FRONT OF FOLDOUT 2012 - Financial...
10
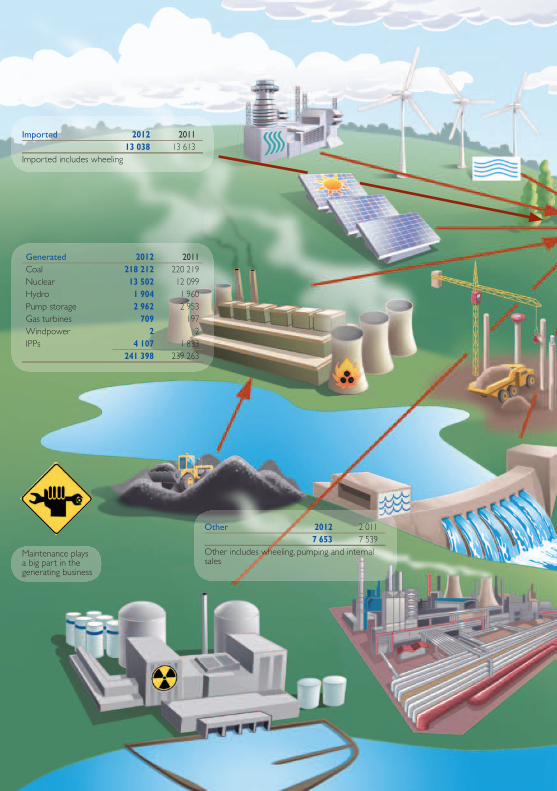
01 Eskom Holdings SOC Limited Integrated Report 2012 Generated 2012 2011 Coal 218 212 220 219 Nuclear 13 502 12 099 Hydro 1 904 1 960 Pump storage 2 962 2 953 Gas turbines 709 197 Windpower 2 2 IPPs 4 107 1 833 241 398 239 263 Imported 2012 2011 13 038 13 613 Imported includes wheeling Other 2012 2 011 7 653 7 539 Other includes wheeling, pumping and internal sales Maintenance plays a big part in the generating business
-
Upload
truonghanh -
Category
Documents
-
view
213 -
download
0
Transcript of FRONT OF FOLDOUT 2012 - Financial...
01Eskom Holdings SOC Limited Integrated Report 2012
FRONT OF FOLDOUT
Generated 2012 2011Coal 218 212 220 219Nuclear 13 502 12 099Hydro 1 904 1 960Pump storage 2 962 2 953Gas turbines 709 197Windpower 2 2IPPs 4 107 1 833
241 398 239 263
Imported 2012 201113 038 13 613
Imported includes wheeling
Other 2012 2 0117 653 7 539
Other includes wheeling, pumping and internal sales
Maintenance plays a big part in the generating business
02Eskom Holdings SOC Limited Integrated Report 2012
FRONT OF FOLDOUT
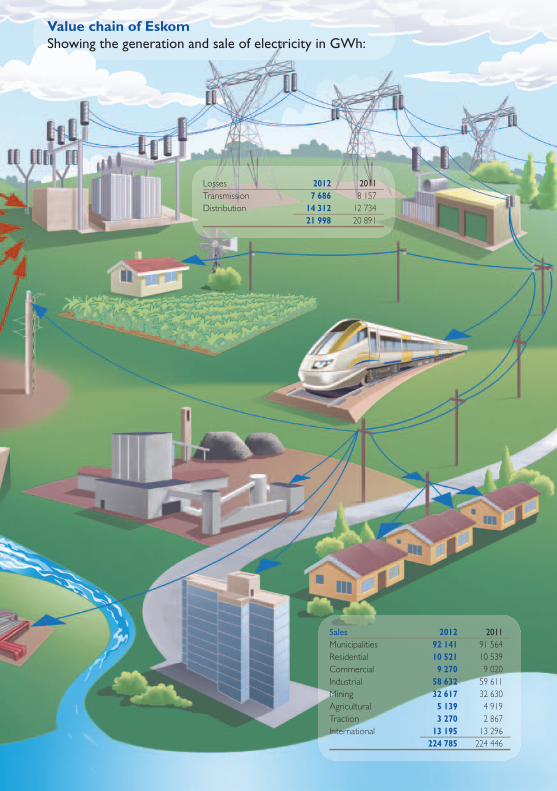
Value chain of EskomShowing the generation and sale of electricity in GWh:
Sales 2012 2011Municipalities 92 141 91 564Residential 10 521 10 539Commercial 9 270 9 020Industrial 58 632 59 611Mining 32 617 32 630Agricultural 5 139 4 919Traction 3 270 2 867International 13 195 13 296
224 785 224 446
Losses 2012 2011Transmission 7 686 8 157Distribution 14 312 12 734
21 998 20 891

03Eskom Holdings SOC Limited Integrated Report 2012
Key industrial and internationalcustomers average debtors days
20
18
16
14
12
10
8
6
4
2
0
Ave
rage
deb
tors
day
s
2009 2010 2011 2012 2012Target
Our performance
25 Employees and contractors passed away during the current year, the same number as the previous year
Generated capacity installed and commissioned during the year was 535MW, up from 315MW the previous year
System average interruption duration index improved to 45.75hrs from 52.61hrs in the previous year
IPP power purchased increased from 1 833GWh the previous year to 4 107GWh
The energy availability factor decreased from 84.59% the previous year to 81.99% the current year
Coal transported by rail increased from 7.1Mt to 8.5Mt in the last year
BACK OF FOLDOUT
Average coal stock days
45
40
35
30
25
Day
s
2009 2010 2011 2012 2012Target
Customer service index
87
85
83
81
79
77
75
Inde
x (%
)
2009 2010 2011 2012 2012Target
Coal stock days at 39 days are 2 days lower than the previous year.
The debtors days for key industrial and international customers improved from 15.5 the previous year to 14.4 for the current year.
The customer service index improved from 84.37% the previous year to 85.55% for the current year.
Key facts and figures
Eskom Holdings SOC Limited Integrated Report 201204
Key facts and figures
Total electricity sales
230
225
220
215
210
205
200
GW
h (’0
00)
2009 2010 2011 2012 2012Target
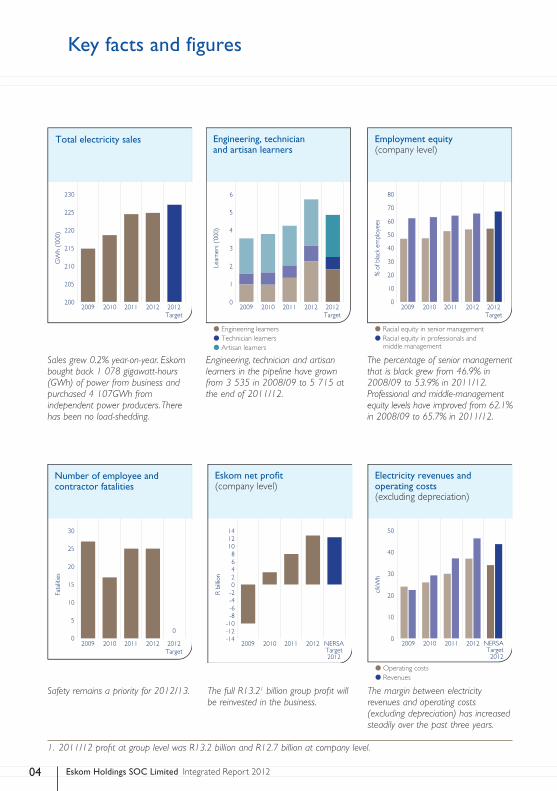
Sales grew 0.2% year-on-year. Eskom bought back 1 078 gigawatt-hours (GWh) of power from business and purchased 4 107GWh from independent power producers. There has been no load-shedding.
The full R13.21 billion group profit will be reinvested in the business.
Eskom net pro�t(company level)
14121086420
-2-4-6-8
-10-12-14
R bi
llion
2009 2010 2011 2012 NERSATarget2012
Safety remains a priority for 2012/13.
30
25
20
15
10
5
0
Fata
litie
s
2009 2010 2011 2012 2012Target
0
Number of employee and contractor fatalities
The percentage of senior management that is black grew from 46.9% in 2008/09 to 53.9% in 2011/12. Professional and middle-management equity levels have improved from 62.1% in 2008/09 to 65.7% in 2011/12.
Employment equity(company level)
80
70
60
50
40
30
20
10
0
% o
f bla
ck e
mpl
oyee
s
2009 2010 2011 2012 2012Target
● Racial equity in senior management● Racial equity in professionals and middle management
Engineering, technician and artisan learners in the pipeline have grown from 3 535 in 2008/09 to 5 715 at the end of 2011/12.
● Engineering learners● Technician learners● Artisan learners
Engineering, technician and artisan learners
6
5
4
3
2
1
0
Lear
ners
(’0
00)
2009 2010 2011 2012 2012Target
The margin between electricity revenues and operating costs (excluding depreciation) has increased steadily over the past three years.
2009
Electricity revenues andoperating costs (excluding depreciation)
c/kW
h
2010 2011 2012 NERSATarget2012
50
40
30
20
10
0
● Operating costs● Revenues
1. 2011/12 profit at group level was R13.2 billion and R12.7 billion at company level.
05Eskom Holdings SOC Limited Integrated Report 2012
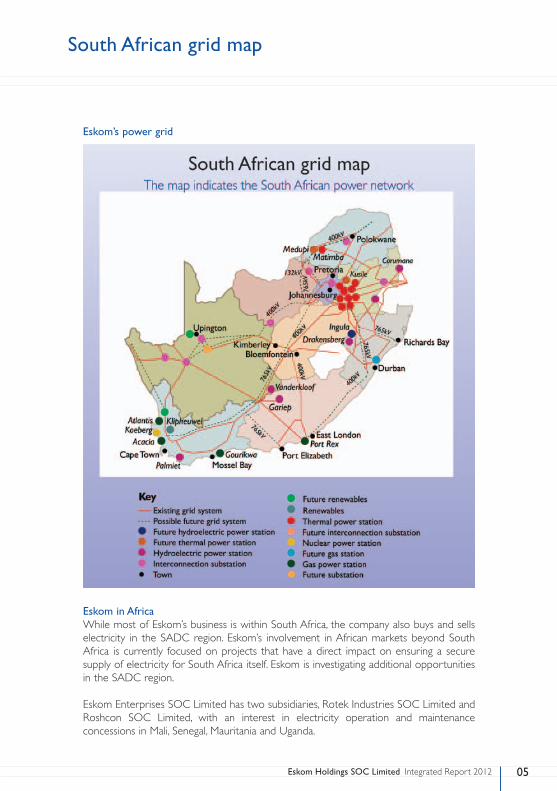
South African grid map
Eskom in AfricaWhile most of Eskom’s business is within South Africa, the company also buys and sells electricity in the SADC region. Eskom’s involvement in African markets beyond South Africa is currently focused on projects that have a direct impact on ensuring a secure supply of electricity for South Africa itself. Eskom is investigating additional opportunities in the SADC region.
Eskom Enterprises SOC Limited has two subsidiaries, Rotek Industries SOC Limited and Roshcon SOC Limited, with an interest in electricity operation and maintenance concessions in Mali, Senegal, Mauritania and Uganda.
Eskom’s power grid
Eskom Holdings SOC Limited Integrated Report 201206
Highlights of 2011/12
September 2011
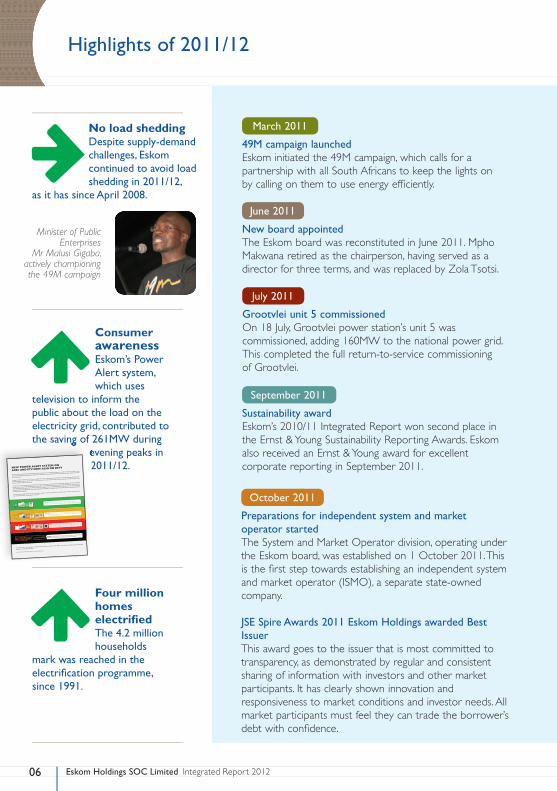
Sustainability awardEskom’s 2010/11 Integrated Report won second place in the Ernst & Young Sustainability Reporting Awards. Eskom also received an Ernst & Young award for excellent corporate reporting in September 2011.
ConsumerawarenessEskom’s Power Alert system, which uses
television to inform the public about the load on the electricity grid, contributed to the saving of 261MW during
evening peaks in 2011/12.
Four million homes electrifi ed The 4.2 million households
mark was reached in the electrifi cation programme, since 1991.
No load shedding Despite supply-demand challenges, Eskom continued to avoid load shedding in 2011/12,
as it has since April 2008.
For the year
March 2011
49M campaign launchedEskom initiated the 49M campaign, which calls for a partnership with all South Africans to keep the lights on by calling on them to use energy effi ciently.
October 2011
Preparations for independent system and market operator startedThe System and Market Operator division, operating under the Eskom board, was established on 1 October 2011. This is the fi rst step towards establishing an independent system and market operator (ISMO), a separate state-owned company.
JSE Spire Awards 2011 Eskom Holdings awarded Best IssuerThis award goes to the issuer that is most committed to transparency, as demonstrated by regular and consistent sharing of information with investors and other market participants. It has clearly shown innovation and responsiveness to market conditions and investor needs. All market participants must feel they can trade the borrower’s debt with confi dence.
the saving of 261MW during the saving of 261MW during evening peaks in evening peaks in
With South Africa experiencing energy challenges and 2012 poised to be an especially diffi cult year, we hereby invite you to partner in saving
electricity and achieving an energy effi cient South Africa. Luckily, the new user-friendly Power Alert programme has been developed to enable
you to do just that.
Already a familiar presence on your TV screens (SABC, eTV and now extended to DStv: Mnet, Action, Series, Supersport, VUZU, Kyknet
and Mzansi Magic), the Power Alert system is a critical source of real time information about what is happening on the national grid on any
particular night throughout the seasons.
Late afternoon to mid-evening between 5pm and 9pm is the period of peak electricity demand in South Africa. People arrive home from work
and start their evening routines by taking a bath and switching on everything; the lights, climate control systems, televisions, microwave ovens,
stoves, dishwashers and tumble dryers. Working quietly out of sight are the two hungriest appliances in the home; the hot water geyser and
the swimming pool pump. These two notorious energy-guzzlers add greatly to the huge demand for electricity during the big evening switch-on
and should be used sparingly.
The Power Alert message boards will use colour-coded messages to clearly communicate the electricity status as well as remind you of the
steps to take whenever a message appears on your TV.
So be “Power Alert” and remember to switch off, this includes every member of the family – mom, dad, the children, grandma and grandpa.
Together let us keep SA powered up.
For more information and regular updates go to www.poweralert.co.za
GREEN - A green Power Alert message with full electricity status bars, means
electricity usage is stable but increasing. Please switch off lights in unoccupied rooms.
ORANGE - An orange Power Alert message with only three full electricity status
bars means electricity usage is increasing rapidly. Please switch off lights, the geyser
as well as the swimming pool pump.
RED - A red Power Alert message with just one full electricity status bar
warns that electricity usage is too high. Please switch off lights, the geyser,
the swimming pool pump and all non-essential appliances.
BLACK - A black Power Alert message means the situation is critical as demand
exceeds supply. Switch off everything, except the TV and one light.
NEW POWER ALERT SYSTEM ON
SABC AND ETV NOW ALSO ON DSTV
NEWSPAPER_1.5.indd 1
2012/02/15 9:01 AM
June 2011
New board appointedThe Eskom board was reconstituted in June 2011. Mpho Makwana retired as the chairperson, having served as a director for three terms, and was replaced by Zola Tsotsi.
Minister of Public Enterprises
Mr Malusi Gigaba, actively championing the 49M campaign
July 2011
Grootvlei unit 5 commissionedOn 18 July, Grootvlei power station’s unit 5 was commissioned, adding 160MW to the national power grid. This completed the full return-to-service commissioning of Grootvlei.

07Eskom Holdings SOC Limited Integrated Report 2012
November 2011
COP 17Eskom showcased its commitment to reducing its carbon footprint and making its energy mix less dependent on coal at the 17th Conference of the Parties to the United Nations (UN) Convention on Climate Change (COP 17), which took place in Durban in November and December 2011.
Camden unit 6 commissionedOn 24 November, Camden power station’s unit 6 which was originally returned to service at a lower capacity, had its capacity upgraded by 20MW.
December 2011
Komati unit 4 commissionedKomati power station’s unit 4 was commissioned on 29 December, adding 100MW to the grid.
Restoration work at Komati power station
January 2012
Public Sector Excellence AwardEskom won the gold medal at the 2011 Public Sector Excellence Awards for excellence in the energy and minerals sector.
February 2012
EMEA Finance AwardEskom Finance Company’s Nqaba Finance 1 Limited won the award for the best securitisation deal in Europe, the Middle East and Africa. Nqaba is a R5 billion residential mortgage-backed securitisation programme that finances mortgage loans with funding from the South African capital market. ABSA Capital, the sole lead arranger of the transaction, was named the best securitisation house of the year.
Komati unit 5 commissionedOn 3 February, Komati power station’s unit 5 was commissioned, adding 100MW to the grid.
March 2012
Staff and learner complement grew The number of group employees increased by 1 695 during the reporting period, bringing the staff complement to 43 473 employees at 31 March 2012. The number of learners (engineers, technicians and artisans) with three- to four-year learning/bursary contracts increased by 1 475 during the reporting period to 5 715 learners.
Approved tariff increase loweredIn March 2012 Eskom requested that the 25.9% tariff increase granted by the National Energy Regulator of South Africa (NERSA) be revised downwards to 16% for the period from 1 April 2012 to 31 March 2013. NERSA approved the request.
Komati unit 6 commissionedOn 5 March, Komati power station’s unit 6 was commissioned, adding 125MW to the grid. This leaves 3 units at Komati to be commissioned.
Arnot unit 5 commissionedOn 5 March, Arnot power station’s unit 5 capacity upgrade was commissioned, adding 30MW.
Eskom Holdings SOC Limited Integrated Report 201208
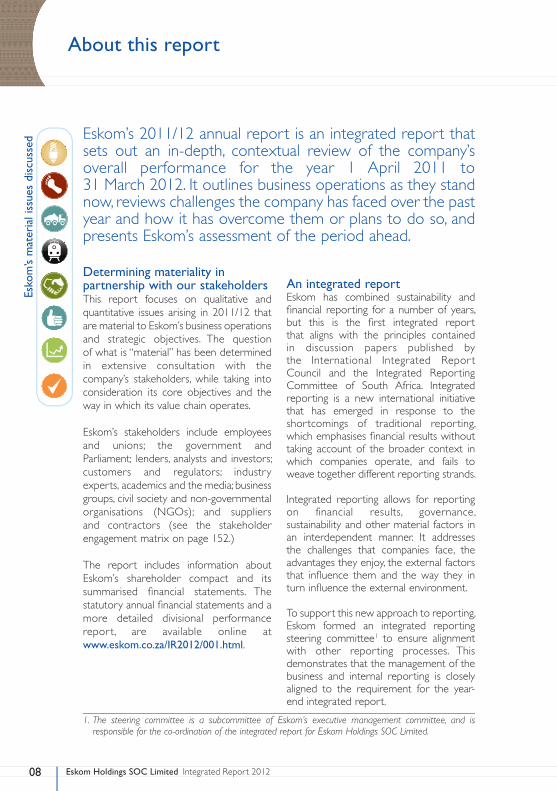
About this report
Determining materiality in partnership with our stakeholdersThis report focuses on qualitative and quantitative issues arising in 2011/12 that are material to Eskom’s business operations and strategic objectives. The question of what is “material” has been determined in extensive consultation with the company’s stakeholders, while taking into consideration its core objectives and the way in which its value chain operates.
Eskom’s stakeholders include employees and unions; the government and Parliament; lenders, analysts and investors; customers and regulators; industry experts, academics and the media; business groups, civil society and non-governmental organisations (NGOs); and suppliers and contractors (see the stakeholder engagement matrix on page 152.)
The report includes information about Eskom’s shareholder compact and its summarised fi nancial statements. The statutory annual fi nancial statements and a more detailed divisional performance repor t, are available online at www.eskom.co.za/IR2012/001.html.
An integrated reportEskom has combined sustainability and fi nancial reporting for a number of years, but this is the fi rst integrated report that aligns with the principles contained in discussion papers published by the International Integrated Repor t Council and the Integrated Reporting Committee of South Africa. Integrated reporting is a new international initiative that has emerged in response to the shortcomings of traditional reporting, which emphasises fi nancial results without taking account of the broader context in which companies operate, and fails to weave together different reporting strands.
Integrated reporting allows for reporting on financial results, governance, sustainability and other material factors in an interdependent manner. It addresses the challenges that companies face, the advantages they enjoy, the external factors that infl uence them and the way they in turn infl uence the external environment.
To support this new approach to reporting, Eskom formed an integrated reporting steering committee1 to ensure alignment with other reporting processes. This demonstrates that the management of the business and internal reporting is closely aligned to the requirement for the year-end integrated report.
Eskom’s 2011/12 annual report is an integrated report that sets out an in-depth, contextual review of the company’s overall performance for the year 1 April 2011 to 31 March 2012. It outlines business operations as they stand now, reviews challenges the company has faced over the past year and how it has overcome them or plans to do so, and presents Eskom’s assessment of the period ahead.
1. The steering committee is a subcommittee of Eskom’s executive management committee, and is responsible for the co-ordination of the integrated report for Eskom Holdings SOC Limited.
Esko
m’s
mat
eria
l iss
ues
disc
usse
d

09Eskom Holdings SOC Limited Integrated Report 2012
Eskom has applied Global Reporting Initiative (GRI) principles in compiling this report. These principles ensure that the company incorporates the views of its stakeholders, as well as internal planning reporting and risk-management processes.
Eskom has declared a B+ application level in terms of the GRI. Refer to the assurance provider’s report on page 157 which confi rms this declaration. The list of relevant GRI indicators is available online at: www.eskom.co.za/IR2012/002.html.
KPMG has provided assurance on selected sustainability information in this report (see page 157). Eskom follows a combined assurance approach (refer to page 33 for more details).
Eskom’s reports are also prepared with due consideration of the King Report on Corporate Governance (King III). Refer to www.eskom.co.za/IR2012/003.html for more information on King III.
Structure of the reportThis new global reporting platform takes cognisance of the need to present information succinctly. Consequently, this report is structured in a concise and accessible manner:
1. Leadership overview sets out Eskom’s view of the environment in which it operates, the central achievements of the reporting period, priorities for the year ahead, strategic objectives and long-term challenges for the business.
The integrated reporting pilot programme
Eskom is a member of the International Integrated Reporting Council’s pilot programme (http://www.theiirc.org/). All annual reports published by the more than 60 programme members worldwide in the period October 2011 to September 2012 (including this report) will be reviewed and analysed for their strengths and weaknesses. Lessons learnt during this cycle will contribute to a global standard for integrated reporting.
Leading and partnering to keep the lights on
Reducing our carbon footprint and pursuing low-carbon growth opportunities
Securing future resource requirements, mandate and the required enabling environment
Implementing coal haulage and the road-to-rail migration plan
Pursuing private sector participation
1st building block:Setting ourselves up for success
2nd building block:Ensuring our fi nancial sustainability
3rd building block:Become a high-performance utility
Material issues navigation
Esko
m’s
mat
eria
l iss
ues
disc
usse
d

Eskom Holdings SOC Limited Integrated Report 201210
About this report continued
2. About the company outlines the nature of the business and its legal structure, as well as its purpose, strategic objectives and values.
3. Corporate governance reports on the composition of the board and the executive management committee. It reviews committees and initiatives designed to ensure good governance and statutory compliance, and sets out Eskom’s remuneration philosophy.
4. Operating context: material issues assesses the primary material factors that have a bearing on Eskom’s performance and discusses steps taken to manage associated risks.
5. Value chain performance reviews the contributions of Eskom’s operating line divisions during the reporting period, discussing material issues as they affect operations.
6. Service and strategic functions outlines the key challenges of the service and strategic functions.
7. Financial performance presents an overview of the financial performance for 2011/12.
8. Summarised financial statements for 2011/12 (the statutory annual financial statements are available at www.eskom.co.za/IR2012/004.html).
9. Future priorities cover Eskom’s priorities over the next five years.
10. Appendices include: A. Key indicators, comparing perfor-
mance against Eskom’s internal targets B. Stakeholder engagement matrix,
highlighting the material issues that arose through dialogue with stakeholders and the nature of these interactions
C. Sustainability responsibilities, approval and assurance statements from Eskom and the external assurance provider, detailing assurance provided on selected sustainability information
D. Glossary E. List of acronyms F. Eskom’s contact details.
Refer to:www.eskom.co.za/IR2012/005.html where the following reports can be found: Statutory annual financial statements Divisional reports (detail performance information from a divisional perspective)
The Eskom Development Foundation report (provides a review of Eskom’s Corporate Social Investment (CSI) activities)
The Eskom Factor Report (details Eskom’s broader impact and contribution to society)
Supplementary fact sheets
Throughout the integrated report links to supplementary information are provided.
Snow covers the intake canal of the Ingula pumped storage scheme under construction near Ladysmith