FROM TOP RIGHT, COUNTER CLOCKWISE: PHOTO BY · PDF filejoseph p. schwieterman, ph.d. & heather...
25
-
Upload
vuongnguyet -
Category
Documents
-
view
223 -
download
4
Transcript of FROM TOP RIGHT, COUNTER CLOCKWISE: PHOTO BY · PDF filejoseph p. schwieterman, ph.d. & heather...

CHADDICK INSTITUTE FOR METROPOLITAN DEVELOPMENT AT DEPAUL UNIVERSITY
WORKING PAPER - 07.21.16
CONTACT: JOSEPH SCHWIETERMAN, PH.D.PHONE: 312.362.5732EMAIL: [email protected]
JOSEPH P. SCHWIETERMAN, PH.D. & HEATHER SPRAY
FROM TOP RIGHT, COUNTER CLOCKWISE: PHOTO BY RACHAEL SMITH, FELIX KRAMER (CREATIVE COMMONS), RACHAEL SMITH & MARIO ROBERTO DURÁN ORTIZ (CREATIVE COMMONS)
RACHAEL SMITH & HALEY CANNON GRAPHICS
AUTHORS
PHOTOGRAPHY
THE STUDY TEAM
2
EXECUTIVE SUMMARY A growing body of research shows that carsharing—the sharing of vehicles by people with similar needs—generates economic and social benefits through enhanced mobility, active lifestyles, and lessened automobile dependence. This segment of the “sharing economy,” however, faces an unusually high tax burden due to the almost universal requirement that carsharers pay the same taxes as those using conventional car rental services. This study reviews the tax policies of 80 locations in various U.S. cities and shows that:
x Nearly a quarter of the country’s 40 largest cities impose retail taxes that increase the costs of a 1-hour carshare by more than 30%. Many impose $2 - $4 per transaction fees, which were originally created to generate revenue from conventional car rentals.
x Nearly half of the largest cites impose tax rates of 15% or more on longer (5-hour) reservations. These rates are particularly high in Chicago, New York, Philadelphia, and Phoenix.
x Average tax rates rose from 15.6% in 2011 to 17.0% in 2016, making the burden on carshares higher than those on hotel rooms and airline tickets. Competing services, including Lyft/Uber, face a much lower retail tax, if they face such taxes at all.
x Transaction-based fees are a formidable obstacle to the growth of “one way” carsharing and the addition of electric cars that are best suited for these short trips.
x Taxation issues will come into sharper focus as autonomous vehicles (“driverless cars”), which would be subjected to the same taxes in some locales, become available for hire.
Such issues appear to be factors in the recent downturn in U.S. carsharing membership. To reduce the distortive effects of taxation policies, the study calls for reducing or exempting transaction fees from carsharing reservations of relatively short durations, such as those eight hours or less, as well as taking other initiatives. Rapid technological change, meanwhile, creates an opportunity for a larger discussion about the need for more coherent taxation policies governing vehicle sharing.

3
I. INTRODUCTION Many sectors of the “sharing economy” face difficult regulatory issues in the cities they serve across the United States. Room rental services, such as Airbnb and Flipkey, are encountering challenges with zoning and safety regulation compliance. Ridesourcing services, such as Lyft and Uber, face stiff opposition from taxicab companies who claim they constitute unfair competition. Van and minibus services sold on subscription basis, such as Bridg and Skedaddle, face regulations pertaining to entry by private firms into public transit markets. Carsharing organizations face a different obstacle—retail taxes that tend to be higher than nearly every other sector of the economy. This is due to the almost universal requirement that carsharers pay the same taxes as those using conventional car rental services. Although the burden differs from place to place, the prevalence of transaction-based (lump-sum) taxes in many locales is particularly significant. Users face a tax burden often several times the sales tax rate, despite the sector’s demonstrated benefits, including the environmental and social benefits on neighborhoods, which are summarized in Section II below. The issue of differential rates of taxation between carsharing and other share-economy sectors is coming into sharper focus as the number of mobility options available to urban dwellers grows. Travelers needing to occasionally make a car trip once had a relatively simple set of options, such as owning a car, renting one, taking a taxi, or subscribing to a carsharing service. Now, those same carsharers typically can also:
x Summon a ridersourcing service, such as Lyft or Uber, which provide the benefit of curbside pickup with a simple mobile application. Unlike taxis, users do not need to settle payment at the end of the trip, as this is done automatically.
x Hail a carpooling service, such as UberPool or LyftLine, which now operate in many cities. These services often reduce the costs of a typical Uber or Lyft ride by more than half, in exchange for allowing the car to serve other passengers during the course of one’s trip.
x Rely on specialized minibus or shared-ride services, such as Via, which operate much like the jitneys of yesteryear and are now prolific in certain corridors. Some offer one-way trips for $5 or less.
These services were largely nonexistent in many cities five years ago. Bikesharing programs are also on the rise and now boast hundreds of “pods” in some cities, providing new competition on short-distance trips. In the face of such rising competition, carsharing organizations face the unwelcome challenge of asking customers to shoulder rates of retail taxation they rarely encounter elsewhere. Such competition appears to be a factor in explaining why the number of carsharing members in the United States declined 11.7% between 2014 and early 2015,

4
although seasonal factors may explain some of the decline (Shaheen and Cohen, 2016). To develop perspective on these issues, this study explores taxation rates on carsharing services in 80 locations, including each of the country’s 40 largest cities. The study draws upon the results from our earlier study (Biesczat and Schwieterman, 2013) to evaluate recent changes in rates and suggests practical solutions to deal with the sector’s problems.
II. GROWTH OF THE INDUSTRY Carsharing’s status as a highly taxed sector is largely the result of the once-prevalent notion that the incidence of taxes on car rentals will fall almost entirely on out-of-towners, including tourists, business travelers, and conference-goers. Many taxes collected on car rentals indeed target those living outside the jurisdiction imposing the tax. As carsharing services expand, these taxes, including transaction fees (Figure 1), are increasingly being felt locally, especially by residents who have sold their cars in favor of more “green” lifestyles. The carsharing sector has evolved greatly since Car Sharing Portland, the country’s first large-scale program, emerged on the West Coast in 1998. Most of the earliest entrants provided services similar to carsharing organizations that existed at the time in Canada and Europe. These models emphasized the neighborhood residential model and focused on pods strategically scattered throughout dense urban areas. In the dramatic expansion that followed, carsharing became prevalent in smaller cities and suburbs as well as specialty locations, such as college campuses and airports. Dozens of colleges now have active carsharing pods. Along with carsharing’s growth has come extensive research about its environmental, economic, and social benefits (Shaheen and Cohen, 2013). This research points to reductions in emissions, pollution, congestion, and parking requirements made possible by this sector—much of it stemming heavily from the reduction in privately owned vehicles in urban settings (Litman, 2015, TCRP, 2012). Carsharing promotes active lifestyles by increasing walking and biking while being shown to have no significant negative effect on transit use, partially due to the fact that many carsharing members simultaneously increase their reliance on buses and trains (Elliot and Shaheen, 2011). The reduction in demand for parking spaces afforded by carsharing also increases open space and public safety, and boosts local economies (Shoop, 2011). Carsharing encompasses both for-profit businesses and non-profit businesses. Zipcar is by far the country’s largest for-profit provider, with pods in more than 50 U.S. cities. The Boston-based company, which went public in 2011 and was bought by Avis Company in 2013, serves 38 U.S. states as well as Canada and various European locations. Enterprise follows behind as the country’s second largest for-profit carsharing company. Other providers—both private and
5
6
nonprofits—include Buffalo CarShare, City CarShare, Daimler’s Car2Go, eGo CarShare, Getaround, Hourcar, Ithaca Carshare, JustShareIt, General Motor’s Maven, ReachNow, Turo, and CarHoppers. Since their inception, many carsharing providers have aimed to demonstrate their unique value to the community. Formal definitions for “carsharing organizations” require providers to document their commitment to neighborhood improvement and civic-minded goals—requirements that some, but not all, have met. Those that do meet this definition are better positioned to attract support from local governments and philanthropic organizations, which include technical assistance, land for vehicle parking under favorable terms, and waivers from certain taxes. New services have helped to fuel much of the sector’s recent growth. Peer-to-peer carsharing is growing particularly fast, allowing users to rent cars owned by individuals living nearby. One-way carsharing, such as Car2Go, gives users more flexibility by allowing cars to be dropped off at a different location than the starting point. Zipcar is also now making a push to make its cars available at 7-Eleven stores to offer new, convenient pickup options for its members.
Some of this innovation is spurred by rising competition, including the threat posed by ridesourcing companies such as Lyft and Uber, as well as innovations by traditional car-rental services, which have begun to allow for more short-term rentals. Avis and Hertz, for example, now offer rentals by the hour, blurring the line between a car rental and a carshare, as well as virtual check-in features, allowing users to bypass the time spent at a traditional car rental check-in counter. Despite the move towards app-based service and short-term rentals, differences between carsharing and car rentals persist. Carsharing works on a membership-based model, which includes automatic insurance coverage and typically entails an annual fee; users do not enter a separate contract every time they use a vehicle. Carsharing also involves filling up the tank when fuel runs low (many providers, including Zipcar, keep a credit card in vehicles to make fill-ups relatively easy). Members are also expected to clean up after themselves or membership may be revoked.
III. MEASURING LEVELS OF TAXATION
To measure the tax burden facing carsharing, information about the fees and surcharges added by public bodies to reservations was gathered from 80 locations in 75 cities throughout the United States, including all 40 of the country’s cities with populations of 300,000 or more with neighborhood carsharing. Prices were collected from March through May 2016, with several locations sampled in numerous metropolitan areas to ensure that differences in tax rates between municipalities and counties would be captured. In the San Francisco metropolitan
7
area, for example, carsharing pods are in three different counties (Alameda, San Francisco, and Santa Clara).
The data for this analysis was collected using the reservation portal of Zipcar.com. The data set assembled encompasses the base reservation rate, all applicable taxes, and all applicable government-imposed fees and surcharges. The reservations were priced whenever possible for compact vehicles, such as a Honda Civic, which are common in carsharing fleets. Reservations of three lengths—1-hour, 5-hours, and 24-hours—were sampled. Downtown or neighborhood-based rental locations, rather than airport locations, were selected to evaluate costs in typical carsharing areas. This approach avoided inclusion of special taxes and surcharges applied to airport-based transactions that do not apply in neighborhood settings. Nonetheless, this approach captures many of the large state- and region-wide transaction-based taxes prevalent throughout the country. As can be seen on Figure 1, $2–$2.50 transactions fees are most common, although some, such as New Jersey’s flat $5 fee, are much higher. The base price of carsharing was found to range from about $7.50 to $9 per hour, before taxes, in most cities. Densely populated cities, such as Chicago ($9.50) and New York ($10), are generally priced higher, while less dense or rural locations, such as Greenville, NC and Omaha, NE (both $7.50) were priced less. The base price is typically proportional to the number of hours a car is used, with discounting for longer reservations often limited to special promotions or sales.
IV. FINDINGS The four major findings from our data analysis warrant particular attention: FINDING 1: Eight of the 12 largest cities impose taxes of 15% or more on all types of reservations (1, 5 and 24-hours), resulting in rates of taxation at least 50% higher than local sales taxes. In two of the three largest cities, Chicago and New York, rates hover around 20%, while in Philadelphia and Phoenix they exceed 33% in some scenarios (Table 1). Chicago is the only one of the 12 largest cities with tax rates exceeding 20% regardless of duration, which is more than double the local sales tax (10.25%). In Philadelphia, taxes add about a third and a quarter to 1 and 5-hour reservations, respectively—three to four times the sales tax rate. In Phoenix, 1-hour carsharers pay almost half as much in taxes as they do for the car itself—and about six times the rate of the local sales tax. Tax rates are more favorable in Dallas, Los Angeles, San Diego, and San Jose, where rates are at or near the sales tax rate. San Diego has the lowest tax rates for all reservation lengths (8.0%)

8
Such fees are likely to compel some carsharers to consider other modes. A customer who reserves a car in Chicago for 4 hours (at $9.50 per hour) will pay $8.04 in retail taxes, resulting in a total trip cost of $46.04. For a trip about 4 miles in each direction, an Uber is estimated to be $30 roundtrip and an UberPool trip, considerably less.1
These fees are in addition to fuel taxes embedded in the price of a reservation, in addition to the other taxes that are included in the base price. Rates tend to drop as the duration of the reservations increase due to the diminishing impact of flat-fee taxes on more expensive purchases. Such cost differences may encourage many customers to pursue alternate modes.

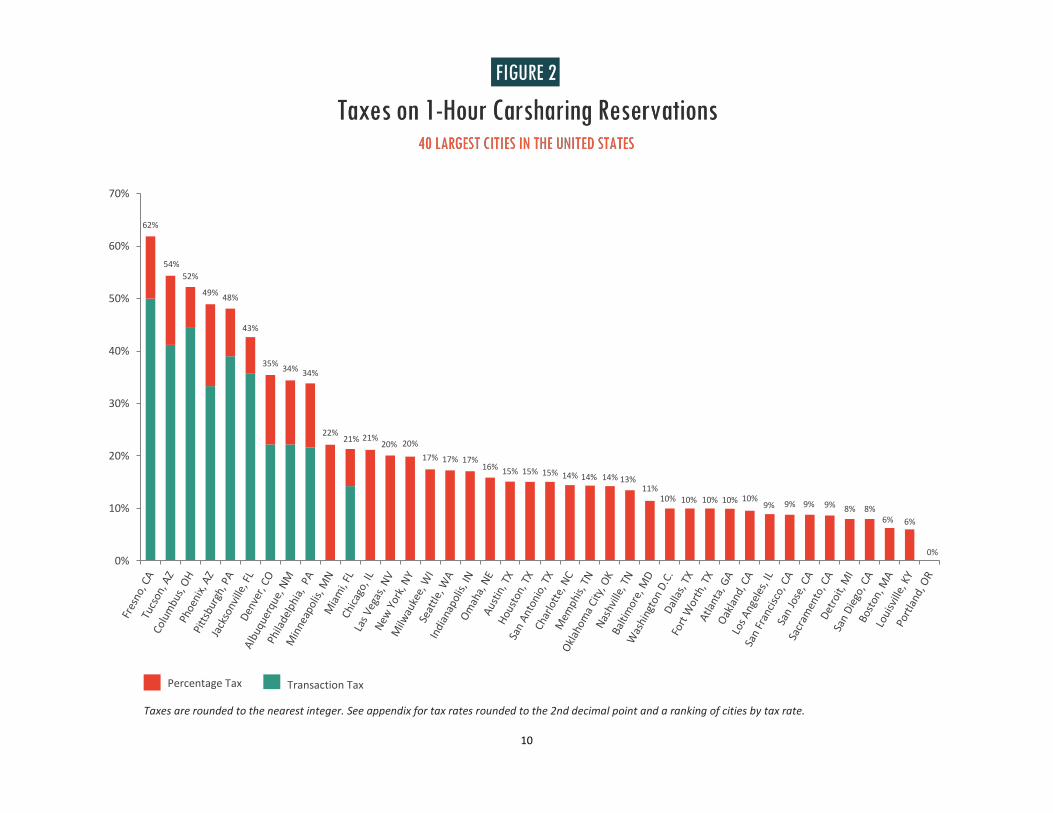
9
FINDING 2: Nine of the 40 largest cities in the United States impose tax rates of 30% or more on 1-hour reservations. The majority of large cities have tax rates of 15% or more, putting them significantly above each city’s sales tax rate. All nine of the cities with the highest taxes have transaction-based (lump-sum) fees (which are denoted in blue on the adjacent Figure 2). Nevertheless, even cities that have only percentage-based fees have overall tax rates far above those of sales taxes:
x Nine of the 40 largest cities have tax rates of 30% or more for 1-hour reservations. About three quarters (29 cities) have tax rates of 10% or more.
x In 25 of the 40 largest cities, taxes are more than five percentage points higher than
local sales taxes.
x Only in Portland, OR, is the sector exempt from retail taxes.
Some of smaller cities, including Columbus, OH, Fresno, CA, and Tucson, AZ, in which carsharing is attempting to gain a foothold, have tax rates in the 52–62% range due to lump-sum taxes. In Columbus, users pay a $4 city vehicle lessor tax, a .25% Central Ohio Transit Authority Tax and general sales taxes. Pittsburgh imposes a tax rate of 48% due to two flat $2 fees, one for Allegheny County and another for the aforementioned state public transportation fund. Denver is also near the top with a 35% tax rate. The experiences of twelve cities illustrate the wide range of taxes that many users pay—and some of the political issues that surround them (Table 1). Advocates of carsharing in Boston, for example, were able to limit a $10 convention center fee on every rental transaction applied only once annually to carsharers, making tax rates lower after the first reservation has been made each year. Chicago has a different story, essentially doubling its fees in 2015, while Philadelphia and Phoenix are notable for having sizable lump-sum fees paid on every reservation. New York, the country’s largest urban carsharing market, has numerous percentage-based fees that add about 20% to the price of a reservation.
10
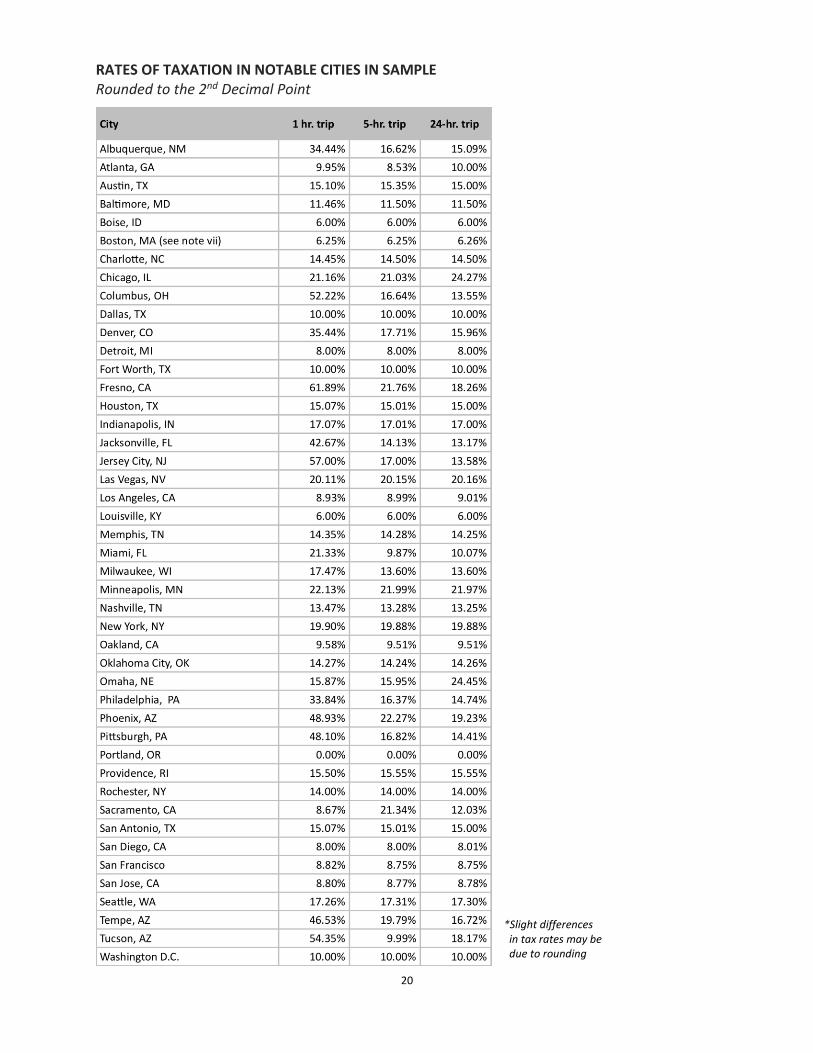
Taxes are rounded to the nearest integer. See appendix for tax rates rounded to the 2nd decimal point and a ranking of cities by tax rate.
62%
54%52%
49% 48%
43%
35% 34% 34%
22%21% 21%
20% 20%17% 17% 17%
16% 15% 15% 15% 14% 14% 14% 13%11%
10% 10% 10% 10% 10%9% 9% 9% 9% 8% 8%
6% 6%
0%0%
10%
20%
30%
40%
50%
60%
70%
Percentage Tax Transaction Tax
11
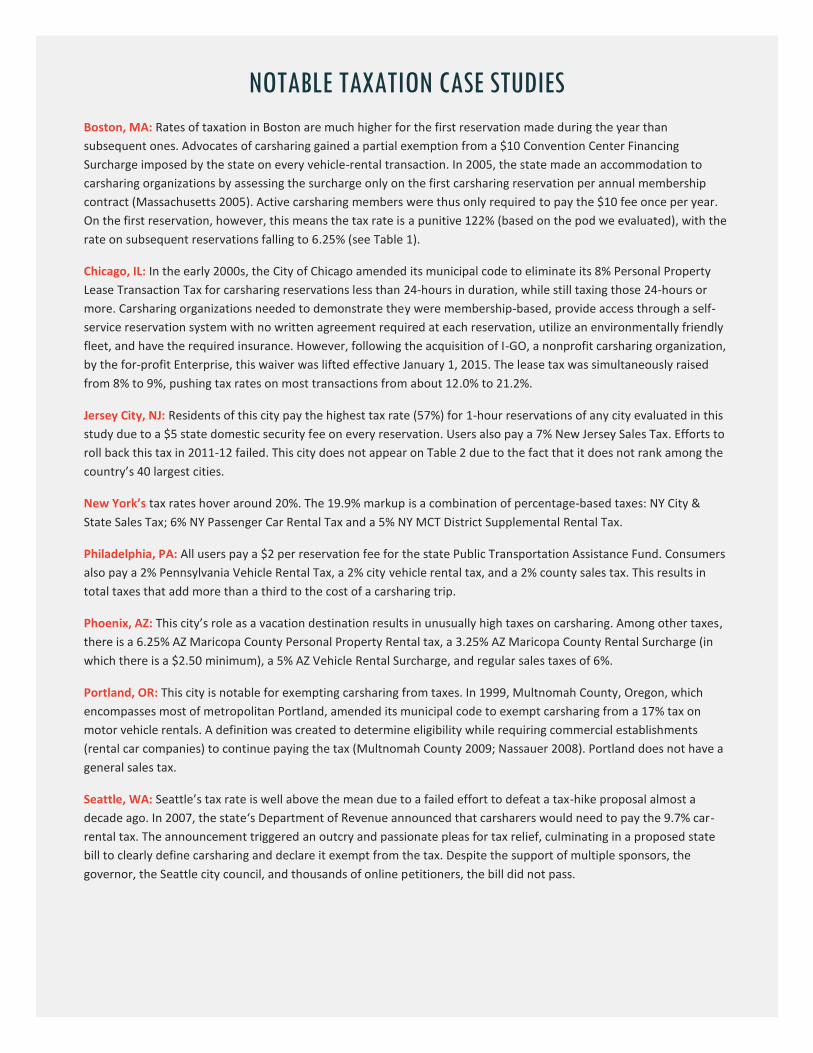
NOTABLE TAXATION CASE STUDIES Boston, MA: Rates of taxation in Boston are much higher for the first reservation made during the year than subsequent ones. Advocates of carsharing gained a partial exemption from a $10 Convention Center Financing Surcharge imposed by the state on every vehicle-rental transaction. In 2005, the state made an accommodation to carsharing organizations by assessing the surcharge only on the first carsharing reservation per annual membership contract (Massachusetts 2005). Active carsharing members were thus only required to pay the $10 fee once per year. On the first reservation, however, this means the tax rate is a punitive 122% (based on the pod we evaluated), with the rate on subsequent reservations falling to 6.25% (see Table 1).
Chicago, IL: In the early 2000s, the City of Chicago amended its municipal code to eliminate its 8% Personal Property Lease Transaction Tax for carsharing reservations less than 24-hours in duration, while still taxing those 24-hours or more. Carsharing organizations needed to demonstrate they were membership-based, provide access through a self-service reservation system with no written agreement required at each reservation, utilize an environmentally friendly fleet, and have the required insurance. However, following the acquisition of I-GO, a nonprofit carsharing organization, by the for-profit Enterprise, this waiver was lifted effective January 1, 2015. The lease tax was simultaneously raised from 8% to 9%, pushing tax rates on most transactions from about 12.0% to 21.2%.
Jersey City, NJ: Residents of this city pay the highest tax rate (57%) for 1-hour reservations of any city evaluated in this study due to a $5 state domestic security fee on every reservation. Users also pay a 7% New Jersey Sales Tax. Efforts to roll back this tax in 2011-12 failed. This city does not appear on Table 2 due to the fact that it does not rank among the country’s 40 largest cities.
New York’s tax rates hover around 20%. The 19.9% markup is a combination of percentage-based taxes: NY City & State Sales Tax; 6% NY Passenger Car Rental Tax and a 5% NY MCT District Supplemental Rental Tax.
Philadelphia, PA: All users pay a $2 per reservation fee for the state Public Transportation Assistance Fund. Consumers also pay a 2% Pennsylvania Vehicle Rental Tax, a 2% city vehicle rental tax, and a 2% county sales tax. This results in total taxes that add more than a third to the cost of a carsharing trip.
Phoenix, AZ: This city’s role as a vacation destination results in unusually high taxes on carsharing. Among other taxes, there is a 6.25% AZ Maricopa County Personal Property Rental tax, a 3.25% AZ Maricopa County Rental Surcharge (in which there is a $2.50 minimum), a 5% AZ Vehicle Rental Surcharge, and regular sales taxes of 6%.
Portland, OR: This city is notable for exempting carsharing from taxes. In 1999, Multnomah County, Oregon, which encompasses most of metropolitan Portland, amended its municipal code to exempt carsharing from a 17% tax on motor vehicle rentals. A definition was created to determine eligibility while requiring commercial establishments (rental car companies) to continue paying the tax (Multnomah County 2009; Nassauer 2008). Portland does not have a general sales tax.
Seattle, WA: Seattle’s tax rate is well above the mean due to a failed effort to defeat a tax-hike proposal almost a decade ago. In 2007, the state‘s Department of Revenue announced that carsharers would need to pay the 9.7% car-rental tax. The announcement triggered an outcry and passionate pleas for tax relief, culminating in a proposed state bill to clearly define carsharing and declare it exempt from the tax. Despite the support of multiple sponsors, the governor, the Seattle city council, and thousands of online petitioners, the bill did not pass.
12
FINDING 3: Even when consumers make a 5-hour carsharing reservation, lessening the effects of lump-sum taxes, tax rates remain 15% or more in most cities. As a result, it is common for users to pay taxes of at least $7 per reservation on these longer trips. Consumers in cities that have flat fees, including Albuquerque, Columbus, Miami and Philadelphia, fare relatively better with respect to longer reservations than short ones (Figure 3). Conversely, those in cities with the highest percentage fees, such as Las Vegas, Minneapolis, New York, and Omaha, fare comparatively worse. Even when making 5-hour reservations, however, only eight of the 40 cities (including Boston, Detroit, Louisville, Portland, and San Diego) have tax rates on 5-hour reservations that are within three points of local sales rates. In 60% of the largest 40 cities, consumers pay at least 5% more than they would on normal retail goods—and in most cases more than twice this amount. Considering the cumulative effects of taxes on longer reservations, many travelers no doubt opt for other modes of travel. In most cities, such taxes add at least $7 to the 5-hour reservations, while in some, such as Chicago, Minneapolis, Phoenix, they add at least $10, which often equates to at least a dollar a mile per trip and approaches the entire cost of an UberPool ride. FINDING 4: Tax rates in large U.S. cities rose from an estimated 15.6% in 2011 to 17.0% in 2016. Taxes have risen significantly over the past five years.2 Using data from our earlier study allowed for computations of the weighted average of the 27 cities for which we have data in both 2011 and 2016, which shows that the average tax rate rose from 15.6% to 17.0%.3 When taxes are weighted on the size of the carsharing market (rather than population), the average tax rate would be higher since large, high-tax cities such as Chicago and New York tend to have more cars per-capita than smaller ones.4 Among the cities with appreciable increases include Chicago (+9.2 percentage point increase), Omaha, NE (+8.9 pts), Minneapolis (+8.1 pts) and Milwaukee (+3.8) (Table 2).

13
Taxes are rounded to the nearest integer. See appendix for tax rates rounded to the 2nd decimal point and a ranking of cities by tax rate.
22%22% 22% 21%
21%
20% 20%
18%17% 17%
17% 17% 17%16% 16%
15% 15% 15%14% 14% 14% 14%
14%13%
12%
10%10% 10%
10% 10%10%
9% 9% 9% 9% 8% 8%
6%6%
0%0%
5%
10%
15%
20%
25%
Percentage Tax Transaction Tax

14
.

15
A full list of the taxes paid in 2016, and a ranking of the 40 cities on the based on the average tax rate, appears in the appendix.
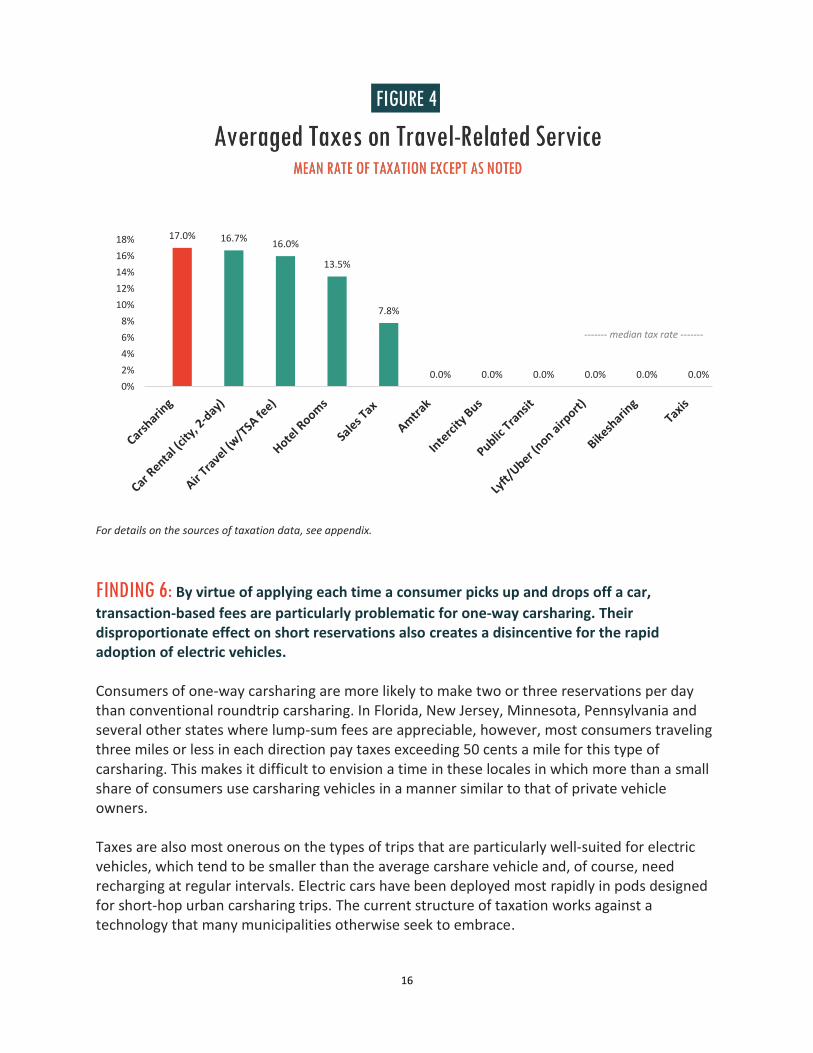
FINDING 5: Taxes on carsharing are now higher than almost any other travel-related sector, including hotel rooms and airline tickets. Meanwhile, the median rate of retail tax burden on other notable sectors of the share economy, including Lyft and Uber ridesourcing, is zero. Carsharing finds itself in a far less favorable position with respect to taxes than nearly all other sharing economy sectors. It competes with other urban transportation services, including ridesourcing (Lyft/Uber) and bikesharing, which are generally not subject to retail taxes. Although there are exceptions in some cities, and data is not available on the mean rate of taxation on ridesourcing and taxicabs, the median rate of taxation is zero for both services.5 The carsharing sector’s 17.0% rate is marginally above the tax rate on two-day neighborhood car rentals in the 40 largest U.S. cities.6 It is also well above other intercity transportation services, such as airline tickets (16.0%, including security fees, as estimated by the Business Travel Coalition in 2015) and intercity bus and train fares (which are not taxed). (Most airline fees are earmarked for airport and security services provided for air travelers). Even hotel taxes, as estimated by HVS, are lower, averaging about 13.5%. (See the appendix and details and source of these estimates). The implications of this for the moderately intensive user can be appreciated by considering someone who, over the course of a year, reserves a car 1) twice weekly for 1-hour each time; 2) twice monthly for a longer 5-hour reservation; and 3) two 24-hour reservations. That user will pay about $450 per year in taxes. Of course, light users would tend to pay less and heavier users more. A ranking of the weighted average tax rate in the 40 largest U.S. cities, organized by population category, can be found in the appendix.
16
For details on the sources of taxation data, see appendix. FINDING 6: By virtue of applying each time a consumer picks up and drops off a car, transaction-based fees are particularly problematic for one-way carsharing. Their disproportionate effect on short reservations also creates a disincentive for the rapid adoption of electric vehicles. Consumers of one-way carsharing are more likely to make two or three reservations per day than conventional roundtrip carsharing. In Florida, New Jersey, Minnesota, Pennsylvania and several other states where lump-sum fees are appreciable, however, most consumers traveling three miles or less in each direction pay taxes exceeding 50 cents a mile for this type of carsharing. This makes it difficult to envision a time in these locales in which more than a small share of consumers use carsharing vehicles in a manner similar to that of private vehicle owners. Taxes are also most onerous on the types of trips that are particularly well-suited for electric vehicles, which tend to be smaller than the average carshare vehicle and, of course, need recharging at regular intervals. Electric cars have been deployed most rapidly in pods designed for short-hop urban carsharing trips. The current structure of taxation works against a technology that many municipalities otherwise seek to embrace.
17.0% 16.7% 16.0%
13.5%
7.8%
0.0% 0.0% 0.0% 0.0% 0.0% 0.0%0%2%4%6%8%
10%12%14%16%18%
------- median tax rate -------
------
17
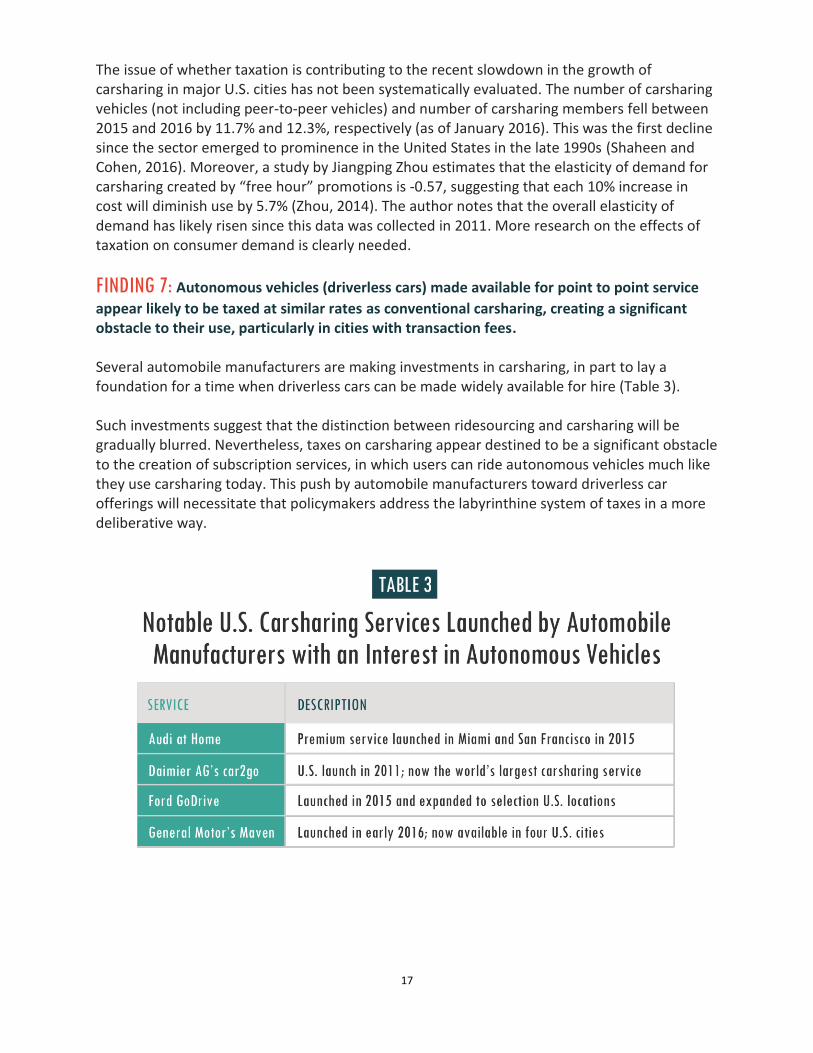
The issue of whether taxation is contributing to the recent slowdown in the growth of carsharing in major U.S. cities has not been systematically evaluated. The number of carsharing vehicles (not including peer-to-peer vehicles) and number of carsharing members fell between 2015 and 2016 by 11.7% and 12.3%, respectively (as of January 2016). This was the first decline since the sector emerged to prominence in the United States in the late 1990s (Shaheen and Cohen, 2016). Moreover, a study by Jiangping Zhou estimates that the elasticity of demand for carsharing created by “free hour” promotions is -0.57, suggesting that each 10% increase in cost will diminish use by 5.7% (Zhou, 2014). The author notes that the overall elasticity of demand has likely risen since this data was collected in 2011. More research on the effects of taxation on consumer demand is clearly needed. FINDING 7: Autonomous vehicles (driverless cars) made available for point to point service appear likely to be taxed at similar rates as conventional carsharing, creating a significant obstacle to their use, particularly in cities with transaction fees. Several automobile manufacturers are making investments in carsharing, in part to lay a foundation for a time when driverless cars can be made widely available for hire (Table 3). Such investments suggest that the distinction between ridesourcing and carsharing will be gradually blurred. Nevertheless, taxes on carsharing appear destined to be a significant obstacle to the creation of subscription services, in which users can ride autonomous vehicles much like they use carsharing today. This push by automobile manufacturers toward driverless car offerings will necessitate that policymakers address the labyrinthine system of taxes in a more deliberative way.

18
V. RECOMMENDATIONS
Municipal leaders and planners must make choices on how to generate tax revenues for vital public services in ways that are both equitable and efficient. This is, by no means, an easy process, especially with rapid technological innovation and the growth of services paid for over the internet. While this study does not evaluate these difficult tradeoffs, it shows that most cities have opted to leave other sectors of the “sharing economy” much less heavily taxed than it does carsharing. Several steps could help alleviate the problem: 1: Policymakers should push to relieve carsharing of transaction-based (lump sum) taxes that are insensitive to the length of the reservation while striving to more closely align overall rates of taxation with local sales tax rates. Transaction fees have been shown in this report to have particularly distortive effects on short-term reservations. Exempting or reducing these taxes from reservations that are 8 hours or less (or some other agreed upon threshold) would alleviate the most punitive effects. Similarly, having the fees scaled to the length of the reservations, with 1-hour users paying less than those making longer reservations, is another option. If this proves politically difficult, the exemption could be limited to neighborhood carshares or others non-airport locations. 2: Cities and states unwilling to exempt the sector from transaction-based taxes should follow the Boston model and require users to pay a transaction-based tax on the first reservation made each year—or even once monthly if this is a politically unattainable goal. Software systems can easily be adopted at membership-based carsharing organizations to assure that users pay per-transaction fees only once annually, or perhaps even once per quarter. For carsharing organizations that operate only in one city, these fees could be rolled into the price of membership. 3: Use the intensifying discussion about disruptive technological innovations, such as autonomous (driverless) vehicles, on-demand van service, and Lyft and Uber ridesourcing, to build a case for a more coherent set of policies treating all modes fairly. Creating a world in which technology-enabled consumers move seamlessly between transportation modes in the most advantageous way possible will require that tax policies be addressed in a more comprehensive manner. Carsharing organizations should be ready to push for change—and call for a more level playing field—as the policy window opens. 4: Expand research and policy awareness of the unanticipated consequences of the rising tax burden on both neighborhood car rentals and carsharing. Such efforts are particularly important to the expansion of the one-way and peer-to-peer segments. Moving to a world in which vehicle sharing is widespread will require educating policymakers about the social benefits of carsharing and neighborhood car rental—and why taxing these sectors at a rate more comparable to other goods and services would foster innovation and reduced dependence on privately owned cars. In many areas, much of the enthusiasm about the potential benefits of one-way and peer-to-peer carsharing must be tempered by the reality of lump-sum taxes accumulating with every reservation, creating a strong disincentive to sharing.
19
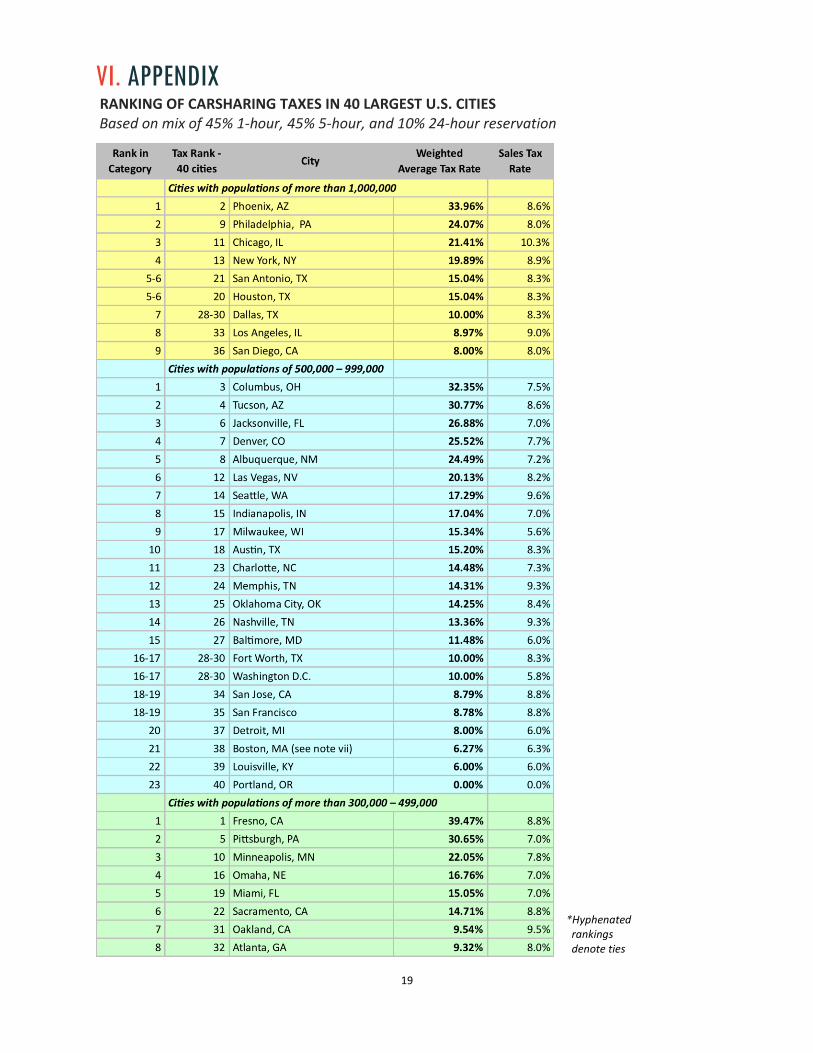
VI. APPENDIX RANKING OF CARSHARING TAXES IN 40 LARGEST U.S. CITIES Based on mix of 45% 1-hour, 45% 5-hour, and 10% 24-hour reservation
*Hyphenated rankings denote ties
20
RATES OF TAXATION IN NOTABLE CITIES IN SAMPLE Rounded to the 2nd Decimal Point
*Slight differences in tax rates may be due to rounding
21
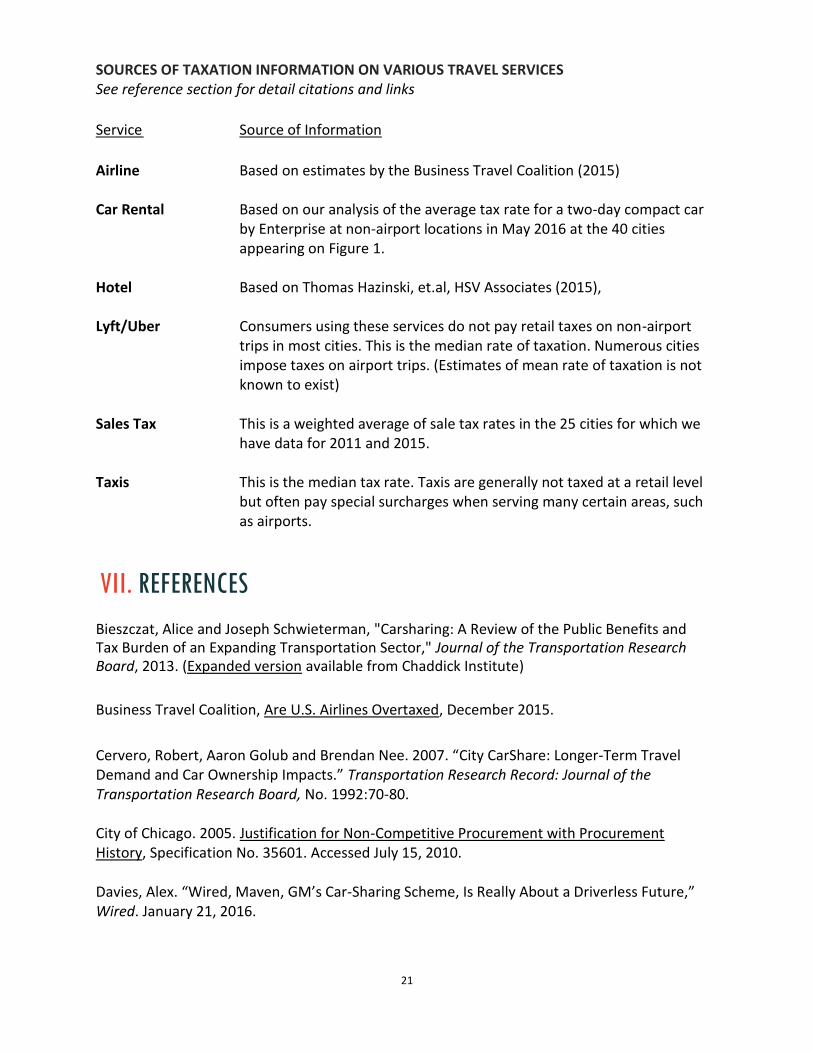
SOURCES OF TAXATION INFORMATION ON VARIOUS TRAVEL SERVICES See reference section for detail citations and links Service Source of Information Airline Based on estimates by the Business Travel Coalition (2015) Car Rental Based on our analysis of the average tax rate for a two-day compact car by Enterprise at non-airport locations in May 2016 at the 40 cities appearing on Figure 1. Hotel Based on Thomas Hazinski, et.al, HSV Associates (2015), Lyft/Uber Consumers using these services do not pay retail taxes on non-airport trips in most cities. This is the median rate of taxation. Numerous cities impose taxes on airport trips. (Estimates of mean rate of taxation is not known to exist) Sales Tax This is a weighted average of sale tax rates in the 25 cities for which we have data for 2011 and 2015. Taxis This is the median tax rate. Taxis are generally not taxed at a retail level but often pay special surcharges when serving many certain areas, such as airports.
VII. REFERENCES Bieszczat, Alice and Joseph Schwieterman, "Carsharing: A Review of the Public Benefits and Tax Burden of an Expanding Transportation Sector," Journal of the Transportation Research Board, 2013. (Expanded version available from Chaddick Institute) Business Travel Coalition, Are U.S. Airlines Overtaxed, December 2015.
Cervero, Robert, Aaron Golub and Brendan Nee. 2007. “City CarShare: Longer-Term Travel Demand and Car Ownership Impacts.” Transportation Research Record: Journal of the Transportation Research Board, No. 1992:70-80. City of Chicago. 2005. Justification for Non-Competitive Procurement with Procurement History, Specification No. 35601. Accessed July 15, 2010. Davies, Alex. “Wired, Maven, GM’s Car-Sharing Scheme, Is Really About a Driverless Future,” Wired. January 21, 2016.

22
Econsult Corporation. 2010. The Economic and Environmental Impact of PhillyCarShare in the Philadelphia Region. Accessed July 5, 2010. Feigon, Sharon. 2008. The I-GO Carsharing Program. Lecture, American Planning Association, Chicago, IL, January 8. Accessed February 2, 2011. Government Fleet. 2010. Philadelphia Pilots Carsharing and Tracking Technology in City Vehicles. Accessed February 3, 2011. Grasset, Vincent and Catherine Morency. 2010. Carsharing: Analyzing the interaction between neighborhood features and market share. Paper presented at the annual meeting of the Transportation Research Board, Washington, D.C. January 10-14. Green, Elwin. 2008. Paying the Price: New $2 Rental Car Levy Punishing Flexcar Users. Pittsburgh Post-Gazette, February 5. Hazinski, Thomas, Alex Moon and Madeline Rees, HVS Lodging Tax Report, HVS Convention, Sports, and Entertainment. September 2015. Litman, Todd, “Evaluating Carsharing Benefits,” Victoria Transport Policy Institute, 17 September, 2015. Lane, Clayton. 2005. “PhillyCarShare: First-Year Social and Mobility Impacts of Carsharing in Philadelphia, Pennsylvania.” Transportation Research Record: Journal of the Transportation Research Board, no. 1927: 158-166. Martin, Elliot W. and Susan A. Shaheen. 2010. Greenhouse Gas Emission Impacts of Carsharing in North America. San Jose, CA: Mineta Transportation Institute. Accessed July 10. Martin, Elliot W. and Susan A. Shaheen. (2011a) "Greenhouse Gas Emission Impacts of Carsharing in North America" IEEE Transactions on Intelligent Transportation Systems. IEEE Transactions on Intelligent Transportation Systems 12 (4), 1074-1086. Martin, Elliot W. and Susan A. Shaheen (2011b). “The Impact of Carsharing on Public Transit and Non-Motorized Travel: An Exploration of Survey Data of North American Carsharing Members,” Energies, 4 (11), 2094-2114. Massachusetts Department of Revenue. 2005. TIR-05-1: Convention Center Financing Surcharges. Accessed February 3, 2011. Millard-Ball, Adam, Gail Murray, Jessica Ter Schure, Christine Fox and Jon Burkhardt. 2005. Carsharing: Where and How It Succeeds (TCRP Report 108). Washington, DC: Transportation Research Board. Accessed August 27, 2010. Multnomah County Board of Commissioners. 2009. Ordinance No. 1132. Accessed January 5, 2011.

23
Nassauer, Sarah. 2008. “Carsharing companies fight taxman”. Wall Street Journal, June 19. Philadelphia Code. Chapter 14-1638.11. Accessed February 2, 2011. San Francisco Planning Department. 2010. Car-Share Requirements and Guidelines. Accessed November 24. Scott, Steven and David Brook and Matei Perussi. 2003. Impacts of Carsharing on Walking Behavior. Paper presented at the Walk 21 conference Portland, Oregon, May 1-3. Accessed December 18, 2010. Schuster, Thomas D., John Byrne, James Corbett and Yda Schreuder. 2005. Assessing the Potential Extent of Carsharing: A New Method and Its Implications Transportation Research Record: Journal of the Transportation Research Board, no 1927, 174-181. Seattle Post-Intelligencer. 2008. Editorial “Renting is better” Seattle Post-Intelligencer, February 8. Shaheen, Susan A. and Adam Cohen, Innovative Mobility Carsharing Outlook: Market Overview, Analysis and Trends, Transportation Sustainability Research Center, University of California Berkeley, Summer 2015. Accessed on May 14, 2016. Shaheen, Susan A. and Adam P. Cohen, Carsharing and personal vehicle services: worldwide market developments and emerging trends, International Journal of Sustainable Transportation 1 (no. 7) (2013), 5 – 34.
Shaheen, Susan, Adam P. Cohen and Melissa S. Chung. 2009. “North American Carsharing 10-Year Retrospective.” Transportation Research Record: Journal of the Transportation Research Board, no. 2110: 35-44. Shaheen, Susan, Adam P. Cohen and J. Darius Roberts. 2005. Carsharing in North America: Market Growth, Current Developments, and Future Potential. Davis, CA: Institute of Transportation Studies, University of California. Accessed May 5, 2010. Shared-Use Mobility Center/American Public Transit Association, 2016, Shared Mobility and the Transformation of Public Transit (TCRP J-11/Task 21), 2016. Submitted by the Shared-Use Mobility Center to APTA.
Shoup, Donald. 2005. The High Cost of Free Parking. Chicago: American Planning Association Planners Press. Tal, Gil. “Evaluating the Effect of Carsharing: Exploring the Gap Between What We Know vs. What We Need to know and Its Effect on Optimism Bias Institute of Transportation Studies,” University of California, Davis, 2009. Zhou, Jiangping. Carsharing on University Campus: Subsidies, Commuter benefits, and their impacts on Carsharing. Transportation Research Part D 32 (2014) 316–319.

24
1 For an assessment of UberPool pricing, see our June 2016 report, “Have App Will Travel: Comparing the Price & Speed of 50 CTA & UberPool Trips in Chicago,” available at las.depaul.edu/chaddick 2 The authors are indebted to Alice Bieszczat for assembling large data set on carsharing prices and taxes in 2011. This data is summarized in her master’s thesis and available by request from the Chaddick Institute. This data is summarized in Bieszczat and Schwieterman (2013). 3 These estimates are based on tax information, weighted on the basis of population, of the 27 cities in which had one, five, and 24 hour data available for both 2011 and 2016. See previous endnote for more details on this earlier study, which uses data assembled by Alice Bieszczat and Joseph Schwieterman (2013). 4 In some cases, the tax rate charges are the result of the changing base price of the reservation rather than a change in the tax rates themselves. (This affects the rates in cities that have flat-rate taxes). In general, however, the prices of reservations have risen since 2011, which may have offset some of the effects of hikes in government taxation. 5 The median refers to the midpoint in the distribution of values. The vast majority of ridesharing trips are not subject to retail taxes, making the median rate equal to zero. Although data is not available on the mean rate of retail taxes, there is strong reason to believe this rate is less than 2 or 3%. 6 This estimate is based on our analysis of the average tax rate for a two-day compact car by Enterprise at non-airport locations in May 2016 at the 40 cities appearing on Figure 1. vii The Boston estimate does not include the effects of the $10 annual convention base. If this is amortized across all carsharing reservations over the course of a year, it results in a much higher tax rate under most scenarios.
The authors wish to acknowledge the assistance of: Adam Cohen of the Innovative Mobility Research Group at the Transportation Sustainability Research Center, University of California-Berkley; Colin Murphy of the Shared-Use Mobility Center; and Alice Bieszczat. Any errors in this report remain our own.
Other recent Chaddick Institute studies on private innovation in passenger transportation include Have App Will Travel: Comparing the Price & Speed of Fifty CTA & UberPool Trips in Chicago (June 2016) and The Remaking of the Motor Coach: 2015 Year-in-Review of Intercity Bus Service in the United States (January 2016).