(From the University of Biochemical Laboratory, Chepauk ...
13
ENZYMIC PROTEOLYSIS* Part V. The Liberation of Cystine BY M. DAMODARAN AND T. K. KRISHNASWAMY (From the University of Biochemical Laboratory, Chepauk, Madras) Received January 29, 1942 INVESTIGATIONS on the time course of the liberation of cystine ' and other amino-acids from proteins during enzymic digestion were carried out by Abderhalden and Reinbold (1905). In these experiments pancreatin was allowed to act upon edestin, portions of the digest were removed at definite intervals and dialysed. The non-dialysable residue gave negative reactions for tyrosine after 24 hours, for tryptophane after 4 days and for cystine (" Schwefelblei probe ") after 8 days, indicating that these three amino-acids were present entirely in the free condition at the end of the respective periods noted. Recently the rate of liberation of cystine has been studied more quantitatively with the aid of two widely used methods, the Folin and Marenzi method, based upon the reduction of Folin's uric acid reagent by thiol compounds, and the Sullivan reaction using fl-naphthaquinone sulphonate. Employing these colorimetric procedures Jones and Gersdorff (1933) found that during peptic digestion of casein the Sullivan reaction remained negative throughout while the Folin and Marenzi reagent gave high colour values which rose to a peak in the early stages of digestion and then fell to a constant value. In parallel experiments in which hydrolysis was effected by means of 2G% HC1 the Folin and Marenzi method showed similar abnormal values which were, in the early stages of hydrolysis, much higher than the total cystine content of casein. Jones and Gersdorff came to the conclusion that pepsin does not split free cystine from casein and that the high Folin and Marenzi colour values obtained with peptic digests are produced by some compound or compounds other than cystine. In their opinion two factors, a stable and an unstable type of chromogenic compound, were involved; the possibility was also suggested that substances such as furfural, pyruvic acid, levulinic acid etc., might be responsible for colour formation. With egg albumin using the same reagent for the estimation * Papers I--IV in this series appearedin the Biochemical Journal, 1877, 32; 1919,32 ; 2105, 32 ; 122, 35. 285
Transcript of (From the University of Biochemical Laboratory, Chepauk ...

E N Z Y M I C P R O T E O L Y S I S *
Part V. The Liberat ion of Cyst ine
BY M. DAMODARAN AND T. K. KRISHNASWAMY (From the University of Biochemical Laboratory, Chepauk, Madras)
Received January 29, 1942
INVESTIGATIONS on the time course of the liberation of cystine ' and other amino-acids from proteins during enzymic digestion were carried out by Abderhalden and Reinbold (1905). In these experiments pancreatin was allowed to act upon edestin, portions of the digest were removed at definite intervals and dialysed. The non-dialysable residue gave negative reactions for tyrosine after 24 hours, for tryptophane after 4 days and for cystine (" Schwefelblei probe ") after 8 days, indicating that these three amino-acids were present entirely in the free condition at the end of the respective periods noted. Recently the rate of liberation of cystine has been studied more quantitatively with the aid of two widely used methods, the Folin and Marenzi method, based upon the reduction of Folin's uric acid reagent by thiol compounds, and the Sullivan reaction using fl-naphthaquinone sulphonate. Employing these colorimetric procedures Jones and Gersdorff (1933) found that during peptic digestion of casein the Sullivan reaction remained negative throughout while the Folin and Marenzi reagent gave high colour values which rose to a peak in the early stages of digestion and then fell to a constant value. In parallel experiments in which hydrolysis was effected by means of 2G% HC1 the Folin and Marenzi method showed similar abnormal values which were, in the early stages of hydrolysis, much higher than the total cystine content of casein. Jones and Gersdorff came to the conclusion that pepsin does not split free cystine from casein and that the high Folin and Marenzi colour values obtained with peptic digests are produced by some compound or compounds other than cystine. In their opinion two factors, a stable and an unstable type of chromogenic compound, were involved; the possibility was also suggested that substances such as furfural, pyruvic acid, levulinic acid etc., might be responsible for colour formation. With egg albumin using the same reagent for the estimation
* Papers I--IV in this series appeared in the Biochemical Journal, 1877, 32; 1919, 32 ; 2105, 32 ; 122, 35.
285

286 M. Damodaran and T. K. Krishnaswamy
of cystine Calvery e t a l . (1936) obtained high chromogenic values but in contrast to Jones and Gersdorff appear to be of opinion that these values represent in fact cystine set free by pepsin.
In tryptic digestion there is evidence to show that cystine is rapidly liberated. Pollard and Chibnall (1934) using Prunty's (1933) modification of the Sullivan reaction found that about 72 and 52?/0 respectively of the cystine in rye grass and cocksfoot proteins were present in the free condition after 72 hours' digestion with trypsin. These experiments also gave indi- cation of the decomposition of cystine during prolonged digestion. In experiments on the tryptic digestion of casein carried out by Jones and Gersdorff (1939) 80~ of the cystine was liberated in 24 hours, but a large part of this was destroyed on account of the alkalinity of the medium (pH 8-9). At pH 6.6-6.8 about 40% of the cystine as determined by the Sullivan method was in the free condition in 24 hours and almost complete liberation took place in 120 hours. In these experiments also the Folin and Marenzi method gave "h igh and erratic values ".
In the experiments now described a study has been made of the liber- ation of cystine from eight proteins during the action of pepsin and trypsin in succession. As in the experiments of Jones and Gersdorff (1933) none of the eight proteins studied gave a positive Sullivan reaction during peptic digestion, but with the uric acid reagent all gave high colour values. The value in the case of casein (Fig. I) reached a maximum at 161~o of the total cysfine of casein in the first hour of digestion and then fell gradually to a constant value of about 104~o. Egg albumin (Fig. II) showed a similar peak
ZOG~ , , , �9 , Pe, psm oa Casein
160 ~ , - + " ' + +"~
I ' ~ " ~ . . _ . . c , u i n o
t" 40
Time (hours)
F I G . I
value of 86.5~ at the end of 12 hours.
125
10(
7~
5O
25
e~ptWOilea+ ?y,tine - ~ - ealn an'd M,,e,:i
Anacardgn
- o eGliadi n
0 0 Egf Albumin
rime (hours)
~4 4's ~2 ;6 lzo
F I G . I I
The remaining six proteins (Figs. II and III) showed no such maxima, the Folin and Marenzi colour values increasing gradually in the course of digestion and finally remaining at a constant high level. In the case of anacardein this constant value'was higher

Enzymic Proleolys is- -V 287
again than the cystine content of the protein. In every case it was found that colour production with the Folin and Marenzi reagent could be completely inhibited by H.CHO and HgClz; as inhibition by these reagents has been shown by Shinohara (1936) and Lugg (1932) to be specific for thiol groups
I00
~0
6(
4(
2C
, '" i
PeptK DzgestS
C).stmc . - ~ Foha and Mareazt
Serum Globulin
I ~ o F~bnn
r~me (hourS) t i ~ 5 '4 .... ' s 6
Fio. III
9 ( - ~ " -
6(
3(
"f~me (hourSl
211 4~ 7I~ ~6 | ~ ' 144 168 192 216 240
FIo. IV
Io0 , i , , T _ , , ryps,n oa B aicrmdOa Globuhn 150
x20~ .. \ t' ~, "~, o_.--.o-~-o-----~-----o-----o-~ 12G
/~,.,~ "~" 9~
I ~/,,0 C),st, ne { ~ Sulh,,an 6C (--X-- N,t,~:,uss=:te
30[- Amino-N --[~-- "
I Time (hours') 3(J
0 24 4t~ 72 90 121~ 1,14 168 192 21~ :~tu'
FIG. V
' T,~'psu, On An'acardem ' '" "'0-- Foha and 5Iaren=~
C),stme ~ Sullivan { ~ Nitronrusstde ~ n o - l v
! "
Time (hours) , , I ~ t~o 1~ l;s 192 2~6 240
FIo. VI
it can be concluded that the chromogenic substances formed during peptic digestion are cystine complexes, most probably large polypeptides, capable of producing a higher intensity of colour than cystine itself. In the case of casein and egg albumin which show pronounced maxima in the hydrolysis curves it has to be assumed that complexes formed in the earlier stages of digestion are later split up into substances with less colorigenic power.
In tryptic digestion there were similar discrepancies between the values obtained by the two methods. Folin and Marenzi method gave with all the proteins, with the exception of edestin, values higher than the total cystine content, gliadin (Fig. IV), watermelon globulin (Fig. V) and ana- cardein (Fig. VI) showing maxima in the early phases of digestion similar

288 M. Damodaran and T. K. Krishnaswamy
to those shown by casein and egg albumin in peptic digestion. As colour production in these digests also could be completely inhibited by H.CHO and HgC12 it is to be inferred that the chromogenic substances are cysfine peptides.
Sullivan values also showed maxima in two cases, viz., casein and fibrin. However, while the shape of the curves with Folin and Marenzi values is to be explained on the assumption of the formation and subsequent break- down of highly chromogenic polypeptides the rise and fall of the Sullivan values observed with these two proteins is to be ascribed to destruction of free cystine. In view of the evidence for the destruction of cystine produced by Jones and Gersdorff (1939) at the end of the digestion period aliquots of the digests were hydrolysed completely with acid and cystine determinations carried out by the Sullivan method. With most proteins it was found that there was considerable destruction, the value obtained in the digests being much lower than on an equivalent amount of the intact protein. The exl~ent of destruction varied from protein to protein being highest with casein, amounting to almost half; egg albumin and watermelon globulin showed no destruction while the other proteins occupied intermediate positions. In addition to the Folin and Marenzi and Sullivan methods, the nitroprusside reaction (Krishnaswamy, 1942) was also made use of in studying the progress or tryptic digestion. The values for disulphide groups thus obtained were usually intermediate between the values obtained by the other two methods but it does not appear that any special meaning can be attached to these data.
From a comparison of the rates of peptide splitting (increase in amino nitrogen) and cystine liberation (as determ:ned by the Sullivan method) it will be obvious that in some digests cystine splitting takes place much more rapidly than peptide hydrolysis so that there is justification for the view that this amino-acid occupies an "exposed position" in these proteins. The data regarding the extent of peptide hydrolysis at the stage when cystine liberation had reached the maximum are summarised in Table I. Making allowance for the amount of cystine destroyed during digestion it will be seen that practically all the cystine in anacardein, watermelon globulin and edestin are set free in the early stages of digestion (48-72 hours) when peptide hydrolysis has proceeded to only about 50%. From gliadin 95% of the cystine is set free in 96 hours when the extent of protein hydro- lysis is 58%. With the animal proteins, fibrin, egg albumin and serum globulin, however, there is no such marked discrepancy between the rates of cystine and amino nitrogen liberation, cystine present in the free condi- tion ranging from 74-80% when peptide hydrolysis is approximately 70%.

Ensyrnie P roteolysis~ V 289
The significance of these observations with reference to the position of cystine in the protein molecule requires further elucidation.
TABLE I
Liberation of Cystine and Amino-N
Protein f Time hr. Peptide
Hydrolysis %
Free cystine % (corrected for destruction)
Edestin . . . . 72 Gliadin . . . . 96
Anacardein iit 72 Watermelon globulin .. 48 Casein .. 24 Fibrin .. 96 Egg albumin .. 120 Serum globulin 168
59"3 58"7 56"9 52"2 49" 5 68"6 65"2 71 "3
97"2 95"4
100"9 99" 1 90"2 78"8 74"4 80"7
Experimental
Materials.--Casein, edestin, gliadin and fibrin were prepared accord- ing to standard methods. The serum globulin used was the euglobulin described in Plimmer (1933). Anacardein was prepared according to Damodaran and Sivaswamy (1936), and the watermelon globulin by the method of Krishnan and Krishnaswamy (1939). B . D . H . preparations of egg albumin, pepsin and trypsin were used.
Enzymic Digestion.--The following procedure based upon that employed in previous work from this laboratory (cf. Damodaran and Ananthanaraya- nan, 1938) was uniformly employed with all proteins studied. To 20 g. protein dissolved in about 950 ml. of N/20 HC1 was added, after adjustment of pH to 1.8, 1 g. pepsin in 50 mt. of N/20 HC1 and the solution made up to 1 1. At the end of 7 days 450 ml. of the digest was brought to pH 8.3 with NaOH, 0.5 g. trypsin dissolved in a small amount of water added and the solution made up to 500 ml.
For control, lg. pepsin was dissolved in 950 ml. of N/20 HC1, the pH adjusted to 1.8 and the solution made up to 1 1. After 7 days 450 ml. were brought to pH 8.3 and made up to 500 ml. after the addition of 0-5,g. trypsin dissolved in water. The values for amino-N and cystine in the digests were in all cases corrected for the values in the control experiments.
Methods of Analysis.--Amino-N was determined by formoi titration according to Sorensen (Abderhalden, 1923). 5 ml. aliquots of digests were withdrawn at intervals, neutralized to pH 6-8 and the resulting solution

290 M. Damodaran and T. K. Krishnaswamy
after treatment with 10 ml. of neutralised formalin titrated with standard N/10 NaOH.
Cystine was determined by the Folin and Marenzi (1929) method as modified by Tompsett (1931), the Sullivan method (Sullivan and Hess, 1937) and by means of nitroprusside (Krishnaswamy, 1942). Aliquots measuring 2 to 5 ml. were removed according to the concentration of cystine present. Further details were exactly as described in the original papers. In casein digests with low cystine content determinations had to be made with added standard. In the accompanying tables, A, B and C represent Folin and Marenzi, Sullivan and Nitroprusside values respectively.
For calculation of the extent of peptide hydrolysis amino nitrogen determined according to Sorensen was compared to the amino nitrogen on complete hydrolysis, this value being calculated from N-distribution values given in Plimmer (1917). For calculation of ~o cystine splitting total cystine in each protein was determined experimentally after acid hydrolysis. For ascertaining the extent of the destruction of cystine during digestion the digests were completely hydrolysed with acid and cystine determinations made in these hydrolysates.
Total Cystine in the Proteins.--O. 5. to 3 g. of protein (to contain about 10 rag. cystine) was hydrolysed with 20 parts of 20~ HC1 for 8 hours, the hydrolysate repeatedly distilled in vacuo to expel the acid, decolorised with 0.5 g. kaolin and made up to 50 ml. 5ml. aliquots were used for the deter- mination of cystine by the three colorimetric methods already mentioned. From the values given in Table II it will be seen that with completely hydro- lysed proteins, with the exception of casein, the three methods give fairly concordant values.
T A B L E I I
Cystine Content o f Proteins
Pro te in
Casein . . . . Edes t in . . . . G l i ad in . . Anacarde ian" W a t e r m e l o n g lobu l in" Egg a l b u m i n . . Se rum globul in . . F ib r in . �9
A
0 .42 1-44 2 .52 1 .45 1.19 2 .69 2 .41 2 .02
Cys t ine
0"28 I "41 ~ :39
38 1"19 2"15 2 .05 1 . 8 4
t
C
0 ' 2 9 1 "48 2"61 1 "38 1"19 2"69 2"53 2"28

Enzymic Proteolysis~V 291
150
12{
9(
6r
3(
. ' ' i ,yps! 'n on ~ct ,st ,~ ' " '
~ C sline | " ~ Folin a n d Murenz.i "'~ Y I ~ Sullivan i ~ Amino-N
T, me (hours)
FIo. VII
Trypsin on Egg Albumin
120 ~
90 r~
~' C,,ine { ~ Sull .... l / t-x-_ ~.,o~ru.'e I
I A m , n o - l r - '{33- 4
Time (hours) �9 , a I # t i i !
) 24 48 72 96 120 144 16.8 192 216 2
FIG. VIII
Tr),pszn on Casein
15s
12(
6(
3(
T~me (hours)
2'4 48 72 66 120 144 168 192 216 240
FIG. I X
150
120
90
15C
120
90
60
80
Trypsin on Serum Olobuhn
~ ~ ' - ~
24 48 72 96 120 144 168 192 216 240
"-~ ' ' rry'sinp one"'"'Fibein ' ' '
FiG. X
6(~ " ~ . . . . i--O-- Folin and bIarenzl Cystint ] ~ Sullivan
30'- I @ Nitroprussidt Ammo-N
Time (hours)
o 2~4 4's 7'2 9'6 a~o ,h ~'~8 ib2 216 240 FIG. XI
Destruction of Cystine during Tryptic Digestion.--lO ml. of the digest in each case was treated with 17 ml. o f conc. HCI and refluxed for 8 hours. The acid was removed by repeated distillation in vacuo, the solution de- colorised with kaolin and made up to 25 ml, 5 ml. aliquots were taken for

292 M. Damodaran and T. K. Krishnaswamy
Sullivan determination, standard cystine being added in the case of aliquots with low cystine content. The results are given in Table III.
TABLE I I I
Destruction of Cystine
Protein Cystine %
in Protein
Edestin . . . . 1.41 Gliadin .. 2.39 , o
Anacardein 1.38 Watermelon globulin" I. 19 Casein . . . . 0.28 Fibrin .. 1- 84 Egg albumin" . 2" 15 Serum globulin i[ 2.05
/
Cystine % in Protein after diges-
tion
0-97 1 .96 1 .02 1.19 0.15 1.73 2-15 1-89
Destruction
31 "3 18"2 26"7 0
45"8 5"9 0 7"9
PROTOCOLS
TABLE I V
Pepsin and Trypsin on casein
Hydrolysis %
Time Trypsin
hr. Cystine
0-5 O.75 1.0 1.5 2 3 4 5 6
24 48 72 96
120 144 168 192 216 240 264 288
Pepsin
I Peptide Cystine 'A
~ 1 7 6
7.2 7.9 8-5
11 "9 13"9 15"6 16"9 17"3 17"3
135.7 142.9 161.1 127-5 114.3 105.4 104.3 103-9
103'.9
Peptide
~
~
35:6
38:6 49.5 57.4 60.9 63.8 66-8 69.0 70.9 72.7 74.4 75.6 76.0 76.0
A I
47:1 60.7
65" 90
114 123.2 133.9 146" 1
~ 9
146:1 146.1
B
o ,
, .
66:4 90.2 60 58"2 43.6, 32.9 30"9
9 ~
~ P
30"9 30-9

Enzymic Proteolysis-- U
TABLE V
Pepsin and Trypsin on Edestin
293
Hydrolysis
Time Pepsin Trypsin
hr. Cystine
I 2 3 4 6
24 48 72 96
120 144 168 192. 216 240 264 288
Peptide Cystine A
2.1 39.2 5.6 44.5 7-2 45.8 8.4 42.2
42.0 1i:7 t, 13.9 t, 14.8 ,t 15-5 ,t 16"0 ,, 16.2 16-2 42"0
Peptide
. .
34:0
37:3 51.4 56.3 59-3 61.4 62-9 64.1 65.1 66.1 66.8 67-5
67~5
A t B 78.0 . . 81.6 . . 86.5 . .
96:0 4':):4 ,, 46.8 ,, 59"0 ,t 6 6 " 2
t ~ t ~
96"0 66'.2
TABLE VI
Pepsin and Trypsin on Gliadin
Hydrolysis %
Time Pepsin Trypsin
hr. Cystine
I 2 3 4 5 6
24 48 72 96
120 144 168 192 216 240 264 288
Peptide
1"3 3-3 4.9 5"9 6.3
1o:9 11.8 12.8 13"9 14"2
lg2
Cystine A
35.6 42.9 51.9 56.9 60.3
7J :2 82"4 90.4
90"4
Peptide
~
33~9
3~:o
48;9 55.1 58.7 58.7 62.7 65.4 67.3 68.0 68.7
68~7
A
105.9 107.9 110.9
11,~:2 120.0 112.9 105.0
~ t
lOJ'O
B
3J:5
4i" 60" 7 67"3 77"4
77"4
56:2 78.3 84" I 88-3 90"4
90'. 4

294 M. Damodaran and T. K. Krlshnaswamy
TABLE VII
Pepsin and Trypsin on Anaeardein
Hydrolysis %
Time Pepsin Trypsin
hr. Cystine
0.5 1 2 3 4 5 6
24 48 72 96
120 144 168 192 216 240 264 288
Peptide Cystine A
63.5 ,~:5 70.6 6-4 73.7 7.4" 77.3 8.3 79.4 9-0 85.8
10.9 12.9 105" 13-7 112.9 14-5 ,, 15-0 ,, 15.5 ,,
15"5 112"9
Peptide
~
~
35:6 . ,
4i:2 50.6 54.5 56.9 60.2 62.0 63-l 64.1 65.4 66.3 67.0
67'.0
A
112:7 130
. o
133:3 137-6 144.7 150 117.2 107.1 97.9
107:1
B
. ~
42:6 . .
47:6 65 .4 74~ 82-5
8i'.5
C
~ 1 7 6
. ~
. ~
. ~
5"1:2 75-9 83-0 84"4 85.1
8~: 1
TABLE V I I I
Pepsin and Trypsin on Watermelon Globulin
Hydrolysis %
Time Pepsin Trypsin
hr. Cystine
0-5 0.75 1 1.5 2 3 4 5 6
24 48 72 96
120 144 168 192 216 240 264 288
Peptide
i:9 ~:3 5"2 7'2 8"7
li:5 12-6 13.5 14.2 15'0 15.4 15.4
Cystine A
43"0 45"0 46" 1 50"2 51 "3 52"9
) )
5~'.9
Peptide
35:2
3925 47.6 52.2 59.4 63.5 65"8 67.3 68"3 69"0 69.5 69.8
6r 8
A
~
110:9
117:6 122.7
126~7 131-1 121-9 108"4
10~[4
B I C !
45:4 69:5 81 "2 84-0 99-1 85-7
87.4 ) ) [
,, j 93.0 ) ) ] ) )
) ) 1 ) )
9 ) 5 -
I
) ) 1 ) ) I
9r 1 93.0
E~zzymlc Proteolysis~ V
TABLE IX
Pepsin and Trypsin on Egg Albumin
295
Hydrolysis %
Pepsin Trypsin Time
hr. Cystine
0"5 1 1.5 2 3 4 5 6 8
12 24 48 72 96
120 144 168 192 216 240 264 288
Peptide Cystine A
41.4 i:3 42.6
54.0 �89 61.4 3.8 70.0 4.8 75.6 5.7 77.2 7.2 78.4 8.1 84.7
10.2 86.5 11.5 75.6 13.5 74.6 15.2 73.5 16.7 ,, 18.7 ,, 19.4 19.4 73~5
Peptide
, ~
. .
3b:5
43:7 . ~
5i:6 55.7 59.0 62"0 65.2 6g.1 71.2 73.3 75.3 76.3 76.8 76-8
A
. ~
, ~
93:0 94.2
~
16i2
li5.3 I19"1
11~'i
B
28"7
4527 52,3 61,6 70.2 74"4
7z~'. 4
C
3~:5 . ~
. .
46:5 , .
65:2 70.0 74"4 80-0
80'0
TABLE X
Pepsin and Trypsin on Serum globulin
Hydrolysis
Time Pepsin Trypsin
hr. Cystine
0"75 1 1 "25 2 3 4 6
24 48 72 96
120 144 168 192 216 240 288
Cystine Peptide A
22. I i:4 40.2
45"9 3:4 50"3 6.8 69"2 8-2 72"2
li" " 1
13.2 ,, 14.9 ,, 15.4 ,, 15.8 ,, 16.0 16.0 72'-2
Peptide
. ~
34:4
3~:5 47-8 54.1 59.1 64.3 68-2 70.2 71-3 72.3 73.5 74.6 75.3
A
io~:9
126:5 145" 3
. .
145.3
. ~
. ~
35:9
5~:7 54.6 62.2 64.1 66-5 68-4 72.7
72'.7
C
~
. ~
62:4 . ~
7i:1 81.5 91.2 91.2 88"3 79"0
7~'.o
296 M. Damodaran and T. K. Krlshnaswamy
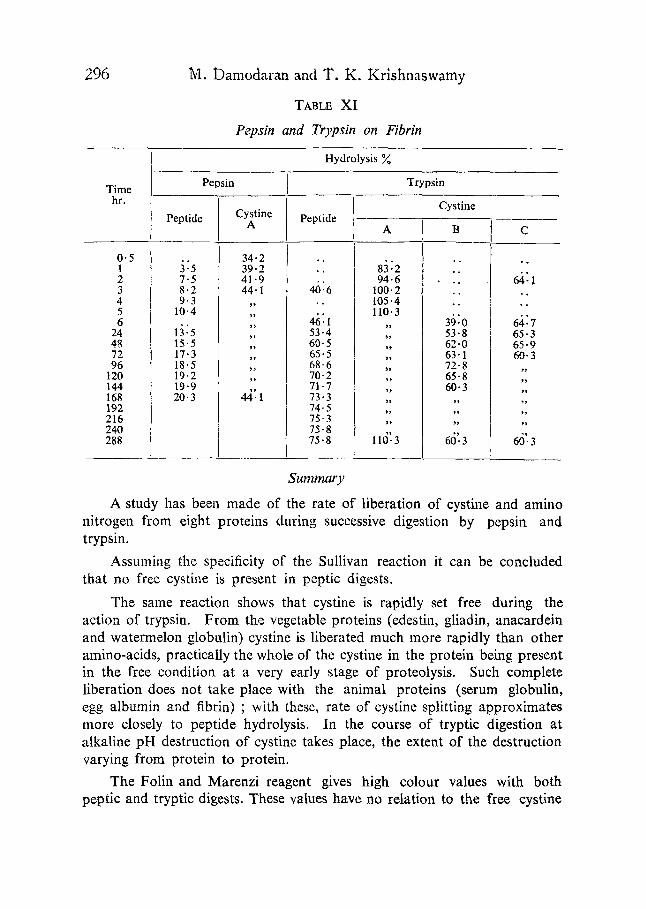
TABLE XI
Pepsin and Trypsin on Fibrin
Hydrolysis
Time Pepsin Trypsin
hr. Cystine
0.5 1 2 3 4 5 6
24 48 72 96
120 144 168 192 216 240 288
Peptide Cystine A
34.2 3~5 39.2 7.5 41.9 8-2 44-1 9.3 ,,
10.4 ,,
1 :5 ;i 15-5 ,, 17.3 ,, 18.5 ,, 19.2 ,, 19.9 20"3 44]1
Peptide
46:6
46:1 53.4 60-5 65-5 68.6 70-2 71.7 73.3 74.5 75-3 75-8 75.8
A
83:2 94-6
100.2 105.4 110.3
s ~
s ,
~ 9
l l d :3
~
39:0 53.8 62-0 63-1 72"8 65.8 60- 3
7~
~7
66'. 3
C
~ 1 7 6
6;,: I
6i:7 65-3 65.9 60- 3
7."
7 ,
7 ,
60.3
Summary
A study has been made of the rate of liberation of cystine and amino nitrogen from eight proteins during successive digestion by pepsin and trypsin.
Assuming the specificity of the Sullivan reaction it can be concluded that no free cystine is present in peptic digests.
The same reaction shows that cystine is rapidly set free during the action of trypsin. From the vegetable proteins (edestin, gliadin, anacardein and watermelon globulin) cystine is liberated much more rapidly than other amino-acids, practically the whole of the cystine in the protein being present in the free condition at a very early stage of proteolysis. Such complete liberation does not take place with the animal proteins (serum globulin, egg albumin and fibrin) ; with these, rate of cystine splitting approximates more closely to peptide hydrolysis. In the course of tryptic digestion at alkaline pH destruction of cystine takes place, the extent of the destruction varying from protein to protein.
The Folin and Marenzi reagent gives high colour values with both peptic and tryptic digests. These values have no relation to the free cystine

,Enzymic Proteolysis~ V 297
present, being frequently in great excess of the total cystine content of the protein. This colour production is due to cystine complexes and not to non-nitrogenous substances as has been previously suggested.
Abderhalden
and Reinbold Calvery, Block and Schock Damodaran and Ananta-
Narayanan and Sivaswamy
Folin and Marenzi Jones and Gersdorff
Krishnan and Krishnaswamy Krishnaswamy Lugg Plimmer
Pollard and Chibnall Prunty Shinohara Sullivan and Hess Tompsett
BIBLIOGRAPHY
�9 . H a n d b u c h d e r B io log i s chen A r b e i t s m e t h o d e n ,
E i w e i s s a b b a u p r o d u k t e (Berlin), 1923, 245. �9 . H o p p e - - S e y l . Z . , 1905, 46, 166. �9 .Tour. B io l . C h e m . , 1936, 113, 21.
B i o c h e m . J . , 1938, 32, 1877.
. . Ib id . , 1936, 30,604.
�9 .Tour. B io l . C h e m . , 1929, 83, 103. . . Ib id . , 1933, 101,657.
. . Ib id . , 1939, 129, 207. �9 B i o c h e m . J . , 1939, 33, 1284.
. . P r o c . Ind . A c a d . Sc i . , 1942, 15, 135. . . B i o c h e m . J . , 1932, 26, 2160.
. . T h e C h e m i c a l C o n s t i t u t i o n o f P r o t b i n s , Part I (London), 1917, 132.
. . O r g a n i c a n d B i o c h e m i s t r y (London), 1933, 490. . . B i o c h e m . J . , 1934, 28, 326.
. . I b i d . , 1933, 27, 387.
�9 .Tour. B io l . C h e m . , 1936, 112, 697. . . Ib id . , 1937, 117, 423.
�9 B i o c h e m . J . , 1931, 25, 2014.