FROM THE IO’s DESK: Market on the verge of gaining ... on the verge of gaining momentum Amid...
16
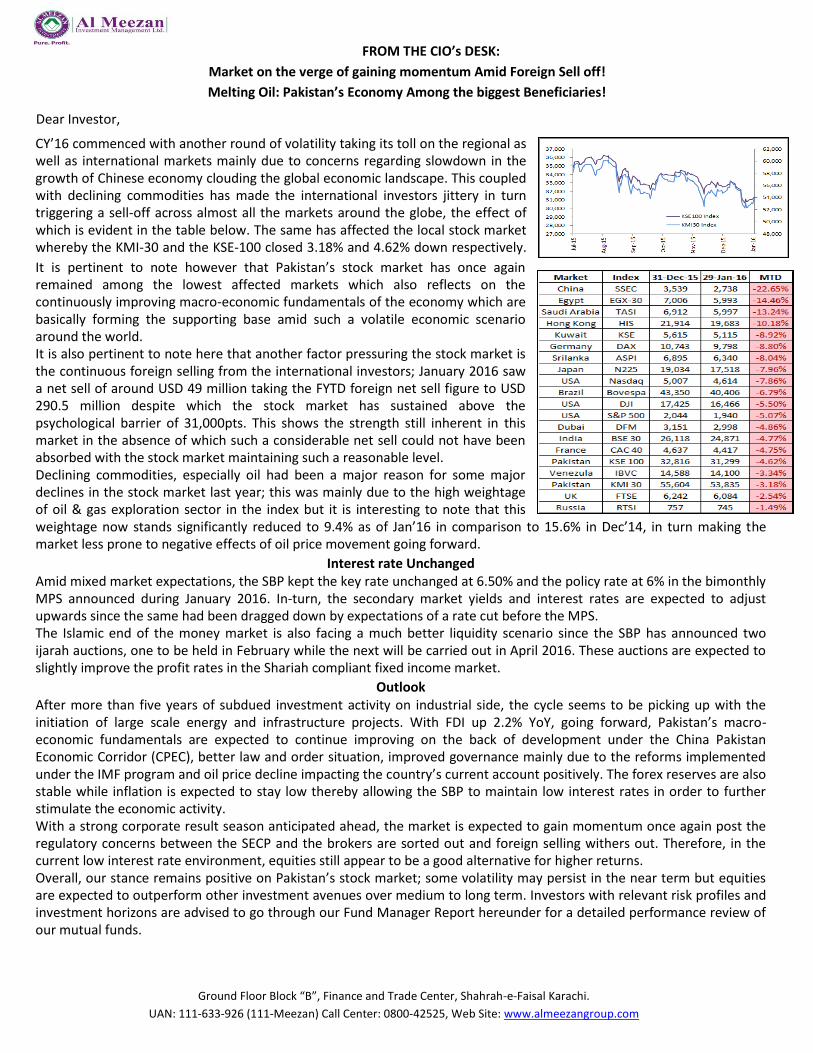
FROM THE CIO’s DESK: Market on the verge of gaining momentum Amid Foreign Sell off! Melting Oil: Pakistan’s Economy Among the biggest Beneficiaries! Dear Investor, CY’16 commenced with another round of volatility taking its toll on the regional as well as international markets mainly due to concerns regarding slowdown in the growth of Chinese economy clouding the global economic landscape. This coupled with declining commodities has made the international investors jittery in turn triggering a sell-off across almost all the markets around the globe, the effect of which is evident in the table below. The same has affected the local stock market whereby the KMI-30 and the KSE-100 closed 3.18% and 4.62% down respectively. It is pertinent to note however that Pakistan’s stock market has once again remained among the lowest affected markets which also reflects on the continuously improving macro-economic fundamentals of the economy which are basically forming the supporting base amid such a volatile economic scenario around the world. It is also pertinent to note here that another factor pressuring the stock market is the continuous foreign selling from the international investors; January 2016 saw a net sell of around USD 49 million taking the FYTD foreign net sell figure to USD 290.5 million despite which the stock market has sustained above the psychological barrier of 31,000pts. This shows the strength still inherent in this market in the absence of which such a considerable net sell could not have been absorbed with the stock market maintaining such a reasonable level. Declining commodities, especially oil had been a major reason for some major declines in the stock market last year; this was mainly due to the high weightage of oil & gas exploration sector in the index but it is interesting to note that this weightage now stands significantly reduced to 9.4% as of Jan’16 in comparison to 15.6% in Dec’14, in turn making the market less prone to negative effects of oil price movement going forward. Interest rate Unchanged Amid mixed market expectations, the SBP kept the key rate unchanged at 6.50% and the policy rate at 6% in the bimonthly MPS announced during January 2016. In-turn, the secondary market yields and interest rates are expected to adjust upwards since the same had been dragged down by expectations of a rate cut before the MPS. The Islamic end of the money market is also facing a much better liquidity scenario since the SBP has announced two ijarah auctions, one to be held in February while the next will be carried out in April 2016. These auctions are expected to slightly improve the profit rates in the Shariah compliant fixed income market. Outlook After more than five years of subdued investment activity on industrial side, the cycle seems to be picking up with the initiation of large scale energy and infrastructure projects. With FDI up 2.2% YoY, going forward, Pakistan’s macro- economic fundamentals are expected to continue improving on the back of development under the China Pakistan Economic Corridor (CPEC), better law and order situation, improved governance mainly due to the reforms implemented under the IMF program and oil price decline impacting the country’s current account positively. The forex reserves are also stable while inflation is expected to stay low thereby allowing the SBP to maintain low interest rates in order to further stimulate the economic activity. With a strong corporate result season anticipated ahead, the market is expected to gain momentum once again post the regulatory concerns between the SECP and the brokers are sorted out and foreign selling withers out. Therefore, in the current low interest rate environment, equities still appear to be a good alternative for higher returns. Overall, our stance remains positive on Pakistan’s stock market; some volatility may persist in the near term but equities are expected to outperform other investment avenues over medium to long term. Investors with relevant risk profiles and investment horizons are advised to go through our Fund Manager Report hereunder for a detailed performance review of our mutual funds. Ground Floor Block “B”, Finance and Trade Center, Shahrah-e-Faisal Karachi. UAN: 111-633-926 (111-Meezan) Call Center: 0800-42525, Web Site: www.almeezangroup.com
Transcript of FROM THE IO’s DESK: Market on the verge of gaining ... on the verge of gaining momentum Amid...
FROM THE CIO’s DESK:
Market on the verge of gaining momentum Amid Foreign Sell off!
Melting Oil: Pakistan’s Economy Among the biggest Beneficiaries!
Dear Investor,
CY’16 commenced with another round of volatility taking its toll on the regional as well as international markets mainly due to concerns regarding slowdown in the growth of Chinese economy clouding the global economic landscape. This coupled with declining commodities has made the international investors jittery in turn triggering a sell-off across almost all the markets around the globe, the effect of which is evident in the table below. The same has affected the local stock market whereby the KMI-30 and the KSE-100 closed 3.18% and 4.62% down respectively.
It is pertinent to note however that Pakistan’s stock market has once again remained among the lowest affected markets which also reflects on the continuously improving macro-economic fundamentals of the economy which are basically forming the supporting base amid such a volatile economic scenario around the world. It is also pertinent to note here that another factor pressuring the stock market is the continuous foreign selling from the international investors; January 2016 saw a net sell of around USD 49 million taking the FYTD foreign net sell figure to USD 290.5 million despite which the stock market has sustained above the psychological barrier of 31,000pts. This shows the strength still inherent in this market in the absence of which such a considerable net sell could not have been absorbed with the stock market maintaining such a reasonable level. Declining commodities, especially oil had been a major reason for some major declines in the stock market last year; this was mainly due to the high weightage of oil & gas exploration sector in the index but it is interesting to note that this weightage now stands significantly reduced to 9.4% as of Jan’16 in comparison to 15.6% in Dec’14, in turn making the market less prone to negative effects of oil price movement going forward.
Interest rate Unchanged Amid mixed market expectations, the SBP kept the key rate unchanged at 6.50% and the policy rate at 6% in the bimonthly MPS announced during January 2016. In-turn, the secondary market yields and interest rates are expected to adjust upwards since the same had been dragged down by expectations of a rate cut before the MPS. The Islamic end of the money market is also facing a much better liquidity scenario since the SBP has announced two ijarah auctions, one to be held in February while the next will be carried out in April 2016. These auctions are expected to slightly improve the profit rates in the Shariah compliant fixed income market.
Outlook After more than five years of subdued investment activity on industrial side, the cycle seems to be picking up with the initiation of large scale energy and infrastructure projects. With FDI up 2.2% YoY, going forward, Pakistan’s macro-economic fundamentals are expected to continue improving on the back of development under the China Pakistan Economic Corridor (CPEC), better law and order situation, improved governance mainly due to the reforms implemented under the IMF program and oil price decline impacting the country’s current account positively. The forex reserves are also stable while inflation is expected to stay low thereby allowing the SBP to maintain low interest rates in order to further stimulate the economic activity. With a strong corporate result season anticipated ahead, the market is expected to gain momentum once again post the regulatory concerns between the SECP and the brokers are sorted out and foreign selling withers out. Therefore, in the current low interest rate environment, equities still appear to be a good alternative for higher returns. Overall, our stance remains positive on Pakistan’s stock market; some volatility may persist in the near term but equities are expected to outperform other investment avenues over medium to long term. Investors with relevant risk profiles and investment horizons are advised to go through our Fund Manager Report hereunder for a detailed performance review of our mutual funds.
Ground Floor Block “B”, Finance and Trade Center, Shahrah-e-Faisal Karachi.
UAN: 111-633-926 (111-Meezan) Call Center: 0800-42525, Web Site: www.almeezangroup.com

0
\
Fund Managers’ Report AL Meezan Investment Management Limited
Stock Market Review
During the month of January 2016, the KSE-100 index declined by
4.62% to close at 31,298 points. Cement sector remained a positive
contributor to the Index whereas Oil and Banks were negative
contributors. The average daily volume of the market was 128.56
mn shares, down by 8.3% on a MoM basis.
Foreigners continued to sell during the month of January and
reported a net sell of USD 50 mn which kept downward pressure on
the market. Major foreign selling was witnessed in Oil, Fertilizer and
Banking sectors. Earnings announcements from Cement companies
bore favorably with investors due to impressive growth, which lent
support to the market. Oil prices, having hit a decade low of below
USD 28/bbl rebounded towards the end of the month, bringing
about interest in Oil stocks.
Slowdown in the global economy has brought about monetary
stimulus from major world economies including Europe and Japan.
Due to accommodative policies in these economies, further
monetary tightening by the US has decreased in likelihood. This can
alleviate investor fears in the coming months and can slow down
the pace of outflows from emerging markets. We believe that local
interest and tapering off of foreign selling will help the equity
market perform in the near term.
KSE-100 Index Performance
Al Meezan Investments, the company in operation since 1995, has one of the longest track record of managing mutual funds in the private sector
in Pakistan. Al Meezan Investments manages twelve mutual funds; namely Al Meezan Mutual Fund, Meezan Balanced Fund, Meezan Islamic
Fund, Meezan Islamic Income Fund, Meezan Tahaffuz Pension Fund, Meezan Cash Fund, Meezan Sovereign Fund, Meezan Capital Preservation
Fund II, Meezan Capital Preservation Fund III, Meezan Financial Planning Fund of Funds, KSE Meezan Index Fund and Meezan Gold Fund.
The total funds under management of Al Meezan, the only full-fledged Shariah compliant asset management company in Pakistan, have reached
Rs. 70.61 billion as on January 31, 2016. With an AM2+ credit rating denoting high management quality, the company clearly stays well ahead of
all its competitors in the Islamic asset management market in Pakistan.
January, 2016
Money Market Review
The State Bank of Pakistan (SBP) in its recent Monetary Policy
Statement (MPS) on January 30, 2015 has maintained the status quo
while keeping the Discount Rate (DR) unchanged at 6.5% in light of
improvements in macroeconomic indicators.
On the liquidity front, the money market faced relatively tight
liquidity scenario evidenced by Rs. 4.4 trillion worth of OMO
injections carried out by the SBP coupled with Rs. 94.5 billion worth
of discounting availed by various counters during this month. The
3MK closed 15bps down at 6.37% and 6MK closed 16bps down at
6.37%. The T-bill and PIB yields also took downward adjustments in
the range of 20-21bps and 21-52bps respectively.
On the forex front, the rupee lost its value; in interbank market
closed Rs. 0.17 weaker at Rs. 104.92/$ while in the open market, it
closed Rs. 0.55 weaker at Rs. 106.65/$ during the month.
Moreover, two T-bill auctions were conducted during this period
whereby in total Rs. 548 billion was accepted against a participation
of Rs. 1,142 billion with major participation and acceptance in 12
months category. A PIB auction was also conducted whereby Rs. 121
billion was accepted against a participation of Rs. 335 billion with
major participation and acceptance in 3 years category.
6 Month KIBOR
Disclaimer
This publication is for informational purpose only and nothing herein should be construed as a solicitation, recommendation or an offer to buy or sell any fund. All investments in
mutual funds are subject to market risk. The NAV based prices of units and any dividends/returns thereon are dependent on force and factors affecting the capital markets. These may go up or down based on market conditions. Past performance is not necessarily indicative of future results.
(This report has been prepared in line with MUFAP’s recommended Format)
28,800
29,600
30,400
31,200
32,000
32,800
33,600
0
100
200
300
1-J
an
7-J
an
13-J
an
19-J
an
25-J
an
29-J
an
Vol (mn) (LHS) Index (RHS)
5.80
6.00
6.20
6.40
6.60
6.80
7.00
7.20
1-J
an
3-J
an
5-J
an
7-J
an
9-J
an
11-J
an
13-J
an
15-J
an
17-J
an
19-J
an
21-J
an
23-J
an
25-J
an
27-J
an
29-J
an

MEEZAN ISLAMIC FUND (MIF)
Fund Review:
Net assets of Meezan Islamic Fund stood at Rs. 26.02 billion as on January 29, 2016. The fund’s NAV decreased by 2.4% during the month of
January as compared to 3.18% decrease in benchmark index (KMI-30) while KSE-100 Index during the same period decreased by 4.62%. As on
January 29, the fund was 98% invested in equities.
Funds Details
Disclaimer This publication is for informational purpose only and nothing herein should be construed as a solicitation, recommendation or an offer to buy or sell any fund. All investments in mutual funds are subject to market
risk. The NAV based prices of units and any dividends/returns thereon are dependent on force and factors affecting the capital markets. These may go up or down based on market conditions. Past performance is not
necessarily indicative of future results. (This report has been prepared in line with MUFAP’s recommended Format)
AMC RATING AM2+ (STABLE OUTLOOK)
1M 3M 6M FYTD 1Yr 3Yr 5Yr PSD* CAGR*
MIF -2% -3% -5% -1% 1% 92% 194% 944% 21%
Benchmark# -3% -6% -8% -6% -0.1% 81% 169% 621% 17%
* Performance start date of August 08, 2003, CAGR since inception # KMI-30 replaced DJIIMPK as the Fund’s benchmark from July 01, 2009, while KSE-100 index remained as the benchmark till June 30, 2006
FY15 FY14 FY13 FY12 FY11 FY10 FY09 FY08
MIF 22% 29% 51% 19% 39% 31% -30% 0%
Benchmark 20% 30% 54% 14% 44% 37% -35% 1%
Packages Ltd. 10% Fauji Cement Co. Ltd. 5%
The Hub Power Co. Ltd. 10% Mari Petroleum Ltd. 4%
Lucky Cement Ltd. 8% Indus Motors Co. Ltd. 4%
Engro Corporation 7% Kohat Cement Ltd. 3%
Pakistan State Oil Co. Ltd. 6% Engro Foods Ltd. 3%
Fund Type: Open End Risk Level High Launch Date 8th Aug 2003 Trustee CDC
Auditors KPMG Taseer Hadi & Co.
Registrar Meezan Bank Ltd. Unit Types A, B and C Management Fee 2% Front End Load 2% Fund Category Equity Back End Load Nil Benchmark KMI-30 Leverage Nil Listing KSE AMC Rating AM2+
Rating Agency JCRVIS Pricing Mechanism Forward Valuation Days Mon-Fri Subscription/ Redemption Days Mon-Fri 9am – 4pm Fund Manager Muhammad Asad
Members of Investment Committee
M. Shoaib, CFA
Muhammad Asad
Sanam Zaib, CFA
Ahmed Hassan, CFA
Asif Imtiaz, CFA Zain Malik Asmar Hamoodi Fahad Sultan, ACA
Investment Objective:
To maximize total investor returns by investing in
Shariah Compliant equities focusing on both capital
gains and dividend income.
Fund Details:
Dec '15 Jan '16 MoM %
Net Assets (Rs mn) 27,610 26,020 -5.8%
NAV Per Unit (Rs) 59.95 58.49 -2.4%
Dec '15 Jan '16
Equity (%) 94.89 98.17
Cash (%) 4.45 1.13
Other receivables (%) 0.66 0.70
Expense Ratio 1.57% 2.50%
P/E 8.6 8.3
adf
MIF KSE-100 Index
KMI-30 Index
Standard Deviation (%) 0.87 0.87 1.07
Sharpe Ratio -3.27 -5.79 -3.34
Fund Net Assets:
Top Ten Equity Holdings:(% of Total Assets):
Annual Returns:
Performance - Cumulative Returns:
Fund’s Performance:
Sector Allocation:
EQ
UITY
qu
ity
Risk Measures – Jan ‘16:
Asset Allocation:
WWF Disclosure: The Board of Directors of the management company in its meeting held on October 25, 2013 have resolved that unrecorded accumulated WWF provision in the fund
from the date of its application till December 31, 2012, in case is required to be paid, shall be borne by Al Meezan Investment Management Limited (Management Company of the fund).
Thus, the Fund is no longer liable to pay any expense under WWF until December 31, 2012.
The Fund has maintained provisions against Workers’ Welfare Fund liability of Rs. 184.61 million till June 30, 2015, if the same was not made the NAV per unit/return of the fund would have
been higher by Rs. 0.41/0.71%. Effective from July 1, 2015 no provision is being made as mutual funds have been excluded from levy of WWF vide Finance Act 2015.
January, 2016
-
200
400
600
800
1,000
1,200
Aug-0
3
Dec-0
4
May-0
6
Oct-
07
Feb-0
9
Jul-
10
Nov-1
1
Apr-
13
Aug-1
4
Jan-1
6
MIF Benchmark
25%13%
8%
9%
10%
35%
Cement
Power Generation & Distribution
Automobile Assembler
Fertilizer
Paper & Board
Others

AL MEEZAN MUTUAL FUND (AMMF)
Fund Review:
The net assets of Al Meezan Mutual Fund (AMMF) as at January 29, 2015 stood at Rs. 4.33 billion. The fund’s NAV decreased by 2.5% during the
month of January as compared to 3.2% increase in benchmark index (KMI-30) while KSE-100 Index during the same period decreased by 4.6%.
As on January 29, the fund was 97% invested in equities.
Funds Details
Disclaimer This publication is for informational purpose only and nothing herein should be construed as a solicitation, recommendation or an offer to buy or sell any fund. All investments in mutual funds are subject to market
risk. The NAV based prices of units and any dividends/returns thereon are dependent on force and factors affecting the capital markets. These may go up or down based on market conditions. Past performance is not
necessarily indicative of future results. (This report has been prepared in line with MUFAP’s recommended Format)
AMC RATING AM2+ (STABLE OUTLOOK)
1M 3M 6M FYTD 1Yr 3Yr 5Yr PSD* CAGR*
AMMF -2% -4% -6% -2% -0.4% 91% 189% 2,278% 17%
Benchmark# -3% -6% -8% -6% -0.1% 81% 169% 1,774% 15%
* Performance start date of July 13, 1995, CAGR since inception # KMI-30 replaced DJIIMPK as the Fund’s benchmark from July 01, 2009, while KSE-100 index remained as the benchmark till June 30, 2006.
FY15 FY14 FY13 FY12 FY11 FY10 FY09 FY08
AMMF 22% 30% 51% 19% 38% 31% -32% 0%
Benchmark 20% 30% 54% 14% 44% 37% -35% 1%
The Hub Power Co. Ltd. 10% Pakistan State Oil Co. Ltd. 5%
Packages Ltd. 9% Engro Foods Ltd. 3%
Engro Corporation 8% Cherat Cement Co. Ltd. 3%
Lucky Cement Ltd. 8% Kohat Cement Ltd. 3%
Fauji Cement Co. Ltd. 6% Maple leaf Cement Co. Ltd. 3%
Fund Type: Open End Risk Level High Launch Date 13th Jul 1995 Trustee CDC
Auditors KPMG Taseer Hadi & Co.
Registrar Meezan Bank Ltd. Unit Types A, B,C and D Management Fee 2% Front End Load 2% Fund Category Equity Back End Load Contingent Load Benchmark KMI-30 Leverage Nil Listing ISE AMC Rating AM2+
Rating Agency JCRVIS Pricing Mechanism Forward Valuation Days Mon-Fri Subscription/ Redemption Days Mon-Fri 9am – 4pm Fund Manager Ahmed Hassan, CFA
Members of Investment Committee
M. Shoaib, CFA
Muhammad Asad
Sanam Zaib, CFA
Ahmed Hassan, CFA
Asif Imtiaz, CFA Zain Malik Asmar Hamoodi Fahad Sultan, ACA
Investment Objective:
The objective of Al Meezan Mutual Fund is to optimize
the total investment returns, both capital gains and
dividend income, through prudent investment
management.
Fund Details:
Dec '15 Jan '16 MoM %
Net Assets (Rs mn) 4,260 4,326 1.5%
NAV Per Unit (Rs) 16.33 15.92 -2.5%
Dec '15 Jan '16
Equity (%) 95.85 97.10
Cash (%) 3.67 1.85
Other receivables (%) 0.48 1.05
Expense Ratio 1.59% 1.85%
P/E 8.6 8.3
*Management fee is included in the expense ratio
Fund Net Assets:
Top Ten Equity Holdings:(% of Total Assets):
Annual Returns:
Performance - Cumulative Returns:
Investment Growth from FY 1996 - to Date
Sector Allocation:
EQ
UITY
qu
ity
Asset Allocation:
AMMF
KSE-100
Index
KMI-30
Index
Standard Deviation (%) 0.89 0.87 1.07
Sharpe Ratio -3.22 -5.79 -3.34
Risk Measures – Jan ‘16:
WWF Disclosure The Board of Directors of the management company in its meeting held on October 25, 2013 have resolved that unrecorded accumulated WWF provision in the fund
from the date of its application till December 31, 2012, in case is required to be paid, shall be borne by Al Meezan Investment Management Limited (Management Company of the fund). Thus,
the Fund is no longer liable to pay any expense under WWF until December 31, 2012.
The Fund has maintained provisions against Workers’ Welfare Fund liability of Rs. 34.83 million till June 30, 2015, if the same was not made the NAV per unit/return of the fund would have
been higher by Rs. 0.13/0.81%. Effective from July 1, 2015 no provision is being made as mutual funds have been excluded from levy of WWF vide Finance Act 2015.
January, 2016
100,000
122,800
1,172,192
487,122
968,549
2,377,912
-
500,000
1,000,000
1,500,000
2,000,000
2,500,000
3,000,000
July
95
June 0
1
June 0
6
June 1
1
Nov 1
1
Apr
12
Sep 1
2
Feb 1
3
Jul 13
Dec 1
3
May 1
4
Oct 14
Mar
15
Aug 1
5
Jan 1
6
Conversion from close end fund to open end fund
26%13%
8%
10%
9%34%
Cement
Power Generation & Distribution
Oil & Gas Marketing Companies
Fertilizer
Paper & Board
Others

MEEZAN ISLAMIC INCOME FUND (MIIF)
Fund Review
Net assets of Meezan Islamic Income Fund (MIIF) stood at Rs. 11.6 billion as on January 29, 2016. MIIF has provided an annualized return of
4.22% for the month of january as compared to its benchmark which has provided an annualized return of 3.34% during the same period.
Funds Details
Disclaimer This publication is for informational purpose only and nothing herein should be construed as a solicitation, recommendation or an offer to buy or sell any fund. All investments in mutual funds are subject to market
risk. The NAV based prices of units and any dividends/returns thereon are dependent on force and factors affecting the capital markets. These may go up or down based on market conditions. Past performance is not
necessarily indicative of future results. (This report has been prepared in line with MUFAP’s recommended Format)
AMC RATING AM2+ (STABLE OUTLOOK)
1M 3M 6M FYTD 1Yr 3Yr 5Yr PSD*
MIIF 4.22% 6.24% 5.47% 6.62% 6.82% 10.67% 12.96% 14.79%
Benchmark 3.34% 3.40% 3.65% 3.71% 4.21% 4.89% 5.34% 5.56%
* Performance start date of Jan 15, 2007
FY15 FY14 FY13 FY12 FY11 FY10 FY09 FY08
MIIF 8.15% 11.90% 14.45% 7.79% 11.77% 7.31% 10.14% 9.28%
Benchmark 5.04% 5.38% 5.54% 6.02% 5.88% 5.80% 6.12% 5.75%
GoP Ijarah Sukuks XVI 17% K-Electric Limited-II 2%
K-Electric Limited-III 10% Maple Leaf Sukuk - I 1%
Engro Fertilizer Limited - I 3%
Hascol Sukuk 3%
Lalpir (Commercial Paper) 2%
Dec ’15 Jan ’16 Sukuks 18% 19%
Government backed / Guaranteed Securities 20% 17%
Placements with Banks and DFIs 18% 16%
Commercial Paper 2% 2%
Cash 41% 45%
Others Including receivables 1% 1%
Fund Type: Open End Risk Level Minimal Launch Date 15-Jan-07 Trustee CDC
Auditors KPMG Taseer Hadi & Co.
Registrar Meezan Bank Ltd. Unit Types A, B and C Management Fee 1.5% Front End Load 0.5% Fund Category Income Leverage Nil Listing KSE AMC Rating AM2+ Rating Agency JCRVIS Fund Stability Rating A- (f) Pricing Mechanism Forward Weighted average time to maturity
1.58 Years
Back End Load Contingent load for Type C investors
Benchmark Average bank deposit rate of three Islamic banks
Valuation Days Mon-Fri Subscription/ Redemption Days Mon-Fri 9am – 4pm Fund Manager Zain Malik
Members of Investment Committee
M. Shoaib, CFA
Muhammad Asad
Sanam Zaib, CFA
Ahmed Hassan, CFA
Asif Imtiaz, CFA Zain Malik Asmar Hamoodi Fahad Sultan, ACA
Investment Objective: To provide investors with a high and stable rate of
current income consistent with long term preservation
of capital in a Shar iah compliant way. A secondary
objective is to take advantage of opportunities to
realize capital appreciation.
Fund Details:
Dec '15 Jan '16 MoM %
Net Assets (Rs mn) 9,936 11,619 10.94%
NAV Per Unit (Rs) 52.64 52.82 0.34%
Top Portfolio Holdings:(% of Total Assets):
Annual Returns:
Performance - Annualized Returns:
Monthly Performance:
Asset Allocation:
Details of Non Performing Investments:
Fund Net Assets:
Credit Quality of Portfolio: IN
CO
ME
WWF Disclosure: The Board of Directors of the management company in its meeting held on October 25, 2013 have
resolved that unrecorded accumulated WWF provision in the fund from the date of its application till December 31, 2012, in
case is required to be paid, shall be borne by Al Meezan Investment Management Limited (Management Company of the
fund). Thus, the Fund is no longer liable to pay any expense under WWF until December 31, 2012.
The Fund has maintained provisions against Workers’ Welfare Fund liability of Rs. 45.46 million till June 30, 2015, if the same
was not made the NAV per unit/return of the fund would have been higher by Rs. 0.21/0.39%. Effective from July 1, 2015 no
provision is being made as mutual funds have been excluded from levy of WWF vide Finance Act 2015.
AAA 19.7%
AA+ 0.1%
AA 13.7%
A+ 56.2%
A 1.0%
A- 2.6%
AA- 6.0%
January, 2016
0%
5%
10%
15%
20%
25%
Jul-
15
Aug-15
Sep-15
Oct-
15
Nov-15
Dec-15
Jan-16
MIIF Benchmark
20%
0.1%
14%
56%
1% 3%6%
0%
30%
60%
AAA
AA+
AA
A+
A A-
AA
-
Credit Quality

MEEZAN CASH FUND (MCF)
Fund Review
Net assets of Meezan Cash Fund (MCF) stood at Rs. 3.6 billion as on January 29, 2016. MCF has provided an annualized return of 4.40% for the
month of January as compared to its benchmark which has provided an annualized return of 4.35% during the same period.
Funds Details
Disclaimer This publication is for informational purpose only and nothing herein should be construed as a solicitation, recommendation or an offer to buy or sell any fund. All investments in mutual funds are subject to market
risk. The NAV based prices of units and any dividends/returns thereon are dependent on force and factors affecting the capital markets. These may go up or down based on market conditions. Past performance is not
necessarily indicative of future results. (This report has been prepared in line with MUFAP’s recommended Format)
AMC RATING AM2+ (STABLE OUTLOOK)
1M 3M 6M FYTD 1Yr 3Yr 5Yr PSD*
MCF 4.40% 4.31% 4.47% 4.59% 5.61% 7.29% 9.79% 11.24%
Benchmark 4.35% 4.38% 4.59% 4.64% 5.22% 6.10% 6.84% 7.04%
* Performance start date of June 15, 2009
FY15 FY14 FY13 FY12 FY11 FY10 FY09 FY08
MCF 7.46% 7.08% 8.78% 10.71% 11.02% 10.09% 8.03%≠ -
Benchmark 6.24% 6.55% 6.91% 8.13% 8.24% 7.50% 7.60% -
≠15 days of operations
Fund Type: Open End Risk Level Minimal Launch Date 15-Jun-09 Trustee CDC
Auditors KPMG Taseer Hadi & Co.
Registrar Meezan Bank Ltd. Unit Types A, B and C Management Fee 1% Front End Load Nil Back End Load* 0.1% if redemption
within 3 days Fund Category Money Market Leverage Nil Listing ISE AMC Rating AM2+ Rating Agency JCRVIS Fund Stability Rating AA (f) Pricing Mechanism Forward Weighted average time to maturity
8.78 Days
Benchmark Average return on 6-month Islamic bank deposits
Valuation Days Mon-Fri Subscription/ Redemption Days Mon-Fri 9am – 4pm Fund Manager Zain Malik
Members of Investment Committee
M. Shoaib, CFA
Muhammad Asad
Sanam Zaib, CFA
Ahmed Hassan, CFA
Asif Imtiaz, CFA Zain Malik Asmar Hamoodi Fahad Sultan, ACA
Investment Objective: To seek maximum possible preservation of capital and
a reasonable rate of return via investing primarily in
liquid Shariah compliant money market and debt
securities.
Fund Details:
Dec '15 Jan'16 MoM %
Net Assets (Rs mn) 3,292 3,574 8.57%
NAV Per Unit (Rs) 51.26 51.44 0.35%
AAA 57%
AA+ 23%
AA 15%
A+ 2.7%
Rating Exposure:
Portfolio: Salient Features
Annual Returns:
Performance – Annualized Returns:
Monthly Performance:
Asset Allocation:
Fund Net Assets:
Key Benefits
Maximum Preservation of Principal Investment
High Liquidity (Redemption within two working days)
*No Sales Load (No Entry or Exit charges)
Tax Credit as per tax laws
Investment Policy and Strategy
Investments in High Grade & Liquid avenues:
Instrument/Issuer Rating : Minimum ‘AA’
Maximum Maturity of Instruments : Six Months
Average Time to Maturity of Portfolio : Three Months
Benchmark Average return on 6-month Islamic bank deposits
Portfolio Composition:
Dec ’15 Jan ’16
Placements with Banks and DFIs 13% 12%
Cash 76% 79%
Commercial Paper 7% 7%
Government Guaranteed 0.1% 0%
Other Including receivables 3% 2%
M
ON
EY
MA
RK
ET
WWF Disclosure: The Board of Directors of the management company in its meeting held on October 25, 2013 have
resolved that unrecorded accumulated WWF provision in the fund from the date of its application till December 31, 2012, in
case is required to be paid, shall be borne by Al Meezan Investment Management Limited (Management Company of the fund).
Thus, the Fund is no longer liable to pay any expense under WWF until December 31, 2012.
The Fund has maintained provisions against Workers’ Welfare Fund liability of Rs. 58.58 million till June 30, 2015, if the same
was not made the NAV per unit/return of the fund would have been higher by Rs. 0.84/1.64%. Effective from July 1, 2015 no
provision is being made as mutual funds have been excluded from levy of WWF vide Finance Act 2015.
January, 2016
0%
2%
4%
6%
Jul-
15
Aug-15
Sep-15
Oct-
15
Nov-15
Dec-15
Jan-16
MCF Benchmark
12%
79%
7%2%
Placements with Banks and DFIs
Cash
Commercial Paper
Other Including receivables

MEEZAN SOVEREIGN FUND (MSF)
Fund Review
Net assets of Meezan Sovereign Fund (MSF) stood at Rs. 9.34 billion as on January 29, 2016. For the month of January, the fund has provided
an annualized return of 1.97% as compared to its benchmark which has provided an annualized return of 4.35% during the same period.
Funds Details
Disclaimer This publication is for informational purpose only and nothing herein should be construed as a solicitation, recommendation or an offer to buy or sell any fund. All investments in mutual funds are subject to market
risk. The NAV based prices of units and any dividends/returns thereon are dependent on force and factors affecting the capital markets. These may go up or down based on market conditions. Past performance is not
necessarily indicative of future results. (This report has been prepared in line with MUFAP’s recommended Format)
AMC RATING AM2+ (STABLE OUTLOOK)
1M 3M 6M FYTD 1Yr 3Yr 5Yr PSD*
MSF 1.97% 6.72% 5.20% 5.41% 6.24% 7.80% 10.41% 11.31%
Benchmark 4.35% 4.38% 4.59% 4.64% 5.22% 6.10% 6.84% 6.99%
* Performance start date of Feb 10, 2010,
FY15 FY14 FY13 FY12 FY11 FY10 FY09 FY08
MSF 6.81% 8.50% 9.11% 11.19% 11.45% 9.76%* - -
Benchmark 6.24% 6.55% 6.91% 8.13% 8.24% 7.50% - -
* 140 days of operations
Fund Type: Open End Risk Level Minimal Launch Date 10-Feb-10 Trustee CDC
Auditors KPMG Taseer Hadi & Co.
Registrar Meezan Bank Ltd. Unit Types A, B, C and D Management Fee 1% Front End Load 0.5% Back End Load Nil Fund Category Income Leverage Nil Listing ISE AMC Rating AM2+ Rating Agency JCRVIS Fund Stability Rating AA (f) Pricing Mechanism Forward Weighted average time to maturity
2.34 years
Benchmark Average return on 6-month Islamic bank deposits
Valuation Days Mon-Fri Subscription/ Redemption Days Mon-Fri 9am – 4pm Fund Manager Zain Malik
Members of Investment Committee
M. Shoaib, CFA
Muhammad Asad
Sanam Zaib, CFA
Ahmed Hassan, CFA
Asif Imtiaz, CFA Zain Malik Asmar Hamoodi Fahad Sultan, ACA
Investment Objective: To seek maximum possible preservation of capital and
a reasonable rate of return
Fund Details:
Dec '15 Jan '16 MoM %
Net Assets (Rs mn) 10,517 9,339 -11.20%
NAV Per Unit (Rs) 51.98 52.06 0.16%
AAA 88.3% AA+ 0.3% AA 2.8% A+ 7.5%
Dec ’15 Jan ’16
Government Guaranteed 83% 88%
Cash 16% 11%
Other Including receivables 1% 1%
Asset Rating:
Portfolio: Salient Features
Annual Returns:
Performance - Annualized Returns:
Monthly Performance:
Asset Allocation:
Fund Net Assets:
Key Benefits
Maximum Preservation of Principal Investment
Primary Investments in securities issued by Government of Pakistan
Very Low Risk
Liquidity (Redemption on average in 2-3 working days)
Tax Credit as per tax laws
Investment Policy and Strategy
Investments in High Grade & Liquid avenues:
Minimum 70% Investment in Government backed / issued securities (rated ‘AAA’)
Placements in top rated banks and financial institutions
Weighted Average Time to Maturity of Portfolio : Not more than 4 years
Benchmark Average return on 6-month Islamic bank deposits
Asset Allocation:
IN
CO
ME
WWF Disclosure: The Board of Directors of the management company in
its meeting held on October 25, 2013 have resolved that unrecorded accumulated
WWF provision in the fund from the date of its application till December 31, 2012,
in case is required to be paid, shall be borne by Al Meezan Investment Management
Limited (Management Company of the fund). Thus, the Fund is no longer liable to
pay any expense under WWF until December 31, 2012.
The Fund has maintained provisions against Workers’ Welfare Fund liability of Rs.
133.89 million till June 30, 2015, if the same was not made the NAV per unit/return
of the fund would have been higher by Rs. 0.75/1.43%. Effective from July 1, 2015
no provision is being made as mutual funds have been excluded from levy of WWF
vide Finance Act 2015.
January, 2016
0%
2%
4%
6%
8%
10%
12%
14%
16%
Jul-
15
Aug-15
Sep-15
Oct-
15
Nov-15
Dec-15
Jan-16
MSF Benchmark
88%
11%1%
Government Guaranteed
Cash
Other Including receivables

MEEZAN TAHAFFUZ PENSION FUND (MTPF)
Fund Review:
As at January 29, 2016, total size of net assets of Meezan Tahaffuz Pension Fund (MTPF) stood at Rs. 5,093 million. For the month of January,
the NAV of equity sub fund decreased by 2.83% while the NAV of debt and money Market sub funds provided an annualized return of 1.61% and
1.58% respectively.
Funds Details
Disclaimer This publication is for informational purpose only and nothing herein should be construed as a solicitation, recommendation or an offer to buy or sell any fund. All investments in mutual funds are subject to market
risk. The NAV based prices of units and any dividends/returns thereon are dependent on force and factors affecting the capital markets. These may go up or down based on market conditions. Past performance is not
necessarily indicative of future results. (This report has been prepared in line with MUFAP’s recommended Format)
AMC RATING AM2+ (STABLE OUTLOOK)
1M 3M 6M YTD 1Yr 3Yr 5Yr PSD* CAGR*
High Volatility -2% -2% -1% 2% 4% 95% 186% 281% 17%
Med. Volatility -1% -1% 0.1% 2% 4% 67% 134% 213% 14%
Low Volatility -1% 0.1% 1% 2% 5% 44% 90% 157% 12%
Lower Volatility 0.1% 1% 2% 2% 5% 20% 46% 100% 8%
* Performance start date of June 28, 2007. CAGR since inception
Allocation Scheme Equity Debt Money Market
High Volatility 80% 20% 0%
Medium Volatility 50% 40% 10%
Low Volatility 25% 60% 15%
Lower Volatility 0% 50% 50%
FY15 FY14 FY13 FY12 FY11 FY10 FY09 FY08
MTPF- Equity 26.6% 32.4% 54.9% 16.8% 36.0% 31.5% -25.8% 3.1%
MTPF- Debt 6.4% 7.7% 8.3% 9.5% 10.9% 8.5% 10.2% 8.3%
MTPF- MMkt 6.9% 6.9% 7.8% 10.9% 10.7% 8.5% 11.1% 7.7%
Fund Type: Open End Risk Level Minimal Launch Date 28-Jun-07 Trustee CDC Auditors KPMG Taseer Hadi
& Co. Registrar Meezan Bank Ltd. Fund Category Pension Management Fee 1.5% Front End Load 3% Leverage Nil AMC Rating AM2+
Rating Agency JCRVIS Pricing Mechanism Forward Valuation Days Mon-Fri Subscription/ Redemption Days Mon-Fri 9am – 4pm Fund Manager Asmar Hamoodi
Members of Investment Committee
M. Shoaib, CFA
Muhammad Asad
Sanam Zaib, CFA
Ahmed Hassan, CFA
Asif Imtiaz, CFA Zain Malik Asmar Hamoodi Fahad Sultan, ACA
Rs (Mn) Dec'15 Jan '16 MoM %
MTPF- Equity 3,179 3,144 -1.1%
MTPF- Debt 1,549 1,579 2.0%
MTPF- MMkt 363 370 2.0%
Total Fund 5,091 5,093 0.04%
Rs Dec '15 Jan '16 MoM %
MTPF- Equity 438.7 426.3 -2.83%
MTPF- Debt 200.2 200.4 0.13%
MTPF- MMkt 199.8 200.0 0.13%
Investment Objective: To provide participants a regular Halal income stream
after retirement/disability when they can no longer
earn regular income to support their living so that they
are not dependent on other members of the society.
Fund Details:
NAV per unit:
Annual Returns:
(MTPF – Equity): Sector Allocation & Top Holdings (Jan’16)
MTPF Debt Sub Fund:
Sukuk Holdings – MTPF (MMKT Fund)
GoP Ijarah Sukuks XVI 28.01%
GoP Ijarah Sukuks XIV 2.14%
MTPF Money Market Sub Fund: P
EN
SIO
N
Fund Net Assets:
MTPF - Allocation Schemes
WWF Disclosure: The Board of Directors of the management company in its meeting held on October 25, 2013 have resolved that unrecorded accumulated WWF provision in the fund from the
date of its application till December 31, 2012, in case is required to be paid, shall be borne by Al Meezan Investment Management Limited (Management Company of the fund). Thus, the Fund is no
longer liable to pay any expense under WWF until December 31, 2012.
Effective from January 1, 2013, the Fund has maintained provisions against Workers’ Welfare Fund liability to the tune of Rs. 25.05mn (Equity), Rs. 4.63mn (Debt) and Rs. 1.24mn (MMKT), if the
same were not made the NAV per unit/return of the fund would be higher by Rs. 3.40/0.80% (Eq.), Rs. 0.59/0.29% (Dt.) and Rs. 0.67/0.33 (MM.). For further details, investors are advised to read
financial statements of the fund.
Packages Ltd. 7.74%
Fauji Cement Co. Ltd. 6.72%
Engro Corporation 6.43%
The Hub Power Co. Ltd. 6.03%
Lucky Cement Ltd. 5.40%
Pakistan State Oil Co. Ltd. 5.08%
Cherat Cement Co. Ltd 3.91%
Ferozesons Labs 3.88%
Al-Shaheer Corp 3.45%
Mari Petroleum Ltd. 3.10%
Cement 24%
Pharmaceutical 10%
Power Generation & Distribution 10%
Paper & Board 9%
Fertilizer 8%
Other Sectors 36%
Cash & Others including receivable 3%
January, 2016
30.1%
69.9%
GoP Guaranteed Securities
Cash & Other Including receivables
43.8%
3.3%
16.9%36.0%
GoP Guaranteed Securities
Sukuk
Placement
Cash & Other Including receivables

KSE-MEEZAN INDEX FUND (KMIF)
AMC RATING AM2+ (STABLE OUTLOOK)
Fund Review:
As at January 29, 2016, the net assets of KSE-Meezan Index Fund (KMIF) stood at Rs. 750 million. For the month of January, KMIF provided a
return of -3.22%.
Disclaimer This publication is for informational purpose only and nothing herein should be construed as a solicitation, recommendation or an offer to buy or sell any fund. All investments in mutual funds are subject to market
risk. The NAV based prices of units and any dividends/returns thereon are dependent on force and factors affecting the capital markets. These may go up or down based on market conditions. Past performance is not necessarily indicative of future results. (This report has been prepared in line with MUFAP’s recommended Format)
1M 3M 6M FYTD 1Yr 3Yr 5Yr PSD* CAGR
KMIF -3.2% -6.7% -9.1% -7.1% -2.2% 67.1% - 101.0% 20.8%
Benchmark -3.2% -6.1% -8.1% -6.0% -0.1% 81.3% - 122.2% 24.2%
* Performance start date of May 23, 2012.
FY15 FY14 FY13 FY12 FY11 FY10 FY09 FY08
KMIF 17.1% 26.5% 49.6% -2.4%* - - - -
Benchmark 20.1% 29.9% 54.4% -1.9% - - - -
* 38 days of operations.
The Hub Power Co. Ltd. 12% DG Khan Cement Co. Ltd. 5%
Fauji Fertilizer Co. Ltd. 10% Dawood Hercules 5%
Engro Corporation 9% Fauji Cement Co.Ltd. 4%
Lucky Cement Ltd. 8% Engro Fertilizer 3%
Pakistan Petroleum Ltd. 7% Pakistan Oilfields Ltd. 3%
Fund Type: Open End Risk Level High Launch Date 23-May-12 Trustee CDC
Auditors KPMG Taseer Hadi & Co.
Registrar Meezan Bank Ltd. Unit Types A and B Management Fee 1% Front End Load 2% Fund Category Index Tracker Scheme Back End Load Nil Leverage Nil Listing ISE AMC Rating AM2+
Rating Agency JCRVIS Pricing Mechanism Forward Benchmark KMI-30 Index Valuation Days Mon-Fri Subscription/ Redemption Days Mon-Fri 9am – 1pm Fund Manager Asmar Hamoodi
Members of Investment Committee
M. Shoaib, CFA
Muhammad Asad
Sanam Zaib, CFA
Ahmed Hassan, CFA
Asif Imtiaz, CFA Zain Malik Asmar Hamoodi Fahad Sultan, ACA
Investment Objective: KSE Meezan Index Fund (KMIF) is a Shariah Compliant
Index Fund that aims to provide investors an
opportunity to track closely the performance of the
KSE-Meezan Index 30 (KMI 30) by investing in
companies of the Index in proportion to their
weightages.
Performance - Cumulative Returns:
Annual Returns:
Fund Net Assets:
Sector Allocation:
Fund Details:
WWF Disclosure: The Board of Directors of the management company in its meeting held on October 25, 2013 have resolved that unrecorded accumulated WWF provision in the fund from the
date of its application till December 31, 2012, in case is required to be paid, shall be borne by Al Meezan Investment Management Limited (Management Company of the fund). Thus, the Fund is no longer
liable to pay any expense under WWF until December 31, 2012.
The Fund has maintained provisions against Workers’ Welfare Fund liability of Rs. 12.90 million till June 30, 2015, if the same was not made the NAV per unit/return of the fund would have been higher by
Rs.1.15/1.72%. Effective from July 1, 2015 no provision is being made as mutual funds have been excluded from levy of WWF vide Finance Act 2015.
Dec '15 Jan '16 MoM %
Net Assets (Rs mn) 880 750 -14.83%
NAV Per Unit (Rs) 68.81 66.60 -3.22%
Dec '15 Jan '16
Equity (%) 92.8 97.2
Cash (%) 6.7 2.4
Other Including receivables (%) 0.5 0.4
IN
DEX
TR
AC
KER
Fund’s Performance:
Top Ten Equity Holdings:(% of Total Assets):
Assets Allocation:
January, 2016
90
110
130
150
170
190
210
230
250
270Jun-12
Sep-12
Nov-12
Jan-13
Apr-
13
Jun-13
Aug-13
Nov-13
Jan-14
Apr-
14
Jun-14
Aug-14
Nov-14
Jan-15
Mar-
15
Jun-15
Aug-15
Nov-15
Jan-16
KMIF Benchmark
22% 14%
12%
32%4%
16%
Cement
Power Generation & Distribution
Oil & Gas Exploration Companies
Fertilizer
Pharmaceuticals
Others
MEEZAN FINANCIAL PLANNING FUND OF FUNDS (MFPFOF)
Fund Review:
As at January 29, 2016, total size of net assets of Meezan Financial Planning Fund of Fund (MFPFOF) stood at Rs. 7,493 million. For the month of
January, the NAV of Aggressive plan decreased by 1.7% while the NAV of moderate, Conservative plan, Preservation plan I, Preservation plan II,
MAAP-I, MAAP-II and MAP-III provided a return of -1.2%, -0.5%, -1.1%, -0.5%, -2.0%, -0.8% and 0.01% respectively.
Funds Details
Disclaimer This publication is for informational purpose only and nothing herein should be construed as a solicitation, recommendation or an offer to buy or sell any fund. All investments in mutual funds are subject to market
risk. The NAV based prices of units and any dividends/returns thereon are dependent on force and factors affecting the capital markets. These may go up or down based on market conditions. Past performance is not
necessarily indicative of future results. (This report has been prepared in line with MUFAP’s recommended Format)
AMC RATING AM2+ (STABLE OUTLOOK)
1M 3M 6M FYTD 1Yr 3Yr 5Yr PSD*
Aggressive -1.7% -1.6% -2.6% 0.1% 2.6% - - 55.2%
Benchmark -1.9% -3.6% -4.4% -3.0% 1.7% - - 47.0%
Moderate -1.2% -1.0% -1.2% 1.6% 4.4% - - 44.3%
Benchmark -1.4% -2.5% -2.9% -1.6% 2.5% - - 40.1%
Conservative -0.5% 0.3% 0.7% 2.9% 5.8% - - 32.3%
Benchmark -0.3% -0.4% 0.2% 1.0% 4.2% - - 26.2%
MCPP – I** -1.1% -0.8% -2.2% 1.1% -1.7% - - 9.0%
Benchmark -1.3% -2.5% -4.0% -2.2% -1.4% - - 6.1%
MCPP – II*** -0.5% 0.2% -1.2% 1.0% -0.03% - - 1.4%
Benchmark -0.6% -0.7% -1.8% -0.4% 1.1% - - 1.6%
MAAP – I**** -2.0% -2.3% -3.0% -2.9% - - - -2.9%
Benchmark -2.6% -3.4% -4.2% -3.8% - - - -3.8%
MAAP – II***** -0.8% - - -0.1% - - - -0.1%
Benchmark -0.9% - - -0.8% - - - -0.8%
MAAP – III# 0.01% - - 0.01% - - - 0.01%
Benchmark 0.1% - - 0.1% - - - 0.1%
* Performance start date of April 12, 2013. ** Performance start date of September 01, 2014. *** Performance start date of
December 16, 2014. **** Performance start date of July 10, 2015, ***** Performance start date of November 24, 2015.
# Performance start date of January 26, 2016.
FY15 FY14 FY13 FY12 FY11 FY10 FY09 FY08
Aggressive 16.5% 22.1% 9.0%* - - - - -
Benchmark 15.1% 21.7% 7.9% - - - - -
Moderate 13.6% 17.3% 6.5%* - - - - -
Benchmark 12.9% 18.2% 6.2% - - - - -
Conservative 10.1% 12.6% 3.8%* - - - - -
Benchmark 8.6% 11.2% 3.6% - - - - -
MCPP - I 7.8%** - - - - - - -
Benchmark 8.5% - - - - - - -
MCPP – II 0.4%*** - - - - - - -
Benchmark 2.0% - - - - - - -
MAAP - I - - - - - - - -
Benchmark - - - - - - - -
MAAP - II - - - - - - - -
Benchmark - - - - - - - -
MAAP – III - - - - - - - -
Benchmark - - - - - - - -
* 80 days of operations, **303 days of operations, 196 days of operations, 55 days of operations
Rs Dec '15 Jan '16 MoM%
Aggressive 71.34 70.14 -1.68%
Moderate 66.13 65.35 -1.19%
Conservative 63.35 63.03 -0.51%
MCPP - I 55.06 54.47 -1.07%
MCPP - II 50.94 50.67 -0.54%
MAAP - I 49.53 48.54 -1.99%
MAAP - II 50.34 49.93 -0.82%
MAAP - III 50.00
Fund Type: Open End Risk Level Plan specific Launch Date 11-April-13 Trustee CDC
Auditors KPMG Taseer Hadi & Co.
Registrar Meezan Bank Ltd. Unit Types A and B Management Fee Same as underlying
Funds and 1% on Cash
Front End Load Aggressive Plan 2.0%
Moderate Plan 1.5%
Conservative Plan 1.0%
Other Plans 0% to 3% Fund Category Fund of Funds Back End Load Nil Leverage Nil AMC Rating AM2+
Rating Agency JCRVIS
Pricing Mechanism Forward
Fund Manager Ahmed Hassan, CFA
Benchmark
Aggressive Allocation Plan 65% KMI-30 & 35% 6M
dep. rate*
Moderate Allocation Plan 50% KMI-30 & 50% 6M
dep. rate*
Conservative Allocation Plan 20% KMI-30 & 80% 6M
dep. rate*
MCPP – Plan I Combination of KMI-30 Index and Average return on 6-month Islamic bank deposits
MCPP – Plan II
MAAP
Valuation Days Mon-Fri Subscription/ Redemption Days
Mon-Fri 9am – 4pm
Members of Investment Committee
M. Shoaib, CFA
Muhammad Asad
Sanam Zaib, CFA
Ahmed Hassan, CFA
Asif Imtiaz, CFA Zain Malik Asmar Hamoodi Fahad Sultan, ACA
* Average return on 6-month Islamic bank deposits
Investment Objective: To generate returns on Investment as per respective
allocation plans by investing in Shariah Compliant
Fixed Income and Equity Mutual Funds in line with the
risk tolerance of the Investor.
Fund Details:
NAV per unit:
Annual Returns:
Fund Net Assets:
MFPFOF - Allocation Plan:
FU
ND
OF F
UN
DS
January, 2016
Rs (Mn) Dec '15 Jan '16 MoM %
Aggressive 392 386 -1.6%
Moderate 310 296 -4.4%
Conservative 237 235 -1.1%
MCPP - I 1,549 1,521 -1.8%
MCPP - II 3,087 3,058 -0.9%
MAAP - I 1,201 1,171 -2.5%
MAAP - II 686 819 19.4%
MAAP - III 7
Funds Multiplier:
MCPP-I MCPP-II
High Multiplier 4.00 3.99
Low Multiplier 3.80 3.81
(to be contd..)

MEEZAN FINANCIAL PLANNING FUND OF FUNDS (MFPFOF)
Fund Review:
As at January 29, 2016, total size of net assets of Meezan Financial Planning Fund of Fund (MFPFOF) stood at Rs. 7,493 million. For the month of
January, the NAV of Aggressive plan decreased by 1.7% while the NAV of moderate, Conservative plan, Preservation plan I, Preservation plan II,
MAAP-I, MAAP-II and MAP-III provided a return of -1.2%, -0.5%, -1.1%, -0.5%, -2.0%, -0.8% and 0.01% respectively.
Funds Details
Disclaimer This publication is for informational purpose only and nothing herein should be construed as a solicitation, recommendation or an offer to buy or sell any fund. All investments in mutual funds are subject to market
risk. The NAV based prices of units and any dividends/returns thereon are dependent on force and factors affecting the capital markets. These may go up or down based on market conditions. Past performance is not
necessarily indicative of future results. (This report has been prepared in line with MUFAP’s recommended Format)
AMC RATING AM2+ (STABLE OUTLOOK)
Equity/ Index
Funds (%)
Income/Money
market Funds (%)
Cash
(%)
Other Including
receivables (%)
Aggressive 69.1% 30.4% 0.5% 0.0%
Moderate 48.9% 50.2% 0.9% 0.0%
Conservative 24.3% 74.8% 0.7% 0.2%
MCPP-I 39.6% 59.8% 0.6% 0.0%
MCPP-II 22.8% 77.0% 0.2% 0.0%
MAAP-I 89.5% 10.2% 0.3% 0.0%
MAAP-II 96.0% 0.0% 4.0% 0.0%
MAAP-III 0.0% 0.0% 100.0% 0.0%
Fund Type: Open End Risk Level Plan specific Launch Date 11-April-13 Trustee CDC
Auditors KPMG Taseer Hadi & Co.
Registrar Meezan Bank Ltd. Unit Types A and B Management Fee Same as underlying
Funds and 1% on Cash
Front End Load Aggressive Plan 2.0%
Moderate Plan 1.5%
Conservative Plan 1.0%
Other Plans 0% to 3% Fund Category Fund of Funds Back End Load Nil Leverage Nil AMC Rating AM2+
Rating Agency JCRVIS
Pricing Mechanism Forward
Fund Manager Ahmed Hassan, CFA
Benchmark
Aggressive Allocation Plan 65% KMI-30 & 35% 6M
dep. rate*
Moderate Allocation Plan 50% KMI-30 & 50% 6M
dep. rate*
Conservative Allocation Plan 20% KMI-30 & 80% 6M
dep. rate*
MCPP – Plan I Combination of KMI-30 Index and Average return on 6-month Islamic bank deposits
MCPP – Plan II
MAAP
Valuation Days Mon-Fri Subscription/ Redemption Days
Mon-Fri 9am – 4pm
Members of Investment Committee
M. Shoaib, CFA
Muhammad Asad
Sanam Zaib, CFA
Ahmed Hassan, CFA
Asif Imtiaz, CFA Zain Malik Asmar Hamoodi Fahad Sultan, ACA
* Average return on 6-month Islamic bank deposits
Investment Objective: To generate returns on Investment as per respective
allocation plans by investing in Shariah Compliant
Fixed Income and Equity Mutual Funds in line with the
risk tolerance of the Investor.
Fund Details:
Asset Allocation:
FU
ND
OF F
UN
DS
WWF Disclosure: The Board of Directors of the management company in its meeting held on October
25, 2013 have resolved that unrecorded accumulated WWF provision in the fund from the date of its
application till December 31, 2012, in case is required to be paid, shall be borne by Al Meezan Investment Management Limited (Management Company of the fund). Thus, the Fund is no longer liable to pay any expense under WWF until December 31, 2012.
The Scheme has maintained provisions against Workers’ Welfare Fund’s liability to the tune of Rs.2.69mn (Aggressive), Rs.1.74mn (moderate), Rs.1.45mn (Conservative), Rs.2.35mn (Preservation Plan I), 0.28mn (Preservation Plan II). If the same were not made the NAV per unit/return of the Scheme would be higher by
Rs. 0.49/0.70% (Aggressive), Rs. 0.36/0.59% (Moderate), Rs. 0.39/0.62% (Conservative), Rs. 0.08/0.15% (Preservation Plan I) and Rs. 005/0.01% (Preservation Plan II). For details, investors are advised to read
Financial Statements of the Scheme. Effective from July 1, 2015 no provision is being made as mutual funds have been excluded from levy of WWF vide Finance Act 2015.
January, 2016
Portfolio: Salient Features (MAAP-III)
Benefits
Strategy reflective of investor’s risk appetite as market conditions change
Up to 100% equity Participation possible, based on fund managers outlook on the market
Actively managed by experienced Fund Managers
Tax Rebate as per Section 62 of ITO
Investment Policy
Based on the Fund Manager’s outlook on asset classes, the allocation plan will actively allocate its portfolio between the Equity asset Schemes and Fixed Income/Money Market Schemes based on the macroeconomic view and outlook of such asset classes.
For exposure to equities, this Plan shall primarily be invested in Islamic Equity and Islamic Index Funds managed by Al Meezan and also other Asset Management Companies. Whereas for taking exposure to Fixed Income/Money Market, the Plan shall invest in Islamic Money Market and Islamic Fixed Income Scheme(s) managed by Al Meezan or any other Asset Management Company as well as in Cash at Bank Accounts of Islamic Banks and licensed Islamic Banking windows of conventional Banks.
Trading Strategy
The allocation plan will actively allocate its portfolio between the Equity Schemes and Fixed Income/Money Market Schemes based on the Fund Manager’s view on macroeconomic outlook of such asset classes.

asdf
January, 2016
MEEZAN GOLD FUND (MGF)
Fund Review:
Net assets of Meezan Gold Fund (MGF) as at January 29, 2016 stood at Rs. 123 million. The fund’s NAV increased by 2.14% during the month.
Funds Details
Disclaimer This publication is for informational purpose only and nothing herein should be construed as a solicitation, recommendation or an offer to buy or sell any fund. All investments in mutual funds are subject to market
risk. The NAV based prices of units and any dividends/returns thereon are dependent on force and factors affecting the capital markets. These may go up or down based on market conditions. Past performance is not necessarily indicative of future results. (This report has been prepared in line with MUFAP’s recommended Format)
AMC RATING AM2+ (STABLE OUTLOOK)
1M 3M 6M FYTD 1Yr 3Yr 5Yr PSD*
MGF 2.1% -3.3% - -3.2% - - - -3.2%
Benchmark 3.8% -0.7% - 3.4% - - - 3.4%
* Performance start date of Aug 13, 2015,
FY15 FY14 FY13 FY12 FY11 FY10 FY09 FY08
MGF - - - - - - - -
Benchmark - - - - - - - -
Dec '15 Jan '16
Gold (%) 54.3 79.2
Cash (%) 45.7 20.7
Other Including receivables (%) 0.0 0.1
Fund Type: Open End Risk Level High Launch Date 13-Aug-15 Trustee CDC
Auditors KPMG Taseer Hadi & Co.
Registrar Meezan Bank Ltd. Unit Types C Management Fee 1.5% Front End Load 2% Fund Category Commodity Fund Back End Load Nil Benchmark Combination of 70%
PKR base closing price of physical gold and 30% Average return on 6-month Islamic bank deposits
Leverage Nil Listing ISE AMC Rating AM2+
Rating Agency JCRVIS Pricing Mechanism Forward Valuation Days Mon-Fri Subscription/ Redemption Days Mon-Fri 9am – 4pm Fund Manager Ali Khan, CFA
Members of Investment Committee
M. Shoaib, CFA
Muhammad Asad
Sanam Zaib, CFA
Ahmed Hassan, CFA
Asif Imtiaz, CFA Zain Malik Asmar Hamoodi Fahad Sultan, ACA
Investment Objective: “Meezan Gold Fund (MGF)” aims to provide maximum
exposure to prices of Gold in a Shariah Compliant
(Islamic) manner, by investing a significant portion of
the Fund’s net assets in deliverable gold based
contracts available on Pakistan Mercantile Exchange
(PMEX).”
Fund Details:
Dec ’15 Jan'16 MoM %
Net Assets (Rs mn) 119 123 3.68%
NAV Per Unit (Rs) 47.38 48.40 2.14%
Annual Returns:
Performance - Cumulative Returns (net of expenses):
Fund Net Assets:
January, 2016
GO
LD F
UN
D
Portfolio: Salient Features
Key Advantages
Fully Shariah Compliant means of investing in gold
Efficient Store of value, thereby providing investors the opportunity to invest in a high priced (valuable) commodity through unit certificates (mutual funds)
Tracks price performance of gold
Maximum exposure to gold prices
Good hedge against Inflation
Investment Strategy
MGF, in line with its Investment Objectives, will invest in Authorized Investments as approved by the Shariah Advisor
To meet Fund’s investment objective, at least seventy percent (70%) of Fund’s net assets, will remain invested in deliverable gold based contracts available at a Commodity Exchange, during the year based on quarterly average investment calculated on daily basis.
Remaining net assets of the Fund shall be invested in cash and near cash instruments which include cash in bank accounts of Islamic banks and licensed Islamic banking windows of conventional banks (excluding TDR). However, at least 10% of the net assets of the Fund shall remain invested in cash and near cash instruments at all times.
Weighted Average Time to Maturity of Portfolio : Not more than 4 years
Investment Horizon Long term (Investors are advised to take a long term view of a minimum of 3 to 5 years)
Assets Allocation:

MEEZAN CAPITAL PRESERVATION FUND-II
Fund Review:
For the month of January 2016, KSE-Meezan Index (KMI-30) decreased by 3.18% with which the fund also decreased its exposure to equities.
The NAV as a result decreased from Rs. 56.08 to Rs. 55.54 translating into a loss of 0.96% for the month.
Funds Details
Disclaimer This publication is for informational purpose only and nothing herein should be construed as a solicitation, recommendation or an offer to buy or sell any fund. All investments in mutual funds are subject to market
risk. The NAV based prices of units and any dividends/returns thereon are dependent on force and factors affecting the capital markets. These may go up or down based on market conditions. Past performance is not necessarily indicative of future results. (This report has been prepared in line with MUFAP’s recommended Format)
AMC RATING AM2+ (STABLE OUTLOOK)
1M 3M 6M FYTD 1Yr 3Yr 5Yr PSD*
MCPRF-II -1.0% -0.9% -2.0% 0.7% -1.1% - - 11.1%
Benchmark -1.2% -2.1% -3.4% -1.7% -1.9% - - 6.6%
* Performance start date of Jun 28, 2014,
FY15 FY14 FY13 FY12 FY11 FY10 FY09 FY08
MCPRF-II 10.3% - - - - - - -
Benchmark 8.5% - - - - - - -
Nov ’15 Dec ’15 Jan ’16
Equity/ Index Funds (%) 39.7 44.7 38.0
Income/Money market Funds (%) 60.2 55.2 61.8
Cash (%) 0.0 0.0 0.2
Other Including receivables (%) 0.1 0.1 0.0
Fund Type: Open End Risk Level Low to Moderate Launch Date 28-Jun-14 Trustee CDC
Auditors KPMG Taseer Hadi & Co.
Registrar Meezan Bank Ltd. Unit Types A and B Management Fee 1% Front End Load 3% Fund Category Fund of Funds Back End Load Contingent Load Benchmark Combination of
KMI-30 Index and Average return on 6-month Islamic bank deposits
Leverage Nil Listing ISE AMC Rating AM2+
Rating Agency JCRVIS Pricing Mechanism Forward Valuation Days Mon-Fri Subscription/ Redemption Days Mon-Fri 9am – 4pm Fund Manager Asif Imtiaz, CFA
Members of Investment Committee
M. Shoaib, CFA
Muhammad Asad
Sanam Zaib, CFA
Ahmed Hassan, CFA
Asif Imtiaz, CFA Zain Malik Asmar Hamoodi Fahad Sultan, ACA
Investment Objective:
Objective of this fund is to earn a potentially high
return through dynamic asset allocation between
Shariah Compliant Equities and Shariah Compliant
Income/Money Market based Collective Investment
Schemes.
Fund Details:
Dec ’15 Jan '16 MoM %
Net Assets (Rs mn) 2,229 2,207 -1.00%
NAV Per Unit (Rs) 56.08 55.54 -0.96%
Annual Returns:
Performance - Cumulative Returns (net of expenses):
Fund Net Assets: Asset Allocation:
Fund’s Performance:
WWF Disclosure: The Board of Directors of the management company in its meeting held on October
25, 2013 have resolved that unrecorded accumulated WWF provision in the fund from the date of its
application till December 31, 2012, in case is required to be paid, shall be borne by Al Meezan Investment
Management Limited (Management Company of the fund). Thus, the Fund is no longer liable to pay any
expense under WWF until December 31, 2012.
The Fund has maintained provisions against Workers’ Welfare Fund liability of Rs. 4.28 million till June 30,
2015, if the same was not made the NAV per unit/return of the fund would have been higher by Rs.
0.11/0.19%. Effective from July 1, 2015 no provision is being made as mutual funds have been excluded from
levy of WWF vide Finance Act 2015.
January, 2016
FU
ND
OF F
UN
DS
Funds Multiplier:
MCPRF-II
High Multiplier 4.00
Low Multiplier 3.81
47.00
49.00
51.00
53.00
55.00
57.00
59.00
Jul-
14
Aug-1
4
Sep-1
4
Oct-
14
Nov-1
4
Dec-1
4
Feb-1
5
Mar-
15
Apr-
15
May-1
5
Jun-1
5
Jul-
15
Sep-1
5
Oct-
15
Nov-1
5
Dec-1
5
Jan-1
6
MCPRF-II Benchmark

MEEZAN CAPITAL PRESERVATION FUND (MCPF-III)
Fund Review:
For the month of January 28, 2016, KSE-Meezan Index (KMI-30) decreased by 3.18% with which the fund also decreased its exposure to
equities. The NAV as a result decreased from Rs. 59.31 to Rs. 58.34 translating into a loss of 1.64% for the month.
Funds Details
Disclaimer This publication is for informational purpose only and nothing herein should be construed as a solicitation, recommendation or an offer to buy or sell any fund. All investments in mutual funds are subject to market
risk. The NAV based prices of units and any dividends/returns thereon are dependent on force and factors affecting the capital markets. These may go up or down based on market conditions. Past performance is not
necessarily indicative of future results. (This report has been prepared in line with MUFAP’s recommended Format)
AMC RATING AM2+ (STABLE OUTLOOK)
1M 3M 6M FYTD 1Yr 3Yr 5Yr PSD*
MCPF-III -1.6% -2.0% -3.7% -0.4% -1.7% - - 17.9%
Benchmark -1.4% -3.0% -4.7% -2.8% -0.9% - - 14.2%
* Performance start date of Jan 31, 2014,
FY15 FY14 FY13 FY12 FY11 FY10 FY09 FY08
MCPF-III 12.09% 5.6% - - - - - -
Benchmark 11.96% 5.0% - - - - - -
Nov’15 Dec’15 Jan’16
Equity/ Index Funds (%) 56.4 49.8 0.0
Income/Money market Funds (%) 43.5 50.1 99.9
Cash (%) 0.0 0.1 0.1
Other Including receivables (%) 0.1 0.0 0.0
Fund Type: Open End Risk Level Low to Moderate Launch Date 31-Jan-14 Trustee CDC
Auditors KPMG Taseer Hadi & Co.
Registrar Meezan Bank Ltd. Unit Types A, B and C Management Fee 1% Front End Load 3% Fund Category Fund of Funds Back End Load Contingent Load Benchmark Combination of
KMI-30 Index and Average return on 6-month Islamic bank deposits
Leverage Nil Listing ISE AMC Rating AM2+
Rating Agency JCRVIS Pricing Mechanism Forward Valuation Days Mon-Fri Subscription/ Redemption Days Mon-Fri 9am – 4pm Fund Manager Ahmed Hassan, CFA
Members of Investment Committee
M. Shoaib, CFA
Muhammad Asad
Sanam Zaib, CFA
Ahmed Hassan, CFA
Asif Imtiaz, CFA Zain Malik Asmar Hamoodi Fahad Sultan, ACA
Investment Objective:
Objective of this fund is to earn a potentially high
return through dynamic asset allocation between
Shariah Compliant Equities and Shariah Compliant
Income/Money Market based Collective Investment
Schemes.
Fund Details:
Dec’15 Jan '16 MoM %
Net Assets (Rs mn) 3,380 3,318 -1.84%
NAV Per Unit (Rs) 59.31 58.34 -1.64%
Annual Returns:
Performance - Cumulative Returns (net of expenses):
Fund Net Assets: Asset Allocation:
Fund’s Performance:
WWF Disclosure: The Board of Directors of the management company in its meeting held on
October 25, 2013 have resolved that unrecorded accumulated WWF provision in the fund from the date of
its application till December 31, 2012, in case is required to be paid, shall be borne by Al Meezan
Investment Management Limited (Management Company of the fund). Thus, the Fund is no longer liable to
pay any expense under WWF until December 31, 2012.
The Fund has maintained provisions against Workers’ Welfare Fund liability of Rs. 10.83 million till June 30,
2015, if the same was not made the NAV per unit/return of the fund would have been higher by Rs.
0.19/0.33%. Effective from July 1, 2015 no provision is being made as mutual funds have been excluded
from levy of WWF vide Finance Act 2015.
January, 2016
FU
ND
OF F
UN
DS
Funds Multiplier:
MCPF-III
High Multiplier 3.54
Low Multiplier 0.00
49.30
51.30
53.30
55.30
57.30
59.30
61.30
63.30
Feb-1
4
Mar-
14
Apr-
14
May-1
4
Jun-1
4
Jul-
14
Aug-1
4
Sep-1
4
Oct-
14
Nov-1
4
Dec-1
4
Jan-1
5
Feb-1
5
Mar-
15
Apr-
15
May-1
5
Jun-1
5
Jul-
15
Aug-1
5
Sep-1
5
Oct-
15
Nov-1
5
Dec-1
5
Jan-1
6
MCPF-III Benchmark

Fund Review:
Net assets of Meezan Balanced Fund (MBF) as at January 29, 2016 stood at Rs. 4.49 billion. The fund’s NAV decreased by 1.36% during the
month.
Funds Details
Disclaimer This publication is for informational purpose only and nothing herein should be construed as a solicitation, recommendation or an offer to buy or sell any fund. All investments in mutual funds are subject to market
risk. The NAV based prices of units and any dividends/returns thereon are dependent on force and factors affecting the capital markets. These may go up or down based on market conditions. Past performance is not necessarily indicative of future results. (This report has been prepared in line with MUFAP’s recommended Format)
1M 3M 6M FYTD 1Yr 3Yr 5Yr PSD* CAGR*
MBF -1% -2% -2% 0.2% 3% 58% 124% 414% 16%
Benchmark -1% -3% -3% -2% 2% 43% 87% 239% 12%
* Performance start date of Dec 20, 2004, CAGR since inception
FY15 FY14 FY13 FY12 FY11 FY10 FY09 FY08
MBF 16% 20% 32% 17% 25% 23% -11% 1%
Benchmark 13% 18% 30% 10% 25% 21% -14% 3%
*
Equity
Sukuk
Packages Ltd. 6% K-Electric Sukuk 3 10%
Engro Corporation 6% GoP Ijarah Sukuk XVI 8%
Hub Power Co. Ltd. 6% Hascol Sukuk 6%
Lucky Cement Co. Ltd. 4% Engro Fertilizer Limited – II 1%
Pakistan State Oil Ltd. 3% Lalpir (Commercial Paper) 1%
Dec ’15 Jan ’16 Equity 58% 57%
GoP Guaranteed Securities 8% 8%
Sukuk 12% 18%
Placement with Banks 4% 4%
Cash Others including receivable 18% 13%
Fund Type: Open End Risk Level Minimal Launch Date 20-Dec-2004 Trustee CDC
Auditors KPMG Taseer Hadi & Co.
Registrar Meezan Bank Ltd. Management Fee 2% Fund Category Balanced Front End Load 2% Back End Load Contingent Load Leverage Nil Listing ISE AMC Rating AM2+
Rating Agency JCRVIS
Pricing Mechanism Forward
Valuation Days Mon-Fri
Subscription/ Redemption Days Mon-Fri 9am – 4pm
Benchmark 50% KMI-30 Index 50% Average bank Deposit rate of three Islamic banks
Fund Manager Asmar Hamoodi
Members of Investment Committee
M. Shoaib, CFA
Muhammad Asad
Sanam Zaib, CFA
Ahmed Hassan, CFA
Asif Imtiaz, CFA Zain Malik Asmar Hamoodi Fahad Sultan, ACA
Investment Objective:
The objective of Meezan Balanced Fund is to generate
long term capital appreciation as well as current
income by creating a balanced portfolio that is invested
both in high quality equity securities and Islamic
Income Instruments such as TFCs, COIs, Certificates of
Musharika, Islamic Sukuk, Ready-future hedges, and
other Shariah compliant instruments.
Fund Details:
Annual Returns:
Performance - Cumulative Returns:
Top Ten Portfolio Holdings:(% of Total Assets):
Sector Allocation:
Fund Net Asset:
MEEZAN BALANCED FUND
(MBF) AMC RATING AM2+ (STABLE OUTLOOK)
Dec '15 Jan '16 MoM %
Net Assets (Rs mn) 4,523 4,486 -0.82%
NAV Per Unit (Rs) 14.90 14.70 -1.36%
B
ALA
NC
ED
Asset Allocation:
WWF Disclosure: The Board of Directors of the management company
in its meeting held on October 25, 2013 have resolved that unrecorded accumulated
WWF provision in the fund from the date of its application till December 31, 2012, in
case is required to be paid, shall be borne by Al Meezan Investment Management
Limited (Management Company of the fund). Thus, the Fund is no longer liable to
pay any expense under WWF until December 31, 2012.
The Fund has maintained provisions against Workers’ Welfare Fund liability of Rs.
37.91 million till June 30, 2015, if the same was not made the NAV per unit/return of
the fund would have been higher by Rs. 0.12/0.85%. Effective from July 1, 2015 no
provision is being made as mutual funds have been excluded from levy of WWF vide
Finance Act 2015.
January, 2016
Details of Non Performing Investments:
26%
12% 6%8%
8%
40%
Sukuk
Cement
Paper & Board
Power Generation & Distribution
Fertilizer
Cash & others
Performance – Fiscal Year Returns:
FY15 FY14 FY13 FY12 FY11 FY10 FY09 FY08 FY07
MIF 22% 29% 51% 19% 39% 31% -30% 0% 29%
Benchmark 20% 30% 54% 14% 44% 37% -35% 1% 17%
FY15 FY14 FY13 FY12 FY11 FY10 FY09 FY08 FY07
AMMF 22% 30% 51% 19% 38% 31% -32% 0% 27% Benchmark 20% 30% 54% 14% 44% 37% -35% 1% 17%
FY15 FY14 FY13 FY12 FY11 FY10 FY09 FY08 FY07
MIIF 8.15% 11.90% 14.45% 7.79% 11.77% 7.31% 10.14% 9.28% 10.07%
Benchmark 5.04% 5.38% 5.54% 6.02% 5.88% 5.80% 6.12% 5.75% 5.00%
FY15 FY14 FY13 FY12 FY11 FY10 FY09 FY08 FY07
MCF 7.46% 7.08% 8.78% 10.71% 11.02% 10.09% 8.03% - - Benchmark 6.24% 6.55% 6.91% 8.13% 8.24% 7.50% 7.60% - -
FY15 FY14 FY13 FY12 FY11 FY10 FY09 FY08 FY07
MSF 6.81% 8.50% 9.11% 11.19% 11.45% 9.76% - - -
Benchmark 6.24% 6.55% 6.91% 8.13% 8.24% 7.50% - - -
FY15 FY14 FY13 FY12 FY11 FY10 FY09 FY08 FY07
MTPF- Equity 26.6% 32.40% 54.90% 16.8% 36.00% 31.50% -25.80% 3.10% - MTPF- Debt 6.4% 7.70% 8.30% 9.5% 10.90% 8.50% 10.20% 8.30% - MTPF- MMkt 6.9% 6.90% 7.80% 10.9% 10.70% 8.50% 11.10% 7.70% -
FY15 FY14 FY13 FY12 FY11 FY10 FY09 FY08 FY07
KMIF 17.1% 26.50% 49.60% -2.4% - - - - -
Benchmark 20.1% 29.90% 54.40% -1.90% - - - - -
FY15 FY14 FY13 FY12 FY11 FY10 FY09 FY08 FY07
MCPRF-II 10.3% - - - - - - - - Benchmark 8.5% - - - - - - - -
FY15 FY14 FY13 FY12 FY11 FY10 FY09 FY08 FY07
MCPF-III 12.1% 5.60% - - - - - - - Benchmark 12.0% 5.00% - - - - - - -
FY15 FY14 FY13 FY12 FY11 FY10 FY09 FY08 FY07
MBF 16% 20% 32% 17% 25% 23% -11% 1% 26% Benchmark 13% 18% 30% 10% 25% 21% -14% 3% 11%
FY15 FY14 FY13 FY12 FY11 FY10 FY09 FY08 FY07
Aggressive 16.5% 22.10% 9.0% - - - - - - Benchmark 15.1% 21.70% 7.90% - - - - - -
Moderate 13.6% 17.30% 6.5% - - - - - - Benchmark 12.9% 18.20% 6.20% - - - - - -
Conservative 10.1% 12.60% 3.8% - - - - - - Benchmark 8.6% 11.20% 3.60% - - - - - -
MCPP - I 7.8% - - - - - - - - Benchmark 8.5% - - - - - - - -
MCPP – II 0.4% - - - - - - - -
Benchmark 2.0% - - - - - - - -
MAAP – I - - - - - - - - - Benchmark - - - - - - - - -
MAAP – II - - - - - - - - - Benchmark - - - - - - - - -
MAAP – III - - - - - - - - - Benchmark - - - - - - - - -
FY15 FY14 FY13 FY12 FY11 FY10 FY09 FY08 FY07
MGF - - - - - - - - - Benchmark - - - - - - - - -
Disclaimer This publication is for informational purpose only and nothing herein should be construed as a solicitation, recommendation or an offer to buy or sell any fund. All investments in mutual funds are subject to market
risk. The NAV based prices of units and any dividends/returns thereon are dependent on force and factors affecting the capital markets. These may go up or down based on market conditions. Past performance is not necessarily indicative of future results. (This report has been prepared in line with MUFAP’s recommended Format)