From STRDBG to the RDi Debugger - OMNI...
22
Copyright Central Park Data Systems Inc 1 The Art of Debugging: From STRDBG to RDi Charles Guarino Central Park Data Systems, Inc. About The Speaker With an IT career spanning over 30 years, Charles Guarino has been a consultant for most of them. Since 1995 he has been founder and President of Central Park Data Systems, Inc., a New York area based IBM midrange consulting company. In addition to being a professional speaker, he is a frequent contributor of technical and strategic articles and webcasts for the IT community. He is a proud member of COMMON’s Speaker Excellence Hall of Fame and also Long Island Software and Technology Network’s Twenty Top Techies of 2009. Charles currently serves as a member of COMMON’s Strategic Education Team (SET) and is also Immediate Past President and monthly Q&A host of LISUG, a Long Island IBM i User’s Group www.lisug.org . Charles can be reached at [email protected] . LinkedIn - http://www.linkedin.com/in/guarinocharles Twitter - @charlieguarino
Transcript of From STRDBG to the RDi Debugger - OMNI...

Copyright Central Park Data Systems Inc 1
The Art of Debugging:
From STRDBG to RDi
Charles Guarino
Central Park Data Systems, Inc.
About The Speaker
With an IT career spanning over 30 years, Charles Guarino
has been a consultant for most of them. Since 1995 he has
been founder and President of Central Park Data Systems,
Inc., a New York area based IBM midrange consulting
company. In addition to being a professional speaker, he is a
frequent contributor of technical and strategic articles and
webcasts for the IT community. He is a proud member of
COMMON’s Speaker Excellence Hall of Fame and also Long
Island Software and Technology Network’s Twenty Top
Techies of 2009. Charles currently serves as a member of
COMMON’s Strategic Education Team (SET) and is also
Immediate Past President and monthly Q&A host of LISUG,
a Long Island IBM i User’s Group www.lisug.org.
Charles can be reached at [email protected].
LinkedIn - http://www.linkedin.com/in/guarinocharles
Twitter - @charlieguarino

Copyright Central Park Data Systems Inc 2
In This Session …
For years we believed that STRDBG had been adequate for
everyday debugging situations. With the introduction of
WDSC/RDP/RDi we have been given the ability to extend our
productivity in a feature-rich graphical environment.
In this session we will review every aspect of this new
environment and explore how the days of green screen
debugging have become a technology of the past.
What We’ll Cover …
• Perspectives
• Review program we will debug
• The Debug Server
• Service Entry Points
• Calling a program from within RDi and debug configurations
• Debugging views
• Debugging another user’s program
• Wrap-up

Copyright Central Park Data Systems Inc 3
Perspectives
• There are many available in RDi
� This session focuses on the debugging perspective
� To see all available perspectives click on
Window>Open Perspective>Other
- Or – Typing “Perspective” in Quick Access
What We’ll Cover …
• Perspectives
• Review program we will debug
• The Debug Server
• Service Entry Points
• Calling a program from within RDi and debug configurations
• Debugging views
• Debugging another user’s program
• Wrap-up

Copyright Central Park Data Systems Inc 4
Call encryption service program, return ciphertext
Update CUSTMAST with encrypted data
Read a record from file CUSTMAST
Read more records from file CUSTMAST
Program we will be debugging
Start program
If %EOF, leave program loop and exit program
Program we will be debugging (cont.)

Copyright Central Park Data Systems Inc 5
What We’ll Cover …
• Perspectives
• Review program we will debug
• The Debug Server
• Service Entry Points
• Calling a program from within RDi and debug configurations
• Debugging views
• Debugging another user’s program
• Wrap-up
The Debug Server
• Listens on the IBM i for debugging instructions from RDi
• It needs to be active before any debugging can occur
� You will receive a warning message if you try to debug a
program and the server is not yet active.
� Don’t panic! You can start it immediately directly from RDi.
� Once the debug server is started it will work for everyone
� There is NOT one server PER USER – only one per system
which will service every developer’s RDP debugging requests
� I recommend putting command STRDBGSVR in your startup
program

Copyright Central Park Data Systems Inc 6
Starting the Debug Server (3 different ways!)
- OR -
- OR -
The Debug Server in action
• Runs in subsystem QUSRWRK as jobs and programs
QB5BROUTER and QB5SERVER
• Job will use the user ID that started the server
• The debug server will remain active until it is explicitly ended
• There will be an additional job for each program being debugged,
serviced by program QRSEEXEC

Copyright Central Park Data Systems Inc 7
What We’ll Cover …
• Perspectives
• Review program we will debug
• The Debug Server
• Service Entry Points
• Calling a program from within RDi and debug configurations
• Debugging views
• Debugging another user’s program
• Wrap-up
Starting the Debugger
• There are three methods to prepare and launch the debugger:
� Method 1: A program can be launched directly from RDi
� With or without parameter prompting
� Method 2: Setting a Service Entry Point
� When the program is run anywhere using the specified
parameters the debugger will be launched
� Method 3: Debugging an active job
� Can intercept an active job to identify and resolve issues

Copyright Central Park Data Systems Inc 8
Setting a Service Entry Point from a source member
• Right click on any source member
Setting a Service Entry Point from a source member (cont.)
• You will have an opportunity to change any of these values
• This is a HUGE improvement over service jobs and STRSRVJOB

Copyright Central Park Data Systems Inc 9
Setting a Service Entry Point from a source member (cont.)
• Once the SEP has been set you will receive this confirmation
• You will see your parameters in the SEP view in the RSE
Service Entry Point being set from a program object
Copyright Central Park Data Systems Inc 10
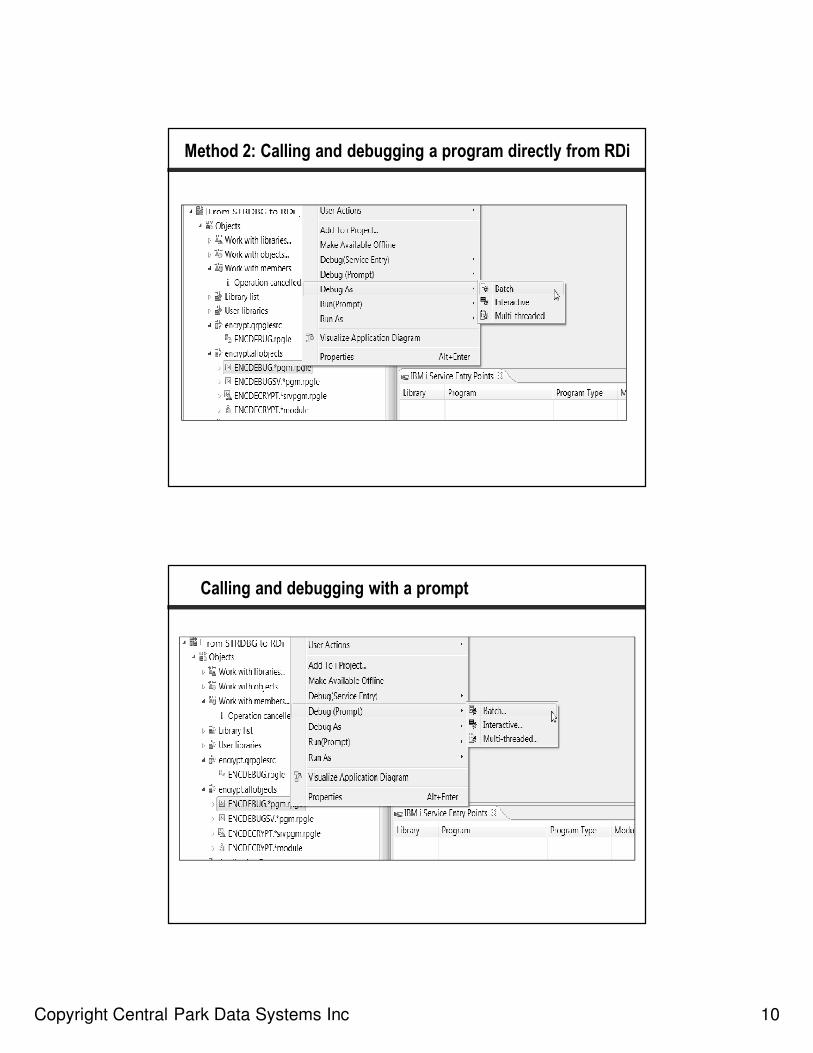
Method 2: Calling and debugging a program directly from RDi
Calling and debugging with a prompt

Copyright Central Park Data Systems Inc 11
Debug configurations
CAN BE NAMED AND SAVED
SPECIFY WHAT AND HOW TO RUN
CAN SPECIFY PROGRAM
PARAMETERS
• Click on “How to Start” for additional parameters
Debug configurations (cont.)

Copyright Central Park Data Systems Inc 12
Launching an existing configuration
• Very useful is you will debugging programs multiple times
• The configuration will remember all of your settings
What We’ll Cover …
• Perspectives
• Review program we will debug
• The Debug Server
• Service Entry Points
• Calling a program from within RDi and debug configurations
• Debugging views
• Debugging another user’s program
• Wrap-up

Copyright Central Park Data Systems Inc 13
Submitting and debugging a job directly from RDi
• Debug as submits with your current session’s settings
� This includes library list, updprod settings, etc.
• Debug (prompt) brings up a debug configuration
Introducing the DEBUG perspective
• “Wakes up” automatically when a program launched in debug mode or an
active service entry point is encountered
• Green line is the current line of execution
• Boxes shows shortcuts, breakpoints and current line of execution pointer

Copyright Central Park Data Systems Inc 14
What We’ll Cover …
• Perspectives
• Review program we will debug
• The Debug Server
• Service Entry Points
• Calling a program from within RDi and debug configurations
• Debugging views
• Debugging another user’s program
• Wrap-up
Introducing the DEBUG view
• This is the call stack and communication area between RDi and
the IBM i
• Can be used to debug multiple jobs at the same time
� Simply click on the job you want to debug

Copyright Central Park Data Systems Inc 15
The DEBUG view
• When debugging multiple jobs at once keep the debug view open
� Makes it easier to keep track of current job being debugged
Introducing the VARIABLES view
• All program variables are displayed and updated in real time
� Each variable will change color when its value changes
• This view is customizable using the drop-down menu
• Right click to change view and add to monitors view
• Values can be changed by simply over-typing

Copyright Central Park Data Systems Inc 16
Green screen equivalent to variables view!
• Type the debug command EVAL %LOCALVARS to see all variables!
Introducing the MONITORS view
• You decide which variables will appear in this view
• Useful when watching a specific set of fields
• You can right click on a field to switch between character or
hexadecimal view

Copyright Central Park Data Systems Inc 17
Introducing the BREAKPOINTS view
• Breakpoints can be set at the source level or at runtime
• Breakpoints can be conditional or unconditional
• Can also be disabled so you don’t have to delete them
• Watch breakpoints are set at runtime – here we’re watching the
variable named “direction”
Adding a breakpoint

Copyright Central Park Data Systems Inc 18
Adding a watch breakpoint
Watching for changes in the field “direction”

Copyright Central Park Data Systems Inc 19
Watching for changes in the field “direction” (cont.)
Introducing the OUTLINE view

Copyright Central Park Data Systems Inc 20
Introducing the PROGRAMS view
• Functionally similar to pressing F14 from DSPMODSRC screen
Field hovering
• Position the cursor over a field and its value appears.
• Much easier than typing “ev cleardata” or pressing F11!

Copyright Central Park Data Systems Inc 21
What We’ll Cover …
• Perspectives
• Review program we will debug
• The Debug Server
• Service Entry Points
• Calling a program from within RDi and debug configurations
• Debugging views
• Debugging another user’s program
• Wrap-up
Debugging Another User’s Job
• Locate the active job, right click on it and select “Debug As >
IBM i job”

Copyright Central Park Data Systems Inc 22
What We’ll Cover …
• Perspectives
• Review program we will debug
• The Debug Server
• Service Entry Points
• Calling a program from within RDi and debug configurations
• Debugging views
• Debugging another user’s program
• Wrap-up
The Art of Debugging:
From STRDBG to RDi
Charles Guarino
THANK YOU !!!