From science to a mission design JAXA Earth · PDF fileFrom science to a mission design JAXA...
37
From science to a mission design JAXA Earth Observations Toshiyoshi Kimura Head of Sensor System Research Research and Development Directorate JAXA
Transcript of From science to a mission design JAXA Earth · PDF fileFrom science to a mission design JAXA...

From science to a mission design JAXA Earth Observations
Toshiyoshi Kimura
Head of Sensor System Research
Research and Development Directorate
JAXA
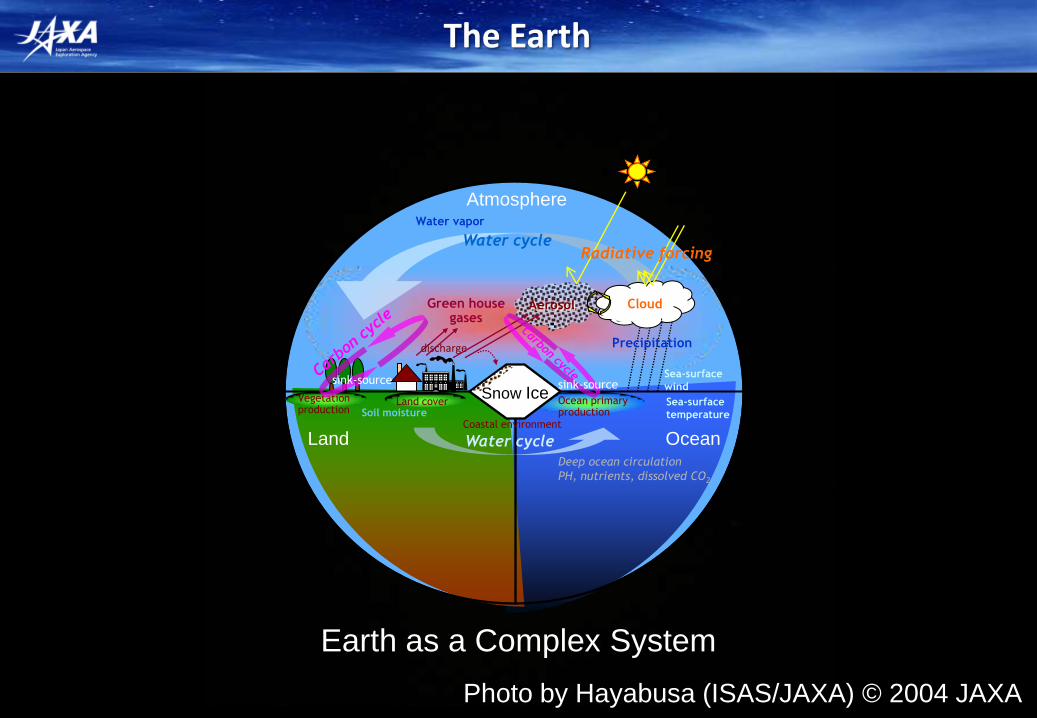
The Earth
Space Science School, 17-26 Oct, 2016 @ GISTDA, Si Racha 1 Photo by Hayabusa (ISAS/JAXA) © 2004 JAXA
Atmosphere
Land Ocean
Green house gases
Vegetation production
Cloud
discharge
Snow Ice
Precipitation
Soil moisture
Aerosol
sink-source
Ocean primary production
Water vapor
Sea-surface
temperature
Water cycle
sink-source
Water cycle
Land cover
Sea-surface
wind
Coastal environment
Deep ocean circulation
PH, nutrients, dissolved CO2
Radiative forcing
Earth as a Complex System

2
National, Regional and Global Observation Systems
Disasters Energy Climate Water Health Weather Ecosystems Agriculture Biodiversity
CEOS In-situ observation
organizations
Europe/Africa Asia Americas
Requirements Realization of global Earth observation system of systems within 10 years for 9 SBAs. 72 countries, EC and 52 int’l organizations
Coordination body for GEOSS space segment
GEOSS
27 space agencies, 21 associates
Copernicus (GMES) SERVIR

3
Asia GCOM
Disaster
Monitoring
satellites …..
Sentinel Asia
(JAXA)
North/South America EOS JPSS Decadal Survey Missions
…..
SERVIR
(NOAA, NASA, DOD)
Europe/Africa METOP Sentinels Earth Watch Earth Explore …..
Copernicus
(ESA,EC)
CEOS, GCOS (+IPCC)
Global Forest Monitoring System
Global Warming and Climate Change
Climate Change
Global
warming
CO2
emission
co
olin
g
Vegetation
Water vapor
Water cycle variability
Ocean
Rain Aerosol Cloud
heating
CO2
concentration
increasing
ad
so
rptio
n
Greenhouse Gases Monitoring System
Global Disaster Monitoring System
Global Water Cycle Monitoring System
Con
cre
te g
lobal
observ
ation s
yste
ms
Essential Climate Varibales (ECVs) List
GEOSS
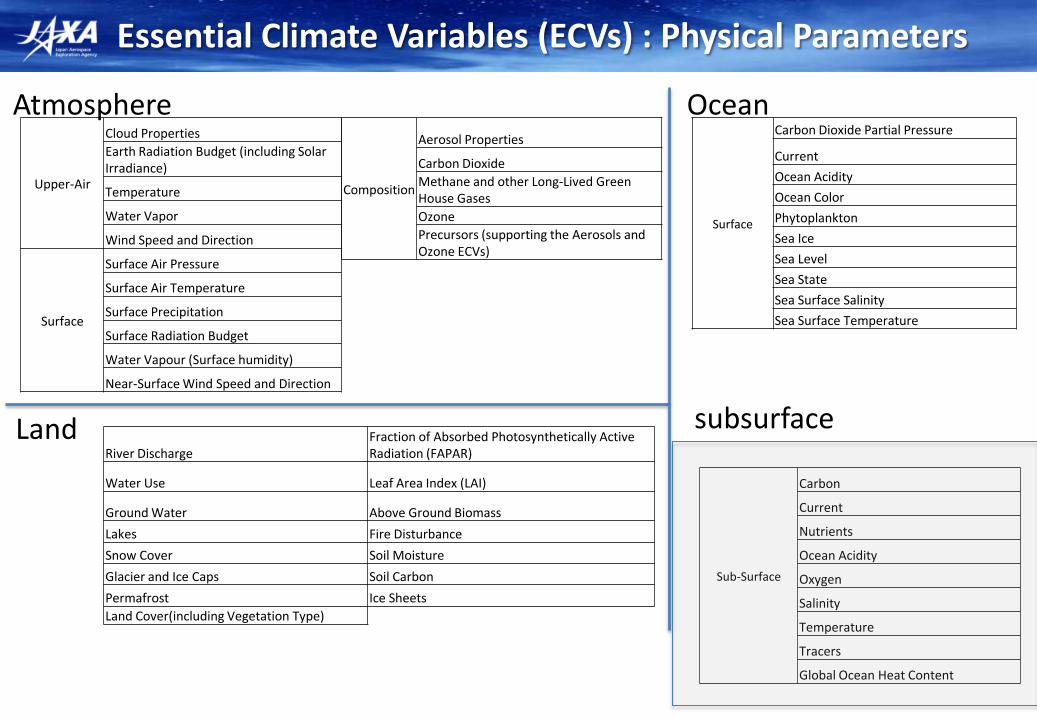
Essential Climate Variables (ECVs) : Physical Parameters
Composition
Aerosol Properties
Carbon Dioxide
Methane and other Long-Lived Green House Gases
Ozone
Precursors (supporting the Aerosols and Ozone ECVs)
Surface
Carbon Dioxide Partial Pressure
Current
Ocean Acidity
Ocean Color
Phytoplankton
Sea Ice
Sea Level
Sea State
Sea Surface Salinity
Sea Surface Temperature
Sub-Surface
Carbon
Current
Nutrients
Ocean Acidity
Oxygen
Salinity
Temperature
Tracers
Global Ocean Heat Content
Atmosphere
Land
Ocean
River Discharge Fraction of Absorbed Photosynthetically Active Radiation (FAPAR)
Water Use Leaf Area Index (LAI)
Ground Water Above Ground Biomass
Lakes Fire Disturbance
Snow Cover Soil Moisture
Glacier and Ice Caps Soil Carbon
Permafrost Ice Sheets
Land Cover(including Vegetation Type)
Upper-Air
Cloud Properties
Earth Radiation Budget (including Solar Irradiance)
Temperature
Water Vapor
Wind Speed and Direction
Surface
Surface Air Pressure
Surface Air Temperature
Surface Precipitation
Surface Radiation Budget
Water Vapour (Surface humidity)
Near-Surface Wind Speed and Direction
subsurface

Current major scientific discussions in Japan
5
Water Cycle
Aerosol-Cloud-Precipitation process / Radiation budget
Precipitation/Land process(Flood, High tide, River discharge)
Air Pollution
Aerosol (incl. PM2.5 / Air Quality (incl. short life climate pollutants)
Carbon Cycle
CO2 concentration in atmosphere
Net Primary Production in land
Primary Production in ocean
Ocean
Sea Surface Temperature, SS Color, SS Height
Coastal Monitoring
Land
Crustal Movement(incl. uplift and subsidence)
Vegetation / Agriculture
Land use (incl. Urbanization)
Cryosphere
Arctic area change
Climate
Integrated Model (Atmosphere/Ocean/Land) > Climate change

Science to Mission
Space Science School, 17-26 Oct, 2016 @ GISTDA, Si Racha 6
So How to ?
Firstly should know
Earth natural character and
Remote sensing fundamentals
Following discussion is only electro-magnetic wave observation

Spectral characteristics Sun-reflection and Earth-emission
7
5900K Blackbody (Sun) 300K Blackbody(Earth)
Wavelength (mm)
Reflection Emission
UV Visible Infrared
Near IR Mid IR Thermal IR
Microwave
Soil
Water
Vegetation
Water Surface
Land Surface

Line absorption of atmosphere
Calculation result of MODTRAN
Wavelength (mm)
Tra
nspa
rency (
Top o
f A
tmosphere
)
CO2 CO2 H2O O3 H2O Absorb gas
8
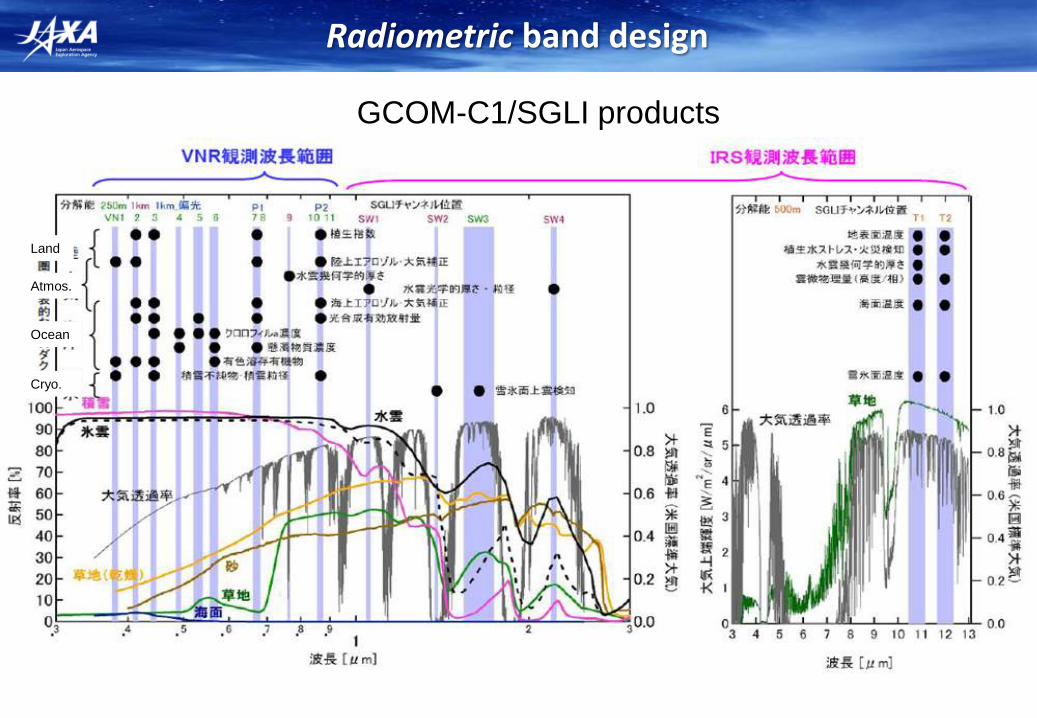
Radiometric band design
GCOM-C1/SGLI products
Land
Atmos.
Ocean
Cryo.

Observational character vs Instruments
Space Science School, 17-26 Oct, 2016 @ GISTDA, Si Racha 10
• Reflectivity/Emissivity / Photometry
• Spectral character (band differential / ratio)
• Absorption line shape (for sounding)
• Polarization
• Bi-directional character
• Vertical
Panchromatic / Hi-res.
Imaging Radiometer
Polarimeter
Spectrometer
Multi-angle
Define necessary scheme to be used for the target
considering SNR for necessary precision
Radar / Lidar
Occultation
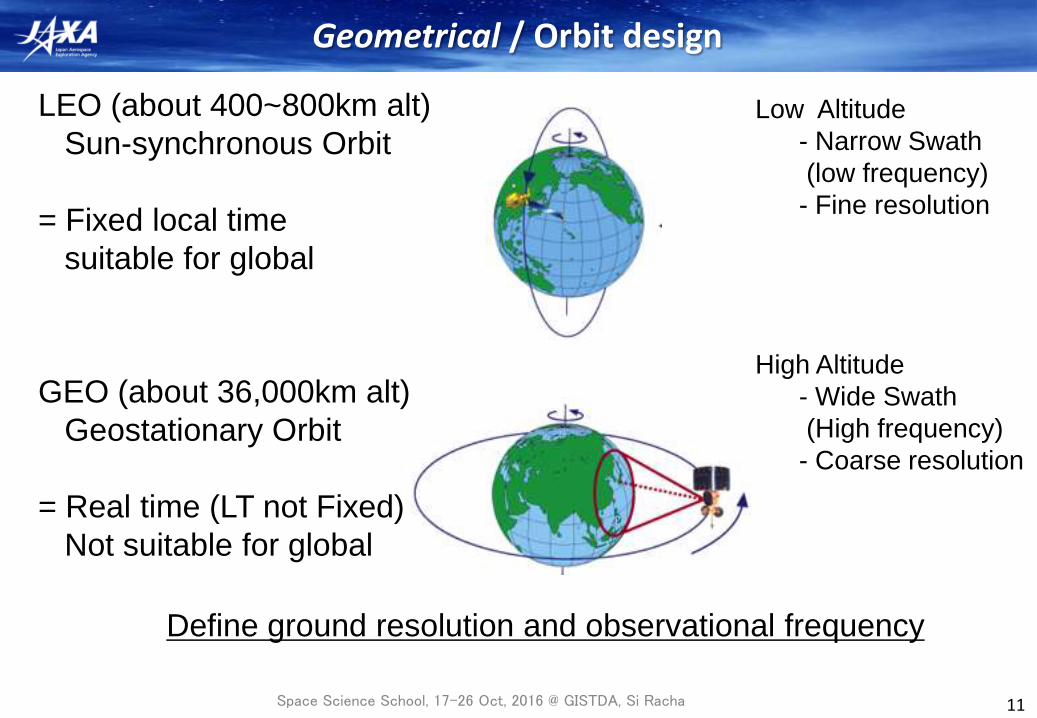
Geometrical / Orbit design
Space Science School, 17-26 Oct, 2016 @ GISTDA, Si Racha 11
LEO (about 400~800km alt)
Sun-synchronous Orbit
= Fixed local time
suitable for global
GEO (about 36,000km alt)
Geostationary Orbit
= Real time (LT not Fixed)
Not suitable for global
Low Altitude
- Narrow Swath
(low frequency)
- Fine resolution
High Altitude
- Wide Swath
(High frequency)
- Coarse resolution
Define ground resolution and observational frequency
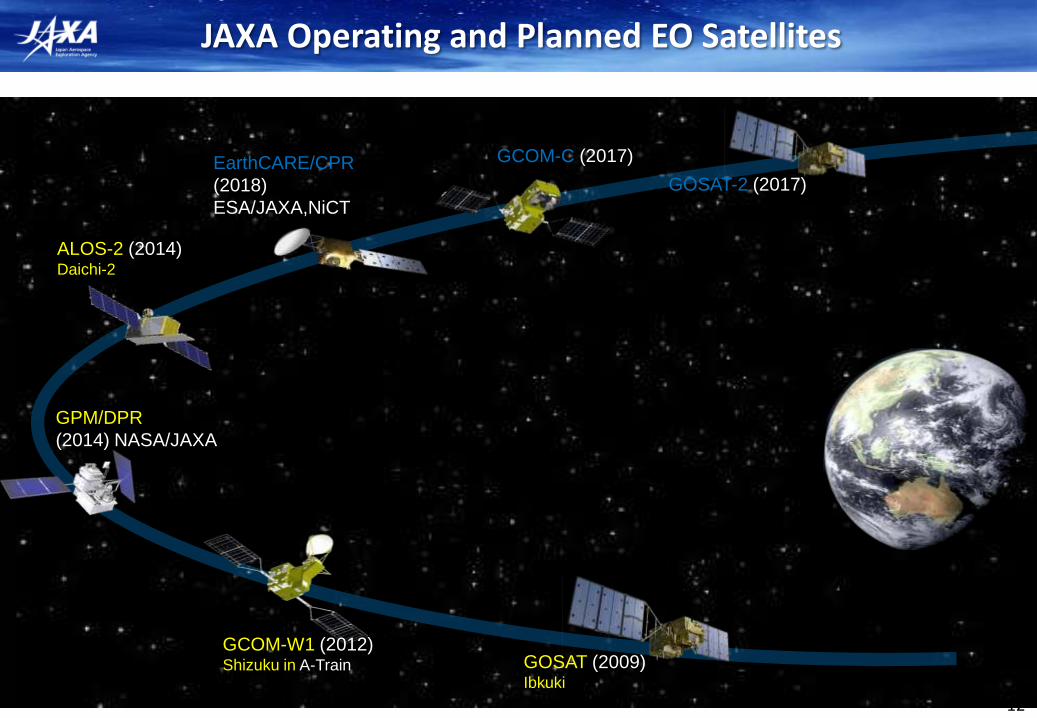
JAXA Operating and Planned EO Satellites
Space Science School, 17-26 Oct, 2016 @ GISTDA, Si Racha 12
ALOS-2 (2014) Daichi-2
GPM/DPR
(2014) NASA/JAXA
GCOM-C (2017) EarthCARE/CPR
(2018)
ESA/JAXA,NiCT
GCOM-W1 (2012) Shizuku in A-Train
GOSAT-2 (2017)
GOSAT (2009) Ibkuki
GPM/DPR (2013)
EarthCARE/CPR (2018)
GOSAT Jan. 2009-
GOSAT-2 (2017)
Atmosphere
Land Ocean
Green house gases
Vegetation production
Cloud
discharge
Snow Ice
Precipitation
Soil moisture
Aerosol
sink-source
Carbon cycle and
land cover
Spatial distribution of
cloud and aerosols
3D structure of
precipitation
Ocean primary production
Water vapor
Green house
gases
Sea-surface
temperature
Water cycle
3D structure of cloud
and aerosols
sink-source
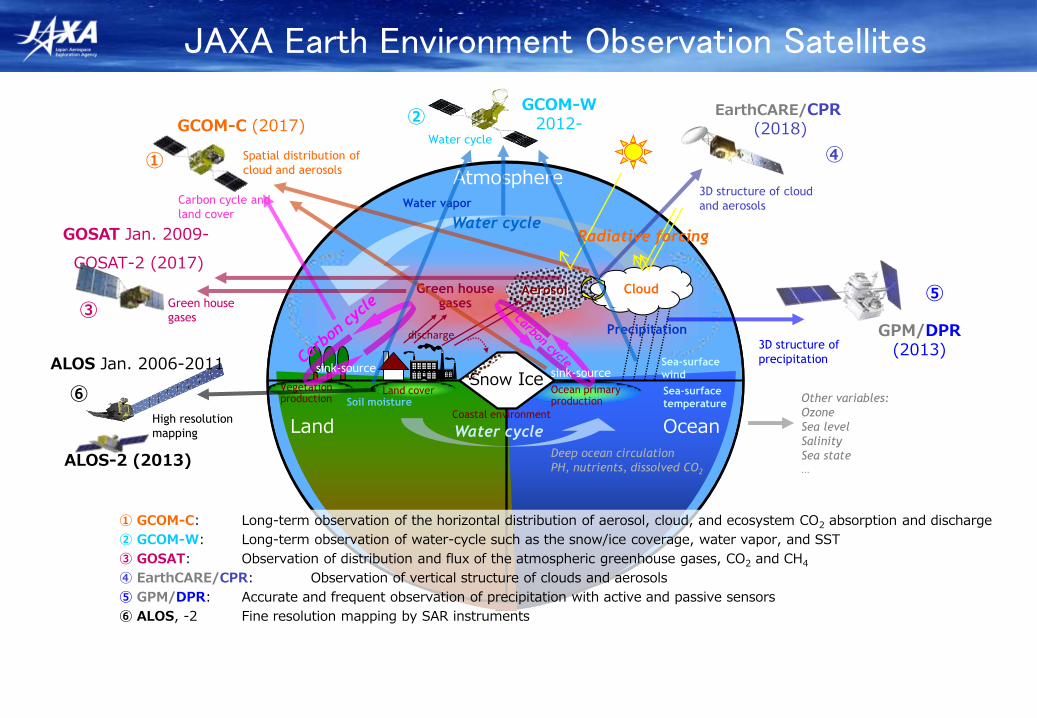
① GCOM-C: Long-term observation of the horizontal distribution of aerosol, cloud, and ecosystem CO2 absorption and discharge
② GCOM-W: Long-term observation of water-cycle such as the snow/ice coverage, water vapor, and SST
③ GOSAT: Observation of distribution and flux of the atmospheric greenhouse gases, CO2 and CH4
④ EarthCARE/CPR: Observation of vertical structure of clouds and aerosols
⑤ GPM/DPR: Accurate and frequent observation of precipitation with active and passive sensors
⑥ ALOS, -2 Fine resolution mapping by SAR instruments
Water cycle
GCOM-W 2012- GCOM-C (2017)
Land cover
Sea-surface
wind
Water cycle
Coastal environment
Deep ocean circulation
PH, nutrients, dissolved CO2
Other variables:
Ozone
Sea level
Salinity
Sea state ...
①
②
⑤
④
③
⑥ High resolution
mapping
Radiative forcing
ALOS Jan. 2006-2011
ALOS-2 (2013)
JAXA Earth Environment Observation Satellites
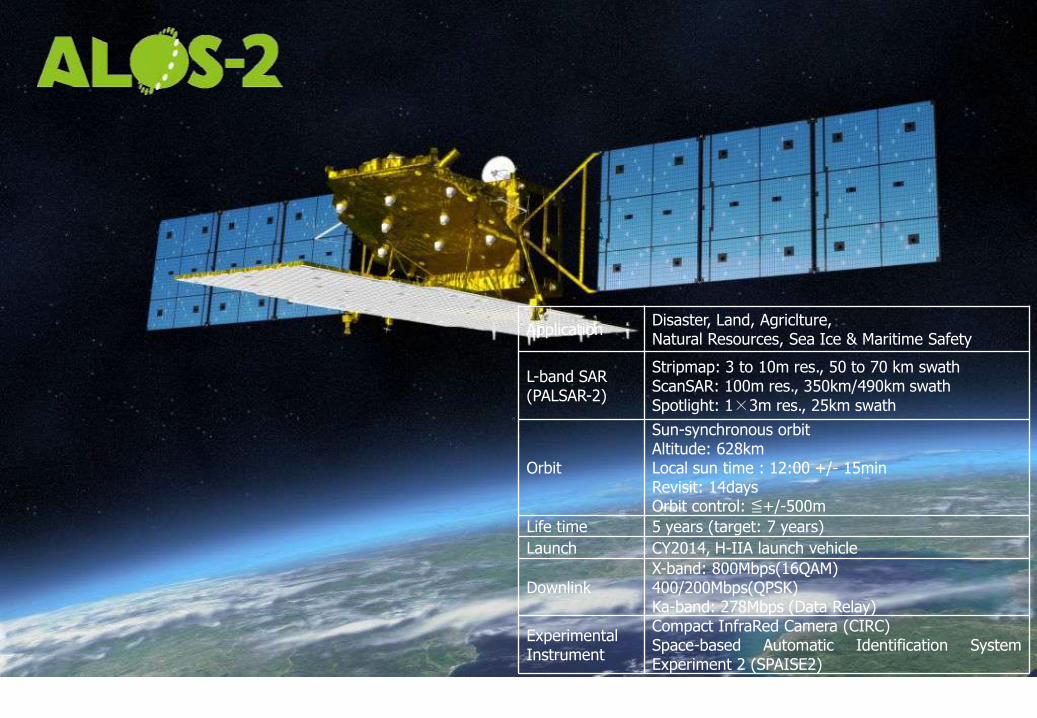
Application Disaster, Land, Agriclture, Natural Resources, Sea Ice & Maritime Safety
L-band SAR (PALSAR-2)
Stripmap: 3 to 10m res., 50 to 70 km swath ScanSAR: 100m res., 350km/490km swath Spotlight: 1× 3m res., 25km swath
Orbit
Sun-synchronous orbit Altitude: 628km Local sun time : 12:00 +/- 15min Revisit: 14days Orbit control: ≦+/-500m
Life time 5 years (target: 7 years)
Launch CY2014, H-IIA launch vehicle
Downlink X-band: 800Mbps(16QAM) 400/200Mbps(QPSK) Ka-band: 278Mbps (Data Relay)
Experimental Instrument
Compact InfraRed Camera (CIRC) Space-based Automatic Identification System Experiment 2 (SPAISE2)
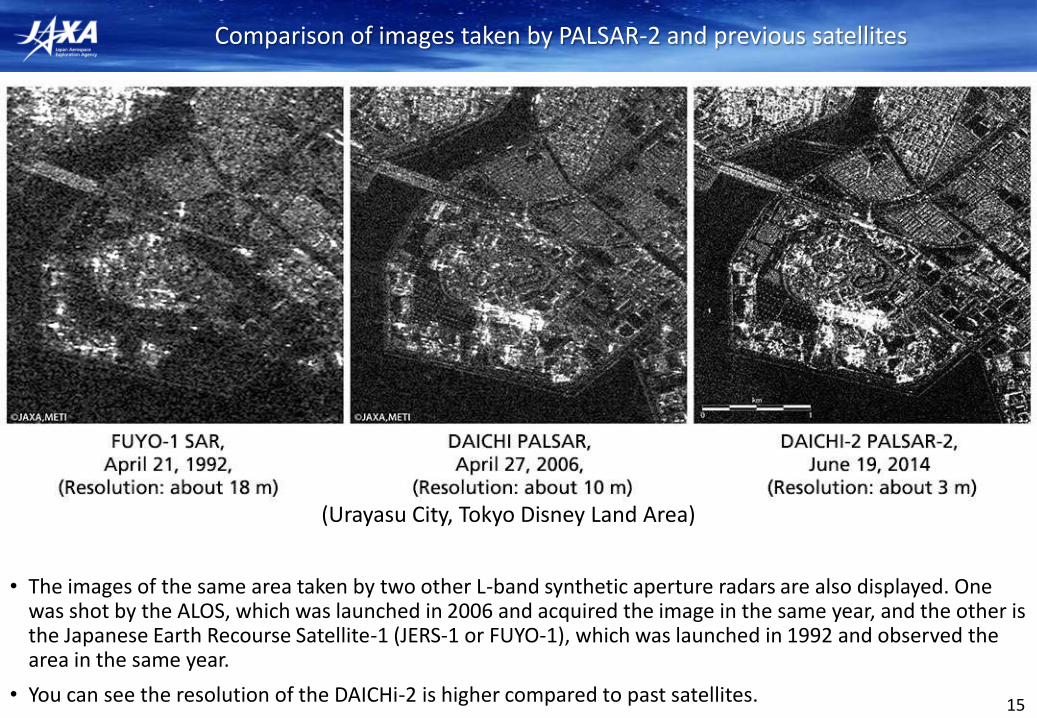
• The images of the same area taken by two other L-band synthetic aperture radars are also displayed. One was shot by the ALOS, which was launched in 2006 and acquired the image in the same year, and the other is the Japanese Earth Recourse Satellite-1 (JERS-1 or FUYO-1), which was launched in 1992 and observed the area in the same year.
• You can see the resolution of the DAICHi-2 is higher compared to past satellites. 15
Comparison of images taken by PALSAR-2 and previous satellites
(Urayasu City, Tokyo Disney Land Area)

16
Flood Monitoring by Synthetic Aperture Radar Data on 19 Nov 2011 Some areas of Nonthaburi, Pathumthani and Bangkok Analyzed by GISTDA Obtained by JAXA’s Polarimetric and Interferometric Airborne Synthetic Aperture Radar (Pi-SAR)
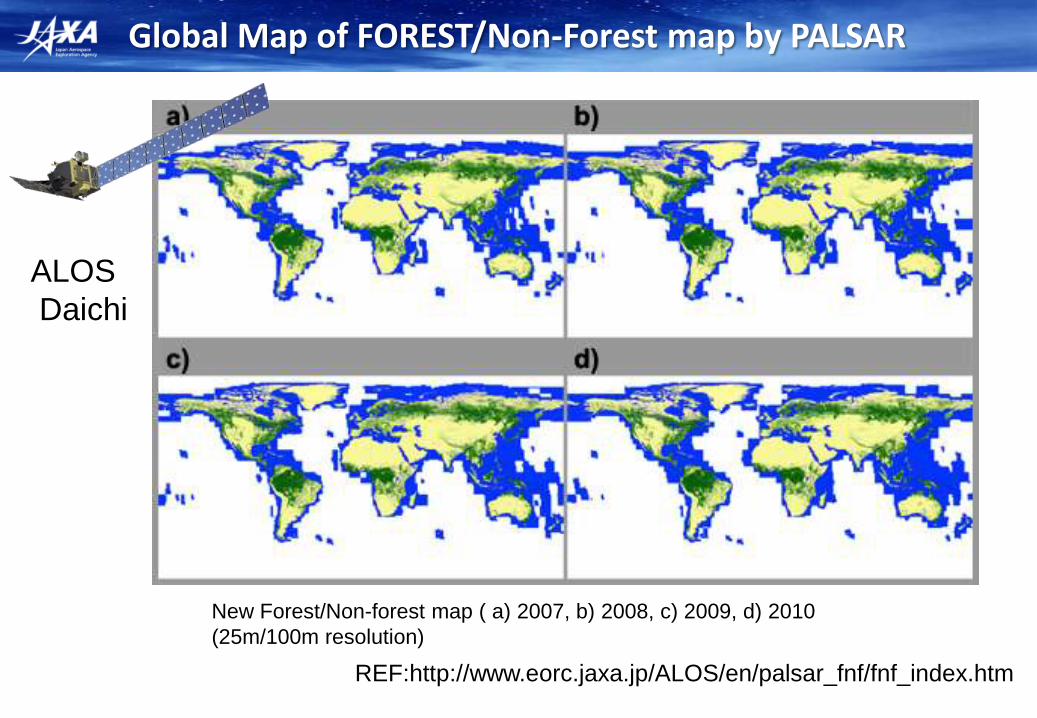
Global Map of FOREST/Non-Forest map by PALSAR
New Forest/Non-forest map ( a) 2007, b) 2008, c) 2009, d) 2010
(25m/100m resolution)
REF:http://www.eorc.jaxa.jp/ALOS/en/palsar_fnf/fnf_index.htm
ALOS
Daichi
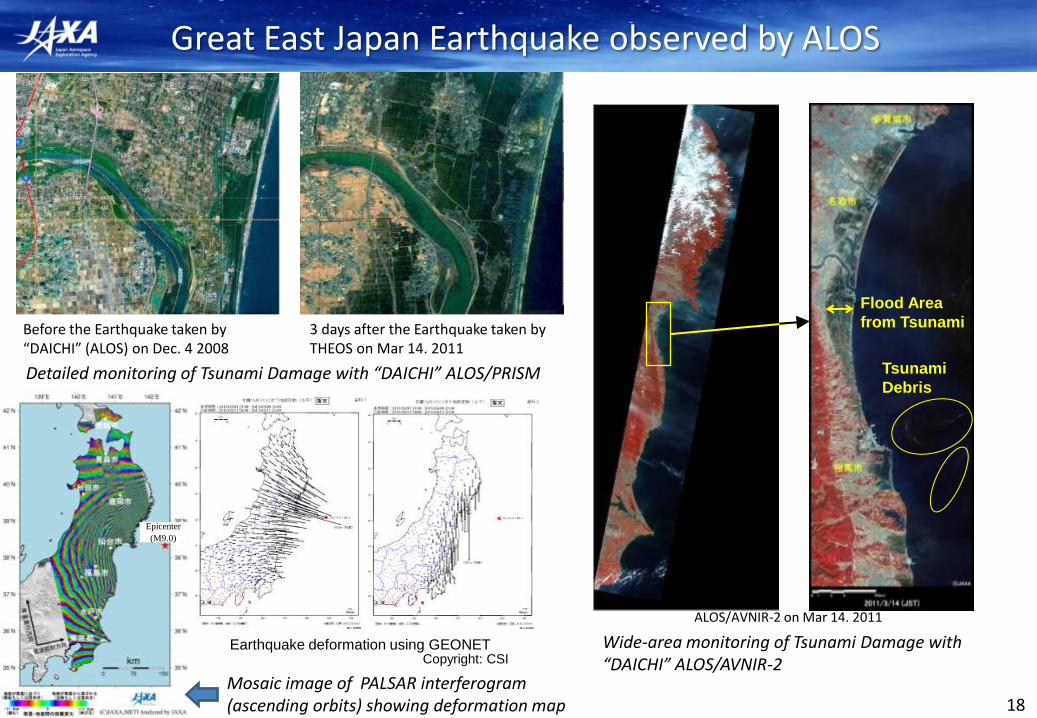
Great East Japan Earthquake observed by ALOS
Before the Earthquake taken by “DAICHI” (ALOS) on Dec. 4 2008
3 days after the Earthquake taken by THEOS on Mar 14. 2011
18
Flood Area
from Tsunami
Mosaic image of PALSAR interferogram (ascending orbits) showing deformation map
Earthquake deformation using GEONET Copyright: CSI
ALOS/AVNIR-2 on Mar 14. 2011
Tsunami
Debris Detailed monitoring of Tsunami Damage with “DAICHI” ALOS/PRISM
Epicenter
(M9.0)
Wide-area monitoring of Tsunami Damage with “DAICHI” ALOS/AVNIR-2
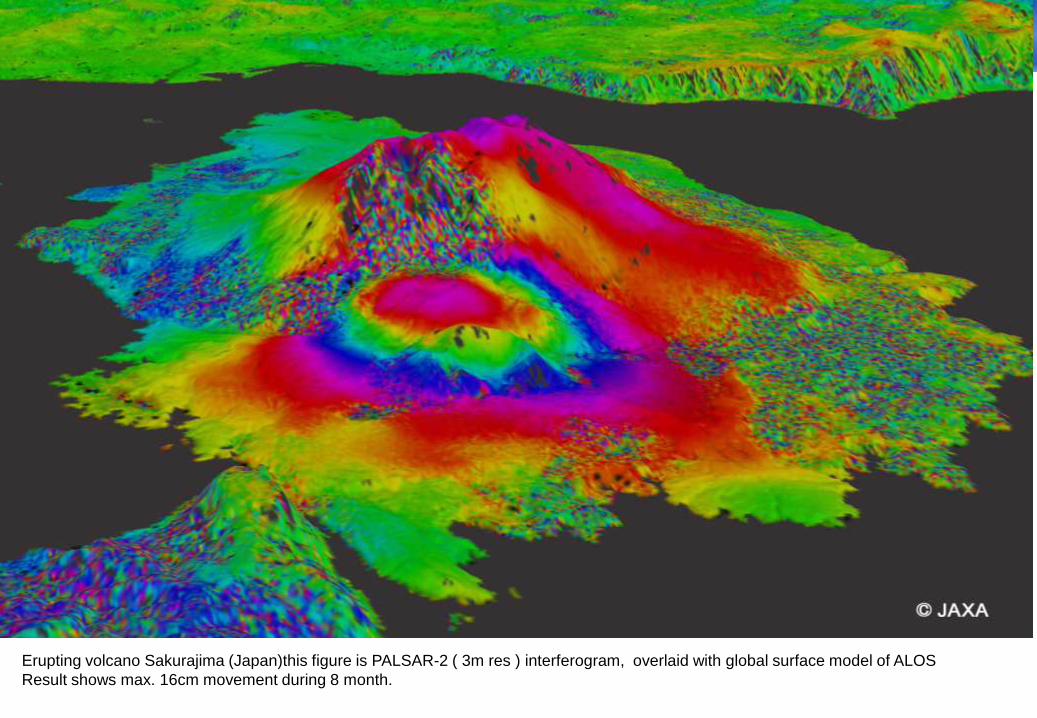
Erupting volcano Sakurajima (Japan)this figure is PALSAR-2 ( 3m res ) interferogram, overlaid with global surface model of ALOS
Result shows max. 16cm movement during 8 month.

GCOM-W1 with A-TRAIN
16th Sep. 2012
(by SHIZUKU/AMSR2)
The Global Change Observation Mission 1st Water (GCOM-W1) satellite observes water circulations and collect concerned data to reveal the mechanism of the climate change.

21
- Frequency range: 6.9-89GHz
- Conical scanning with constant
incidence angle of 55 degrees
AMSR2 instrument (AMSR2: Advanced Microwave Scanning Radiometer-2)
AMSR2 daily ascending coverage AMSR2 observation concept
AMSR2 channel specification Polar regions can be observed twice a day.
Advanced Microwave Scanning Radiometer (AMSR) is a multi-frequency passive microwave
radiometer (PMR) aiming at measuring geophysical parameters related to global water and
energy cycle.
Center Freq. Band width Polari Beam width IFOV(Ground GHz MHz degree km
6.925 /7.3 350 1.8 35 x 62
10.65 100 1.2 24 x 42
18.7 2 00 0.65 14 x 22
23.8 400 0.75 15 x 26
zation Res.)
36.5 1000 0.35 7 x 12
89.0 3000
V/H
0.15 3 x 5
• GPMの衛星写真(他で使っているようなもの)を貼る
22
© NASA
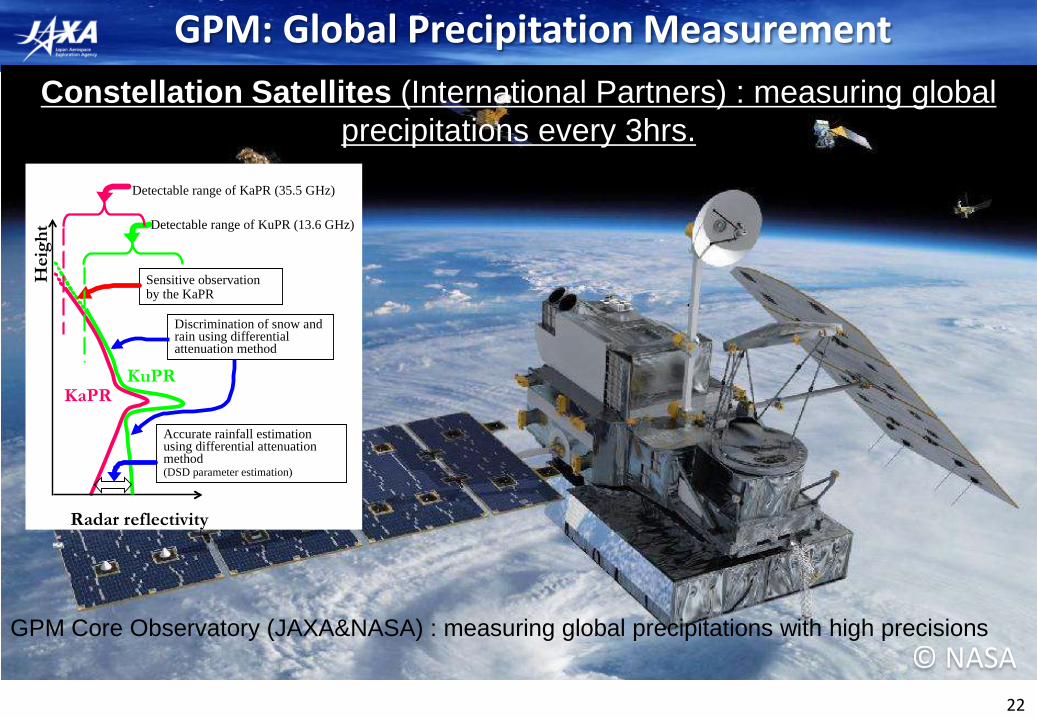
GPM: Global Precipitation Measurement
KaPR
Heig
ht
KuPR
Radar reflectivity
Accurate rainfall estimation using differential attenuation method (DSD parameter estimation)
Discrimination of snow and rain using differential attenuation method
Sensitive observation by the KaPR
Detectable range of KuPR (13.6 GHz)
Detectable range of KaPR (35.5 GHz)
GPM Core Observatory (JAXA&NASA) : measuring global precipitations with high precisions
Constellation Satellites (International Partners) : measuring global
precipitations every 3hrs.
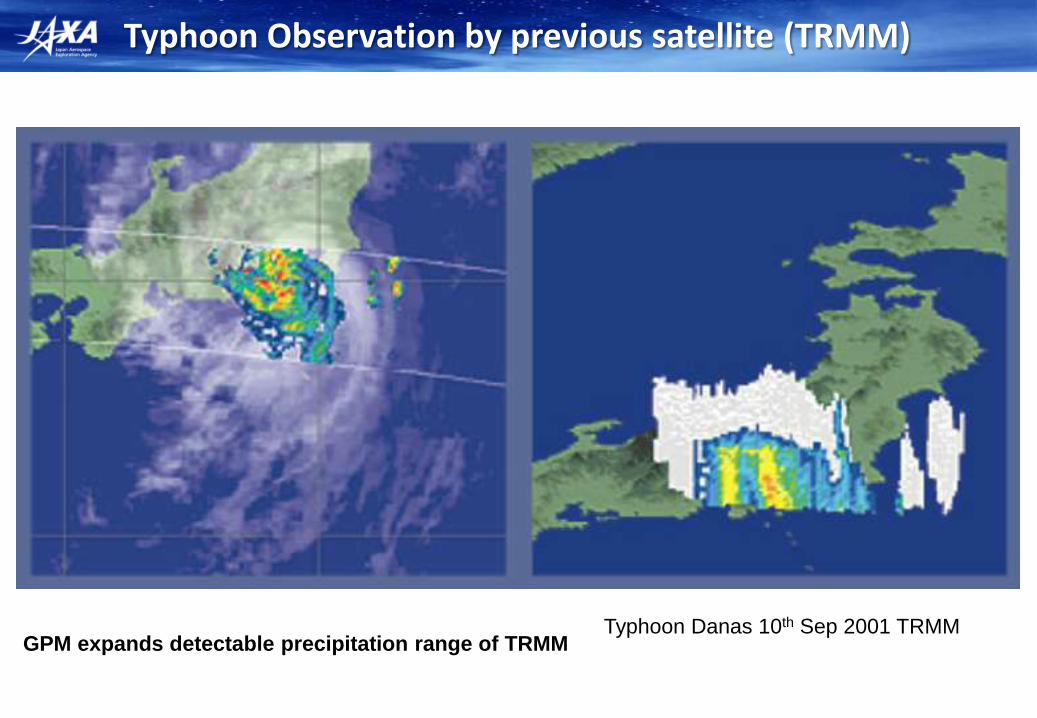
Typhoon Observation by previous satellite (TRMM)
Typhoon Danas 10th Sep 2001 TRMM GPM expands detectable precipitation range of TRMM

GPM Constellation Concept
Suomi NPP
(NASA/NOAA)
MetOp B/C
(EUMETSAT)
JPSS-1 (NOAA)
DMSP
F17/F18/F19/F20
(DOD) GCOM-W1 (JAXA)
NOAA 18/19
(NOAA)
Megha-Tropiques
(CNES/ISRO)
Next-Generation Unified Global Precipitation Products Using GPM Core Observatory as Reference 24
TRMM
(NASA/JAXA)
GPM Core Observatory
(NASA/JAXA, 2014 )
DPR (Ku & Ka band)
GMI (10-183 GHz)
65o Inclination
407 km altitude
5 km best footprint
Rain 0.2 – 110 mm/hr & snow
© NASA

GSMaP: Global Satellite Mapping of Precipitation
TRMM PR/TMI GPM DPR/GMI
Aqua AMSR-E GCOM-W AMSR2
Geostationary Satellite (Himawari)
GSMaP rainfall in 0.1-deg grid and hourly
DMSP SSM/I, SSMIS
Calculate cloud moving vectors
NOAA&MetOp AMSU-A/MHS
Satellite-based global hourly precipitation data of 10km grid
25 http://sharaku.eorc.jaxa.jp/GSMaP/
Different sensor merge
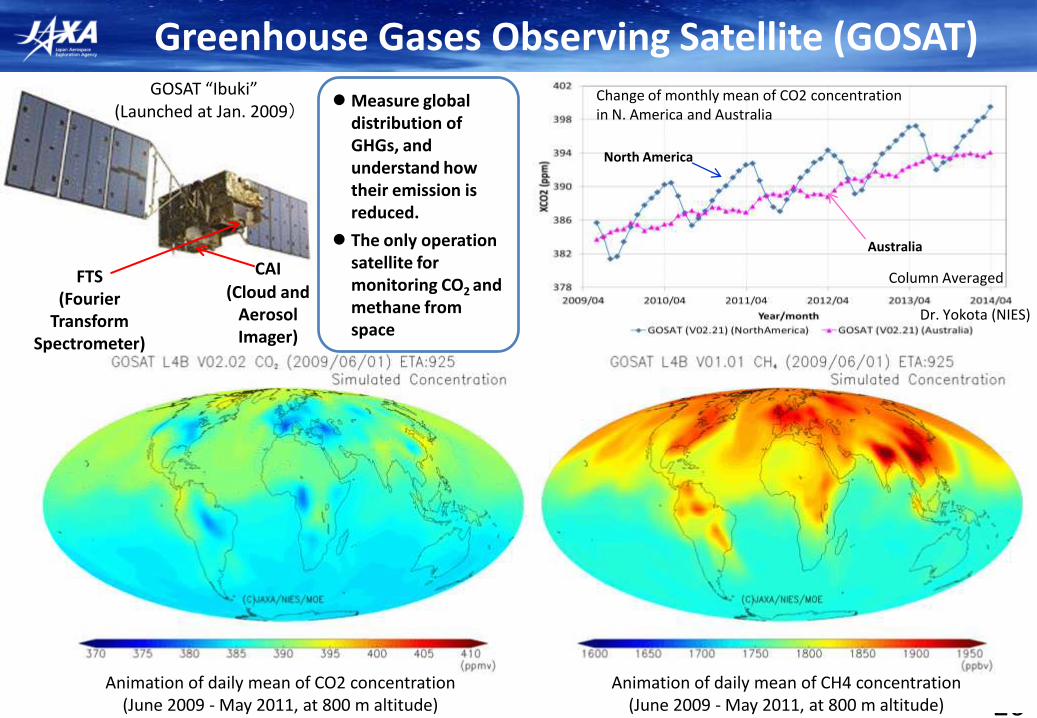
Greenhouse Gases Observing Satellite (GOSAT) GOSAT “Ibuki”
(Launched at Jan. 2009)
26
二酸化炭素全球分布の変化を把握
Measure global distribution of GHGs, and understand how their emission is reduced.
The only operation satellite for monitoring CO2 and methane from space
Dr. Yokota (NIES)
Change of monthly mean of CO2 concentration in N. America and Australia
Australia
Animation of daily mean of CO2 concentration (June 2009 - May 2011, at 800 m altitude)
Animation of daily mean of CH4 concentration (June 2009 - May 2011, at 800 m altitude)
FTS (Fourier
Transform Spectrometer)
CAI
(Cloud and Aerosol Imager)
North America
Column Averaged
27
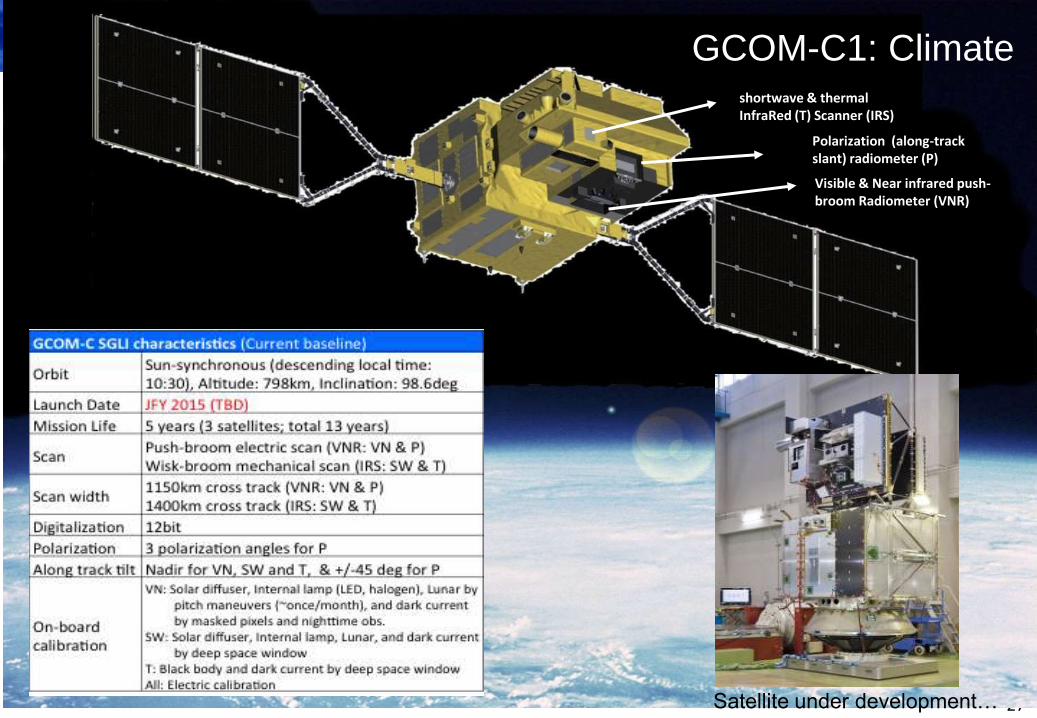
GCOM-C1: Climate
Visible & Near infrared push-broom Radiometer (VNR)
Polarization (along-track slant) radiometer (P)
shortwave & thermal InfraRed (T) Scanner (IRS)
Satellite under development…
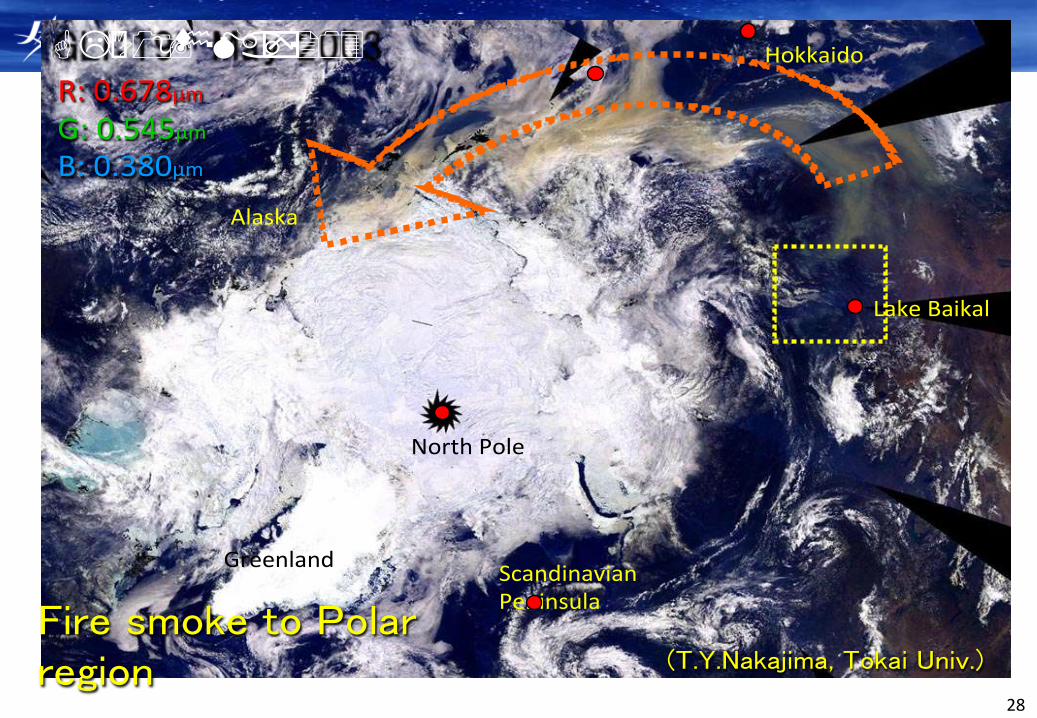
Greenland
NorthPole
Alaska
Hokkaido
ScandinavianPeninsula
GLI:19th May 2
0
03
R:0.678μmG:0.545μmB:0.380μm
LakeBaikal
Fire smoke to Polar region (T.Y.Nakajima, Tokai Univ.)
28

San Francisco ●
chl a (1km)
Results from previous sensor GLI, 250m ocean GLI 250m RGB:22/21/20,2003.5.26
29

EarthCARE (ESA/JAXA joint mission)
30
Atmospheric LIDAR (ATLID)
Cloud Profiling RADAR (CPR)
by JAXA/NICT
Multi-Spectral Imager (MSI)
Board Band Radiometer (BBR)
EarthCARE Satellite Courtesy of ESA
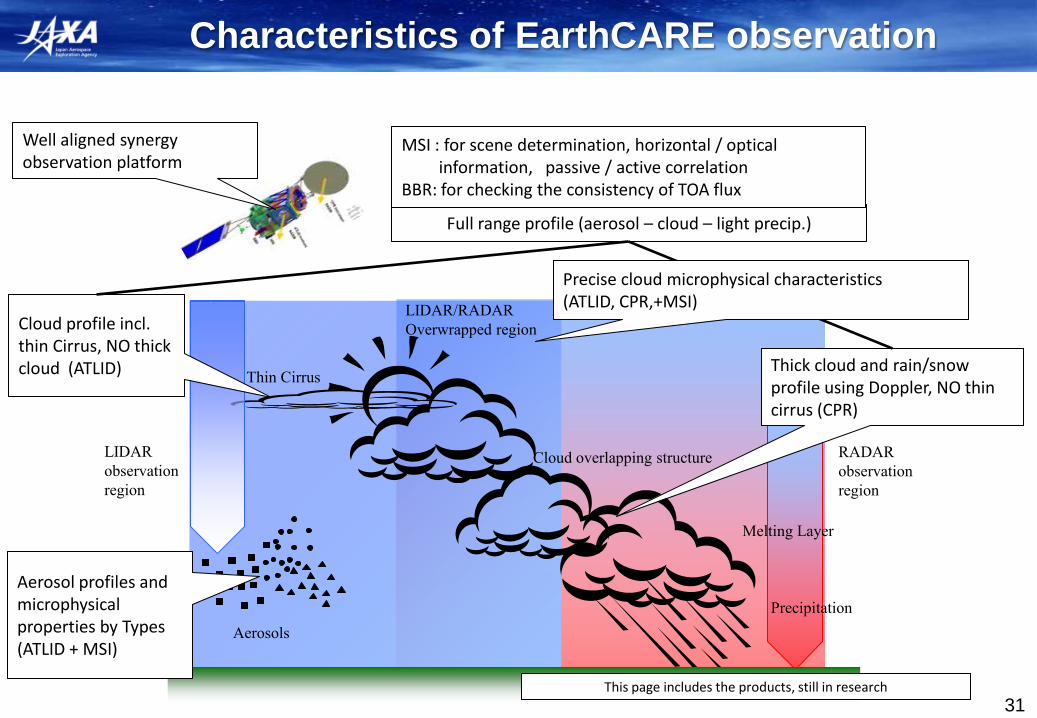
Characteristics of EarthCARE observation
31
Thin Cirrus
Aerosols
Cloud overlapping structure
Melting Layer
Precipitation
LIDAR
observation
region
RADAR
observation
region
LIDAR/RADAR
Overwrapped region
Aerosol profiles and microphysical properties by Types (ATLID + MSI)
Cloud profile incl. thin Cirrus, NO thick cloud (ATLID) Thick cloud and rain/snow
profile using Doppler, NO thin cirrus (CPR)
Full range profile (aerosol – cloud – light precip.)
Precise cloud microphysical characteristics (ATLID, CPR,+MSI)
MSI : for scene determination, horizontal / optical information, passive / active correlation BBR: for checking the consistency of TOA flux
This page includes the products, still in research
Well aligned synergy observation platform

Japanese Earth Observation Science infrastructure
32
EO Satellite System
In-Situ Obs.
Networks
Numerical Models
Super Computer “Kei”
for Model engine JMA – Models
CR-Models “NICAM”,”CReSS”
Climate Model “MIROC”,
“MIROC-ESM”
Universities networks
Operational networks
International networks
Ordinary Operational
Agencies
DIAS: DATA Integration and Analysis
System
J-Simulator: Multi Sensor Signal Simulator
Satellite System
ALOS, GCOM-W/-C, GPM, GOSAT,
EarthCARE
+ International System

MTS
AT
IR T
b (
10
.8 m
m)
Clo
ud
Sat/
CP
R (
94
GH
z)
Clo
ud
Res
olv
ing
Mo
del
(N
ICA
M)
+ J-
sim
ula
tor
(IR
Tb 1
0.8
μm
)
J-Si
mu
lato
r (C
PR
-Ref
lect
ivit
y)
Sensor signal simulation; “J-Simulator” COSP like tool
J-Si
mu
lato
r (C
PR
-Do
pp
ler
Vel
oci
ty)
Tropical Cyclone simulation (Nasuno et al.2009)
Tropical Cyclone case study
(Hashino, Satoh (U. Tokyo) and Kubota (JAXA))
Observation
CRM/Sensor Signal
Simulation
Global Cloud Resolving Model NICAM:Nonhydrostatic ICosahedral Atmospheric Model (Satoh et al. 2008)

Link to model community
VIS 0.62 mm Scene generator
COSP, ECSIM, Joint-Simulator
High resolution model; bin aerosol-
cloud model
NICAM global simulation:2008 TC Fengshen (Nasuno et al.
2009)
Hashino, M. Satoh (2012)
Summary
• Earth Science Observation requirements to Satellite Earth Observation are internationally discussed in IPCC/GCOS/CEOS/GEOSS framework. Especially for “climate” , we already have ECVs list, which is integrated physical parameter to be observed. Other we expect same procedure will be done in other Social Benefit Area.
• Simple “science to mission design procedure” was introduced
• Earth science (like water cycle) can not be sufficiently observed with single mission or satellite. So that, cooperation activity from planning phase is important.
• Current JAXA Earth Observation system and missions are introduced
• Not only space part, numerical model and in-situ observation links are crucial
Space Science School, 17-26 Oct, 2016 @ GISTDA, Si Racha 35

Space Science School, 17-26 Oct, 2016 @ GISTDA, Si Racha 36
HD Photo by SELENE spacecraft (JAXA)
Thank you !