From Preconception - Georgia Department of Public...
50
From Preconception To Infant Protection A Regional Look at Periods of Risk for Georgia’s Newborns
Transcript of From Preconception - Georgia Department of Public...

From Preconception
To Infant ProtectionA Regional Look at Periods of Risk for Georgia’s Newborns
Georgia Department of Public Health: Brenda Fitzgerald, M.D., Commissioner
Division of Health Promotion: Yvette Daniels, J.D., Director
Maternal and Child Health Program (MCH): Seema Csukas, M.D., Ph.D., Interim Director
MCH Epidemiology Office: Theresa Chapple-McGruder, Ph.D., M.P.H., Director
Commissioner’s Office: Chief of Staff Office of Health Indicators for Planning
Cobb/Douglas Health District
Porter Novelli
Healthcare Georgia Foundation
Suggested Citation:
Theresa Chapple-McGruder, Ph.D., Yueqin Zhou, M.A., Gordon Freymann, M.P.H., Brian Castrucci, M.A. From Preconception to Infant Protection. Georgia Department of Public Health, Maternal and Child Health Program, Office of Epidemiology, March 2012.
“From Preconception to Infant Protection” was funded in part by a grant from Healthcare Georgia Foundation.
ACKNOWLEDGEMENTS

Dear Fellow Georgians,
The Georgia Department of Public Health became its own agency July 1, 2011 and immediately began tackling issues to improve the health of Georgia’s communities and its entire population. One of these issues is infant mortality. The number of infant deaths within a community can be one of the best measures of health status and, sadly, Georgia’s infant mortality rate is higher than the national average.
In this publication, “From Preconception to Infant Protection: A Regional Look at Periods of Risk for Georgia’s Newborns,” we provide an in-depth analysis of the causes of infant mortality in Georgia and identify specific clusters throughout the state where most infant deaths occur.
It is our hope that this report provides you with a framework for understanding the problem and specific interventions to address these issues. This is our call to action to work together to reduce infant mortality and protect the health and well-being of families in our communities.
Success in meeting our priorities requires forging strong relationships among stakeholders, maximizing current programs and resources, and developing innovative initiatives. The Maternal and Child Health Program in the Georgia Department of Public Health will begin working with communities to significantly reduce infant mortality. I look forward to your partnership.
Sincerely,
Brenda Fitzgerald, MDCommissioner and State Health OfficerGeorgia Department of Public Health


Table of Contents
Introduction 1
Key Findings 3
Infant Mortality at the State Level 4 Infant Mortality at the Community Level Fulton, Douglas, Cobb, Clayton (Cluster A) 14 Bibb, Twiggs, Houston, Jones (Cluster B) 15 Muscogee, Chattahoochee (Cluster C) 16 Lowndes (Cluster D) 17 Richmond (Cluster E) 18 Chatham (Cluster F) 19 Perinatal Periods of Risk 20 Fulton, Douglas, Cobb, Clayton (Cluster A) 22 Bibb, Twiggs, Houston, Jones (Cluster B) 23 Muscogee, Chattahoochee (Cluster C) 24 Lowndes (Cluster D) 25 Richmond (Cluster E) 26 Chatham (Cluster F) 27 Implications for Georgia 28Methods 30Data 34Definitions 43


1
The number of infant deaths within a community can be one of the best measures of health status and is reflected in a community’s infant mortality rate (IMR). The IMR is defined as the number of infant deaths in the first year of life per 1,000 live births. From 2002 through 2006, the IMR for Georgia was 8.4 infant deaths per 1,000 live births. For the same time period, the US IMR decreased by 10% while Georgia’s IMR remained 15% to 20% greater than the national average and 42% higher than the Healthy People 2010 goal of reducing the average to 4.5 deaths per 1,000 live births. Infants who were Black, non-Hispanic experienced an IMR nearly two and a half times higher than infants who were White, non-Hispanic. When considering all Georgia births, two-thirds of infant deaths happened in the first 28 days of life, 54% of which occurred within the first week of life.
From 2002-2006, an infant died in Georgia every
7 hours and 36 minutes.

2
In an effort to understand Georgia’s IMR—a key first step in addressing the issues that contribute to it—this report details an analysis of the statewide picture of infant mortality in Georgia and within Georgia’s 18 public health districts and 159 counties and explores infant mortality clusters that exist outside of administrative boundaries within the state such as county, zip code and census tract. Further analyses outline geographical areas with disproportionally high IMR and excess death resulting from health and other factors from preconception through the first birthday, known as the perinatal periods of risk (PPOR) model. These analyses are provided to support targeted interventions as an effective means to reduce the state’s IMR.
3
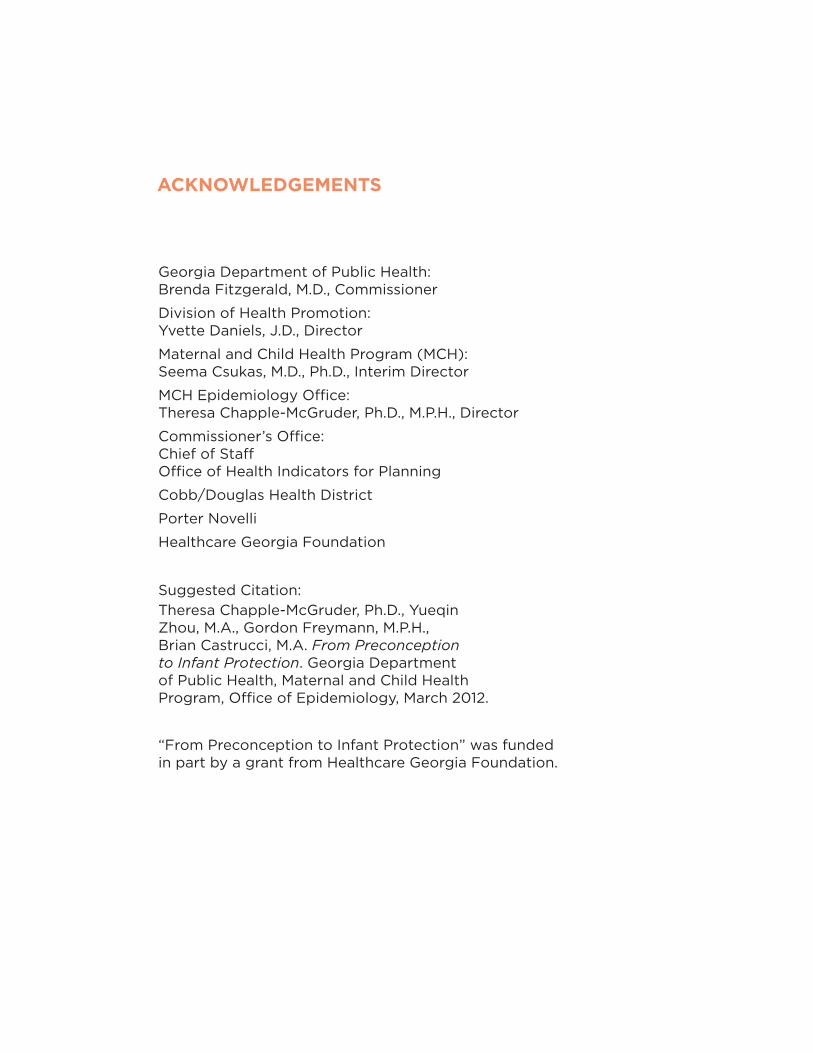
KEY FINDINGS
• In Georgia, the number one cause of infant mortality is disorders related to preterm birth and low birth weight.
• The three public health districts with the highest rates of infant mortality are: North Central, West Central and South.
• Analysis of the infant mortality rate ratio at the county level reveals concentrated areas of infant deaths that are disguised in health district level analyses. Smaller geographical level analyses aid in understanding areas and communities with high IMRs otherwise masked by examination from a county or district level.
• Six significant clusters of infant deaths were found across the state:
ClusterA:Fulton,Douglas,CobbandClaytonCounties ClusterB:Bibb,Twiggs,HoustonandJonesCounties ClusterC:MuscogeeandChattahoocheeCounties ClusterD:LowndesCounty ClusterE:RichmondCounty ClusterF:ChathamCounty
• In the region surrounding Lowndes County (Cluster D), the infant mortality rate was three times the national average; Richmond and Chatham Counties (Clusters E and F) were twice the national average.
• In the region of Bibb, Twiggs, Houston and Jones Counties (Cluster B), respiratory distress was the leading cause of death; this was the fifth leading cause statewide.
• Across all clusters studied, women were nearly two times less likely to have had adequate prenatal care compared to women whose infants celebrated a first birthday.
• Each of the six identified clusters is characterized by demographic information, causes of infant death, demographic and behavioral factors related to infant death and a PPOR analysis. Appropriate interventions to address the unique characteristics of infant mortality in each cluster are outlined.

4
Georgia’s infant mortality rate decreased from 8.7 infant deaths per 1000 live births in 2002 to 7.8 per 1000 in 2006. While most races experienced a decline in infant mortality rates, it did little to impact the existence of racial/ethnic disparities. Black non-Hispanics experienced an infant mortality rate nearly two and a half timeshigher than White non-Hispanics (See Figure 1). Two-thirds of infant deaths happen in the neonatal period, 54% of which occur withinthe first week of life (Figure 2).
Rates are infant (under 1 year) deaths per 1,000 live births. All racial groups are exclusive of the Hispanic ethnicity.
INFANT MORTALITY IN GEORGIA
Figure1.Infantmortalitybyrace/ethnicity,Georgia,2002–2006
Figure2.Percentofearlyneonatal,neonatal,andpostneonataldeaths,
Georgia,2002–2006
“Black non-Hispanics experienced an infant mortality rate nearly TWO & A HALF TIMES HIGHER than White non-Hispanics.”
2002
16
14
12
10
8
6
4
2
02003 2004
YEAR
RA
TE
2005 2006
StateWhiteBlackHispanicOther
33.4 53.8
12.8
Postneonatal Death (28–364 Days)
Neonatal Death (8–27 Days)
Early Neonatal Death (0–7 Days)
5
Rates are infant (under 1 year) deaths per 1,000 live births.
Table1.Infantmortalityratesforthe10leadingcausesofinfantdeath,Georgia,2002–2006
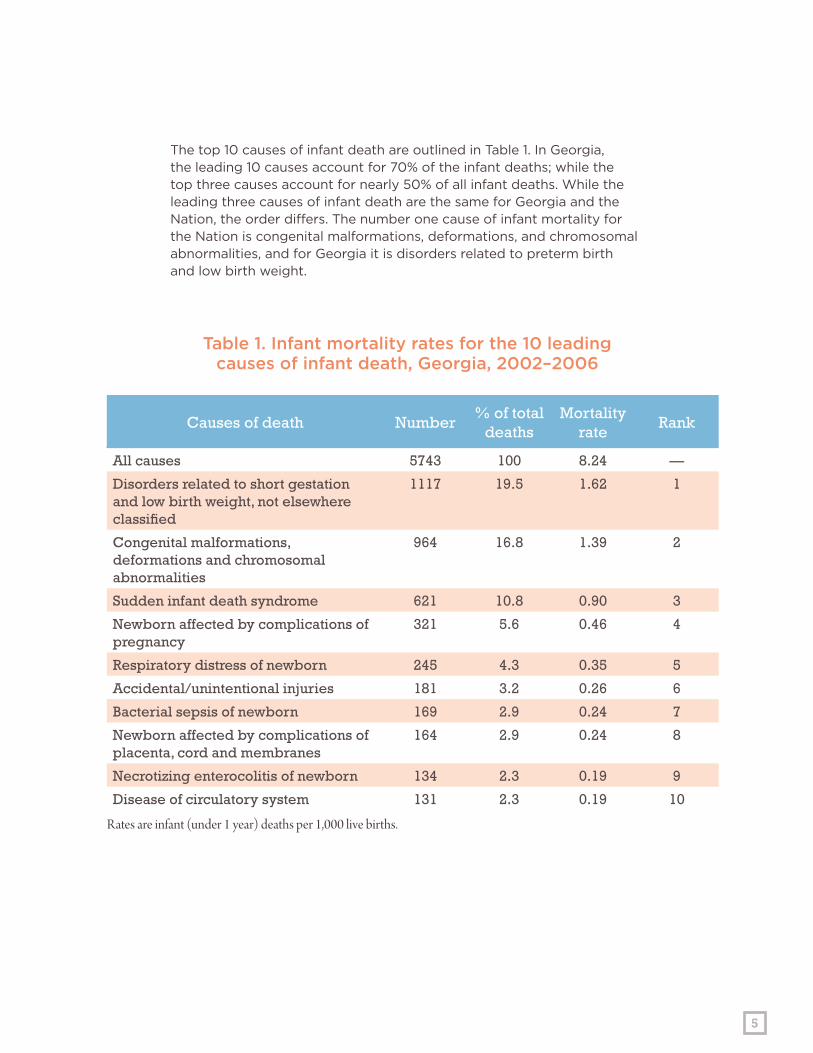
The top 10 causes of infant death are outlined in Table 1. In Georgia, the leading 10 causes account for 70% of the infant deaths; while the top three causes account for nearly 50% of all infant deaths. While the leading three causes of infant death are the same for Georgia and the Nation, the order differs. The number one cause of infant mortality for the Nation is congenital malformations, deformations, and chromosomal abnormalities, and for Georgia it is disorders related to preterm birth and low birth weight.
Causes of death Number% of total
deathsMortality
rateRank
All causes 5743 100 8.24 —
Disorders related to short gestation and low birth weight, not elsewhere classified
1117 19.5 1.62 1
Congenital malformations, deformations and chromosomal abnormalities
964 16.8 1.39 2
Sudden infant death syndrome 621 10.8 0.90 3
Newborn affected by complications of pregnancy
321 5.6 0.46 4
Respiratory distress of newborn 245 4.3 0.35 5
Accidental/unintentional injuries 181 3.2 0.26 6
Bacterial sepsis of newborn 169 2.9 0.24 7
Newborn affected by complications of placenta, cord and membranes
164 2.9 0.24 8
Necrotizing enterocolitis of newborn 134 2.3 0.19 9
Disease of circulatory system 131 2.3 0.19 10

6
“In Georgia, the leading causes of infant death are disorders related to preterm birth & low birth weight.”

7
Georgiaisdividedinto159countiesthatareaggregatedinto18PublicHealthDistricts(PHDs)
Georgia’s public health districtsFigure 3.
09-2
08-2
06-0
07-0
05-2
04-0
09-1
05-1
02-0
08-1
01-1
10-0
01-2
03-4
03-1
03-203-5
03-3
IM Rate Ratios by Public Health District
0.678571 - 0.785714
0.892857 - 0.976190
1.035714 - 1.107143
1.190476 - 1.285714
1.345238 - 1.452381
8
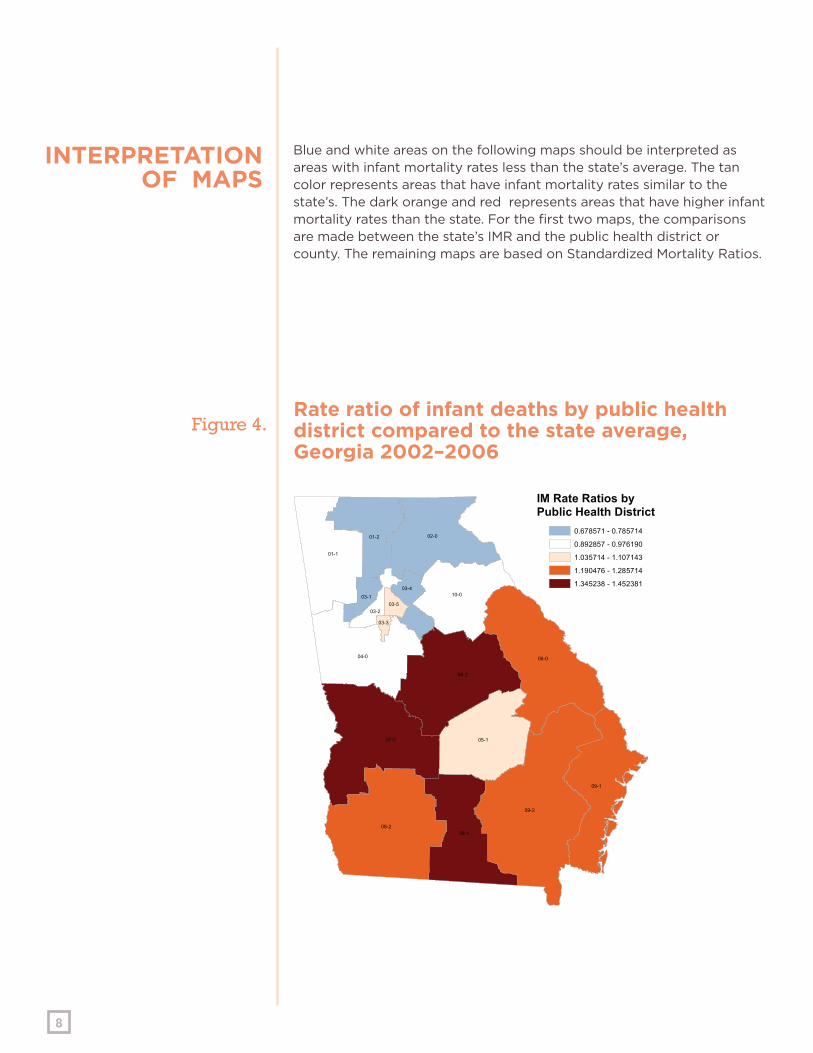
Rate ratio of infant deaths by public health district compared to the state average, Georgia 2002–2006
INTERPRETATIONOF MAPS
Blue and white areas on the following maps should be interpreted as areas with infant mortality rates less than the state’s average. The tan color represents areas that have infant mortality rates similar to the state’s. The dark orange and red represents areas that have higher infant mortality rates than the state. For the first two maps, the comparisons are made between the state’s IMR and the public health district or county. The remaining maps are based on Standardized Mortality Ratios.
Figure 4.
Ware
Burke
Clinch
Hall
Early
Laurens
Worth
Lee
Floyd
Wayne
Bulloch
Charlton
Coffee
Tift
Fulton
Long
Liberty
Screven
Decatur
Harris
Emanuel
Troup
Irwin
Bryan
Carroll
Dodge
Grady
Telfair
Colquitt
Camden
Wilkes
Polk
Brooks
Dooly
Tattnall
Appling
Thomas
Sumter
Mitchell
Bartow
Jones
Talbot
GilmerWalker
Cobb
Elbert
BerrienGlynn
Taylor
Echols
Stewart
Hart
Macon
Baker
Coweta
Washington
Wilcox
Jefferson
RabunFannin
Lowndes
Bibb
Union
Jasper
Terrell
Hancock
Brantley
Greene
Henry
Pierce
Crisp
Marion
Miller
Monroe
Twiggs
Upson
Pike
Murray
Gwinnett
Heard
Clay
Chatham
Effingham
Gordon
Walton
Wilkinson
Toombs
Putnam
Morgan
Jenkins
Meriwether
Houston
Bacon
Randolph
Cherokee
Cook
Turner
McIntosh
White
Jackson
Atkinson
Oglethorpe
Warren
Banks
Butts
DeKalb
Newton
Lincoln
Johnson
Paulding
Wheeler
Crawford
Pulaski
Jeff Davis
Baldwin
Calhoun
Whitfield
Madison
Lumpkin
Franklin
Forsyth
Ben Hill
Richmond
Dade
Columbia
Dougherty
Lanier
Candler
Haralson
Chattooga
McDuffie
Evans
Pickens
Lamar
Seminole
Towns
Fayette
Dawson
Bleckley
Webster
Schley
Treutlen
Douglas
Habersham
Peach
Oconee
Barrow
Spalding
Muscogee
Taliaferro
Catoosa
Stephens
Clayton
Quitman
Clarke
Chattahoochee
Glascock
Montgomery
Rockdale
Glynn
Camden
Chatham
McIntosh
IM Rate Ratios by County0.000000 - 0.357143
0.440476 - 0.964286
1.000000 - 1.380952
1.392857 - 1.940476
2.297619 - 3.440476
9
The five year infant mortality rates (IMR) range from 5.7 to 12.2 per 1,000 live births across Georgia’s 18 PHDs. Figure 5 displays the variance in rate ratios of the district infant mortality rates compared to the overall state rate of 8.24 per 1,000 live births. North Central, West Central and South health districts have the highest IMR compared to the state. Research has documented that having lower educational attainment, increased
poverty and being a member of a minority racial ethnic group places individuals at higher risk for poor birth outcomes. The PHD with the highest IMR had a poverty rate of twenty percent or greater compared to seventeen percent for the state. Those districts also had the highest percent of non-white racial/ethnic groups. The percent of educational attainment beyond high school varied by district, over eighty percent of residents
in Fulton, East Metro and DeKalb health districts have a high school education or higher compared to 71 percent for the state. South and West Central health districts have infant mortality rates exceeding 11 per 1,000 live births; greater than twenty percent of its residents below poverty and one-third of its residents attaining less than a high school education.
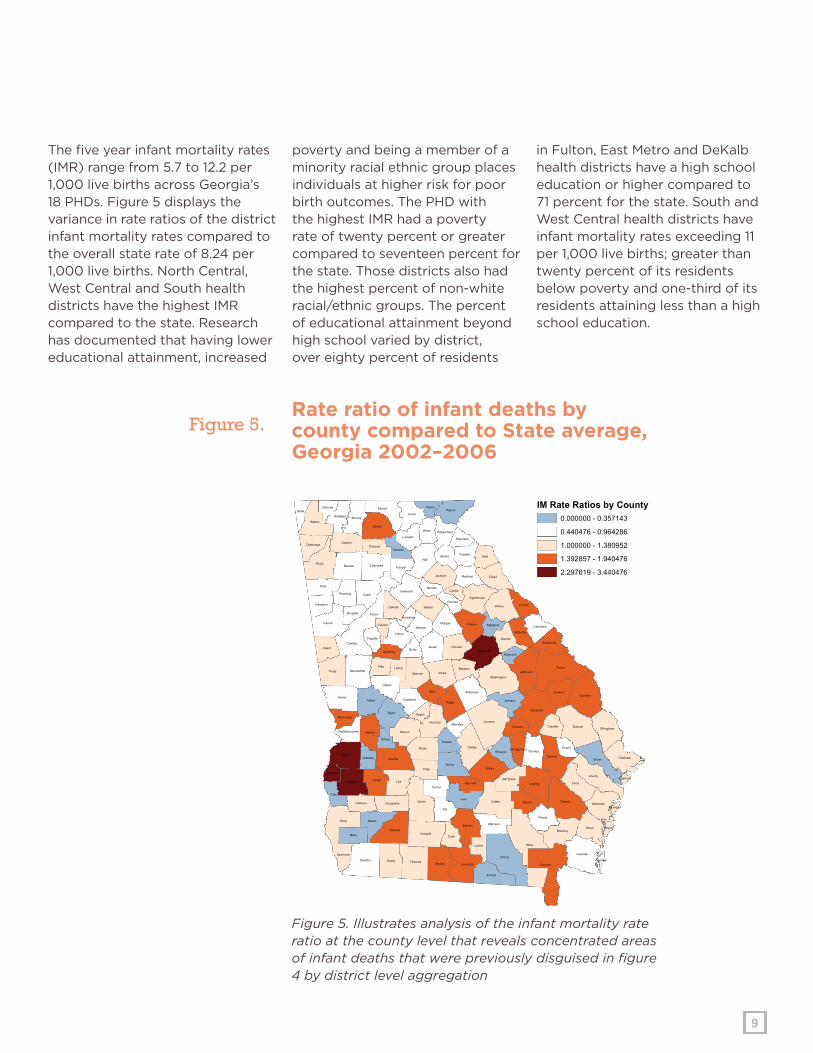
Rate ratio of infant deaths by county compared to State average, Georgia 2002–2006
Figure 5. Illustrates analysis of the infant mortality rate ratio at the county level that reveals concentrated areas of infant deaths that were previously disguised in figure 4 by district level aggregation
Figure 5.
10
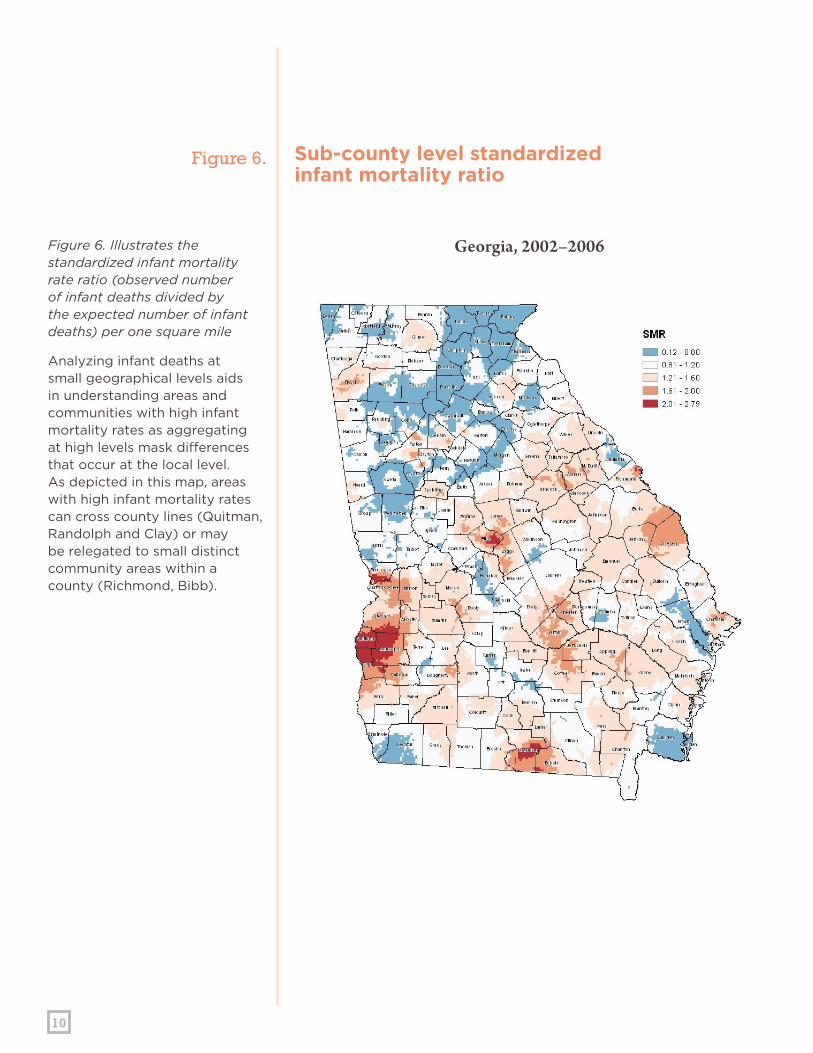
Georgia, 2002–2006Figure 6. Illustrates the standardized infant mortality rate ratio (observed number of infant deaths divided by the expected number of infant deaths) per one square mile
Analyzing infant deaths at small geographical levels aids in understanding areas and communities with high infant mortality rates as aggregating at high levels mask differences that occur at the local level. As depicted in this map, areas with high infant mortality rates can cross county lines (Quitman, Randolph and Clay) or may be relegated to small distinct community areas within a county (Richmond, Bibb).
Sub-county level standardized infant mortality ratio
Figure 6.
11
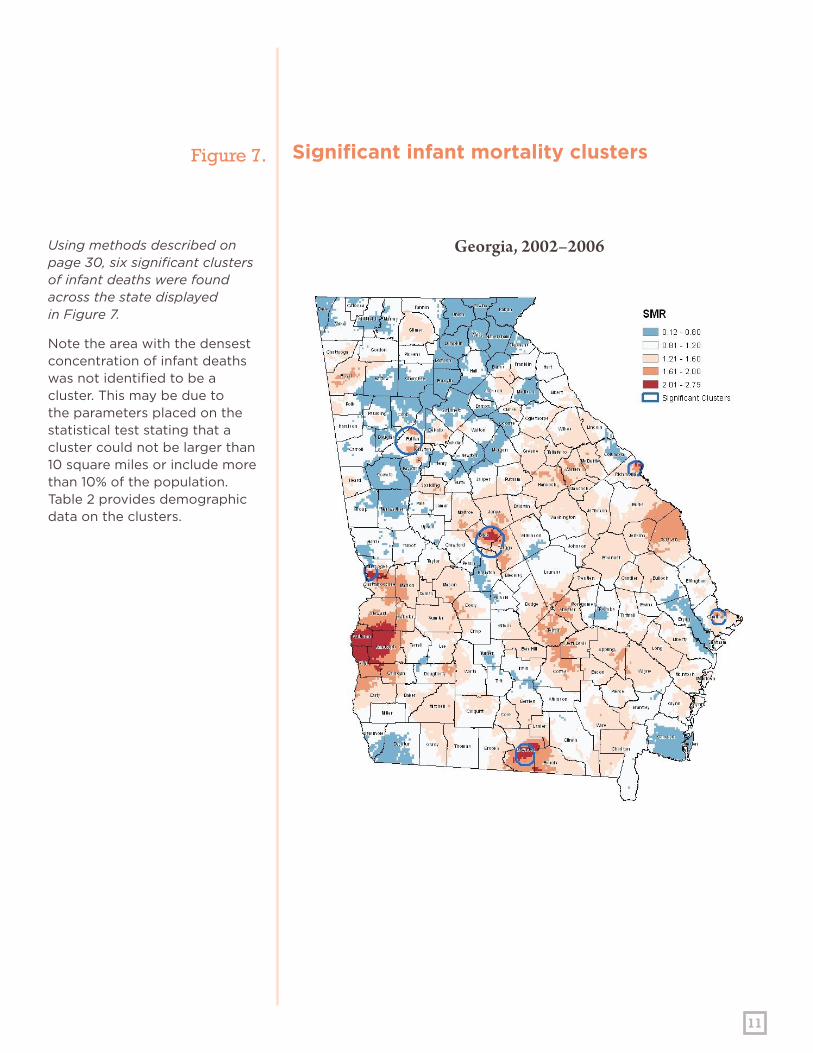
Georgia, 2002–2006Using methods described on page 30, six significant clusters of infant deaths were found across the state displayed in Figure 7.
Note the area with the densest concentration of infant deaths was not identified to be a cluster. This may be due to the parameters placed on the statistical test stating that a cluster could not be larger than 10 square miles or include more than 10% of the population. Table 2 provides demographic data on the clusters.
Significant infant mortality clustersFigure 7.

12
Georgia, 1997–2006This map displays seven clusters of neonatal mortality.
Notably, six of the seven clusters are the same as the infant mortality clusters. The cluster in DeKalb County is the only cluster that was not significant when examining infant death as a whole.
Significant clusters of neonatal mortality
Figure 8.

13
Georgia, 1997–2006Four significant clusters of postneonatal deaths were found across the state, all of which were in existing clusters of infant death.
Notable, significant postneonatal clusters were not found in Chatham or Richmond, suggesting that the infant death rates in these areas are driven mainly by the neonatal death rate.
Significant clusters of postneonatal mortality
Figure 9.
14
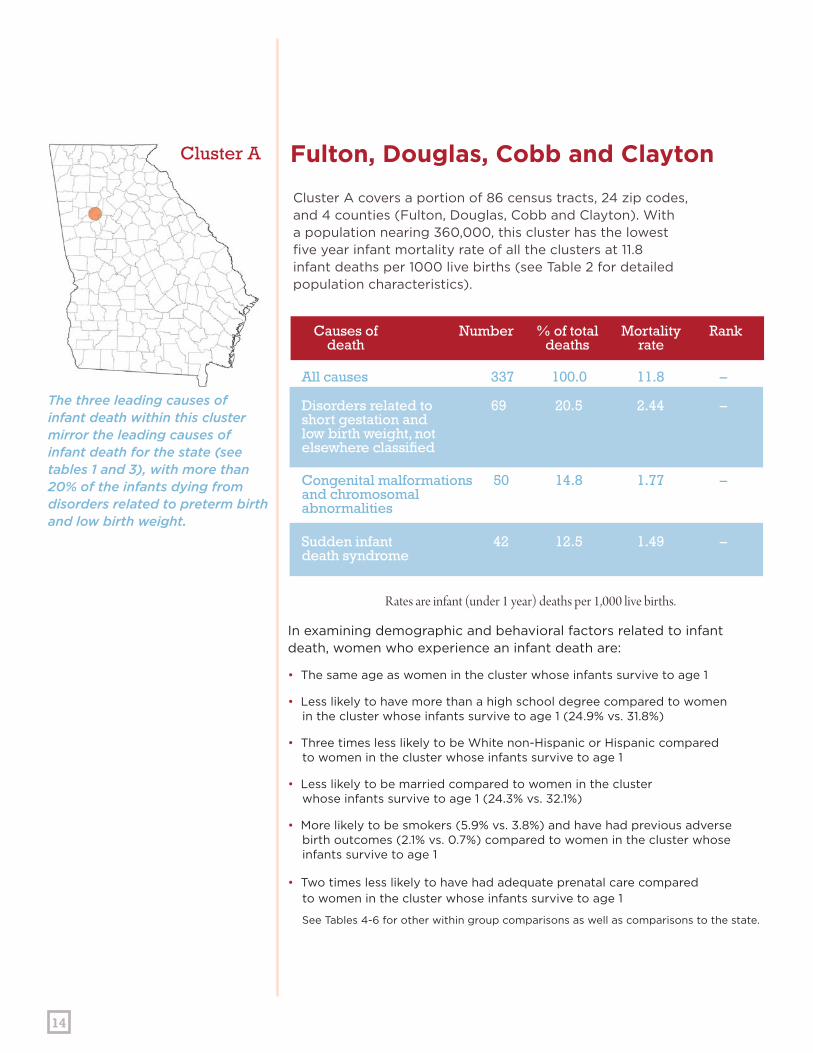
In examining demographic and behavioral factors related to infant death, women who experience an infant death are:
• The same age as women in the cluster whose infants survive to age 1
• Less likely to have more than a high school degree compared to women in the cluster whose infants survive to age 1 (24.9% vs. 31.8%)
• Three times less likely to be White non-Hispanic or Hispanic compared to women in the cluster whose infants survive to age 1
• Less likely to be married compared to women in the cluster whose infants survive to age 1 (24.3% vs. 32.1%)
• More likely to be smokers (5.9% vs. 3.8%) and have had previous adverse birth outcomes (2.1% vs. 0.7%) compared to women in the cluster whose infants survive to age 1
• Two times less likely to have had adequate prenatal care compared to women in the cluster whose infants survive to age 1
See Tables 4-6 for other within group comparisons as well as comparisons to the state.
The three leading causes of infant death within this cluster mirror the leading causes of infant death for the state (see tables 1 and 3), with more than 20% of the infants dying from disorders related to preterm birth and low birth weight.
Cluster A covers a portion of 86 census tracts, 24 zip codes, and 4 counties (Fulton, Douglas, Cobb and Clayton). With a population nearing 360,000, this cluster has the lowest five year infant mortality rate of all the clusters at 11.8 infant deaths per 1000 live births (see Table 2 for detailed population characteristics).
Fulton, Douglas, Cobb and ClaytonCluster A
Causes of death
Number Rank% of totaldeaths
Mortalityrate
All causes 337 100.0 11.8 –
Disorders related to 69 20.5 2.44 – short gestation and low birth weight, notelsewhere classified
Congenital malformations 50 14.8 1.77 – and chromosomalabnormalities
Sudden infant 42 12.5 1.49 – death syndrome
Rates are infant (under 1 year) deaths per 1,000 live births.

15
In examining demographic and behavioral factors related to infant death, women who experience an infant death are:
• More likely to be 19 years old or younger (24.7% vs. 17.6%) compared to women in the cluster whose infants survive to age 1
• Less likely to have more than a high school degree compared to women in the cluster whose infants survive to age 1 (16.8% vs. 29.8%)
• Less likely to be White non-Hispanic (20.0% vs. 31.4%) compared to women in the cluster whose infants survive to age 1
• Less likely to be married compared to women in the cluster whose infants survive to age 1 (24.3% vs. 32.1%)
• More likely to have had previous adverse birth outcomes (2.1% vs. 0.1%) compared to women in the cluster whose infants survive to age 1
• Two times less likely to have had adequate prenatal care compared to women in the cluster whose infants survive to age 1
See Tables 4-6 for other data within group comparisons as well as comparisons to the state.
The leading cause of infant death in this cluster was respiratory distress of the newborn accounting for 33 (17.4%) infant deaths. Respiratory distress of newborn was the fifth leading cause of infant death for the state (see Tables 1 and 3).
Cluster B covers a portion of 36 census tracts, 17 zip codes, and 4 counties (Bibb, Twiggs, Houston and Jones). With a population greater than 130,000, this cluster has a five year infant mortality rate of 14.7 infant deaths per 1000 live births, over two times the national average (see Table 2 for detailed population characteristics).
Bibb, Twiggs, Houston and JonesCluster B
Causes of death
Number Rank% of totaldeaths
Mortalityrate
All causes 190 100.0 14.7 –
Respiratory distress 33 17.4 2.59 – of newborn
Disorders related to short 29 15.3 2.28 – gestation and low birth weight, not elsewhere classified
Congenital malformations, 23 12.1 1.81 – chromosomal abnormalities
Rates are infant (under 1 year) deaths per 1,000 live births.
16
Rates are infant (under 1 year) deaths per 1,000 live births.
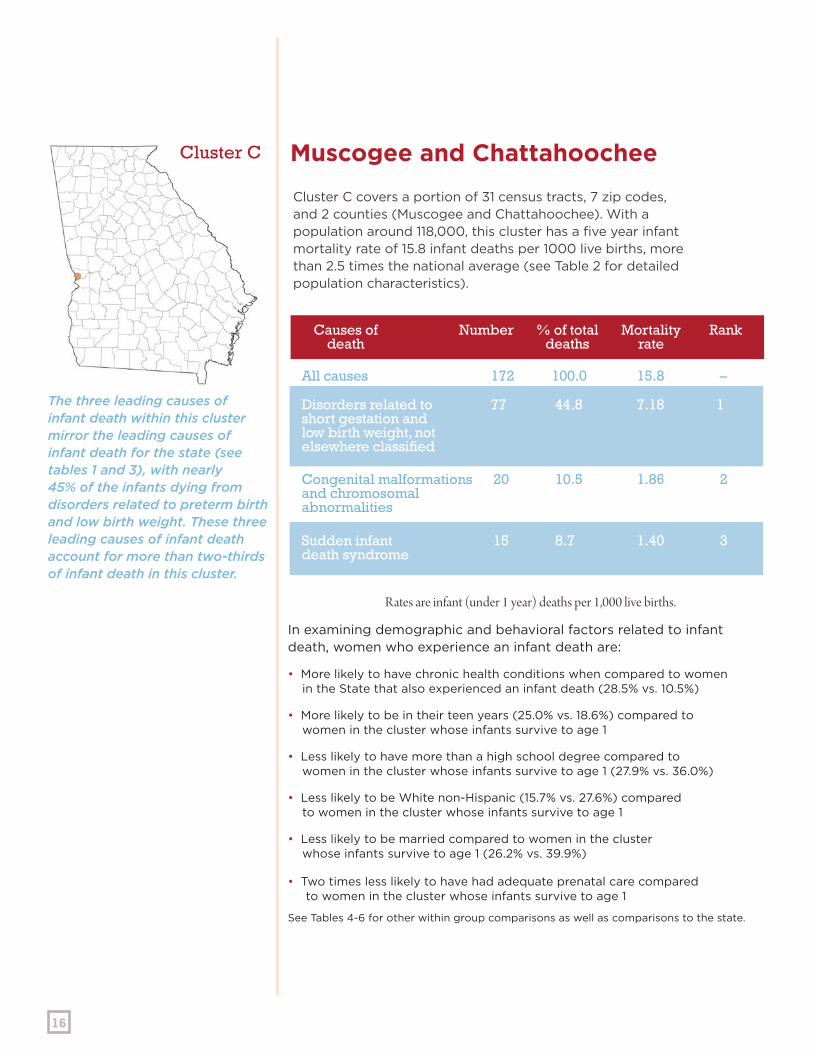
In examining demographic and behavioral factors related to infant death, women who experience an infant death are:
• More likely to have chronic health conditions when compared to women in the State that also experienced an infant death (28.5% vs. 10.5%)
• More likely to be in their teen years (25.0% vs. 18.6%) compared to women in the cluster whose infants survive to age 1
• Less likely to have more than a high school degree compared to women in the cluster whose infants survive to age 1 (27.9% vs. 36.0%)
• Less likely to be White non-Hispanic (15.7% vs. 27.6%) compared to women in the cluster whose infants survive to age 1
• Less likely to be married compared to women in the cluster whose infants survive to age 1 (26.2% vs. 39.9%)
• Two times less likely to have had adequate prenatal care compared to women in the cluster whose infants survive to age 1 See Tables 4-6 for other within group comparisons as well as comparisons to the state.
The three leading causes of infant death within this cluster mirror the leading causes of infant death for the state (see tables 1 and 3), with nearly 45% of the infants dying from disorders related to preterm birth and low birth weight. These three leading causes of infant death account for more than two-thirds of infant death in this cluster.
Cluster C covers a portion of 31 census tracts, 7 zip codes, and 2 counties (Muscogee and Chattahoochee). With a population around 118,000, this cluster has a five year infant mortality rate of 15.8 infant deaths per 1000 live births, more than 2.5 times the national average (see Table 2 for detailed population characteristics).
Muscogee and ChattahoocheeCluster C
Causes of death
Number Rank% of totaldeaths
Mortalityrate
All causes 172 100.0 15.8 –
Disorders related to 77 44.8 7.18 1short gestation and low birth weight, notelsewhere classified
Congenital malformations 20 10.5 1.86 2 and chromosomalabnormalities
Sudden infant 15 8.7 1.40 3 death syndrome
17
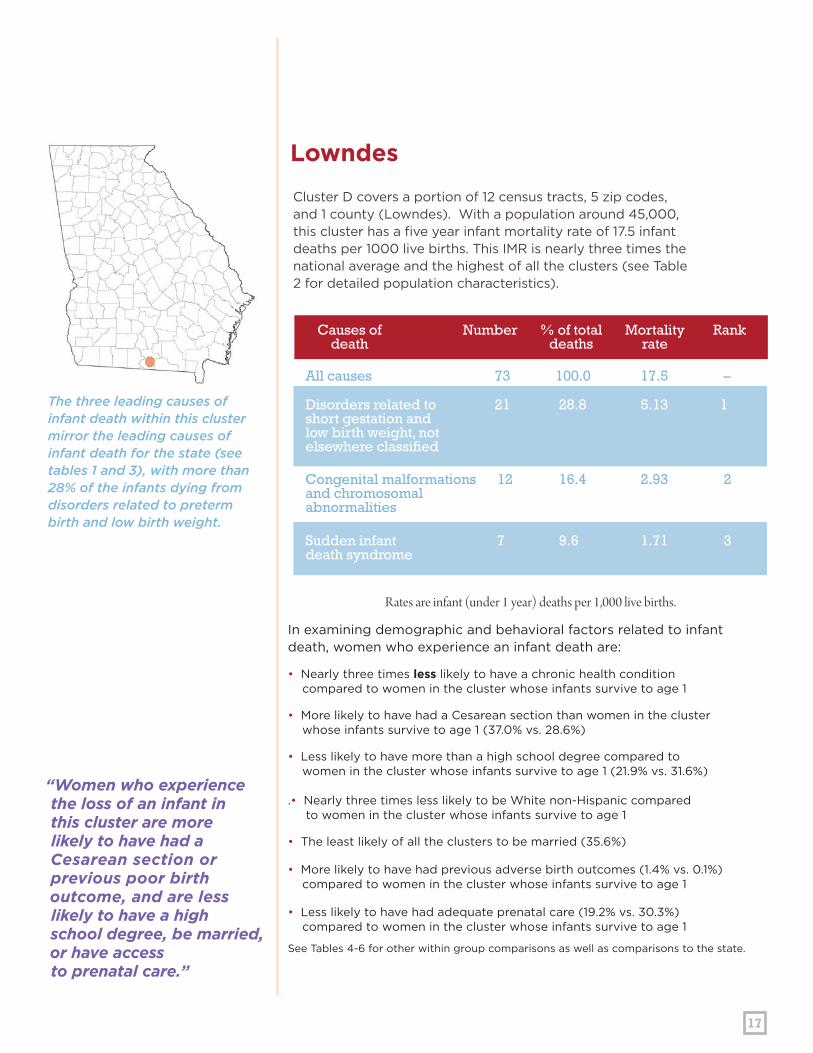
“Women who experience the loss of an infant in this cluster are more likely to have had a Cesarean section or previous poor birth outcome, and are less likely to have a high school degree, be married, or have access to prenatal care.”
In examining demographic and behavioral factors related to infant death, women who experience an infant death are:
• Nearly three times less likely to have a chronic health condition compared to women in the cluster whose infants survive to age 1
• More likely to have had a Cesarean section than women in the cluster whose infants survive to age 1 (37.0% vs. 28.6%)
• Less likely to have more than a high school degree compared to women in the cluster whose infants survive to age 1 (21.9% vs. 31.6%) .• Nearly three times less likely to be White non-Hispanic compared to women in the cluster whose infants survive to age 1
• The least likely of all the clusters to be married (35.6%)
• More likely to have had previous adverse birth outcomes (1.4% vs. 0.1%) compared to women in the cluster whose infants survive to age 1
• Less likely to have had adequate prenatal care (19.2% vs. 30.3%) compared to women in the cluster whose infants survive to age 1
See Tables 4-6 for other within group comparisons as well as comparisons to the state.
The three leading causes of infant death within this cluster mirror the leading causes of infant death for the state (see tables 1 and 3), with more than 28% of the infants dying from disorders related to preterm birth and low birth weight.
Cluster D covers a portion of 12 census tracts, 5 zip codes, and 1 county (Lowndes). With a population around 45,000, this cluster has a five year infant mortality rate of 17.5 infant deaths per 1000 live births. This IMR is nearly three times the national average and the highest of all the clusters (see Table 2 for detailed population characteristics).
LowndesCluster D
Causes of death
Number Rank% of totaldeaths
Mortalityrate
All causes 73 100.0 17.5 –
Disorders related to 21 28.8 5.13 1short gestation and low birth weight, notelsewhere classified
Congenital malformations 12 16.4 2.93 2 and chromosomalabnormalities
Sudden infant 7 9.6 1.71 3 death syndrome
Rates are infant (under 1 year) deaths per 1,000 live births.

18
Rates are infant (under 1 year) deaths per 1,000 live births.
In examining demographic and behavioral factors related to infant death, women who experience an infant death are:
• More likely to have had a Cesarean Section than women in the cluster whose infants survive to age 1 (43.4% vs. 27.6%)
• More likely to have less than a high school degree compared to women in the cluster who’s infants survive to age 1 (45.5% vs. 32.0%)
• Two and a half time less likely to be White non-Hispanic compared to women in the cluster whose infants survive to age 1.)
• Less likely to be married compared to women in the cluster whose infants survive to age 1 (15.2% vs. 28.8%)
• Two times less likely to have had adequate prenatal care compared to women in the cluster whose infants survive to age 1
See Tables 4-6 for other within group comparisons as well as comparisons to the state.
The three leading causes of infant death within this cluster are the same as the state’s, however the order differs. SIDS is the third leading cause of infant death for the state, but the second leading cause of death for this cluster (see tables 1 and 3).
Cluster E covers a portion of 28 census tracts, 6 zip codes, and 1 county (Richmond). With a population greater than 133,000, this cluster has a five year infant mortality rate of 15.1 infant deaths per 1000 live births, more than two times the national average (see Table 2 for detailed population characteristics).
RichmondCluster E
Causes of death
Number Rank% of totaldeaths
Mortalityrate
All causes 99 100.0 15.1 –
Disorders related to 20 20.2 3.09 1short gestation and low birth weight, notelsewhere classified
Sudden infant 14 14.1 2.16 2 death syndrome (SIDS)
Congenital malformations 13 13.1 2.01 3 and chromosomalabnormalities
19
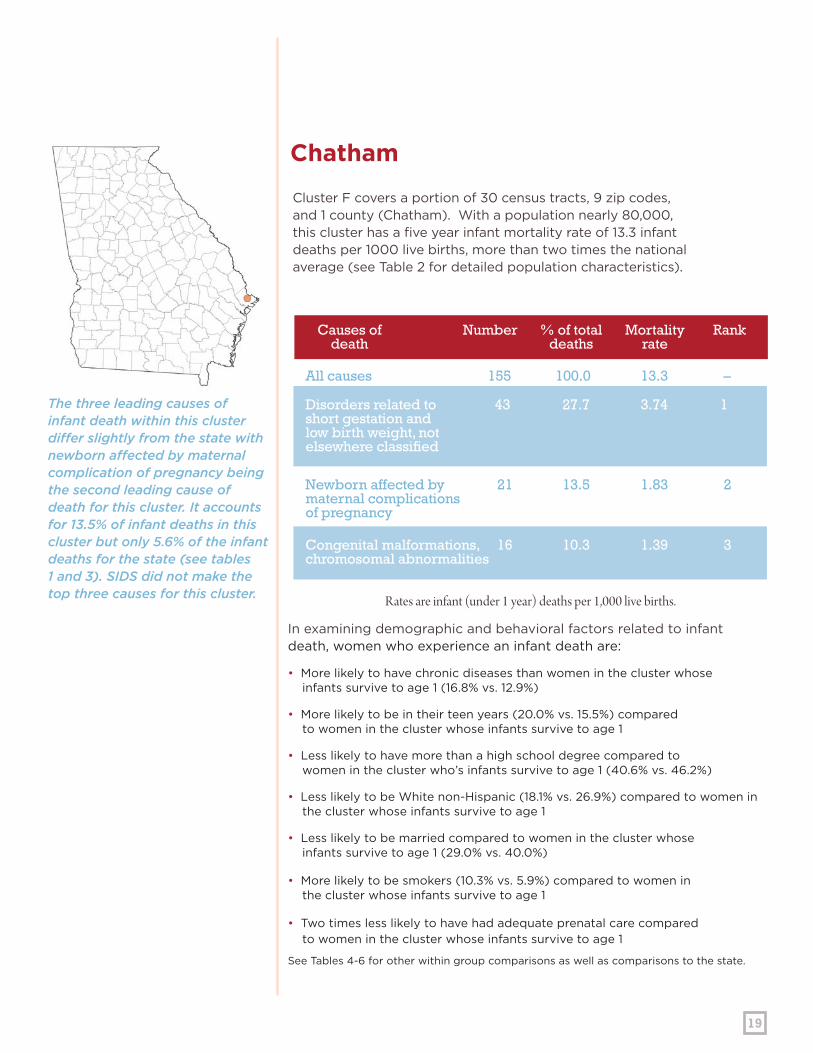
In examining demographic and behavioral factors related to infant death, women who experience an infant death are:
• More likely to have chronic diseases than women in the cluster whose infants survive to age 1 (16.8% vs. 12.9%)
• More likely to be in their teen years (20.0% vs. 15.5%) compared to women in the cluster whose infants survive to age 1
• Less likely to have more than a high school degree compared to women in the cluster who’s infants survive to age 1 (40.6% vs. 46.2%)
• Less likely to be White non-Hispanic (18.1% vs. 26.9%) compared to women in the cluster whose infants survive to age 1
• Less likely to be married compared to women in the cluster whose infants survive to age 1 (29.0% vs. 40.0%)
• More likely to be smokers (10.3% vs. 5.9%) compared to women in the cluster whose infants survive to age 1
• Two times less likely to have had adequate prenatal care compared to women in the cluster whose infants survive to age 1
See Tables 4-6 for other within group comparisons as well as comparisons to the state.
The three leading causes of infant death within this cluster differ slightly from the state with newborn affected by maternal complication of pregnancy being the second leading cause of death for this cluster. It accounts for 13.5% of infant deaths in this cluster but only 5.6% of the infant deaths for the state (see tables 1 and 3). SIDS did not make the top three causes for this cluster.
Cluster F covers a portion of 30 census tracts, 9 zip codes, and 1 county (Chatham). With a population nearly 80,000, this cluster has a five year infant mortality rate of 13.3 infant deaths per 1000 live births, more than two times the national average (see Table 2 for detailed population characteristics).
ChathamCluster F
Causes of death
Number Rank% of totaldeaths
Mortalityrate
All causes 155 100.0 13.3 –
Disorders related to 43 27.7 3.74 1short gestation and low birth weight, notelsewhere classified
Newborn affected by 21 13.5 1.83 2 maternal complications of pregnancy
Congenital malformations, 16 10.3 1.39 3 chromosomal abnormalities
Rates are infant (under 1 year) deaths per 1,000 live births.
20
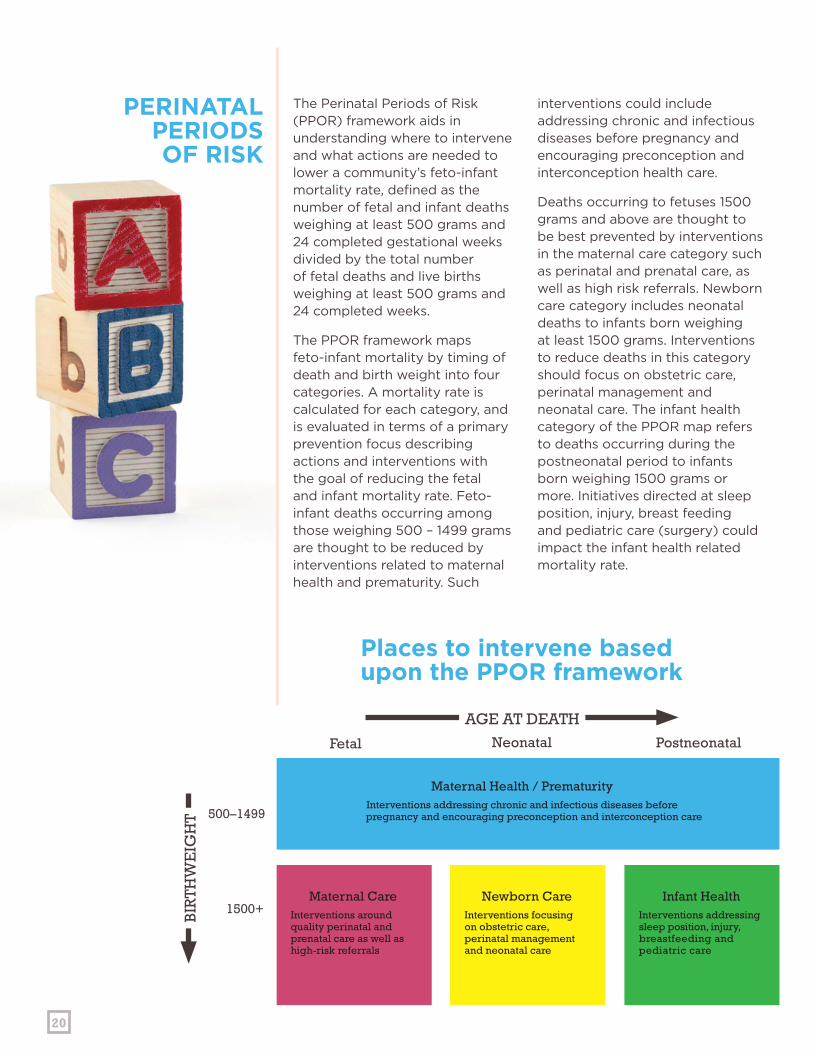
PERINATAL PERIODSOF RISK
The Perinatal Periods of Risk (PPOR) framework aids in understanding where to intervene and what actions are needed to lower a community’s feto-infant mortality rate, defined as the number of fetal and infant deaths weighing at least 500 grams and 24 completed gestational weeks divided by the total number of fetal deaths and live births weighing at least 500 grams and 24 completed weeks.
The PPOR framework maps feto-infant mortality by timing of death and birth weight into four categories. A mortality rate is calculated for each category, and is evaluated in terms of a primary prevention focus describing actions and interventions with the goal of reducing the fetal and infant mortality rate. Feto-infant deaths occurring among those weighing 500 – 1499 grams are thought to be reduced by interventions related to maternal health and prematurity. Such
interventions could include addressing chronic and infectious diseases before pregnancy and encouraging preconception and interconception health care.
Deaths occurring to fetuses 1500 grams and above are thought to be best prevented by interventions in the maternal care category such as perinatal and prenatal care, as well as high risk referrals. Newborn care category includes neonatal deaths to infants born weighing at least 1500 grams. Interventions to reduce deaths in this category should focus on obstetric care, perinatal management and neonatal care. The infant health category of the PPOR map refers to deaths occurring during the postneonatal period to infants born weighing 1500 grams or more. Initiatives directed at sleep position, injury, breast feeding and pediatric care (surgery) could impact the infant health related mortality rate.
AGE AT DEATH
500–1499
1500+
Fetal Neonatal Postneonatal
BIR
TH
WE
IGH
T
Places to intervene basedupon the PPOR framework
Maternal Health / PrematurityInterventions addressing chronic and infectious diseases before
pregnancy and encouraging preconception and interconception care
Maternal CareInterventions around quality perinatal and prenatal care as well as high-risk referrals
Newborn CareInterventions focusing on obstetric care, perinatal management and neonatal care
Infant HealthInterventions addressing sleep position, injury, breastfeeding and pediatric care

21
AGE AT DEATHFetal
500–1499
1500+
Maternal Care
Newborn Care
Infant Health
Neonatal
Maternal Health/Prematurity
1.30
0.34 1.070.71
Postneonatal
BIR
TH
WE
IGH
T
AGE AT DEATHFetal
500–1499
1500+
Maternal Care
Newborn Care
Infant Health
Neonatal
Maternal Health/Prematurity
Postneonatal
BIR
TH
WE
IGH
T
PPOR map
Rates for the referent population
Figure 1.
Figure 2.

22
Rates are infant (under 1 year) deaths per 1,000 live births.
Cluster A has a feto-infant mortality rate of 9.69 per 1000 live births plus fetal deaths, with nearly 5 deaths per 1000 occurring within the maternal health/prematurity category. Excess deaths are seen in all categories, although negligible for newborn care. Of the 5 deaths per 1000 in the maternal health/prematurity category, it is hypothesized that 3.5 deaths per 1000 could be prevented if the feto-infant mortality rate of the referent group were attained by women in this cluster.
In this cluster, nearly 2 deaths per thousand were due to preventable causes like SIDS, unintentional injury and homicide.
AGE AT DEATHFetal
500–1499
1500+
Maternal Care
Newborn Care
Infant Health
Neonatal
Maternal Health/Prematurity
4.82
0.46 2.891.52
Postneonatal
BIR
TH
WE
IGH
T
Maternal Care
Newborn Care
Infant Health
Maternal Health/Prematurity
AGE AT DEATHFetal
500–1499
1500+
Neonatal
3.52
0.12 1.820.81
Postneonatal
BIR
TH
WE
IGH
TNearly 2 excess deaths per 1000 occurred in the infant health category.
Preventable deaths in this category included SIDS deaths (N=40), unintentional injuries (N=10) and homicides (N=4).
To impact the feto-infant mortality rate of this cluster, interventions are needed that address preconception health, intendedness of pregnancies, perinatal health, infant health and safety.
Fulton, Douglas, Cobb and ClaytonCluster A
Overall feto-infant mortality rates
Excess feto-infant mortality rates
23
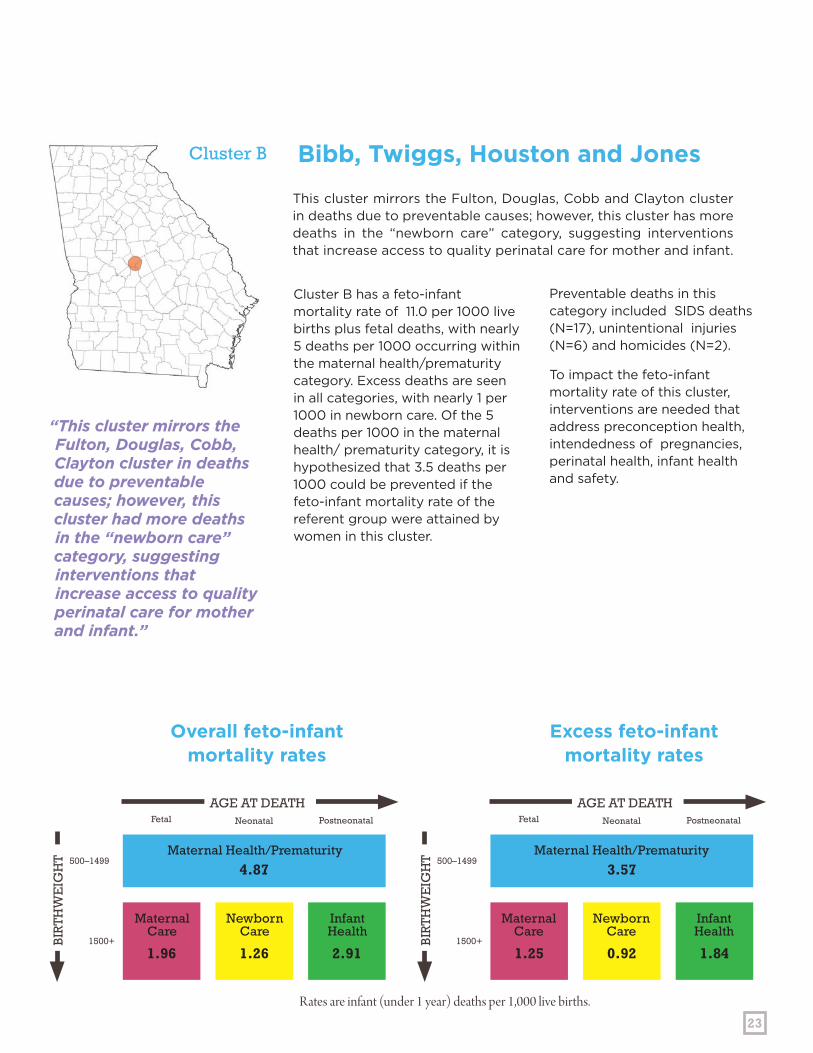
Cluster B has a feto-infant mortality rate of 11.0 per 1000 live births plus fetal deaths, with nearly 5 deaths per 1000 occurring within the maternal health/prematurity category. Excess deaths are seen in all categories, with nearly 1 per 1000 in newborn care. Of the 5 deaths per 1000 in the maternal health/ prematurity category, it is hypothesized that 3.5 deaths per 1000 could be prevented if the feto-infant mortality rate of the referent group were attained by women in this cluster.
This cluster mirrors the Fulton, Douglas, Cobb and Clayton cluster in deaths due to preventable causes; however, this cluster has more deaths in the “newborn care” category, suggesting interventions that increase access to quality perinatal care for mother and infant.
Maternal Care
Maternal Care
Newborn Care
Newborn Care
Infant Health
Infant Health
Maternal Health/Prematurity Maternal Health/Prematurity
AGE AT DEATHFetal
500–1499
1500+
Neonatal
4.87
1.26 2.911.96
Postneonatal
BIR
TH
WE
IGH
T
AGE AT DEATHFetal
500–1499
1500+
Neonatal
3.57
0.92 1.841.25
Postneonatal
BIR
TH
WE
IGH
T
Preventable deaths in this category included SIDS deaths (N=17), unintentional injuries (N=6) and homicides (N=2).
To impact the feto-infant mortality rate of this cluster, interventions are needed that address preconception health, intendedness of pregnancies, perinatal health, infant health and safety.
Bibb, Twiggs, Houston and JonesCluster B
“This cluster mirrors the Fulton, Douglas, Cobb, Clayton cluster in deaths due to preventable causes; however, this cluster had more deaths in the “newborn care” category, suggesting interventions that increase access to quality perinatal care for mother and infant.”
Overall feto-infant mortality rates
Excess feto-infant mortality rates
Rates are infant (under 1 year) deaths per 1,000 live births.

24
Rates are infant (under 1 year) deaths per 1,000 live births.
Cluster C has a feto-infant mortality rate of 9.41 per 1000 live births plus fetal deaths, with 3.6 deaths per 1000 occurring within the maternal health/prematurity category. Excess deaths are seen in all categories, with 0.6 per 1000 in newborn care. Of the 3.6 deaths per 1000 in the maternal health/prematurity category, it is hypothesized that 2.3 deaths per 1000 could be prevented if the feto-infant mortality rate of the referent group were attained by women in this cluster.
The infant health cell includes only live births born at a moderate to normal birth weight. In general,
Typically speaking, women are more likely to have a miscarriage of an infant who never reaches 1500 grams than experience the death of an infant weighing more than 1500 grams at birth. In the Muscogee and Chattahoochee cluster however, these rates are very similar: greater than 3 deaths per thousand.
AGE AT DEATHFetal
500–1499
1500+
Neonatal
3.63
0.93 3.361.49
Postneonatal
BIR
TH
WE
IGH
T
AGE AT DEATHFetal
500–1499
1500+
Neonatal
2.33
0.59 2.290.78
Postneonatal
BIR
TH
WE
IGH
TIt is rare that the infant health category is as high as the maternal health/ prematurity category, due to the maternal health category including deaths that occur during the fetal, neonatal and postneonatal periods.
these infants have a greater probability of surviving when compared to the maternal health/prematurity category. In Cluster C, nearly 3.4 deaths per 1000 occurred in the infant health category, preventable deaths in this category included SIDS deaths (N=14), unintentional injuries (N=6) and homicides (N=2).
To impact the feto-infant mortality rate of this cluster, interventions are needed that address preconception health, intendedness of pregnancies, perinatal health, infant health and safety.
Muscogee and ChattahoocheeCluster C
Maternal Care
Maternal Care
Newborn Care
Newborn Care
Infant Health
Infant Health
Maternal Health/PrematurityMaternal Health/Prematurity
Overall feto-infant mortality rates
Excess feto-infant mortality rates

25
Cluster D has the highest feto-infant mortality rate of all the clusters, at 13.93 per 1000 live births plus fetal deaths, with 6.11 deaths per 1000 occurring within the maternal health/prematurity category. Excess deaths are notable in all categories, with 1.12 per 1000 in newborn care. Of the 6.11 deaths per 1000 in the maternal health/prematurity category, it is hypothesized that approximately 5 deaths per 1000 could be prevented if the feto-infant mortality rate of the referent group were attained by women in this cluster.
The Lowndes cluster has the highest rate of infant mortality with 13.93 deaths per 1,000 live births. With high rates across all categories, a comprehensive approach to intervention is needed.
AGE AT DEATHFetal
500–1499
1500+
Neonatal
6.11
1.47 4.152.20
Postneonatal
BIR
TH
WE
IGH
T
AGE AT DEATHFetal
500–1499
1500+
Neonatal
4.81
1.13 3.081.49
Postneonatal
BIR
TH
WE
IGH
T“While it is uncommon for each cell in the PPOR map to have such high rates of feto-infant mortality, this data supports a comprehensive approach to lowering the rates in this community.”
LowndesCluster D
To impact the feto-infant mortality rate of this cluster. interventions are needed that address all areas of health that directly impact infant and fetal survival with emphasis on preconception health, intendedness of pregnancies, perinatal health, infant health and safety.
Maternal Care
Maternal Care
Newborn Care
Newborn Care
Infant Health
Infant Health
Maternal Health/Prematurity Maternal Health/Prematurity
Overall feto-infant mortality rates
Excess feto-infant mortality rates
Rates are infant (under 1 year) deaths per 1,000 live births.

26
Rates are infant (under 1 year) deaths per 1,000 live births.
Cluster E has a feto-infant mortality rate of 12.34 per 1000 live births plus fetal deaths, with 5.25 deaths per 1000 occurring within the maternal health/prematurity category. Excess deaths are seen mainly in maternal health and prematurity as well as infant health. Of the 5.25 deaths per 1000 in the maternal health/prematurity category, it is hypothesized that nearly 4 deaths per 1000 could be prevented if the feto-infant mortality rate of the referent group were attained by women in this cluster.
The Richmond Cluster has high rates in both maternal health/prematurity and infant health categories, with rates greater than 5 deaths per thousand live births in each.
AGE AT DEATHFetal
500–1499
1500+
Neonatal
5.25
0.46 5.091.54
Postneonatal
BIR
TH
WE
IGH
T
AGE AT DEATHFetal
500–1499
1500+
Neonatal
3.95
0.12 4.020.83
Postneonatal
BIR
TH
WE
IGH
TA similar oddity is occurring with Cluster E as occurred in Cluster C.
Based on the initial PPOR map, the infant health category is as high as the maternal health and prematurity category. However, the excess death for the infant health category is higher than the excess deaths calculated for the maternal health and prematurity cell. To impact the feto-infant mortality rate of this cluster, interventions are needed that address preconception health, intendedness of pregnancies, perinatal health, infant health and safety.
RichmondCluster E
Maternal Care
Maternal Care
Newborn Care
Newborn Care
Infant Health
Infant Health
Maternal Health/Prematurity Maternal Health/Prematurity
Overall feto-infant mortality rates
Excess feto-infant mortality rates

27
Cluster F has a feto-infant mortality rate of 8.86 per 1000 live births plus fetal deaths, with more than 4 deaths per 1000 occurring within the maternal health/prematurity category. Excess deaths are seen in all categories, but are negligible in maternal and newborn care. Of the 4.17 deaths per 1000 in the maternal health/prematurity category, it is hypothesized that 2.9 deaths per 1000 could be prevented if the feto-infant mortality rate of the referent group were attained by women in this cluster.
SIDS, unintentional injuries and congenital malformations are contributing to this cluster’s high infant mortality rate, suggesting interventions are needed to help the mother with her health prior to pregnancy and the familiy’s ability to raise children in safe environments.
AGE AT DEATHFetal
500–1499
1500+
Neonatal
4.17
0.52 3.131.04
Postneonatal
BIR
TH
WE
IGH
T
AGE AT DEATHFetal
500–1499
1500+
Neonatal
2.87
0.18 2.060.33
Postneonatal
BIR
TH
WE
IGH
T
The incidence of SIDS deaths (N=8), unintentional injuries (N=5) and congenital malformations (N=5) are driving the high infant mortality rate among the infant health cell.
To impact the feto-infant mortality rate of this cluster interventions are needed that address preconception health, intendedness of pregnancies, perinatal health, infant health and safety.
ChathamCluster F
Maternal Care
Maternal Care
Newborn Care
Newborn Care
Infant Health
Infant Health
Maternal Health/Prematurity Maternal Health/Prematurity
Infant health issues are among the leading causes of death in the Chatham Cluster.
OVERALL FETO-INFANT MORTALITY RATES
EXCESS FETO-INFANT MORTALITY RATES
Rates are infant (under 1 year) deaths per 1,000 live births.

28
A Call to Action—Preventing Infant Mortality in Your Community
Following are steps to take to reduce infant mortality in your community,whether within a specific cluster or throughout the state.
Preconception refers to health and intendedness of pregnancy refers to the period of time before pregnancy occurs. Perinatal health
is the health of women and babies before, during and after birth.
Everyone has a role in reducing infant mortality.
Fulton, Douglas, Cobb and Clayton:
Nearly 5 per 1000 deaths were due to maternal health/prematurity. 3.5/1000 could be prevented with better preconception health, intendedness of pregnancy and perinatal health. 2 deaths per 1,000 were due to preventable causes: SIDS, unintentional injuries, homicide.
Lowndes:
6.11 per 1000 deaths were due to maternal health/prematurity. 5/1000 could be prevented with better preconception health, intendedness of pregnancy and perinatal health. 1.12 deaths per 1,000 are due to newborn care which could be prevented with better infant health and safety.
Bibb, Twiggs, Houston and Jones:
Nearly 5 per 1000 deaths were due to maternal health/prematurity. 3.5/1000 could be prevented with better preconception health, intendedness of pregnancy and perinatal health. 1 death per 1,000 was due to preventable causes: SIDS, unintentional injuries, homicide.
Richmond:
5.25 per 1000 deaths were due to maternal health/prematurity. 4/1000 could be prevented with better preconception health, intendedness of pregnancy and perinatal health. 5.09 per 1,000 deaths were due to infant health and indicates a need for communities to address infant health and safety.
Muscogee and Chattahoochee:
3.6 per 1,000 deaths were due to maternal health/prematurity. 2.3/1,000 could be prevented with better preconception health, intendedness of pregnancy and perinatal health. 3.4 per 1,000 deaths were in the infant health category and due to preventable causes: SIDS, unintentional injuries, homicide.
Chatham:
4.17 per 1000 deaths were due to maternal health/prematurity. 2.9/1000 could be prevented with better preconception health, intendedness of pregnancy and perinatal health. 3.13 deaths per 1,000 are due to SIDS, unintentional injuries, and congenital malformations. Overall interventions should support preconception health and safe environments.
Cluster A
Cluster D
Cluster B
Cluster E
Cluster C
Cluster F

29
WHAT CAN YOU DO?
WHAT CAN YOUR COMMUNITY DO?1
• Plan your pregnancy—about half of all pregnancies are unplanned.
• Address preconception health—take a multi-vitamin pill with 400 mcg of folic acid before getting pregnant to help prevent birth defects.
• Stop the use of tobacco or alcohol.
• Be healthy-take control of your medical condition, such as diabetes, high blood pressure, asthma, infections or other health problems. Also, be sure that your vaccinations are up to date.
• Receive interconception care—wait at least 18 months between pregnancies.
• Carry your pregnancy at least 39 weeks whenever possible— elective deliveries prior to 39 weeks carry significant increased risk of adverse outcomes for your baby.
• Enhance infant health and safety—have your baby sleep on his/her back, in a separate sleep space, on a firm mattress.
• Work to eliminate health disparities and promote health equity.
• Use data to inform efforts to promote healthy birth outcomes.
• Implement health promotion and education efforts to improve birth outcomes.
• Enhance service integration for women and infants.
• Improve maternal risk screening for women of reproductive age.
• Improve access to health care for women before, during and after pregnancy.
• Ensure quality of care for all women and infants.
1. AMCHP, 2012

30
Data used for this report come mainly from vital statistics and the 2000 census files. Birth and death certificates were matched for infants who died under the age of one year. All analyses were done using the linked birth death file allowing for the evaluation of pregnancy and birth related factors in relation to the infant’s death. Infant mortality rates were defined as the number of infants dying before their first birthday divided by the total number of live births during the same period and expressed per 1000 live births. Cohort infant mortality rates were calculated, ensuring that the infants in the numerator were also in the denominator. Infants were excluded from this dataset if their mother was not a resident of the state of Georgia at time of delivery and/or time of death.
Infant mortality was examined at the state level by race/ethnicity, timing of death, and leading causes of infant mortality. Five year average rate ratios were calculated to compare the five year average infant mortality rate
of public health districts to that of the state (IMR of public health district/IMR for state). This analysis was repeated at the county level.
In order to assess the presence of infant mortality clusters that exist outside of administrative boundaries, a fishnet consisting of squares with 1x1 mile cell sizes was created to cover the entire area of the state of Georgia. Based on the geocoded locations of their mother’s residence at delivery, all live births in the 2002-2006 birth cohort were aggregated to the one-mile square to obtain the counts of births and deaths observed. The aggregated counts of births and the state’s overall infant mortality rate in the years 2002-2006 were used to calculate the expected counts of deaths under the null hypothesis that all births had the same probability of dying in their first year of life. The observed and expected numbers of deaths were then assigned to the centers of the squares, which were used in the creation of the smoothed surface of the standard mortality ratio (SMR) as well as the detection of clusters.
METHODS
31
The smoothed surface was created using the Spatial Filtering method introduced by Ruston and Lolonis (1996). Centered on the center of each square, a circular area was constructed by expanding the circle from a point to a certain area at which at least 25 expected deaths were captured. The total number of observed deaths within the same area was calculated. The observed and the expected numbers of deaths were then used to calculate SMR by dividing the observed deaths by the expected deaths. The procedure was repeated for all squares. The SMRs were then used to create the smoothed surface.
The clusters were detected using the Spatial Scan Statistic developed by Kulldorff and Nagarwalla (1995). Centered on the center of each square, a set of circles were overlaid with varying radii from 0 to an upper limit defined by a radius of circle that captures a maximum 10% of total births or a maximum of 10 miles. For each circle, the likelihood ratio associated with the ratio of the observed and expected numbers of
deaths inside and outside the circle was calculated. The procedure was repeated for all squares. Then the circles were ranked based on their likelihood ratios. The circle with the maximum likelihood ratio was considered the most likely cluster. For this cluster, it is least likely that the observed number of deaths exceeded the expected number of deaths by chance alone under the null hypothesis that the infant mortality rates inside and outside of the circle were the same. A certain number of other circles were considered secondary clusters. The p-values were obtained for the most likely and the secondary clusters through the Monte Carlo hypothesis testing. Clusters with p-values smaller than 0.05 were said to be statistically significant at an α=0.005. This process was repeated using the linked birth death file from 1997 to 2006 to identify clusters of neonatal (deaths occurring before the 28th day of life) and postneonatal (deaths occurring between the 28th day and 364th day of life) deaths. The remainder of the report consists of detailed analyses of the six significant infant mortality clusters.
32
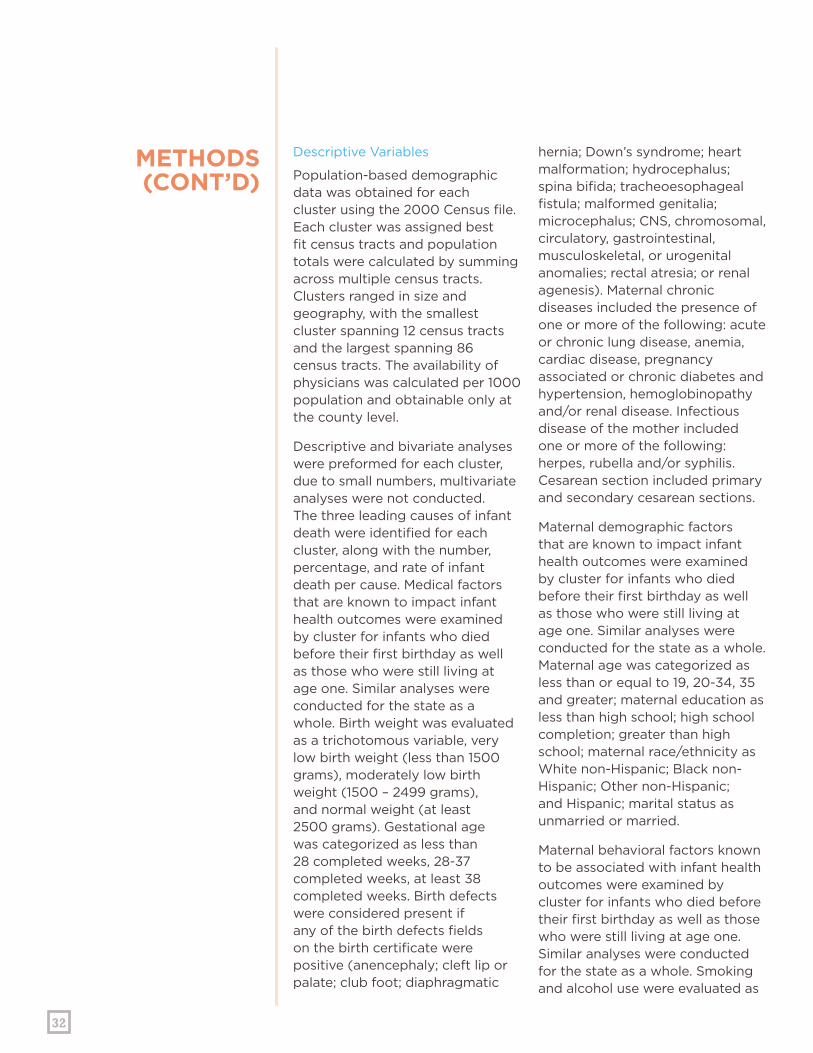
Descriptive Variables
Population-based demographic data was obtained for each cluster using the 2000 Census file. Each cluster was assigned best fit census tracts and population totals were calculated by summing across multiple census tracts. Clusters ranged in size and geography, with the smallest cluster spanning 12 census tracts and the largest spanning 86 census tracts. The availability of physicians was calculated per 1000 population and obtainable only at the county level.
Descriptive and bivariate analyses were preformed for each cluster, due to small numbers, multivariate analyses were not conducted. The three leading causes of infant death were identified for each cluster, along with the number, percentage, and rate of infant death per cause. Medical factors that are known to impact infant health outcomes were examined by cluster for infants who died before their first birthday as well as those who were still living at age one. Similar analyses were conducted for the state as a whole. Birth weight was evaluated as a trichotomous variable, very low birth weight (less than 1500 grams), moderately low birth weight (1500 – 2499 grams), and normal weight (at least 2500 grams). Gestational age was categorized as less than 28 completed weeks, 28-37 completed weeks, at least 38 completed weeks. Birth defects were considered present if any of the birth defects fields on the birth certificate were positive (anencephaly; cleft lip or palate; club foot; diaphragmatic
hernia; Down’s syndrome; heart malformation; hydrocephalus; spina bifida; tracheoesophageal fistula; malformed genitalia; microcephalus; CNS, chromosomal, circulatory, gastrointestinal, musculoskeletal, or urogenital anomalies; rectal atresia; or renal agenesis). Maternal chronic diseases included the presence of one or more of the following: acute or chronic lung disease, anemia, cardiac disease, pregnancy associated or chronic diabetes and hypertension, hemoglobinopathy and/or renal disease. Infectious disease of the mother included one or more of the following: herpes, rubella and/or syphilis. Cesarean section included primary and secondary cesarean sections.
Maternal demographic factors that are known to impact infant health outcomes were examined by cluster for infants who died before their first birthday as well as those who were still living at age one. Similar analyses were conducted for the state as a whole. Maternal age was categorized as less than or equal to 19, 20-34, 35 and greater; maternal education as less than high school; high school completion; greater than high school; maternal race/ethnicity as White non-Hispanic; Black non-Hispanic; Other non-Hispanic; and Hispanic; marital status as unmarried or married.
Maternal behavioral factors known to be associated with infant health outcomes were examined by cluster for infants who died before their first birthday as well as those who were still living at age one. Similar analyses were conducted for the state as a whole. Smoking and alcohol use were evaluated as
METHODS(CONT’D)

33
dichotomous variables (yes/no), previous adverse birth outcome was a composite variable and considered present if any of the following were present- previous low birth weight, preterm birth and/or small for gestational age. Adequacy of prenatal care was examined using the Kotelchuck index which takes into account number of prenatal visits and month of prenatal care initiation. Interpregnancy interval was categorized as six months or less, seven to 17 months, 18 months or more.
The Perinatal Periods of Risk framework aids in understanding where to intervene and what actions are needed to lower a community’s feto-infant mortality rate. Fetal death files from 2002-2006 were appended to the linked birth death certificate file to calculate feto-infant mortality rates, defined as the number of fetal and infant deaths weighing at least 500 grams and 24 completed gestational weeks divided by the total number of fetal deaths and live births weighing at least 500 grams and 24 completed weeks during the same time period. Feto-infant mortality rates were expressed per 1000 live births and fetal deaths. This definition was chosen in compliance with the perinatal periods of risk model.
The PPOR framework maps feto-infant mortality by timing of death and birth weight into four categories. A mortality rate is calculated for each
category, and is evaluated in terms of a primary prevention focus describing actions and interventions with the goal of reducing the fetal and infant mortality. Feto-infant deaths occurring among those weighing 500 – 1499 grams are thought to be reduced by interventions related to maternal health and prematurity. Such interventions could include addressing chronic and infectious diseases before pregnancy and encouraging preconception and interconception health care.
Deaths occurring to fetuses 1500 grams and above are thought to be best prevented by interventions in the maternal care category such as perinatal and prenatal care, as well as high risk referrals. Newborn care category includes neonatal deaths to infants born weighing at least 1500 grams. Interventions to reduce deaths in this category should focus on obstetric care, perinatal management and neonatal care. The infant health category of the PPOR map refers to deaths occurring during the postneonatal period to infants born weighing 1500 grams or more. Initiatives directed at sleep position, injury, breast feeding, and pediatric care (surgery) could impact the infant health related mortality rate.

34
DATATABLES
Table 2. Demographic characteristics for the six geographical clusters of infant mortality in GA, 2002-2006
Approximate population totals are calculated from census tract level data. Best fit census tracts were assigned to the clusters. Where necessary, population totals were calculated by adding multiple census tracts together.
IMR—infant mortality rate expressed per 1000 live births
Clusters Pub
lic
He
alth
Dis
tric
ts
En
com
pas
sin
g c
oun
tie
s
# o
f Ce
nsu
s T
ract
s
po
pul
atio
n
% P
ove
rty
% W
hit
e
% H
S G
rad
Ob
gyn
s /1
000
of f
em
ale
po
p
Ped
iatr
ic D
ocs
/10
00 o
f to
tal p
op
# M
Ds/
100
0 o
f to
tal p
op
IMR
AClayton
Cobb-DouglasFulton
Fulton,Douglas,Cobb,Clayton
86 359,081 23.1 11.8 74.1 0.48 0.23 6.9 11.8
B North Central
Bibb, Twiggs,Houston,Jones
36 133,729 23.9 39.5 70.8 0.42 0.18 5.4 14.7
C West Central
Muscogee,Chatahoochee
31 117,942 19.9 34.4 75.9 0.22 0.12 5.4 15.8
D SouthLowndes 12 45,384 26.2 48.2 68.3 0.24 0.09 3.7 17.5
EEastCentral Richmond 28 133,296 23.8 38.5 73.4 0.61 0.41 10.6 15.1
F Coastal Chatham 30 79,481 25.8 27.2 67.9 0.47 0.27 6.9 13.3
Georgia All 1618 8,186,453 13.0 65.1 78.6 0.30 0.17 2.2 8.24
35
DATATABLES
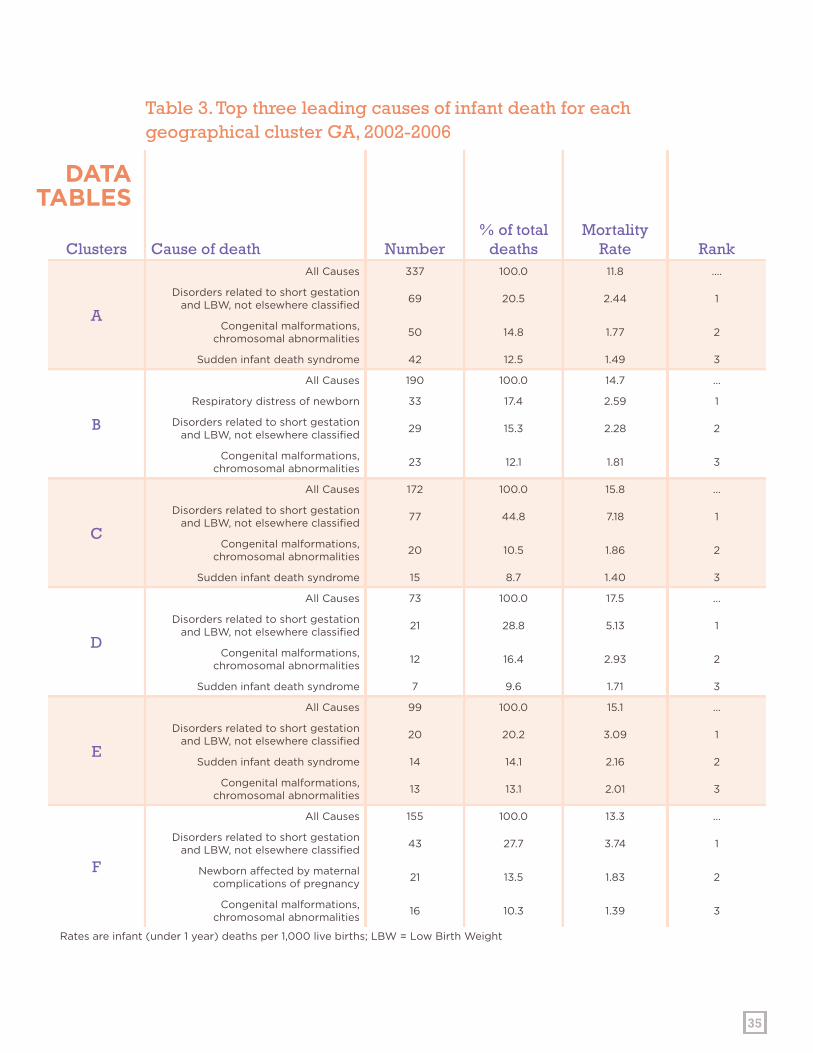
Table 3. Top three leading causes of infant death for each geographical cluster GA, 2002-2006
Rates are infant (under 1 year) deaths per 1,000 live births; LBW = Low Birth Weight
Clusters Cause of death Number% of total
deathsMortality
Rate Rank
A
All Causes 337 100.0 11.8 ….
Disorders related to short gestation and LBW, not elsewhere classified
69 20.5 2.44 1
Congenital malformations, chromosomal abnormalities
50 14.8 1.77 2
Sudden infant death syndrome 42 12.5 1.49 3
B
All Causes 190 100.0 14.7 …
Respiratory distress of newborn 33 17.4 2.59 1
Disorders related to short gestation and LBW, not elsewhere classified
29 15.3 2.28 2
Congenital malformations, chromosomal abnormalities
23 12.1 1.81 3
C
All Causes 172 100.0 15.8 …
Disorders related to short gestation and LBW, not elsewhere classified
77 44.8 7.18 1
Congenital malformations, chromosomal abnormalities
20 10.5 1.86 2
Sudden infant death syndrome 15 8.7 1.40 3
D
All Causes 73 100.0 17.5 …
Disorders related to short gestation and LBW, not elsewhere classified
21 28.8 5.13 1
Congenital malformations, chromosomal abnormalities
12 16.4 2.93 2
Sudden infant death syndrome 7 9.6 1.71 3
E
All Causes 99 100.0 15.1 …
Disorders related to short gestation and LBW, not elsewhere classified
20 20.2 3.09 1
Sudden infant death syndrome 14 14.1 2.16 2
Congenital malformations, chromosomal abnormalities
13 13.1 2.01 3
F
All Causes 155 100.0 13.3 …
Disorders related to short gestation and LBW, not elsewhere classified
43 27.7 3.74 1
Newborn affected by maternal complications of pregnancy
21 13.5 1.83 2
Congenital malformations, chromosomal abnormalities
16 10.3 1.39 3

36
Geographical Cluster Georgia
CLUSTER% INFANT DEATHS
% LIVE BIRTHS LIVING AT 1YR
% INFANT DEATHS
% LIVE BIRTHS LIVING AT 1YR
Birth weight
<1500 grams
A 59.3 2.1
56.1 1.3
B 58.9 1.9
C 64.0 1.7
D 56.2 1.5
E 53.5 2.0
F 65.2 1.6
1500-2499 grams
A 10.7 10.5
13.6 7.4
B 19.5 10.3
C 11.0 9.4
D 15.1 9.5
E 14.1 9.6
F 10.3 9.3
≥2500 grams
A 30.0 87.4
30.2 91.2
B 21.6 87.8
C 25.0 88.9
D 28.8 89.0
E 32.3 88.5
F 24.5 89.0
Gestational Age
<28 weeks
A 51.9 0.9
48.5 0.5
B 52.1 0.6
C 60.5 0.7
D 49.3 0.7
E 48.5 0.7
F 59.4 0.6
28-37 weeks
A 26.7 27.4
26.7 22.7
B 27.4 28.4
C 24.4 24.4
D 24.7 26.7
E 26.3 25.5
F 22.6 26.1
Table 4. State level and Sub-county level analyses of medical factors associated with infant death, GA, 2002-2006
DATATABLES

37
38+ weeks
A 21.4 71.7
24.9 76.8
B 20.5 70.9
C 15.1 74.9
D 26.0 72.6
E 25.3 73.8
F 18.1 73.3
Birth Defects
A 6.8 0.3
9.4 0.6
B 11.1 0.3
C 10.5 0.9
D 6.8 0.3
E 2.0 0.3
F 5.2 0.8
Maternal Chronic Diseases
A 10.1 8.8
10.5 8.3
B 5.8 4.9
C 28.5 22.4
D 1.4 3.9
E 9.1 6.2
F 16.8 12.9
Maternal Infectious Diseases
A 0.0 1.8
0.9 1.3
B 0.5 0.6
C 0.0 1.9
D 0.0 1.3
E 1.0 1.4
F 0.0 1.4
Cesarean Section
A 35.0 26.4
36.2 28.8
B 25.3 27.1
C 24.4 28.1
D 37.0 28.6
E 43.4 27.6
F 29.7 35.5
DATATABLESCONT’D
Birth Defects include all congenital anomalies collected in the birth certificate.
Chronic diseases include: Acute or Chronic Lung Disease, Anemia HCT less than 30 HGB less than 10, Cardiac Disease, Pregnancy associated and chronic diabetes and hypertension, Hemoglobinophathies, and Renal disease.
Infectious diseases present in the mother include: Herpes, Rubella, and Syphilis.
Geographical Cluster Georgia
CLUSTER% INFANT DEATHS
% LIVE BIRTHS LIVING AT 1YR
% INFANT DEATHS
% LIVE BIRTHS LIVING AT 1YR

38
Geographical Cluster Georgia
LABEL% INFANT DEATHS
% LIVE BIRTHS LIVING AT 1YR
% INFANT DEATHS
% LIVE BIRTHS LIVING AT 1YR
Maternal Age
≤19
A 18.4 16.2
16.7 12.0
B 24.7 17.6
C 25.0 18.6
D 16.4 19.7
E 19.2 18.8
F 20.0 15.5
20-34
A 73.9 73.9
71.9 75.8
B 69.5 75.7
C 64.5 75.3
D 79.5 75.1
E 75.8 74.9
F 73.5 76.5
≥35
A 7.7 9.8
11.5 12.1
B 5.8 6.7
C 10.5 6.1
D 4.1 5.2
E 5.1 6.2
F 6.5 7.9
Maternal Education
< High School
A 27.3 30.6
26.5 23.8
B 36.3 25.8
C 29.7 26.0
D 30.1 29.1
E 45.5 32.0
F 16.1 19.2
High School Grad
A 37.7 34.4
33.7 29.8
B 42.6 42.5
C 40.7 37.8
D 41.1 38.1
E 27.3 35.2
F 41.3 33.7
> High School
A 24.9 31.8
32.2 43.6
B 16.8 29.8
C 27.9 36.0
D 21.9 31.6
E 27.3 32.6
F 40.6 46.2
Table 5. State level and Sub-county level analyses of demographic factors associated
DATATABLES

39
Maternal Race/Ethnicity
White non-Hispanic
A 1.5 4.8
34.1 48.1
B 20.0 31.4
C 15.7 27.6
D 16.4 34.0
E 9.1 24.5
F 18.1 26.9
Black non-Hispanic
A 91.4 80.2
49.7 31.3
B 77.4 61.1
C 75.0 61.8
D 76.7 58.4
E 87.9 71.1
F 74.2 65.6
Other non-Hispanic
A 0.6 1.6
2.6 3.7
B 0.5 1.6
C 4.1 2.5
D 4.1 1.6
E 1.0 1.4
F 0.6 2.6
Hispanic
A 4.5 11.7
9.5 14.4
B 1.6 3.9
C 4.1 7.6
D 2.7 5.3
E 2.0 2.6
F 4.5 4.5
Marital Status
Unmarried
A 75.7 67.9
55.2 39.6
B 75.8 62.4
C 73.8 60.0
D 64.4 59.3
E 84.8 71.2
F 71.0 60.0
Married
A 24.3 32.1
44.6 60.4
B 24.2 37.6
C 26.2 39.9
D 35.6 40.7
E 15.2 28.8
F 29.0 40.0
DATATABLESCONT’D
Geographical Cluster Georgia
CLUSTER% INFANT DEATHS
% LIVE BIRTHS LIVING AT 1YR
% INFANT DEATHS
% LIVE BIRTHS LIVING AT 1YR

40
Geographical Cluster Georgia
CLUSTER% INFANT DEATHS
% LIVE BIRTHS LIVING AT 1YR
% INFANT DEATHS
% LIVE BIRTHS LIVING AT 1YR
Smoking
A 5.9 3.8
11.1 7.4
B 7.4 10.7
C 12.2 10.5
D 8.2 6.9
E 9.1 9.9
F 10.3 5.9
Alcohol
A 0.9 0.6
1.0 0.6
B 0.5 0.5
C 3.5 1.5
D 0.0 0.3
E 1.0 0.8
F 1.9 1.0
Previous Adverse Birth
Outcome
A 2.1 0.7
1.7 0.6
B 2.1 0.1
C 0.6 0.6
D 1.4 0.1
E 0.0 0.0
F 0.6 0.2
Parity
1
A 36.8 38.0
40.4 39.8
B 39.5 38.3
C 41.3 38.6
D 37.0 40.5
E 35.4 36.4
F 44.5 39.6
2 to 4
A 51.3 53.3
47.2 55.0
B 47.4 53.8
C 44.8 55.8
D 45.2 53.4
E 51.5 55.9
F 40.0 53.7
Table 6. State level and Sub-county level analyses of behavioral risk factors associated with infant death, GA, 2002-2006
DATATABLES

41
5+
A 5.0 7.0
4.8 3.6
B 6.3 6.2
C 5.2 4.0
D 11.0 5.0
E 5.1 6.2
F 5.2 5.0
Prenatal Care (Kotelchuck index)
Inadequate
A 24.3 20.4
14.6 11.5
B 11.6 7.0
C 21.5 22.0
D 17.8 12.9
E 11.1 14.5
F 23.9 23.3
Intermediate
A 7.7 13.9
8.7 14.0
B 11.6 14.8
C 10.5 18.1
D 2.7 17.5
E 12.1 22.2
F 11.0 17.3
Adequate
A 16.3 34.1
21.7 39.0
B 28.4 42.4
C 15.7 31.0
D 19.2 30.3
E 18.2 36.8
F 22.6 35.2
Adequate Plus
A 38.9 26.0
47.1 31.8
B 42.6 34.3
C 50.0 27.2
D 39.7 30.3
E 57.6 26.1
F 34.8 22.3
DATATABLESCONT’D
Geographical Cluster Georgia
CLUSTER% INFANT DEATHS
% LIVE BIRTHS LIVING AT 1YR
% INFANT DEATHS
% LIVE BIRTHS LIVING AT 1YR
42
Interpregnancy interval
≤ 6 months
A 0.3 0.0
0.3 0.0
B 0.0 0.0
C 1.2 0.0
D 0.0 0.0
E 0.0 0.0
F 1.3 0.0
7-17 months
A 9.2 7.7
8.9 6.5
B 8.9 9.1
C 10.5 8.0
D 12.3 7.6
E 9.1 10.7
F 9.7 9.5
18+
A 32.6 39.4
32.9 44.0
B 34.2 44.8
C 33.1 46.0
D 30.1 33.8
E 47.5 49.7
F 27.1 44.6
DATATABLESCONT’D
Geographical Cluster Georgia
CLUSTER% INFANT DEATHS
% LIVE BIRTHS LIVING AT 1YR
% INFANT DEATHS
% LIVE BIRTHS LIVING AT 1YR
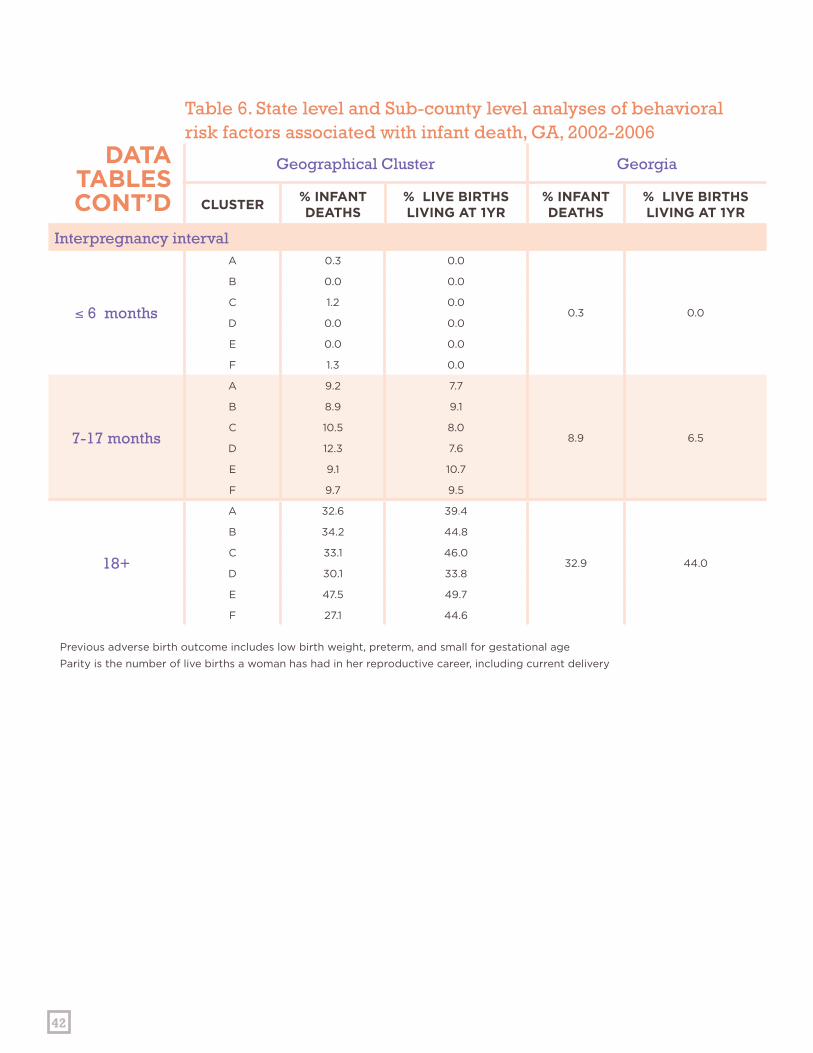
Table 6. State level and Sub-county level analyses of behavioral risk factors associated with infant death, GA, 2002-2006
Previous adverse birth outcome includes low birth weight, preterm, and small for gestational age
Parity is the number of live births a woman has had in her reproductive career, including current delivery
DEFINITION OF TERMS Fetal death—Deaths occurring to fetuses weighing at least 500 grams and 24 completed gestational weeks.
Feto-infant mortality rate—The number of fetal deaths (the death of a fetus before complete expulsion from its mother at 500 grams and at least 24 weeks gestation) plus the number of infant deaths (death of a live born baby before completing 365 days of life. ) divided by the total number of fetal deaths plus live births and expressed as a rate per 1,000.1
Intendedness of pregnancy—The extent to which a pregnancy is planned or intended. Current studies suggest that as many as half of all pregnancies are unplanned, leading to higher frequencies of conceptions among women without preconception care.
Interconception care—Care given to women between pregnancies. The main goal of interconception care is to provide health promotion, screening and interventions for women following a pregnancy to ensure the best health outcomes of subsequent pregnancies.
Neonatal—The period from birth to 27 days of age.
Perinatal periods of risk—Fetal and infant death rates organized by intervention strategies (Women’s health, maternal care, newborn care, and infant care) in order to facilitate local health planning.2
Preconception care—Care given to women before they are pregnant. According to the Centers for Disease Control and Prevention, the main goal of preconception care is to provide health promotion, screening and interventions for women of reproductive age to reduce risk factors that might affect future pregnancies.3
Prenatal—The period that spans a woman’s pregnancy.
Postneonatal—The period from 28 days after birth through 364 days of age.4
1. http://oasis.state.ga.us/oasis/oasis/help/infantdeathwppor.html2. http://oasis.state.ga.us/oasis/oasis/help/infantdeathwppor.html3. http://www.cdc.gov/ncbddd/preconception/4. http://oasis.state.ga.us/oasis/oasis/help/infantdeathwppor.html
43

Georgia Department of Public Health 2 Peachtree Street, NW
15th Floor Atlanta, Georgia 30303
www.health.state.ga.us/publications