FROM MOLECULAR OLIGOMERS TO SUPRAMOLECULAR GELS...
207
FROM MOLECULAR OLIGOMERS TO SUPRAMOLECULAR GELS: PHOTOPHYSICS OF CONJUGATED METAL-ORGANIC SYSTEMS By THOMAS CARDOLACCIA A DISSERTATION PRESENTED TO THE GRADUATE SCHOOL OF THE UNIVERSITY OF FLORIDA IN PARTIAL FULFILLMENT OF THE REQUIREMENTS FOR THE DEGREE OF DOCTOR OF PHILOSOPHY UNIVERSITY OF FLORIDA 2005
Transcript of FROM MOLECULAR OLIGOMERS TO SUPRAMOLECULAR GELS...

FROM MOLECULAR OLIGOMERS TO SUPRAMOLECULAR GELS: PHOTOPHYSICS OF CONJUGATED METAL-ORGANIC SYSTEMS
By
THOMAS CARDOLACCIA
A DISSERTATION PRESENTED TO THE GRADUATE SCHOOL OF THE UNIVERSITY OF FLORIDA IN PARTIAL FULFILLMENT
OF THE REQUIREMENTS FOR THE DEGREE OF DOCTOR OF PHILOSOPHY
UNIVERSITY OF FLORIDA
2005

Copyright 2005
By
Thomas Cardolaccia

Dedicated to my parents for their support
Dedicated to my wife for her love And vice versa….

ACKNOWLEDGMENTS
These years as a graduate student have been without a doubt the most stimulating
and rewarding years of my life. Many people have contributed to make this journey a
positive and gratifying adventure and they are hereby acknowledged. Some many things
to say, so little space . . .
First I would like to thank my advisor, Dr. Kirk S. Schanze, for his guidance and
support throughout those years. His constant encouragements and motivation have been
an incredible source of strength in many occasions. His genuine care for the intellectual
development of his students is evidenced in the time he often took to explain new
concepts to me or demonstrate the operation of some instruments. Dr. Schanze has
always been willing to let me go my way, giving me a significant degree of freedom on
my research. More importantly, he never made me feel bad for mistakes and failed
experiments. Through these times of failure and success, I have grown as a scientist and a
person, inspired by his creativity and approach to sciences.
I would like to thank my committee members, Dr. John Reynolds, Dr. William
Dolbier, Dr. Michael Scott and Dr. Bruce Carroll. Special gratitude goes to Dr. Dolbier
for organizing and managing the Thursday night Bull Sessions, where I have been
exposed to some aspects of organic chemistry I would have never encountered otherwise.
Many people have been involved with my research and I would like to thank Dr.
Xiaoming Zhao for synthesizing polymers faster than I could characterize them
spectroscopically, Dr. Alison M. Funston and Dr. John R. Miller for carrying out the
iv

pulse radiolysis in Brookhaven National Laboratory, Dr. Stephen Hagen for the use of his
CD spectrometer, and Dr. Richard Weiss for carrying out the polarizing microscopy
experiments.
My experience in the laboratory has been particularly enriching due to several
exceptional individuals willing to share their knowledge and time. Thanks go to Dr. Ben
Harrison, Dr. Yiting Li, Dr. Mauricio R. Pinto, Dr. Yao Liu, Dr. Ksenija Haskins-Glusac,
Dr. Eric Silverman and all present members of the Schanze’s group.
I thank my parents for making me what I am today and my family for the love I
was always surrounded with.
v

TABLE OF CONTENTS page
ACKNOWLEDGMENTS ................................................................................................. iv
LIST OF TABLES............................................................................................................. ix
LIST OF FIGURES .............................................................................................................x
ABSTRACT.......................................................................................................................xv CHAPTER
1 INTRODUCTION ........................................................................................................1
Introduction to Photophysics ........................................................................................1 Absorption of Light ...............................................................................................1 Nature of the Excited State....................................................................................4 Relaxation of Excited States..................................................................................6 Energy Transfer .....................................................................................................9 Singlet and Triplet Excimers ...............................................................................12 Exciton Coupling in Molecular Aggregates ........................................................15 Triplet Excited States in Conjugated Systems.....................................................20
Platinum Acetylides....................................................................................................22 Structure and Synthesis .......................................................................................22 Excited State........................................................................................................24
Objective of Present Study .........................................................................................30
2 TRIPLET EXCITED STATES IN BICHROMOPHORIC PLATINUM ACETYLIDE OLIGOMERS......................................................................................34
Introduction.................................................................................................................34 Synthesis .....................................................................................................................36 Results.........................................................................................................................39
UV-Vis Absorption .............................................................................................39 Steady-State Photoluminescence.........................................................................41 Transient Absorption ...........................................................................................49 Time-Resolved Photoluminescence ....................................................................50
Discussion...................................................................................................................53 Energy of the Triplet Excited State in Pt4T3. .....................................................53 The Absence of Phosphorescence in Pt4T3 ........................................................55 Excited State Dynamics.......................................................................................57
vi

Conclusion ..................................................................................................................60 Experimental...............................................................................................................61
Photophysical Measurements ..............................................................................61 Mass Spectrometry of Pt Oligomers....................................................................62 Synthesis..............................................................................................................62
3 DELOCALIZATION OF CHARGE CARRIERS IN PLATINUM ACETYLIDE OLIGOMERS.............................................................................................................71
Introduction.................................................................................................................71 Results.........................................................................................................................73
Electrochemistry..................................................................................................73 Pulse Radiolysis – Ion Radical Spectra ...............................................................78
Discussion...................................................................................................................80 Delocalization of Charge Carriers................................................................80 Electronic Transitions of the Radical Ions ...................................................83
Conclusion ..................................................................................................................87 Experimental...............................................................................................................88
Electrochemistry..................................................................................................88 Pulse Radiolysis...................................................................................................88 Synthesis..............................................................................................................89
4 CONSEQUENCES OF AGGREGATION ON THE TRIPLET EXCITED STATE IN PLATINUM ACETYLIDE OLIGOMERS...........................................................90
Introduction.................................................................................................................90 Synthesis .....................................................................................................................95 Results.......................................................................................................................100
Gel Formation....................................................................................................100 Thermal Properties ............................................................................................101 UV-Vis Absorption ...........................................................................................103 Circular Dichroism ............................................................................................108 Steady-State Photoluminescence.......................................................................110 Time-Resolved Photoluminescence ..................................................................119
Discussion.................................................................................................................127 Nature of Aggregates.........................................................................................127 Photoluminescence of Aggregates ....................................................................132 Molecular Exciton Modeling.............................................................................137
Conclusion ................................................................................................................140 Experimental.............................................................................................................142
Thermal Properties ............................................................................................142 Photophysical Measurements ............................................................................143 Calculation of Exciton Interaction Energy ........................................................144 Synthesis............................................................................................................145
5 CONCLUSION.........................................................................................................158
vii

APPENDIX
NMR SPECTRA..............................................................................................................161
LIST OF REFERENCES.................................................................................................172
BIOGRAPHICAL SKETCH ...........................................................................................191
viii

LIST OF TABLES
Table page 2-1. Photophysical data for oligomers Pt4 and Pt4Tn. .....................................................54
3-1. Redox potentials (V vs SCE) for Ptn and Pt4Tn oligomers series in CH2Cl2 containing 0.1 M TBAH.a ........................................................................................74
4-1. Lifetimea of photoluminescence of self-assembling platinum acetylide oligomers.b127
4-2. Absorption data of self-assembling platinum acetylide oligomers. .........................139
4-3. Some angles and dipole-dipole distances calculated with the molecular exciton model. .....................................................................................................................141
ix
LIST OF FIGURES
Figure page 1-1. Potential energy curves for electronic transitions.........................................................5
1-2. Jablonski diagram representing the possible transitions after absorption. ...................8
1-3. Diagram for the exchange energy transfer mechanism. .............................................10
1-4. Diagram for the Coulombic energy transfer mechanism............................................12
1-5. Fluorescence spectra of pyrene solutions in cyclohexane. .........................................13
1-6. Potential energy curves for monomer and excimer. ...................................................14
1-7. Schematic representation of the energy levels of the excited state of the monomer and of aggregates in parallel (left) and head-to-tail (right) geometry. .....................16
1-8. Exciton band splitting energy diagram for a co-planar molecular dimer as a function of the angle θ..............................................................................................18
1-9. Absorption and fluorescence spectra for cyclohexane solution (dotted line) and multilayers of fatty acid derivative of trans-stilbene (solid line).............................19
1-10. Absorption spectra of a carbocyanine derivative in 10-2 M aqueous sodium hydroxide solution at different concentrations and room temperature.....................20
1-11. Schematic pictures of conjugated polymers studied by Monkman and Burrows.44.21
1-12. Plot of triplet energy against singlet energy for the conjugated polymers studied by Monkman and Burrows. ......................................................................................22
1-13. General structure of a platinum acetylide polymer. .................................................23
1-14. Splitting of d orbital levels in square-planar Pt(II) complexes.................................25
1-15. Structures of platinum acetylide dimers and polymers studied by Chawdhury et al.63 ...........................................................................................................................26
1-16. Platinum acetylide dimers and polymers studied by Wilson et al.64 from which figure was adopted. ..................................................................................................27
x

1-17. Absorption spectra (high energy dotted lines) and photoluminescence spectra (at 300 K dotted lines, at 20 K solid lines) of films of polymers P1-P8. ......................28
1-18. Energy levels of the S1 and T1 excited states and singlet-triplet energy gap for the Pt-containing and organic polymers...................................................................29
1-19. Platinum acetylide oligomers studied by Rogers et al.66 from which figure was adopted. ....................................................................................................................29
1-20. Platinum oligomers Pt-n (n = 1-5,7) studied by Liu et al.67 .....................................30
1-21. Absorption (a) and photoluminescence (b) spectra of Pt-n oligomers. ....................31
1-22. Triplet exciton confinement in platinum acetylide oligomers..................................31
2-1. The structures of platinum acetylide oligomers Pt4 and Pt4Tn (n = 1-3)..................36
2-2. Synthesis of platinum acetylide complexes 5a-d. ......................................................37
2-3. Synthesis of platinum acetylide complex intermediate 11. ........................................38
2-4. Synthesis of oligomers Pt4 and Pt4Tn (n = 1-3). .......................................................39
2-5. Absorption spectra of oligomers in THF....................................................................40
2-6. Photoluminescence spectra of oligomers in deoxygenated THF with an excitation λ = 352 nm................................................................................................................42
2-7. Photoluminescence spectra of oligomers Pt4Tn in deoxygenated THF.....................45
2-8. Excitation spectra of oligomers Pt4Tn in deoxygenated THF. ..................................47
2-9. Low-temperature photoluminescence spectrum of Pt4T1 in deoxygenated MeTHF with an excitation λ = 352 nm. ...................................................................48
2-10. Low-temperature photoluminescence spectrum in deoxygenated MeTHF with an excitation λ = 352 nm at T = 90 K (―) and T = 300 K (– –)...................................50
2-11. Transient absorption spectra of oligomers in deoxygenated THF following 355 nm excitation. ...........................................................................................................51
2-12. Time-resolved photoluminescence spectra of oligomers Pt4Tn in deoxygenated THF following 355 nm excitation. ...........................................................................52
2-13. Energy diagram representing the photophysical processes involved in the Pt4Tn oligomers. .................................................................................................................59
3-1. Structure of platinum acetylide oligomers Ptn (n = 1-5). ...........................................73
xi

3-2. Structure of platinum acetylide oligomers Pt4Tn (n = 1-3). ......................................73
3-3. Cyclic voltammetry (CV, left) and differential pulse voltammetry (DPV, right) of oligomers Ptn............................................................................................................76
3-4. Cyclic voltammetry (CV) of oligomers Pt4Tn. ..........................................................77
3-5. Radical cation spectra for Ptn (top) and Pt4Tn (bottom) oligomers series.. ..............79
3-6. Radical anion spectra for Ptn (top) and Pt4Tn (bottom) oligomers series. ................81
4-1. Structures of phenyleneethynylene and platinum acetylide oligomers synthesized for the preliminary study. .........................................................................................93
4-2. Structures of self-assembling platinum acetylide oligomers......................................95
4-3. Synthesis of platinum complex intermediate 18.........................................................96
4-4. Synthesis of phenyleneethynylene derivative 20........................................................97
4-5. Synthesis of chiral intermediate 23. ...........................................................................98
4-6. Synthesis of Pt2M as a representative reaction of the oligomer series......................98
4-7. Synthesis of oligomer PE3. ........................................................................................99
4-8. Picture of deoxygenated dodecane gel of Pt2M (10-3 M) under illumination with a UV light. ................................................................................................................100
4-9. Differential scanning calorimetry thermograms for second heating and cooling cycle at a10 oC/min scan rate. ................................................................................102
4-10. Pictures of liquid-crystal phases under a polarized optical microscope.................104
4-11. Absorption spectrum of Pt2M in dodecane. ..........................................................105
4-12. Absorption spectrum of Pt2MT in dodecane.........................................................106
4-13. Absorption spectrum of Pt2MP3 in dodecane. ......................................................107
4-14. Absorption spectrum of Pt2MC at room temperature in dodecane. ......................109
4-15. Circular dichroism (CD) absorption spectrum of Pt2MC in dodecane. ................109
4-16. Photoluminescence spectrum of PE3 with λex = 354 nm. ......................................111
4-17. Photoluminescence spectrum of Pt2M...................................................................112
xii

4-18. Photoluminescence spectrum of Pt2M in MeTHF at C = 7 x 10⁻⁶ M with λex = 326 nm from -63 oC to -23 oC. ...............................................................................113
4-19. Low-temperature photoexcitation spectra of Pt2M in deoxygenated MeTHF monitoring λem = 494 nm (―) and λem = 516 nm (– – –). ......................................114
4-20. Photoluminescence spectrum of Pt2MT in deoxygenated dodecane with λex = 340 nm at C = 10-3 M (—) and 10-4 M (– – –). ......................................................116
4-21. Photoluminescence spectrum of Pt2MP3. .............................................................117
4-22. Absorption spectrum of Pt2M (―) and Pt2MT (– – –) in dodecane at C = 10-3 M. ...........................................................................................................................119
4-23. Photoluminescence spectrum of Pt2M-Pt2MT mixed-oligomer system. .............120
4-24. Time-resolved photoluminescence spectrum of Pt2M in deoxygenated dodecane following λex = 337 nm...........................................................................................121
4-25. Principal components of emission decay of Pt2M at 10-3 M in dodecane for slow component τ = 59 μs (―) and fast component τ = 9 μs (– –). ...............................123
4-26. Time-resolved photoluminescence spectrum of Pt2MP3 in deoxygenated dodecane following λex = 355 nm. .........................................................................124
4-27. Time-resolved photoluminescence spectrum of Pt2M with 5 mol% Pt2MT in deoxygenated dodecane following λex = 337 nm. ..................................................126
4-28. Principal components of emission decay of Pt2M at 10-3 M with 5 mol% Pt2MT in dodecane for slow component τ = 41 μs (―), fast component τ = 5 μs (– –). .......................................................................................................................126
4-29. Plot of emission decay of Pt2M at 494 nm (a) and 516 nm (b) with x mol% doping levels of Pt2MT. .......................................................................................128
4-30. Energy diagram for monomer and aggregates in self-assembling platinum acetylide oligomers. ...............................................................................................134
4-31. Proposed conformation of the triplet excited state of Pt2M. .................................135
4-32. Plot of angle θ versus Δλ = λagg – λm for different dipole-dipole distance R. ........140
A-1. 1H NMR (300 MHz, CDCl3) spectrum of Pt4.........................................................161
A-2. 31P NMR (121 MHz, CDCl3) spectrum of Pt4. .......................................................161
A-3. 1H NMR (300 MHz, CDCl3) spectrum of Pt4T1. ...................................................162
A-4. 31P NMR (121 MHz, CDCl3) spectrum of Pt4T1. ..................................................162
xiii

A-5. 1H NMR (300 MHz, CDCl3) spectrum of Pt4T2. ...................................................163
A-6. 31P NMR (121 MHz, CDCl3) spectrum of Pt4T2. ..................................................163
A-7. 1H NMR (300 MHz, CDCl3) spectrum of Pt4T3. ...................................................164
A-8. 31P NMR (121 MHz, CDCl3) spectrum of Pt4T3. ..................................................164
A-9. 1H NMR (300 MHz, CDCl3) spectrum of Pt2M. ....................................................165
A-10. 13C NMR (75 MHz, CDCl3) spectrum of Pt2M....................................................165
A-11. 31P NMR (121 MHz, CDCl3) spectrum of Pt2M. .................................................166
A-12. 1H NMR (300 MHz, CDCl3) spectrum of Pt2MT. ...............................................166
A-13. 13C NMR (75 MHz, CDCl3) spectrum of Pt2MT. ................................................167
A-14. 31P NMR (121 MHz, CDCl3) spectrum of Pt2MT................................................167
A-15. 1H NMR (300 MHz, CDCl3) spectrum of Pt2MP3. .............................................168
A-16. 13C NMR (75 MHz, CDCl3) spectrum of Pt2MP3. ..............................................168
A-17. 31P NMR (121 MHz, CDCl3) spectrum of Pt2MP3..............................................169
A-18. 1H NMR (300 MHz, CDCl3) spectrum of Pt2MC. ...............................................169
A-19. 13C NMR (75 MHz, CDCl3) spectrum of Pt2MC. ................................................170
A-20. 31P NMR (121 MHz, CDCl3) spectrum of Pt2MC. ..............................................170
A-21. 1H NMR (300 MHz, CDCl3) spectrum of PE3. ....................................................171
A-22. 13C NMR (75 MHz, CDCl3) spectrum of PE3 ......................................................171
xiv

Abstract of Dissertation Presented to the Graduate School of the University of Florida in Partial Fulfillment of the Requirements for the Degree of Doctor of Philosophy
FROM MOLECULAR OLIGOMERS TO SUPRAMOLECULAR GELS: PHOTOPHYSICS OF CONJUGATED METAL-ORGANIC SYSTEMS
By
Thomas Cardolaccia
August, 2005
Chair: Kirk S. Schanze Major Department: Chemistry
In this dissertation, several series of platinum acetylide oligomers have been
prepared and studied by photophysical methods. The motivation for the research stems
from direct opto-electronic applications that platinum acetylide materials may be used
for, as well as from a more fundamental need to gain a better understanding on the triplet
excited state in conjugated systems.
First, platinum acetylide oligomers containing energy traps were prepared in order
to investigate their effect on the triplet excited state. Second, the delocalization of charge
carriers (radical anions and cations) was studied to determine the charge transport
properties of these materials and the effect of platinum on the charge carriers. Third, a
series of platinum acetylide oligomer was designed to self-assemble in solution with the
goal of determining the consequences of aggregation on the triplet excited state. The goal
of this work was to gain an insight into the dynamics of the triplet excited state in
conjugated systems.
xv

The most significant findings of the study are as follows: (i) although more
localized than the singlet exciton, the triplet exciton is also sensitive to the presence of
energy traps, which can have a significant impact on the photophysical properties of the
materials; (ii) charge carriers are relatively localized on the oligomer chain and the
estimated delocalization of the radical cation is no more than two repeat units; (iii) the
consequences of aggregation on the triplet excited state may be very limited or relatively
important, depending on the mode of aggregation.
xvi

CHAPTER 1 INTRODUCTION
The interaction of light with matter is an elementary process in nature responsible
for the life of plants and many other species. Absorption of light is the source of energy
for plants, of heat for some animals. It is the process by which humans and many other
animals see their environment and are able to interact with it and with each other. In the
next chapter, some concepts relying on the interaction of light with molecules will be
presented. It is therefore important to review several fundamental photophysical
processes before. This introductory chapter is divided into two parts. The first part
reviews several important concepts for photophysical studies such as absorption and
emission of light. Then a closer look is taken of the general structure and photophysical
properties of platinum acetylide polymers and oligomers.
Introduction to Photophysics
Absorption of Light
The understanding of the interaction of light with matter has been considerably
changed with the notion of the dual nature of light and the non-classical description of
atomic structure. Maxwell’s theory of electromagnetism in 1860 and the development of
quantum mechanics started by Schödinger in 1928 have provided scientists with
mathematical equations describing these phenomena.1 Light is often referred to as an
elementary particle called a photon but can also be thought of as an electromagnetic
wave. Electrons also possess this dual nature and can be visualized as an elementary
1

2
particle or a wave. The energy of the photon and the frequency of its electromagnetic
wave are related by the following equation:
λν hchE == (1)
where E is the energy in Joules (J), ν is the frequency (Hz or s-1), h is Planck’s constant
(6.63 x 10⁻³⁴ J.s), c is the speed of light (3.00 x 10⁸ m.s-1 in a vacuum) and λ is the
wavelength (m).
When a molecule interacts with an optical field, the outer valence electrons of the
molecule interact with the light and can be promoted to higher energy levels. For this to
occur, the light, or the photon, must have the appropriate energy (or quantum) that
corresponds to the difference in energy between the two energy levels involved. This is
because the energy levels of the electrons in an atom or a molecule are not continuous but
discrete. Therefore the wavelength of the light absorbed provides the energy difference
between these energy levels. For many conditions, the absorption of radiation follows
Beer’s law
lCTA ε=−= log (2)
where A is the absorbance, T is the transmittance, l is the pathlength of absorption (cm), ε
is the molar absorptivity (L.mol-1.cm-1), and C is the concentration of the absorbing
species (mol.L-1). The molar absorptivity represents the probability of the transition to
occur and is related to the transition dipole moments between the initial and final states.
The molar absorptivity is a function of the radiation frequency and is usually
reported for λmax as εmax. However, a better measure of the transition intensity is obtained
by integrating ε over the whole absorption spectrum,2 which gives the integrated
absorption coefficient α:

3
υυεα ~)~( dband∫= (3)
The integrated absorption coefficient provides a connection between the
experimental spectrum and a theoretical quantity known as the oscillator strength, fnm.
This latter is a measure of the strength of an electric dipole transition between electronic
states n and m compared to that of a free electron oscillating in three dimensions. It is
given by
αε
⎟⎟⎠
⎞⎜⎜⎝
⎛= 2
20 )10ln(4
eNcm
fA
enm (4)
where ε0 is the permittivity of vacuum, me is the mass of the electron, c is the speed of
light in vacuum, NA is the Avogadro’s number and e is the elementary charge. The
collection of fundamental constant has a value of 4.319 x 10⁻⁹ mol.L-3.cm2.
Assuming a Lorentzian band profile for the absorption band, the integrated
absorption coefficient can be calculated from the experimental absorption spectrum using
Γ= max21 πεα (5)
where Γ is the full width at half maximum (FWHM). The oscillator strength equation
then becomes
Γ×=Γ
×= −−max
9max9 10784.62
10319.4 επε
nmf (6)
Moreover, the oscillator strength can also be related to the transition dipole moment μnm
272
2
2~10702.4~
38
nmnme
nm hecm
f μνμνπ −×=⎟⎟
⎠
⎞⎜⎜⎝
⎛= (7)
where h is Planck’s constant and the collection of fundamental constant has a value of
4.226 x1052 C-2.m-2.cm, or 4.702 x 10⁻⁷ D-2.cm.

4
Even though the energy involved in an electronic transition is discrete, absorption
bands in molecules do not appear as sharp lines, but usually as more or less broad bands.
The reason for this is that electronic transitions are usually accompanied by vibrational
transitions. The explanation for this lies in the fact that electronic transitions occur very
rapidly (10-15 s) with respect to the re-adjustement time of the inter-atomic distance (10-13
s) and this is referred to as the Franck Condon principle. This can be illustrated by
representing the potential energy curves of the ground and excited states as a function of
their respective equilibrium geometry, as shown in Figure 1-1. Electronic transitions are
termed “vertical” with respect to the equilibrium geometry, conveying the idea that the
electron is excited to the upper state before the nuclei have had the time to re-equilibrate.
Nature of the Excited State
Following excitation and creation of an electronic excited state, the molecule will
first relax to the lowest vibrational level by thermal (emission of heat) or collisional
(collision with solvent or solute molecules) relaxation. When the initial state is a ground
neutral state, the electrons are paired and of opposite spin, according to Hund’s rule. Due
to spin restrictions imposed by quantum mechanics, the electron promoted to a higher
energy level does not change its spin during excitation and the excited state formed is
called a singlet excited state (S1). In certain cases, however, the spin of the promoted
electron can flip and the resulting overall spin momentum of this excited state becomes
equal to three. This process is called intersystem crossing (ISC) and the resulting state is
called a triplet excited state (T1).3 Similarly to the excitation into a singlet excited state,
the triplet excited state formed is first vibrationnally excited and then relaxes to its lowest
vibrational level. In organic molecules, the rate of ISC is slow and consequently the yield
of the triplet excited state is usually low. Certain factors can greatly increase the ISC rate

5
Figure 1-1. Potential energy curves for electronic transitions. (a) Transition between
states of similar equilibrium nuclear geometry. (b) Transition between states of different equilibrium nuclear geometry. The figure was adopted from Gilbert and Baggot.2
and the yield of the triplet excited state is then increased. The process of ISC relies on
spin-orbit coupling and it is facilitated through the heavy-atom effect (internal via
valence bond or external via solvent). In heavy atoms, the spin angular momentum and
the orbital angular momentum of the electron can interact and are not separately

6
conserved. Therefore as long as the total orbital momentum is conserved, the spin of the
electron can be changed. Rapid intersystem crossing and efficient creation of triplet
excited states are thus common in inorganic or organometallic molecules, and the
platinum acetylide systems that are the focus of this study are among them.
Another important feature of excited states is the singlet-triplet splitting energy (ES-
T). The first singlet excited state is always higher in energy than the first triplet excited
state and the reasoning for this is as follows: In the singlet excited state, the electrons are
of opposite spin and are therefore not prevented by quantum mechanics to be in the same
region of space. In the triplet excited state, the electrons are of the same spin and are
therefore forbidden from being in the same region. This leads to a higher coulombic
repulsion energy in the case of the singlet excited state compared to the triplet excited
state. In a small molecule, this repulsive energy is large and the ES-T is therefore also
large. In large molecules such as a conjugated polymer, the repulsive energy may not be
as large and thus ES-T may not be large either.
Relaxation of Excited States
The excited state is metastable and the electrons will return to their initial
configuration (ground state) by one of two self-relaxation mechanisms: radiative decay
and nonradiative decay.
Radiative decay. In radiative decay, the excited electron will relax to the ground
state by emission of a photon. This photon will carry a quantum of energy corresponding
to the energy difference between the geometrically relaxed excited state and ground state,
similar to the absorption process. If the excited state is a singlet, this emission of light is
called fluorescence whereas it is called phosphorescence if the excited state is a triplet.
Since fluorescence is a transition between states of same spins, it is allowed by quantum

7
mechanics and the radiative rate of the singlet excited state is fast (~108 s-1).4
Phosphorescence on the other hand is a transition between states of opposite spin and
although facilitated by the presence of heavy atoms in the molecules, it is not as fast as
fluorescence and the radiative rate of triplet excited states is typically much slower (~105
– 102 s-1). Fluorescence caused by direct excitation to S1 is called more precisely prompt
fluorescence. Delayed fluorescence has a longer lifetime than prompt fluorescence
because S1 is populated by indirect mechanisms. This alternate S1 population can proceed
through a thermally-assisted ISC back to S1 from T1 (T1 → S1, E-type delayed
fluorescence) or through a bimolecular triplet-triplet annihilation (T1 + T1 → S0 + S1, P-
type delayed fluorescence).
Before the radiative decay, the electron has relaxed to the v = 0 vibrational level so
the energy of this transition will be less than that of the absorption. This results in
fluorescence bands appearing at a longer wavelength than the absorption and this is
called the Stokes shift. The extent of the Stokes shift is then a representation of the
structural differences between the ground and excited states. If the excited state is largely
distorted, a large Stokes shift will be observed.
Nonradiative decay. Another type of relaxation mechanism is nonradiative decay.
In this case, energy is released to the system as heat and does not involve a photon. This
process, as well as the vibrational relaxation, is also referred to as internal conversion.
The relative rate of non-radiative decay is governed by the energy gap law, which states
that as the energy of the excited state decreases, the rate of non-radiative decays will
increase exponentially.5-7 The triplet excited state being lower in energy than the singlet

8
for the reason provided above, it is therefore sometimes difficult to observe
phosphorescence, even though the triplet excited state was formed.
It is helpful to look at all these transitions in a representative Jablonski diagram, as
shown in Figure 1-2 below.
There are two characteristics of the excited state that will be encountered in the
next chapters that are worth mentioning at this stage: the photoluminescence quantum
yield Φ and the lifetime τ. The fluorescence quantum yield is the ratio of the number of
emitted photons to the number of photons absorbed4 and it is given by
nrf
fF kk
k+
=Φ (8)
where ΦF is the quantum yield of fluorescence, kf is rate constant of fluorescence and knr
ISC v = 0
S0
IC P IC F A
S1
T1
IC
IC
v = 1v = 0
v = 2v = 3
v = 1v = 2v = 3
A: absorption F: fluorescence P: phosphorescence S0: ground state S1: singlet excited state T1: triplet excited state IC: internal conversion ISC: intersystem crossing
Figure 1-2. Jablonski diagram representing the possible transitions after absorption.

9
is the rate constant of non-radiative decay for S1. In the case of phosphorescence, the
quantum yield is given by
⎟⎟⎠
⎞⎜⎜⎝
⎛+⎟⎟
⎠
⎞⎜⎜⎝
⎛+
=ΦnrP
P
nrF
ISCP kk
kkk
k'
(9)
where ΦP is the quantum yield of phosphorescence, kISC is the rate constant of inter-
system crossing, kP is the rate constant of phosphorescence and k’nr is the rate constant of
non-radiative decay for T1.
The luminescence lifetime τ is defined as the time for the luminescence signal to
decay to 1/e of its initial value.4 The lifetimes for fluorescence τF and phosphorescence τP
are related to the rate constants for deactivation with the following equations
nrF
F kk +=
1τ (10)
nrP
P kk '1+
=τ (11)
Energy Transfer
Other than by self-relaxation, excited states may relax to the ground state by
transferring the excitation to other molecules present in the system by a bimolecular
process as in equation 12 below.
** ADAD +→+ (12)
where D is the energy donor, A is the energy acceptor and * denotes an excited state.
Different mechanisms for energy transfer can occur, depending on the environment, but
some conditions require (1) that the energy of D* is higher than the energy of A*; (2) that
the energy transfer rate is more rapid than the decay rate of D*. Two mechanisms for
energy transfer can be distinguished: exchange and Coulombic energy transfer.

10
Exchange energy transfer. Also called collisional or Dexter energy transfer,8 this
mechanism requires contact or a short separation (6-10 Å) between the donor and the
acceptor. The rate of energy transfer is therefore diffusion controlled and depends on the
temperature and the viscosity of the solvent. It also requires an overlap between the
orbitals of the donor and the acceptor. Both S-S and T-T energy transfer processes are
allowed and this is in fact the dominant mechanism in triplet-triplet energy transfer. The
mechanism can be represented schematically as in Figure 1-3 below. The transfer rate
constant kET is given by
[ ] ( )LrJPhk ET /2exp2/( 2 −∝ π (13)
D* A D A*
Figure 1-3. Diagram for the exchange energy transfer mechanism.
where r is the distance between D and A, L and P are constant not easily related to
experimentally determinable quantities and J is the spectral overlap integral.
The decrease in emission intensity due to collisional quenching9 is described by the
Stern-Volmer equation
][1][1 000 QkQK
FF
qq τ+=+=ΦΦ
= (14)

11
where F and F0 are the fluorescence intensities in the presence and in the absence of the
quencher (or acceptor), respectively, Φ and Φ0 are the quantum yields of fluorescence in
the presence and in the absence of quencher, respectively, Kq is the Stern-Volmer
quenching constant, kq is the bimolecular quenching constant, τ0 is the lifetime in the
absence of quencher, and [Q] is the quencher (or acceptor) concentration. A similar
Stern-Volmer equation can be written in the case of phosphorescence. However, as can
be seen from equation 9, excited species with long lifetimes (such as triplet excited
states) are more prone to quenching than species with short lifetimes (such as singlet
excited states). Oxygen is an efficient quencher of triplet excited states and for this
reason, phosphorescence measurements are usually carried out in deoxygenated solutions
or frozen matrix.
Coulombic energy transfer. Also called the dipole-dipole or Förster energy
transfer mechanism,10 this long-range interaction does not require contact between the
donor and the acceptor. Efficient long-range energy transfer is favored in situations
where the emission spectrum of the donor and the absorption spectrum of the acceptor
overlap. It is important to note that no photon is involved. As opposed to the exchange
energy transfer, only S-S energy transfer is allowed. This type of energy transfer can be
considered to be due to dipole-dipole coupling between the donor and the acceptor and
can be represented as in Figure 1-4 below.
The rate of energy transfer11 in this case is given by
601
⎟⎠
⎞⎜⎝
⎛⎟⎟⎠
⎞⎜⎜⎝
⎛=
RR
kD
ET τ (15)
where τD is the lifetime of the donor, R is the average distance between donor and
acceptor and R0 is the Förster distance (which is a measure of the spectral overlap).
12
D* A D A*
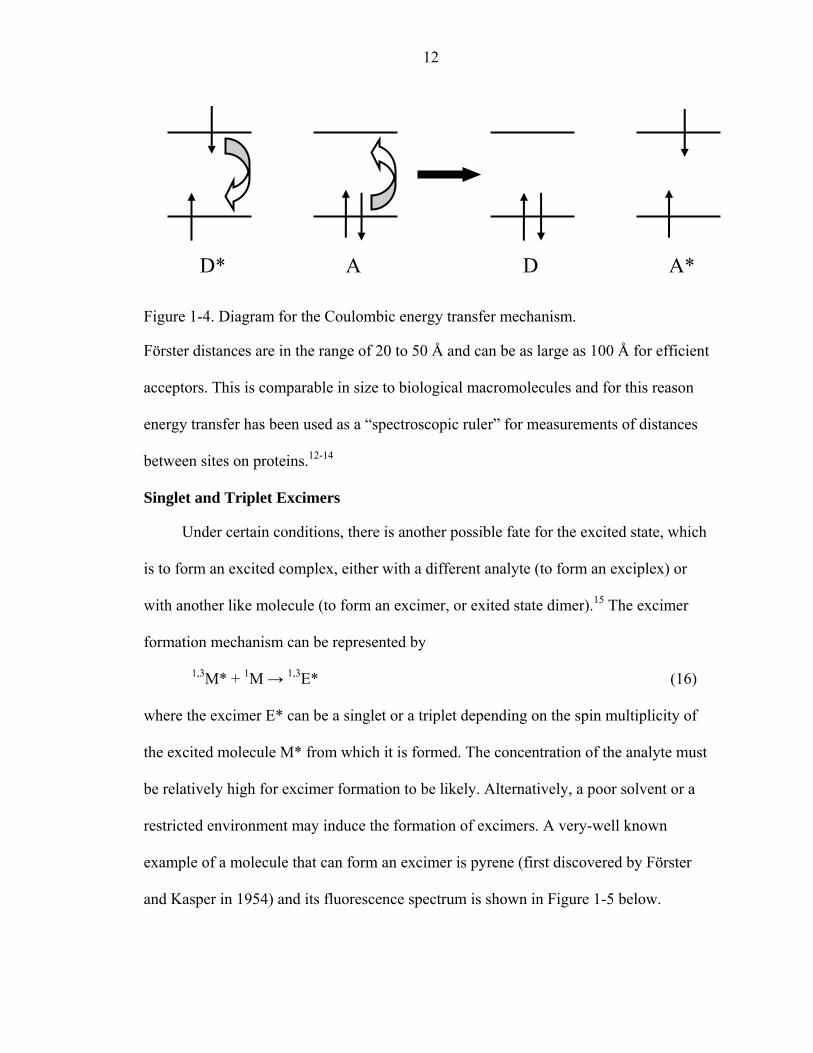
Figure 1-4. Diagram for the Coulombic energy transfer mechanism.
Förster distances are in the range of 20 to 50 Å and can be as large as 100 Å for efficient
acceptors. This is comparable in size to biological macromolecules and for this reason
energy transfer has been used as a “spectroscopic ruler” for measurements of distances
between sites on proteins.12-14
Singlet and Triplet Excimers
Under certain conditions, there is another possible fate for the excited state, which
is to form an excited complex, either with a different analyte (to form an exciplex) or
with another like molecule (to form an excimer, or exited state dimer).15 The excimer
formation mechanism can be represented by
1,3M* + 1M → 1,3E* (16)
where the excimer E* can be a singlet or a triplet depending on the spin multiplicity of
the excited molecule M* from which it is formed. The concentration of the analyte must
be relatively high for excimer formation to be likely. Alternatively, a poor solvent or a
restricted environment may induce the formation of excimers. A very-well known
example of a molecule that can form an excimer is pyrene (first discovered by Förster
and Kasper in 1954) and its fluorescence spectrum is shown in Figure 1-5 below.

13
Figure 1-5. Fluorescence spectra of pyrene solutions in cyclohexane. Intensities are normalized to a common value of ΦFM. Concentrations decrease from A (10-2 M) to G (10-4 M). Figure was adopted from Birks.15
At low concentration, pyrene displays a highly structured emission. At higher
concentrations, a broad structureless band appears at longer wavelengths, due to the
excimer luminescence. This is a general characteristic of excimer luminescence which is
usually broader and red-shifted from the monomeric emission. This is due to the fact that
the ground state of the excimer is unstable and therefore the potential energy of the
ground state dimer increases with decreasing intermolecular distance. Another
consequence of the absence of a bound dimer in the ground state is that a longer lifetime
is usually observed for excimer emission compared to monomer emission. This is
illustrated in Figure 1-6. Studies of fluorescence in crystals,16 sandwich dimers17 and
diarylalkanes18 all indicate that the preferred conformation of singlet excimers is close to
a symmetrical sandwich structure with a separation of 3-4 Å. The binding energy in the

14
Figure 1-6. Potential energy curves for monomer and excimer. This figure was adapted from Gilbert and Baggot.2
singlet excimer comes mainly from the exciton resonance and to a lesser extent from
charge resonance.
Triplet excimers, which are more related to this study, have been less studied due
to the experimental difficulties associated with their detection. In fact there has been
much debate on their existence and identification.19,20 But an extensive and pioneering
work by Lim21 greatly contributed to establish triplet excimers as physical species.
Experimental evidences point towards a different structure for the triplet excimer
than for the singlet. In a spectroscopic study on a series of 1,n-di-α-naphtylalkanes (n=1-
4), Subudhi and Lim22 have concluded that the triplet excimer adopts a skewed

15
conformation, where the short axis of the naphthalene are highly nonparallel while the
long axes are parallel. The angle between the short axes was found to be 100-120°. As a
result, the activation energy of triplet excimer formation is higher than for singlet excimer
and the rate constant of formation of triplet excimer is smaller than for a singlet excimer.
More recently, triplet excimers have also been observed in polymers23 and
fullerenes24 and have been used as the main source of white light emission in
electrophosphorescent organic light emitting devices.25 However, they remain rather
elusive and more work is needed to fully comprehend their photophysical properties.
Exciton Coupling in Molecular Aggregates
In 1962, the molecular exciton model was developed by Davydov26 to provide a
theory describing the effects induced by the strong coupling of the collective excited
states in organic crystals. Later, Kasha and co-workers27,28 provided chemists with a
model derived from the molecular exciton model that would provide simple tools to
predict some of the photophysical properties of non-crystalline molecular aggregates. In
particular, the molecular exciton model has proven useful in explaining the photophysical
properties of porphyrins29,30 and different dyes31,32 in aggregates.
One of the important features of this model is the ability to explain the spectral shift
of the absorption band observed in aggregates. This spectral shift is due to the splitting of
the monomer excited state into two excitonic levels. The exciton band splitting can be
derived from detailed quantum calculations but an approximation of the excited state
interaction can be made by considering the electrostatic interaction of the transition
dipole moments. This is illustrated in Figure 1-7 for co-planar dimers arranged in a
parallel and head-to-tail geometry. In the case of parallel geometry, the out-of-phase
arrangement corresponds to a lowering of energy, so E’ lies lower than E (excited state of

16
monomer), whereas the in-phase dipole interaction gives repulsion, so E’’ lies higher than
E. Since the transition dipole moment is given by the vector sum of the individual
transition dipole moments, transitions from ground-state to exciton state E’ are forbidden
whereas those from ground-state to E’’ are allowed. The spectroscopic consequence of
the exciton splitting will therefore be observed as blue-shift of the absorption in the
aggregate in parallel arrangement compared to the monomer. For the head-to-tail
geometry, the situation is opposite. The in-phase arrangement of individual dipole
moments leads to an electrostatic attraction, whereas the out-of-phase arrangement causes
electrostatic repulsion. However, transitions to E’ are allowed whereas transitions to E’’
are forbidden. In this case, the spectroscopic consequence of the exciton splitting will be
observed as a red-shift of the absorption in the head-to-tail aggregate compared to the
monomer. In the literature, aggregates in parallel arrangement are often referred to as J-
aggregate, and the head-to-tail as H-aggregates.
Figure 1-7. Schematic representation of the energy levels of the excited state of the monomer and of aggregates in parallel (left) and head-to-tail (right) geometry. Solid arrows and dashed arrows represent allowed transitions and forbidden transitions, respectively. This figure was adopted from Kasha.33

17
For planar aggregates composed of N monomers and in the point-dipole
approximation, the exciton splitting energy ΔE is given by
( θμπε
23
2
0
cos314
114 −⎟⎟⎠
⎞⎜⎜⎝
⎛⎟⎠⎞
⎜⎝⎛ −
=ΔRN
NE ) (17)
where ΔE is in joules, μ is the electronic transition moment of the monomer in Coulomb
meter, R is the point-dipole—point-dipole distance in meter and θ is the angle between
the long axis of the molecule and the line of molecular centers. This equation shows that
the exciton splitting energy depends on the number of aggregates, that it is proportional
to the square of the transition moment of the monomer and proportional to the inverse
cube of the distance between monomers. The theory also predicts that for an angle θ =
arcos(1/√3) = 54.7o, the exciton splitting energy is equal to zero and therefore no spectral
shift may be observed in the absorption spectrum. This is the angle for which the
aggregate will shift from J-aggregate to H-aggregate, as shown in Figure 1-8 below.
While the spectroscopic consequence of aggregation can be easily identified in the
absorption spectrum, there is also a consequence on the photoluminescence. In the case
of H-aggregates, where the excited state is the higher excited state E’’, there is usually a
quenching of fluorescence observed in the emission spectrum of aggregates. After
excitation to E’’, there is a rapid internal conversion to the lower exciton level E’. Since
the transition from E’ to the ground-state is not allowed, the system goes back to ground-
state via nonradiative decay or intersystem crossing through the triplet excited state.
Experimentally, the fluorescence detected is red-shifted (as it originates from the lower
excitonic level E’) and longer lived (as the transition from E’ to ground state is
forbidden) compared to the fluorescence of the monomer. A phosphorescence
enhancement was observed by several authors34,35 in the 1950s and was later rationalized
18
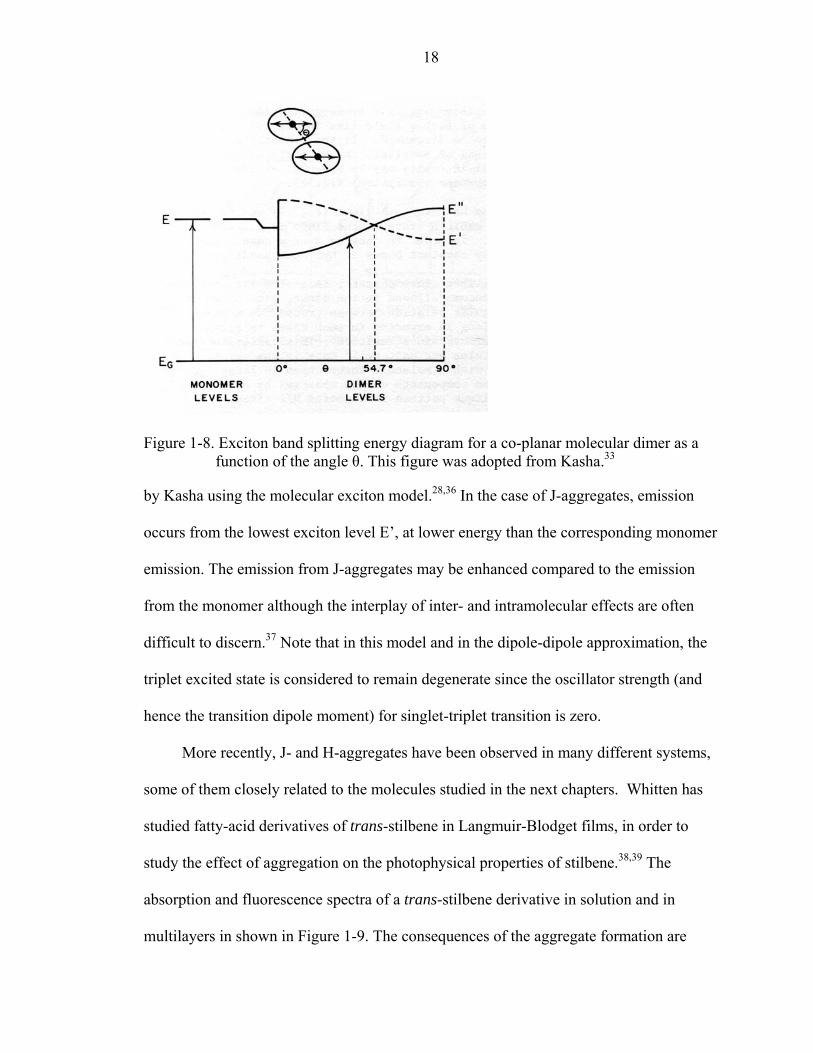
Figure 1-8. Exciton band splitting energy diagram for a co-planar molecular dimer as a function of the angle θ. This figure was adopted from Kasha.33
by Kasha using the molecular exciton model.28,36 In the case of J-aggregates, emission
occurs from the lowest exciton level E’, at lower energy than the corresponding monomer
emission. The emission from J-aggregates may be enhanced compared to the emission
from the monomer although the interplay of inter- and intramolecular effects are often
difficult to discern.37 Note that in this model and in the dipole-dipole approximation, the
triplet excited state is considered to remain degenerate since the oscillator strength (and
hence the transition dipole moment) for singlet-triplet transition is zero.
More recently, J- and H-aggregates have been observed in many different systems,
some of them closely related to the molecules studied in the next chapters. Whitten has
studied fatty-acid derivatives of trans-stilbene in Langmuir-Blodget films, in order to
study the effect of aggregation on the photophysical properties of stilbene.38,39 The
absorption and fluorescence spectra of a trans-stilbene derivative in solution and in
multilayers in shown in Figure 1-9. The consequences of the aggregate formation are

19
found in both spectra. The absorption spectrum shows a hypsochromic shift compared to
the monomer while the fluorescence spectrum shows a bathochromic shift compared to
the monomer. This is consistent with the presence of H-aggregates in the supported
multilayers system. In this case, fluorescence is observed from the lower excitonic state
E’ even though it is a forbidden process. But the lifetime of the fluorescence band in the
multilayers is four times longer (3.3 ns) than the fluorescence lifetime of trans-stilbene
(0.8 ns), consistent with a forbidden radiative decay.38
Examples of J-aggregates are found in a recent study of carbocyanine dyes by
Pawlik et al.40 Cyanines are strongly aggregating systems and the absorption spectrum
(Figure 1-10) shows the presence of aggregates even in dilute solution. However, it is
dependent on the concentration and increases with concentration. The absorption band for
the aggregate is sharp and red-shifted from the absorption band of the monomer,
consistent with a J-aggregate.
Figure 1-9. Absorption and fluorescence spectra for cyclohexane solution (dotted line) and multilayers of fatty acid derivative of trans-stilbene (solid line). Figure was adopted from Whitten.39

20
Figure 1-10. Absorption spectra of a carbocyanine derivative in 10-2 M aqueous sodium hydroxide solution at different concentrations and room temperature. (a) 1.7 x 10⁻⁵ M; (b) 2.2 x 10⁻⁵ M; (c) 4.4 x 10⁻⁴ M. Figure was adopted from Pawlik et al.40
Triplet Excited States in Conjugated Systems
While their presence usually goes undetected in organic conjugated polymers (CPs)
for reasons mentioned previously (slow ISC), triplet excited states are still important in
these systems. This is particularly true for organic light-emitting devices (OLEDs) where
electroluminescence is generated by the recombination of electrons and holes injected
from the electrodes. If conventional spin statistics were applied, only 25% of all
recombination events would lead to potentially emissive singlet states, and 75% would
lead to non-emissive triplet states. However, a number of recent experimental41 and
theoretical42 studies point to the existence of a chain-length dependence on the exciton
spin formation. It is therefore critical for the optimization of OLEDs to understand the
factors controlling the formation of triplet excited states.
The quantum yield of ISC in some representative organic CPs has been measured
by Burrows et al.43 using photoacoustic calorimetry and the values varied from 0.50-0.80

21
for some polythiophenes to 0.01-0.04 for poly(p-phenylene vinylene)s. The higher value
of ISC obtained for the polythiophene are attributed to the efficient spin-orbit coupling
induced by the sulfur atom.
Monkman and Burrows have also carried out an extensive study on a broad range
of organic conjugated polymers and measured their singlet and triplet energies by pulse
radiolysis and energy transfer.44 The polymers studied are presented in Figure 1-11 and a
plot of triplet energy gap against singlet energy gap is shown in Figure 1-12. As can be
seen, there is a linear correlation between the triplet and the singlet energy gaps for the
very different polymers studied. Above the trend line are polymers with rigid and planar
backbone structures while twisted polymers lie below the trend line. From this, it appears
that while planarity enhances the delocalization of singlet excited state, triplets do not
Figure 1-11. Schematic pictures of conjugated polymers studied by Monkman and
Burrows.44

22
Figure 1-12. Plot of triplet energy against singlet energy for the conjugated polymers studied by Monkman and Burrows. Figure was adopted from Monkman et al.44
benefit as much from delocalization enhancements and while torsion angles tend to
localize singlet excited states, this has les impact on the localization of triplet excited
states. It follows then that triplet excitons must be more localized than singlet excitons,
for which it is commonly agreed that their delocalization extends over 7-8 repeat units.
Köhler et al.45 have carried out a systematic study of singlet-triplet splitting energy (ES-T)
in organic poly(phenylene ethynylene) polymers, varying the optical bandgap by
changing the nature of the spacer. They found that the ES-T was always 0.7±0.1 eV and
this is similar to what has been reported in other organic CPs.46,47 Monomers, oligomers
and twisted polymers have higher ES-T because of the exciton confinement, which
impacts the singlet more than the triplet exciton.48
Platinum Acetylides
Structure and Synthesis
Platinum acetylide materials are a class of compounds which have recently
attracted significant attention due to their non-linear optical properties and potential
application in optical limiting. The general structure of a platinum acetylide polymer is

23
presented in Figure 1-13. The aryl group (Ar) is usually a phenyl or a thienyl group,
while the R is typically a short to medium alkyl chain (1 to 8 carbons) or even a phenyl
group.
Figure 1-13. General structure of a platinum acetylide polymer.
The synthesis of the first Pt-acetylide complex was accomplished by Hagihara and
co-workers49 in 1978 and it involves the coupling of a platinum chloride complex with
acetylene. The reaction is carried out in the presence of a base such as an alkylamine
needed for the deprotonation of the arylacetylene while a catalyst such as copper
iodide(I) is used to activate the acetylene function towards deprotonation. To avoid
unwanted oxidation of the catalyst and of the platinum complex, the reaction is best
carried out under inert atmosphere. Recently, it has been found that a trans-platinum
complex is not necessary to obtain trans-platinum acetylide products, as the cis-platinum
complex rapidly isomerizes in the presence of an amine. The two isomers can be
identified by 31P NMR, from the coupling constant between the phosphorous and one of
the NMR active platinum isotope (195Pt, I = ½, 33.8% natural abundance). While a trans
isomer will typically have a JPt-P below 2500 Hz, the JPt-P for the cis isomer is usually
higher than 2500 Hz.50-52
Due to their attractive non-linear optical properties, first reported by Davy and
Staromlynska53,54 in 1994, different architectures of platinum acetylide have been
prepared in the last few years. These include dendrimers55-57 (one of them containing up
to 189 platinum atoms), liquid-forming oligomers,58 and metallamacrocycles.59

24
Excited State
The photophysics of transition metal complexes involve the electrons in the d-
orbitals, which are split into different energy levels depending on the electronic
environment provided by the ligands. In the case of Pt(II) with four ligands, a d8
complex, the ligand field stabilizes the dyz, dxz, dz2 and dxy oriented away from the ligands
and destabilizes the dx2
- y2
pointing towards the ligands. The resulting orbital diagram is
shown in Figure 1-14. As can be seen, the HOMO orbital is the dxy and the LUMO is the
dx2 - y
2 so the photophysics of Pt(II) are expected to involve those two orbitals. Optical
transitions encountered in organometallic complexes may be purely metallic (d-d
transitions) or metal-to-ligand charge-transfer (MLCT). When the ligands have a π-
system, π-π* transitions localized on the ligand may also be observed.
In platinum acetylide oligomers and polymers there is a mixing between the
platinum d-orbitals and the π-system and the optical transitions do not clearly fall in one
or the other category. The extent of mixing depends on the overlap between the ligand
and metal orbitals, the size of the spacer and the extent of conjugation in the ligand. The
emission of platinum acetylide complexes typically shows vibronic bands, which is
consistent with a MLCT or π-π* excited state, but not with a d-d transition. Also,
phosphorescence lifetimes of are often found to be intermediate between a typical 3π-π*
or 3MLCT. Theoretical work60-62 has shown that the HOMO of platinum acetylide
complexes is composed mostly of the π orbitals of the acetylide ligands with some
contribution from the dxy metal orbital, while the LUMO consists only of the ligand π*
orbitals. Therefore the phosphorescence in platinum acetylide complexes is best thought
of as originating from a 3π-π*/3MLCT manifold with predominantly intraligand character.
Platinum acetylide complexes and polymers absorb light into the S1 state between 300

25
5 dxz, dyz
5 dz2
5 dxy
5 dx2-y
2
Figure 1-14. Splitting of d orbital levels in square-planar Pt(II) complexes.
and 400 nm. Rapid and efficient intersystem crossing (with close to unite quantum
efficiency) converts the singlet excited state into triplets, so that their emission spectrum
may show some fluorescence (decay of S1) between 370 and 450 nm and
phosphorescence (decay of T1) between 500 and 600 nm. The triplet excited state absorbs
light into higher triplet excited states (Tn) between 600 and 800 nm.
Several groups, including ours, are actively working on the photophysics of
platinum acetylide complexes and in the next section, the state of the research on these
materials is described.
Chawdhury et al.63 have studied the evolution of the singlet and triplet excited
states with the number of thienyl rings in platinum-acetylide dimers and polymers (shown
in Figure 1-15). From absorption measurements of the polymers and dimers and
comparison with the 2,5-diethynyl-oligothiophenes, they observed that the introduction
of platinum lowers the energy of the S0→S1 transition. This shows that conjugation is

26
preserved through the platinum centers and that they do not confine the singlet exciton.
The photoluminescence spectra of the polymers show a phosphorescence band between
650 and 740 nm, however phosphorescence was not observed for the terthienyl-
containing polymer. They attributed the absence of phosphorescence to the reduced
influence of the heavy-metal center responsible for ISC when increasing the number of
thiophene rings.
Figure 1-15. Structures of platinum acetylide dimers and polymers studied by Chawdhury et al.63
From a closer inspection of the fluorescence bands in the polymers, they observed
increasing intensity in the vibronic bands as the number of thiophene rings increased.
This is an indication that that the excited state geometry differs more from the ground
state geometry and that the excited state takes more of a π-π* thiophene-based character
with increasing thiophene rings. They also observed a constant S1-T1 splitting energy of
0.7 eV across the polymer series.
This constant S1-T1 gap of 0.7 eV was also exhibited in a larger range of platinum
acetylide polymers (shown in Figure 1-16) studied by Wilson et al.64 The polymers were
chosen so that the triplet energy level would be tuned between 2.5 and 1.3 eV and this
trend could be related to changes in nonradiative decay rates. Indeed, shorter lifetimes
and lower quantum yields of phosphorescence were observed as the triplet energy level
decreased, as illustrated in Figure 1-17. Calculations of the radiative and nonradiative
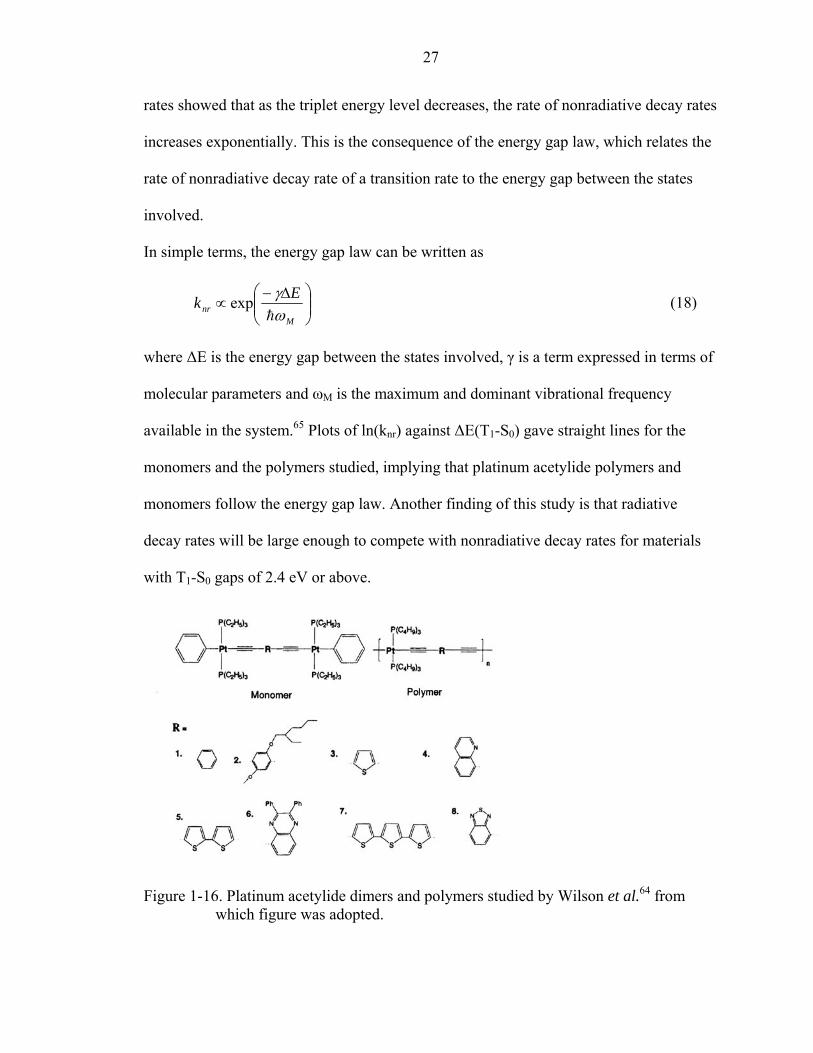
27
rates showed that as the triplet energy level decreases, the rate of nonradiative decay rates
increases exponentially. This is the consequence of the energy gap law, which relates the
rate of nonradiative decay rate of a transition rate to the energy gap between the states
involved.
In simple terms, the energy gap law can be written as
⎟⎟⎠
⎞⎜⎜⎝
⎛ Δ−∝
Mnr
Ekωγh
exp (18)
where ΔE is the energy gap between the states involved, γ is a term expressed in terms of
molecular parameters and ωM is the maximum and dominant vibrational frequency
available in the system.65 Plots of ln(knr) against ΔE(T1-S0) gave straight lines for the
monomers and the polymers studied, implying that platinum acetylide polymers and
monomers follow the energy gap law. Another finding of this study is that radiative
decay rates will be large enough to compete with nonradiative decay rates for materials
with T1-S0 gaps of 2.4 eV or above.
Figure 1-16. Platinum acetylide dimers and polymers studied by Wilson et al.64 from which figure was adopted.

28
Figure 1-17. Absorption spectra (high energy dotted lines) and photoluminescence spectra (at 300 K dotted lines, at 20 K solid lines) of films of polymers P1-P8. Figure was adopted from Wilson et al.64
Extending the series of platinum-containing polymers studied and comparing them
with their respective organic counterparts, Köhler et al.45 proved that conclusions drawn
on the triplet excited state in platinum acetylide polymers could be carried to the
corresponding organic polymers. In a series of 15 platinum-containing and organic
polymers with various optical bandgaps, a constant singlet-triplet energy gap of 0.7 ± 0.1
eV was found in both series (Figure 1-18).
In a study concerned with the influence of the size of the ligand in platinum
acetylide complexes (shown in Figure 1-19), Rogers et al.66 have also greatly contributed
to the field. The study found that the effect of increased conjugation is a red-shift and an
increase in the molar absorption coefficient of S0-S1 and T1-Tn absorption bands and an

29
increase in the singlet-triplet energy gap. The authors concluded that as the conjugation
increased, the S0-S1 transition is more localized on the ligand with less metal character
Figure 1-18. Energy levels of the S1 and T1 excited states and singlet-triplet energy gap for the Pt-containing and organic polymers. Figure was adopted from Köhler et al.45
and therefore slower intersystem crossing occurs. This was supported by the longer
lifetimes of T1 and lower quantum yield of phosphorescence observed.
Finally, our group carried out a systematic study of the delocalization of the singlet
and triplet excited state in a series of mono-disperse platinum acetylide oligomers67
(Figure 1-20). While the previous studies had some indications that the triplet exciton
Figure 1-19. Platinum acetylide oligomers studied by Rogers et al.66 from which figure was adopted.

30
Figure 1-20. Platinum oligomers Pt-n (n = 1-5,7) studied by Liu et al.67
may be more localized than the singlet exciton, no definite conclusions could be drawn
by comparing long conjugated polymers and short monomers. Polymers have a
distribution of chain lengths and it is therefore not possible to relate the molecular weight
of the polymers to the optical properties. The absorption and emission spectra measured
for this series of oligomers is shown in Figure 1-21. The main absorption band found
between 320 and 370 nm red-shifts across the series but the change is small between Pt-5
and Pt-7, indicating that the effective and maximum conjugation length of the S1 state is
approximately 6 repeat units. The emission spectra of the oligomers displayed weak
fluorescence between 370 and 390 nm and was dominated by a strong phosphorescence
band at λ = 518 nm. The fluorescence red-shifted as the oligomer size increased but
leveled off between Pt-5 and Pt-7, consistent with the absorption data. However, the
phosphorescence was found to be independent of oligomer length and this clearly showed
that the triplet exciton is only delocalized over one or two repeat units. Figure 1-22 shows
the estimated size of the triplet exciton based on these experiments. Consistent with this
idea and the observations made in previous studies, the singlet-triplet energy gap was not
constant in this oligomer series and varied from 0.91 to 0.78 eV as the oligomers length
increased.
Objective of Present Study
Platinum acetylide oligomers offer a unique framework to study triplet excited state
in conjugated system. Their monodisperse length and precise chemical structure allows
structure-property relationship to be established by the synthesis of different derivatives.

31
Figure 1-21. Absorption (a) and photoluminescence (b) spectra of Pt-n oligomers. Fluorescence (F) intensity scale is magnified 100X compared to phosphorescence (P). Figure was adopted from Liu et al.67
PtPBu3
PBu3
PtPBu3
PBu3
PtPBu3
PBu3
PtPBu3
PBu3
PtPBu3
PBu3
PtPBu3
PBu3
PtPBu3
PBu 3
Figure 1-22. Triplet exciton confinement in platinum acetylide oligomers. Location of exciton is arbitrary.
The information gained from the study of platinum acetylide oligomers can be
extrapolated to metal-organic68 and even all-organic45 polymers, where the triplet excited
state is just as crucial as the singlet excited state. The need for more research on these
unique molecules is therefore at a fundamental level.
There is also a direct motivation as platinum acetylide oligomers are promising
candidates for optical limiting applications. McKay and co-workers53,69 have found
evidence that platinum acetylide oligomers could be used as the active component of a
broadband, frequency agile optical limiter. This is a crucially important technology for

32
protection against intrusive, possibly damaging, laser radiations that have become
increasingly present.
While the study of platinum acetylide oligomers and polymers carried thus far have
significantly improved general knowledge on triplet excited states in these systems and
related conjugated systems, much work remain to be done. In particular, several
questions still need to be addressed in platinum acetylide materials:
What is effect of a low energy site on triplet excitons? While these effects are
known in the case of the singlet exciton,70,71 the situation may be different given the
relative localization of the triplet excited state compared to the delocalized singlet excited
state. For this, a series of platinum acetylide oligomers Pt4Tn with triplet energy traps
were synthesized. The traps consisted of oligothiophenes (n = 1-3), which are known to
have a lower triplet excited than benzene. The effect of these traps on the photophysical
properties of platinum acetylide oligomer was probed and compared to a “trap-free”
oligomer.
What is the extent of delocalization of charge carriers? In all-organic conjugated
polymers, the charge carriers are believed to extend over several repeat units72 but the
effect of a metal center on the delocalization of charge carriers remains unknown. In
order to determine the extent of delocalization of charge carriers, oligomer series Ptn and
oligomer series P4Ttn were studied with electrochemistry and pulse radiolysis. The first
series of oligomers Ptn (n = 1-5) provided a system to study the delocalization of charge
carriers as a function of conjugation length while the second series of oligomers Pt4Tn
probed the effect of low energy sites on charge carriers.

33
What are the consequences of aggregation? While these consequences can have a
dramatic effect on the singlet exciton and are now fairly well understood,73,74 almost no
information is available for the triplet exciton in conjugated systems. A parallel to
organic crystals has to be made and it remains unclear whether this is reasonable or not.
With the concepts of supramolecular chemistry, complex conjugated systems have
appeared in the literature in the past few years75 and it appeared that platinum acetylide
oligomers could be easily modified and designed to self-assemble. A series of short
platinum acetylide oligomers where the phenylene end-group was tri-substituted with
dodecanoxy chains were synthesized and their photophysical properties in molecular
aggregates studied by steady-state and time-resolved spectroscopy using standard
solution techniques.

CHAPTER 2 TRIPLET EXCITED STATES IN BICHROMOPHORIC PLATINUM ACETYLIDE
OLIGOMERS
Introduction
Conjugated systems have received tremendous attention in the past fifteen years.
Conjugated polymers in particular have been the subject of an enormous research effort,
as they combine attractive photophysical and mechanical properties. Much of the
research efforts are aimed towards understanding the dynamics of the different
photophysical processes involved in an opto-electronic devices. For example in a light
emitting diode, an exciton is formed following recombination of an electron and a hole.76-
78 The radiative decay of this exciton will give rise to luminescence. But the exciton may
encounter a defect or low-energy site within the time of its lifetime, which will usually
lead to nonradiative decay and a reduction of the device luminescence and
performance.79-84 It is therefore important to understand the susceptibility of the exciton
to these low-energy traps, which are almost inevitable in polymer systems.
Most of the conjugated polymers studied are all-organic polymers, the
photophysics of which are dominated by singlet excited states and fluorescence. The
extent of delocalizaton of the singlet exciton85,86 and its migration ability70,87 are now
fairly well understood. The triplet excited state on the other hand, being elusive and not
directly active in all-organic conjugated polymers, has been less studied and is therefore
less understood. Our group has a special interest in platinum acetylide polymers and
oligomers. The introduction of the platinum center in the conjugated backbone increases
34

35
the ISC yield by spin-orbit coupling due to the heavy atom effect induced by platinum.
The photophysics of these platinum oligomers and polymers are therefore dominated by
the triplet excited state and intense phosphorescence emission. These systems provide
access to the triplet excited state and allow its study through standard photophysical
techniques. Using a series of platinum acetylide oligomers of increasing length, our group
has successfully determined the extent of delocalization of the triplet excited state.67
While the singlet excited state is sensitive to changes in conjugation length, the triplet
excited state proved to be rather insensitive to the changes in conjugation length,
implying that it is rather localized. The study points out to a triplet excited state localized
between two platinum centers with some electronic density on the “outer” ligands as
well.
Since the triplet excited state is believed to be much more localized than the
singlet excited state, we wondered whether it would also be sensitive to the presence of
low-energy traps in the conjugated backbone. For this we prepared the series of platinum
acetylide oligomer Pt4Tn containing oligothienyl units in the center. Oligothiophenes are
known to have lower triplet energies than benzene.88,89 It is therefore anticipated that the
oligothiophenes would act as low-energy traps. Thus their influence on the platinum
acetylide photophysics could be observed and compared to a “trap-free” oligomer Pt4.
The structures of the oligomers are shown in Figure 2-1 below. Each oligomer contains
four platinum centers spaced out by phenyleneethynylenes linkages. Pt4 is the “trap-free”
reference oligomer and Pt4T1 to Pt4T3 are the oligomers with an oligothienyl unit
energy trap of decreasing singlet and triplet energy. In the present study, we will first
briefly look at the synthetic pathway to the oligomer series. We will then examine their

36
Figure 2-1. The structures of platinum acetylide oligomers Pt4 and Pt4Tn (n = 1-3).
photophysical properties measured by steady-state and time-resolved techniques. Finally
a discussion will provide some explanations for the results observed and what has been
learned on the dynamics of triplet exciton in these metal-organic conjugated systems.
Synthesis
The synthetic strategy chosen for this series of oligomers is convergent, which
allows the same platinum acetylide complex intermediate to be used for the synthesis of
all four oligomers. The synthesis of the different platinum acetylide complexes 5a-d is
shown in Figure 2-2 below. It started with the iodination of oligothiophenes with N-
iodosuccimide, in the presence of acetic acid and a co-solvent. The diiodo-
oligothiophenes 2b-d were then reacted with 2.1 equivalents of trimethylsilylacetylene
under Sonogashira coupling conditions90 to give the protected diacetylene-

37
oligothiophenes 3b-d in good yields. After deprotection of the acetylenes under basic
conditions, the diacetylene-oligothiophene 4b-d are reacted with 3 equivalents of cis-
dichloro-bis-(tri-n-butylphosphine)platinum(II) in the presence of diethylamine to give
the four different platinum acetylide complexes 5a-d in moderate to good yields.
Figure 2-2. Synthesis of platinum acetylide complexes 5a-d.
The synthesis of the common platinum acetylide complex intermediate 11 is shown
in Figure 2-3 below. This was achieved by subjecting 1,4-diiodobenzene to a one-pot
double Sonogashira coupling reaction with tri-iso-propylsilylacetylene and propargyl
alcohol to give the unsymmetrically protected bis-acetylenebenzene 7. Selective
deprotection of one acetylene function with manganese oxide and potassium hydroxide
gave the unsymmetrically protected bis-acetylene compound 8. In parallel,
phenylacetylene was reacted with cis-dichloro-bis-(tri-n-butylphosphine)platinum(II) to
give platinum complex 9 in excellent yield. This latter was then reacted with compound
8, affording the platinum complex intermediate 10 in very good yield, which after
deprotection with TBAF, gave the desired platinum acetylide complex intermediate 11 in
good yield.

38
Figure 2-3. Synthesis of platinum acetylide complex intermediate 11.
The synthesis of the oligomers was finally achieved by reacting 2 equivalents of the
platinum complex 11 and one equivalent of the required platinum acetylide complex 5a-d
in diethylamine under mild reflux. The oligomers were obtained in moderate to good
yields. The reaction is illustrated in Figure 2-4 below.
The oligomers were characterized by 1H and 31P NMR, MALDI-DIOS and
elemental analysis. The 1H NMR allows the identification of the oligothiophene unit in
each oligomer, their protons appearing downfield compared to the phenylene protons.
The 31P NMR shows two peaks, due to the two different magnetic environments of the
phosphorus atoms in the oligomers. The value of the JPt-P coupling constant (2340-2360
Hz) indicates that all platinum centers have a trans geometry in all oligomers.

39
Figure 2-4. Synthesis of oligomers Pt4 and Pt4Tn (n = 1-3).
Results
UV-Vis Absorption
The absorption spectra of the oligomers were recorded in THF and the results are
presented in Figure 2-5 below. Pt4 displays a strong absorption band at λmax = 352 nm
and some weaker bands at higher energy. The strong band is believed to arise from the
long-axis polarized π,π* transition, whereas the weaker low-energy bands arise from
short-axis polarized transitions.67,91 These transitions are comonly agreed to be mostly
ligand-based and have only little metal-based character. The influence of the low energy
thiophene in Pt4T1 can be observed from the broadening of the main absorption band in
this oligomer. The effect is more pronounced in Pt4T2 and Pt4T3 which both exhibit an
extra thienyl-based band at λmax = 410 nm and λmax = 440 nm in addition to the phenyl-
based absorption. The red-shifting of the thienyl-based absorption is consistent with the
idea that the increasing size and conjugation length of the oligothienyl leads to greater
stabilization of the singlet excited state. From these spectra, it appears that while the
phenyl-based and thienyl-based chromophores are too close in energy to be give two

40
Figure 2-5. Absorption spectra of oligomers in THF. (a) Pt4; (b) Pt4T1; (c) Pt4T2; (d) Pt4T3.
distinct states in Pt4T1, the corresponding larger difference in energy in Pt4T2 and
Pt4T3 allows the identification of two distinctly localized phenyl-based and oligothienyl-
based excited states.
However, the thienyl singlet exciton is not experiencing its optimum delocalization
and stabilization in these oligomers. In a series of thienyl-containing platinum acetylide
polymers, Chawdhury et al.63 reported absorption bands at lower energy (λmax = 457 nm
and λmax = 469 nm for the bithienyl and terthienyl-containing platinum polymers,
respectively) than the thienyl-based absorption here. This is probably due to the

41
confinement of the singlet exciton and to the presence of the higher-energy phenyl
chromophores. Interestingly, the corresponding thienyl-containing platinum acetylide
monomers end-capped with phenylacetylene were found to have absorption bands at λmax
= 406 nm and λmax = 433 nm, very similar in energy to the thienyl-based absorption in
Pt4T2 and Pt4T3. This would imply that the singlet confinement is not the largest
contribution to the difference in stability between the Pt4Tn oligomers series and the
thienyl-containing platinum acetylide polymers.
Steady-State Photoluminescence
The photoluminescence of the oligomers was recorded in deoxygenated THF
solutions with an excitation wavelength λ = 352 nm for all oligomers and the spectra are
shown in Figure 2-6. The excitation wavelength was chosen on the blue edge of the
absorption band of Pt4 to minimize direct excitation of the thienyl units in the Pt4Tn
oligomers. The dotted line across the spectra identifies the position of the main emission
band observed in Pt4. This band is centered at λ = 520 nm and it arises from the
relaxation of a well-studied triplet excited state.45,66,67 The delocalization of the triplet
exciton is believed to be 1-2 repeat units, based on a previous study.67 Very little
fluorescence is seen in the spectrum, implying that intersystem crossing is very efficient
in Pt4. The emission spectrum of Pt4T1 appears very different from that of Pt4. The
spectrum is dominated by a broad band with a maximum at λ = 604 nm, while the
phosphorescence band at λ =520 nm observed in Pt4 is relatively weak. This broad band
is believed to be originating from a thienyl-based triplet excited state. This assignment is
made by comparison with the broad phosphorescence observed around λ = 604 nm in a
platinum acetylide polymer with a thiophene unit as a spacer.63 Some fluorescence is also

42
Figure 2-6. Photoluminescence spectra of oligomers in deoxygenated THF with an excitation λ = 352 nm. (a) Pt4; (b) Pt4T1; (c) Pt4T2; (d) Pt4T3. Dotted line indicates the position of main emission band in Pt4. Solid and dashed lines are for deoxygenated and air-saturated solutions, respectively.
seen in this spectrum (λ = 415 nm) and it is believed to be originating from the thienyl-
localized singlet excited state, as it is not phenyl-based67 and it corresponds to a slightly
less stable singlet excited state than in the thiophene-containing platinum acetylide
polymer reported by Köhler and Beljonne48 (λ = 435 nm). This is consistent with the idea
that the singlet excited state in these oligomers will experience a destabilizing
confinement effect not found in polymers and thus will be found at higher energy than in
the corresponding polymers. The observed maximum delocalization of the singlet excited

43
state in platinum acetylide oligomers was found to be about six repeat units by Liu et al.67
In the present oligomers series, there are only four repeat units, so that the singlet excited
state is confined and experiencing a destabilization compared to the corresponding
polymers.
The emission spectra of Pt4T2 and Pt4T3 are similar. The emission is dominated
by strong fluorescence (λ = 457 nm and λ = 491 nm for Pt4T2 and Pt4T3, respectively)
arising from a thienyl-based singlet excited state. The fluorescence peak shifts to lower
energies from Pt4T1 to Pt4T3, consistent with the bathochromic shift of the thienyl-
based absorption band in the absorption spectra. The singlet excited state energies of
Pt4T2 and Pt4T3 are again found at higher energies than those found in platinum
acetylide polymers with the same oligothienyl unit spacing units.48 Some phenyl-
localized phosphorescence is also observed buried under the fluorescence emission. The
phenyl-based phosphorescence can be identified by comparison with the air-saturated
emission spectrum from which it is not observed. In addition, Pt4T2 displays a very
weak band around λ = 728 nm which arises from the bithienyl-based triplet excited state.
This is consistent with the phosphorescence observed around λ = 746 nm for a platinum
acetylide polymer with a bithiophene spacer.48,63 No terthienyl-based phosphorescence
emission was observed at room temperature in Pt4T3, even in the near-IR up to 1600 nm.
It is interesting to note that Chawdhury et al.63 did not observed phosphorescence from
the terthiophene-containing platinum acetylide polymer at room temperature. They did
however observe this phosphorescence at λ = 816 nm when photoluminescence was
measured at T = 10 K.

44
The overall quantum yields of photoluminescence (fluorescence and
phosphorescence) were measured for Pt4 (Φ = 6.8%), Pt4T1 (Φ = 1.8%) and Pt4T3 (Φ =
0.9%). These values are an important characteristic of this series and will be discussed
further in the discussion. But it is important to notice the decreasing trend of the quantum
yield of photoluminescence as the triplet exciton energy decreases. This trend is in fact
expected as it is a prediction of the energy gap law.64
The effect of the excitation wavelength was studied in order to determine if direct
excitation of the oligothienyl moieties contributes to their observed luminescence (Figure
2-7). We therefore examined the photoluminescence spectrum in THF solutions of each
oligomer at two excitation wavelengths: one is the phenylene-based chromophore
absorption wavelength (λ = 352 nm) and the other is the oligothienyl-based chromophore
absorption wavelength (λ = 369, 409 and 438 nm for Pt4T1, Pt4T2 and Pt4T3,
respectively). The dependence of the photoluminescence on the excitation wavelength is
not dramatic but significant nonetheless. When exciting the oligothienyl units directly,
the phosphorescence observed at λ = 518 nm decreases (in Pt4T1) or disappears (in
Pt4T2 and Pt4T3). It is not entirely unexpected to observe phenyl-based
phosphorescence in Pt4T1 even when exciting at λ = 369 nm since the chromophores are
not resolved in the absorption spectrum due to the proximity of their energy levels. The
absorption spectrum of Pt4 shows that absorption is possible even at λ = 369 nm (see
Figure 2-5) given that ε367 ≈160,000 M-1.cm-1.67 More importantly, the phosphorescence
arising from the oligothienyl group in Pt4T1 (λ = 604 nm) and Pt4T2 (λ = 723 nm) does
not increase significantly upon direct excitation of the thienyl-based chromophore. While
it could be argued that the same amount of thienyl chromophores could be directly

45
Figure 2-7. Photoluminescence spectra of oligomers Pt4Tn in deoxygenated THF. (a) Pt4T1, λex = 352 nm (―), λex = 369 nm (– –); (b) Pt4T2 λex = 352 nm (―), λex = 369 nm (– –); (c) Pt4T3 λex = 352 nm (―), λex = 369 nm (– –).
excited at λ = 352 nm and λ = 369 nm in Pt4T1, it does not hold for Pt4T2, where the
absorption bands of both chromophores are resolved in the absorption spectrum. This
implies that the phosphorescence of the bithienyl units is limited by other factors. One
possible reason is that the nonradiative decay is much faster than the radiative decay of

46
the bithienyl-based triplet excited state and inherently limits the luminescence. Another
reason could be that an equilibrium exists between the phenyl-based and the bithienyl-
based excited state. In this case, no matter how many more bithienyl excited states are
produced by direct excitation, the equilibrium will effectively balance the excitation on
both chromophores.
In order to clarify the exact origin of the bands observed in the emission spectra
of the oligomers, we now turn to the excitation spectra of the Pt4Tn series measured in
THF solutions (Figure 2-8). The oligothienyl fluorescence bands (λ = 415, 457 and 491
nm for Pt4T1, Pt4T2 and Pt4T3, respectively), the phenyl-based phosphorescence (λ
=520 nm) and oligothienyl phosphorescence bands (λ = 604 and 723 nm for Pt4T1 and
Pt4T2, respectively) are monitored while scanning for excitation and the results are very
revealing. It is not surprising to see some of the phenyl-based absorption in the
fluorescence of the oligothienyl since the oligothienyl-based singlet excited state is lower
in energy than the phenyl-based and excitation transfer is therefore downhill. It is
however striking that some of the thienyl-based absorption is seen in the phenyl-based
phosphorescence, as this is uphill and therefore not energetically favorable. This supports
the idea of an equilibrium between the excited states located on the phenylene and the
thienyl, whereby a thienyl-based excited state can transfer some of the excitation back to
the phenyl-based chromophore. The dynamics of the excited state in these oligomers is
therefore more complex than it may have appeared until now and this will be discussed
further in the discussion.

47
Figure 2-8. Excitation spectra of oligomers Pt4Tn in deoxygenated THF. (a) Pt4T1 excitation for λem = 425 nm (―), λem = 520 nm (– –) and λem = 604 nm (– • • –); (b) Pt4T2 excitation for λem = 457 nm (―), λem = 520 nm (– –) and λem = 723 nm (– • • –); (c) Pt4T3 excitation for λem = 500 nm (―), λem = 520 nm (– –).
If an equilibrium is indeed present between the phenyl and thienyl-based excited
state, it may be possible to influence it by changing the temperature. Moreover, lowering
the temperature may reveal the terthienyl phosphorescence that has been elusive so far.

48
Therefore, the photoluminescence spectrum of Pt4T1 was recorded in deoxygenated
MeTHF at low temperature (Figure 2-9). As the temperature decreases, the phenyl-based
emission intensity increases relative to the thienyl-based emission. The change levels off
at 220 K and only an overall intensity change is observed at lower temperatures. This is
consistent with the previously proposed equilibrium concept between the phenyl and
thienyl-based triplet excited state. The thienyl-based triplet excited being lower in energy
Figure 2-9. Low-temperature photoluminescence spectrum of Pt4T1 in deoxygenated MeTHF with an excitation λ = 352 nm. Direction of arrow indicates effect of decreasing temperature from 300 K to 220 K. Region between 730 and 750 nm is removed because a strong scattering peak appears at this wavelength.
than the phenyl-based, the energy transfer to the phenyl-based is energetically not
favorable and is slowed down at lower temperature. However, this could also be due to
an activation energy associated with the energy transfer from the phenyl to the thienyl-
based triplet excited state.

49
Photoluminescence of Pt4T2 and Pt4T3 (Figure 2-10) were recorded under similar
conditions and the emission at 90 K and 300 K are shown only. The effect of temperature
appears to be the same as the one observed in Pt4T1. Compared to the emission spectrum
at room temperature, the phenyl-based phosphorescence is stronger and dominates the
emission in Pt4T2 and Pt4T3 at T = 90 K. In fact, the phenyl-based phosphorescence
band at λ = 520 nm in Pt4T3 is almost identical to the phosphorescence of Pt4 at room
temperature (see Figure 2-6). No terthienyl-based phosphorescence was detected at T =
90 K in Pt4T3, even in the near-IR region up to 1600 cm (not shown).
Transient Absorption
In order to better understand the nature of the excited state present following the
excitation of the oligomers, their transient absorption spectrum was recorded in
deoxygenated THF (Figure 2-11). All oligomers feature a strong triplet-triplet (T1-Tn)
absorption band between 600 and 700 nm, and the lifetimes extracted from the decay of
this band are presented in Table 2-1. The lifetime of the triplet excited state present is
longest for Pt4 (17.3 μs) and decreases from Pt4T1 (9.4 μs) to Pt4T2 and Pt4T3 (4.4 and
4.6 μs, respectively), which have a similar lifetime. All oligomers also feature a bleaching
band between 360 and 440 nm, where the singlet ground state absorbs. The red-shift and
the narrowing of the T1-Tn band from Pt4T1 to Pt4T3 is a clear indication of a thienyl-
based triplet excited state. This is particularly significant for Pt4T3, where no terthienyl-
based phosphorescence was observed in the steady-state photoluminescence study. The
red-shift of the triplet-triplet absorption band is consistent with a more stable triplet
exciton as the size of the oligothienyl increases. The narrowing of the band implies that
the triplet exciton is also better defined as the size of the oligothienyl increases.

50
Figure 2-10. Low-temperature photoluminescence spectrum in deoxygenated MeTHF with an excitation λ = 352 nm at T = 90 K (―) and T = 300 K (– –). (a) Pt4T2; (b) Pt4T3.
Time-Resolved Photoluminescence
In order to gain insight into the dynamics and decays of the triplet excited states,
time-resolved emission measurements were carried out in deoxygenated THF on the three
oligothienyl-containing oligomers (Figure 2-12). The lifetimes extracted from these
measurements, as well as other relevant data for the platinum acetylide oligomers are
presented in Table 2-1. The lifetimes are on the order of microseconds in support of our

51
Figure 2-11. Transient absorption spectra of oligomers in deoxygenated THF following 355 nm excitation. (a) Pt4, 4 μs delay; (b) Pt4T1, 1.6 μs; (c) Pt4T2, 1.6 μs delay; (d) Pt4T3, 1.6 μs delay.
assignment as emission from a triplet excited state for the emission bands at λ = 606 nm
and λ = 723 nm for Pt4T1 and Pt4T2, respectively. It also supports the assignment as
fluorescence for the emission bands observed between λ = 415 and 491 nm in Pt4T1 to
Pt4T3. These bands decayed within ~ 200 ns and are typical of a singlet excited state
lifetime. Since any prompt fluorescence has been gated out in these experiments, the
phenyl-based phosphorescence is now clearly identified in Pt4T2 and Pt4T3. However
once again, no phosphorescence from the terthienyl was detected by time-resolved
measurements. All emission decays were found to give better fit with a bi-exponential
function than with a mono-exponential function. Therefore, the lifetimes extracted from
this sets of measurements shown in Table 2-1 give the lifetime and the corresponding
contribution of each exponential decay.

52
Figure 2-12. Time-resolved photoluminescence spectra of oligomers Pt4Tn in deoxygenated THF following 355 nm excitation. (a) Pt4T1, camera delay 0.4 μs, delay increment 1.3 μs; (b) Pt4T2, camera delay 0.5 μs, delay increment 2.0 μs; (c) Pt4T3, camera delay 0.4 μs, delay increment 2.5 μs.
The presence of the oligothienyl units is reflected in the lower lifetimes for the
phenylene emission in all Pt4Tn oligomers compared to Pt4. The oligothienyl units act as
energy acceptors and provide an alternate relaxation pathway for the phenyl-based triplet
excited state, resulting in a shorter phenyl-based triplet excited state lifetime in all Pt4Tn

53
oligomers. For the phenylene emission decay, it is difficult to make a prediction on what
should be observed. If energy transfer takes place through an exchange mechanism,
which depends on the orbital spectral overlap between donor and acceptor, the rate of
energy transfer and thus the phenylene emission lifetime should not change across the
Pt4Tn oligomers series. Indeed, the orbital overlap between the donor (phenyl-based
triplet excited state) and the acceptor (oligothienyl-based triplet state) should not change
across the Pt4Tn oligomers series, as the same orbitals are most likely involved in all
cases (3π,π with some metal character). However, other unidentified effects may also
have an influence on the energy transfer rate. As can be seen from Table 2-1, while the
phenylene lifetime drops from Pt4 to Pt4T1, it is slightly longer for Pt4T2 and about the
same for Pt4T3. For the thienyl emission decay, for which one would expect the lifetime
to get shorter as the thienyl-based triplet excited state energy level decreases, the
lifetimes for Pt4T2 and Pt4T3 seem to follow the prediction based on the energy gap
law. However it is difficult to interpret this as an energy gap law effect since only two
decay lifetimes are available. These results only seem to indicate that the dynamics of the
triplet exciton are not well-behaved and do not involve only forward energy transfer from
a phenyl-based to a thienyl-based triplet excited state.
Discussion
Energy of the Triplet Excited State in Pt4T3.
It is possible to estimate the energy of the terthienyl-based triplet excited state
present in Pt4T3. As discussed in the first chapter, the singlet-triplet splitting energy is
constant in a family of platinum acetylide polymers, regardless of the energy of the
singlet excited state. In monomers and oligomers, the S1-T1 gap is larger than for the

54
Table 2-1. Photophysical data for oligomers Pt4 and Pt4Tn. UV-vis PL φf τ λmax / nm λmax / nm / % TAg / μs PLh / μs Fd Pe Pi Tnj
Pt4 366 389 517 6.8 17.3 18.6 b Pt4T1 369 415 516, 606 1.8 9.4 0.8 (64%) 1.1 (43%) 8.4 (36%) 7.4 (57%) Pt4T2 354, 409 457 515, 723 a 4.4 2.7 (51%) 1.6 (51%) 11.8 (49%) 4.7 (49%) Pt4T3 353, 438 491 511 0.9 4.6 1.4 (56%) b 12.7 (44%) a Not measured; b Not applicable; c From ref.67; d F: fluorescence; e P: phosphorescence; f Total quantum yield of photoluminescence (F+P); g Transient absorption decay lifetime; h Photoluminescence decay lifetime (number in parentheses indicates relative amplitude of component); i P: decay at 517 nm; j Tn: decay at 606 nm for Pt4T1, decay at 723 nm for Pt4T2.
corresponding polymer. This difference has been attributed to the fact that the triplet
exciton is more localized than the singlet exciton and is therefore less sensitive to the
confinement effect experienced by the singlet exciton in monomers and oligomers.
Polymers with either thiophene, bithiophene or terthiophene as the spacer in platinum
acetylide polymers have been studied by Köhler et al.45 and a constant S1-T1 energy gap
of 0.7 ± 0.1 eV was found for these three polymers. It is therefore expected that the S1-T1
gap should be close but higher than this in our oligomers series.
From the steady-state emission fluorescence and phosphorescence of the mono-
and bithienyl chromophores in Pt4T1 and Pt4T2, the S1-T1 energy gap can be calculated:
Pt4T1: ES-T = ES- ET = 0.94 eV
Pt4T2: ES-T = ES- ET = 1.00 eV

55
As can be seen, these values of S1-T1 are very close. If we assume a value of 1.0 ± 0.1 eV
for the series of Pt4Tn oligomers, the energy of the terthienyl-based triplet excited state
should be:
Pt4T3: ET = ES - ES-T = 1.52 eV
This value is similar to the S-T splitting energy found in a platinum acetylide polymer
based on the terthienyl spacer.64 This means that a terthienyl-based phosphorescence
would appear at λ = 816 nm and that it should have been detected in our measurements if
this state was sufficiently emissive. In fact this emission has been detected by Chawdhury
et al. at a temperature T =10 K at the exact same position λ = 816 nm in a terthiophene-
containing platinum acetylide polymer.63
The Absence of Phosphorescence in Pt4T3
Now that the energy of the terthienyl-based triplet excited state and the wavelength
at which it should have appeared have been determined, some possible explanations for
the absence of phosphorescence from this excited state will be provided.
While phosphorescence from the terthienyl chromophore in Pt4T3 was not
successfully detected, it is important to bear in mind that such a state exists in this
molecule. Evidence for this lies in its transient absorption spectrum which clearly
identifies a triplet excited state fitting the trend started in Pt4T1 and Pt4T2. The red-
shifting and the narrowing of the T1-Tn band is consistent with a terthienyl-based triplet
excited state. As seen in Chapter 1, radiative decays are always in competition with
nonradiative decay processes and the observation of light emission only means that the
radiative rate is fast enough to compete with the nonradiative decay rate. In the case of
Pt4T3, the absence of terthienyl-based phosphorescence only means that for this excited
state, the radiative rate is too slow and that the relaxation of the terthienyl-based triplet

56
excited state occurs only through nonradiative channels. One reason for that is that as we
move from Pt4T1 to Pt4T3, the organic content of the oligothienyl chromophore
increases and the metal content decreases. Therefore the spin-orbit coupling must be less
efficient so ISC should be slower. The consequences are a slower rate of radiative decay
for the T1-S0 transition and a lower quantum yield of phosphorescence. Cryogenic
temperatures in a frozen solvent matrix are often used to detect phosphorescence too
weak at room temperature. However, the photoluminescence spectrum of Pt4T3 recorded
under these conditions (although T = 70 K was the lowest temperature where the
measurement was carried) did not reveal the terthienyl-based phosphorescence. Looking
at the low-temperature photoluminescence of Pt4T1 at low-temperature, it appears that
lowering the temperature favors the phenyl-based emission more than the thienyl-based.
Therefore, the same effect can be expected in Pt4T3 and it should not be surprising that
the low-temperature emission spectrum did not display any terthienyl-based
phosphorescence.
While a slower ISC is probably partly responsible for the absence of
phosphorescence from the terthienyl-based triplet excited state, there is almost certainly
another factor playing a part. As already discussed in Chapter 1, the energy gap law has
been shown to apply to platinum acetylide polymers and monomers.64 It had previously
been shown to apply to metal complexes7,92. Simply stated, the energy gap law predicts
that as the energy of the triplet excited state decreases, the rate of nonradiative decay
increases exponentially. In fact, the calculated radiative and nonradiative rates for the
terthiophene platinum acetylide polymer64 were found to be kr = 3 x 10³ s-1 and knr = 4.2
x 106 s-1 at 300 K. At 20 K, they were kr = 0.4 x 10³ s-1 and knr = 6 x 10⁵ s-1. These values

57
mean that at room temperature, the rate of radiative decay is too small to compete with
nonradiative decay for a terthienyl-based triplet excited state. The authors concluded
from their study that rates of nonradiative decay are only small enough for materials with
a triplet energy level of 2.4 eV and more, which is well above our estimate of the energy
level of terthienyl-based triplet excited state (1.52 eV).
Excited State Dynamics
So far, it has been shown that the presence of a low-energy trap can have a
dramatic effect on the photophysical properties of platinum acetylide oligomers.
Introduction of a thiophene unit results in a bathochromic shift of 90 nm with lower
quantum yield of photoluminescence. Introduction of even lower energy trap such as
bithiophene and terthiophene results in an emission spectrum dominated by fluorescence
from the trap and the long-lived phosphorescence is lost. This could potentially be very
problematic for optical applications relying on the triplet excited state of this type of
compound.53,69
It is therefore critical to understand the dynamics of the triplet excited state in these
systems and the interplay of low-energy sites. The photophysical study of this series of
oligomers with energy traps of decreasing energy has shown that the dynamics of the
triplet exciton in these systems is rather complicated. There appears to be more than just a
simple energy migration to the low-energy traps and subsequent decay from those traps.
Several experiments seem to indicate the presence of an equilibrium between the
phenylene and thienyl-localized excited states. Evidence for the equilibrium lies in the
excitation spectra of the Pt4Tn oligomers which shows that the phenylene emission is
arising from excited states localized both on the phenylene and on the oligothienyl
moieties, with equal contributions. This can be explained by an equilibrium between the

58
phenyl-based and thienyl-based excited state. Also, the photoluminescence collected
upon direct excitation of the oligothienyl fragment did not show a significant increase in
thienyl luminescence, either from the singlet or the triplet excited state localized on the
oligothiophenes. This is also consistent with an equilibrium effectively balancing the
proportion of excited states and their respective luminescence, which is shown to be quite
independent of the location of the initially formed excited state. The low-temperature
photoluminescence of Pt4T1 revealed that the energy transfer is slowed down at lower
temperature and relatively more phosphorescence from the phenyl-based triplet excited
state is observed. This is also consistent with an equilibrium where the least energetically
favorable process (back energy transfer to higher excited state is endothermic) is slowed
down at lower temperature. However, this could also be explained by a simple thermally-
activated energy transfer from the phenyl-based to the thienyl-based triplet excited state.
The lifetime data extracted from the emission decays are not easily interpreted and
rationalized. While the thienyl-based phosphorescence seems to be in agreement with the
expected decreasing trend with the decrease in triplet energy level, the phenylene-based
phosphorescence does not really follow any trend. Although this does not support the
presence of an equilibrium, it does not disprove it either.
To illustrate this equilibrium, the photophysical processes involved in the
oligomers series is presented in Figure 2-13 below. The equilibrium would be brought in
by relatively efficient processes 11 or 9, in addition to the forward processes 10 and 8.
The experiments carried out in this study do not allow distinguishing whether the forward
energy transfer takes place between the singlets (process 8) or the triplets (process 10).
In fact both the singlet and the triplet energy transfer could be operating in this system.

59
P Tn
S0
S1
T1En
ergy
S1
T11 2
6
3 7
8
9
10
11
12
4 13
5
Figure 2-13. Energy diagram representing the photophysical processes involved in the Pt4Tn oligomers.
For the singlets to be in equilibrium, this would require singlet energy transfer (processes
8 and 9) to be faster than ISC (processes 5 and 12). Both of these processes have been
shown to be fast93,94, therefore it is not possible to rule out the singlet or the triplet energy
transfer without exact calculations of the rate constants for the processes involved.
Although not commonly observed and studied, the presence of an excited state
equilibrium is not unprecedented. In fact such a dynamic equilibrium has been observed
recently in related metal-organic oligomers95-97. The absence of a clear trend in the
lifetimes of emission suggests that while the equilibrium might be operating in Pt4T1, it
does not seem to be the case in Pt4T2 and Pt4T3. Indeed, it appears that in Pt4T1, the
phenyl-based and the thienyl-based triplet excited states decay at similar rates (7-8 μs),
close to the lifetime extracted from transient absorption (9 μs). However, in Pt4T2, the
phenyl-based and the bithienyl-based triplet excited states do not decay at the same rate.

60
The lifetime of the phenyl-based triplet excited state increases (12 μs), closer to the
lifetime observed in Pt4 (18 μs), while the lifetime of the bithienyl-based triplet excited
state decreases further (5 μs). It is however in accordance with the lifetime of triplet
excited state detected by transient absorption, supporting the idea that this latter is
localized on the bithiophene. Therefore if there are strong evidences for an excited state
equilibrium in Pt4T1, it appears to be dependent on the energy gap and does not operate
in the other oligomers of the series.
Conclusion
In this chapter, a series of platinum acetylide oligomers has been synthesized and
their photophyisical properties studied. The oligomers incorporated oligothiophene units
in the main chain to act as energy traps. The increasing length the oligothiophenes
provided a series of oligomers with decreasing energy trap.
The photophysics of these oligomers have shown that the presence of an energy
trap can have dramatic consequence on the photophysical properties of the oligomers.
Efficient energy transfer creates excited state on the low energy sites. From there,
radiative decay can occur and red-shifted emission can be observed. Alternatively, the
radiative decay rate may become too small to compete with nonradiative decay as the
energy of the trap decreases and the excited state created by energy transfer will relax by
nonradiative decay processes. It has been shown that the energy of the trap can determine
the dominant relaxation mechanism, due to the energy gap law. Finally, the presence of
an excited state equilibrium has been suggested to explain the photophysical data
collected on this oligomer series. However, the equilibrium seems to depend upon in the
energy gap between the excited states and may be shut down by large energy gaps
between excited states.

61
Experimental
Photophysical Measurements
Steady-state absorption spectra were recorded on a Varian Cary 100 dual-beam
spectrophotometer. Corrected steady-state emission measurements were conducted on a
SPEX F-112 fluorescence spectrometer. Samples were degassed by argon purging for 30
min and concentrations were adjusted to produce “optically dilute” solutions (i.e., Amax <
0.20). Low-temperature fluorescence measurements were made by cooling the samples in
a LN2 cooled Oxford Instruments DN-1704 optical cryostat connected to an Omega
CYC3200 temperature controller. Samples were degassed by 4 repeated cycles of freeze-
pump-thaw on a high vacuum line.
Photoluminescence quantum yields were determined according to the “optically
dilute” method described by Demas and Crosby, with the quantum yield being computed
according to eq. 14 in their paper.98 fac-Ir(2-phenylpyridine)3 was used as an actinometer
(ΦF = 0.40 in THF) .
Transient absorption measurements were conducted on a home-built apparatus,
which has been described elsewhere.99 Samples were contained in a cell holding a total
volume of 10 mL and the contents were continuously circulated through the pump-probe
region of the cell. Samples were degassed by argon purging for 30 mn. Excitation was
provided by the 3rd harmonic output of a Nd:YAG laser (355 nm, Spectra Physics, GCR-
14). Typical pulse energies were 5 mJ/pulse which corresponds to an irradiance in the
pump-probe region of 20 mJ/cm. Sample concentration were adjusted so that A ≈ 0.8.
Time-resolved emission measurements were recorded on a home-built apparatus
consisting of a Quanta Ray GCR Series Nd:YAG laser as a source (λ = 355nm, 10 ns
fwhm), with time-resolved detection provided by an intensified CCD detector (Princeton

62
Instruments, PI-MAX iCCD) coupled to an Acton SpectraPro 150 spectrograph.
Optically dilute solutions were used.
Mass Spectrometry of Pt Oligomers
The samples were analyzed using a Bruker Reflex II time-of-flight mass
spectrometer equipped with delayed extraction (Bruker Daltonics, Billerica, MA). The
analysis mode was desorption ionization on silicon (DIOS).100 The samples were
dissolved in dichloromethane at 1-10 µM and 1 µL was spotted on a DIOS plate that had
been electrochemically etched with HF under tungsten light illumination.101 Desorption
was achieved using a nitrogen laser at 337 nm.
Synthesis
General. All chemicals used for synthesis were of reagent grade and used without
purification unless noted. Reactions were carried out under an argon atmosphere with
freshly distilled solvents, unless otherwise noted. 1H, 13C and 31P NMR spectra were
recorded on a Varian Gemini 300, VXR 300 or Mercury 300 spectrometer and chemical
shifts are reported in ppm relative to TMS. cis-Dichloro-bis(tri-n-butylphosphine)-
platinum(II)102 and 1,4-diethynylbenzene67 were prepared by literature methods.
2,5-diiodothiophene (2b). Thiophene (1.0 g, 11.9 mmol) and N-iodosuccinimide
(5.48 g, 24.4 mmol) were dissolved in acetic acid (6 mL) and chloroform (8 mL). The
flask was covered with aluminum foil and the mixture was stirred at room temperature
overnight. The mixture was then washed with 10% sodium thiosulfate and water, the
organic phase was dried on MgSO4, filtered and the solvent was removed. The dark red
oil obtained was further purified by column chromatography (silica gel, hexane) giving
the desired product 2b as a yellow oil (3.0 g, 75%). 1H NMR (C6D6, 300 MHz) δ 7.23 (s,
2H); 13C NMR (C6D6, 75 MHz) δ 77.0, 139.3.

63
5,5’-diiodo-2,2’-bithiophene (2c). 2,2’-Bithiophene (0.5 g, 3 mmol) and N-
iodosuccinimide (1.67 g, 7.5 mmol) were dissolved in methanol (45 mL). To this
solution, acetic acid (0.5 mL) was added. After stirring for 2 hours, a precipitate had
formed and the flask was placed in freezer overnight to ensure complete precipitation of
product. The white solid was then filtered by suction filtration and washed with cold
methanol. After drying under vacuum, product 2c was obtained as a white solid (0.80 g,
64 %). 1H NMR (CDCl3, 300 MHz) δ 6.80 (d, 2H), 7.18 (d, 2H).
5,5’’-diiodo-[2,2’-5’,2’’]-terthiophene (2d). [2,2’-5’,2’’]-terthiophene (0.1 g, 0.4
mmol) and N-iodosuccinimide ( 0.199 g, 0.89 mmol) were dissolved in dichloromethane
(6 mL) and acetic acid (0.05 mL) and flask was purged with nitrogen. The mixture was
stirred in a water/ice bath for 2 hours after which time a yellow solid had precipitated.
The solid was collected by suction filtration, washed with cold methanol and dried under
vacuum giving product 2d as a yellow solid (0.15 g, 73 %). 1H NMR (C6D6, 300 MHz) δ
6.39 (d, 2H), 6.58 (s, 2H), 6.74 (d, 2H).
2,5-Bis-[(trimethylsilyl)-ethynyl]-thiophene (3b). 2,5-diiodothiophene 2b (2.0 g,
5.96 mmol) and trimethylsilylacetylene (1.22 g, 12.5 mmol) were dissolved in Et2NH (8
mL) and the solution was degassed with argon for 30 min. Then, Pd(PPh3)2Cl2 (0.21 g,
5% eq., 0.298 mmol) and CuI (0.114 g, 10 % eq., 0.596 mmol) were added and mixture
was stirred at room temperature for 12 hours. The mixture was then passed through a bed
of Celite, washed with 10 % ammonium hydroxide, water, the organic phase dried on
MgSO4, filtered and the solvent was removed. Chromatography (silica gel, hexane) gave
the desired product 3b as a yellow solid (1.15 g, 70 %). 1H NMR (CDCl3, 300 MHz) δ
64
0.22 (s, 18H), 7.05 (s, 2H); 13C NMR (CDCl3, 75 MHz) δ 0.01, 97.1, 100.1, 124.7, 132.5,
169.0.
5,5’-Bis-[(trimethylsilyl)-ethynyl]-2,2’-bithiophene (3c). This compound was
synthesized according to the same procedure used for 2,5-bis-[(trimethylsilyl)-ethynyl]-
thiophene 3b except 5,5’-diiodo-2,2’-bithiophene 2c (0.2 g, 0.48 mmol) was used and the
reaction was completed in 4 hours. The desired product 3c was obtained as a yellow solid
(0.129 g, 75 %). 1H NMR (CDCl3, 300 MHz) δ 0.22 (s, 18H), 7.00 (d, 2H), 7.10 (d, 2H);
13C NMR (CDCl3, 75 MHz) δ 0.1, 97.4, 100.7, 122.7, 123.9, 133.6, 138.2.
5,5’’-Bis-[trimethylsilyl)ethynyl]-[2,2’,5’2’’]-terthiophene (3d). This compound
was synthesized according to the same procedure used for 2,5-bis-[(trimethylsilyl)-
ethynyl]-thiophene 3b except 5,5’’-diiodo-[2,2’-5’,2’’]-terthiophene 2d (0.135 g, 0.27
mmol) was used and the reaction was stirred at 45˚C for 2 hours. The desired product 3d
was obtained as a bright yellow solid (0.096 g, 81 %). 1H NMR (CDCl3, 300 MHz) δ
0.24 (s, 18H), 7.01 (d, 2H), 7.08 (s, 2H), 7.14 (d, 2H).
2,5-Diethynyl-thiophene (4b). 2,5-bis-[(Trimethylsilyl)-ethynyl]-thiophene 3b
(0.392 g, 1.42 mmol) was dissolved in methanol (24 mL) and the solution was degassed
with nitrogen. To this solution, 0.1 mL of a 0.5 M KOH solution was added and the
mixture was stirred at room temperature for 2 hours. After this time, water (50 mL) was
added and the mixture was extracted with pentane, the organic phase dried on Na2SO4,
filtered, and the solvent was removed under reduced pressure at room temperature. The
desired product 4b was obtained as a colorless oil (0.15 g, 80 %). 1H NMR (CDCl3, 300
MHz) δ 3.5 (s, 2H), 7.22 (s, 2H); 13C NMR (CDCl3, 75 MHz) δ 76.4, 82.3, 123.8, 132.8.

65
5,5’-Diethynyl-2,2’-bithiophene (4c). 5,5’-bis-[(Trimethylsilyl)-ethynyl]-2,2’-
bithiophene 3c (30.7 mg, 0.086 mmol) was dissolved in THF (2 mL) and the solution was
degassed with nitrogen. Then, tetrabutylammonium fluoride (0.35 mL of a 1 M THF
solution, 0.35 mmol) was added via a syringe and the mixture was stirred at room
temperature protected from light for 3 hours. After this time, the solvent was removed
and chromatography (silica gel, hexane) gave the desired product 4c as a yellow solid
(14.4 mg, 78 %). 1H NMR (CDCl3, 300 MHz) δ 3.4 (s, 2H), 7.04 (d, 2H), 7.19 (d, 2H);
13C NMR (CDCl3, 75 MHz) δ 82.9, 121.6, 124.1, 134.2, 138.3.
5,5’’-Diethynyl-[2,2’,5’,5’’]-terthiophene (4d). 5,5’’-Bis-[trimethylsilyl)ethynyl]-
[2,2’,5’2’’]-terthiophene 3d (93 mg, 0.21 mmol) and K2CO3 (29 mg, 0.21 mmol) were
dissolved in MeOH (9 mL) and THF (4 mL) and solution degassed with argon. The
mixture was stirred at room temperature overnight after which time the solvent was
removed. The brown residue obtained was dissolved in CH2Cl2, washed with 10% HCl,
water, the organic phase dried on MgSO4, filtered and the solvent was removed.
Chromatography (silica gel, hexane) gave the desired product 4d as a yellow solid (43.5
mg, 70 %). 1H NMR (CDCl3, 300 MHz) δ 3.42 (s, 2H), 7.02 (d, 2H), 7.10 (s, 2H), 7.20
(d, 2H).
Complex 5a. 1,4-diethynylbenzene (46.2 mg, 0.373 mmol) and cis-dichloro-bis-
(tri-n-butylphosphine)platinum(II) were dissolved in Et2NH (15 mL) and the solution was
degassed with nitrogen. The mixture was stirred under reflux for 8 hours. The solvent
was removed and the crude product purified by flash chromatography (silica gel, hexane
then 7:3 hexane/CH2Cl2) giving the desired product 5a as a yellow solid (210 mg, 40 %).
1H NMR (CDCl3, 300 MHz) δ 0.85-1.0 (t, 36H), 1.40-1.63 (m, 48H), 1.9-2.0 (m, 24H),

66
7.05 (s, 4H); 13C NMR (CDCl3, 75 MHz) δ 14.0, 22.1, 24.5, 26.3, 101.6, 125.3, 130.5;
31P NMR (CDCl3, 121 MHz) δ 7.89 (JPt-P = 2390.8 Hz).
Complex 5b. This compound was synthesized according to the same procedure
used for complex 5a, except 2,5-diethynyl-thiophene 4b (64 mg, 0.483 mmol) and cis-
dichloro-bis(tri-n-butylphosphine)platinum(II) (0.648 g, 0.967 mmol) were used. Flash
chromatography (silica gel, hexane then 7:3 hexane/CH2Cl2) gave the desired product 5b
as a dark orange oil (288 mg, 43 %). 1H NMR (CDCl3, 300 MHz) δ 0.85-1.0 (t, 36H),
1.40-1.60 (m, 48H), 1.9-2.0 (m, 24H), 6.6 (s, 2H); 13C NMR (CDCl3, 75 MHz) δ 13.9,
22.1, 24.4, 26.2, 53.5, 88.5, 93.9, 127.0; 31P NMR (CDCl3, 121 MHz) δ 8.03 (JPt-P =
2364.0 Hz).
Complex 5c. This compound was synthesized according to the same procedure
used for complex 5a, except 5,5’-diethynyl-2,2’-bithiophene 4c (14.4 mg, 0.067 mmol)
and cis-dichloro-bis(tri-n-butylphosphine)platinum(II) (134.1 mg, 0.2 mmol) were used.
Flash chromatography (silica gel, hexane then 9:1 hexane/CH2Cl2) gave the desired
product 5c as a yellow film-forming oil (82.8 mg, 83 %). 1H NMR (CDCl3, 300 MHz) δ
0.9-1.0 (t, 36H), 1.40-1.65 (m, 48H), 1.9-2.0 (m, 24H), 6.70 (d, 2H), 6.85 (d, 2H); 13C
NMR (CDCl3, 75 MHz) δ 14.0, 22.2, 24.5, 26.2, 91.5, 93.7, 122.6, 128.2, 128.4, 134.9;
31P NMR (CDCl3, 121 MHz) δ 8.15 (JPt-P = 2364.6 Hz).
Complex 5d. This compound was synthesized according to the same procedure
used for complex 5a, except 5,5’’-diethynyl-[2,2’,5’,5’’]-terthiophene 4d (43.5 mg, 0.15
mmol) and cis-dichloro-bis(tri-n-butylphosphine)platinum(II) (201.2 mg, 0.30 mmol)
were used. Flash chromatography (silica gel, hexane then 7:3 hexane/CH2Cl2) gave the
desired product 5d as a yellow film-forming oil (135 mg, 57 %). 1H NMR (CDCl3, 300

67
MHz) δ 0.8-1.0 (t, 36H), 1.4-1.6 (m, 48H), 1.9-2.0 (m, 24H), 6.75 (d, 2H), 6.94 (d, 2H),
6.98 (s, 2H); 13C NMR (CDCl3, 75 MHz) δ 14.0, 22.2, 24.5, 26.3, 92.5, 93.8, 123.2,
123.7, 128.3, 129.1, 134.1, 136.2; 31P NMR (CDCl3, 121 MHz) δ 8.19 (JPt-P = 2347.6
Hz).
3-{4-[(Triisopropylsilyl)-ethynyl]-phenyl}-prop-2-yn-1-ol (7). 1,4-
Diiodobenzene (5.0 g, 15.16 mmol) was dissolved in THF (60 mL) and i-Pr2NH (40 mL)
in a Schlenk flask and the solution was degassed with argon for 30 min. Then, tri-iso-
propylsilylacetylene (2.76 g, 15.16 mmol), Pd(PPh3)2Cl2 (0.642g, 0.9 mmol) and CuI
(0.346 g, 1.8 mmol) were added. The mixture was stirred at 70˚C for 3 hours, after which
time prop-2-yn-1-ol was added dropwise via a syringe. The mixture was stirred overnight
at 70˚C. After cooling down, the mixture was passed through a bed of Celite, washed
with 10% NH4OH (3 x 50 mL) and water (3 x 50 mL), the organic phase dried on
MgSO4, filtered and the solvents were removed. Chromatography on silica (hexane first,
then 9:1 hexane/CH2Cl2) gave the desired product 7 as a red oil (1.65 g, 35 %). 1H NMR
(CDCl3, 300 MHz) δ 1.20 (s, 21H), 4.40 (br, 1H), 4.58 (s, 2H), 7.40 (m, 4H); 13C NMR
(CDCl3, 75 MHz) δ 11.4, 18.7, 51.1, 85.1, 89.3, 92.5, 106.7, 122.7, 123.6, 131.5, 131.9.
1-Ethynyl-4-(tri-iso-propylsilylethynyl)-benzene (8). 3-{4-[(Tri-iso-propylsilyl)-
ethynyl]-phenyl}-prop-2-yn-1-ol (1.43 g, 4.58 mmol) was dissolved in Et2O (80 mL) and
degassed with nitrogen for 15min. Then, activated MnO2 (6.37 g, 73.3 mmol) and KOH
(2.05 g, 36.6 mmol) were added in four fractions every hour and mixture was stirred at
room temperature for 4 hours protected from light. After this time, mixture was washed
with 5% HCl (3 x 50 mL), water (3 x 50 mL), dried on MgSO4, filtered and the solvent
was removed. Chromatography (silica gel, hexane) gave the desired product 8 as a red oil

68
(0.99 g, 86 %). 1H NMR (CDCl3, 300 MHz) δ 0.98 (s, 21H), 2.98 (s, 1H), 7.22 (s, 4H);
13C NMR (CDCl3, 75 MHz) δ 11.3, 18.6, 78.8, 83.2, 92.9, 106.4, 121.9, 124.0, 131.9.
Complex 9. cis-dichloro-bis(tri-n-butylphosphine)platinum(II) (0.500 g, 0.74
mmol) and phenylacetylene (76.5 mg, 0.75 mmol) were dissolved in Et2NH (20 mL) and
degassed with nitrogen for 15 min. The mixture was then stirred under gentle reflux for 8
hours after which time all phenylacetylene has been consumed. Mixture was allowed to
cool down, solvents removed and crude product was purified by flash chromatography
(silica gel, hexane) giving the desired product 9 as yellow solid (522.0 mg, 96 %). 1H
NMR (CDCl3, 300 MHz) δ 0.95 (t, 18H), 1.45 (m, 12H), 1.60 (m ,12H), 2.03 (m, 12H),
7.21 (m, 5H); 13C NMR (CDCl3, 75 MHz) δ 14.02, 21.94, 22.16, 22.38, 24.08, 24.43,
24.52, 24.61, 26.01, 26.29, 26.42, 26.56, 31.79, 125.27, 128.03, 128.01, 130.97, 130.99;
31P NMR (CDCl3, 121 MHz) δ 7.95 (JPt-P = 2395.2 Hz).
Complex 10. Platinum complex 9 (0.235 mg, 0.32 mmol) and 1-ethynyl-4-(tri-iso-
propylsilylethynyl)-benzene (100.0 mg, 0.35 mmol) were placed in Et2NH (6 mL) and
the solution was degassed with nitrogen for 15 min. Mixture was stirred under gentle
reflux for 8h. After cooling down, the solvents were removed and the crude product was
purified by flash chromatography (silica gel, hexane then 4:1 hexane/CH2Cl2) giving the
desired product as yellow solid (258.0 mg, 82%). 1H NMR (300 MHz, CDCl3) δ 0.98 (t,
18H), 1.18 (s, 21H), 1.50 (m, 12H), 1.64 (m,12H), 2.19 (m, 12H), 7.25 (m, 9H); 13C
NMR (75 MHz, CDCl3) δ 11.56, 14.01, 14.32, 15.57, 18.88, 22.86, 23.88, 24.11, 24.34,
24.51, 24.61, 24.69, 24.48, 25.48, 26.56, 31.80, 34.87, 90.67, 107.97, 119.68, 125.03,
128.03, 130.68, 130.95, 130.95, 131.82; 31P NMR (121 MHz, CDCl2) δ 4.21 (JPt-P =
2395.4 Hz).

69
Complex 11. Platinum complex 10 (340.0 mg, 0.35 mmol) was dissolved in THF
(6 mL) and the solution was degassed with nitrogen for 15 min. Then, TBAF (0.70 mL of
a 1M solution in THF, 0.70 mmol) was added and the mixture was stirred at room
temperature protected from light for 4 hours. Then the mixture was diluted to 50 mL with
CH2Cl2 , washed with brine (2 x 30 mL) and water (2 x 30 mL), dried on MgSO4, filtered
and the solvents removed. The crude oil was purified by flash chromatography (silica gel,
hexane then 4:1 hexane/CH2Cl2) giving the desired product as a yellow solid (240.0 mg,
83%). 1H NMR (CDCl3, 300 MHz) δ 0.98 (t, 18H), 1.47 (m, 12H), 1.63 (m, 12H), 2.18
(12H), 7.22 (m, 9H); 13C NMR (CDCl3, 75 MHz) δ 14.07, 23.90, 24.13, 24.35, 24.56,
24.65, 24.74, 26.44, 26.59, 26.74, 84.49, 107.86, 109.16, 109.34, 112.59, 112.79, 123.64,
125.03, 125.11, 128.10, 129.22, 129.98, 130.83, 131.02, 131.96; 31P NMR (CDCl3, 121
MHz) δ 4.22 (JPt-P = 2357.0 Hz).
Pt4. Complex 5a (67.5 mg, 0.048 mmol) and complex 10 (0.08 g, 0.097 mmol)
were dissolved in Et2NH (9 mL) and the solution was degassed with nitrogen for 15 min.
The mixture was stirred under reflux overnight. After cooling down, solvents were
removed and crude product purified by flash chromatography (silica gel, hexane then 7:3
hexane/CH2Cl2) gave Pt4 as a yellow solid (65 mg, 46 %). 1H NMR (CDCl3, 300 MHz) δ
0.95 (t, 72H), 1.47 (m, 48H), 1.65 (m, 48H), 2.15 (m ,48H), 7.20 (m, 22H); 31P NMR
(CDCl3, 121 MHz) δ 3.98, 4.05 (JPt-P = 2363.2 Hz).
Pt4T1. This compound was synthesized according to the same procedure used for
Pt4, except complex 5b (87 mg, 0.062 mmol) and complex 10 (0.103 mg, 0.125 mmol)
were used. Flash chromatography (silica gel, hexane then 7:3 hexane/CH2Cl2) gave
Pt4T1 as a yellow solid (110 mg, 59 %). 1H NMR (CDCl3, 300 MHz) δ 0.95 (t, 72H),

70
1.35 (m ,48H), 1.62 (m, 48H), 2.12 (m, 48H), 6.66 (s, 2H), 7.27 (m, 18H); 31P NMR
(CDCl3, 121 MHz) δ 4.05, 4.08 (JPt-P = 2365.5 Hz); Mass spec. (MALDI-TOF) calc’d for
C140H236P8Pt4S 2979.54, found 2978; Elemental anal. calc’d C 56.43, H 7.98, found C
56.58, H 8.06.
Pt4T2. This compound was synthesized according to the same procedure used for
Pt4, except complex 5c (82.8 mg, 0.056 mmol) and complex 10 (101.5 mg, 0.123 mmol)
were used. Flash chromatography (silica gel, hexane then 7:3 hexane/CH2Cl2) gave
Pt4T2 as a yellow solid (98.4 mg, 57 %). 1H NMR (CDCl3, 300 MHz) δ 1.0 (m, 72H),
1.55 (m, 96H), 2.12 (m, 48H), 6.7 (d, 2H), 6.9 (d, 2H), 7.22 (m, 18H); 31P NMR (CDCl3,
121 MHz) δ 4.07, 4.21 (JPt-P = 2356.2 Hz); Mass spec. (MALDI-TOF) calc’d for
C144H238P8Pt4S2 3061.66, found 3058; Elemental anal. calc’d C 56.49, H 7.84, found C
56.45, H 8.10.
Pt4T3. This compound was synthesized according to the same procedure used for
Pt4, except complex 5d (102 mg, 0.065 mmol) and complex 10 (107.4 mg, 0.13 mmol)
were used. Chromatography on silica (hexane first, 7:3 hexane/CH2Cl2) gave Pt4T3 as a
red film-forming solid (106 mg, 51 %). 1H NMR (CDCl3, 300 MHz) δ 0.95 (m, 72H),
1.48 (m, 48H), 1.65 (m, 48H), 2.13 (m, 48H), 6.74 (d, 2H), 6.94 (s, 2H), 6.97 (s, 2H),
7.25 (m, 18H); 31P NMR (CDCl3, 121 MHz) δ 4.07, 4.25 (JPt-P = 2362.8 Hz); Mass spec.
(MALDI-TOF) calc’d for C148H240P8P4S3 3143.79, found 3141; Elemental anal. calc’d C
56.54, H 7.69, found C 56.43, H 8.00.

CHAPTER 3 DELOCALIZATION OF CHARGE CARRIERS IN PLATINUM ACETYLIDE
OLIGOMERS
Introduction
Conjugated polymers are promising active materials for use in light-emitting diodes
(LEDs),76-78,103 field-effect transistors104,105 and photovoltaic devices.106,107 All of these
applications rely on charge carriers for charge transport.108 Much debate arose over the
last twenty years concerning the exact nature of these charge carriers, and whether they
were solitons,109 polarons110 or bipolarons.111 It is now believed that the charge carriers in
most nondegenerate conjugated polymers such as poly(thiophene), poly(p-phenylene)
and poly(p-phenylenevinylene)112 are polarons, essentially radical ions. These charge
carriers and the charge transport properties of conjugated polymers have therefore
received a lot of attention in order to determine structure property-relationships113,114 and
improve the performance of devices based on conjugated polymers.115
In organic light-emitting diodes (OLEDs), the internal electroluminescent quantum
efficiency is limited by the proportion singlet excitons formed after recombination of an
electron and a hole on the polymer chain78 (a negative and a positive polaron). Based on
spin statistics and assuming electron-hole recombination is spin-independent, the
electron-hole recombination should give 25% of singlet excitons and 75% of triplet
excitons. Since the triplet exciton is usually not emissive in organic molecules, this would
mean that the maximum efficiency of OLEDs would be 25%. However, several groups
have now independently demonstrated that the exciton formation is spin-dependent and
71

72
internal quantum efficiencies up to 63% have been reported.116-119 The reason for this is
currently under strong theoretical and experimental investigation.42,120
However, it is likely that triplet formation will always limit the efficiency of
OLEDs so other groups have proposed and successfully demonstrated different strategies,
such as using transition metal complexes.121-123 The idea is that due to the heavy atoms
inducing mixing of singlet and triplet excitons, all excitons formed will luminescence
through rapid radiative decay of the triplet exciton and thus all electron-hole
recombination leads to an emissive exciton. In fact, there are examples of singlet-
harvesting platinum(II) complexes used in light-emitting devices with external efficiency
up to 11%.124-126 There is therefore clearly a technological need for a better understanding
of the dynamics of charge carriers in metal-organic systems such as platinum acetylide
and this is one of the motivations for the work presented in this chapter.
On a more fundamental level, our group also has an interest in conjugation through
metal. After having successfully demonstrated the difference in delocalization of singlet
and triplet excited states in platinum acetylide oligomers,67 it appeared that this platinum
oligomer series of increasing length would provide an interesting system to study the
effect of chain length on the delocalization of charge carriers. Moreover, the
oligothiophene-containing platinum acetylide oligomers studied in Chapter 2 would
provide a system to study the effects of low-energy sites on charge carriers in platinum
acetylide oligomers.
Therefore the conjugation and delocalization effects of charge carriers have been
explored through electrochemistry and pulse radiolysis. These techniques93,113,127,128 and
other time-of-flight techniques129-131 have been used extensively and successfully to study

73
charge transport in organic conjugated oligomers and polymers. Among them,
thiophene-based oligomers132,133 and polymers134,135 in particular have received
considerable attention due to their rich and promising electrochemical properties.
Conjugated metal-organic systems are less common than all-organic conjugated systems
but are gaining increasing attention due to the unique electrochemical properties of
transition metal complexes.136-139
The oligomers studied here are presented in Figure 3-1 and Figure 3-2 below. The
first series (Ptn), consists of platinum acetylide oligomers containing one to five platinum
centers in the conjugated phenyleneethynylene backbone. Their synthesis has been
described elsewhere67 and their NMR spectra were identical to the oligomers prepared
previously. The second series (PT4Tn) consists of platinum acetylide oligomers
containing four platinum centers where the central benzene ring is replaced by thiophene,
bithiophene or terthiophene. Their synthesis and characterization has been described in
Chapter 2.
Figure 3-1. Structure of platinum acetylide oligomers Ptn (n = 1-5).
Figure 3-2. Structure of platinum acetylide oligomers Pt4Tn (n = 1-3).
Results
Electrochemistry
The oxidation and reduction of the platinum acetylide oligomers were explored
using cyclic voltammetry (CV) and differential pulse voltammetry (DPV). Measurements
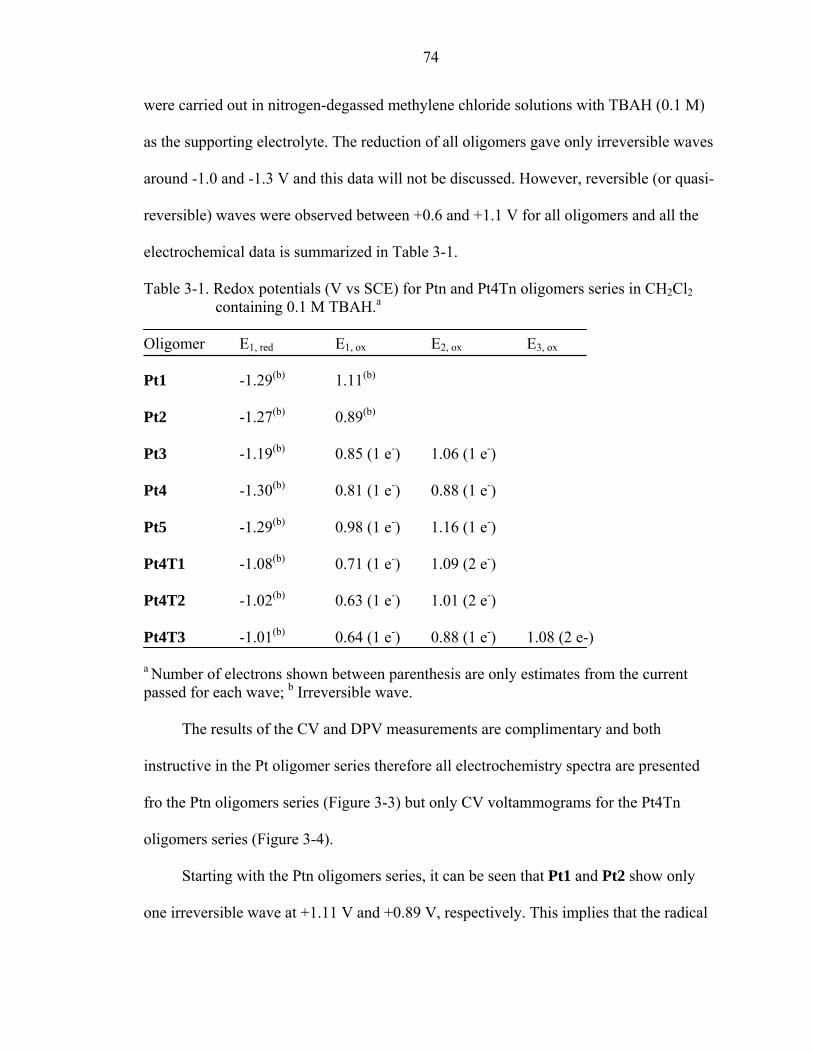
74
were carried out in nitrogen-degassed methylene chloride solutions with TBAH (0.1 M)
as the supporting electrolyte. The reduction of all oligomers gave only irreversible waves
around -1.0 and -1.3 V and this data will not be discussed. However, reversible (or quasi-
reversible) waves were observed between +0.6 and +1.1 V for all oligomers and all the
electrochemical data is summarized in Table 3-1.
Table 3-1. Redox potentials (V vs SCE) for Ptn and Pt4Tn oligomers series in CH2Cl2 containing 0.1 M TBAH.a
Oligomer E1, red E1, ox E2, ox E3, ox
Pt1 -1.29(b) 1.11(b)
Pt2 -1.27(b) 0.89(b)
Pt3 -1.19(b) 0.85 (1 e-) 1.06 (1 e-)
Pt4 -1.30(b) 0.81 (1 e-) 0.88 (1 e-)
Pt5 -1.29(b) 0.98 (1 e-) 1.16 (1 e-)
Pt4T1 -1.08(b) 0.71 (1 e-) 1.09 (2 e-)
Pt4T2 -1.02(b) 0.63 (1 e-) 1.01 (2 e-)
Pt4T3 -1.01(b) 0.64 (1 e-) 0.88 (1 e-) 1.08 (2 e-)
a Number of electrons shown between parenthesis are only estimates from the current passed for each wave; b Irreversible wave.
The results of the CV and DPV measurements are complimentary and both
instructive in the Pt oligomer series therefore all electrochemistry spectra are presented
fro the Ptn oligomers series (Figure 3-3) but only CV voltammograms for the Pt4Tn
oligomers series (Figure 3-4).
Starting with the Ptn oligomers series, it can be seen that Pt1 and Pt2 show only
one irreversible wave at +1.11 V and +0.89 V, respectively. This implies that the radical
75
cation formed from Pt1 and Pt2 is not stable on the electrochemical timescale. In Pt3,
two reversible waves are observed at +0.85 and +1.06 V. This is evidenced in the CV
spectrum where the typical half-wave shape of a reversible electron process is present. In
Pt4, it appears that the two waves observed in Pt3 are “merged” into a single reversible
wave centered at +0.85 V, while a new quasi-reversible wave appears at higher
potentials. This merging of the two waves is clearly observed in the DPV spectrum of Pt4
where the broad peak shows a shoulder due to the second oxidation process next to the
maximum peak. The merging of these waves suggests charge localization on an
electrophore. In Pt3, each reversible wave is attributed to the formation of radical cation
centers on two sites in close proximity of each other on the oligomer. Due to this
proximity, the second radical cation formed is affected by the presence of the first center
already present. When the oligomer becomes longer, two radical cation centers can be
formed without interacting with each other. This is almost entirely possible in Pt4 where
the waves have merged because the presence of a radical cation center does not influence
the formation of a second center. In Pt5, the merging is complete and essentially one
broad band is observed in the DPV spectrum. However, close inspection of the CV
spectrum shows that the radical cation formed is not stable here again, as evidenced by
the mostly irreversible wave observed. Several cycles revealed a loss of current after each
cycle indicating that the oligomer was probably being deposited on the electrode during
the oxidation.
All in all, the electrochemistry data on the Ptn oligomer series suggests that the
radical cation electrophore is rather localized since two such sites can be created on Pt4
with almost no electronic coupling or interaction between them.

76
Figure 3-3. Cyclic voltammetry (CV, left) and differential pulse voltammetry (DPV, right) of oligomers Ptn.
In the Pt4Tn voltammograms, it can be seen that all Pt4Tn oligomers show two
reversible bands around +1.0 V and +0.65 V. Based on the previous Ptn electrochemistry
study and the lower oxidation potential of thiophene compared to benzene,140 the high
potential at +1.0 V is attributed to an oxidation of a phenyl-based electrophore and the

77
Figure 3-4. Cyclic voltammetry (CV) of oligomers Pt4Tn.
wave at +0.65 V to an oxidation of a thienyl-based electrophore. But while the first
thienyl-based oxidation is attributed to a one-electron process, it appears that twice the
current is passed in the phenyl-based oxidation in Pt4T1 and Pt4T2. It is therefore
believed that the phenyl-based wave is due to an oxidation on both end-phenylene
electrophores. In addition, the DPV spectrum of Pt4T3 (not shown) revealed a third band

78
at +0.88 V. This oxidation probably arises from the formation of a second oxidation on
the terthiophene and formation of a dicationic terthienyl species, as observed in other
oligothiophenes studies.141
Pulse Radiolysis – Ion Radical Spectra
Ion radicals were generated by pulse radiolysis at Brookhaven National Laboratory.
The spectra were measured at 0.1-1.0 μs delay time following the growth of the radical
ion species. Radical ions were produced from transfer of electron or hole from the
solvated electrons and solvent-based holes created by the electron pulse.
Radical cations
The spectra of the radical cation obtained for both oligomers series are presented in
Figure 3-5. All radical cation oligomers feature a strong band in the visible spectrum
(400-800 nm) and a weaker and broader band in the near-IR (800-1600 nm). Looking at
the Ptn oligomers first, it appears that the visible band around between λ = 360 and λ =
520 nm red-shifts strongly from Pt1 to Pt2, but does not move after that. This is clearly
evidenced in the inset of the visible region shown in Figure 3-5. In fact, the change levels
off at Pt3, which has the same absorption band as Pt4 and Pt5. The same trend is
observed for the band in the near-IR, where the change levels off at Pt2 in this case.
Consistent with the electrochemistry data, this suggests a relatively localized radical
cation species in these oligomers. Since no apparent stabilization energy is gained for
oligomers longer than Pt3, it appears that the radical cation is delocalized over ca. three
repeat units.
Turning to the Pt4Tn oligomers series, similar spectra consisting of two absorption
bands in the visible and near-IR are observed. The spectra suggest that the radical cations

79
Figure 3-5. Radical cation spectra for Ptn (top) and Pt4Tn (bottom) oligomers series. In Ptn: Pt1 (●), Pt2 (■), Pt3 (▲), Pt4 (▼) and Pt5 (♦). In Pt4Tn: Pt4T1 (●), Pt4T2 (■), Pt4T3 (▲).
formed are essentially localized on the oligothienyl electrophore, as the visible bands are
at much lower energies than the absorption bands in the Ptn oligomers series. Both of the
bands undergo a significant bathochromic shift from Pt4T1 to Pt4T3. This is attributed
to the increasing stability of radical cation centers on the oligothienyl units of increasing
length present in the oligomer.

80
Radical anions
The absorption spectra of the radical anions are presented in Figure 3-6 and all
oligomers display two bands, one in the visible between λ = 380 and λ = 580 nm and one
extending far in the IR (except for Pt1). Apart from Pt1 which is blue-shifted from the
rest of the series, the visible absorption band of all Ptn oligomers radical anions are
almost superimposable. This suggests the presence of a very localized radical anion,
which is not sensitive to an increase in chain length after Pt2.
The anion radicals of the Pt4Tn again display two bands as well, again in the
visible between λ = 520 and λ = 800 nm and one extending in the IR. The visible band
shows the same trend observed in the radical cation spectra, that is a bathochromic shift
with increasing oligothiophene size. The second IR band however does not seem to
follow any particular trend, although it is difficult to interpret as the bands are beyond the
range of the instrument.
Discussion
Except from bulk conductivity of oligoPPE-based self-assembled films studied by
Tour and co-workers,142 there is no literature on the electrochemistry of
phenyleneethynylene-based conjugated systems. However, platinum acetylide
complexes, oligo(phenylenevinylene)s and oligo(thiophene)s have been studied by
several groups and this provide a basis for the discussion.
Delocalization of Charge Carriers
The oxidation waves observed in the CV and DPV spectra of the Ptn and Pt4Tn
oligomers are assigned to oxidation occurring on the phenyl or thienyl ligand rather than
oxidation of the metal because of the oxidation potential and their reversibility. It is
known that the one-electron oxidation of Pt(II) to Pt(III) is usually irreversible as the

81
Figure 3-6. Radical anion spectra for Ptn (top) and Pt4Tn (bottom) oligomers series. In Ptn: Pt1 (●), Pt2 (■), Pt3 (▲), Pt4 (▼) and Pt5 (♦). In Pt4Tn: Pt4T1 (●), Pt4T2 (■), Pt4T3 (▲).
radical cation formed readily undergoes rapid interaction with the solvent, leading to
decomposition products.143 When observed,144 the platinum oxidation has been reported
at higher potential (~1.2 V) than all oxidation potential observed here. Moreover, the
HOMO of platinum acetylide oligomers is believed to be located mostly on the aryl
ligands with little metal character while the LUMO is located essentially on the aryl

82
ligands. It is therefore safe to rule out a metal oxidation for the reversible waves. The
oxidations are thus referred to as ligand-based but bearing in mind that some metal
character is probably mixed in as well. However, a Pt(II) to Pt(III) oxidation with
decomposition could be responsible for the irreversible waves observed in Pt1 and Pt2.
The merging of the two oxidation waves in Pt3 into one wave in Pt4 and the red-
shift of the radical cation absorption bands leveling off for Pt3 give an indication on the
delocalization of the radical cation of platinum acetylide oligomers. The data suggest a
fairly localized radical cation species, one that is probably localized over 2 to 3 repeat
units. With 4 repeat units, two radical cation centers can form with little interaction or
electronic coupling between them. The radical anions are more localized than the radical
cations. The absorption spectra of radical anions of the Ptn series show no red-shift after
Pt2 for the visible band. Moreover, the electrochemistry of these platinum acetylide
oligomers displayed only irreversible waves, implying that the radical anions are not
stable. This means that these materials would probably perform better when p-doped
rather than n-doped. The extent of delocalization of the radical ions observed in the Ptn
series is somewhat smaller but comparable to the extent of delocalization of charge
carriers in related all-organic conjugated oligomers studied recently.72,145
The merging of the oxidation waves in Pt4 is reminiscent of mixed-valence
systems which have been known for a long time.146 And while it was first established for
polymetallic complexes, the concept of mixed valence is also valid for organic molecules,
as shown in several recent examples.147-151 If two MII metal centers are coupled by a
strong electronic coupling, removal of one electron on one of the metal may lead to a
delocalized cation with two equivalents metal each in a +2.5 oxidation state. If there is no

83
electronic coupling, the one-electron oxidation will lead to a mixed valence cation
species with MII and MIII metal centers. These two extreme cases represent the class III
and I of the Robin and Day’s classification of mixed-valence species.152 In between those
two cases lies a wide range of intermediate species with different degree of electronic
coupling. Electronic coupling can be significantly improved by conjugation but it is also
distance-dependent. Therefore it is probably favored and effective in the shorter
oligomers of the Ptn series. For oligomers longer than Pt3, the distance between two
radical cation centers becomes too great and the electronic coupling is greatly reduced.
The electrochemistry of thiophene-based conjugated materials is well documented
in the literature. The oxidation potentials of unsubstituted oligothiophenes reported by
Meerholz and Heinze140 in methylene chloride are higher than the potential observed in
the Pt4Tn oligomers series studied here. Values reported for the first oxidation are +1.7,
+1.25 and +0.87 V for thiophene, bithiophenen and terthiophene, respectively, whereas
they are +0.71, +0.63 and +0.64 V across the Pt4Tn oligomers series. Oxidation
potentials for bis-(thiomethyl)bithiophene and bis-(thiomethyl)terthiophene as reported
by Hill et al.153 in acetonitrile are +0.93 and +0.89 V. Even with a good electron-donating
substituent such as thiomethyl group, it appears the oligothiophenes located on the
oligothiophenes of the Pt4Tn oligomers are easier to oxidize and their radical cations
more stable. This is an indication that the platinum center is an excellent electron donor,
that can bring a large stabilization energy to the radical cation.141
Electronic Transitions of the Radical Ions
Charge carriers are a key to opto-electrical processes in conjugated materials. The
most promising polymers for these applications, poly(thiophene),154 poly(p-
phenylenevinylene)130 and poly(p-phenylene)155 have been studied extensively to

84
understand the nature and the dynamics of the charge carriers present. The absorption
spectra of these extentded π-conjugated systems have been interpreted in terms of the
polaron-bipolaron model, based on band theory. However, the oligomers such as the one
studied here do not form real electronic band structures and it has been suggested that
their spectra are better interpreted within the MO theory.156,157 Since the electrochemistry
study showed irreversible processes for the reduction of the platinum acetylide oligomers,
the discussion will be focused on the radical cations.
Although the absorption spectra of the radical cations of
oligo(phenyleneethynylene)s have not been reported, the related
oligo(phenylenevinylene) has been investigated. Two bands are observed for oligomers
up to the tetramer, one in the visible (λ = 500-700 nm) and one in the near-IR (λ = 800-
1500 nm).158 Both of these bands were shown to shift systematically to lower energy with
increasing conjugation length. This implies an increasing delocalization of the radical
cation in these all-organic oligomers and this is opposite to our Ptn oligomers series,
where measurements have shown no shift of the absorption bands to lower energies after
the dimer or the trimer. While the platinum center preserves conjugation in the neutral
state, it is possible that conjugation becomes much more limited in the radical cation of
these metal-organic oligomers. It is however interesting that the all-organic oligomers
also exhibited two absorption bands, in the visible and in the near-IR. This is an
indication that the metal centers do not drastically change the nature of the optical
transitions of radical cations in metal-organic conjugated oligomers.
Different unsubstituted and substituted oligothiophene radical cations have been
prepared and their absorption spectra recorded by several groups.153,156,159,160 It is now

85
generally accepted that oxidized oligothiophenes can form intermolecular π-dimers and
their spectra have been identified from the monomeric, non-aggregated oxidized species.
Typically, the monomer radical cation shows two π,π* absorption bands (due to
excitation from HOMO to SOMO and from SOMO to LUMO) at lower energy than the
neutral oligomers, whereas the radical cation of the π-dimer displays two π,π* bands
broader and blue-shifted compared to the “monomeric radical cation”, as well as a third
charge transfer band. Experimental conditions and factors such as a high concentration or
a low temperature,160 use of a polar solvent and the oligomer length159 have been shown
to favor the formation of π-dimers. Although one author has claimed that steric hindrance
may prevent the formation of π-dimers,161,162 these have been unambiguously identified
in many examples of sterically hindered oligothiophenes. Therefore it is not clear
whether steric hindrance has an effect on the monomer-dimer equilibrium constant.
The high energy transition observed in the visible for the radical cation of the
Pt4Tn oligomers series is red-shifted compared to the visible absorption band observed
for unsubstituted thiophene to terthiophene oligomers. The UV-vis band reported for this
series is found between λ = 250 and λ = 545 nm,156 whereas it is observed between λ =
530 and λ = 750 in the present Pt4Tn oligomers series. The visible absorption band also
occurs at lower energy than various substituted oligothiophenes.153,159,160 As mentioned
earlier, this is consistent with the electrochemistry data and further supports the idea of a
relatively stable radical cation in the platinum acetylide oligomers. The nature of the
radical cation formed upon oxidation of the oligothienyl electrophore is confidently
assigned to a monomeric, non-aggregated species, rather than a π-dimer for several
reasons: 1) Measurements were carried out in 1,2-dichloroethane (not as polar as

86
acetonitrile); 2) The radical ion spectra were acquired on a short timescale (few μs) after
the laser pulse, leaving little time for π-dimers to form; 3) The bis-(tri-n-butylphosphine)
ligands may prevent π-dimer formation; 4) The equilibrium constant for the formation of
π-dimers is probably too low for the short oligothiophenes investigated here.
It is difficult to unambiguously assign the absorption bands displayed by the
platinum acetylide oligomers. The high energy band in the visible region probably is a
ligand-localized π,π* transition. The nature of the broad band observed in the near-IR
could be due to several possible transitions: 1) A second π,π* transition as in all-organic
oligo(phenylene vinylene)s; 2) A Pt → (acetylide)+ charge transfer transition (CT); 3) An
intervalence charge transfer transition (IVCT). These last two transitions were observed
in a platinum acetylide-bridged organic mixed valence compound recently studied by
Jones et al.163 at λ = 1000 nm (CT) and λ = 1530 nm. A triarylaminium ligand-based
transition was also observed at λ = 670 nm in this study. Close inspection of the radical
cation spectra of Ptn and Pt4Tn oligomers actually reveals the presence of two bands in
the near-IR, in addition to the visible band for Pt1 and Pt4T1 only. Longer members of
the Ptn and Pt4Tn series only display one broad near-IR band which extends beyond
1600 nm. Therefore it is not possible to tell whether a third transition occurs after 1600
nm or whether it is just the extension of the second band. A theoretical treatment of the
radical cations would be needed to identify the exact orbitals involved in the electronic
absorption of these species. Intervalence charge transfer transitions were first observed in
mixed-valence inorganic systems and a theoretical model was developed by Hush in
1967.164 More recently, intervalence charge transfer transitions have also been observed

87
in organic systems147-149,165 and their presence can not be ruled out in platinum acetylide
oligomers.
Conclusion
Two series of platinum acetylide oligomers have been studied by electrochemistry
and pulse radiolysis. The first series of oligomers (Ptn) probed the effect of increasing
chain length on the charge carriers while the effect of low-energy sites on these charge
carriers was studied on the second series of oligomers (Pt4Tn).
The reduction of all oligomers gave irreversible waves between -1.0 and -1.3 V,
indicating that the radical anions of these oligomers are not stable and probably fairly
reactive. The oxidation however displayed a rich electrochemistry with reversible or
quasi-reversible oxidations between +0.6 and +1.1 V. The electrochemical and pulse
radiolysis data suggests the existence of a fairly localized radical ion in these oligomers,
more so for the radical anions than for the radical cations. The extent of delocalization of
the radical cation is estimated to be no more than three repeat units. This is comparable to
the delocalization in all-organic conjugated oligomers and seems to indicate that the
presence of platinum does not confine the charge carriers.
By comparison with the electronic absorption data available for related compound,
the transitions observed by pulse radiolysis have been discussed. While the visible
transition is almost certainly ligand-based, the origin of the near-IR transition is not clear
and can not be assigned unambiguously. Several possibilities are envisaged such as
charge transfer or intervalence charge transfer.
88
Experimental
Electrochemistry
Electrochemical measurements were performed in dry methylene chloride solutions
containing 0.1 M tetra-n-butylammonimum hexafluorophosphate (TBAH, Aldrich) as the
supporting electrolyte. The three-electrode setup consisted of a platinum microdisk (2
mm2) working electrode, a platinum wire auxiliary electrode and a silver wire quasi-
reference electrode. Solutions were bubble-degassed with nitrogen prior to measurements
and a positive pressure of nitrogen was maintained during the measurements. The
concentrations of oligomers in the solutions were all around 10 μM. Cyclic voltammetry
(CV) was performed with a scan rate of 100 mV/s. Differential pulse voltammetry (DPV)
was performed with a scan rate of 4 mV/s, a pulse amplitude of 50 mV and a pulse width
of 50 ms. All potentials were internally calibrated against the ferrocene/ferricinium
couple (E = 0.43 V vs SCE in methylene chloride137).
Pulse Radiolysis
This work was carried out at the Brookhaven National Laboratory Laser-Electron
Accelerator Facility (LEAF). The facility has been described elsewhere.93,166,167 The
electron pulse (≤ 120 ps duration) was focused into a quartz cell with an optical path
length of 20 mm containing the solution of interest. The concentration of oligomers was
typically 0.2-2 mM. The monitoring light source was a 75 W Osram xenon arc lamp
pulsed to a few hundred times its normal intensity. Wavelengths were selected using
either 40 or 10 mm band-pass interference filters. Transient absorption signals were
detected with either FND-100G silicon (≤ 1000 nm) or GAP-500L InGas (≥ 1100 nm)
diodes and digitized with a Tektronix TDS-680B oscilloscope.

89
Synthesis
The synthesis of the Pt4Tn oligomers series was described in Chapter 2. The
synthesis of the Ptn oligomers series was described elsewhere and all NMR data was
identical to the data published previously.67
CHAPTER 4 CONSEQUENCES OF AGGREGATION ON THE TRIPLET EXCITED STATE IN
PLATINUM ACETYLIDE OLIGOMERS
Introduction
The performance of electronic devices (LEDs, photovoltaic cells, field-effect
transistors) made out of conjugated polymers depends on two main factors: the intrinsic
photophysical properties of molecules, and the morphology of the molecules in the solid-
state device. While the former has received the most attention in this field, the latter is
generally accepted as being the most critical issue for device performance. For
conjugated systems-based devices, the interchain electronic coupling determines the
performance and is difficult to tune. Some studies have provided insights into the
relationship between microstructure and device performance115,168-170 but much work
remains to be done in this particular area.
Conjugated oligomers have an important role to play in the fabrication of efficient
devices because their precise chemical structure and conjugation length gives rise to well-
defined functional properties and facilitates control over their supramolecular
organization.86,171 Controlled mesoscopic order can be created using supramolecular
chemistry, the chemistry of molecular assemblies using noncovalent bonds.172 Two
important secondary interactions available for the supramolecular assembly of conjugated
systems are π-π and hydrogen-bond interactions.75 These interactions, individually or
combined,173 can provide a strong driving force for solution self-assembly, which
contributes greatly to long-range macroscopic order in the final solid form.
90

91
The self-assembly process can take place in solution or in a liquid-crystalline
phase. Conjugated oligomers such as derivatives of oligo(m-phenyleneethynylene)174-176
and oligo(p-phenylenevinylene)177-179 have shown very interesting self-assembling
properties in solution, forming supramolecular helical or lamellar structures. In both
systems, the expression of chirality was achieved over large supramolecular structures, as
evidenced by circular dichroism experiments. Meijer and co-workers177 use the
“sergeants-and-soldiers” principle to convey the idea that chirality is achieved through a
large number of achiral units (the soldiers) cooperating with a few chiral units (the
sergeants). The supramolecular aggregates of phenylene vinylene oligomers have
provided a system to study in moderately concentrated solutions phenomena usually
encountered in the solid-state. Energy transfer,180,181 exciton diffusion182,183 and exciton
annihilation184 were hence studied with standard solution techniques.
More recently, Stupp and co-workers have prepared oligo(p-phenylene vinylene)
amphiphiles and studied their luminescence properties.179 These oligomers exhibited a
liquid-crystalline mesophase and formed gels in water and DMSO (~30 wt%). The
absorption spectrum of films displayed a blue-shifted absorption compared to solution,
which was attributed to the presence of H-aggregates. A bilayer lamellar structure in
films was proposed as a supramolecular architecture, brought upon by the amphiphilic
character of the molecules.
Being purely organic systems, however only the singlet exciton was explored in
these studies and no information regarding the triplet exciton was gained.
Recently, Cooper et al.58 described a platinum acetylide oligomer exhibiting a glass
phase at low temperature and a liquid state under ambient conditions. This was achieved

92
by using tri-n-octylphosphine ligands on the platinum complex instead of the more
commonly used tri-n-butylphosphine ligand. In the liquid state, the chromophore density
is increased 10 times compared to the chromophore density of a similar platinum
acetylide oligomer (with tri-n-butylphosphine ligands) at the maximum concentration in
solution. This is an interesting approach that should allow the study of triplet-triplet
annihilation and triplet exciton dynamics in aggregated platinum acetylide oligomers.
However to this date, no data on the triplet exciton dynamics in aggregated platinum
oligomers is available on this system. This knowledge is nonetheless crucial for the
design of efficient devices based on platinum acetylide oligomers, particularly in
nonlinear optics and optical limiting.69 While the properties of triplet excitons in platinum
acetylide oligomers have been studied mostly in dilute solutions, questions remain on its
fate in solid-state devices. There is a strong concern about this, as it is well-known that
large and detrimental differences (red-shifted excimer emission, with lower quantum
yield of emission) are observed between the solution and the solid-state properties of
singlet excitons in organic conjugated polymers and oligomers.74,185-187
Inspired by the solution self-aggregating properties of the oligo(p-
phenylenevinylene) derivatives designed by Meijer and co-workers, similar platinum
acetylide oligomers have been prepared in hope of gaining some insight into the triplet
exciton dynamics in aggregated states using standard photophysical solution techniques.
Before plunging into the synthesis of relatively expensive platinum-containing oligomers,
organic oligo(phenyleneethynylene) oligomers were prepared to assess the potential for
self-assembling (Figure 4-1) in a preliminary study.

93
The first oligomer prepared, PE1, contained three phenyleneethynylene repeat units
with both end-phenyl groups tri-substituted with n-dodecyloxy hydrocarbon chains,
similar to the oligomers studied by Meijer and co-workers177 as well as other aggregating
systems studied in other groups.188-190 However, no aggregates were clearly detected,
either in concentrated solutions (up to 1 mM) or in the solid-state (drop-cast films). Since
π-stacking is recognized to be an important driving force for the aggregation, a longer
organic oligomer PE3 was prepared, containing five phenyleneethynylene repeat units
end-capped by the same 1,2,3-tri-dodecyloxyphenyl motif. In this case, clear evidence of
aggregation was obtained from photoluminescence studies, both on thin films and in
concentrated solutions (although only between 1 and 10
Figure 4-1. Structures of phenyleneethynylene and platinum acetylide oligomers synthesized for the preliminary study.

94
mM). Encouraged by this result, the synthesis of similarly end-capped platinum acetylide
oligomers Pt2B and Pt4B was carried out. However, no sign of aggregation was
observed from the photoluminescence of both oligomers. Recognizing that the bulky tri-
n-butylphosphine ligands of the platinum complex may be sterically hindering the
aggregation, a platinum acetylide oligomer with trimethylphosphine ligands on the
platinum complex Pt2M (Figure 4-2) was prepared and this time, evidence for
aggregation was obtained from photoluminescence and the immediate observation that
this oligomer could form a gel in a dodecane solution (at 1 mM). With a desire to probe
some structure-property relationships in the photophysics of aggregates of platinum
acetylide oligomers, several variations of Pt2M were also prepared. As the photophysical
evidence of aggregation was not entirely clear at first and not as dramatic as the eximer
emission seen in PE3, an oligomer with a longer π-system Pt2MP3 was prepared, the
idea being that the longer π-conjugated segment would provide a strong driving force
towards solution aggregation. A thiophene-containing oligomer Pt2MT was prepared to
allow the study of the effect of a low-energy site and to probe energy transfer processes
in aggregates. Finally, an oligomer with chiral side chains extending from the idle phenyl
ring Pt2MC was also prepared to study the presence of chiral aggregates. These three
oligomers are presented in Figure 4-2 along with Pt2M.
In the following, the synthesis of the oligomers presented in Figure 4-2 will be
discussed. A brief look at some of the physical properties of these oligomers will be taken
before presenting the photophysical properties of the aggregates of the oligomers.
Finally, a discussion will propose a rationale for the photophysical observations made
during the study.

95
Figure 4-2. Structures of self-assembling platinum acetylide oligomers.
Synthesis
The synthesis of the platinum acetylide oligomers described above relies on a
convergent strategy, as all oligomers share a common intermediate in trans-(tri-[3,4,5-
dodecyloxy]phenylethynyl)-chloride-bis-(trimethylphosphine)-platinum(II) complex
(Figure 4-3). This synthesis started with commercially available 3,4,5-trimethoxyaniline
12 which was converted to 1-iodo-3,4,5-trimethoxybenzene 13 in 83% yield through the
in-situ formation of the diazonium salt and subsequent reaction with KI. The latter was
treated with 4 eq. of boron tribromide191 in CH2Cl2 to give 1-iodo-3,4,5-
trihydroxybenzene 14 in a moderate 53% yield. Dodecyl chains were introduced by the

96
reaction of 14 with 4.5 eq. of 1-bromododecane in the presence of K2CO3 in DMF188 to
give 15 in 90% yield. Sonogashira coupling90 of 15 and trimethylsilylacetylene (TMSA)
gave the protected acetylene derivative 16 in good yield which was then treated with
K2CO3 to afford the free acetylene derivative intermediate 17 in 91% yield.. Finally, the
reaction of the latter with cis-dichloro-bis-(trimethylphosphine)platinum(II) gave the
desired platinum complex 18 in excellent yield. The presence of a trans geometry around
the platinum complex was assessed by 31P NMR, which showed a single peak for the
phosphorus resonance at δ = -13.6 ppm and the satellites arising from the coupling with
195Pt with 1JPt-P = 2332 Hz typical of trans platinum complexes.
Figure 4-3. Synthesis of platinum complex intermediate 18.
The synthesis of Pt2MP3 required the preparation of a phenyleneethynylene trimer
intermediate 20. The latter was prepared from the Sonogashira coupling of 1,4-
diiodobenzene and 1-ethynyl-4-(tri-iso-propylsilylethynyl)benzene 8 to give the protected

97
intermediate 19 in 69% yield. After desilylation with TBAF in THF, the desired free
acetylene trimer 20 was obtained in 66% yield. These last two reactions were
complicated by the limited solubility of compounds 19 and 20 but enough materials were
obtained for the synthesis of Pt2MP3.
Figure 4-4. Synthesis of phenyleneethynylene derivative 20.
The synthesis of Pt2MC necessitated the synthesis of a central benzene ring with
chiral side chains. This began with commercially available 2,5-diiodohydroquinone
which was reacted with (S)-(+)-1-bromo-2-methylbutane in the presence of K2CO3 to
give 1,4-diiodo-2,5-bis-[(S)-(+)-2-methylbutanoxy]benzene 21. The latter was then
subjected to Sonogashira coupling with trimethylacetylene, which after deprotection with
TBAF in THF, afforded the desired 1,4-bis-[(S)-(+)-2-methylbutanoxy]-2,5-bis-
trimethylsilylethynylbenzene 22 in good yield. No loss of chirality was observed from
1H NMR, as evidenced by the absence of diastereomers in the NMR spectrum of 23.
Finally, the synthesis of the platinum acetylide oligomers was achieved by reacting
2 eq. of platinum complex 18 with the required bis-acetylene-aryl unit (1,4-
diacetylenebenzene, 2,5-diacetylenethiophene, compound 20 and compound 23 for

98
Figure 4-5. Synthesis of chiral intermediate 23.
Pt2M, Pt2MT, Pt2MP3 and Pt2MC, respectively) under Hagihara conditions.49 The
synthesis of Pt2M only is shown in Figure 4-6 as a representative reaction of the series.
Figure 4-6. Synthesis of Pt2M as a representative reaction of the oligomer series.
Reactions were completed at room temperature within a few hours and the materials were
obtained after column chromatography and recrystallization in moderate to excellent
yields. All NMR spectra (1H, 13C and 31P) were consistent with the assumed structures. In
particular, 31P NMR showed one peak only around δ = - 19.2 ppm along with the
platinum satellites exhibiting a 1JPt-P value between 2290 and 2310 Hz typical of trans
geometry of such complexes.

99
Since the all-organic oligomer PE3 will be mentioned in the following study, the
synthesis is described here as well (Figure 4-7). The synthesis started with 1,4-
diiodobenzene which was reacted with 0.67 eq. of propargyl alcohol under Sonogashira
conditions90 to afford the iodophenylpropynol intermediate 24 in 61% yield. The latter
was then reacted with the previously prepared 3,4,5-tris-(dodecyloxy)ethynylbenzene 17
in a Sonogashira coupling reaction giving 25 in 87%, which after deprotection with
MnO2 and KOH gave the intermediate 26 in 50%. This deprotection step which usually
proceeds in good yield was hampered here by the poor solubility of the starting material.
Finally, the oligomer PE3 was obtained by reacting 1,4-diiodobenzene with 2 eq. of
intermediate 26 under Sonogashira coupling conditions giving oligomer PE3 in 86%
yield.
Figure 4-7. Synthesis of oligomer PE3.

100
Results
Gel Formation
All of the oligomers presented in Figure 4-2 except Pt2MP3 are able to gel
hydrocarbon solvents such as n-dodecane, hexane and cyclohexane. The critical gel
concentration was determined to be around 1 mM in dodecane and hexane for Pt2M and
Pt2MT (~2 wt %), while it is 4 mM for Pt2MC. Moreover, while the gels are formed
upon cooling of a hot concentrated solution within a few minutes for Pt2M and Pt2MT,
the gel takes about 3 days to form for Pt2MC. This prevented advanced photophysical
characterization of Pt2MC gels since solutions need to be oxygen-free for triplet excited
state studies. Upon heating to ~50oC, the gels melted to an isotropic liquid that could be
reversibly brought back to the gel upon cooling. The gels are stiff enough that the flow of
entrapped solvent molecules is frozen when a vial containing the gel is tilted or turned
upside-down (Figure 4-8).
a b
Figure 4-8. Picture of deoxygenated dodecane gel of Pt2M (10-3 M) under illumination with a UV light. (a) At room temperature. (b) At 50 oC. Notice the non-horizontal level of the solution in (a) due to the presence of the gel.
It is important to realize that the gel formation of these platinum acetylide
oligomers is rather unique. While examples of luminescent organogels and

101
organometallic gels are numerous,192,193 examples of low molecular weight luminescent
gel-forming systems with extended conjugation are rare. In fact, there are only three
examples found in the literature of fluorescent organogels based on a conjugated
oligomer.173,194,195 The platinum acetylide oligomer series studied here truly makes a
remarkable system, which could contribute to make platinum acetylide oligomers into
more attractive materials for technological applications.
Thermal Properties
The thermal properties of the oligomers were investigated by differential scanning
calorimetry between -50 oC and 150 oC and the plot obtained for the second heating and
second cooling are presented in Figure 4-9. The oligomers were also studied under
polarized optical microscopy, both as neat samples and in their dodecane gels.
The thermogram of oligomer Pt2M shows one endotherm at 58 oC (19 J.g-1) upon
heating and a corresponding exotherm at 37 oC (20 J.g-1) upon cooling. However, no
transition was observed under polarized microscopy upon heating up to 190 oC. Upon
cooling to room temperature, a glass phase was observed. Some fibers were seen in the
dodecane gel sample, indicating the presence of a network structure.
For oligomer Pt2MT, two small endotherms are found at 54 oC and 79 oC (2.7 and
1.0 J.g-1, respectively) and a larger one at 115 oC (11 J.g-1). Upon cooling, three
corresponding exotherms are observed. In this case, a liquid-crystalline phase was
observed under polarized microscopy between 124 oC and 144 oC (Figure 4-10a), at
which temperature the liquid-crystal melted into the isotropic liquid. Some fibers were
also observed in the dodecane gel sample. Upon cooling to room temperature, no obvious
change in appearance was observed, indicating a possible decomposition of the sample
during the first heating.

102
Figure 4-9. Differential scanning calorimetry thermograms for second heating and cooling cycle at a10 oC/min scan rate. (a) Pt2M. (b) Pt2MT. (c) Pt2MC.
In Pt2MC, the thermogram displays two endotherms, at -19 oC (7.1 J.g-1) and 55
oC (17.1 J.g-1), with corresponding exotherms upon cooling. Under polarized microscopy,
the oligomer started melting at 84 oC and a liquid-crystal phase was observed between
114 oC and 181 oC (Figure 4-10b). No change was observed upon cooling to room
temperature, again indicating a possible decomposition during the first heating. Some
fibers were also observed in the dodecane gel sample.
103
Finally, Pt2MP3 was only investigated with polarized microscopy where the
oligomer started melting at 102 oC. A liquid-crystal phase was observed between 154 oC
and 181 oC (Figure 4-10c), but no clearing point was detected at this temperature where
the liquid-crystal phase remains. Upon cooling, the liquid-crystal phase disappeared at
143 oC and no further change was observed. On second heating, the mesoscopic phase
was again observed at 143 oC but some crystals remained even up to 180 oC, indicating a
possible decomposition during the first heating.
The mesoscopic properties of the platinum acetylide oligomers is not the main
concern of this study, hence observations with polarized microscopy were not carried out
extensively. Therefore, it is not possible to identify the type of mesophase (nematic,
smectic) displayed by these materials. However, they are included to illustrate the
potential of these oligomers as active elements in opto-electronic devices.
UV-Vis Absorption
The absorption spectra of the oligomers were recorded in dodecane solutions,
where a concentration and a temperature-dependence were observed for all oligomers.
The absorbance was kept below a value of one by using short path length (1 cm, 1 mm, or
0.1 mm) cells when necessary.
The absorption spectrum of Pt2M in dilute dodecane solutions (C = 10-4 M and
below) is dominated by a strong band centered around λ = 358 nm, with some weaker
transitions at higher energy (Figure 4-11a). This is similar to the absorption spectrum of
Pt4 from Chapter 2 and to Ptn oligomers from a previous study,67 and this is confidently
assigned to a “monomeric” chromophore absorption since the spectrum does not undergo
any further change at lower concentrations. When the concentration is increased from 10-
4 M, the spectrum broadens due to the decrease of the main absorption band to be finally

104
(a)
(b)
(c)
Figure 4-10. Pictures of liquid-crystal phases under a polarized optical microscope. (a) Pt2MT at 124 oC. (b) Pt2MC at 84 oC. (c) Pt2MP3 at 144 oC. The black space bar indicates 100 μm. The presence of liquid-crystal phases was confirmed by lateral displacement of one cover slip with respect to the other.
dominated by a blue-shifted band at λ = 300 nm in the gel phase (C = 10-3 M). A similar
trend is observed in the temperature-dependent absorption spectrum of Pt2M (Figure 4-
11b). Starting in the gel phase at room temperature and increasing the temperature up to
~60oC results in the melting of the gel into the isotropic solution and the recovery of the
“monomeric” absorption at λ = 358 nm.

105
Figure 4-11. Absorption spectrum of Pt2M in dodecane. (a) Room temperature, C = 10-3 M and 0.1 mm pathlength (―), C = 5x10⁻⁴ M and 1 mm pathlength (• • •), C = 10-4 M and 1 mm pathlength (– – – ). (b) C = 10-3 M and 0.1 mm pathlength, arrow indicates effect of increasing temperature from 21 oC to 66 oC.
A very similar behavior was observed for Pt2MT, for which only the temperature-
dependent absorption is shown here (Figure 4-12). As can be seen, the main absorption
band of the hot isotropic solution at λ = 378 nm decreases with decreasing temperature
and at room temperature the spectrum is dominated by a higher energy transition at λ =
338 nm. Again, the “monomeric” absorption of Pt2MT disappears when the gel is
formed, to be replaced by higher energy transitions in the gel phase, as in Pt2M. This

106
Figure 4-12. Absorption spectrum of Pt2MT in dodecane. C = 10 M and 0.1 mm pathlength. Arrow indicates effect of increasing temperature from 23 C to 63 C.
-3
o
o
blue-shifting of the absorption in aggregated states is an indication of the presence of H-
aggregates and this will be examined more closely in the discussion.
The absorption of Pt2MP3 (Figure 4-13) showed a very different trend than the
two previous oligomers. Note that in this case, no gel is formed in concentrated solutions
but turbidity appears instead at a concentration of ~10-3 M. In the concentration-
dependent absorption spectrum (Figure 4-13a), it can be seen that in the dilute solutions
(10-5 - 10-4 M), the spectrum is dominated by a band at λ = 368 nm. This is again similar
to what has been seen so far on the platinum acetylide absorption data and this is
attributed to the absorption of a “monomeric” chromophore. However in concentrated
solutions (10-3 M), this band becomes narrower, with a maximum at λ = 373 nm, and a
new sharp band appears at λ = 405 nm. The “monomeric” absorption in concentrated
solution can be restored by heating the solution to ~ 60 oC, where aggregates are broken

107
Figure 4-13. Absorption spectrum of Pt2MP3 in dodecane. (a) Room temperature, C = 10-3 M and 0.1 mm pathlength (―), 10-4 M and 1 mm pathlength (• • •), 10-5 M and 1 cm pathlength (– – – ). (b) C = 10-3 M and 0.1 mm pathlength, arrow indicates the effect of increasing temperature from 23 oC to 58 oC.
down and the same absorption spectrum as observed in dilute solutions is observed
(Figure 4-13b).
In Pt2MP3, the effect of aggregation on the absorption of the oligomers is
therefore opposed to what they are in Pt2M and Pt2MT. While the latter both show a
broadening and a large blue shift of the absorption maximum, Pt2MP3 show a small red-
shift and a new sharp red-shifted peak. And while the change in absorption observed for
108
Pt2M and Pt2MT is often attributed to H-aggregates, the trend observed in Pt2MP3 is
usually assigned to J-aggregates.
As mentioned earlier, while Pt2MC also has the ability to gel dodecane, this
process takes more time than Pt2M and Pt2MT oligomers. This is apparent in the
absorption spectrum of Pt2MC (Figure 4-14), which is typical of platinum acetylide
oligomers with a maximum at λ = 368 nm and two higher energy transitions. The
spectrum is almost unchanged under dilute and concentrated conditions, except for a
small increase in the higher energy bands absorption. However, if the solution is left
sitting for several days and a gel has had time to settle, a large hypsochromic shift of the
maximum of absorption to λ = 345 nm occurs. The higher energy bands are now stronger
than the main absorption band and the reason for this is not clear.
Circular Dichroism
While the UV-vis absorption spectrum of Pt2MC offers some proof of
aggregation, more evidence for the presence of aggregates in dodecane gels of Pt2MC is
found in circular dichroism (CD) experiments (Figure 4-15). The CD spectrum of
Pt2MC only shows a very weak negative signal in freshly prepared dodecane solutions at
4 x 10⁻³ M. However, after this solution is allowed to gel (over a period of a few days), a
strong negative signal is observed in the CD spectrum in the region where Pt2MC
absorbs. Since Meijer and co-workers177 observed bisignate signals in their H-bonded
helical self-assembled oligo(p-phenylenevinylene)s, this indicates that the chiral
assemblies formed in this gel are not supramolecular helices. The possibility of a
supramolecular lamellar structure is more likely in view of this result.

109
Figure 4-14. Absorption spectrum of Pt2MC at room temperature in dodecane. C = 4 x 10⁻³ M and 0.1 mm pathlength gelled for 40 days (―), C = 4 x 10⁻³ M and 0.1 mm pathlength freshly prepared (• • •), C = 10-3 M and 0.1 mm pathlength (– – –), C = 10-4 M and 1 mm pathlength (– • • –).
Figure 4-15. Circular dichroism (CD) absorption spectrum of Pt2MC in dodecane. C = 4 x 10 M and 0.3 mm pathlength freshly prepared (―), C = 4 x 10 M and 0.3 mm pathlength gelled after 4 days (– – –).
-3 -3

110
Steady-State Photoluminescence
The photoluminescence of the platinum acetylide oligomers were studied in
dodecane. For gels, the solutions were bubble-degassed with argon from a hot isotropic
state and heated regularly to prevent gel formation and ensure adequate degassing.
In order to determine what emission band may appear in the photoluminescence of
self-assembled oligomers in the solution, the photoluminescence of drop-cast films of the
oligomers were measured as well. Moreover, in order to stress the difference between the
aggregate emission of an organic system and the aggregate emission of the metal-organic
systems, the emission spectrum of PE3 is presented in Figure 4-16. The effect of
aggregation on the emission of PE3 is typical of many organic conjugated systems.
Whereas the emission in dilute solutions is dominated by sharp fluorescence emission,
the emission in thin films often exhibits a red-shifted band due to excimer formation. In
fact, the excimer emission entirely dominates the spectrum in thin film of PE3 and no
“monomeric” fluorescence is observed. A concentration study supports the excimer
origin of the broad red-shifted emission band, which decreases as concentration decreases
and is no longer observed for concentrations lower than 10-3 M.
The photoluminescence spectrum of Pt2M in gel (10-3 M) is excitation wavelength-
dependent and is dominated by phosphorescence emission (Figure 4-17a). When exciting
at λ = 326 nm, close to the maximum of absorption found in the gel, the emission
spectrum displays a phosphorescence peak at λ = 495 nm. When exciting at λ = 366 nm,
where the maximum of absorption is found in the dilute solution, the peak of maximum
intensity is λ = 516 nm. With an intermediate excitation wavelength λ = 346 nm, a
phosphorescence band exhibiting both peaks at λ = 495 and 516 nm is observed. Both
bands are assigned to emission from a triplet excited state due to their similarity to the

111
Figure 4-16. Photoluminescence spectrum of PE3 with λ = 354 nm. (a) C = 10 M deoxygenated dodecane (―), drop-cast film (– – –). (b) From 10 M to 10 M in deoxygenated dodecane. Arrow indicates effect of decreasing concentration.
ex-2
-2 -3
Pt4 oligomer emission spectrum (see Chapter 2). Moreover, the “blue” emission band at
λ = 495 nm is attributed to an aggregated state, while the “normal” emission band at λ =
516 nm is assigned to a monomeric state. Several experiments support these assignments:
1) The “blue” band is also present in the emission spectrum of thin films (Figure 4-17b);
2) The “blue” band is absent from the dilute solution emission spectrum (Figure 4-17c);
3) The “blue” band intensity decreases relative to the “normal” emission band as

112
Figure 4-17. Photoluminescence spectrum of Pt2M. (a) C = 10-3 M with λex = 326 nm (—), λex = 346 nm (• • •) and λex = 366 nm (– – –) in deoxygenated dodecane. (b) With λex = 326 nm in deoxygenated dodecane at C = 10-3 M (—) and in drop-cast film (– – –). (c) With λex = 326 nm in deoxygenated dodecane at C = 10-3 M (—), C = 10-4 M (• • •), C = 10-6 M (– – –). (d) In deoxygenated dodecane at C = 10-3 M, from 23 oC to 61 oC. The arrow indicates the effect of increasing temperature.
temperature increases (Figure 4-17d). All of these observations support the idea that the
emission band observed at λ = 495 nm arises from a triplet excited state in an aggregated
environment. Note that this is very different from organic systems, as illustrated with
PE3 in Figure 4-16, where aggregation is often accompanied by the appearance of red-
shifted excimer emission.
Low-temperature photoluminescence in dilute MeTHF solutions (Figure 4-18) are
also revealing as the “blue” emission band also appears at -53 oC, increases relatively to
the “normal” emission until -33 oC, and then decreases to finally disappear at higher

113
temperatures. While the presence of the “blue” band only in this narrow temperature
range is not entirely clear, it is interesting that it is present at all since the concentration is
only ~7 μM. Aggregation of similar oligomers in dilute solutions at low temperature have
been observed in our group before196 and there is little doubt that the appearance of a
blue-shifted emission band in this experiment has the same origin as the one observed in
concentrated solutions.
Figure 4-18. Photoluminescence spectrum of Pt2M in MeTHF at C = 7 x 10⁻⁶ M with λex = 326 nm from -63 oC to -23 oC. The arrow indicates the effect of increasing temperature.
While the photoexcitation spectra obtained in concentrated solutions should be
viewed with caution and therefore are not discussed here, the photoexcitation spectra
obtained in dilute solutions (Figure 4-19) are not be plagued by high concentration effects
and are hence useful in assessing the origin of the emission bands observed. At -63 oC,
there is no emission at λ = 494 nm and no photoexcitation signal when this emission
wavelength is monitored. The emission spectrum displays the “normal” emission at λ =
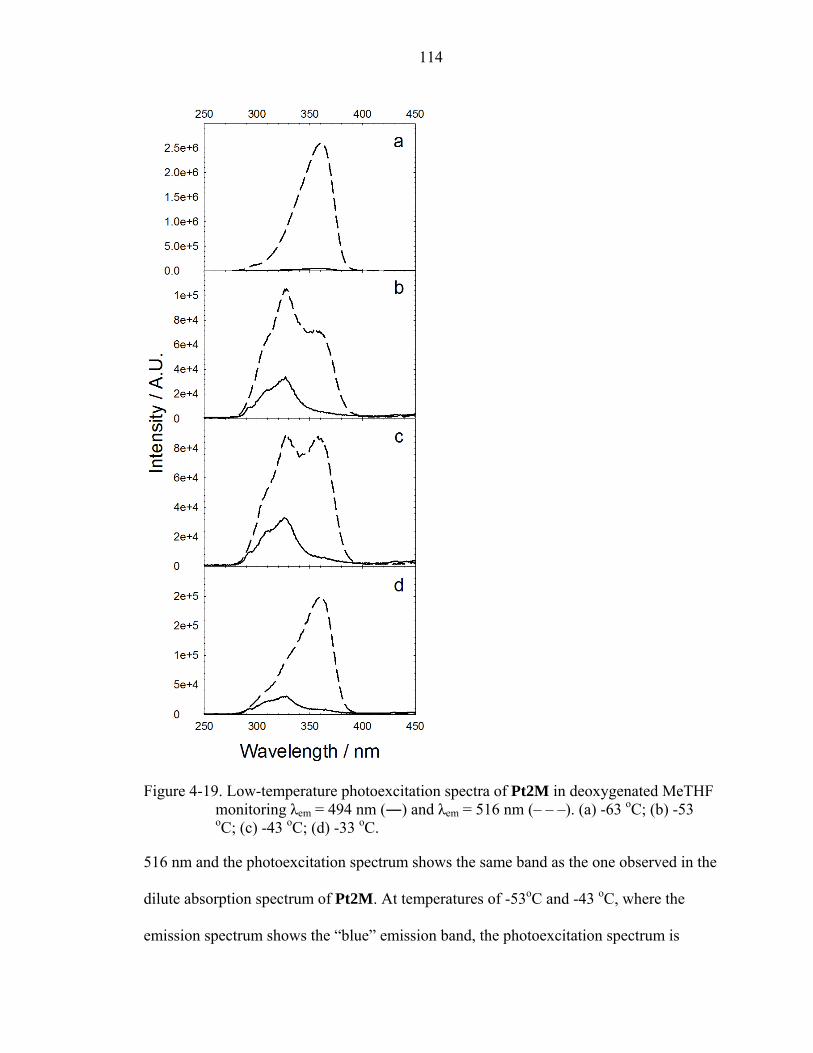
114
Figure 4-19. Low-temperature photoexcitation spectra of Pt2M in deoxygenated MeTHF monitoring λem = 494 nm (―) and λem = 516 nm (– – –). (a) -63 oC; (b) -53 oC; (c) -43 oC; (d) -33 oC.
516 nm and the photoexcitation spectrum shows the same band as the one observed in the
dilute absorption spectrum of Pt2M. At temperatures of -53oC and -43 oC, where the
emission spectrum shows the “blue” emission band, the photoexcitation spectrum is

115
indeed revealing. While the “blue” emission band at λ = 494 nm seems to be coming
from a state absorbing at λ = 340 nm, the “normal” emission now has contributions from
both excited states. This implies that in the presence of aggregates, the higher-energy
excited state can transfer the excitation to the lower “normal” excited state from which
emission is then observed. At -43 oC, there is probably too much thermal energy for
aggregates to form, the “blue” emission is almost entirely absent from the emission
spectrum and the photoexcitation of the “normal” emission at λ = 516 nm originates now
almost entirely from the “normal” non-aggregated excited state.
Although Pt2MT was not studied as extensively as Pt2M, there are indications that
much of the same photophysics are found in this compound. For instance, the
photoluminescence shows a blue shift of the emission band in dodecane gel (Figure 4-20)
as well, although not as strong as in Pt2M.
For PtMP3, while the absorption spectrum displayed signs of possible aggregates
absorption (see Figure 4-13), the photoluminescence spectrum does not show direct
evidence of aggregates (Figure 4-21). The spectra of concentrated solutions and drop-cast
films are very similar (Figure 4-21a), showing a strong fluorescence band at λ = 440 nm
and a comparatively weak phosphorescence at λ = 573 nm. The emission band appearing
at lower energy (λ = 622 nm) is a scattering peak, as evidenced by its strong dependence
on the excitation wavelength (not shown here). The photoluminescence spectrum of
Pt2MP3 at different concentrations (Figure 4-21b) shows that under dilute conditions,
the phosphorescence dominates the spectrum, as in all platinum acetylide oligomers
studied here. Note the presence of the scattering peak at λ ≈ 670 nm, clearly dependent on
the excitation wavelength used (λex = 366 nm in Figure 4-21a, λex = 393 nm in Figure 4-

116
Figure 4-20. Photoluminescence spectrum of Pt2MT in deoxygenated dodecane with λex = 340 nm at C = 10-3 M (—) and 10-4 M (– – –).
21b). While the relative increase in fluorescence at high concentrations can certainly be
interpreted as originating from increased triplet-triplet annihilation, this has not been
shown to be particularly more efficient in the high concentration photoluminescence
spectra of Pt2M and Pt2MT where phosphorescence always dominates the emission
spectra. However, this is consistent with the presence of J-aggregates, where increased
fluorescence compared to monomer emission is usually observed. Further support for the
presence of aggregates in concentrated dodecane solutions of Pt2MP3 comes from the
temperature dependent photoluminescence spectrum (Figure 4-21c), where it can be seen
that the phosphorescence band increases as temperature increases. This is at first counter-
intuitive, as nonradiative decay channels are typically activated at high temperature but it
is in fact consistent with a breakdown of the aggregates at elevated temperatures and a
return to a “monomeric” photoluminescence dominated by the phosphorescence.

117
Figure 4-21. Photoluminescence spectrum of Pt2MP3. (a) With λex = 366 nm from drop-cast film (―) and from deoxygenated dodecane at 10-3 M (– – –). (b) With λex = 393 nm in deoxygenated solution at C = 10-3 M (―), 10-4 M (• • •), 10-5 M (– – –), 10-6 M (– •• –). (c) With λex = 366 nm from deoxygenated dodecane at 10-3 M. Arrow indicates the effect of increasing temperature from 23 oC to 48 oC.

118
As the photophysical data obtained so far for Pt2M indicated that emission from
aggregates could be detected and identified, the possibility of observing energy transfer
within those aggregates was envisaged. For this, doping levels of Pt2MT were mixed in a
gel of Pt2M and the photoluminescence was measured. In order to minimize direct
excitation of Pt2MT, the excitation wavelength used for photoluminescence was λex =
300 nm. This is where the least direct absorption of Pt2MT will occur while still
allowing the observation of the “blue” emission band of Pt2M (Figure 4-22). Note that in
the following photoluminescence energy transfer experiments, the concentration of
Pt2MT is at doping levels, so its effective absorption is of a few percent to what is
apparent in Figure 4-22.
Energy transfer from Pt2M to Pt2MT at doping levels was indeed observed in
dodecane gels (Figure 4-23a). At only 3 mol% doping of Pt2MT in Pt2M at 10-3 M, the
photoluminescence displays equally intense phosphorescence from both oligomers. At 5
mol% doping level, the phosphorescence of Pt2MT dominates the emission spectrum.
Note that the photoluminescence spectrum in Figure 4-23a is normalized to the PL
intensity at λ = 494 nm. The slight increase in the phosphorescence at λ = 526 nm as the
Pt2MT doping level increases suggests a stronger quenching of the “blue” emission band
than of the “normal” emission. This is consistent with the idea that energy transfer will
occur more efficiently in aggregates than in non-aggregated domains. In order to provide
evidence that the emission from Pt2MT is not due to its direct excitation and that energy
transfer occurs preferentially in aggregates, the photoluminescence of Pt2M at different
concentrations with a constant 5% doping level of Pt2MT was measured (Figure 4-23b).
As expected, the phosphorescence emission from Pt2MT decreases with concentration.
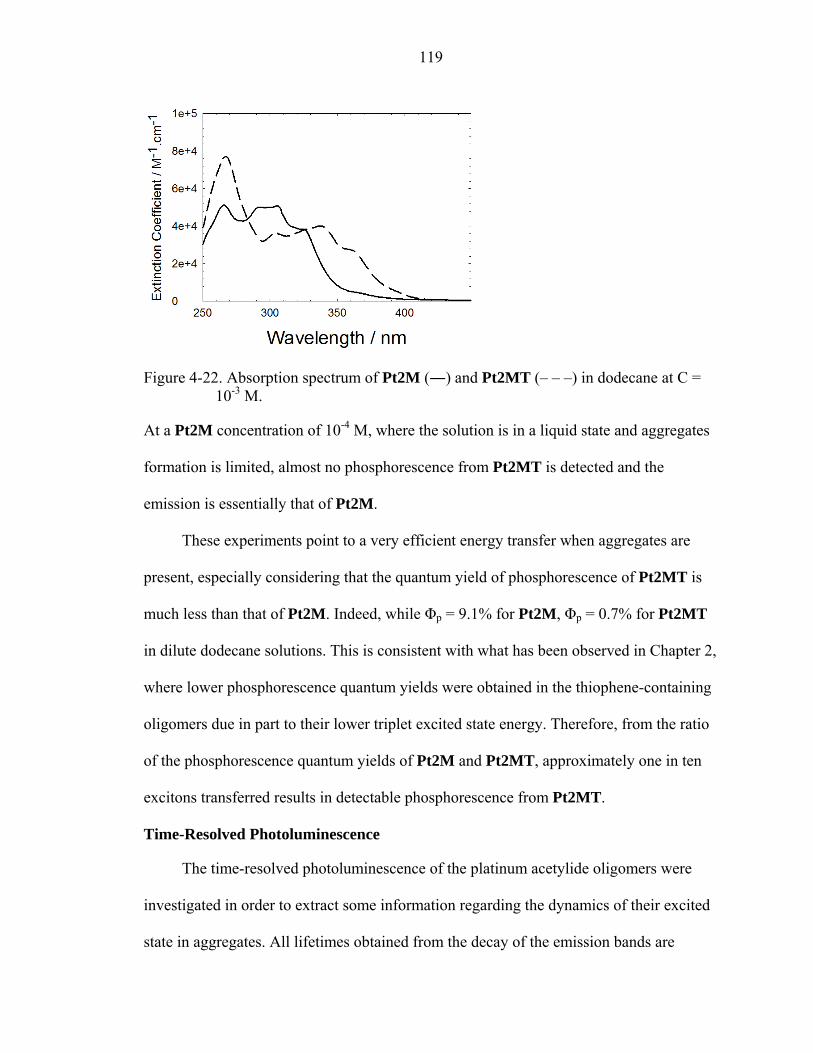
119
Figure 4-22. Absorption spectrum of Pt2M (―) and Pt2MT (– – –) in dodecane at C = 10-3 M.
At a Pt2M concentration of 10-4 M, where the solution is in a liquid state and aggregates
formation is limited, almost no phosphorescence from Pt2MT is detected and the
emission is essentially that of Pt2M.
These experiments point to a very efficient energy transfer when aggregates are
present, especially considering that the quantum yield of phosphorescence of Pt2MT is
much less than that of Pt2M. Indeed, while Φp = 9.1% for Pt2M, Φp = 0.7% for Pt2MT
in dilute dodecane solutions. This is consistent with what has been observed in Chapter 2,
where lower phosphorescence quantum yields were obtained in the thiophene-containing
oligomers due in part to their lower triplet excited state energy. Therefore, from the ratio
of the phosphorescence quantum yields of Pt2M and Pt2MT, approximately one in ten
excitons transferred results in detectable phosphorescence from Pt2MT.
Time-Resolved Photoluminescence
The time-resolved photoluminescence of the platinum acetylide oligomers were
investigated in order to extract some information regarding the dynamics of their excited
state in aggregates. All lifetimes obtained from the decay of the emission bands are

120
Figure 4-23. Photoluminescence spectrum of Pt2M-Pt2MT mixed-oligomer system. (a) With [Pt2M] = 10-3 M and [Pt2MT] = 0 mol% (―), 1 mol% (• • •), 2 mol% (– – –), 3 mol% (– • • –), 4 mol% (― ―) and 5 mol% (– • –) in deoxygenated dodecane, with λex = 300 nm. (b) Pt2M with 5 mol% Pt2MT mixed-oligomer system in deoxygenated dodecane with [Pt2M] = 10-3 M (―), 5x10⁻⁴ M (• • •), 10-4 M (– – –), with λex = 300 nm.
summarized in Table 4-1. When the decay was better fitted with a bi-exponential, the
lifetime and the relative contribution of each component are shown.
The time-resolved photoluminescence of Pt2M (Figure 4-24) shows a much slower
decay for the “blue” emission (λ = 494 nm) than for “normal” emission (λ = 516 nm) in
aggregates. While the lifetime of the emission at λ = 516 m is about 10 μs at all
concentrations studied, the lifetime of the emission at λ = 494 nm is about 59 μs. The
lifetime of the “normal” emission band is somewhat smaller but comparable to the

121
Figure 4-24. Time-resolved photoluminescence spectrum of Pt2M in deoxygenated dodecane following λ = 337 nm. (a) C = 10 M, 100 ns camera delay, 10.5 μs delay increment; (b) C = 10 M, 100 ns camera delay, 5.2 μs delay increment; (c) C = 10 M, 100 ns camera delay, 5.2 μs delay increment
ex-3
-4
-5 .
emission lifetime of Pt4 (see Chapter 2). However, the lifetime of the “blue” emission is
surprisingly longer. This is at first unexpected because triplet-triplet annihilation could
have been thought to be efficient in aggregates and therefore shorter lifetimes could have
been expected in aggregates. This is clearly not the case for Pt2M and possible

122
explanations for this will be provided in the discussion. The photoluminescence decay of
Pt2M was deconvoluted into two components (Figure 4-25). The decay of the blue
emission band, while longer, contributes only 22% of the emission decay observed. The
decay of the normal emission band contributes 78% of the emission decay observed. This
seems to imply that a significant proportion of photoluminescence is arising from non-
aggregated domains of the gel.
While the time-resolved photoluminescence spectrum of Pt2MT (not shown here)
does not display two emission bands as Pt2M, the lifetime obtained in concentrated
solution is also much longer than what could have expected (τ = 23 μs). As a comparison,
the lifetime of the thiophene-based excited state in Pt4T1 in dilute solutions was much
shorter (τ = 7 μs, see Chapter 2) than the lifetime of emission of Pt2MT in concentrated
solutions, which may appear counter-intuitive but is consistent with the trend observed in
the lifetimes of Pt2M.
The time-resolved photoluminescence of Pt2MP3 (Figure 4-26) shows trends
different than those observed in Pt2M, further supporting the different structure of the
aggregates formed in Pt2MP3. The first noticeable feature is the presence of some
delayed fluorescence in the photoluminescence at high concentration solution (10-3 and
10-4 M) acquired 1 μs after laser pulse, indicating that triplet-triplet annihilation is taking
place in aggregates of Pt2MP3. However, it does not appear as though the delayed
fluorescence observed here can account for the strong fluorescence observed in the
steady-state spectrum (Figure 4-21). This implies that the strong fluorescence in the
steady-state emission is prompt-type fluorescence, rather than a delayed fluorescence
originating from triplet-triplet annihilation.

123
Figure 4-25. Principal components of emission decay of Pt2M at 10-3 M in dodecane for slow component τ = 59 μs (―) and fast component τ = 9 μs (– –).
Another noteworthy feature extracted from the time-resolved emission is the
lifetime of the emission band. As can be seen from Table 4-1, the lifetime of the
phosphorescence band was fitted well with a mono-exponential decay function. Looking
at the overall evolution of these lifetimes as concentration increases, it appears that in this
case, the trend follows the expected lifetime increase as concentration decreases and
excited states quenching becomes less prone to occur. Hence, the lifetimes vary from 37
μs at 10-3 M to 148 μs at 10-6 M. However, experiments carried out with increasing laser
intensity (not shown here) did not show a decrease in lifetime, as expected if quenching is
due to triplet-triplet annihilation at higher laser energies. This again supports the idea that
delayed fluorescence is not the main origin for the strong fluorescence observed in the
steady-state experiment. The decay of the phosphorescence band in Pt2MP3 was also
fitted well with a bi-exponential function (not shown here) for all concentrations,
consisting of a short (9-25 μs) and a long (52-160 μs) component. The relative

124
Figure 4-26. Time-resolved photoluminescence spectrum of Pt2MP3 in deoxygenated dodecane following λ = 355 nm. (a) C = 10 M, 1 μs camera delay, 10 μs delay increment. (b) C = 10 M, 1 μs camera delay, 20 μs delay increment. (c) C = 10 M, 1 μs camera delay, 20 μs delay increment. (d) C = 10 M, 1 μs camera delay, 40 μs delay increment.
ex-3
-4
-5 -6
contribution of the short component decreased from 42% at 10-3 M to 13% at 10-6 M, at
the expense of the longer component. The trend displayed by these two components
would be consistent with triplet-triplet annihilation responsible for the short component,
however again power-dependent lifetime measurements did not reveal any effect on the
lifetime. The reason for this is not clear at this time.
The Pt2M-Pt2MT mixed oligomer system was also examined with time-resolved
photoluminescence in order to gain some understanding on the dynamics of energy
transfer. The time-resolved photoluminescence was measured in a dodecane gel of Pt2M
containing 5 mol% Pt2MT (Figure 4-27) 1 μs after laser excitation (λex = 337 nm). The
spectrum clearly shows a much shorter decay for the phosphorescence bands of Pt2M,

125
resulting from the energy transfer to Pt2MT. The fitting of the decay curves did not
deconvolute both bands from Pt2M, but gives an overall lifetime of 5 μs, much shorter
than the lifetimes of pure Pt2M in dodecane (τ1 = 9 μs, τ2 = 59 μs). The energy transfer is
also reflected in the lifetime of Pt2MT in the mixed-oligomers system (τ = 62 μs, with
some contribution from the “blue” band of Pt2M), which is considerably longer than the
lifetime of pure Pt2MT (τ = 23 μs). The photoluminescence decay was deconvoluted into
phosphorescence components of Pt2M (71%) and Pt2MT (29%), although the
component from Pt2MT has some contribution from the “blue” emission of Pt2M
(Figure 4-28). A control experiment under dilute concentration (10-5 M) at with 1:1
Pt2M/Pt2MT (not shown here) shows no change on the lifetime of Pt2M emission. This
supports the idea that the presence of aggregates is necessary for efficient energy transfer
and that quenching does not occur by a diffusional process.
In an effort to determine whether both emission bands of Pt2M are quenched to
the same extent by Pt2MT, measurements were carried out in dodecane gel of Pt2M
with different doping levels of Pt2MT ranging from 0.25 to 4 mol%. The decay of the
each emission band is plotted as a function time and can be at least qualitatively
commented (Figure 4-29).
First, it is clear that Pt2MT has an effect on both emission bands, as the lifetime of
both bands gets shorter with increasing content of Pt2MT. However, it appears that the
effect is somewhat more pronounced for the “blue” emission band at λ = 494 nm (Figure
4-29a) than for the “normal” emission at λ = 516 nm (Figure 4-29b). Since several pieces
of evidence point out to efficient energy transfer only in the aggregates. This is evidenced
by the apparent faster decays at λ = 494 nm than at λ = 516 nm as well as by the relative

126
Figure 4-27. Time-resolved photoluminescence spectrum of Pt2M with 5 mol% Pt2MT in deoxygenated dodecane following λ = 337 nm. [Pt2M] = 10 M, 1 μs camera delay, 10.5 μs delay increment.
ex-3
Figure 4-28. Principal components of emission decay of Pt2M at 10-3 M with 5 mol% Pt2MT in dodecane for slow component τ = 41 μs (―), fast component τ = 5 μs (– –).

127
quenching of instantaneous amplitude (t = 0). This further supports the idea that the
“blue” emission band is the emission of Pt2M in aggregates. This is not contradictory
with an energy transfer working also for the “normal” emission as there appears to be a
significant proportion of oligomers in “liquid” non-aggregated domains in the gel.
Table 4-1. Lifetimea of photoluminescence of self-assembling platinum acetylide oligomers.b
Pt2M Pt2MT Pt2MP3 Pt2M/Pt2MT
10-3 M 10-4 M 10-5 M 10-3 M 10-3 M 10-4 M 10-5 M 10-6 M 10-3 M Pt2M + 5% Pt2MT
59 (22%)c 5 (71%)e
9 (78%)d11 10 23 37 70 119 148
41 (29%)f
a: all lifetimes are in μs. b: number in parenthesis is the relative contribution of the individual decay component; c: decay of “blue” band; d: decay of “normal” band”; e: decay of Pt2M only; f: decay of Pt2MT and “blue” band of Pt2M.
Discussion
Nature of Aggregates
The photophysical properties of platinum acetylide oligomers studied here have
clearly shown signs of aggregation in dodecane solution. For all oligomers except
Pt2MP3, the solutions of oligomers at concentrations of ~1 mM were found to form a gel
in saturated hydrocarbon solvents. The observation of the gelation effect is a clear
indication that some network structures are present, such that the flow of the solvent is
frozen. While the concentration necessary to reach gelation may appear high when
compared to concentrations typically used in photophysical studies in solution, they are
not. A concentration of 1 mM of Pt2M in dodecane corresponds to about 2 wt%, which is
in fact on the low end of concentration range of efficient low molecular mass
organogelators.192 This is an important finding that would allow these materials to be

128
Figure 4-29. Plot of emission decay of Pt2M at 494 nm (a) and 516 nm (b) with x mol% doping levels of Pt2MT. Doping x = 0% (―), 0.25% (• • •), 0.50% (– – –), 1% (– • • –), 2% (― ―) and 3% (― • ―). Lines are only an indication of the decays and do not represent an actual fit of the data points.
easily processed, when most short oligomers do not usually have the advantageous
processable properties of long chain polymers. Their apparent liquid-crystalline behavior
is also a clear advantage in terms of processability and technological application.
Moreover, organogels based on π-conjugated systems are relatively very few and
therefore makes these platinum acetylide oligomers an elegant and original system.

129
While a direct characterization of the gels and the solution aggregates could be
desirable, the photophysical study conducted here can give a wealth of information
regarding the structure of aggregates. As briefly introduced in Chapter 1, the interaction
of aggregated chromophores has been fairly accurately described by McRae and Kasha
in terms of the molecular exciton model.27 The model predicts a splitting of the excited
state in the aggregate due to the interaction between neighboring transition dipole
moments. The exciton interaction energy (ΔE) depends on the transition dipole moment
of the molecule (ΔE ∝ M2), the distance between them (ΔE ∝ R-3) and their relative
orientation. Depending on the position of the absorption band of the aggregate relative to
the monomer, the aggregates are called J-aggregates (for an observed bathochromic shift)
or H-aggregates (for an observed hypsochromic shift).
From the absorption spectra of the oligomers, it appears that Pt2M and Pt2MT
form H-aggregates in concentrated dodecane solutions. The hypsochromic shift of the
absorption band compared to the one observed in dilute solutions is a typical signature of
H-aggregates, as observed in various systems such as trans-stilbene,38 squaraine dye197,
perylene bisimide polymers,198 terthiophene199 and different dyes.31,200,201 In this case, the
interaction of the transition dipoles splits the excited state into two excitonic levels E’ and
E’’ (see Chapter 1). Transition between ground state and E’ are forbidden, so excitation
occurs to the higher excitonic level E’’, resulting in absorption at higher energy and
shorter wavelength. The spectral shift of the absorption bands observed here (Δλ = - 58
nm for Pt2M, Δλ = - 40 nm for Pt2MT with Δλ = λagg – λm) are comparable though
somewhat smaller than those observed in the examples cites above. For instance in the
trans-stilbene system,38 a spectral blue shift of 70 nm was observed upon aggregation,

130
while the squaraine system197 exhibited a strong blue shift of 130 nm in aggregates. This
indicates that the exciton coupling in the aggregates of platinum acetylide oligomers may
not be as strong as in these other systems.
The absorption spectrum of Pt2MP3 displays a red-shift that could be attributed to
J-aggregates. In this case, absorption is only allowed from the ground state to the lower
excitonic level E’. This results in absorption at lower energy and longer wavelength for
the aggregate. J-aggregates have also been observed in many different systems such as
bis-(biphenyl)-ethylene37 and diphenylbutadiene202 derivatives, carbocyanine dyes40,203,
as well as H-bonded oligo(p-phenylenevinylene)s.177 The spectral shift of the absorption
band in Pt2MP3 (Δλ = 40 nm, with Δλ = λagg – λm) is also smaller than those observed in
the examples cited above, again indicating that exciton coupling in aggregates of
Pt2MP3 may relatively weak.
The bathochromic shift of the absorption band in the aggregate of Pt2MP3 can also
be explained by an intramolecular phenomenon, rather than an intermolecular one in the
form of J-aggregates. Indeed, Bunz and co-workers204 have studied the aggregation
behavior of poly(p-phenenyleneethynylene)s (PPEs) and observed a sharp red-shifted
absorption in films, very similar to the one observed in Pt2MP3. The red-shifted band
disappeared once the polymer reached an isotropic state. The same behavior was
observed more recently by Li and Wang205 in a polystyrene-oligo(p-
phenyleneethynylene)-polystyrene triblock copolymer. Upon addition of a poor solvent to
the dissolved polymer, a red-shifted shoulder appeared in the absorption spectrum, almost
superimposable to the absorption spectrum in thin films. The general consensus about the
bathochromic shift in these aggregates is that it is due to a planarization of the conjugated

131
backbone induced by aggregation.206 Therefore, it is not excluded that the red-shifted
absorption in aggregates of Pt2MP3 could also be simply due to a planarization of the
phenyleneethynylene segment of the oligomer. However, there are some indications that
J-aggregates are indeed formed in Pt2MP3. Firstly, H-aggregates are clearly formed in
Pt2M and Pt2MT so it appears likely that similar aggregates should form in Pt2MP3.
More importantly, when aggregate formation was observed in thin films of PPEs, the
photoluminescence spectrum was entirely dominated by a broad strongly red-shifted band
attributed to excimer emission. The intensity of the excimer band was also weaker than
the emission of non-aggregated PPEs. From the photoluminescence experiments of
Pt2MP3 (Figure 4-21), it does not appear as though emission from excimers is observed.
While the fluorescence of Pt2MP3 in aggregates does seem broader and red-shifted
compared to the photoluminescence in dilute solutions, it is clearly not similar to the
excimer emission at λ = 516 nm observed in PE3 (Figure 4-16). Moreover, thin films of
PE3 exhibiting excimer emission did not display the sharp red-shifted absorption band
observed in Pt2MP3 but only a slight broadening of the “monomeric” absorption band
(not shown here). Time-resolved photoluminescence measurements of Pt2MP3 at early
times after laser excitation (not shown) did not reveal excimer emission either. Moreover,
the fluorescence of Pt2MP3 seems stronger in aggregates than it is in dilute solutions,
further supporting the idea that J-aggregates are indeed formed for Pt2MP3. Increased
red-shifted fluorescence in J-aggregates has been observed before in similar systems,37,194
and is attributed to the synergic effects of intramolecular planarization (which leads to a
slight increase in oscillator strength), restricted excimer formation and increased
transition dipole moment of the E’→S0 transition.27,207
132
Although it appears that the absorption properties of the oligomers studied here can
be rationalized in terms of face-to-face H- and J-aggregates, other structures have been
proposed for aggregates consisting of small aromatic systems. Whitten and co-workers208
have studied a wide variety of aromatic-functionalized amphiphiles-fatty acid and
phospholipids derivatives and the results of their experimental and simulation studies
indicate that in many cases, aggregates are characterized by strong noncovalent edge-to-
face interactions. Pinwheel and herringbone structures based on a chiral tetramer unit209
were proposed for the aggregates which exhibited blue-shifted absorption and red-shifted
fluorescence compared to the monomer. Close energetic balance and competing factors
such as topology and steric constraints do not allow an easy identification between edge-
to-face and face-to-face. The remaining of the discussion will therefore assume a face-to-
face arrangement for the aggregates of platinum acetylide oligomers studied here, bearing
in mind that other supramolecular arrangement are also possible.
Photoluminescence of Aggregates
The photoluminescence of H- and J-aggregates is rationalized with the molecular
exciton model introduced in Chapter 1. For organic H-aggregates, quenching of
fluorescence and long lifetimes are usually observed. After excitation to the upper
excitonic level E’’ (excitation to lower excitonic level E’ is forbidden), rapid internal
conversion occurs to the E’ level. The radiative relaxation from E’ to the ground state
being forbidden, radiationless transitions are necessary to return to ground state. Two
possibilities are nonradiative decay from E’ to S0 and intersystem crossing to triplet
excited state. The latter is considered to be nondegenerate in the molecular exciton
model, since the oscillator strength of the S0-T1 is zero. The consequence on
photoluminescence are therefore quenching of fluorescence with long lifetime and

133
phosphorescence enhancement in some cases. This effect was observed by Kasha and co-
workers28,36 as early as 1958. For J-aggregates, absorption from ground state to the lower
excitonic level E’ is allowed, therefore red-shifted fluorescence is observed.
Platinum acetylide oligomers aggregates fit into the molecular exciton model, the
only difference being that phosphorescence is intrinsically favored due to the presence of
strong spin-orbit coupling induced by platinum. A simplified energy diagram for
monomers and aggregates is shown in Figure 4-30.
The diagram shows the different photophysical processes involved in monomers
and aggregates. For monomers, excitation of the oligomer to S1 results in radiative decay
from S1 and T1A, via ISC. From the photoluminescence in dilute solutions, for which
almost no fluorescence is observed, ISC is fast and relaxation occurs by phosphorescence
from T1A. For Pt2M and Pt2MT, which are believed to form H-aggregates, excitation of
the oligomers occurs to the upper excitonic level E’’, as evidenced by the blue-shifted
absorption in gels. Rapid internal conversion relaxes the molecule to the lower excitonic
level E’, from which the radiative decay is forbidden. Nonradiative decays can provide a
channel for relaxation to ground state but fast intersystem crossing provide an alternate
pathway to the triplet excited state T1B. The triplet excited state in H-aggregate is denoted
T1B and shown slightly higher in energy than T1A (triplet excited state for monomer). As
photoluminescence experiments have shown, phosphorescence from the aggregates
displays two bands. The “normal” phosphorescence band at λ = 516 nm (similar to the
one observed for the monomer), as well as a higher-energy, “blue” phosphorescence band
at λ = 494 nm, only observed when aggregates are present. Preliminary theoretical
calculations carried out in our group indicate that the preferred conformation of the triplet

134
Monomer H-aggregates J-aggregates S0 S0 S0
S1
T1A T1AT1B
E’’ E’’
E’ E’
A
IC
ISC
P A A
ISC ISC
P P F F
E
Figure 4-30. Energy diagram for monomer and aggregates in self-assembling platinum acetylide oligomers. Energy levels are only relative. A: absorption; F: fluorescence; P: phosphorescence; IC: internal conversion; ISC: intersystem crossing; S0: singlet ground state; S1: singlet excited state; T1A,B: triplet excited state; E’,E’’: excitonic levels.
excited state in a Pt2 oligomer has the central phenyl ring co-planar to the planes of the
platinum square complex, while the two outer phenyl rings are perpendicular to the plane
of the platinum complex. Other conformations (obtained by a rotation of 90o of one or
several of the phenyl rings) were found to have energies higher
by as much as 3 kcal/mol. It is proposed that the triplet excited in H-aggregates is a
conformer higher in energy than the conformation of the triplet excited state in dilute
solution. Indeed, for H-aggregates and even if the slippage angle θ is significant, there
must be some planarization to allow the oligomers to come close to each other. A
proposed conformation for the triplet excited state in H-aggregates of Pt2M is depicted in
Figure 4-31, along with the ideal triplet excited state conformation found in solution. The
difference in energy between the “blue” and the “normal” emission band is ~2.5

135
kcal/mol, therefore it is within the limit of the conformer of highest energy calculated
(with all phenyl rings co-planar and perpendicular to the planes of the square platinum
complex). Note that the photoluminescence of dodecane gel of Pt2M also shows
“normal” phosphorescence. This implies that even in the gel, there must be domains
where the oligomer is in a dodecane solvent cage and retains some configurational
freedom.
(a)
(b)
Figure 4-31. Proposed conformation of the triplet excited state of Pt2M. (a) All-planar high energy conformation in H-aggregates. (b) Ideal conformation in dilute solution. Hydrogen atoms and dodecanoxy end-chains have been omitted for clarity.
For Pt2MP3, the photoluminescence spectrum can also be explained using the
energy diagram in Figure 4-30. In this case, the oligomer is excited to the lower excitonic

136
level E’. The radiative decay from E’ to S0 is allowed so the oligomer can relax to ground
state by emission of fluorescence. Efficient intersystem crossing due to the presence of
platinum may also provide access to the triplet excited T1A, from which relaxation occurs
by emission of phosphorescence. Time-resolved photoluminescence experiments have
shown that strong fluorescence observed in concentrated dodecane solution is prompt
fluorescence (fluorescence lifetime on the order of the ns) and that triplet-triplet
annihilation does not play a significant part (no excitation power dependence). This
reinforces the proposed J-aggregation of Pt2MP3 (as opposed to a simple planarization
induced by aggregation) because increased fluorescence is expected from J-aggregates
(intensity scales as N1/2 for aggregates smaller than the emission wavelength, with N the
number of monomers in the aggregate).33 Fluorescence enhancement in aggregates has
been observed previously in related systems and is usually attributed to a combination of
inter- and intramolecular effects.210-212
A brief mention of the phosphorescence lifetimes measured by time-resolved
photoluminescence experiments should be made at this point. The interpretation of the
lifetimes is speculative as no example of phosphorescence lifetime from aggregates in
similar systems is found in the literature. As mentioned earlier, phosphorescence
enhancement may observed in an H-aggregate, because fluorescence from the lower
excitonic level E’ is forbidden. However in H-aggregates of platinum acetylide
oligomers, phosphorescence is always the dominant radiative process, regardless of
concentration. The longer lifetime of the “blue” band (τ = 59 μs) of Pt2M (attributed to
triplet excited states in aggregates) compared to the “normal” band (τ = 9 μs) is
hypothetically attributed to two factors: 1) Constrained environment in aggregate may

137
limit vibrational coupling through which nonradiative decays occur.7,64 This situation is
similar to phosphorescence measurements made in frozen solvent matrix, where
increased phosphorescence is usually observed due to decreased nonradiative decay rates;
2) Phosphorescence from the aggregated triplet excited state appears to arise from a high-
energy conformer, which may slow down the rate of radiative decay.
The case of Pt2MP3, where lifetimes decreases with concentration, is not clear at
this time. While it may appear as though increasing concentration should increase triplet-
triplet annihilation and therefore reduce the lifetime, no evidence for this process which
should result in delayed fluorescence was observed. The observed trend can be explained
by assuming the presence of J-aggregates. As concentration decreases, less aggregates are
present in solution, which limits highly efficient fluorescence from lower excitonic level
to ground state. This would imply that aggregates are present even in relatively dilute
solution as the lifetime increases regularly from 10-3 M (τ = 37 μs) to 10-6 M (148 μs).
While the aggregate band disappears from the absorption spectrum below 10-4 M, it is not
impossible that aggregates are still present below 10-4 M.
Molecular Exciton Modeling
In an effort to further characterize the supramolecular arrangement of the
aggregates, the molecular exciton model is used to predict the geometry of aggregates of
platinum acetylide oligomers. For the sake of simplicity, it is assumed that spectral
changes in the absorption spectra of the oligomers are due to dimers of J- or H-aggregates
and the point-dipole approximation introduced in Chapter 1 is used. This model has been
used recently on studies concerned with aggregates of porphyrins,213 sapphyrins214 and
lutein,32 and provides a simple, semi-quantitative analysis of aggregate effects.
Parameters needed are the interaction energy ΔE (obtained from the energy difference

138
between monomer absorption and aggregate absorption maxima), the transition moment
of the monomer absorption μ (obtained through the calculation of the oscillator strength
of monomer absorption), and the distance R between point-dipoles of oligomers in
aggregates. The latter is critical and will have a large influence on the result of the
calculation since the exciton interaction energy is proportional to the inverse cube of R.
Since no crystallographic data on the oligomers was obtained in this study, the distance R
has to be estimated. A maximum limit on R can be obtained by taking the intermolecular
distance obtained from a non-aggregating platinum acetylide complex bearing bulky
iptycene unit studied recently in our group,215 which was found to have R = 11.782 Å.
Other crystallographic data available for a stilbene platinum acetylide complex216 and a
simple platinum acetylide complex217 are R = 12.812 Å and 10.032 Å, respectively. Note
that in both cases, tri-n-butylphosphine ligands are used, which most likely creates
significant steric hindrance compared to the trimethylphosphine ligand used in the
present study. Relevant parameters for the calculation are presented in Table 4-2 below.
The evolution of the spectral shift Δλ is plotted as a function of the angle θ in Figure 4-
28. Several possible distances are examined and calculated angles θ for the experimental
spectral shifts are presented in Table 4-3 (see Experimental section for detail).
From the plots of the angle θ versus Δλ (Figure 4-32), some limits can be assigned
on the dipole-dipole distance in the aggregates. For Pt2M and Pt2MT, it can be seen that
only distances shorter than 8 Å can account for the exciton splitting observed. Above 8
Å, exciton splitting is too small to induce spectral shifts of 58 and 40 nm found in the
absorption study of Pt2M and Pt2MT, respectively. Since the model assumes no ground

139
Table 4-2. Absorption data of self-assembling platinum acetylide oligomers.
Pt2M Pt2MT Pt2MP3
λm (nm)a 358 378 365
εmax (M-1.cm-1)b 100,520 52,500 123,000
λagg (nm)c 300 338 405
Δλ (nm)d - 58 - 40 40
FWHM (cm-1)e 4709 4673 4895
ff 3.21 1.66 4.08
μ (D)g 15.6 11.5 17.8
a: absorption maximum of monomer; b: molar extinction coefficient of monomer at absorption maximum; c: absorption maximum of aggregate; d: absorption spectral shift (λagg – λm); e: full width at half maximum for monomer; f: oscillator strength; g: transition dipole moment for absorption of monomer.
state interaction, R must be larger than van der Waalls distances, which are about 3-4 Å
in the π-stacking of neutral aromatic compounds.214 Therefore the dipole-dipole distance
in the aggregates of Pt2M can be estimated to be between 8 and 4 Å. The angle θ
calculated for some possible distances R are presented in Table 4-3. For a perfect face-to-
face arrangement with θ = 90o, the calculated distance R is 7.7 Å for Pt2M, while it is 7.5
Å for Pt2MT.
For Pt2MP3, a large exciton splitting is obtained for a dipole-dipole distance R =
12 Å that can account for the absorption spectral shift observed in the aggregate. For a
perfectly arranged head-to-tail geometry with θ = 0o, the calculated dipole-dipole distance
is 13.3 Å (Table 4-3).

140
Figure 4-32. Plot of angle θ versus Δλ = λagg – λm for different dipole-dipole distance R. (a) Pt2M. (b) Pt2MT. (c) Pt2MP3; (―) R = 12 Å; (•••) R = 10 Å; (– – –) R = 9 Å; (– • • –) R = 8 Å; (― ―) R = 7 Å; (– • –) R = 6 Å.
Conclusion
A series of platinum acetylide oligomers designed to self-assemble in solution have
been synthesized in order to study the consequences of aggregation on the triplet excited
state. The oligomers were indeed found to form aggregates in dodecane solution, as
evidenced physically by the formation of gels at relatively low concentrations (~2 wt%).

141
Table 4-3. Some angles and dipole-dipole distances calculated with the molecular exciton model.
Pt2M Pt2MT Pt2MP3
R (Å) 7.7 7 6 7.5 7 6 13.3 10 8
α (degree) 90 73 65 90 75 66 0 38 46
A preliminary study of the mesoscopic properties of the oligomers revealed liquid-
crystalline phases between 120 oC and 180 oC. This is important for opto-electronic
applications because it may improve the processability of these oligomers, which are
often not as processable as polymers.
The photophysical study carried out on these oligomers revealed very different
behavior among the oligomer series. The presence of aggregates has been identified
spectroscopically, and the formation of H- and J-aggregates has been proposed from the
direction of spectral shifts observed in absorption spectrometry of the aggregates. The
mode of aggregation was found to have very different consequences on the
photoluminescence. Oligomers that formed H-aggregates showed intact phosphorescence
upon aggregation. The emission spectrum of H-aggregates was dependent on the
excitation wavelength, and exciting on the J-aggregate absorption band showed a blue-
shifted phosphorescence band in addition to the phosphorescence usually observed. The
“blue” phosphorescence band is assumed to arise from a high energy conformer present
in aggregate, where the restrained environment forces the molecule to adopt an
unfavorable conformation. Overall, the photophysical properties of the oligomer are
preserved in H-aggregates, which is particularly important for technological applications
relying on the triplet excited state. On the other hand, the photoluminescence spectrum of

142
an oligomer believed to form J-aggregate showed a drastic change upon aggregation,
where strong fluorescence was observed instead of phosphorescence, as in dilute
solutions. Although shorter lifetime of phosphorescence are observed in aggregates
compared to those in dilute solution, triplet-triplet annihilation is not believed to be
significatly responsible for the relative increase of fluorescence in aggregates.
Efficient energy transfer has been observed in mixed-oligomer systems, where one
oligomer was used a dopant. Donor emission was significantly quenched with only 5% of
dopant in gel. Both “blue” and “normal” emission bands were found to be affected by the
presence of the dopant, although to a lesser extent for the latter. This implies that the gel
contains domains where oligomer are not aggregated but rather trapped in a solvent cage
with some conformational freedom.
Finally, the molecular exciton model has been used under the dipole-dipole
approximation on the absorption data collected. For H-aggregates, the maximum dipole-
dipole distance was found to be ~7.5 Å, while it was found to be 13.3 Å for a J-aggegate.
Experimental
Thermal Properties
Differential scanning calorimetry (DSC) analysis was performed using a Perkin-
Elmer DSC 7 equipped with a controlled cooling accessory (CCA-7) at a heating and
cooling rate of 10 oC/min. Calibrations were made using indium and freshly distilled n-
octane as the standards for peak temperature transitions and indium for the enthalpy
standard. All samples were prepared in hermetically sealed pans (5-10 mg/sample) and
were run using an empty pan as a reference and an empty cells as a subtracted baseline.
Optical microscopic images of organogelators and organogels were observed on a
Leitz 585 SM-LUX-POL microscope equipped with crossed polars, a Leitz 350 heating

143
stage, a Photometrics CCD camera interfaced to a computer, and an Omega HH503
microprocessor thermometer connected to a J-K-T thermocouple. All solids were
sandwiched between thin cover slides. Organogel samples were smeared between two
glass slides. Temperature was increased approximately 3 - 4 ºC/min from room
temperature. All micrograph images were taken with a full-wave plate.
Photophysical Measurements
Steady-state absorption spectra were recorded on a Varian Cary 100 dual-beam
spectrophotometer. Samples were placed in adequate short path length cell (1 or 0.1 mm)
and absorbance was kept below 1. Corrected steady-state photoluminescence
measurements were conducted on a SPEX F-112 fluorescence spectrometer. Samples
were degassed by argon purging for 30 min and heated to an isotropic state regularly
during this time for adequate degassing of gel-forming solutions. Samples were placed in
a triangular-shaped cell and spectra recorded under pseudo front-face geometry to limit
self-absorption. The sample cell was positioned so that the incident beam was at 45o from
the face of the cell and emission detected at 45o. Low-temperature fluorescence
measurements were carried out similarly to the procedure described in Chapter 2.
Time-resolved photoluminescence measurements were carried out on the same
apparatus described in Chapter 2, except a N2 laser (λ = 337 nm, 10 ns fwhm) was used
as well for some oligomers. Photoluminescence was measured by front-face detection to
limit self-absorption.
Circular dichroism (CD) measurements were carried out on an Aviv-202 circular
dichroism spectrometer with a cell path length of 0.3 mm.

144
Calculation of Exciton Interaction Energy
The oscillator strength f of the monomer absorption was calculated using the
following equation:2
Γ×=Γ
×= −−max
9max9 10784.62
10319.4 επε
nmf (19)
where the constant is in cm2.mol.L-1, ε is the molar extinction coefficient in L.mol-1.cm-1
and Γ is the full width at half maximum in cm-1.
The transition dipole moment μ of the monomer absorption band was calculated by
v
f~10702.4 7−×
=μ (20)
where f has no dimension, the constant is in D-2.cm and the absorption maximum is in
cm
v~
-1. The dipole moment was converted to C.m using:
1 D = 3.33564 x 10⁻³⁰ C.m
The angle θ between the dipole moment of the monomers and the line of molecular
centers was calculated according to Kasha’s model27,28 of the molecular exciton in the
point-dipole approximation, assuming co-planar monomers in the aggregates and using
the following equation:
( θμπε
23
2
0
cos314
114 −⎟⎟⎠
⎞⎜⎜⎝
⎛⎟⎠⎞
⎜⎝⎛ −
=ΔRN
NE ) (21)
For dimers (N = 2), this equation becomes:
( θμπε
23
2
0
cos312
1−⎟⎟
⎠
⎞⎜⎜⎝
⎛=Δ
RE ) (22)
where ΔE is in Joules, ε0 is the permittivity of free space (ε0 = 8.8542 x 10⁻¹² C2.N-1.m-2),
μ is the transition dipole moment in C.m, R is the point-dipole―point-dipole distance in

145
m and θ is the angle between the dipole moment of the monomer and the line of
molecular centers in degree.
The interaction energy was obtained from the energy difference of the monomer and
aggregate maximum of absorption using
magg
hchcEλλ
−=Δ (23)
where h is Plank’s constant (h = 6.626 x 10⁻³⁴ J.s), c is the speed of light (c = 2.998 x10⁸
m.s-1, λagg and λm are the wavelengths in nm of absorption maximum of the aggregate and
of the monomer, respectively.
Synthesis
General. The same procedures as described in Chapter 2 were used. Compounds
were loaded on column for flash chromatography by dry-loading. For this, the crude
product was first dissolved in a few mL of CH2Cl2, silica (1:1 crude/silica by weight) was
added and the solvent removed. Crude adsorbed on silica was then loaded on column. cis-
Dichloro-bis-(trimethylphosphine)-platinum(II) was prepared in two steps by an adapted
literature method.218,219
cis-Bis(trimethylphosphine)dichloroplatinum(II). Potassium tetrachloroplatinate
(3.0 g, 7.27 mmol) was placed in water (60 mL) and the suspension degassed with
nitrogen. Then, diethyl sulfide (1.97 g, 21.8 mmol) was added via syringe and the
mixture stirred for 2 hours under reflux, during which time the mixture turned clear and
yellow. After cooling down, the solution was extracted with CH2Cl2 (3 x 60 mL), the
organic phase dried on MgSO4, and the solvent was removed to give the desired product
as a bright yellow solid. Yield = 2.815 g (87%). The next step was carried out without
characterization and cis-bis(diethylsulfide)dichloroplatinum(II) (2.815 g, 6.3 mmol) was

146
dissolved in CH2Cl2 and the solution degassed with nitrogen. Then trimethylphosphine
(13.9 mL of 1 M THF sol., 13.9 mmol) was added via syringe. A fine white solid
precipitated immediately and the mixture was further stirred for 30 min at room
temperature. After this time, the white solid was collected by filtration, washed with cold
Et2O, recrystallized from Et2O and dried under vacuum for 2 days. After this time, a faint
smell of diethyl sulfide could still be detected, although NMR does not reveal the
presence of diethyl sulfide. Yield = 2.483 g (94%). 1H NMR (300 MHz, CDCl3) δ 1.80
(m, 18H); 31P NMR (75 MHz, CDCl3) δ -23.53 (JPt-P = 3474.6 Hz).
5-Iodo-1,2,3-trimethoxybenzene (13). 3,4,5-Trimethoxyaniline (10.0 g, 54.6
mmol) was placed in a 500 mL beaker and water (120 mL) and sulfuric acid (8 mL) were
added. The beaker was placed in an ice-bath and stirred with a mechanical stirrer. Then
sodium nitrite (37.7 g, 564.6 mmol) in 60 mL of water was added dropwise and the
temperature was maintained between -5 oC and 0 oC. After addition of sodium nitrite was
complete, the reaction mixture was poured onto a 30 mL aqueous solution of potassium
iodide (14.0 g, 84.3 mmol) at 50 oC under strong magnetic stirring. After the addition of
the diazonium salt solution was complete, the mixture was stirred for 30 min. After
cooling down, an aqueous solution of sodium sulfite was added to neutralize excess
iodine until no further change in color was observed. The resulting aqueous solution was
extracted with Et2O (3 x 100 mL), the organic phase dried on MgSO4 and the solvent
removed to give the desired product as a yellow-orange solid. Yield = 13.3 g (83%). 1H
NMR (300 MHz, CDCl3) δ 3.82 (s, 3H), 3.84 (s, 6H), 6.89 (s, 2H); 13C NMR (75 MHz,
CDCl3) δ 56.5, 56.6, 86.4, 115.1, 147.4, 154.2.
147
5-Iodo-1,2,3-trihydroxybenzene (14). 5-Iodo-1,2,3-trimethoxybenzene (9 g, 30.6
mmol) was placed in a 250 mL three-neck round-bottom flask fitted with a condenser and
CaCl2 drying tube, dissolved in 60 mL of freshly distilled methylene chloride, degassed
with nitrogen and the solution cooled to -78 oC. Then boron tribromide (91.8 mL of 1M
CH2Cl2 solution, 91.8 mmol) was added slowly via syringe. After the addition was
complete, the mixture was allowed to warm to room temperature and further stirred for
24 h. The reaction was then carefully quenched with ice-water (40 mL) and stirred for 30
min. The mixture was then extracted with ethyl acetate (3 x 100 mL), the organic phase
washed with aqueous Na2SO3, dried on MgSO4 and solvent removed to give a brown oil.
Finally, the product was precipitated from the crude oil by addition of CHCl3, collected
by filtration, washed with cold CHCl3 and dried overnight to give the desired product as a
white solid. Yield = 4.06 g (53%). 1H NMR (300 MHz, acetone-d6) δ 6.78 (s, 2H), 7.56
(s, 1H), 8.22 (s, 2H); 13C NMR (75 MHz, acetone-d6) δ 60.7, 80.5, 117.2, 147.6.
1,2,3-Tris(dodecyloxy)-5-iodo-benzene (15). 5-Iodo-1,2,3-trihydroxybenzene (4.0
g, 15.9 mmol) was dissolved in DMF (80 mL) and the solution was degassed with
nitrogen for 15 min. Then K2CO3 (17.5 g, 127 mmol) was added and the mixture stirred
at room temperature for 30 min. Then bromododecane (17.1 mL, 17.8 g, 71.4 mmol) was
added and the mixture stirred at 60 oC for 7 h. After cooling down, the brown crude solid
was filtered and washed with ice-cold water. Chromatography (silica gel, hexane then 4:1
hexane/CH2Cl2) gave the desired product as a white solid. Yield = 10.79 g (90%). 1H
NMR (300 MHz, CDCl3) δ 0.88 (t, 9H), 1.26 (s, 48H), 1.45 (m, 6H), 1.78 (m, 6H), 3.92
(m, 6H), 6.84 (s, 2H); 13C NMR (75 MHz, CDCl3) δ 14.34, 22.92, 26.24, 26.31, 29.49,

148
29.58, 29.61, 29.80, 29.84, 29.88, 29.91, 29.95, 30.48, 32.15, 69.50, 73.64, 85.86, 116.39,
138.56, 154.15.
3,4,5-Tris(dodecyloxy)trimethylsilylethynylbenzene (16). 1,2,3-
Tris(dodecyloxy)-5-iodo-benzene (10.70 g, 14.14 mmol) was dissolved in THF (60 mL)
and i-Pr2NH (40 mL) and the solution was degassed with argon. Then
trimethylsilylacetylene (3.0 mL, 2.08 g, 21.2 mmol), Pd(PPh3)4 (489.6 mg, 0.42 mmol)
and CuI (80.7 mg, 0.42 mmol) were added. The mixture turned dark right away and was
stirred at 60 oC overnight. After cooling down, the mixture was passed through a bed of
Celite and the solvents were removed. The crude mixture was dissolved in CH2Cl2 (100
mL), washed with 10% aqueous NH4OH (2 x 100 mL), water (2 x 200 mL), dried on
MgSO4, and the solvent removed. The crude product was purified by flash
chromatography (silica gel, hexane then 4:1 hexane/CH2Cl2) to give the desired product
as a yellow solid. Yield = 6.0 g (58%). 1H NMR (300 MHz, CDCl3) δ 0.24 (s, 9H), 0.88
(t, 9H), 1.28 (s, 48H), 1.46 (m, 6H), 1.78 (m, 6H), 3.94 (m, 6H), 6.66 (s, 2H); 13C NMR
(75 MHz, CDCl3) δ 0.19, 14.27, 22.90, 26.28, 26.32, 29.55, 29.58, 29.61, 29.79, 29.85,
29.88, 29.91, 29.94, 29.97, 30.52, 32.14, 32.16, 53.50, 69.23, 73.32, 73.57, 92.55, 105.71,
110.68, 117.06, 117.69, 139.53, 153.01.
3,4,5-Tris(dodecyloxy)ethynylbenzene (17). 3,4,5-Tris(dodecyloxy)trimethylsilyl-
ethynylbenzene (5.58 g, 7.68 mmol) was dissolved in CH2Cl2 (40 mL) and MeOH (40
mL). Then K2CO3 (3.18 g, 23 mmol) was added and the mixture stirred at room
temperature for 4 h. Then, the mixture was transferred to a separatory funnel and water
(100 mL) was added. The aqueous phase was extracted with CH2Cl2 (2 x 50 mL), the
organic phase washed with water (3 x 50 mL), dried on MgSO4 and the solvent removed

149
to give the desired product as an off-white solid. Yield = 4.57 g (91%). 1H NMR (300
MHz, CDCl3) δ 0.88 (t, 9H), 1.28 (s, 48H), 1.46 (m, 6H), 1.78 (m, 6H), 2.98 (s, 1H), 3.94
(m, 6H), 6.68 (s, 2H); 13C NMR (75 MHz, CDCl3) δ 14.29, 22.90, 22.26, 26.26, 29.49,
29.59, 29.84, 29.91, 30.50, 32.13, 69.19, 73.62, 75.91, 75.98, 76.81, 84.16, 110.70,
116.64, 139.55, 153.08.
trans-[3,4,5-Tris(dodecyloxy)phenylethynyl]-chloro-bis(trimethylphosphine)-
platinum(II) (18). cis-Dichloro-bis(trimethylphosphine)platinum(II) (382.2 mg, 0.91
mmol) was placed in THF (3 mL) and Et2NH (3 mL) and the solution was degassed with
nitrogen. Then 17 (500 mg, 0.76 mmol) was added and the reaction stirred at room
temperature for 24 h after which time TLC showed no more organic 17 (RF = 0.78, 1:1
hexane/CH2Cl2) and a new spot (RF = 0.45, 1:2 hexane/CH2Cl2) was apparent. The
solvents were removed and the crude product was purified by flash chromatography
(silica gel, hexane then 7:3, 1:1, 3:7 hexane/CH2Cl2 and finally pure CH2Cl2) to give the
desired product as a pale yellow solid. Yield = 724.1 mg (96%). 1H NMR (300 MHz,
CDCl3) δ 0.85 (t, 9H), 1.28 (s, 48H), 1.48 (m, 6H), 1.63 (t, 18H), 1.76 (m, 6H), 3.93 (m,
6H), 6.51 (s, 2H); 13C NMR (75 MHz, CDCl3) δ 13.12, 13.37, 13.63, 13.99, 22.55, 25.98,
29.25, 29.27, 29.53, 29.57, 29.60, 29.62, 30.20, 31.80, 68.74, 73.13, 80.43, 101.75,
109.47, 122.65, 137.12, 152.45; 31P NMR (121 MHz, CDCl3) δ -13.66 (JPt-P = 2332.2
Hz).
Compound (19). 1,4-Diiodobenzene (33.0 mg, 0.1 mmol) was dissolved in THF (6
mL) and i-Pr2NH (4 mL) in a Schlenk flask and the solution degassed with argon. Then
1-ethynyl-4-(tri-iso-propylsilylethynyl)benzene (59.2 mg, 0.21 mmol), Pd(PPh3)4 (11.5
mg, 0.01 mmol) and CuI (1.9 mg, 0.01 mmol) were added and the mixture was stirred at

150
room temperature for 2 days. After the solvents were removed, the crude product was
purified by flash chromatography (silica gel, hexane then 4:1 hexane/CH2Cl2) to give the
desired product as a white solid. Yield = 43.9 mg (69%). 1H NMR (300 MHz, CDCl3) δ
1.15 (s, 42H), 7.45 (s, 8H), 7.50 (s, 4H); 13C NMR (75 MHz, CDCl3) δ 11.51, 18.88,
91.06, 91.31, 93.19, 106.79, 123.03, 123.23, 123.76, 131.57, 131.78, 132.22, 147.43.
Compound (20). Compound 19 (43.9 mg, 0.07 mmol) was dissolved in THF (3
mL) and the solution degassed with argon. Then TBAF (0.40 mL of 1 M THF solution,
0.40 mmol) was added via syringe. A white solid precipitated immediately and the
mixture was left stirring at room temperature for 5 h. After this time, the solvent was
removed and the crude redissolved in CH2Cl2 (50 mL), transferred to a separatory funnel,
washed with brine (2 x 50 mL) and water (2 x 50 mL), dried on MgSO4, and the solvent
was removed. The crude product was further purified by flash chromatography (silica gel,
hexane then 4:1, 7:3 hexane/CH2Cl2 to give the desired product (RF = 0.34 in 4:1
hexane/CH2Cl2) as a white crystalline solid. Yield = 14.7 mg (66%). 1H NMR (300 MHz,
CDCl3) δ 4.00 (s, 2H), 7.45 (s, 8H), 7.50 (s, 4H).
1,4-Diiodo-2,5-bis-[(S)-(+)-2-methylbutanoxy]benzene (21). 2,5-
Diiodohydroquinone (200 mg, 0.55 mmol) was dissolved in DMF (3 mL) and the
solution degassed with argon for 15 min. Then K2CO3 (455 mg, 3.3 mmol) was added
and the mixture stirred at room temperature for 30 min. Then (S)-(+)-1-bromo-2-
methylbutane (0.2 mL, 249.2 mL, 1.65 mmol) was added via syringe and the mixture was
stirred at 60 oC for 3 h. After this time, TLC (1:1 hexane/CH2Cl2) showed no more
starting material (RF = 0.05) and a new spot (RF = 0.25) was apparent. After cooling to
room temperature, water (10 mL) was added and mixture transferred to a separatory

151
funnel. The aqueous phase was extracted with CH2Cl2 (3 x 20 mL), the organic phase
dried on MgSO4, and the solvent was removed. The crude red oil obtained was further
purified by flash chromatography (silica gel, hexane then 4:1, 3:2 hexane/CH2Cl2) to give
the desired product as white crystalline solid. Yield = 176 mg (64%). 1H NMR (300
MHz, CDCl3) δ 0.97 (t, 6H), 1.08 (d, 6H), 1.32 (m, 2H), 1.62 (m, 2H), 1.90 (m, 2H), 3.80
(m, 4H), 7.17 (s, 2H); 13C NMR (75 MHz, CDCl3) δ 11.61, 16.90, 26.26, 34.96, 74.96,
86.24, 122.48, 152.87.
1,4-Bis-[(S)-(+)-2-methylbutanoxy]-2,5-bis(trimethylsilylethynyl)benzene (22).
1,4-Diiodo-2,5-bis-[(S)-(+)-2-methylbutanoxy]benzene (175 mg, 0.35 mmol) was
dissolved in THF (6 mL) and i-Pr2NH (4 mL) in a Schlenk flask and the solution was
degassed with argon for 15 min. Then trimethylsilylacetylene (75.2 mg, 0.11 mL, 0.76
mmol), Pd(PPh3)4 (40.1 mg, 0.035 mmol) and CuI (3.8 mg, 0.02 mmol) were added and
the reaction mixture stirred at 50 oC for 4 h. After this time, TLC (2:1 CH2Cl2/hexane)
showed no more starting material (RF = 0.36) and a new blue fluorescent spot (RF = 0.19)
was apparent. After cooling down, the solvents were removed and the crude product was
purified by flash chromatography (silica gel, hexane then 4:1, 3:2, 1:1, 1:2, 1:4
hexane/CH2Cl2 and finally pure CH2Cl2) to give the desired product as a white solid.
Yield = 151.7 mg (98%). 1H NMR (300 MHz, CDCl3) δ 0.26 (s, 18H), 0.96 (t, 6H), 1.08
(d, 6H), 1.30 (m, 2H), 1.64 (m, 2H), 1.88 (m, 2H), 3.78 (m, 4H), 6.90 (s, 2H); 13C NMR
(75 MHz, CDCl3) δ 0.15, 11.66, 16.71, 26.30, 35.16, 74.27, 100.15, 101.25, 114.01,
116.96, 154.29.
1,4-Bis-[(S)-(+)-2-methylbutanoxy]-2,5-bis-ethynylbenzene (23). 1,4-Bis-[(S)-
(+)-2-methylbutanoxy]-2,5-bis-trimethylsilylethynylbenzene (151 mg, 0.34 mmol) was

152
dissolved in THF (8 mL) and the solution was degassed with argon. Then TBAF (2 mL
of 1 M THF solution, 2.04 mmol) was added via syringe and the mixture stirred at room
temperature protected from light for 2 h. After this time, TLC (CH2Cl2) showed no more
starting material (RF = 0.5) and a new spot below it (RF = 0.36). The solvent was
removed at room temperature and the crude product was purified by flash
chromatography (silica gel, hexane then 1:1 and 2:3 hexane/CH2Cl2) to give the desired
product as a brown crystalline solid. Yield = 78.0 mg (77%). 1H NMR (300 MHz,
CDCl3) δ 0.95 (t, 6H), 1.03 (d, 6H), 1.28 (m, 2H), 1.58 (m, 2H), 1.88 (m, 2H), 3.33 (s,
2H), 3.78 (m, 4H), 6.95 (s, 2H); 13C NMR (75 MHz, CDCl3) δ 11.55, 16.71, 26.26, 34.88,
75.48, 79.92, 82.57, 113.32, 117.66, 154.24.
3-(4-iodophenyl)-prop-2-yn-1-ol (24). 1,4-Diiodobenzene (1.13 g, 3.44 mmol)
was dissolved in THF (12 mL) and i-Pr2NH (8 mL) in a Schlenk flask and the solution
was degassed with argon. Then propargyl alcohol (128 mg, 2.29 mmol), Pd(PPh3)4 (198
mg, 0.17 mmol) and CuI (65 mg, 0.34 mmol) were added and the mixture stirred at room
temperature for 20 h. Then, water (50 mL) and Et2O (50 mL) were added and the mixture
transferred to a separatory funnel. The aqueous phase was extracted with Et2O (3 x 50
mL), the combined organic phase washed with brine (3 x 50 mL), dried on MgSO4, and
the solvent was removed. The crude product was purified by flash chromatography (silica
gel, 4:1, 3:2, 2:3, 1:4 hexane/CH2Cl2 and finally pure CH2Cl2) to give the desired product
as a light yellow solid. Yield = 360.7 mg (61%). 1H NMR (300 MHz, CDCl3) δ 2.30 (s,
1H), 4.48 (s, 2H), 7.40 (dd, 4H); 13C NMR (75 MHz, CDCl3) δ 51.69, 84.91, 88.79,
94.64, 122.15, 133.29, 137.62.

153
3-[4-(3,4,5-tris(dodecyloxy)ethynylbenzene)-phenyl]-prop-2-yn-1-ol (25). 3-(4-
iodophenyl)-prop-2-yn-1-ol (360.7 mg, 1.4 mmol) was dissolved in THF (9 mL) and i-
Pr2NH (6 mL) in a Schlenk flask and the solution was degassed with argon for 30 min.
Then, 3,4,5-tris-(dodecyloxy)ethynylbenzene (962.2 mg, 1.47 mmol), Pd(PPh3)4 (80.8
mg, 0.07 mmol) and CuI (26.6 mg, 0.14 mmol) were added and the mixture stirred at 70
oC for 2 hours. After this time, TLC (CH2Cl2) showed no more starting material and a
new bright blue fluorescent spot (RF = 0.52) was apparent. Therefore, Et2O (20 mL) and
water (20 mL) were added and the mixture transferred to a separatory funnel. The
aqueous phase was extracted with Et2O (3 x 20 mL), the combined organic phase was
washed with 5% HCl (2 x 50 mL) and brine (2 x 50 mL), dried on MgSO4, and the
solvent was removed. The crude product was purified by flash chromatography (silica
gel, 4:1, 3:2, 2:3, 1:4 hexane/CH2Cl2 and finally pure CH2Cl2) to give the desired product
a sticky orange solid. Yield = 956.6 mg (87%). 1H NMR (300 MHz, CDCl3) δ 0.88 (t,
9H), 1.26 (s, 48H), 1.46 (m, 6H), 1.78 (m, 6H), 2.66 (s, 1H), 3.96 (m, 6H), 4.47 (s, 2H),
6.72 (s, 2H), 7.40 (dd, 4H); 13C NMR (75 MHz, CDCl3) δ 14.27, 22.87, 26.26, 29.50,
29.55, 29.58, 29.77, 29.83, 29.84, 29.88, 29.91, 29.93, 30.47, 32.10, 51.57, 69.26, 73.74,
85.18, 87.86, 89.39, 91.81, 110.26, 117.57, 122.42, 123.54, 131.46, 131.70, 153.09.
5-(4-ethynyl-phenylethynyl)-1,2,3-tris(dodecyloxy)benzene (26). 3-[4-(3,4,5-
Tris(dodecyloxy)ethynylbenzene)-phenyl]-prop-2-yn-1-ol (956.6 mg, 1.22 mmol) was
dissolved in dry Et2O and the solution degassed with nitrogen. Then, activated MnO2
(1.70 g, 19.52 mmol) and KOH (548 mg, 9.76 mmol) were added in four fractions every
hour and mixture was stirred at room temperature for 22 hours protected from light. After
this time, the mixture was passed through a bed of Celite and transferred to a separatory

154
funnel. The solution was washed with 5% HCl (2 x 100 mL) and water (2 x 50 mL), dried
on MgSO4, and the solvent was removed. The crude product was purified by flash
chromatography (silica gel, hexane, then 7:3, 3:2 hexane/CH2Cl2) to give the desired
product as an orange solid. Yield = 457.9 mg (50 %). 1H NMR (300 MHz, CDCl3) δ 0.88
(t, 9H), 1.26 (s, 48H), 1.46 (m, 6H), 1.78 (m, 6H), 3.14 (s, 1H), 3.96 (m, 6H), 6.72 (s,
2H), 7.44 (s, 4H); 13C NMR (75 MHz, CDCl3) δ 14.28, 22.89, 26.27, 26.30, 29.52, 29.59,
29.60, 29.80, 29.85, 29.87, 29.91, 19.94, 30.52, 32.13, 69.22, 73.64, 79.05, 83.39, 87.74,
92.05, 110.24, 117.48, 121.89, 124.05, 131.48, 132.16, 139.42, 153.17.
Pt2M. trans-[3,4,5-Tris(dodecyloxy)phenylethynyl]-chloro-
bis(trimethylphosphine)platinum(II) 18 (297.2 mg, 0.287 mmol) was placed in THF (10
mL) and Et2NH (10 mL) in a Schlenk flask and the solution was degassed with argon for
15 min. Then, 1,4-diethynylbenzene (18.0 mg, 0.14 mmol) and CuI ( 2.6 mg, 0.014
mmol) were added and the mixture stirred at room temperature for 3 h. After this time,
TLC showed no more platinum complex starting material and a new yellow-green
phosphorescent spot (RF = 0.65, CH2Cl2) was apparent. Therefore the solvents were
removed and the crude product purified by flash chromatography (silica gel, 2:3, 3:2, 4:1
CHCl3/hexane, CHCl3, and finally CHCl3 + 3% MeOH) to give a yellow solid. The
product was precipitated from 10:1 acetone/CH2Cl2 to give the desired product as an off-
white solid. Yield = 275.5 mg (92%). 1H NMR (300 MHz, CDCl3) δ 0.90 (t, 18H), 1.35
(s, 96 H), 1.50 (m, 12H), 1.80 (m, 48H), 3.98 (m, 12H), 6.55 (s, 4H), 7.18 (s, 4H); 13C
NMR (75 MHz, CDCl3) δ 14.24, 15.29, 15.55, 15.81, 22.81, 26.24, 29.49, 29.55, 29.78,
29.82, 29.86, 30.44, 32.05, 69.16, 73.54, 109.07, 109.19, 109.96, 123.02, 125.37, 130.78,

155
137.34, 152.76; 31P NMR (121 MHz, CDCl3) δ – 19.39 (JPt-P = 2293.0 Hz); Elemental
anal. calc’d C 62.12, H 9.19, found C 62.37, H 9.48.
Pt2MT. trans-[3,4,5-Tris(dodecyloxy)phenylethynyl]-chloro-
bis(trimethylphosphine)platinum(II) 18 (127.0 mg, 0.122 mmol) was placed in Et2NH (5
mL) in a Schlenk flask and the solution was degassed with argon for 15 min. Then, 2,5-
diethynylthiophene (7.9 mg, 0.06 mmol) and CuI (1.1 mg, 0.006 mmol) were added and
the mixture stirred at room temperature for 4 h. After this time, TLC showed no more
evolution, with some platinum complex starting material remaining, and a new red
phosphorescent spot (RF = 0.43, CH2Cl2) was apparent. Therefore the solvents were
removed and the crude product purified by flash chromatography (silica gel, 1:1, 3:2, 7:3,
4:1 CHCl3/hexane and finally pure CHCl3) to give a yellow solid. The product was
precipitated from 10:1:1 acetone/CH2Cl2/MeOH to give the desired product as an off-
white solid. Yield = 69.3 mg (54%). 1H NMR (300 MHz, CDCl3) δ 0.88 (t, 18H), 1.26 (s,
96H), 1.46 (m, 12H), 1.74 (m, 48H), 3.92 (m, 12H), 6.53 (s, 4H), 6.68 (s, 2H); 13C NMR
(75 MHz, CDCl3) δ 14.32, 15.36, 15.62, 15.89, 22.88, 26.29, 29.56, 29.58, 29.61, 29.85,
29.89, 29.93, 30.49, 32.11, 53.62, 69.18, 73.62, 109.85, 122.97, 127.86, 137.32, 152.80;
31P NMR (75 MHz, CDCl3) δ – 19.24 (JPt-P = 2296.3 Hz); Elemental anal. calc’d 60.82, H
9.07, found C 61.22, H 9.41.
Pt2MP3. Compound 20 (14.7 mg, 0.045 mmol) and trans-[3,4,5-
tris(dodecyloxy)phenylethynyl]-chloro-bis(trimethylphosphine)platinum(II) 18 (95.7 mg,
0.092 mmol) were placed in THF (3 mL) and Et2NH (3 mL) in a Schlenk flask and the
solution was degassed with argon for 15 min. Then CuI (0.8 mg, 0.004 mmol) was added
and the mixture stirred at room temperature for 6 h. After this time, TLC showed no more

156
starting material 20 and a new orange phosphorescent spot (RF = 0.35, 2:1
CH2Cl2/hexane) was apparent. Therefore the solvents were removed and the crude
product was purified by flash chromatography (silica gel, hexane then 4:1, 3:2, 2:3, 1:4
hexane/CH2Cl2, pure CH2Cl2 and finally CH2Cl2 + 3% MeOH) to give a yellow solid.
The product was precipitated from 10:1:1 acetone/CH2Cl2/MeOH to give the desired
product as a sticky orange solid. Yield = 64.0 mg (61%). 1H NMR (300 MHz, CDCl3) δ
0.90 (t, 18H), 1.25 (s, 96H), 1.45 (m, 12H), 1.75 (m, 48H), 3.90 (m, 12H), 6.55 (s, 4H),
7.30 (dd, 8H), 7.45 (s, 4H); 13C NMR (75 MHz, CDCl3) δ 14.34, 15.37, 15.64, 15.90,
22.90, 26.32, 29.58, 29.60, 29.63, 29.87, 29.91, 29.95, 30.52, 32.13, 69.22, 73.65, 109.94,
131.22, 131.48, 131.58, 152.84; 31P NMR (121 MHz, CDCl3) δ – 19.23 (JPt-P = 2294.1
Hz); Elemental anal. calc’d C 65.03, H 8.75, found C 65.24, H 9.07.
Pt2MC. trans-[3,4,5-Tris(dodecyloxy)phenylethynyl]-chloro-
bis(trimethylphosphine)platinum(II) 18 (168.2 mg, 0.162 mmol) was placed in THF (5
mL) and Et2NH (5 mL) in a Schlenk flask and the solution was degassed with argon for
15 min. Then 1,4-bis-[(S)-(+)-2-methylbutanoxy]-2,5-bis(ethynyl)benzene (23.6 mg, 0.08
mmol) and CuI ( 1.0 mg, 0.008 mmol) were added and the mixture stirred at room
temperature for 3 h. After this time, TLC showed no more starting material and a new
yellow phosphorescent spot (RF = 0.47, CH2Cl2) was apparent. Therefore the solvents
were removed and the crude product was purified by flash chromatography (silica gel,
hexane then 3:2, 2:3, 1:4 hexane/CHCl3 and finally pure CHCl3) to give a red solid. The
product was precipitated from 10:1:1 acetone/CH2Cl2/MeOH to give the desired product
as yellow solid. Yield = 140.7 mg (78%). 1H NMR (300 MHz, CDCl3) δ 0.88 (m, 24H),
0.98 (d, 6H), 1.26 (s, 98H), 1.46 (m, 12H), 1.62 (m, 2H), 1.76 (m, 50H), 3.74 (dt, 4H),

157
3.92 (m, 12H), 6.50 (s, 4H), 6.76 (s, 2H); 13C NMR (75 MHz, CDCl3) δ 11.50, 14.28,
15.37, 15.63, 15.89, 16.81, 22.83, 26.24, 26.30, 29.51, 29.29.80, 29.84, 29.89, 30.44,
32.06, 34.62, 69.08, 73.54, 74.24, 109.42, 109.83, 117.25, 123.04, 136.38, 137.17,
147.35, 147.37, 152.72, 153.08; 31P NMR (121 MHz, CDCl3) δ – 19.10 (JPt-P = 2309.5
Hz); Elemental anal. calc’d C 62.69, H 9.38, found C 63.20, H 9.73.
PE3. 1,4-Diiodobenzene (97.6 mg, 0.3 mmol) was dissolved in THF (18 mL) and i-
Pr2NH (12 mL) in a Schlenk flask and the solution was degassed with argon. Then, 5-(4-
ethynyl-phenylethynyl)-1,2,3-tris(dodecyloxy)benzene (457.9 mg, 0.61 mmol), Pd(Ph3)4
(17.1 mg, 0.015 mmol) and CuI (5.6 mg, 0.03 mmol) were added and the mixture stirred
at 50 oC for 3 hours. After this time, TLC (2:1 hexane/CH2Cl2) showed no more 1,4-
diiodobenzene (RF = 0.87) and a new bright blue fluorescent spot (RF = 0.44) was
apparent. The mixture was diluted to 6 mL with CH2Cl2, transferred to a separatory
funnel, washed with water (3 x 40 mL), dried on MgSO4, and the solvents were removed.
The crude product was purified by flash chromatography (silica gel, hexane then 4:1, 7:3
and 3:2 hexane/CH2Cl2) to give the desired product as a bright yellow solid. Yield =
405.1 mg (86%). 1H NMR (300 MHz, CDCl3) δ 0.88 (t, 18H), 1.26 (s, 96H), 1.46 (m,
12H), 1.78 (m, 12H), 3.96 (m, 12H), 6.73 (s, 4H), 7.48 (s, 12H); 13C NMR (75 MHz,
CDCl3) δ 14.30, 22.89, 26.28, 29.52, 29.58, 29.60, 29.79, 29.85, 29.91, 29.95, 30.52,
32.13, 69.22, 73.65, 87.99, 91.05, 91.31, 92.13, 110.23, 117.53, 122.76, 123.20, 123.64,
131.70, 132.64, 139.39, 153.17; Elemental anal. calc’d C 83.38, H 10.56, found C 84.48,
H 11.03.

CHAPTER 5 CONCLUSION
In previous chapters, different aspects of the photophysical properties of platinum
acetylide oligomers have been presented. The oligomers were designed to gain some
insight into the photophysical properties of these promising materials, but also on the
triplet excited state in general as it has been studied less than the singlet excited state. The
importance of the triplet excited state in all-organic systems where it is usually silent has
only recently been recognized. The studies presented in previous chapters may therefore
help understand the photophysical properties of triplet excited states in all-organic and
metal-organic conjugated systems.
A series of platinum acetylide oligomers containing oligothiophene units
incorporated in the main chain have been prepared in an effort to examine the effect of
low-energy traps on the triplet excited state. Although more localized than the singlet
exciton, the triplet exciton was found to be very sensitive to the presence of low-energy
sites. Triplet excitons were efficiently trapped by the oligothienyl-based units, from
which relaxation occurred. Depending on the energy level of the trap, two scenarios were
observed. In one case where the trap is relatively close in energy to the normal energy
level, relaxation occurred by radiative decay of the triplet excited state of the trap.
Evidence for an equilibrium between two excited states was observed and
phosphorescence remained the main channel of deactivation. In a second case, where the
energy of the trap is much lower than the normal triplet excited, phosphorescence was
almost entirely lost. Governed by the energy gap law, the triplet excited state of the
158

159
lowest energy traps relaxed through nonradiative channels and their emission spectra
were dominated by short lived fluorescence. Moreover, experimental evidence suggests
that the equilibrium is not operating when the energy gap between excited state is large.
This study suggests that the triplet exciton can migrate as well as the singlet exciton and
is therefore subject to being quenched by low energy sites.
In a second study, the same oligothiophene-containing platinum acetylide oligomer
series, as well as a series of oligomers of increasing chain length were studied by
electrochemistry and pulse radiolysis. The radical anions of the platinum acetylide
oligomers were found to be relatively unstable and very localized. On the other hand, the
radical cations displayed reversible oxidations and seemed more stable on the
electrochemical timescale. The radical cations seemed relatively localized, although not
as much as the radial anions. Evidence for possible multiple oxidations was found,
suggesting a relatively weak electronic coupling. Electronic absorption of the radical ions
displayed two transition bands, one in the visible attributed to a transition from ligand-
localized HOMO to SUMO and a second transition in the near-IR which origin was not
clearly determined.
Finally, a third study was devoted to self-assembling platinum acetylide oligomers
in order to probe the consequences of aggregation on the triplet excited state. A series of
different oligomers sharing long alkyl end-chains were synthesized toward this goal. The
materials displayed rich physical properties with liquid-crystalline mesophases and the
formation of gel in saturated hydrocarbon solvents. The consequences of aggregation
were found to fall into one of two categories. In one group, absorption of aggregates was
manifested by a blue-shifted absorption, attributed to H-aggregates. The photophysical

160
properties were almost intact and strong phosphorescence was observed even in
aggregates. Phosphorescence from a high-energy triplet excited state conformer was
observed but no dramatic change on the photoluminescence was otherwise observed. In a
second group, aggregation resulted in the appearance of a sharp red-shifted peak in the
absorption spectrum. The possibility that this could be due to a simple planarization
induced by aggregation was considered but other signs point out to the presence of J-
aggregates. In this case, the phosphorescence was seen to disappear almost completely
from the photoluminescence of aggregates, at the expense of a strong fluorescence
emission. The molecular exciton model was used assuming co-planar dimers and some
geometrical parameters of the aggregates were calculated. This study highlights the fact
that while aggregation may have practically no impact on the triplet excited state, in some
cases, the consequences are dramatic and the photophysical properties of the material
may be entirely compromised.

APPENDIX NMR SPECTRA
Figure A-1. H NMR (300 MHz, CDCl ) spectrum of Pt4. 13
Figure A-2. 31P NMR (121 MHz, CDCl3) spectrum of Pt4.
161

162
Figure A-3. 1H NMR (300 MHz, CDCl3) spectrum of Pt4T1.
Figure A-4. 31P NMR (121 MHz, CDCl3) spectrum of Pt4T1.

163
Figure A-5. 1H NMR (300 MHz, CDCl3) spectrum of Pt4T2.
Figure A-6. 31P NMR (121 MHz, CDCl3) spectrum of Pt4T2.

164
Figure A-7. 1H NMR (300 MHz, CDCl3) spectrum of Pt4T3.
Figure A-8. 31P NMR (121 MHz, CDCl3) spectrum of Pt4T3.

165
Figure A-9. 1H NMR (300 MHz, CDCl3) spectrum of Pt2M.
Figure A-10. 13C NMR (75 MHz, CDCl3) spectrum of Pt2M.
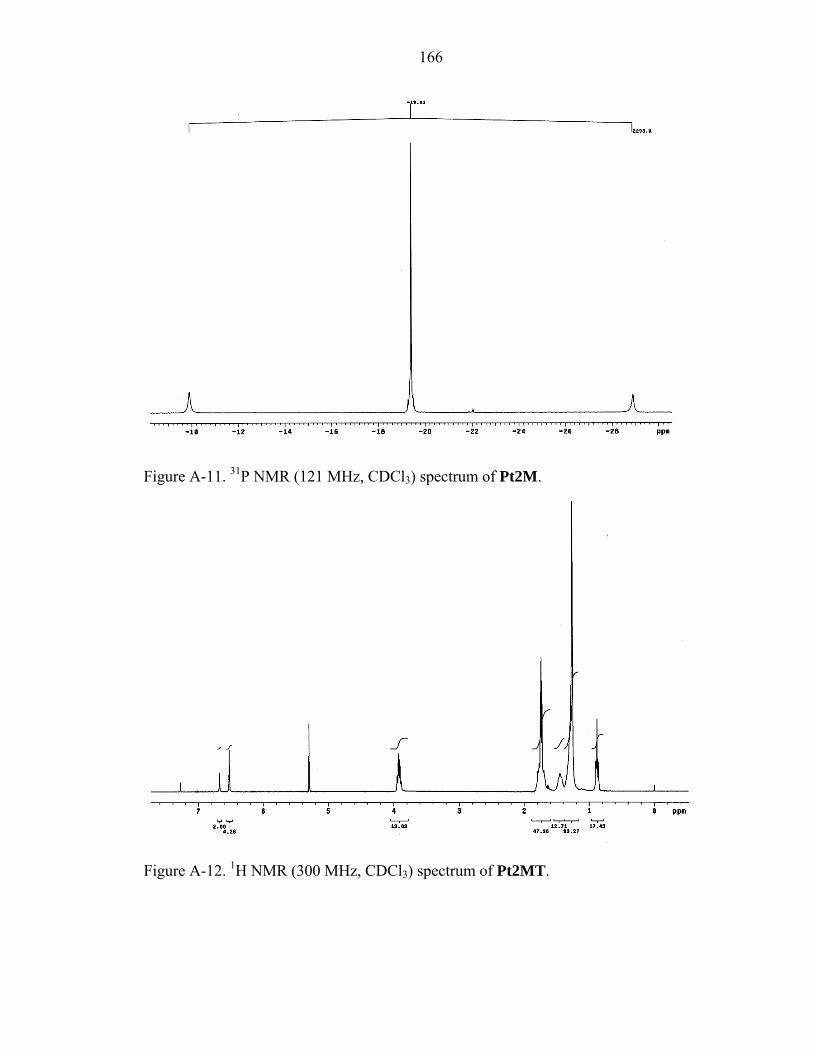
166
Figure A-11. 31P NMR (121 MHz, CDCl3) spectrum of Pt2M.
Figure A-12. 1H NMR (300 MHz, CDCl3) spectrum of Pt2MT.
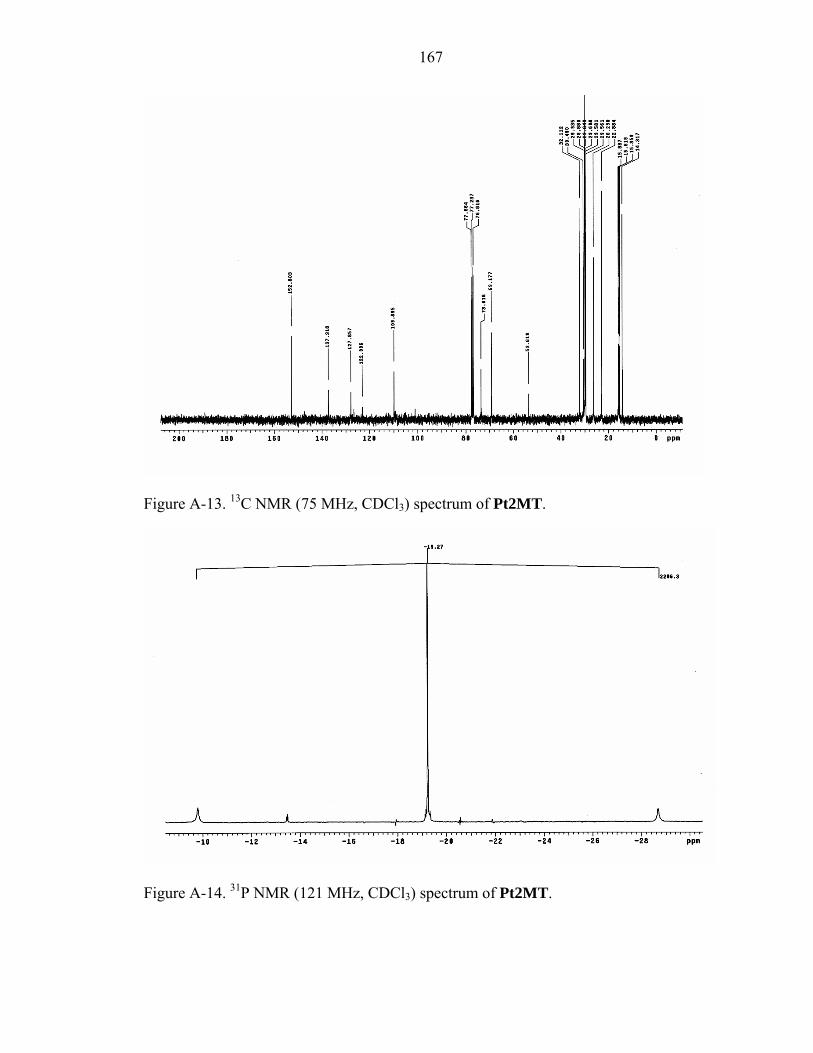
167
Figure A-13. 13C NMR (75 MHz, CDCl3) spectrum of Pt2MT.
Figure A-14. 31P NMR (121 MHz, CDCl3) spectrum of Pt2MT.

168
Figure A-15. 1H NMR (300 MHz, CDCl3) spectrum of Pt2MP3.
Figure A-16. 13C NMR (75 MHz, CDCl3) spectrum of Pt2MP3.

169
Figure A-17. 31P NMR (121 MHz, CDCl3) spectrum of Pt2MP3.
Figure A-18. 1H NMR (300 MHz, CDCl3) spectrum of Pt2MC.

170
Figure A-19. 13C NMR (75 MHz, CDCl3) spectrum of Pt2MC.
Figure A-20. 31P NMR (121 MHz, CDCl3) spectrum of Pt2MC.

171
Figure A-21. 1H NMR (300 MHz, CDCl3) spectrum of PE3.
Figure A-22. 13C NMR (75 MHz, CDCl3) spectrum of PE3.

LIST OF REFERENCES
1. Atkins, P.; de Paula, J. In Physical Chemistry; W.H. Freeman and Company: New York, 2001, p 304.
2. Gilbert, A.; Baggot, J. Essentials of Molecular Photochemistry; CRC Press, Inc.: Boca Raton, 1991.
3. Turro, N. J. In Modern Molecular Photochemistry; The Benjamin/Cummings Publishing Co., Inc.: Menlo Park, 1978, p 185.
4. Ingle, J. D. J.; Crouch, S. R. In Spectrochemical Analysis; Prentice-Hall, Inc.: Upper Saddle River, 1988, p 342.
5. Englman, R.; Joshua, J. Energy Gap Law for Radiationless Transitions in Large Molecules. Mol. Phys. 1970, 18, 145.
6. Lin, S.-H. Energy Gap Law and Franck-Condon Factor in Radiationless Transitions. J. Chem. Phys. 1970, 53, 3766.
7. Caspar, J. V.; Meyer, T. J. Application of the Energy Gap Law to Nonradiative, Excited-State Decay. J. Phys. Chem. 1983, 87, 952.
8. Dexter, D. L. A Theory of Sensitized Luminescence in Solids. J. Chem. Phys. 1953, 21, 836.
9. Lakowicz, J. R. In Principles of Fluorescence Spectroscopy; Kluwer Academic/Plenum Publishers: New York, 1999, p 239.
10. Förster, T. 10th Spiers Memorial Lecture. Transfer Mechanism of Electronic Excitation. Discuss. Faraday Soc. 1959, 27, 7.
11. Lakowicz, J. R. In Principles of Fluorescence Spectroscopy; Kluwer Academic/Plenum Publishers: New York, 1999, p 367.
12. Elisha, H. The Study of Protein Folding and Dynamics by Determination of Intramolecular Distance Distributions and Their Fluctuations Using Ensemble and Single-Molecule FRET Measurements. ChemPhysChem 2005, 6, 858.
13. Heidecker, M.; Yan-Marriott, Y.; Marriott, G. Proximity Relationships and Structural Dynamics of the Phalloidin Binding Site of Actin Filaments in Solution and on Single Actin Filaments on Heavy Meromyosin. Biochemistry 1995, 34, 11017.
172

173
14. Qu, Q.; Sharon, F. J. Proximity of Bound Hoechst 33342 to the ATPase Catalytic Sites Places the Drug Binding Site of P-glycoprotein within the Cytoplasmic Membrane Leaflet. Biochemistry 2002, 41, 4744.
15. Birks, J. B. Photophysics of Aromatic Molecules; Wiley-Interscience: London, 1970.
16. Stevens, B. Some Effects of Molecular Orientation on Fluorescence Emission and Energy Transfer in Crystalline Aromatic Hydrocarbons. Spectrochim. Acta 1962, 18, 439.
17. Chandross, E. A.; Ferguson, J.; McRae, E. G. Absorption and Emission Spectra of Anthracene Dimers. J. Chem. Phys. 1966, 45, 3546.
18. Chandross, E. A.; Dempster, C. J. Intramolecular Excimer Formation and Fluorescence Quenching in Dinaphthylalkanes. J. Am. Chem. Soc. 1970, 92, 3586.
19. Bernhard, N.; Rodriguez Prieto, M. F. On the Alleged Triplet-Excimer Phosphorescence from Liquid Solutions of Naphtalene and Di-α-Naphtylalkanes in Isooctane. Chem. Phys. Lett. 1988, 146, 125.
20. Locke, R. J.; Lim, E. C. Comment. Triplet excimers: Further Verification by Emission Measurements. Chem. Phys. Lett. 1989, 160, 96.
21. Lim, E., C. Molecular Triplet Excimers. Acc. Chem. Res. 1987, 20, 8.
22. Subudhi, P. C.; Lim, E. C. Phosphorescence from Fluid Solutions of Dinaphthylpropane: Evidence for a Conformational Difference Between Singlet and Triplet Excimers. J. Chem. Phys. 1975, 63, 5491.
23. Haggquist, G. W.; Burkhart, R. D. Triplet Photophysics of Multichromophoric Molecules. A Study of Poly(N-ninylcarbazole) and meso-2,4-Dicarbazolylpentane in Fluid Solutions. Macromolecules 1995, 28, 2465.
24. Etheridge, H. T., III; Weisman, R. B. C70 Triplet Excimers: Evidence from Transient Absorption Kinetics. J. Phys. Chem. 1995, 99, 2782.
25. D'Andrade, B. W.; Brooks, J.; Adamovich, V.; Thompson, M. E.; Forrest, S. R. White Light Emission Using Triplet Excimers in Electrophosphorescent Organic Light-Emitting Devices. Adv. Mater. 2002, 14, 1032.
26. Davydov, A. S. Theory of Molecular Excitons; McGraw-Hill: New York, 1962.
27. McRae, E. G.; Kasha, M. In Physical Processes in Radiation Biology; Augenstein, L., Mason, R., Rosenberg, B., Eds.; Academic Press: New York, 1964, pp 23.

174
28. Kasha, M.; Rawls, H. R.; Ashraf El-Bayoumi, M. The Exciton Model in Molecular Spectroscopy. Pure Appl. Chem. 1965, 11, 371.
29. Doan, S. C.; Shanmugham, S.; Aston, D. E.; McHale, J. L. Counterion Dependent Dye Aggregates: Nanorods and Nanorings of Tetra(p-carboxyphenyl)porphyrin. J. Am. Chem. Soc. 2005, 127, 5885.
30. Kubát, P.; Lang, K.; Procházková, K.; Anzenbacher, P. J. Self-Aggregates of Cationic meso-Tetratolylporphyrins in Aqueous Solutions. Langmuir 2003, 19, 422.
31. Nasr, C.; Hotchandani, S. Excited-State Behavior of Nile Blue H-Aggregates Bound to SiO2 and SnO2 Colloids. Chem. Mater. 2000, 12, 1529.
32. Zsila, F.; Bikádi, Z.; Keresztes, Z.; Deli, J.; Simonyi, M. Investigation of the Self-Organization of Lutein and Lutein Diacetate by Electronic Absorption, Circular Dichroism Spectroscopy, and Atomic Force Microscopy. J. Phys. Chem. B 2001, 105, 9413.
33. Kasha, M. In Spectroscopy of the Excited State.; Di Bartolo, B., Ed.; Plenum Press: New York, 1975, p 340.
34. Bellin, J. S. Photoreduction of Eosin in the Bound State. J. Am. Chem. Soc. 1957, 79, 2461.
35. Levinson, G. S.; Simpson, W. T.; Curtis, W. Electronic Spectra of Pyridocyanine Dyes with Assignments of Transitions. J. Am. Chem. Soc. 1957, 79, 4314.
36. McRae, E. G.; Kasha, M. Enhancement of Phosphorescence Ability upon Aggregatation of Dye Molecules. J. Chem. Phys. 1958, 28, 721.
37. An, B.-K.; Kwon, S.-K.; Jung, S.-D.; Park, S. Y. Enhanced Emission and its Switching in Fluorescent Organic Nanoparticles. J. Am. Chem. Soc. 2002, 124, 14410.
38. Mooney, W. F.; Brown, P. E.; Russel, J. C.; Costa, S. B.; Pedersen, L. G.; Whitten, D. G. Photochemistry and Photophysics of Surfactant trans-Stilbenes in Supported Multilayers and Films at the Air-Water Interface. J. Am. Chem. Soc. 1984, 106, 5659.
39. Whitten, D. G. Photochemistry and Photophysics of trans-Stilbene and Related Alkenes in Surfactant Assemblies. Acc. Chem. Res. 1993, 26, 502.
40. Pawlik, A.; Ouart, A.; Kirstein, S.; Abraham, H.-W.; Daehne, S. Synthesis and UV/Vis Spectra of J-Aggregating 5,5',6,6'-Tetrachlorobenzimidacarbocyanine Dyes for Artificial Light-Harvesting Systems and for Asymmetrical Generation of Supramolecular Helices. Eur. J. Org. Chem. 2003, 3065.

175
41. Wohlgenannt, M.; Jiang, X. M.; Vardeny, Z. V.; Janssen, R. A. J. Conjugation-Length Dependence of Spin-Dependent Exciton Formation Rates in π-Conjugated Oligomers and Polymers. Phys. Rev. Lett. 2002, 88, 197401.
42. Beljonne, D.; Ye, A.; Shuai, Z.; Brédas, J.-L. Chain-Length Dependence of Singlet and Triplet Exciton Formation Rates in Organic Light-Emitting Diodes. Adv. Funct. Mater. 2004, 14, 631.
43. Burrows, H. D.; Seixas de Melo, J.; Serpa, C.; Arnaut, L. G.; Miguel, M. d. G.; Monkman, A. P.; Hamblett, I.; Navaratnam, S. Triplet State Dynamics on Isolated Conjugated Polymer Chains. Chem. Phys. 2002, 285, 3.
44. Monkman, A. P.; Burrows, H. D. Backbone Planarity Effects on Triplet Energies and Electron-Electron Correlation in Luminescent Conjugated Polymers. Synth. Met. 2004, 141, 81.
45. Köhler, A.; Wilson, J. S.; Friend, R. H.; Al-Suti, M. K.; Khan, M. S.; Gerhard, A.; Bässler, H. The Singlet-Triplet Energy Gap in Organic and Pt-Containing Phenylene Ethynylene Polymers and Monomers. J. Chem. Phys. 2002, 116, 9457.
46. Hertel, D.; Setayesh, S.; Nothofer, H.-G.; Scherf, U.; Müllen, K.; Bässler, H. Phosphorescence in Conjugated Poly(para-phenylene)-Derivatives. Adv. Mater. 2001, 13, 65.
47. Laquai, F.; Im, C.; Kadashchuk, A.; Bässler, H. Sensitized Intrinsic Phosphorescence from a Poly(phenylene-vinylene) Derivative. Chem. Phys. Lett. 2003, 375, 286.
48. Köhler, A.; Beljonne, D. The Singlet-Triplet Energy Exchange Energy in Conjugated Polymers. Adv. Funct. Mater. 2004, 14, 11.
49. Sonogashira, K.; Fujikura, Y.; Yatake, T.; Toyoshima, N.; Takahashi, S.; Hagihara, N. Syntheses and Properties of cis and trans-Dialkynyl Complexes of Platinum(II). J. Organomet. Chem. 1978, 145, 101.
50. Mather, G. G.; Pidcock, A.; Rapsey, G. J. N. Correlation of NMR Coupling Constants with Transition Metal-Ligand Bond Lengths in Tertiary Phosphine Complexes. J. Chem. Soc., Dalton Trans. 1973, 2095.
51. Sonogashira, K.; Kataoka, S.; Takahashi, S.; Hagihara, N. Studies of Poly-yne Polymers Containing Transition Metals in the Main Chain. J. Organomet. Chem. 1978, 160, 319.
52. Lewis, J.; Long, N. J.; Raithby, P. R.; Shields, G. P.; Wong, W.-Y.; Younus, M. Synthesis and Characterization of New Acetylide-Functionalised Oligothiophenes and Their Dinuclear Platinum Complexes. J. Chem. Soc., Dalton Trans. 1997, 4283.

176
53. McKay, T. J.; Bolger, J. A.; Staromlynska, J.; Davy, J. R. Linear and Nonlinear Optical Properties of Platinum-Ethynyl. J. Chem. Phys. 1998, 108, 5537.
54. Staromlynska, J.; Chapple, P. B.; Davy, J. R.; McKay, T. J. A Platinum Ethynyl Compound for Optical Limiting. Proceedings of SPIE-The International Society for Optical Engineering 1994, 2229, 59.
55. Vestberg, R.; Westlund, R.; Carlsson, M.; Ellasson, B.; Glimsdal, E.; Oertengren, J.; Lindgren, M.; Malmstroem, E. Photophysical Properties of Dendronized Platinum(II) Acetylides for Optical Power Limiting. Polym. Mater. Sci. Eng. 2005, 92, 622.
56. Onitsuka, K.; Shimizu, A.; Takahashi, S. A Divergent Approach to the Precise Synthesis of Giant Organometallic Dendrimers using Platinum-Acetylides as Building Blocks. Chem. Comm. 2003, 280.
57. Onitsuka, K.; Fujimoto, M.; Kitajima, H.; Ohshiro, N.; Takei, F.; Takahashi, S. Convergent Synthesis of Platinum-Acetylide Dendrimers. Chem. Eur. J. 2004, 10, 6433.
58. Cooper, T. M.; Hall, B. C.; Burke, A. R.; Rogers, J. E.; McLean, D. G.; Slagle, J. E.; Fleitz, P. A. Glass-Forming Liquid Platinum Acetylides. Chem. Mater. 2004, 16, 3215.
59. Campbell, K.; Johnson, C. A., III; McDonald, R.; Ferguson, M. J.; Haley, M. M.; Tykwinski, R. R. A Simple, One-Step Procedure for the Formation of Chiral Metallamacrocycles. Angew. Chem., Int. Ed. 2004, 43, 5967.
60. Beljonne, D.; Wittmann, H. F.; Köhler, A.; Graham, S.; Younus, M.; Lewis, J.; Raithby, P. R.; Khan, M. S.; Friend, R. H.; Brédas, J.-L. Spatial Extent of the Singlet and Triplet Excitons in Transition Metal-Containing Poly-ynes. J. Chem. Phys. 1996, 105, 3868.
61. Cooper, T. M.; Blaudeau, J.-P.; Hall, B. C.; Rogers, J. E.; McLean, D. G.; Liu, Y.; Toscano, J. P. The Triplet State of Platinum Acetylide Chromophore Examined by Time-Resolved Infrared Spectroscopy and Density Functional Theory. Chem. Phys. Lett. 2004, 400, 239.
62. Emmert, L. A.; Choi, W.; Marshall, J. A.; Yang, J.; Meyer, L. A.; Brozik, J. A. The Excited State Symmetry Characteristics of Platinum Phenylacetylene Compounds. J. Phys. Chem. A 2003, 107, 11340.
63. Chawdhury, N.; Köhler, A.; Friend, R. H.; Wong, W.-Y.; Lewis, J.; Younus, M.; Raithby, P.; Corcoran, T. C.; Al-Mandhary, M. R. A.; Khan, M. S. Evolution of Lowest Singlet and Triplet Excited States with Number of Thienyl Rings in Platinum Poly-ynes. J. Chem. Phys. 1999, 110, 4963.

177
64. Wilson, J. S.; Chawdhury, N.; Al-Mandhary, M. R. A.; Younus, M.; Khan, M. S.; Raithby, P.; Köhler, A.; Friend, R. H. The Energy Gap Law for Triplet States in Pt-Containing Conjugated Polymers and Monomers. J. Am. Chem. Soc. 2001, 123, 9412.
65. Penner, A. P.; Siebrand, W.; Zgierski, M. Z. Radiationless Decay of Vibronically Coupled Electronic States. J. Chem. Phys. 1978, 69, 5496.
66. Rogers, J. E.; Cooper, T. M.; Fleitz, P. A.; Glass, D. J.; McLean, D. G. Photophysical Characterization of a Series of Platinum(II)-Containing Phenyl-Ethynyl Oligomers. J. Phys. Chem. A 2002, 106, 10108.
67. Liu, Y.; Jiang, S.; Glusac, K.; Powell, D. H.; Anderson, D. F.; Schanze, K. S. Photophysics of Monodisperse Platinum-Acetylide Oligomers: Delocalization in the Singlet and Triplet Excited States. J. Am. Chem. Soc. 2002, 124, 12412.
68. Glusac, K. D.; Schanze, K. S. Photophysics and Photochemistry of Platinum-Acetylide Complexes: Models for Metal-Acetylide Polymers. Polym. Prep. 2002, 43, 87.
69. Staromlynska, J.; McKay, T. J.; Bolger, J. A.; Davy, J. R. Evidence for Broadband Optical Limiting in a Pt-Ethynyl Compound. J. Opt. Soc. Am. B 1998, 15, 1731.
70. Lammi, R. K.; Barbara, P. F. Influence of Chain Length on Exciton Migration to Low-Energy Sites in Single Fluorene Copolymers. Photochem. Photobiol. Sci. 2005, 4, 95.
71. Kraabel, B.; Klimov, I.; Kohlman, R.; Xu, S.; Wang, H.-L.; McBranch, D. W. Unified Picture of the Photoexcitations in Phenylene-Based Conjugated Polymers: Universal Spectral and Dynamical Features in Subpicosecond Transient Absorption. Phys. Rev. B: Condens. Matter 2000, 61, 8501.
72. Koizumi, Y.; Seki, S.; Acharya, A.; Saeki, A.; Tagawa, S. Delocalization of Positive and Negative Charge Carriers on Oligo- and Poly-Fluorenes Studied by Low-Temperature Matrix Isolation Technique. Chem. Lett. 2004, 33, 1290.
73. Peng, K.-Y.; Chen, S.-A.; Fann, W.-S.; Chen, S.-H.; Su, A. C. Well-Packed Chains and Aggregates in the Emission Mechanism of Conjugated Polymers. J. Phys. Chem. B 2005, 109, 9368.
74. Menon, A.; Galvin, M.; Walz, K. A.; Rothberg, L. Structural Basis for the Spectroscopy and Photophysics of Solution-Aggregated Conjugated Polymers. Synth. Met. 2004, 141, 197.
75. Hoeben, F. J. M.; Jonkheijm, P.; Meijer, E. W.; Schenning, A. P. H. J. About Supramolecular Assemblies of π-Conjugated Systems. Chem. Rev. 2005, 105, 1491.

178
76. Burroughes, J. H.; Bradley, D. D. C.; Brown, A. R.; Marks, R. N.; Mackay, K.; Friend, R. H.; Burns, P. L.; Holmes, A. B. Light-Emitting Diodes Based on Conjugated Polymers. Nature 1990, 347, 539.
77. Braun, D.; Heeger, A. J. Visible Light Emission from Semiconducting Polymer Diodes. Appl. Phys. Lett. 1991, 58, 1982.
78. Friend, R. H.; Gymer, R. W.; Holmes, A. B.; Burroughes, J. H.; Marks, R. N.; Taliani, C.; Bradley, D. D. C.; Dos Santos, D. A.; Brédas, J.-L.; Lögdlund, M.; Salaneck, W. R. Electroluminescence in Conjugated Polymers. Nature 1999, 397, 121.
79. List, E. J. W.; Kim, C. H.; Graupner, W.; Leising, G.; Shinar, J. Nonradiative Quenching of Singlet Excitons by Polarons in π-Conjugated Polymers. Synth. Met. 2001, 119, 511.
80. Campbell, A. J.; Bradley, D. D. C.; Lidzey, D. G. Charge Trapping in Polymer Diodes. Opt. Mater. 1998, 9, 114.
81. Zhao, W.; Cao, T.; White, J. M. On the Origin of Green Emission in Polyfluorene Polymers: The Roles of Thermal Oxidation Degradation and Crosslinking. Adv. Funct. Mater. 2004, 14, 783.
82. Romaner, L.; Pogantsch, A.; Scandiucci de Freitas, P.; Scherf, U.; Gaal, M.; Zojer, E.; List, E. J. W. The Origin of Green Emission in Polyfluorene-Based Conjugated Polymers: On-Chain Defect Fluorescence. Adv. Funct. Mater. 2003, 13, 597.
83. Yan, M.; Rothberg, L. J.; Papadimitrakopoulos, F.; Galvin, M. E.; Miller, T. M. Defect Quenching of Conjugated Polymer Luminescence. Phys. Rev. Lett. 1994, 73, 744.
84. Lupton, J. M.; Craig, M. R.; Meijer, E. W. On-Chain Defect Emission in Electroluminescent Polyfluorenes. Appl. Phys. Lett. 2002, 80, 4489.
85. Tretiak, S.; Igumenschchev, K.; Chernyak, V. Exciton Sizes of Conducting Polymers Predicted by Time-Dependent Density Functional Theory. Phys. Rev. B: Condens. Matter 2005, 71, 033201.
86. Martin, R. E.; Diederich, F. Linear Monodisperse π-Conjugated Oligomers: Model Compounds for Polymers and More. Angew. Chem., Int. Ed. 1999, 38, 1350.
87. Hennebicq, E.; Pourtois, G.; Scholes, G. D.; Herz, L. M.; Russel, D. M.; Silva, C.; Setayesh, S.; Grimsdale, A. C.; Müllen, K.; Brédas, J.-L.; Beljonne, D. Exciton Migration in Rigid-Rod Conjugated Polymers: an Improved Förster Model. J. Am. Chem. Soc. 2005, 127, 4744.

179
88. Wasserberg, D.; Marsal, P.; Meskers, S. C. J.; Janssen, R. A. J.; Beljonne, D. Phosphorescence and Triplet State Energies of Oligothiophenes. J. Phys. Chem. B 2005, 109, 4410.
89. Seixas de Melo, J.; Silva, L. M.; Arnaut, L. G.; Becker, R. S. Singlet and Triplet Energies of Oligothiophenes: A Spectroscopic, Theoritical, and Photoacoustic Study: Extrapolation to Polythiophene. J. Chem. Phys. 1999, 111, 5427.
90. Sonogashira, K.; Tohda, Y.; Hagihara, N. A Convenient Synthesis of Acetylenes: Catalytic Substitutions of Acetylenic Hydrogens with Bromoalkenes, Iodoarenes and Bromopyridine. Tet. Lett. 1975, 16.
91. Wilson, J. S.; Wilson, R. J.; Friend, R. H.; Köhler, A.; Al-Suti, M. K.; Al-Mandhary, M. R. A.; Khan, M. S. Polarization of Singlet and Triplet Excited States in a Platinum-Containing Conjugated Polymer. Phys. Rev. B: Condens. Matter 2003, 67, 125206.
92. Cummings, S. D.; Eisenberg, R. Tuning the Excited-State Properties of Platinum(II) Diimine Dithiolate Complexes. J. Am. Chem. Soc. 1996, 118, 1949.
93. Funston, A. M.; Silverman, E. E.; Miller, J. R.; Schanze, K. S. Charge Transfer Through Terthiophene End-Capped Poly(arylene ethynylene)s. J. Phys. Chem. B 2004, 108, 1544.
94. List, E. J. W.; Leising, G. Excitation Energy Migration Assisted Processes in Conjugated Polymers. Synth. Met. 2004, 141, 211.
95. Liu, S.; Schanze, K. S. Solvent Tuned Excited State Configuration Mixing in a π-Conjugated Metal-Organic Oligomer. Chem. Comm. 2004, 1510.
96. Hissler, M.; Harriman, A.; Khatyr, A.; Ziessel, R. Intramolecular Triplet Energy Transfer in Pyrene-Metal Polypyridine Dyads: A Strategy for Extending the Triplet Lifetime of the Metal Complex. Chem. Eur. J. 1999, 5, 3366.
97. Danilov, E. O.; Pomestchenko, I. E.; Kinayyigit, S.; Gentili, P. L.; Hissler, M.; Ziessel, R.; Castellano, F. N. Ultrafast Energy Migration in Platinum(II) Diimine Complexes Bearing Phenylacetylide Chromophores. J. Phys. Chem. A 2005, 109, 2465.
98. Demas, J. N.; Crosby, G. A. Measurements of Photoluminescence Quantum Yields. Review. J. Phys. Chem. 1971, 75, 991.
99. Wang, Y.; Schanze, K. S. Photochemical Probes of Intramolecular Electron and Energy Transfer. Chem. Phys. 1993, 176, 305.
100. Wei, J.; Buriak, J.; Siuzdak, G. Desorption-Ionization Mass Spectrometry on Porous Silicon. Nature 1999, 399, 243.

180
101. Shen, Z.; Thomas, J. J.; Averbuj, C.; Broo, K. M.; Engelhard, M.; Crowell, J. E.; Finn, M. G.; Siuzdak, G. Porous Silicon as a Versatile Platform for Laser Desorption/Ionization Mass Spectrometry. Anal. Chem. 2001, 73, 612.
102. Kauffman, G. B.; Teter, L. A. cis and trans-Dichloro-bis-(tri-n-butylphosphine)platinum(II). Inorganic Syntheses 1963, 7, 245.
103. Greenham, N. C.; Moratti, S. C.; Bradley, D. D. C.; Friend, R. H.; Holmes, A. B. Efficient Light-Emitting Diodes Based on Polymers with High Electron Affinity. Nature 1993, 365, 628.
104. Pichler, K.; Jarrett, C. P.; Friend, R. H.; Ratier, B.; Moliton, A. Field-Effect Transistors Based on Poly(p-phenylene vinylene) Doped by Ion Implantation. J. Appl. Phys. 1995, 77, 3523.
105. Roichman, Y.; Tessler, N. Structures of Field-Effect Transistor: Experimental and Numerical Analyses. Appl. Phys. Lett. 2002, 80, 151.
106. Sariciftci, N. S.; Smilowitz, L.; Heeger, A. J.; Wudl, F. Photoinduced Electron Transfer from a Conducting Polymer to Buckminsterfullerene. Science 1992, 258, 1474.
107. Shaheen, S. E.; Radspinner, R.; Peyghambarian, N.; Jabbour, G. Fabrication of Bulk Heterojunction Plastic Solar Cells by Screen Printing. Appl. Phys. Lett. 2001, 79, 2996.
108. Scott, J. C.; Brock, P. J.; Salem, J. R.; Ramos, S.; Malliaras, G. G.; Carter, S. A.; Bozano, L. Charge Transport Processes in Organic Light-Emitting Devices. Synth. Met. 2000, 111-112, 289.
109. Su, W. P.; Schrieffer, J. R.; Heeger, A. J. Soliton Excitations in Polyacetylene. Phys. Rev. B: Condens. Matter 1980, 22, 2099.
110. Rice, M. J.; Phillpot, S. R.; Bishop, A. R.; Campbell, D. K. Solitons, Polarons and Phonons in the Infinite Polyyne Chain. Phys. Rev. B: Condens. Matter 1986, 34, 4139.
111. Yukihiro, S.; Shuji, A. Competition Between Polarons and Bipolarons in Nondegenerate Conjugated Polymers. Phys. Rev. B: Condens. Matter 1994, 50, 14781.
112. Furukawa, Y. Electronic Absorption and Vibrational Spectrocopies of Conjugated Conducting Polymers. J. Phys. Chem. 1996, 100, 15644.
113. Burrows, H. D.; Miguel, M. d. G.; Monkman, A. P.; Horsburgh, L. E.; Hamblett, I.; Navaratnam, S. Pulse Radiolysis Studies on Charge Carriers in Conjugated Polymers. J. Chem. Phys. 2000, 112, 3082.

181
114. Winokur, M. J.; Chunwachirasiri, W. Nanoscale Structure-Property Relationships in Conjugated Polymers: Implications for Present and Future Device Applications. J. Polym. Sci., Part B: Polym. Phys. 2003, 41, 2630.
115. Nguyen, T.-Q.; Kwong, R. C.; Thompson, M. E.; Schwartz, B. J. Improving the Performance of Conjugated Polymer-Based Devices by Control of Interchain Interactions and Polymer Film Morphology. Appl. Phys. Lett. 2000, 76, 2454.
116. Ho, P. K. H.; Kim, J.-S.; Burroughes, J. H.; Becker, H.; Li, S. F. Y.; Brown, T. M.; Cacialli, F.; Friend, R. H. Molecular-Scale Interface Engineering for Polymer Light-Emitting Diodes. Nature 2000, 404.
117. Cao, Y.; Parker, I. D.; Yu, G.; Zhang, C.; Heeger, A. J. Improved Quantum Efficiency for Electroluminescence in Semiconducting Polymers. Nature 1999, 397, 414.
118. Wohlgenannt, M.; Tandon, K.; Mazumdar, S.; Ramasesha, S.; Vardeny, Z. V. Formation Cross-Sections of Singlet and Triplet Excitons in π-Conjugated Polymers. Nature 2001, 409, 494.
119. Wilson, J. S.; Dhoot, A. S.; Seeley, A. J. A. B.; Khan, M. S.; Köhler, A.; Friend, R. H. Spin-Dependent Exciton Formation in π-Conjugated Compounds. Nature 2001, 413, 828.
120. Wohlgenannt, M.; Vardeny, Z. V. Spin-Dependent Exciton Formation Rates in π-Conjugated Materials. J. Phys.: Condens. Matter 2003, 15, R83.
121. Adachi, C.; Baldo, M. A.; Thompson, M. E.; Forrest, S. R. Nearly 100% Internal Phosphorescence Efficiency in an Organic Light Emitting Device. J. Appl. Phys. 2001, 90, 5048.
122. Anthopoulos, T.; Frampton, M. J.; Namdas, E. B.; Burns, P. L.; Samuel, I. D. W. Solution-Processable Red Phosphorescent Dendrimers for Light-Emitting Device Applications. Adv. Mater. 2004, 16, 557.
123. Holder, E.; Langeveld, B. M. W.; Schubert, U. New Trends in the Use of Transition Metal-Ligand Complexes for Applications in Electroluminescent Devices. Adv. Mater. 2005, 17, 1109.
124. Baldo, M. A.; O'Brien, D. F.; You, Y.; Shoustikov, A.; Sibley, S.; Thompson, M. E.; Forrest, S. R. Highly Efficient Phosphorescent Emission from Organic Electroluminescent Devices. Nature 1998, 395, 151.
125. Jabbour, G.; Wang, J.-F.; Peyghambarian, N. High-Efficiency Organic Electrophosphorescent Devices Through Balance of Charge Injection. Appl. Phys. Lett. 2002, 80, 2026.

182
126. Cocchi, M.; Fattori, V.; Virgili, D.; Sabatini, C.; Di Marco, P.; Maestri, M.; Kalinowski, J. Highly Efficient Organic Electrophosphorescent Light-Emitting Diodes with a Reduced Quantum Efficiency Roll Off at Large Current Densities. Appl. Phys. Lett. 2004, 84, 1052.
127. Grozema, F. C.; Hoofman, R. J. O. M.; Candeias, L. P.; De Haas, M. P.; Warman, J. M.; Siebbeles, L. D. A. The Formation and Recombination Kinetics of Positively Charged Poly(phenylene vinylene) Chains in Pulse-Irradiated Dilute Solutions. J. Phys. Chem. A 2003, 107, 5976.
128. Emmi, S. S.; D'Angelantino, M.; Beggiato, G.; Poggi, G.; geri, A.; Pietropaolo, D.; Zotti, G. Generation and Spectral Characterization of Oligothiophenes Radical Cations. A Pulse Radiolysis Investigation. Radiat. Phys. Chem. 1999, 54, 263.
129. Hertel, D.; Scherf, U.; Baessler, H. Charge Carrier Mobility in a Ladder-Type Conjugated Polymer. Adv. Mater. 1998, 10, 1119.
130. Lee, S. H.; Yasuda, T.; Tsutsui, T. Charge Carrier Mobility in Blue-Green Emitting Fluorenyl-Substituted Poly(p-phenylene vinylene)s. J. Appl. Phys. 2004, 95, 3825.
131. Tseng, H.-E.; Jen, T.-H.; Peng, K.-Y.; Chen, S.-A. Measurements of Charge Mobility and Diffusion Coefficient of Conjugated Electroluminescent Polymers by Time-of-Flight Method. Appl. Phys. Lett. 2004, 84, 1456.
132. Barth, M.; Guillerez, S.; Bidan, G.; Bras, G.; Lapkowski, M. Electrochemical Investigation of Regioregular Alkyl Substituted Oligothiophenes. Electrochim. Acta 2000, 45, 4409.
133. Domagala, W.; Lapkowski, M.; Guillerez, S.; Bidan, G. Electrochemical Studies of Selected Regioregular Oligooctylthiophenes in Solution and in Thin Film Solid State. Electrochim. Acta 2003, 48, 2379.
134. Frère, P.; Raimundo, J.-M.; Blanchard, P.; Delaunay, J.; Richomme, P.; Sauvajol, J.-L.; Orduna, J.; Garin, J.; Roncali, J. Effect of Local Molecular Structure on the Chain-Length Dependence of the Electronic Properties of Thiophene-Based π-Conjugated Systems. J. Org. Chem. 2003, 68, 7254.
135. Ferraris, J. P.; Eissa, M. M.; Brotherston, I. D.; Loveday, D. C.; Moxey, A. A. Preparation and Electrochemical Evaluation of Poly(3-phenylthiophene) Derivatives: Potential Materials for Electrochemical Capacitors. J. Electronanal. Chem. 1998, 459, 57.
136. Pappenfus, T. M.; Mann, K. R. Synthesis, Spectroscopy, and Electrochemical Studies of Binuclear Tris-Bipyridine Ruthenium(II) Complexes with Oligothiophene Bridges. Inorg. Chem. 2001, 40, 6301.

183
137. Jones, N. D.; Wolf, M. O.; Giaquinta, D. M. Synthesis of a Ferrocenyl-Capped Ruthenium(II) Bis(Acetylide) Complex: A Model for Organometallic Molecular Wire. Organometallics 1997, 16, 1352.
138. Clot, O.; Akahori, Y.; Moorlag, C.; Leznoff, D. B.; Wolf, M. O.; Batchelor, R. J.; Patrick, B. O.; Ishii, M. Model Complexes for Metalated Polythiophenes: Gold(I) and Palladium(II) Complexes of Bis(diphenylphosphino)oligothiophenes. Inorg. Chem. 2003, 42, 2704.
139. Encinas, S.; Flamigni, L.; Barigelletti, F.; Constable, E. C.; Housecroft, C. E.; Schofield, E. R.; Figgemeier, E.; Fenske, D.; Neuburger, M.; Vos, J. G.; Zehnder, M. Electronic Energy Transfer and Collection in Luminescent Molecular Rods Containing Ruthenium(II) and Osmium(II) 2,2:6,2-Terpyridine Complexes Linked by Thiophene-2,5-diyl Spacers. Chem. Eur. J. 2002, 8, 137.
140. Meerholz, K.; Heinze, J. Electrochemical Solution and Solid-State Investigations on Conjugated Oligomers and Polymers of the α-Thiophene and p-Phenylene Series. Electrochim. Acta 1996, 41, 1839.
141. Garcia, P.; Pernaut, J. M.; Hapiot, P.; Wintgens, V.; Valat, P.; Garnier, F.; Delabouglise, D. Effect of End Substitution on Electrochemical and Optical Properties of Oligothiophenes. J. Phys. Chem. 1993, 97, 513.
142. Cheng, L.; Yang, J.; Yao, Y.; Price, D. W.; Dirk, S. M.; Tour, J. M. Comparative Study of Electrochemically Directed Assembly Versus Conventional Self-Assembly of Thioacetyl-Terminated Oligo(phenylene ethynylene)s on Gold and Platinum Surfaces. Langmuir 2004, 20, 1335.
143. Benito, J.; Berenguer, J. R.; Forniés, J.; Gil, B.; Gómez, J.; Lalinde, E. Synthesis, Characterization and Luminescence Properties of Homoleptic Platinum(II) Acetylide Complexes. J. Chem. Soc., Dalton Trans. 2003, 4331.
144. Yam, V. W.-W.; Tang, R. P.-L.; Wong, K. M.-C.; Cheung, K.-K. Synthesis, Luminescence, Electrochemistry, and Ion-Binding Studies of Platinum(II) Terpyridyl Acetylide Complexes. Organometallics 2001, 20, 4476.
145. Wohlgenannt, M.; Jiang, X. M.; Vardeny, Z. V. Confined and Delocalized Polarons in π-Conjugated Oligomers and Polymers: A Study of the Effective Conjugation Length. Phys. Rev. B: Condens. Matter 2004, 69, 241204.
146. Barlow, S.; O'Hare, D. Metal-Metal Interactions in Linked Metallocenes. Chem. Rev. 1997, 97, 637.
147. Bonvoisin, J.; Launay, J.-P.; Van der Auweraer, M.; De Schryver, F. C. Organic Mixed-Valence Systems.I. Intervalence Transition in Partly Oxidized Aromatic Polyamines. J. Phys. Chem. 1994, 98, 5052.

184
148. Bonvoisin, J.; Launay, J.-P.; Verbouwe, W.; Van der Auweraer, M.; De Schryver, F. C. Organic Mixed-Valence Systems. II. Two-Centers and Three-Centers Compounds with Meta Connections Around a Central Phenylene Ring. J. Phys. Chem. 1996, 100, 17079.
149. Lahlil, K.; Moradpour, A.; Bowlas, C.; Menou, F.; Cassoux, P.; Bonvoisin, J.; Launay, J.-P.; Dives, G.; Dehareng, D. Intervalence Transitions in Mixed Valence bis(Tetrathiafulvalene) Compounds. J. Am. Chem. Soc. 1995, 117, 9995.
150. Coropceanu, V.; Gruhn, N. E.; Barlow, S.; Lambert, C.; Durivage, J. C.; Bill, T. G.; Noell, G.; Marder, S. R.; Brédas, J.-L. Electronic Coupling in Organic Mixed-Valence Compounds: The Contribution of Photoelectron Spectroscopy. J. Am. Chem. Soc. 2004, 126, 2727.
151. Barlow, S.; Risko, C.; Coropceanu, V.; Tucker, N. M.; Jones, S. C.; Zerubba, L.; Khrustalev, V. N.; Antipin, M. Y.; Kinnibrugh, T. L.; Timofeeva, T.; Marder, S. R.; Brédas, J.-L. A Mixed-Valence bis(Diarylamino)stilbene: Crystal Structure and Comparison of Electronic Coupling with Biphenyl and Tolane Analogues. Chem. Comm. 2005, 764.
152. Robin, M. B.; Day, P. In Advances in Inorganic Chemistry and Radiochemistry; Emeléus, H. J., Sharpe, A. G., Eds.; Academic Press, 1967; Vol. 10, p 247.
153. Hill, M. G.; Penneau, J. F.; Zinger, B.; Mann, K. R.; Miller, L. L. Oligothiophene Cation Radicals. π-Dimers as Alternatives to Bipolarons in Oxidized Polythiophenes. Chem. Mater. 1992, 4, 1106.
154. Frankevich, E.; Ishii, H.; Hamanaka, Y.; Yokoyama, T.; Fuji, A.; Li, S.; Yoshino, K.; Nakamura, A.; Seki, K. Formation of Polaron Pairs and Time-Resolved Photogeneration of Free Charge Carriers in π-Conjugated Polymers. Phys. Rev. B: Condens. Matter 2000, 62, 2505.
155. Hertel, D.; Bässler, H.; Scherf, U.; Horhold, H. H. Charge Carrier Transport in Conjugated Polymers. J. Chem. Phys. 1999, 110, 9214.
156. Emmi, S. S.; D'Angelantonio, M.; Poggi, G.; Beggiato, G.; Camaioni, N.; Geri, A.; Martelli, A.; Pietropaolo, D.; Zotti, G. Spectral Characterization of Thiophene Radical Cation Generated by Pulse Radiolysis. Res. Chem. Intermed. 1998, 24, 1.
157. Deussen, M.; Bässler, H. Anion and Cation Absorption Spectra of Conjugated Oligomers and Polymers. Chem. Phys. 1992, 164, 247.
158. Grozema, F. C.; Candeias, L. P.; Swart, M.; van Duijnen, P. T.; Wildeman, J.; Hadziioanou, G.; Siebbeles, L. D. A.; Warman, J. M. Theoritical and Experimental Studies of the Optoelectronic Properties of Positively Charged Oligo(phenylene vinylene)s: Effects of Chain Length and Alkoxy Substitution. J. Chem. Phys. 2002, 117, 11366.

185
159. Yu, Y.; Gunic, E.; Zinger, B.; Miller, L. L. Spectra and Reactivity of Methoxyoligothiophene Cation Radicals. J. Am. Chem. Soc. 1996, 118, 1013.
160. Bäuerle, P.; Segelbacher, U.; Maier, A.; Mehring, M. Electronic Structure of Mono- and Dimeric Cation Radicals in End-Capped Oligothiophenes. J. Am. Chem. Soc. 1993, 115, 10217.
161. Guay, J.; Diaz, A.; Wu, R.; Tour, J. M.; Dao, L. H. Electrooxidation of Soluble α,α'-Coupled Thiophene Oligomers. Chem. Mater. 1992, 4, 254.
162. Guay, J.; Kasai, P.; Diaz, A.; Wu, R.; Tour, J. M.; Dao, L. H. Chain-Length Dependence of Electrochemical and Electronic Properties of Neutral and Oxidized Soluble α,α'-Coupled Thiophene Oligomers. Chem. Mater. 1992, 4, 1097.
163. Jones, S. C.; Coropceanu, V.; Barlow, S.; Kinnibrugh, T.; Timofeeva, T.; Brédas, J.-L.; Marder, S. R. Delocalization in Platinum-Alkynyl Systems: A Metal-Bridged Organic Mixed-Valence Compound. J. Am. Chem. Soc. 2004, 126, 11782.
164. Hush, N. S. In Progress in Inorganic Chemistry; Cotton, F. A., Ed.; Interscience Publishers: New York, 1967; Vol. 8, p 391.
165. Lambert, C.; Nöll, G. Intervalence Charge-Transfer Bands in Triphenylamine-Based Polymers. Synth. Met. 2003, 139, 57.
166. Wishart, J. F. In In Radiation Chemistry: Present Status and Future Trends; Jonah, C. D., Rao, B. S. M., Ed.; Elsevier Science: Amsterdam, 2001; Vol. 87, pp 21.
167. Wishart, J. F.; Cook, A. R.; Miller, J. R. LEAF Picosecond Pulse Radiolysis Facility at Brookhaven National Laboratory. Rev. Sci. Inst. 2004, 75, 4359.
168. Ding, L.; Lu, Z.; Egbe, D. A. M.; Karasz, F. E. Structure-Morphology-Electroluminescence Relationship for Hybrid Conjugated Polymers. Macromolecules 2004, 37, 10031.
169. Kulkarni, A. P.; Jenekhe, S. A. Blue Light-Emitting Diodes with Good Spectral Stability Based in Blends of Poly(9,9-dioctylfluorene): Interplay between Morphology, Photophysics, and Device Performance. Macromolecules 2003, 36, 5285.
170. Corcoran, N.; Arias, A. C.; Kim, J. S.; MacKenzie, J. D.; Friend, R. H. Increased Efficiency in Vertically Segregated Thin-Film Conjugated Blends for Light-Emitting Diodes. Appl. Phys. Lett. 2003, 82, 299.
171. Müllen, K.; Wegner, G. Electronic Materials: The Oligomer Approach; Wiley-VCH: Weinheim, 1998.
186
172. Lehn, J.-M. Toward Self-Organization and Complex Matter. Science 2002, 295, 2400.
173. Ajayaghosh, A.; George, S. J. First Phenylenevinylene Based Organogels: Self-Assembled Nanostructures via Cooperative Hydrogen Bonding and π-Stacking. J. Am. Chem. Soc. 2001, 123, 5148.
174. Prince, R. B.; Moore, J. S.; Brunsveld, L.; Meijer, E. W. Cooperativity in the Folding of Helical m-Phenylene Ethynylene Oligomers Based Upon the "Sergeants-and-Soldiers" Principle. Chem. Eur. J. 2001, 7, 4150.
175. Goto, H.; Heemstra, J. M.; Hill, D. J.; Moore, J. S. Single-Site Modifications and Their Effect on the Folding Stability of m-Phenylene Ethynylene Oligomers. Org. Lett. 2004, 6, 889.
176. Cary, J. M.; Moore, J. S. Hydrogen Bond-Stabilized Helix Formation of a m-Phenylene Ethynylene Oligomer. Org. Lett. 2002, 4, 4663.
177. Schenning, A. P. H. J.; Jonkheijm, P.; Peeters, E.; Meijer, E. W. Hierarchical Order in Supramolecular Assemblies of Hydrogen-Bonded Oligo(p-phenylene vinylene)s. J. Am. Chem. Soc. 2001, 123, 409.
178. Würthner, F.; Chen, Z.; Hoeben, F. J. M.; Osswald, P.; You, C.-C.; Jonkheijm, P.; Herrikhuyzen, J. v.; Schenning, A. P. H. J.; van der Schoot, P. P. A. M.; Meijer, E. W.; Beckers, E. H. A.; Meskers, S. C. J.; Janssen, R. A. J. Supramolecular p_n-Heterojunctions by Co-Self-Organization of Oligo(p-phenylene vinylene) and Perylene Bisimide Dyes. J. Am. Chem. Soc. 2004, 126, 10611.
179. Hulvat, J. F.; Sofos, M.; Tajima, K.; Stupp, S. I. Self-Assembly and Luminescence of Oligo(p-phenylene vinylene) Amphiphiles. J. Am. Chem. Soc. 2005, 127, 366.
180. Hoeben, F. J. M.; Herz, L. M.; Daniel, C.; Jonkheijm, P.; Schenning, A. P. H. J.; Silva, C.; Meskers, S. C. J.; Beljonne, D.; Phillips, R. T.; Friend, R. H.; Meijer, E. W. Efficient Energy Transfer in Mixed Columnar Stacks of Hydrogen-Bonded Oligo(p-phenylenevinylene)s in Solution. Angew. Chem., Int. Ed. 2004, 43, 1976.
181. Daniel, C.; Herz, L. M.; Beljonne, D.; Hoeben, F. J. M.; Jonkheijm, P.; Schenning, A. P. H. J.; Meijer, E. W.; Phillips, R. T.; Silva, C. Resonance Energy Transfer Dynamics in Hydrogen-Bonded Oligo-p-Phenylenevinylene Nanostructures. Synth. Met. 2004, 147, 29.
182. Herz, L. M.; Daniel, C.; Silva, C.; Hoeben, F. J. M.; Schenning, A. P. H. J.; Meijer, E. W.; Friend, R. H.; Phillips, R. T. Fast Exciton Diffusion in Chiral Stacks of Conjugated p-Phenylene Vinylene Oligomers. Phys. Rev. B: Condens. Matter 2003, 68, 045203.

187
183. Beljonne, D.; Hennebicq, E.; Daniel, C.; Herz, L. M.; Silva, C.; Scholes, G. D.; Hoeben, F. J. M.; Jonkheijm, P.; Schenning, A. P. H. J.; Meskers, S. C. J.; Philips, R. T.; Friend, R. H.; Meijer, E. W. Excitation Migration Along Oligophenylenevinylene-Based Stacks: Delocalization Effects on Transport Dynamics. J. Phys. Chem. B 2005, 109, 10594.
184. Daniel, C.; Herz, L. M.; Silva, C. Exciton Bimolecular Annihilation Dynamics in Supramolecular Nanostructures of Conjugated Oligomers. Phys. Rev. B: Condens. Matter 2003, 68, 235212.
185. Yan, M.; Rothberg, L. J.; Kwock, E. W.; Miller, T. M. Interchain Excitation in Conjugated Polymers. Phys. Rev. Lett. 1995, 75, 1992.
186. Huang, W. Y.; Matsuoka, S.; Kwei, T. K.; Okamoto, Y. Aggregation and Gelation of Fully Conjugated Rigid-Rod Polymers. Poly(2,5-dialkyl-1,4-phenyleneethynylene)s. Macromolecules 2001, 34, 7166.
187. Wang, P.; Collison, C. J.; Rothberg, L. J. Origins of Aggregation Quenching in Luminescent Phenylenevinylene Polymers. J. Photochem. Photobiol., A 2001, 144, 63.
188. Wu, J.; Watson, M. D.; Zhang, L.; Wang, Z.; Müllen, K. Hexakis(4-iodophenyl)-peri-hexabenzocoronene - A Versatile Building Block for Highly Ordered Discotic Liquid Crystalline Materials. J. Am. Chem. Soc. 2004, 126, 177.
189. Hofmeier, H.; El-Ghayoury, A.; Schenning, A. P. H. J.; Schubert, U. S. Synthesis and Optical Properties of (A)chiral Terpyridine-Ruthenium Complexes. Tetrahedron 2004, 60, 6121.
190. Pieterse, K.; Lauritsen, A.; Schenning, A. P. H. J.; Vekemans, J. A. J. M.; Meijer, E. W. Symmetrical Electron-Deficient Materials Incorporating Azaheterocycles. Chem. Eur. J. 2003, 9, 5597.
191. Punna, S.; Meunier, S.; Finn, M. G. A Hierarchy of Aryloxide Deprotection by Boron Tribromide. Org. Lett. 2004, 6, 2777.
192. Terech, P.; Weiss, R. G. Low Molecular Mass Gelators of Organic Liquids and the Properties of Their Gels. Chem. Rev. 1997, 97, 3133.
193. Kishimura, A.; Yamashita, T.; Aida, T. Phosphorescent Organogels via "Metallophilic" Interactions for Reversible RGB-Color Switching. J. Am. Chem. Soc. 2005, 127, 179.
194. An, B.-K.; Lee, D.-S.; Lee, J.-S.; Park, Y.-S.; Song, H.-S.; Park, S. Y. Strongly Fluorescent Organogel System Comprising Fibrillar Self-Assembly of a Trifluoromethyl-Based Cyanostilbene Derivative. J. Am. Chem. Soc. 2004, 126, 10232.

188
195. Geiger, C.; Stanescu, M.; Chen, L.; Whitten, D. G. Organogels Resulting from Competing Self-Assembly Units in the Gelator: Structure, Dynamics, and Photophysical Behavior of Gels Formed from Cholesterol-Stilbene and Cholesterol-Squaraine Gelators. Langmuir 1999, 15, 2241.
196. Walters, K. A.; Ley, K. D.; Schanze, K. S. Photophysical Consequences of Conformation and Aggregation in Dilute Solutions of π-Conjugated Oligomers. Langmuir 1999, 15, 5676.
197. Chen, H.; Law, K.-Y.; Perlstein, J.; Whitten, D. G. Amphiphilic Squaraine Dye Aggregate: Evidence for a Cyclic Chiral Structure as a General Supramolecular Structure for Aggregates of Dyes and Aromatic Molecules. J. Am. Chem. Soc. 1995, 117, 7257.
198. Neuteboom, E. E.; Meskers, S. C. J.; Meijer, E. W.; Janssen, R. A. J. Photoluminescence of Self-Organized Perylene Bisimide Polymers. Macromol. Chem. Phys. 2004, 205, 217.
199. DiCésare, N.; Belletête, M.; Marrano, C.; Leclerc, M.; Durocher, G. Intermolecular Interactions in Conjugated Oligothiophenes. 1. Optical Spectra of Terthiophene and Substituted Terthiophenes Recorded in Various Environments. J. Phys. Chem. A 1999, 103, 795.
200. Billsten, H. H.; Sundström, V.; Polívka, T. Self-Assembled Aggregates of the Carotenoid Zeaxanthin: Time-Resolved Study of the Excited States. J. Phys. Chem. A 2005, 109, 1521.
201. Barazzouk, S.; Lee, H.; Hotchandani, S.; Kamat, P. V. Photosensitization Aspects of Pinacyanol H-Aggregates. Charge Injection from Singlet and Triplet Excited States into SnO2 Nanocrystallites. J. Phys. Chem. B 2000, 104, 3616.
202. Davis, R.; Rath, N. P.; Das, S. Thermally Reversible Fluorescent Polymorphs of Alkoxy-cyano-substituted Diphenylbutadiene: Role of Crystal Packing in Solid State Fluorescence. Chem. Comm. 2004, 74.
203. Xiang, J.; Yang, X.; Chen, C.; Tang, Y.; Yan, W.; Xu, G. Effects of NaCl on the J-Aggregation of Two Thiacarbocyanine Dyes in Aqueous Solutions. J. Colloid Interface Sci. 2003, 258, 198.
204. Miteva, T.; Palmer, L.; Kloppenburg, L.; Neher, D.; Bunz, U. H. F. Interplay of Thermochromocity and Liquid-Crystalline Behavior in Poly(p-phenyleneethynylene)s: π-π Interactions or Planarization of the Conjugated Backbone? Macromolecules 2000, 33, 652.
205. Li, K.; Wang, Q. Synthesis and Solution Aggregation of Polystyrene-Oligo(p-phenyleneethynylene)-Polystyrene Triblock Copolymer. Macromolecules 2004, 37, 1172.

189
206. Bunz, U. H. F. Poly(p-phenyleneethynylene)s by Alkyne Metathesis. Acc. Chem. Res. 2001, 34, 998.
207. Oelkrug, D.; Tomper, A.; Gierschner, J.; Egelhaaf, H.-J.; Hanack, M.; Hohloch, M.; Steinhuber, E. Tuning of Fluorescence in Films and Nanoparticles of Oligophenylenevinylenes. J. Phys. Chem. B 1998, 102, 1902.
208. Whitten, D. G.; Chen, L.; Geiger, H. C.; Perlstein, J.; Song, X. Self-Assembly of Aromatic-Functionalized Amphiphiles: The Role and Consequences of Aromatic-Aromatic Noncovalent Interactions in Building Supramolecular Aggregates and Novel Assemblies. J. Phys. Chem. B 1998, 102, 10098.
209. Song, X.; Geiger, C.; Leinhos, U.; Perlstein, J.; Whitten, D. G. trans-Stilbene Aggregates in Microheterogeneous Media: Evidence for a Chiral Cyclic Supramolecular Unit. J. Am. Chem. Soc. 1994, 116, 10340.
210. Deans, R.; Kim, J. S.; Machacek, M. R.; Swager, T. M. A Poly(p-phenyleneethynylene) with a Highly Emissive Aggregated Phase. J. Am. Chem. Soc. 2000, 122, 8565.
211. Luo, J.; Xie, Z.; Lam, J. W. Y.; Cheng, L.; Chen, H.; Qiu, C.; Kwok, H. S.; Zhan, X.; Liu, Y.; Zhu, D.; Tang, B. Z. Aggregation-Induced Emission of 1-Methyl-1,2,3,4,5-pentaphenylsilole. Chem. Comm. 2001, 1740.
212. Belton, C.; O'Brien, D. F.; Blau, W. J.; Cadby, A. J.; Lane, P. A.; Bradley, D. D. C.; Byrne, H. J.; Stockmann, R.; Hörhold, H.-H. Excited-State Quenching of a Highly Luminescent Conjugated Polymer. Appl. Phys. Lett. 2001, 78, 1059.
213. Komatsu, T.; Moritake, M.; Nakagawa, A.; Tsuchida, E. Self-Organized Lipid-Porphyrin Bilayer Membranes in Vesicular Form: Nanostructures, Photophysical Properties, and Dioxygen Coordination. Chem. Eur. J. 2002, 8, 5469.
214. Kubát, P.; Lang, K.; Zelinger, Z.; Král, V. Aggregation and Photophysical Properties of Water-Soluble Sapphyrins. Chem. Phys. Lett. 2004, 395, 82.
215. Zhao, X.; Cardolaccia, T.; Farley, R.; Abboud, K. A.; Schanze, K. S. A Platinum Acetylide Polymer with Sterically Demanding Substituents: Effect of Aggregation on the Triplet Excited State. Inorg. Chem. 2005, 44, 2619.
216. Haskins-Glusac, K.; Ghiviriga, I.; Abboud, K. A.; Schanze, K. S. Photophysics and Photochemistry of Stilbene-Containing Platinum Acetylides. J. Phys. Chem. B 2004, 108, 4969.
217. Bruce, M. I.; Davy, J. R.; Hall, B. C.; Van Galen, Y. J.; Skelton, B. W.; White, A. H. Some Platinum(II) Complexes Derived from Aromatic Alkynes. Appl. Organometal. Chem. 2002, 16, 559.
190
218. van Asselt, R.; Rijnberg, E.; Elsevier, C. J. Stabilization of High Oxidation States by Rigid Bidentate Nitrogen Ligands: Synthesis and Characterization of Diorgano-and Triorganopalladium(IV) and Cationic Triorganoplatinum(IV) Complexes. Organometallics 1994, 13, 706.
219. Packett, D. L.; Jensen, C. M.; Cowan, R. L.; Strouse, C. E.; Trogler, W. C. Syntheses, Structures, and Mechanism of Formation of trans-Chlorohydrobis(trimethylphosphine)platinum(II) and trans-dihydrobis(trimethylphosphine)platinum(II). Energetics of Cis-Trans Isomerization. Inorg. Chem. 1985, 24, 3578.

BIOGRAPHICAL SKETCH
Thomas Cardolaccia was born on February 10th, 1976, in Clamart, France, in the
south suburbs of Paris. He enjoyed a lively childhood living near Marseille and then in
Bordeaux where his parents moved when he was nine years old. During high school, he
liked biology but during his last year in high school realized that chemistry was far more
fascinating. He graduated from Lycée Camille-Julian with “Mention Assez Bien” in
1994. He obtained his “Maîtrise de Chimie” from Université Bordeaux I in June 2000.
During his time as an undergraduate, he spent one year at the University of Reading,
England, as an ERASMUS student. During the summer of 1999, he also took part in the
France-United States REU exchange program and worked for three months in Dr.
Schanze’s group at the University of Florida where he was first exposed to the field of
conjugated polymers. After returning to France to finish his degree, Thomas came back
to the University of Florida and joined Dr. Schanze’s group as a graduate student to work
toward his PhD. While there, he met his wife Joanne, who was teaching French in a high
school in Gainesville and they got married in October 2003. After his PhD, Thomas will
continue his education as a postdoctoral associate with Dr. Thomas J. Meyer at the
University of North Carolina at Chapel Hill.
191