From Maritime Asia to Continental Asia: China's Responses to the
22
1 The Impact of MAC Buffer Size on the Throughput Performance of IEEE 802.11 Kamil H. Suleiman, Tara Javidi, Mingyan Liu, and Somsak Kittipiyakul Abstract The medium access control protocol of IEEE 802.11 networks has been extensively studied to explore its throughput performance. A popular regime of study is the saturation regime where users are assumed to be saturated with information bits. The throughput achieved in this regime, called the saturation throughput, is commonly interpreted as the maximum achievable throughput for any given system. In this paper, we formalize the conditions under which saturation throughput is indeed the maximum achievable throughput. We provide specific settings which may increase the maximum aggregate throughput of the system beyond the saturation throughput. Furthermore, we observe and prove that reducing the MAC buffer size significantly increases the maximum aggregate throughput, beyond the saturation throughput, a fact that seems counter-intuitive. We formally establish that under small buffer conditions and under UDP-type traffic, a reduction in effective collisions due to the buffer size choice has a positive effect on the throughput performance. This is despite the fact that some packets are dropped because of likely buffer overflow events. In other words, by identifying the notion of saturation throughput as an inherently pessimistic notion, this paper brings to the attention the significant impact of an optimized choice of MAC buffer size on the performance of 802.11 networks. Index Terms IEEE 802.11, medium access control, statistical multiplexing, saturation throughput. I. I NTRODUCTION With the wide deployment of wireless LAN, its core enabling technology, the IEEE 802.11 medium access control (MAC) protocol, has been extensively studied in recent years. These stud- Parts of the results were presented at the 2005 Allerton Conference K. Suleiman is with the University of Cape Town; T. Javidi and S. Kittipiyakul are with the University of California, San Diego; M. Liu is with the University of Michigan, Ann Arbor. January 14, 2008 DRAFT
Transcript of From Maritime Asia to Continental Asia: China's Responses to the

1
The Impact of MAC Buffer Size on the
Throughput Performance of IEEE 802.11
Kamil H. Suleiman, Tara Javidi, Mingyan Liu, and Somsak Kittipiyakul
Abstract
The medium access control protocol of IEEE 802.11 networks has been extensively studied to
explore its throughput performance. A popular regime of study is thesaturation regimewhere users
are assumed to be saturated with information bits. The throughput achieved in this regime, called
the saturation throughput, is commonly interpreted as the maximum achievable throughput for any
given system. In this paper, we formalize the conditions under which saturation throughput is indeed
the maximum achievable throughput. We provide specific settings which may increase the maximum
aggregate throughput of the system beyond the saturation throughput. Furthermore, we observe and prove
that reducing the MAC buffer size significantly increases the maximum aggregate throughput, beyond
the saturation throughput, a fact that seems counter-intuitive. We formally establish that under small
buffer conditions and under UDP-type traffic, a reduction ineffective collisions due to the buffer size
choice has a positive effect on the throughput performance.This is despite the fact that some packets are
dropped because of likely buffer overflow events. In other words, by identifying the notion of saturation
throughput as an inherently pessimistic notion, this paperbrings to the attention the significant impact
of an optimized choice of MAC buffer size on the performance of 802.11 networks.
Index Terms
IEEE 802.11, medium access control, statistical multiplexing, saturation throughput.
I. INTRODUCTION
With the wide deployment of wireless LAN, its core enabling technology, the IEEE 802.11
medium access control (MAC) protocol, has been extensivelystudied in recent years. These stud-
Parts of the results were presented at the 2005 Allerton Conference
K. Suleiman is with the University of Cape Town; T. Javidi andS. Kittipiyakul are with the University of California, San
Diego; M. Liu is with the University of Michigan, Ann Arbor.
January 14, 2008 DRAFT

2
ies include the performance as well as fairness properties of 802.11 basic and DCF (distributed
coordination functions) options. Many of these studies examine the behavior of a fixed number
of 802.11 users (or stations/clients) under a special operating regime known as thesaturation
regime; notable examples include [1]. This is a scenario where all users in the system areinfinite
sources, i.e., they always have packets to send or equivalently, they have infinitely many packets
waiting in the queues, thus the term saturation. Saturationstudies typically characterize the
saturation throughputof a system, which is the throughput that each queue or the system as a
whole can achieve under the saturation scenario. Saturation throughput is shown to vary with
the number of users in the system [1]; they reflect in a sense the capacity of the system and
provide significant insights in understanding the limitingbehavior of 802.11. Bianchi in [1] first
proposed a Markov chain based modeling scheme to estimate the saturation throughput (these
quantities were then used to optimize the backoff window size). Similar models and extensions
have since been used for a variety of purposes. Examples include to tune the protocol [2], to
study the retry limit [3], or to study different aspects of the saturation throughput, e.g., in the
presence of transmission error [11]. The notion of saturation throughput was also studied in [4]
as a fixed point problem where its existence and uniqueness were examined.
More recently, several studies have considered a differentsystem operating regime, where user
queues are fed with finite arrival rates. This means that any given user might not always have
a packet to send. We refer to this type of queues asfinite sourcesto distinguish them from the
infinite sources/queues used in the saturation studies. These include studies that propose similar
Markov chain based models as originally proposed in [1] while taking into account the fact that
the sources may be finite; examples include [5], [6], [12]–[19]. In particular, in our previous
work [5], [7], we investigated how the system behaves when these finite arrival rates approach
the saturation rate (throughput)from below, and made the following interesting observation: The
queues have very good delay performance even when all queueshave arrival rates approaching
the saturation throughput1.
Building on the above observation, the present paper is an attempt to achieve higher than
saturation throughput. This idea builds on our prior work in[5] where we first proposed practical
settings to achieve the saturation throughput. Specifically, in the first part of the paper, we answer
1This is consistent with other non-saturation studies in literature [6].
January 14, 2008 DRAFT

3
the following question first posed in [5]: Under the more realistic operation scenario of non-
saturation, is it possible for every user to achieve a throughput higher than that of saturation?
Unfortunately, the answer to this question is negative. We show that, in fact, the low delay
behavior is due to an extremely long, transient phase in a typical simulation study and is due to
the existence of a broken ergodicity phenomenon. Instead oflimiting the above observation to
a practical lesson on how to set up simulations correctly, wetake a further step. The mentioned
broken ergodicity phenomenon motivates the main contribution of the second part of the paper:
We show that, in the case of realistic traffic (both TCP and UDPsources), reducing buffer
sizes of each user significantly increases the throughput ofthe system! This increase in overall
throughput with the reduction of buffer size might seem counter intuitive at the first glance, but
is explained as follows: The limitation on the buffer space for each user imposes a regular visit to
the all-empty queue state and, consequently, to the desirable transient phase with desirable delay
behavior. In fact, through a simple Markov chain model, we prove that, even for a buffer size
of 1, the total throughput higher than the saturation throughput can be guaranteed for Poisson
(UDP-type) source, despite an increase in packet drop probability.
One might wonder how the above result depends on the reactivebehavior of the arrival stream,
the size of the MAC buffer, or the bursty nature of the traffic.The contribution of the present paper
is to provide answers to these questions. In the case of TCP traffic, we present some simulation
results quantifying the impact of small buffer on the performance of multiple concurrent TCP
flows. We will see that even though the packet drops due to MAC buffer limitations result in
smaller congestion windows for TCP flows, the consequent lower level of contention achieved
by limiting the MAC buffer results in significantly smaller RTT values, which keep the TCP
throughput at roughly similar levels, across various choices of MAC buffer size. This highlights
an improved cross-layer interaction via TCP’s adaptive mechanism.
The rest of the paper is organized as follows. In Section II, we describe our network model and
motivate our study using experimental results. Specifically, we consider the behavior of a system
with symmetric users as the input traffic rate approaches thesaturation throughput from below.
We shall see that the system has very good delay performance.This prompts the question of
whether the notion of saturation throughput is too pessimistic and whether higher than saturation
throughput might be obtainable. We attempt to address this question in Section III, and show
that for an infinite-buffer scenario the answer is negative.We then present a detailed explanation
January 14, 2008 DRAFT

4
ClientNode 1
ClientNode 2
802.11AccessPoint
ClientNode N
ClientNode 3
DestinationNode
802.11 Network
Wire
Fig. 1. Network model.
of the good-delay-performance-paradox, and motivate the idea of reducing the MAC buffer size.
Then, in Section IV, we theoretically show, using a simple Markov model, how the reduction
in the MAC buffer size leads to significant improvement in throughput (higher than saturation
throughput). The same is examined using numerical simulation in Section V for both UDP and
TCP traffic sources. We conclude the paper in Section VI.
Before we close this section, we would like to acknowledge many important works in redesign-
ing the 802.11 MAC mechanism in general, such as [20], and more specifically in improving
its throughput performance, e.g., by using rate adaptation[10], by reducing the amount of time
spent in backoff [9], and so on. Some of these schemes requiremodification to the current
standard. By contrast the solution presented in our paper does not require any changes, and can
be used in conjunction with other solutions. The clean slateredesign of decentralized MAC layer
mechanisms with improved performance remains an interesting area of future work.
II. NETWORK MODEL
In this paper, we consider the network scenario illustratedin Figure 1. It consists of a fixed
number ofN wireless nodes that serve as traffic sources, a single accesspoint (base station),
and a destination node connected to the base station througha wire (for simplicity). We assume
that users have symmetric channels (with negligible error in transmission) and a finite buffer
size, ranging from2 to 10, 000 packets.
January 14, 2008 DRAFT

5
TABLE I
IEEE 802.11 PARAMETERS
slot time 20 µs
SIFS 10 µs
DIFS 50 µs
CWmin 31
CWmax 1023
retry limit 7
physical layer data rate 11Mbps
A. Simulation Setup
The network simulator (ns2) release 2.28 is used for all the simulation presented here. In a
single simulation, the client nodes send theirs packets to the access point, using IEEE 802.11
MAC scheme. Each client node sends packets with an average rate of λ. The burst of data
packets from each node is generated according to the traffic model under study and the size of
each packet is fixed at 1024 bytes. The aggregate throughput of the wireless LAN was measured
by counting all the data bits that arrive at the wired node (orequivalently the base station). In
the simulation, RTS/CTS is disabled. This means that the basic distributed coordination function
or DCF of 802.11 is used. In all of the scenarios, the buffer size at the base station node was
fixed at 109 packets. In each simulation, all the client buffers were initialized to empty. The
relevant simulation parameters used are listed in Table I.
B. Saturation Throughput
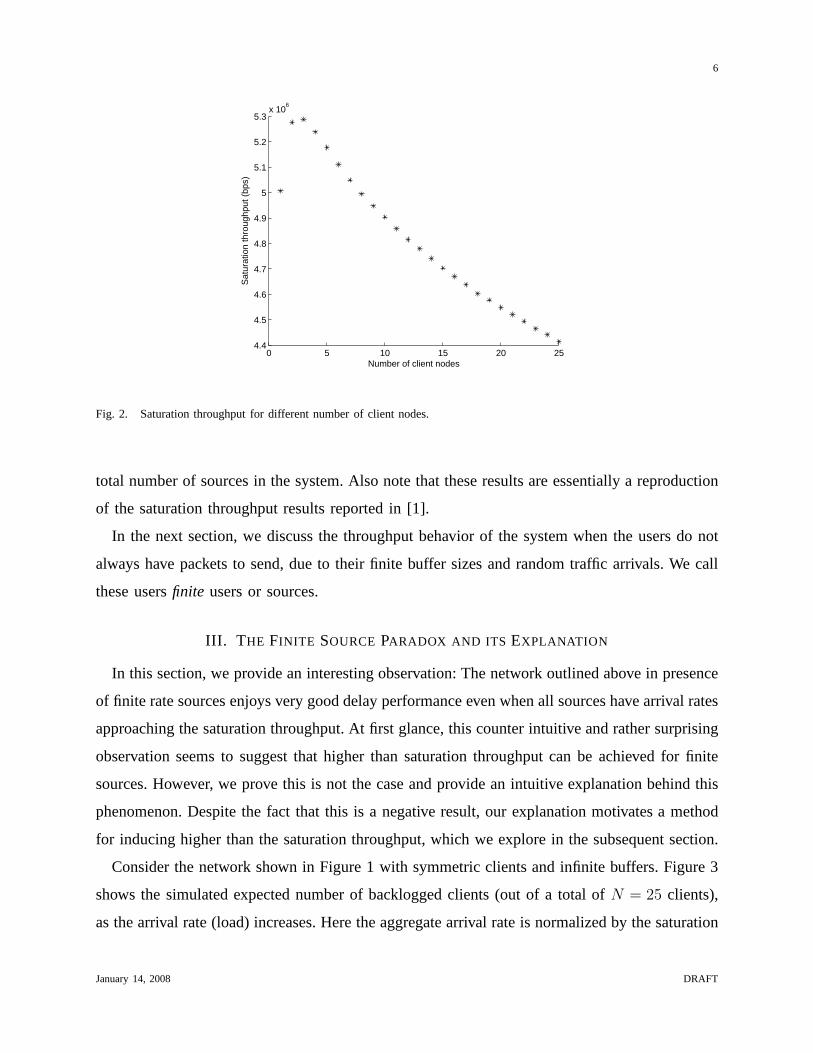
In Figure 2, we show the dependence of aggregate throughput on the number of client nodes for
a buffer size of 10,000 packets which is large enough to be consideredinfinity for our simulation
time and topology (the throughput data were collected untilall the buffers were nonempty or
saturated in our simulations). Thesaturation throughputor saturation rateis defined as the
instantaneous throughput of the overall system when all users at all times have infinite number
of packets to send. For instance, we note that the saturationthroughput forN = 25 client nodes
is approximately 4.41 Mbps. Note that, as shown in Figure 2, this quantity is a function of the
January 14, 2008 DRAFT
6
0 5 10 15 20 254.4
4.5
4.6
4.7
4.8
4.9
5
5.1
5.2
5.3x 10
6
Number of client nodes
Sat
urat
ion
thro
ughp
ut (
bps)
Fig. 2. Saturation throughput for different number of client nodes.
total number of sources in the system. Also note that these results are essentially a reproduction
of the saturation throughput results reported in [1].
In the next section, we discuss the throughput behavior of the system when the users do not
always have packets to send, due to their finite buffer sizes and random traffic arrivals. We call
these usersfinite users or sources.
III. T HE FINITE SOURCE PARADOX AND ITS EXPLANATION
In this section, we provide an interesting observation: Thenetwork outlined above in presence
of finite rate sources enjoys very good delay performance even when all sources have arrival rates
approaching the saturation throughput. At first glance, this counter intuitive and rather surprising
observation seems to suggest that higher than saturation throughput can be achieved for finite
sources. However, we prove this is not the case and provide anintuitive explanation behind this
phenomenon. Despite the fact that this is a negative result,our explanation motivates a method
for inducing higher than the saturation throughput, which we explore in the subsequent section.
Consider the network shown in Figure 1 with symmetric clients and infinite buffers. Figure 3
shows the simulated expected number of backlogged clients (out of a total ofN = 25 clients),
as the arrival rate (load) increases. Here the aggregate arrival rate is normalized by the saturation
January 14, 2008 DRAFT

7
0 0.2 0.4 0.6 0.8 1 1.2 1.40
1
2
3
4
5
6
7
8
Aggregate Arrival Rate
Ave
rage
Num
ber
of B
ackl
ogge
d Q
ueue
s
Fig. 3. Expected number of clients backlogged (out of a totalof 25) versus arrival rate normalized to the saturation rate.
throughput of a system of 25 users (roughly 4.41 Mbps). All queues are initially empty and the
average number of backlogged queues is computed by collecting data over a simulation run time
of 60 minutes. What we see here is that the observed average number of of backlogged queues
is much lower than anticipated even when the arrival rate is at or slightly above the saturation
throughput. In other words, for a system ofN symmetric users, given an empty initial state,
even at the aggregate arrival rate ofNλ = µsat(N) + ǫ, for ǫ ≈ 0, we do not see, more than
eight backlogged queues (less than1/3 of all queues). Similar results were also reported in [6],
where the authors report a large gap between simulated and analytic calculations. This is a rather
surprising result in the context of queuing systems’ operation at heavy loading.
One might prematurely interpret Figure 3 to suggest that a throughput higher than saturation
is achievable, since the observed average delay is much lower than expected. This, however, is
not true. The following result shows that each finite user is limited to its share of saturation
throughput despite the above observed good delay behavior.
Proposition 1: For any Markovian arrival process, which is independent across queues, the
maximum achievable average throughput per user isµsat(N)/N .
Proof: Obviously, for∑N
i=1 λi ≤ µsat(N), we get∑N
i=1 µi ≤ µsat(N), whereµi is the
throughput of useri. This is because aggregate throughput can never be greater than aggregate
arrival rate. Therefore we only need to show that for∑N
i=1 λi > µsat(N), the maximum
January 14, 2008 DRAFT
8
achievable average throughput for each user isµsat(N)/N .
Consider anN-queue system whose states at timet are given by the queue backlog vector
q(t) = [q1(t), q2(t), · · · , qN(t)],
and the embedded Markov chain wheret takes integer values. Consider some timet where all
queues are backlogged, i.e.,mini qi(t) > 0, the instantaneous total service rate of the system is
given byµsat(N). Since∑N
i=1 λi > µsat(N), i.e., the total arrival rate exceeds the service rate,
at timet there is a strictly positive drift with respect to the state of the system. In other words,
there exist someδ > 0 andM > 0 such that for alli, we have
E{
|qi(t + 1) − qi(t)|∣
∣
∣min
iqi(t) > M
}
> δ . (1)
Define the stopping time
T = min {t : qi(t) ≥ M, ∀i} . (2)
From the irreducibility of Markov chain, we have
P (T < ∞) > 0. (3)
Combining (1)-(3), we conclude that this Markov chain consists of only transient states, i.e.
E(mini
qi(t)) = ∞ . (4)
This completes the proof.
The above result says that no collection of finite sources with symmetric traffic can attain
throughput higher than the saturation rate. However, our earlier simulation result suggests that the
source could sustain arrival rates higher than the saturation rate without significant queue buildup
for a while (rather long durations even). This presents an apparent contradiction. Understanding
this discrepancy turns out to be critical in designing mechanisms that allow us to obtain higher
throughput as we detail in the next section.
To understand the gap between the theoretical result and thesimulation observations in
Figure 3, consider again the state of the underlying Markov chain describing the queue state of
our N-user system, given by the queue backlogq ∈ ZN . Note that in such a network, as some
queues become empty, they stop competing for the channel, allowing other users to adaptively
choose smaller average back-off windows. This results in a strong negative drift on subspaces
January 14, 2008 DRAFT

9
of form S0 = {q : ∃i s.t. qi = 0}, whereqi is the backlog of queuei. When the total arrival
rate λ > µsat(N), this negative drift creates abroken ergodicityphenomenon: although the
system consists of all transient states, the time averages computed over a simulation run time
are significantly different from the ensemble averages. More precisely, there are effectively two
classes of states, those with negative drift,S− (S0 ⊂ S−), and those with positive one,S+.
If the arrival rate is greater thanµsat, all states are transient; however, when starting with all
queues empty (inS−), the time it takes to first hit a positive-drift state can be significantly
longer than the simulation time. Indeed, we have never observed such a transition in any of our
simulation, which typically runs on the order of hours in simulated time. In other words, for
realistic simulation times the ensemble average one wishesto obtain can be drastically different
from the computed time average that one ends up getting. To compute the ensemble average,
a randomization of initial queue state is required. However, from (4), it has been shown that
the mean queue length in each buffer is infinity. Another alternative to computing the ensemble
average is to allocate a large initial queue length.
One might argue that the above phenomenon and explanation are lessons in running credible
simulations and reading the results (after all, one needs tounderstand the underlying random
processes before replacing ensemble averages by time averages). But in addition, these results do
lead us to think differently about our system. One can essentially view the system as a globally
unstable one with a desirable (high throughput) operating point which is, given a particular set
of initial conditions, practically “robust” (i.e., it can stay around the high throughput region for
a long time). This “robustness” depends on the statistics ofthe stopping time associated with
the first transition fromS− to S+, which itself heavily depends on the statistics of the arrival
processes (beyond the average mean) as well as the transmission and back-off policies, and
finally, is determined by the maximum of packets each user holds.
This leads to the question of whether one might be able to introduce mechanisms that stabilize
the system around the “robust” equilibrium, while maintaining high throughput, by preventing
the system from transitioning toS+. An intuitive way to force the system to stay inS− is
simply to periodically (but not simultaneously) empty the queues. This would result in a time
share among desirable (higher throughput) operating points. In practice, such a behavior may be
induced by artificially reducing the buffer size at the MAC layer. In the next section, we will
first formalize this idea. In particular, we will use a primitive model for the MAC interaction and
January 14, 2008 DRAFT

10
queue build-ups to hypothesize about a mechanism that enables higher than saturation throughput.
In Section V, we will test our hypothesis via extensive simulation.
IV. THROUGHPUT IMPROVEMENT VIA REDUCED MAC BUFFER SIZE
In this section, we consider a symmetric network where each user has a perfect channel,
a finite arrival rateλ, and a finite buffer space. In particular, we will consider a special case
where each user’s buffer capacity is limited to one packet ata time, and show an increase in
the achievable throughput. This result suggests that even though we incur a loss when dropping
packets due to buffer overflow, we are able to compensate thisloss with an increase in the
departure rate2!
To facilitate the analysis, consider the following simplified model of the network shown in
Figure 4. This is a continuous-time extension of the models proposed in [4]: there areN identical
nodes with buffers of sizeB. Arrival rate to each node is Poisson with rateλ (if the buffer at a
node is full at the arrival time of a new packet, the packet is dropped). Furthermore, the arrivals
to nodes are assumed to be independent among nodes. Here we ignore the back-off times and
focus only on the times when successful attempts are made, i.e., we assume that when there are
k backlogged users a successful attempt leads to the channel being allocated to one of thek
contending nodes with equal probability. We also assume that the time between two successful
attempts, givenk contending nodes, is an exponential random variable with rate µsat(k). In this
paper, we assume thatµsat(·) is a strict monotonically decreasing function, i.e.,µsat(i) > µsat(j)
for any 1 ≤ i < j.
Let µ(λ) denote the average departure rate (average throughput). Note that from previous
sections we know that ifB = ∞, then the maximum achievable average throughput isµsat(N).
In what comes next, we calculateµ(λ) for the generalB ≥ 1 case. A straight-forward, albeit
computationally-intensive, approach is to use the the number of packets in each queue as the
state vector. This approach requires(B + 1)N states and is given as follows: we represent the
2Note that in practice this loss may not be real, in that packets are typically stored in buffers of higher layers, e.g., transport
layer TCP/UDP buffers, before they are moved to and acceptedby the MAC buffer. Therefore, a very small MAC buffer could
simply mean that packets may only be transferred into the MACbuffer in very small quantities at a time, e.g., resulting ina
small TCP window size as we shall see in the next section.
January 14, 2008 DRAFT

11
λ
λ
λ
λ
λ
Randomly select 1 out of nt backlogged queues at rate µsat(nt)
nt = number of backlogged queues at time t
Fig. 4. A simple queuing model to approximate 802.11 MAC. In this illustration,nt = 4.
system as a time-homogeneous continuous-time Markov chain[8] with state vectors
s = (s1, s2, . . . , sN) ∈ S := {0, 1, . . . , B}N .
Here sn is the number of packets in queuen ∈ {1, . . . , N}. The time-homogeneous transition
ratequv from stateu ∈ S to statev ∈ S is given as follows:
quv =
λ, if v = u + en for somen ∈ {1, . . . , N}
µsat(|u|)|u|
, if v = u − en for somen ∈ {1, . . . , N}
−∑
s∈S:s6=u
qus, if v = u
0, otherwise,
where we define|u| :=∑N
m=1 1{um 6=0}, indicator1A =
1, if A
0, if not A, anden denotes a vector
whoseN elements are all zero except one in thenth position. We let a matrixQ = [quv] to
denote the infinitesimal generator matrix.
Since the above continuous-time Markov chain is irreducible and has a finite number of states,
there exists a unique steady-state probability vectorπ̂ = [π̂s]s∈S such that
0 =∑
u∈S
π̂uquv, ∀v ∈ S,
or in vector-matrix form,
0 = π̂Q.
January 14, 2008 DRAFT

12
Therefore, the average throughput is given as
µ(λ) =∑
s∈S
µsat(|s|)π̂s =N∑
m=1
µsat(m)∑
s∈S:|s|=m
π̂s =N∑
m=1
µsat(m)πm(λ),
whereπm(λ) :=∑
s∈S:|s|=m
π̂s is the steady-state probability when there arem backlogged users
in the system.
Due to the large state space, the above calculations have a large computation complexity. On
the other hand, it is not difficult to calculate for the special case ofB = 1. WhenB = 1, the
number of backlogged users,m(t), also forms a continuous-time Markov chain. This allows a
closed form characterization ofµ(λ). The following theorem shows thatµ(λ) can be strictly
greater thanµsat(N) whenB = 1.
Theorem 1:AssumeB = 1. There exists a rate of arrival,λ∗ such that for allλ ≥ λ∗ the
achievable average throughputµ(λ) is strictly greater thanµsat(N).
Proof: The number of backlogged users in the system forms a birth-death continuous-time
Markov chain with statem ∈ {0, 1, . . . , N}. The state transition diagram for such a system is
shown in Figure 5.
Note that the total departure rate in this model is
µ(λ) =N∑
m=1
µsat(m)πm(λ), (5)
whereπm(λ) is the stationary distribution for statem, given the arrival rateλ.
On the other hand, from the balance equations, we obtain the following:
πm(λ) = πN(λ)
∏N
k=m+1 µsat(k)
(N − m)!λ(N−m), m = 0, 1, . . . , N − 1. (6)
This together with the fact that∑N
m=0 πm(λ) = 1 leads to the following expressions forπN
andπm, m = 0, . . . , N − 1:
πN(λ) =
(
1 +N−1∑
j=0
∏N
k=j+1 µsat(k)
(N − j)!λ(N−j)
)−1
=N !λN
N !λN +∑N−1
j=0 [N ]jλj∏N
k=j+1 µsat(k)(7)
πm(λ) =[N ]mλm
∏N
s=m+1 µsat(s)
N !λN +∑N−1
j=0 [N ]jλj∏N
k=j+1 µsat(k), (8)
January 14, 2008 DRAFT

13
0 1 m N
Nλ (N-1)λ
µsat(m)
λ
µsat(N)µsat(1)
(N-m)λ(N-m+1)λ
µsat(m+1)µsat(2)
Fig. 5. Continuous-time Markov chain describing the numberof backlogged users.
where[N ]m denotes N !(N−m)!
.
Inserting (7) and (8) into (5) gives the achievable average throughput:
µ(λ) =
∑N
m=1 µsat(m)[N ]mλm∏N
s=m+1 µsat(s)
N !λN +∑N−1
j=0 [N ]jλj∏N
k=j+1 µsat(k), (9)
where we use the convention that∏N
s=N+1 µsat(s) ≡ 1. Note that, by rearranging the terms, we
have
µ(λ) = µsat(N)N !λN +
∑N−1m=1[N ]mλmµsat(m)
∏N−1k=m+1 µsat(k)
N !λN +∏N
k=1 µsat(k) +∑N−1
m=1[N ]mλmµsat(N)∏N−1
k=m+1 µsat(k). (10)
It is easy to see thatµ(λ) → µsat(N) as λ → ∞. In addition, because of the monotonic
decreasing property ofµsat(·), we note that the numerator in (10) is greater than the denominator,
for sufficiently largeλ. That is, there existsλ∗ for which
µ(λ) > µsat(N),
for any λ > λ∗.
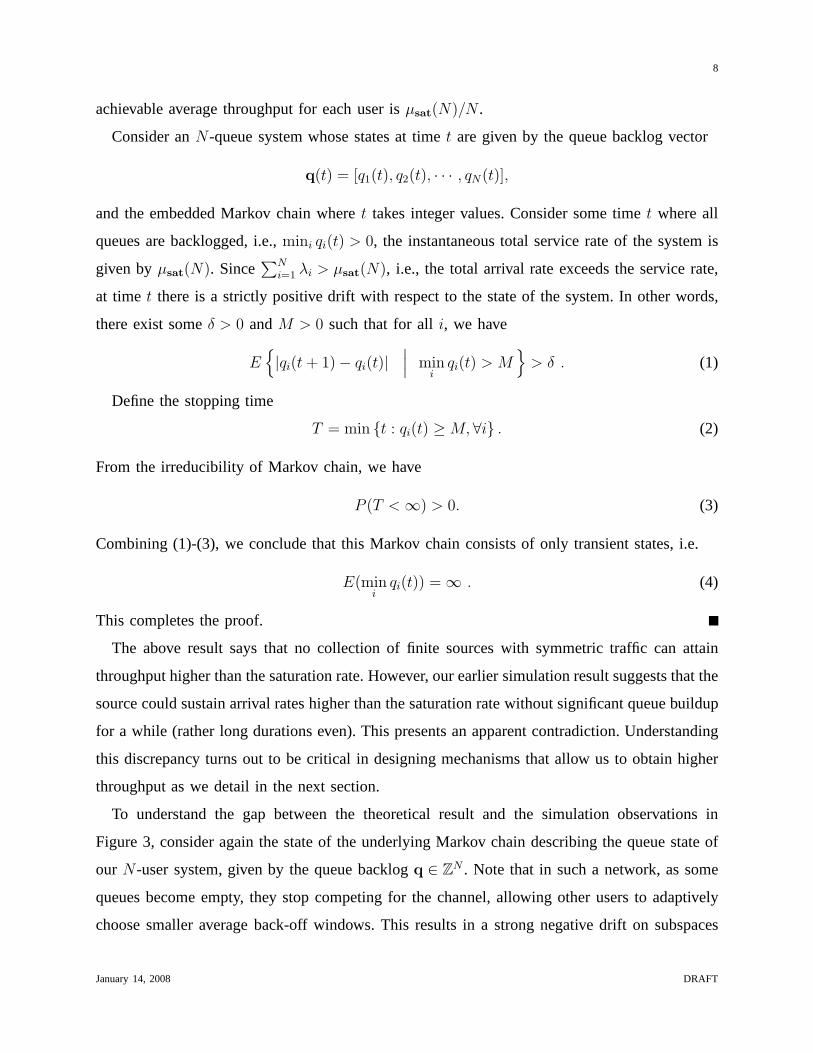
Figure 6 compares the above calculation with the simulationresult for N = 25 users with
B = 1. Even though, as expected, the simple MAC model proposed earlier fails to capture the
precise departure rate, our simulations confirm the generaltrend specified by Theorem 1. In
other words, limiting the buffer size to 1 unit improves the maximum achievable throughput of
the system. Note that such a buffer constraint, on the other hand, causes packet drops in the
admissible regime (whenNλ < µsat(N)) which are nonetheless compensated by the increase in
the overall throughput rate. It clearly confirms the result of Theorem 1, suggesting thatλ∗ is 5.2
Mbps from calculation and 4.4 Mbps from simulation. This discrepancy between the two graphs
is attributed to the overly simplified model of 802.11 MAC. However, the above simple analysis
allows us to hypothesize the following interesting and rather counter-intuitive phenomenon: in
January 14, 2008 DRAFT
14
0 1 2 3 4 5 6 7 8 90
0.5
1
1.5
2
2.5
3
3.5
4
4.5
5
5.5
Aggregate arrival rate Nλ (Mbps)
Agg
rega
te th
roug
hput
µ(λ
) (M
bps)
simulationcalculationµ
sat(N)
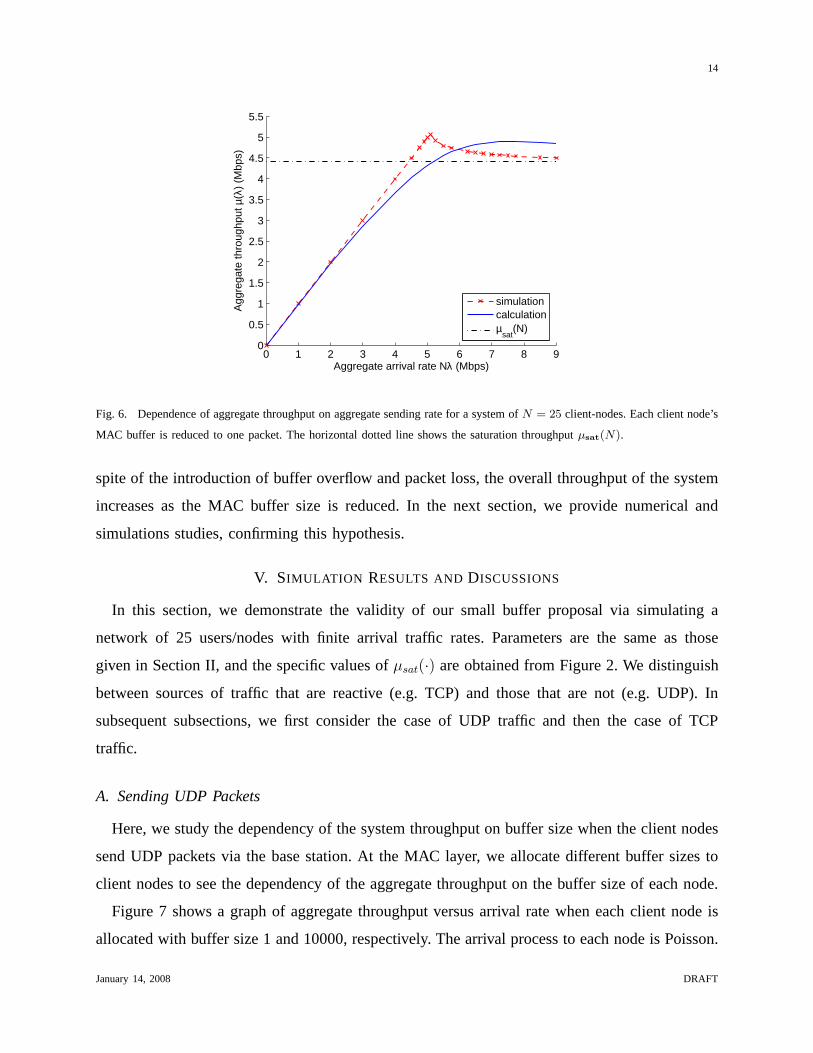
Fig. 6. Dependence of aggregate throughput on aggregate sending rate for a system ofN = 25 client-nodes. Each client node’s
MAC buffer is reduced to one packet. The horizontal dotted line shows the saturation throughputµsat(N).
spite of the introduction of buffer overflow and packet loss,the overall throughput of the system
increases as the MAC buffer size is reduced. In the next section, we provide numerical and
simulations studies, confirming this hypothesis.
V. SIMULATION RESULTS AND DISCUSSIONS
In this section, we demonstrate the validity of our small buffer proposal via simulating a
network of 25 users/nodes with finite arrival traffic rates. Parameters are the same as those
given in Section II, and the specific values ofµsat(·) are obtained from Figure 2. We distinguish
between sources of traffic that are reactive (e.g. TCP) and those that are not (e.g. UDP). In
subsequent subsections, we first consider the case of UDP traffic and then the case of TCP
traffic.
A. Sending UDP Packets
Here, we study the dependency of the system throughput on buffer size when the client nodes
send UDP packets via the base station. At the MAC layer, we allocate different buffer sizes to
client nodes to see the dependency of the aggregate throughput on the buffer size of each node.
Figure 7 shows a graph of aggregate throughput versus arrival rate when each client node is
allocated with buffer size 1 and 10000, respectively. The arrival process to each node is Poisson.
January 14, 2008 DRAFT

15
0 1 2 3 4 5 6 7 8 9
x 106
0
1
2
3
4
5
6x 10
6
Aggregate arrival rate (bps)
Agg
rega
te th
roug
hput
(bp
s)
1pkt10000 pkts
Fig. 7. Throughput performance for buffer size 1 and 10000 packets, respectively, with Poisson arrivals.
Here, we notice that when the buffer size is 10000, the aggregate throughput is basically the
same as the aggregate arrival rate until it peaks at saturation (around 4.6 Mbps). It then follows
a similar flat curve that is consistent with the saturation curve.
In the case of 1-packet buffer size, we notice that the curve overlaps with that of 1000-packet
buffer size until the arrival rate exceeds the saturation throughput. At this point, unlike in the
previous case, the throughput continues to increase past the saturation point at 4.6 Mbps and
starts to drop around 5.2 Mbps (close to a 10% increase in throughput) and gradually returns
to the saturation throughput when the arrival rate exceeds 8.5 Mbps. Here we see a significant
increase in throughput when we compare the maxima of the two curves. In particular, the range
between 4.6 Mbps (the saturation point) and 8.5 Mbps is the ideal range in which the system
should be operated; it is in this range we achieve higher thansaturation throughput.
Similar results can be obtained for various choices of buffer sizes. Figure 8 shows a zoomed-
in plot of the system throughput versus arrival rates aroundthe saturation rate. The conclusion
remains the same: for arrival rates less than the saturationrate we get essentially the same values
of system throughput; for arrival rates higher than the saturation rate smaller buffer sizes result
in higher system throughput than the saturation rate.
Table II lists the maxima of the throughput curve for the different buffer sizes considered
January 14, 2008 DRAFT

16
4.5 5 5.5 6 6.5 7 7.5 8 8.5 94.4
4.5
4.6
4.7
4.8
4.9
5
5.1
5.2
Aggregate arrival rate (Mbps)
Agg
rega
te th
roug
hput
(M
bps)
1 pkt4 pkts9 pkts)30 pkts10,000 pkts
Fig. 8. Throughput performance for different buffer size values
TABLE II
COMPARISON OF THE MAXIMUM THROUGHPUT ACHIEVED FOR DIFFERENTBUFFER SIZES AND THE RESPECTIVE INCREASE
IN THROUGHPUT OVER THE SATURATION THROUGHPUT
Buffer size Approximated maximum Percentage increase in throughput
1 5064913 14.56
4 4959693 12.19
6 4877423 10.31
9 4841981 9.50
30 4497785 1.71
100 4497785 1.71
10000 4497785 1.71
in the above simulation. Note that these maxima are approximate values as the data points are
discrete.
We also experimented with arrival processes that are more bursty than Poisson. In particular,
we also used arrivals that occur in bursts of average size 20 packets, with an exponential inter-
burst time. The results are shown in Figure 9, with a similar observation and conclusion. Note
January 14, 2008 DRAFT

17
0 1 2 3 4 5 6 70
0.5
1
1.5
2
2.5
3
3.5
4
4.5
5
Aggregate arrival rate (Mbps)
Agg
rega
te th
roug
hput
(M
bps)
20 pkt10,000 pkts
Fig. 9. Throughput performance for buffer size 20 and 10,000in which packet arrival process is exponential and bursty (average
burst size of 20 packets)
that in bursty scenarios, the MAC buffer cannot be reduced beyond the average burst size without
the probability of packet drop becoming prohibitively large.
From the above simulation results and comparisons, we conclude that saturation throughput
is a pessimistic criteria when working with 802.11 network.We also observe that a large buffer
size in client nodes can have a negative effect on throughputperformance. The intuitive reason
is that for arrival rates beyond saturation, the higher the arrival rate, the higher the chances of
collision between competing packets. This, in turn, leads to large average window size using
exponential back off, which results in waste of bandwidth. Reducing the buffer sizes at the
client nodes effectively reduces arrival rates “seen” by the base station for arrival rates beyond
saturation.
There are two important points to make in applying the above observation to practice. The
first is that in order to fully benefit from the above result, ideally one would like to operate the
system around the region where the aggregate throughput exceeds the saturation throughput, by
allocating the right buffer size. This may not be easy in practice because one does not necessarily
know a priori the number of clients in the system or their respective arrival processes. Fortunately,
even if one cannot perfectly fit the buffer size to the traffic scenario, not much is lost in term
January 14, 2008 DRAFT

18
of throughput. As we have seen, a smaller buffer gives identical throughput performance as
a large buffer under all arrival rates except for the immediate region exceeding the saturation
rate, in which case smaller buffers outperform large buffers. Even more fortunate, in the case
of transporting using TCP, as we shall see in the next subsection, TCP actually adapts to the
smaller buffer size (adjusting its congestion window size)and “learns” the ideal operating point.
The second point is that the gain in throughput for UDP trafficis obtained at the expense of
higher packet losses due to buffer overflow. We note that, forall buffer sizes and at arrival rates
above the saturation rate, the higher the arrival rate, the higher the difference between arrival and
service rates. In the case of smaller buffers, this difference means packets are lost due to more
buffer overflow; whereas in the case of large buffers, this difference means packets are queued
indefinitely in the buffer (up to the buffer capacity), as well as more loss due to collision. This
distinction is important as it sheds light on the advantage of losing packets at the MAC buffer:
buffer overflow prevents excessive traffic and packet collision over the air. Therefore, reliability
mechanism (e.g., packet loss recovery/retransmission) atthe higher layers does not involve the
actual “retransmission” of packets over the air. Such a system is much more bandwidth and
energy efficient than retransmitting packets lost due to collision.
Having demonstrated the benefits of adopting smaller buffersizes at the MAC layer for UDP
traffic, we next examine whether the same approach has negative impact on TCP traffic, which
is reactive unlike UDP. We will see that the adaptive nature of TCP makes its performance (to
a large extent) impartial to the choice of the MAC buffer size.
B. Sending TCP Packets
The sending rate of TCP packets is determined by the TCP agents at both the sender and
receiver. If TCP packets are being sent by client nodes, the sender-side TCP considers any
loss of packets as a sign of network congestion and, consequently, throttles its sending rate.
The reactive response of TCP, i.e. additive-increase, multiplicative-decrease of the congestion
window, adaptively controls the rate at which packets are being lost for any reason. In our
network, two possible reasons significantly contribute to the loss of a packet: buffer overflow
and timeout (both are regulated and impacted by users’ interactions and dynamics.).
Table III shows the aggregate throughput, number of packetsdropped, the average round trip
time (RTT) for TCP packets, and the average congestion window during the simulation for
January 14, 2008 DRAFT

19
TABLE III
PARAMETERS MEASURED FORTCPSIMULATION FOR DIFFERENT BUFFER SIZE VALUES
Buffer size Throughput Buffer overflow drop Drop due to timeout Average RTT (s) Average CWND
1 3276458 106862 2 0.261492 3.53879
3 3280281 18205 5 0.712183 14.2779
6 3266901 172 48 1.21481 202.856
10 3276458 12 25 1.21821 223.326
30 3275366 0 15 1.21982 224.9
10000 3275366 0 15 1.21982 224.9
different choices of MAC buffer sizes. Many important observations and conclusions are to be
made here: First, we do not see any significant differences between the net aggregate throughput
achieved across different scenarios. Moreover, while the number of packets dropped due to
timeout are quite insignificant, we see significant and consistent changes in number of packets
dropped due to buffer overflow, average RTT, and average TCP congestion window size. This
can be explained as follows. Packet losses due to timeout do not have significant impact on the
throughput performance in the system. As the buffer size increases, the probability of dropping
packets decreases significantly. This has a positive impacton the TCP congestion window size.
However, we do not see any proportional increases in aggregate throughput as the average TCP
congestion window increases. This is because, in the case ofhigher buffer size, there is a higher
competition to share the bandwidth which increases the queue delay of packets (shown by an
increase in RTT). This slows down the sending rate for a givencongestion window as TCP uses
a sliding window mechanism. That is, although a packet with such a long RTT is not dropped,
it blocks the sliding TCP window. This is exactly why the aggregate throughput does not vary
significantly with buffer sizes.
Here we note that the lower aggregate throughput in TCP traffic, relative to UDP traffic, is
somewhat expected due to the less stochastic nature of the TCP traffic streams and the lower
statistical multiplexing of the sources. This lower statistical multiplexing results in a higher level
of simultaneous use of channel and, hence, higher collisionrates. In other words, the adaptive
nature of TCP streams is both the curse and the blessing: it isa curse in smoothly adapting traffic,
January 14, 2008 DRAFT

20
resulting in higher collision rate and, hence, less efficient use of bandwidth; it is a blessing as
it guarantees a robust performance against variations in MAC buffer sizes.
The second issue at hand is the impact of packet loss due to buffer overflow. We note two
regimes for the operation of the network in relation to packet loss. Our studies show that, when
traffic intensity is significantly below saturation, packetloss due to overflow is negligible. With
an increase in traffic load, packet overflow loss increases. When the traffic load is strictly below
saturation, the short buffers introduce an undesirable loss phenomenon. This loss probability
can easily be combatted at high layers via FEC or packet retransmission3. In the regime where
arrival rate surpasses the saturation throughput of the system, the packet loss due to overflow
becomes insignificant compared to the packet loss due to collisions and deadline expiry. This
means that the negative impact of a short buffer, i.e., higher buffer overflow rate, is dominated by
the positive impact of short buffer on decreasing the collision rate. In other words, this highlights
a similar point we made in the case of UDP traffic: that is, for all buffer sizes, the higher the
arrival rate (beyond saturation), the higher the difference between the arrival rate and service
rate. As mentioned earlier, in the case of small buffers, this difference means packets queued
increase buffer overflow, whereas in the case of large buffers, the difference means packets
queued indefinitely in the buffer (up to buffer capacity≈ ∞) as well as increased packet loss
due to collision. This distinction is important because theformer does not introduce excessive
traffic and packet collision over the air. Therefore, any reliability (e.g., packet loss recovery and
retransmission) measures at higher layers do not involve the actual transmission of packets –
they are lost prior to transmission which is thus much more bandwidth and energy efficient.
VI. CONCLUSION
Most studies regarding 802.11 technology have focused on what is known as saturation
analysis. In this paper, we first showed that the notion of saturation is an inherently pessimistic
one as it does not fully convey the capacity of the system. Ourwork was motivated by our
observations and simulations of the 802.11 network. We usedbasic concepts from Markov chain
theory to explain a seemingly paradoxical gap between theoretical notion of throughput and
3The FEC technique is advantageous to retransmission as it does not incur an out-of-order delivery problem, but both techniques
are simple and easy to implement.
January 14, 2008 DRAFT

21
the simulated performance of an 802.11 network. We then relied on this insight to show that a
reduction of MAC buffer size, in fact, significantly improves the throughput performance in the
network. The main reason behind this improvement is the monotonically decreasing property of
the saturation throughput in 802.11 network with the numberof backlogged users.
While we have shown that saturation throughput does not completely capture the capability
of 802.11, it remains one of the most succinct and natural notions of performance. It would
be highly desirable if we could come up with a similarly succinct and natural notion in the
non-saturated regime (conceivably the finite buffer size will have to be counted for somehow).
This is a potentially interesting future research direction.
REFERENCES
[1] G. Bianchi, “Performance analysis of the IEEE 802.11 distributed coordination function,”IEEE J. Select. Areas Commun.,
vol. 18, no. 3, pp. 535-547, Mar. 2000.
[2] F. Cali, M. Conti, and E. Gregori, “Dynamic tuning of the IEEE 802.11 protocol to achieve a theoretical throughput limit,”
IEEE/ACM Trans. Networking, vol. 8, no. 6, pp. 785-799, Dec. 2000.
[3] P. Chatzimisios, A. C. Boucouvalas, and V. Vitsas, “IEEE802.11 packet delay a finite retry limit analysis,”Proc. of IEEE
Global Telecomm. Conf. (GLOBECOM’03), 2003.
[4] A. Kumar, M. Goyal, E. Altman, and D. Miorandi, “New insights from a fixed point analysis of single cell IEEE 802.11
WLANs,” Proc. of IEEE INFOCOM’05, Miami, FL, 2005.
[5] T. Javidi, M. Liu, and R. Vijayakumar, “Revisiting saturation throughput in 802.11,”Proceedings of Allerton Conference,
Oct. 2005.
[6] H. Zhai, Y. Kwon, and Y. Fang, “Performance analysis of IEEE 802.11 MAC protocols in wireless LANs,”Wireless
Communications and Mobile Computing, 2004.
[7] T. Javidi, M. Liu, and R. Vijayakumar, “Saturation throughput of 802.11 revisited,”CSPL Technical Report Series: TR-371.
[Online]. Available: http://www.eecs.umich.edu/systems/TechReportList.html
[8] P. Hoel, S. Port, and C. Stone,Introduction to Stochastic Processes, Waveland Press.
[9] M. K., Amjad and A. Shami, “Improving the throughput performance of IEEE 802.11 Distributed Coordination Function,”
IEEE 23rd Biennial Symposium on Communications, pp. 182–185, May 29 - June 1, 2006.
[10] S. H.Y. Wong, H. Yang, S. Lu, and V. Bharghavan, “Robust rate adaptation for 802.11 wireless networks,”ACM MobiCom,
2006.
[11] Q. Ni, T. Li, T. Turletti, and Y. Xiao, “Saturation throughput analysis of error-prone 802.11 wireless networks,”Wiley
Journal of Wireless Communications and Mobile Computing (JWCMC), vol. 5, issue 8, pp. 945–956, Dec. 2005.
[12] G. Cantieni, Q. Ni, C. Barakat, and T. Turletti, “Performance analysis under finite load and improvements for multirate
802.11b,”Elsevier Computer Communications Journal, vol. 28, issue 10, pp. 1095–1109, June 2005.
[13] F. A.-Shabdiz and S. Subramaniam, “Finite Load Analytical Model for the IEEE 802.11 Distributed Coordination Function
MAC,” Inter. Symp. on Modeling and Optimization in Mobile, Ad Hoc and Wireless Networks (WiOpt), INRIA Sophia
Antipolis, Mar. 2003.
January 14, 2008 DRAFT

22
[14] K. Sakakibara, S. Chikada, and J. Yamakita, “Analysis of unsaturation throughput of IEEE 802.11 DCF,”IEEE International
Conference on Personal Wireless Communications (ICPWC), pp. 134–138, 2005.
[15] G.-S. Ahn, A. T. Campbell, A. Veres, and L.-H. Sun, “Supporting service differentiation for real-time and best-effort traffic
in stateless wireless ad hoc networks (SWAN),”IEEE Trans. Mobile Computing,vol. 1, pp. 192–207, 2002.
[16] M. Ergen and P. Varaiya, “Throughput analysis and admission control in IEEE 802.11a,”Mobile Networks and Applications,
vol. 10, no. 5, pp. 705–716, Oct. 2005.
[17] A. Zaki and M. El-Hadidi, “Throughput analysis of IEEE 802.11 DCF under finite load traffic,” inProc. First Inter. Symp.
on Control, Commun., and Signal Processing, pp. 535–538, 2004.
[18] O. Tickoo and B. Sikdar, “A queueing model for finite loadIEEE 802.11 random access,” inProc. IEEE Inter. Conf. on
Communications, vol. 1, pp. 175–179, June 2004.
[19] K. Duffy, D. Malone, and D. J. Leith, “Modeling the 802.11 Distributed Coordination Function in non-saturated conditions,”
in IEEE Communications Letters,Vol. 9, No. 8, August 2005.
[20] P. Gupta, Y. Sankarasubramaniam, and A. Stolyar, “Random-access scheduling with service differentiation in wireless
networks,” inProceedings of the 24th Inter. Conf. on Computer Communications (INFOCOM), Mar. 2005.
January 14, 2008 DRAFT