From Localization to Connectivity and... Lei Sheu 1/11/2011.
21
From Localization to Connectivity and ... Lei Sheu 1/11/2011
-
Upload
darrell-smith -
Category
Documents
-
view
221 -
download
0
Transcript of From Localization to Connectivity and... Lei Sheu 1/11/2011.
From Localization to Connectivity and ...
Lei Sheu1/11/2011
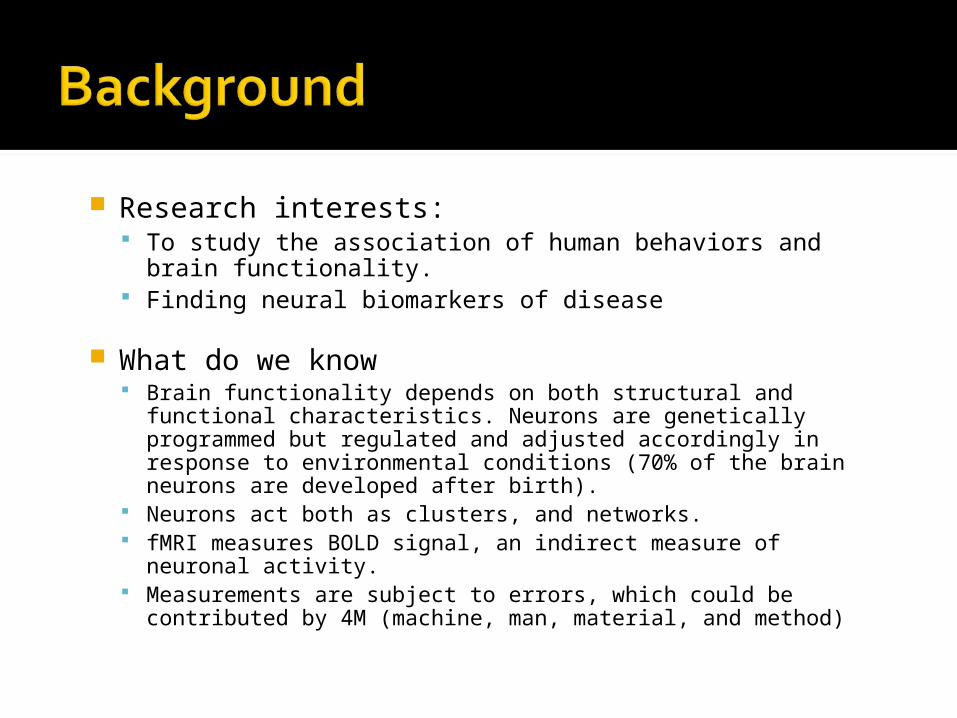
Research interests: To study the association of human behaviors and brain
functionality. Finding neural biomarkers of disease
What do we know Brain functionality depends on both structural and functional
characteristics. Neurons are genetically programmed but regulated and adjusted accordingly in response to environmental conditions (70% of the brain neurons are developed after birth).
Neurons act both as clusters, and networks. fMRI measures BOLD signal, an indirect measure of neuronal
activity. Measurements are subject to errors, which could be contributed
by 4M (machine, man, material, and method)
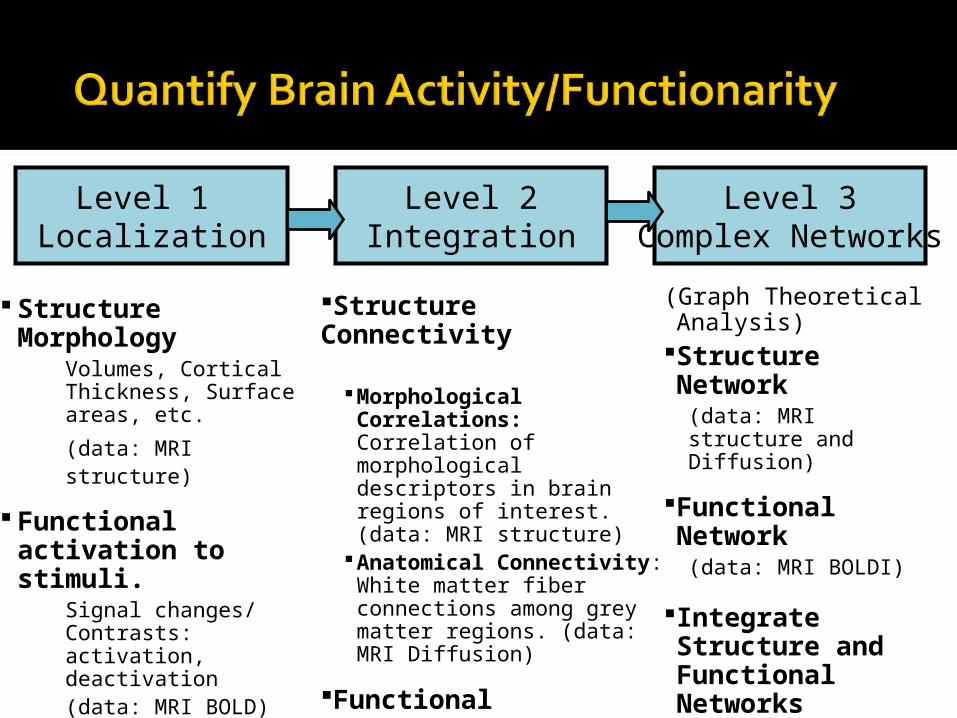
Structure Morphology Volumes, Cortical Thickness, Surface areas, etc.
(data: MRI structure)
Functional activation to stimuli.
Signal changes/ Contrasts: activation, deactivation(data: MRI BOLD)
Structure Connectivity
Morphological Correlations: Correlation of morphological descriptors in brain regions of interest. (data: MRI structure)
Anatomical Connectivity: White matter fiber connections among grey matter regions. (data: MRI Diffusion)
Functional ConnectivitySeed Based (functional
connectivity)ROIs/Network (effective
connectivity) (data: MRI BOLD)
Level 1 Localization
Level 2Integration
Level 3Complex Networks
(Graph Theoretical Analysis)
Structure Network(data: MRI structure and Diffusion)
Functional Network(data: MRI BOLDI)
Integrate Structure and Functional Networks
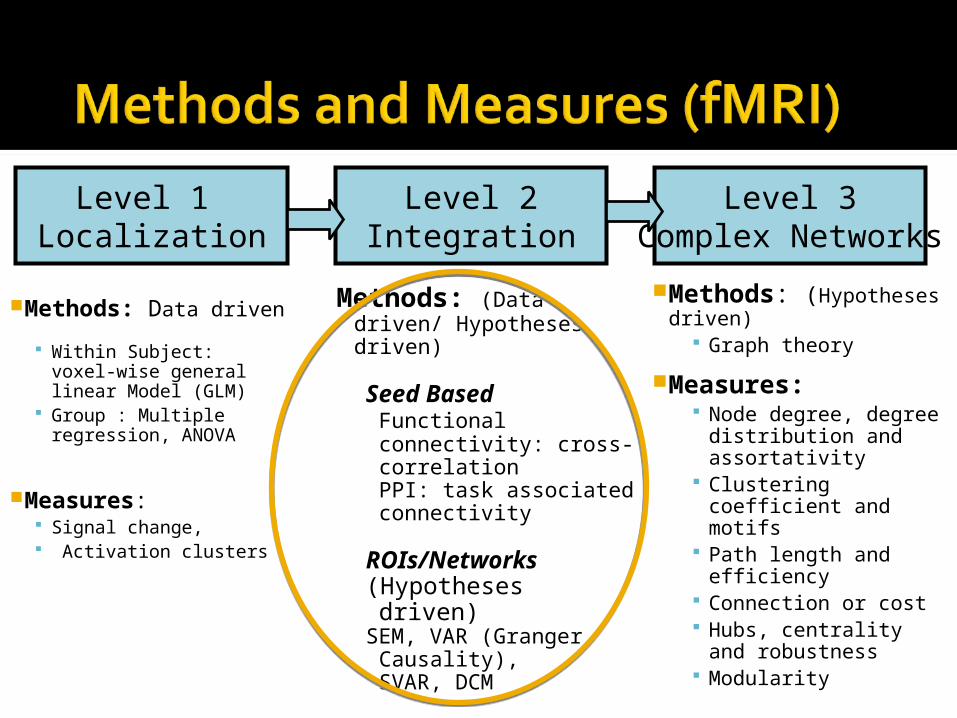
Methods: Data driven
Within Subject: voxel-wise general linear Model (GLM)
Group : Multiple regression, ANOVA
Measures: Signal change, Activation clusters
Methods: (Hypotheses driven)
Graph theory
Measures: Node degree, degree
distribution and assortativity
Clustering coefficient and motifs
Path length and efficiency
Connection or cost Hubs, centrality and
robustness Modularity
Level 1 Localization
Level 2Integration
Level 3Complex Networks
Methods: (Data driven/ Hypotheses driven)
Seed Based Functional connectivity: cross-correlationPPI: task associated connectivity
ROIs/Networks (Hypotheses driven)SEM, VAR (Granger Causality),
SVAR, DCM
Measures:Connectivity strengthConnectivity structural
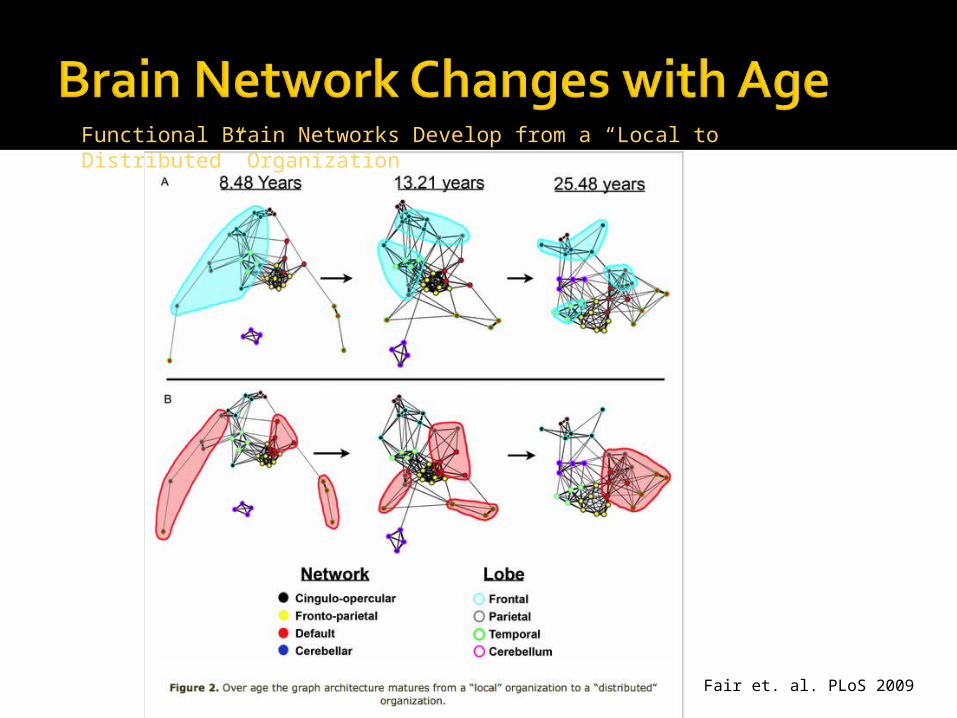
Fair et. al. PLoS 2009
Functional Brain Networks Develop from a “Local to Distributed” Organization
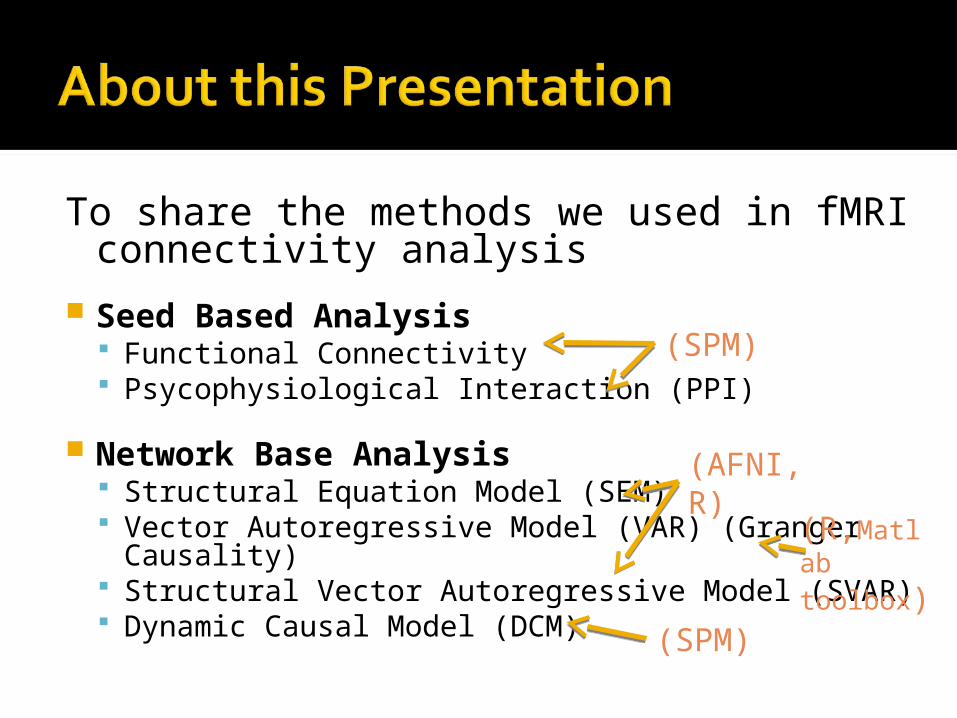
To share the methods we used in fMRI connectivity analysis
Seed Based Analysis Functional Connectivity Psycophysiological Interaction (PPI)
Network Base Analysis Structural Equation Model (SEM) Vector Autoregressive Model (VAR) (Granger
Causality) Structural Vector Autoregressive Model (SVAR) Dynamic Causal Model (DCM)
(SPM)
(SPM)
(AFNI,R)
(R,Matlab
toolbox)
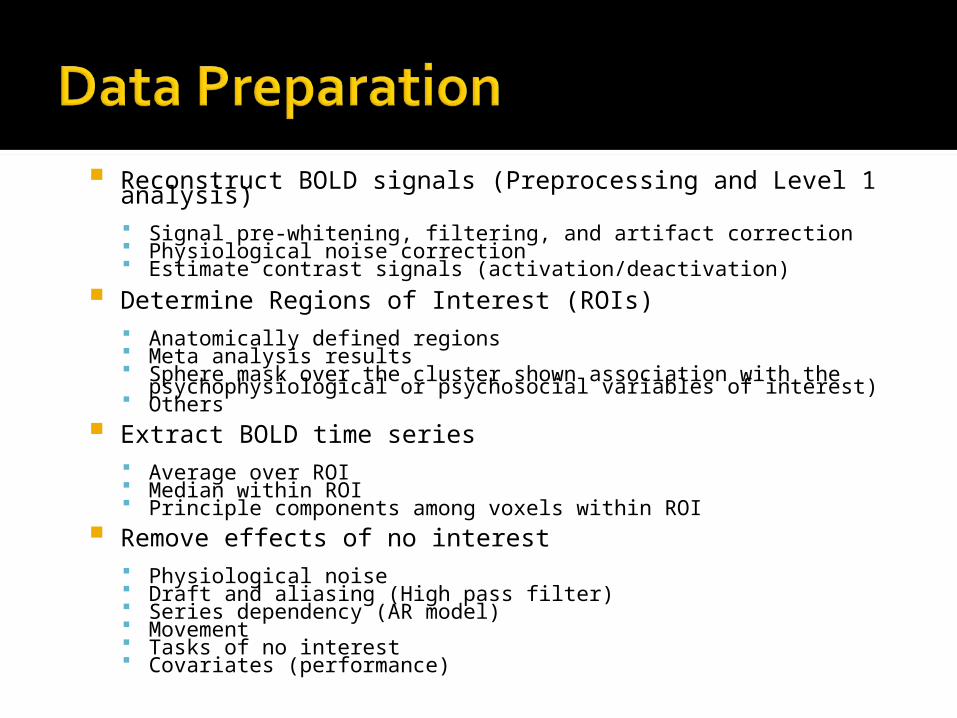
Reconstruct BOLD signals (Preprocessing and Level 1 analysis) Signal pre-whitening, filtering, and artifact correction Physiological noise correction Estimate contrast signals (activation/deactivation)
Determine Regions of Interest (ROIs) Anatomically defined regions Meta analysis results Sphere mask over the cluster shown association with the
psychophysiological or psychosocial variables of interest) Others
Extract BOLD time series Average over ROI Median within ROI Principle components among voxels within ROI
Remove effects of no interest Physiological noise Draft and aliasing (High pass filter) Series dependency (AR model) Movement Tasks of no interest Covariates (performance)
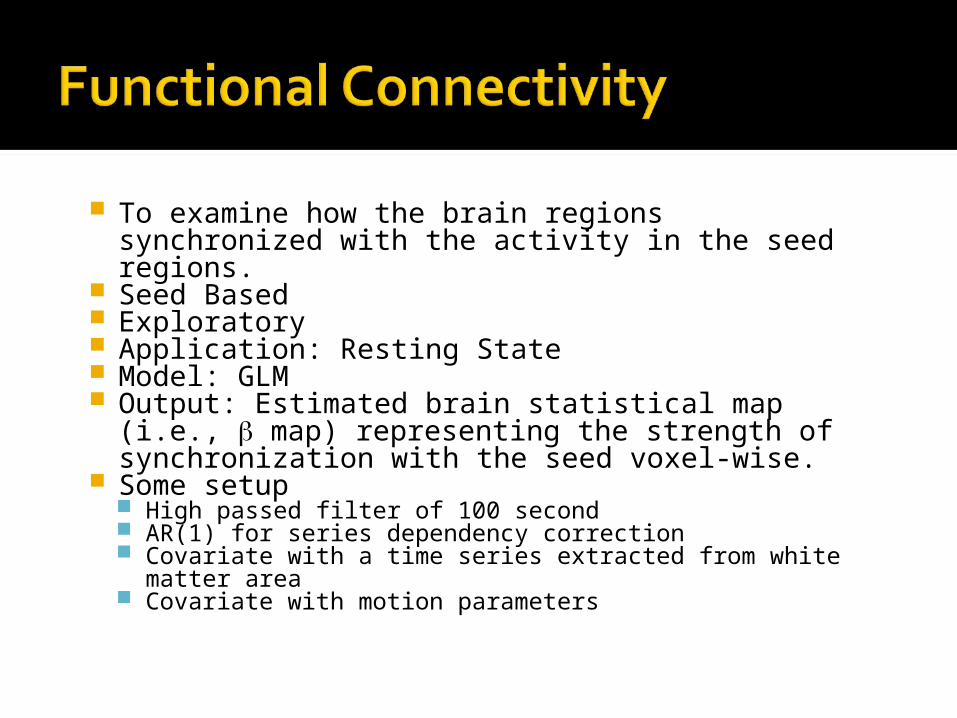
To examine how the brain regions synchronized with the activity in the seed regions.
Seed Based Exploratory Application: Resting State Model: GLM Output: Estimated brain statistical map (i.e.,
map) representing the strength of synchronization with the seed voxel-wise.
Some setup High passed filter of 100 second AR(1) for series dependency correction Covariate with a time series extracted from white
matter area Covariate with motion parameters
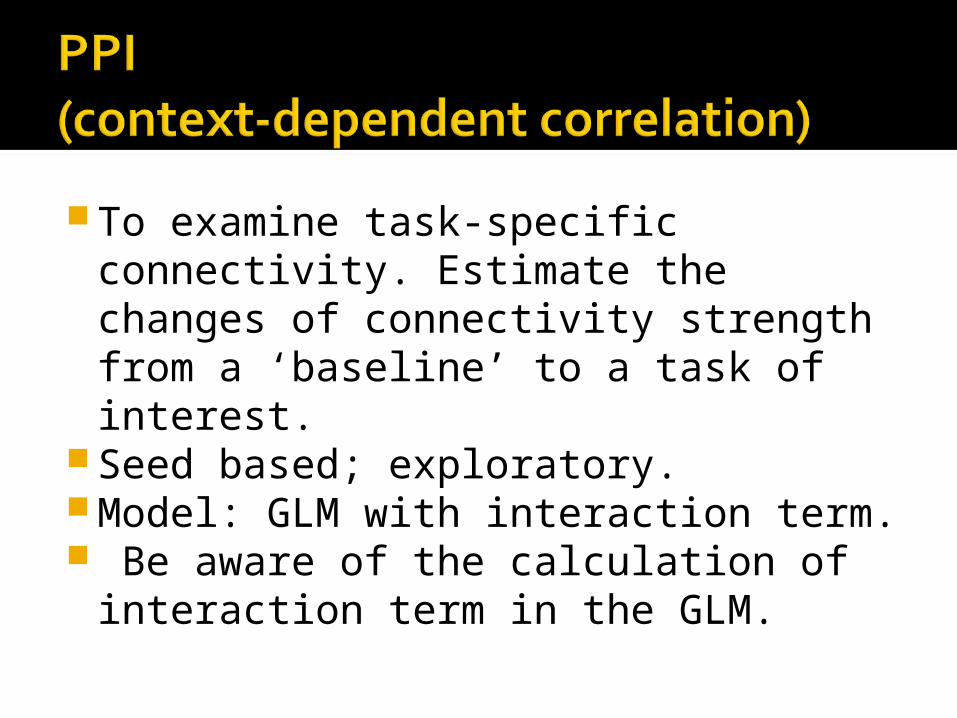
To examine task-specific connectivity. Estimate the changes of connectivity strength from a ‘baseline’ to a task of interest.
Seed based; exploratory.Model: GLM with interaction term. Be aware of the calculation of
interaction term in the GLM.
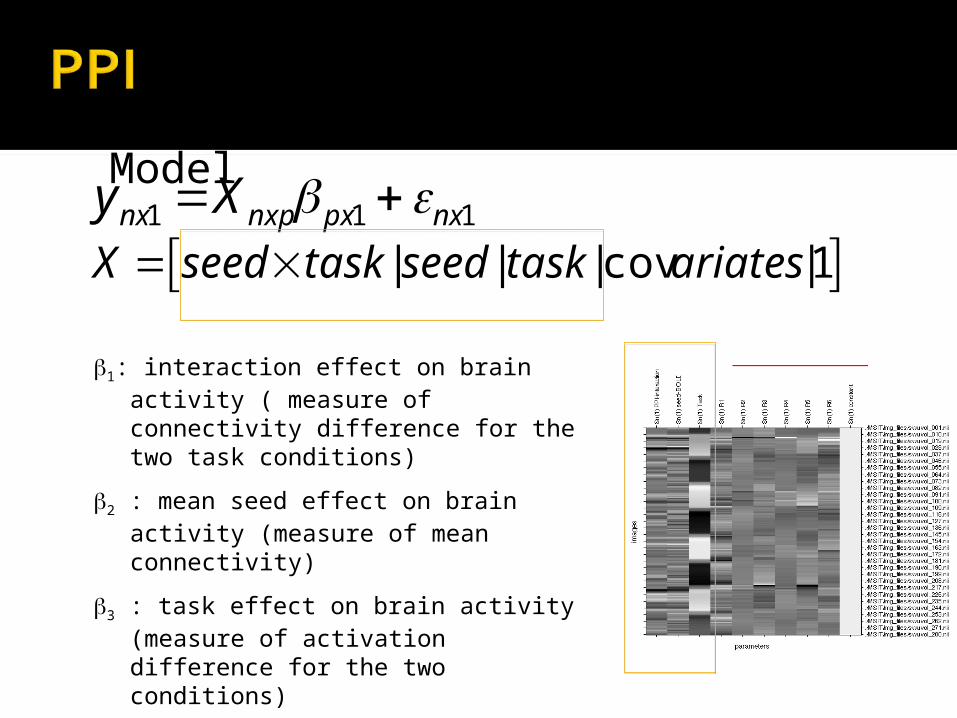
• GLM Model
ynx1 Xnxp px1 nx1
X seed task | seed | task | covariates |1
1: interaction effect on brain activity ( measure of connectivity difference for the two task conditions)
2 : mean seed effect on brain activity (measure of mean connectivity)
3 : task effect on brain activity (measure of activation difference for the two conditions)
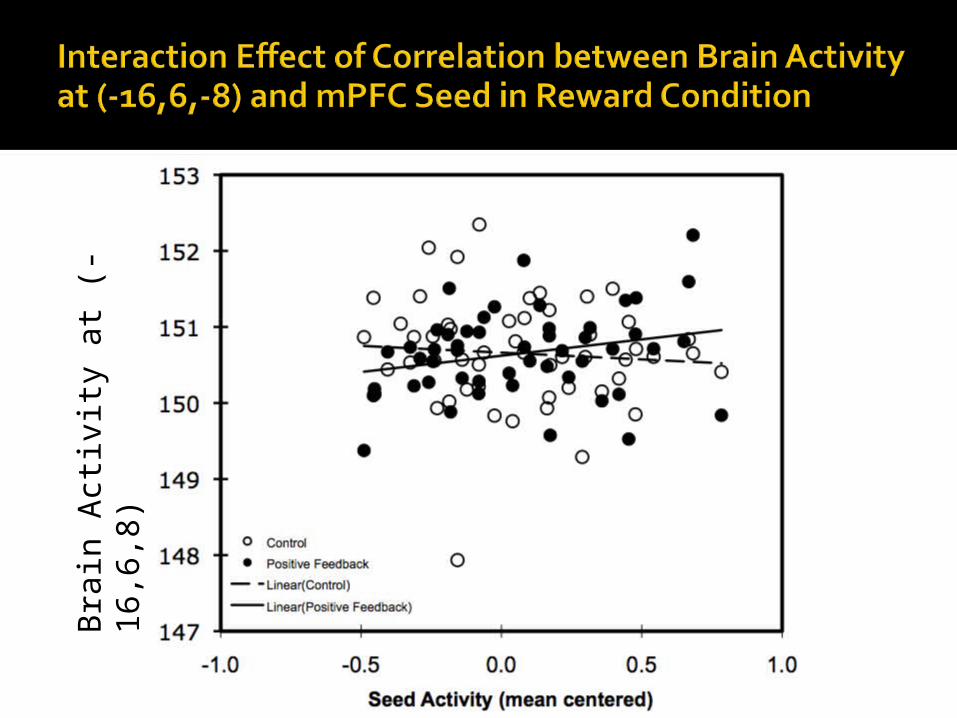
Bra
in A
ctiv
ity a
t (-
16,6
,8)
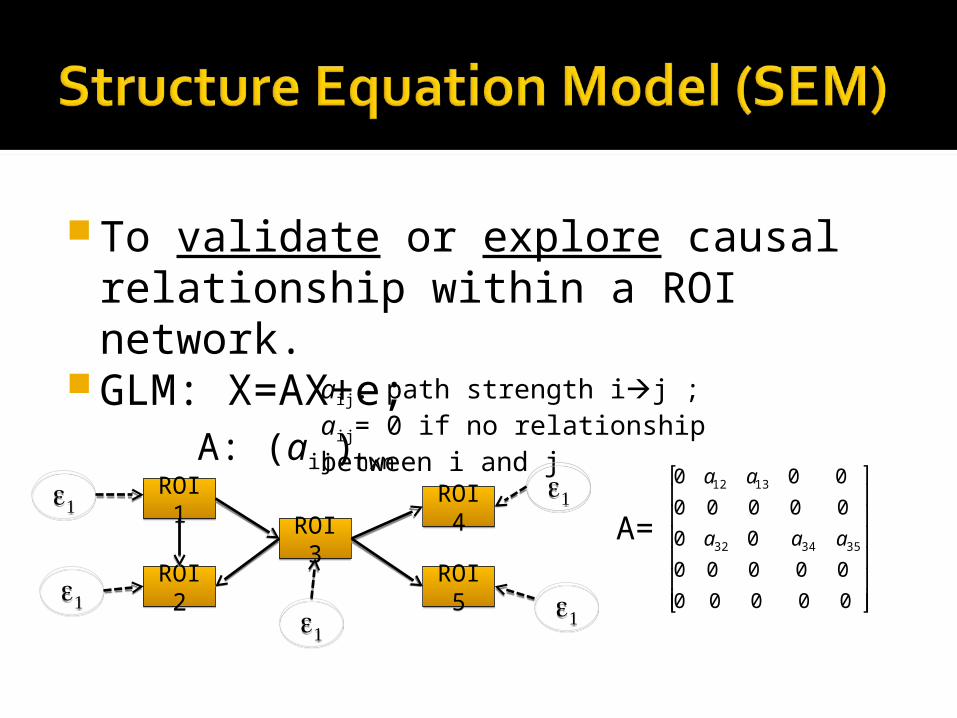
To validate or explore causal relationship within a ROI network.
GLM: X=AX+e; A: (aij)nxn
aij: path strength ij ; aij= 0 if no relationship between i and j
ROI1
ROI1
ROI2
ROI2
ROI5
ROI5
ROI3
ROI3
ROI4
ROI4
€
0 a12 a13 0 0
0 0 0 0 0
0 a32 0 a34 a35
0 0 0 0 0
0 0 0 0 0
⎡
⎣
⎢ ⎢ ⎢ ⎢ ⎢ ⎢
⎤
⎦
⎥ ⎥ ⎥ ⎥ ⎥ ⎥
A=
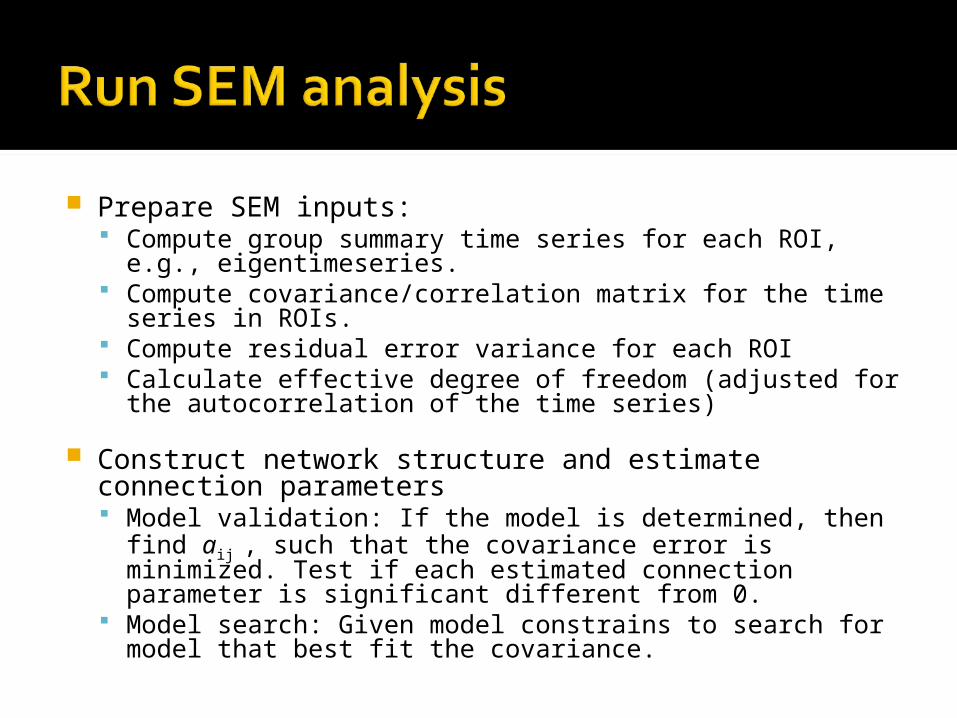
Prepare SEM inputs: Compute group summary time series for each ROI, e.g.,
eigentimeseries. Compute covariance/correlation matrix for the time series
in ROIs. Compute residual error variance for each ROI Calculate effective degree of freedom (adjusted for the
autocorrelation of the time series)
Construct network structure and estimate connection parameters Model validation: If the model is determined, then find aij ,
such that the covariance error is minimized. Test if each estimated connection parameter is significant different from 0.
Model search: Given model constrains to search for model that best fit the covariance.
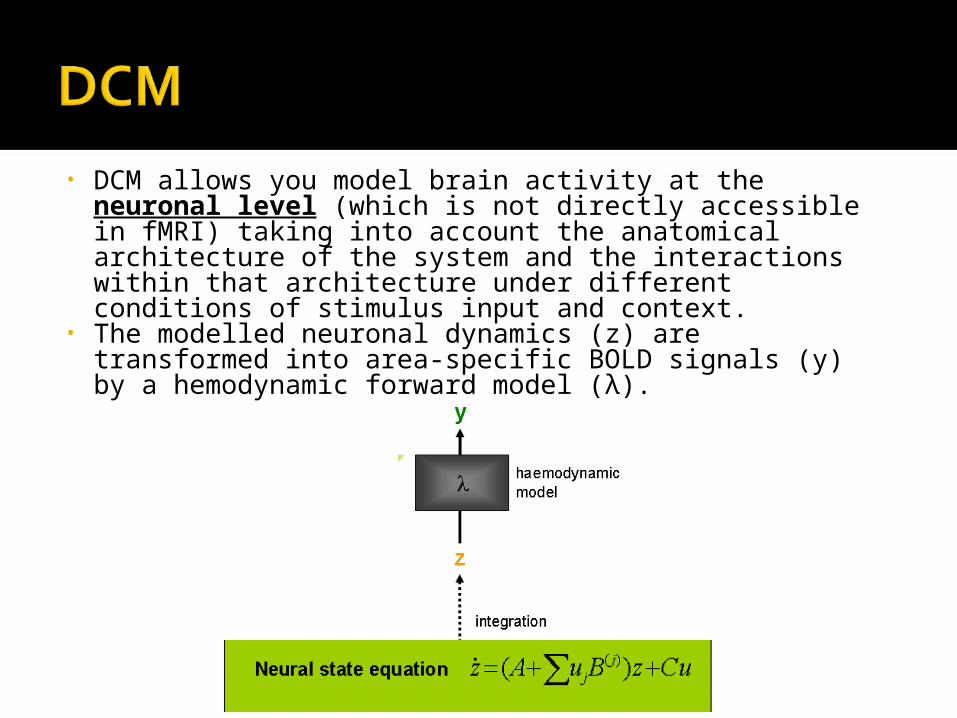
• DCM allows you model brain activity at the neuronal level (which is not directly accessible in fMRI) taking into account the anatomical architecture of the system and the interactions within that architecture under different conditions of stimulus input and context.
• The modelled neuronal dynamics (z) are transformed into area-specific BOLD signals (y) by a hemodynamic forward model (λ).
3
2
112
21
4
3
2
1
334
312
3
444342
343331
242221
131211
4
3
2
1
0
0
0
0
0
0
0
0
0
0
0000
000
0000
000
0
0
0
0
u
u
uc
c
z
z
z
z
b
b
u
aaa
aaa
aaa
aaa
z
z
z
z
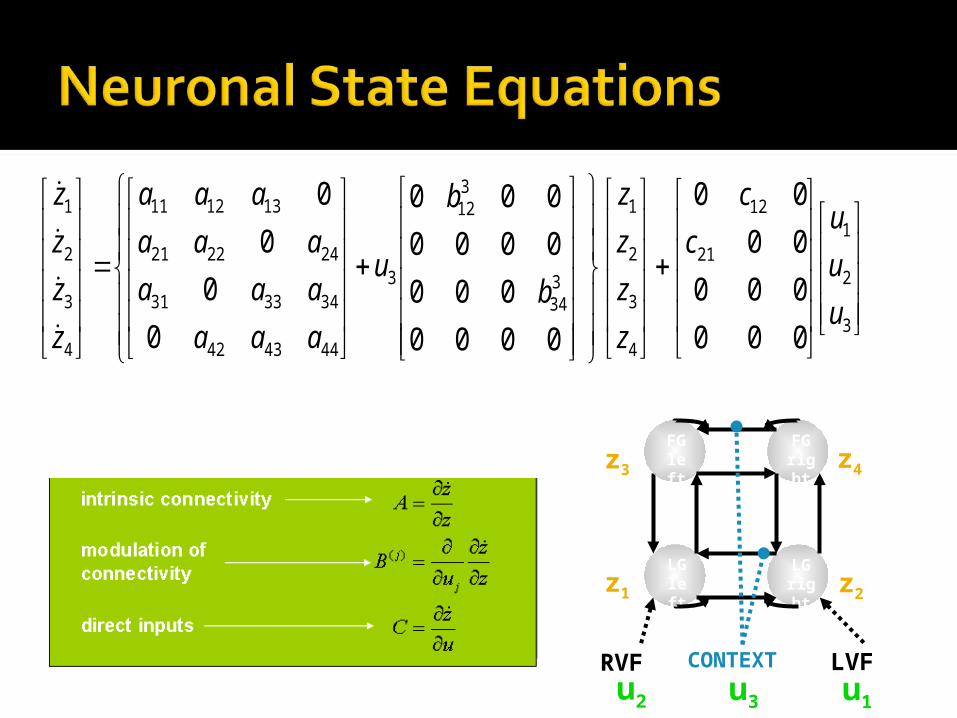
LGleft
LGrigh
t
RVF LVF
FGrigh
t
FGleft
z1 z2
z4z3
u2 u1
CONTEXT
u3
??
??
?? ??
?? ??
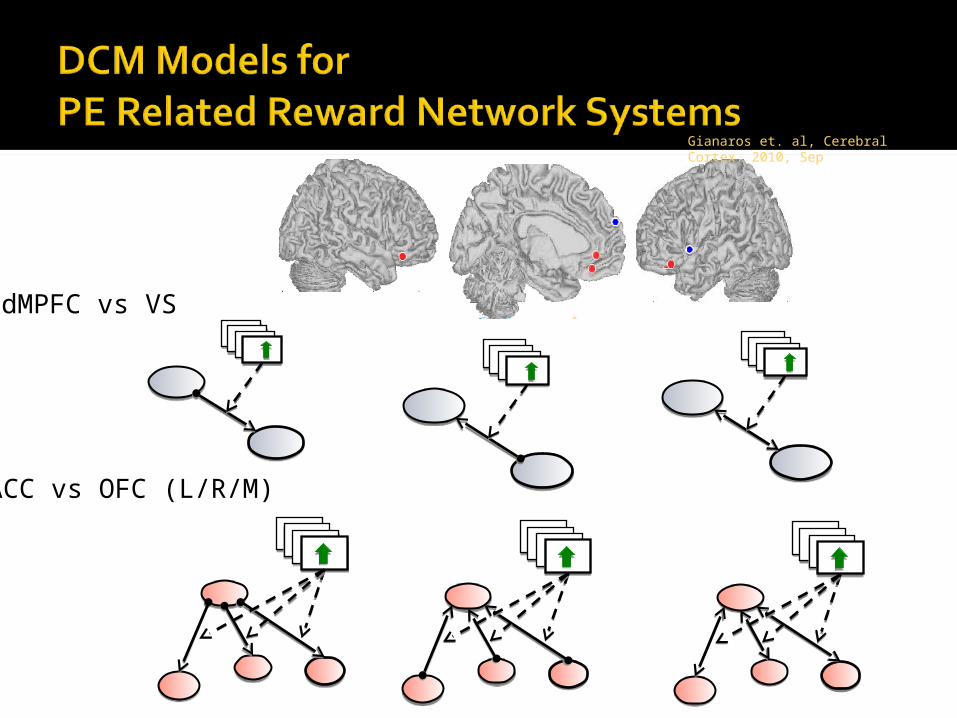
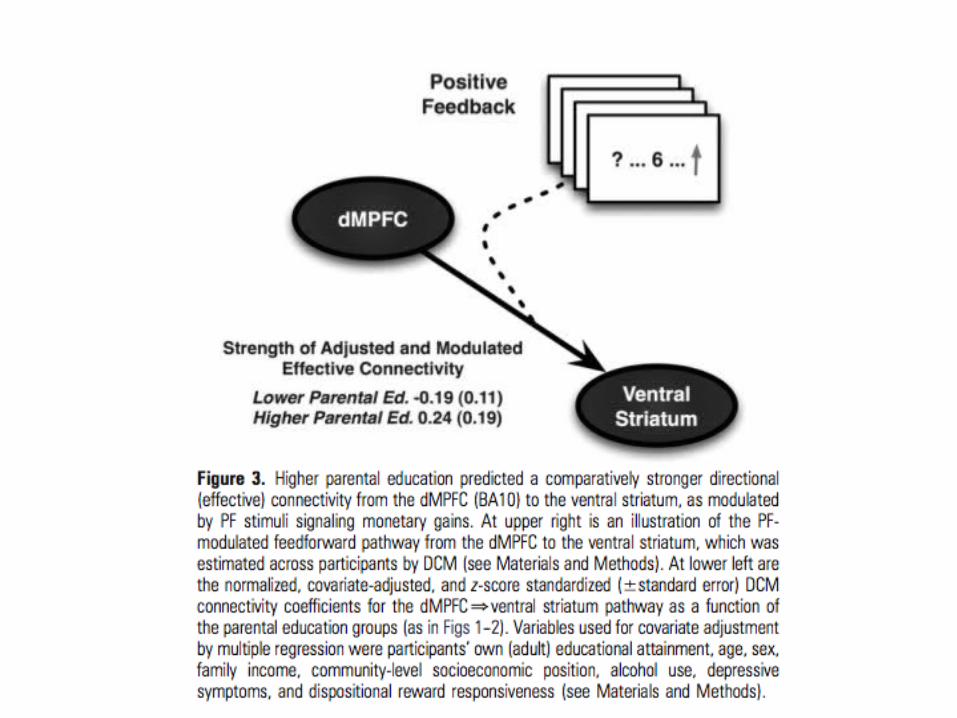
dMPFC vs VS
pACC vs OFC (L/R/M)
Gianaros et. al, Cerebral Cortex. 2010, Sep
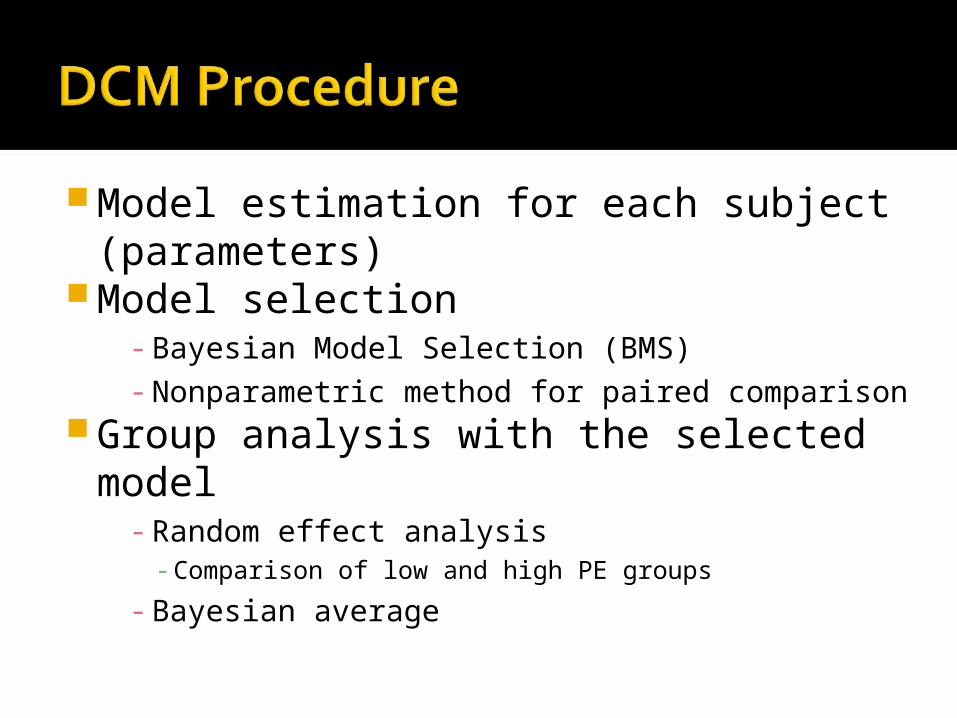
Model estimation for each subject (parameters)
Model selection- Bayesian Model Selection (BMS) - Nonparametric method for paired comparison
Group analysis with the selected model
- Random effect analysis- Comparison of low and high PE groups
- Bayesian average
?????? ???? ??
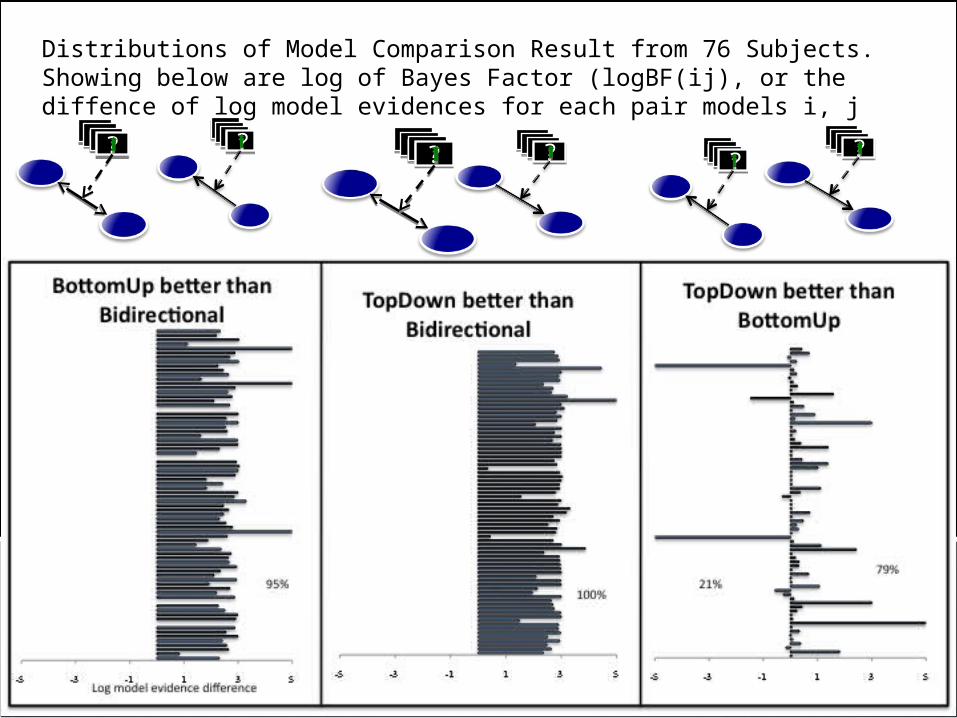
Distributions of Model Comparison Result from 76 Subjects. Showing below are log of Bayes Factor (logBF(ij), or the diffence of log model evidences for each pair models i, j
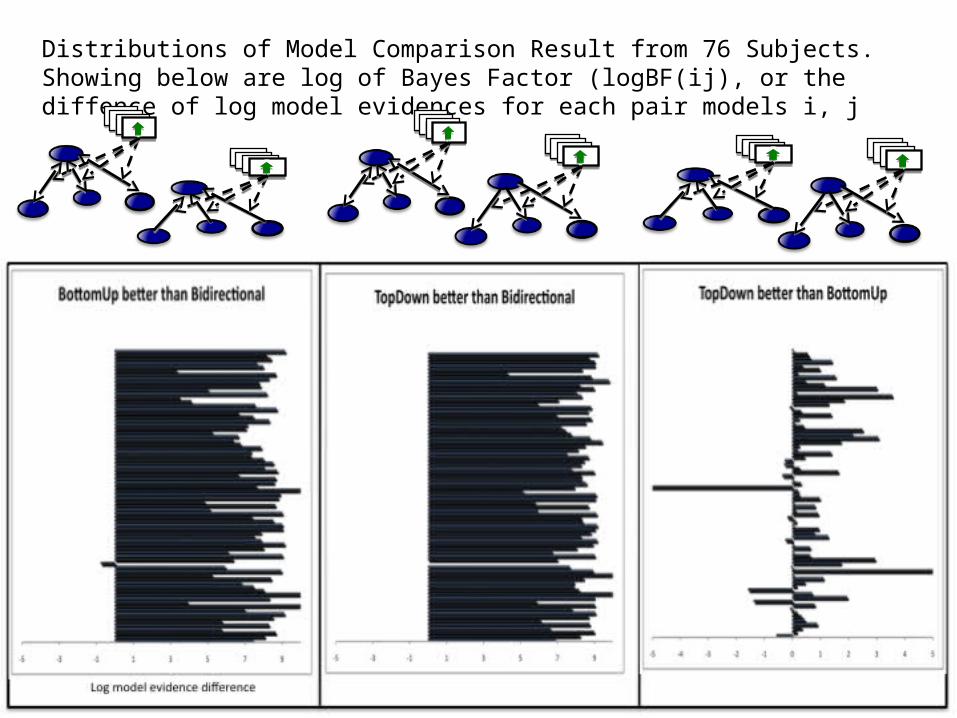
Distributions of Model Comparison Result from 76 Subjects. Showing below are log of Bayes Factor (logBF(ij), or the diffence of log model evidences for each pair models i, j
??
?? ?????? ??
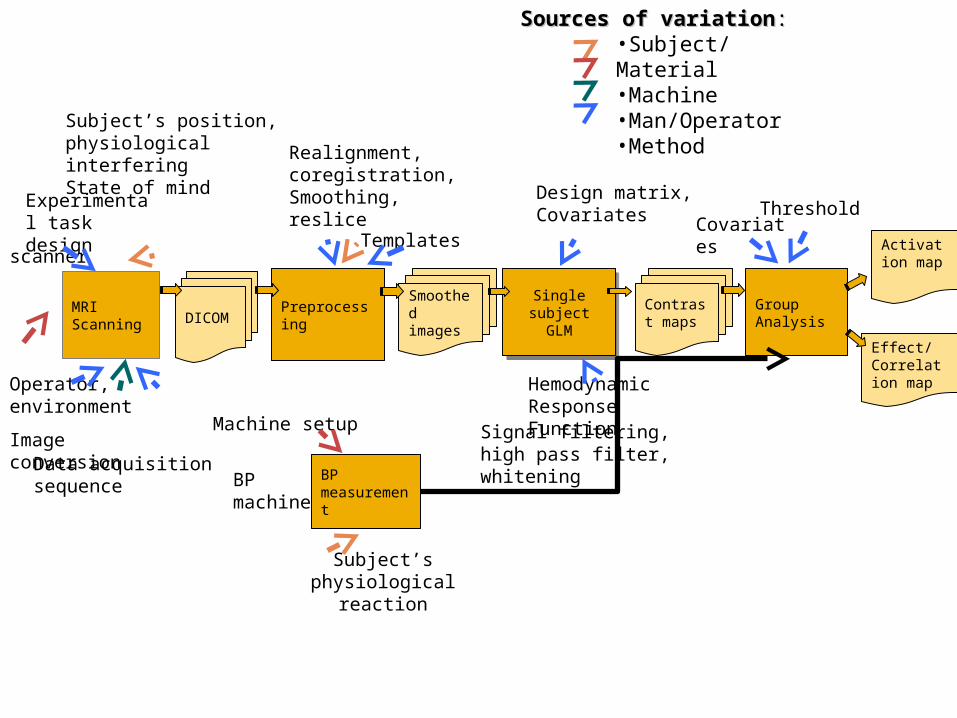
MRI Scanning DICOM
Sources of variationSources of variation::•Subject/Material•Machine•Man/Operator•Method
scanner
Image conversionData acquisition sequence
Subject’s position, physiological interferingState of mind
Experimental task design
Operator, environment
Preprocessing
Realignment, coregistration,Smoothing,reslice
Signal filtering, high pass filter, whitening
Templates
Smoothed images
Single subject GLM
Single subject GLM
Hemodynamic Response Function
Design matrix,Covariates
Group Analysis
Contrast maps
BP measurement
Threshold
Activation map
Effect/Correlation map
BP machine
Machine setup
Subject’s physiological reaction
Covariates