From genetics, health
27
From genetics, health Fourth Quarter & Full Year 2020 Financial Results 02 | 17 | 21
Transcript of From genetics, health

From genetics, healthFourth Quarter & Full Year 2020 Financial Results 02 | 17 | 21
© 2021 Invitae Corporation. All Rights Reserved. 2
Safe harbor statementThis presentation contains forward-looking statements within the meaning of the Private Securities Litigation Reform Act of 1995, including statements relating to the company’s belief regarding the value and leverage of its global, diversified business; the company’s future results, including anticipated 2021 revenue and expected future annual revenue growth targets; the company’s beliefs regarding its ability to deliver sustained growth and the drivers of its growth; the benefits and value of customer relationships and the information the company provides; the company’s beliefs regarding its ability to execute its business strategy; and the benefits and importance of the company’s recent studies, research and collaborations. Forward-looking statements are subject to risks and uncertainties that could cause actual results to differ materially, and reported results should not be considered as an indication of future performance. These risks and uncertainties include, but are not limited to: the impact of COVID-19 on the company, and the effectiveness of the efforts it has taken or may take in the future in response thereto; the company's ability to continue to grow its business, including internationally; the loss of important customer relationships; the company’s ability to compete; the company's failure to manage growth effectively; the company's need to scale its infrastructure in advance of demand for its tests and to increase demand for its tests; the risk that the company may not obtain or maintain sufficient levels of reimbursement for its tests; thecompany's failure to successfully integrate or fully realize the anticipated benefits of acquired businesses; risks associated with litigation; the company's ability to use rapidly changing genetic data to interpret test results accurately and consistently; the applicability of clinical research results to actual outcomes; the success of collaborations; security breaches, loss of data and other disruptions; laws and regulations applicable to the company's business; and the other risks set forth in the company's Quarterly Report on Form 10-Q for the quarter ended September 30, 2020. These forward-looking statements speak only as of the date hereof, and Invitae Corporation disclaims any obligation to update these forward-looking statements.

© 2021 Invitae Corporation. All Rights Reserved.
Non-GAAP financial measurements
3
To supplement Invitae's consolidated financial statements prepared in accordance with generally accepted accounting principles in the United States (GAAP), the company is providing several non-GAAP measures, including non-GAAP gross profit, non-GAAP cost of revenue, non-GAAP operating expense, including non-GAAP research and development, non-GAAP selling and marketing, non-GAAP general and administrative and non-GAAP other income (expense), net, as well as non-GAAP net loss and non-GAAP net loss per share and non-GAAP cash burn. These non-GAAP financial measures are not based on any standardized methodology prescribed by GAAP and are not necessarily comparable to similarly-titled measures presented by other companies. Management believes these non-GAAP financial measures are useful to investors in evaluating the company's ongoing operating results and trends.
Management is excluding from some or all of its non-GAAP operating results (1) amortization of acquired intangible assets, (2) acquisition-related stock-based compensation, (3) post-combination expense related to the acceleration of equity grants or bonus payments in connection with business combinations, (4) adjustments to the fair value of certain acquisition-related assets and liabilities and (5) acquisition-related income tax benefits. These non-GAAP financial measures are limited in value because they exclude certain items that may have a material impact on the company’s reported financial results. Management accounts for this limitation by analyzing results on a GAAP basis as well as a non-GAAP basis and also by providing GAAP measures in the company's public disclosures.
Cash burn excludes (1) changes in marketable securities, (2) cash received from equity financings, (3) proceeds from issuance of debt, and (4) cash received from exercises of warrants. Management believes cash burn is a liquidity measure that provides useful information to management and investors about the amount of cash consumed by the operations of the business. A limitation of using this non-GAAP measure is that cash burn does not represent the total change in cash, cash equivalents, and restricted cash for the period because it excludes cash provided by or used for other operating, investing or financing activities. Management accounts for this limitation by providing information about the company's operating, investing and financing activities in the statements of cash flows in the consolidated financial statements in the company's most recent Quarterly Report on Form 10-Q and Annual Report on Form 10-K and by presenting net cash provided by (used in) operating, investing and financing activities as well as the net increase or decrease in cash, cash equivalents and restricted cash in its reconciliation of cash burn.
In addition, other companies, including companies in the same industry, may not use the same non-GAAP measures or may calculate these metrics in a different manner than management or may use other financial measures to evaluate their performance, all of which could reduce the usefulness of these non-GAAP measures as comparative measures. Because of these limitations, the company's non-GAAP financial measures should not be considered in isolation from, or as a substitute for, financial information prepared in accordance with GAAP. Investors are encouraged to review the non-GAAP reconciliations provided in the tables below.

© 2021 Invitae Corporation. All Rights Reserved.
Consistent execution as we scale*
4
COVID-19
2015 2016 2017 2018 2019 2020
$100M
$60M
$40M
$20M
$80M
*Depicts quarterly results for the past five years
RevenueCOVID-19
250K
200K
150K
100K
50K
2015 2016 2017 2018 2019 2020
Volume

Q4 & FY 2020 Financials
© 2021 Invitae Corporation. All Rights Reserved. 6
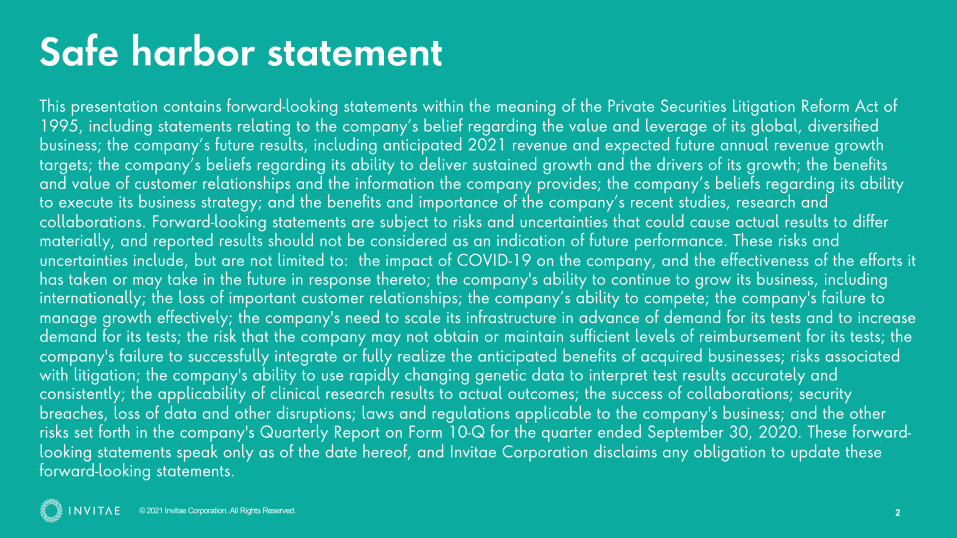
Generated revenue of$100.4 million in Q4 2020Reported $279.6 million in annual revenue in 2020, representing a 29% increase year-over-year
COVID-19
2015 2016 2017 2018 2019 2020
Revenue*
20K
40K
60K
80K
100K
*Depicts quarterly results for the past five years

© 2021 Invitae Corporation. All Rights Reserved.
Post-acquisition revenue breakdown
7
Test revenue: Recognized at time of report delivery
ArcherDX reactions: Recognized at time unit shipped to customer
Invitae other revenue: Multiple deliverables recognized at time of delivery or ratably over time of service
ArcherDX other revenue: Milestones recognized under percentage-of-completion accounting
Revenue breakdown (in thousands)
Test revenue
Invitae and ArcherDX test revenue $263,962
ArcherDX reactions $8,348
Test revenue $272,310*
Other revenue
Invitae other $5,480
ArcherDX other $1,808
Other revenue $7,288*
FY 2020 revenue $279,598
*Only “Test revenue” and “Other revenue” lines will be presented on the Income Statement.

© 2021 Invitae Corporation. All Rights Reserved. 8
Billable volume of 238,000 in Q4 2020Reported ~659,000 in billable volume in 2020, representing a 41% increase year-over-year
COVID-19
50K
2015 2016 2017 2018 2019 2020
Volume*
100K
150K
200K
250K
*Depicts quarterly results for the past five years
© 2021 Invitae Corporation. All Rights Reserved.
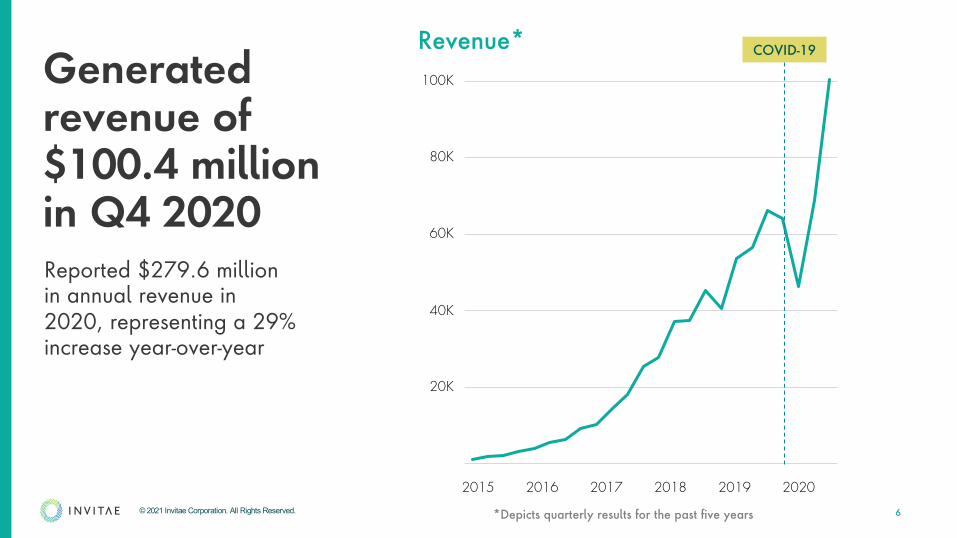
Post-acquisition breakdown of volume
9
A billable unit represents an event that includes individual test reports released and individual reactions shipped
Volume breakdown (in thousands)
Q1-Q3 2020 billable volume
Q1 legacy Invitae volume 151
Q2 legacy Invitae volume 113
Q3 legacy Invitae volume 157
Q1-Q3 2020 total billable volume 421
Q4 2020 billable volume
Q4 legacy Invitae volume 188
Q4 legacy ArcherDX volume 50
Q4 2020 total billable volume 238
FY 2020 volume 659
© 2021 Invitae Corporation. All Rights Reserved. 10
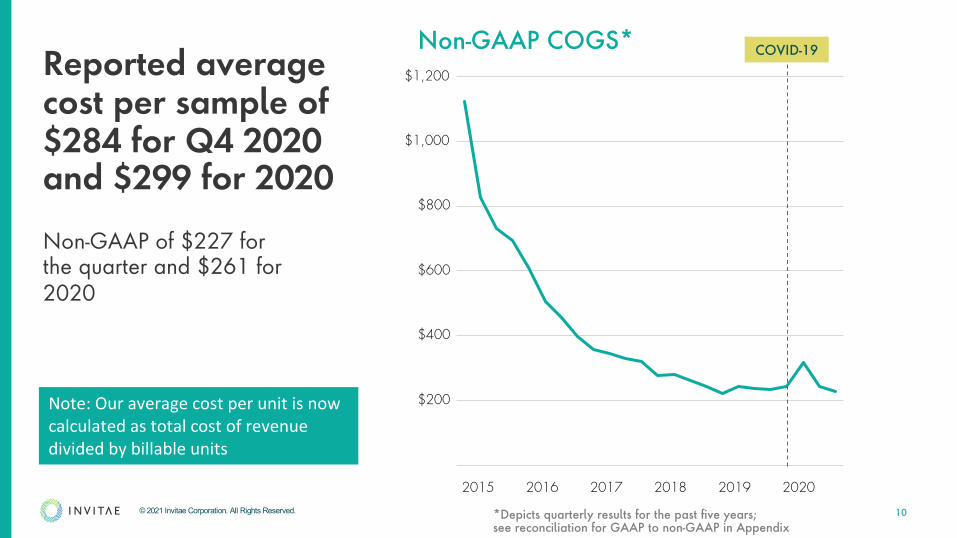
Reported average cost per sample of $284 for Q4 2020 and $299 for 2020
$1,200
$800
$600
$400
$200
$1,000
Non-GAAP of $227 for the quarter and $261 for 2020
Non-GAAP COGS*
2015 2016 2017 2018 2019 2020
COVID-19
Note: Our average cost per unit is now calculated as total cost of revenue divided by billable units
*Depicts quarterly results for the past five years; see reconciliation for GAAP to non-GAAP in Appendix

© 2021 Invitae Corporation. All Rights Reserved. 11
Reported gross profit of $32.2 million in Q4 2020 and $81.3 million in 2020
COVID-19
$50M
$30M
$20M
$10M
$0M
$40M
Non-GAAP gross profit of $45.5 million for Q4 and $106.8 million for 2020
GAAP gross margin of 32% in Q4 2020● Non-GAAP gross margin of 45%
for the quarter
Continue to target 50% gross margin goal into 2021
Non-GAAP Gross Profit*
2015 2016 2017 2018 2019 2020
*Depicts quarterly results for the past five years;see reconciliation for GAAP to non-GAAP in Appendix

© 2021 Invitae Corporation. All Rights Reserved.
Achieved operating expense goals*
12
● Operating expense, excluding cost of revenue, was $363.7 million in Q4 2020 and $733.5 million in 2020○ Non-GAAP operating expense was $145.9 million in Q4 2020 and $456.1 million
in 2020
● Net loss was $241.0 million, or $1.34 net loss per share, in Q4 2020, and $608.9 million, or a $4.52 net loss per share, in 2020○ Non-GAAP net loss was $113.1 million, or $0.63 non-GAAP net loss per share in
Q4 2020 and $373.9 million, or a $2.78 net less per share in 2020
● Reduced the spend for base business, excluding acquisitions and ArcherDX spend in Q4 2020
*See reconciliation for GAAP to non-GAAP in Appendix
© 2021 Invitae Corporation. All Rights Reserved.
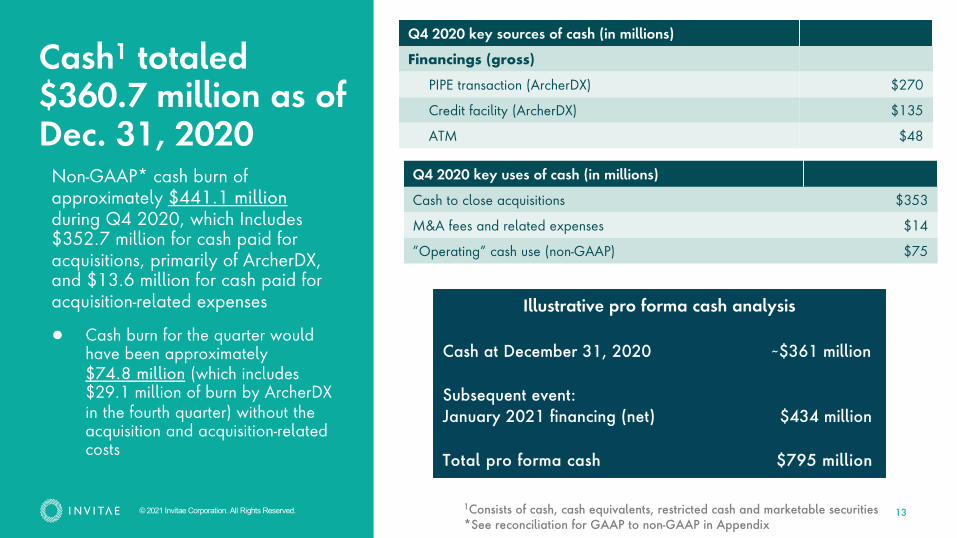
Cash1 totaled $360.7 million as of Dec. 31, 2020
13
Non-GAAP* cash burn of approximately $441.1 millionduring Q4 2020, which Includes $352.7 million for cash paid for acquisitions, primarily of ArcherDX, and $13.6 million for cash paid for acquisition-related expenses
● Cash burn for the quarter would have been approximately $74.8 million (which includes $29.1 million of burn by ArcherDXin the fourth quarter) without the acquisition and acquisition-related costs
1Consists of cash, cash equivalents, restricted cash and marketable securities
Q4 2020 key sources of cash (in millions)
Financings (gross)
PIPE transaction (ArcherDX) $270
Credit facility (ArcherDX) $135
ATM $48
Q4 2020 key uses of cash (in millions)
Cash to close acquisitions $353
M&A fees and related expenses $14
”Operating” cash use (non-GAAP) $75
Illustrative pro forma cash analysis
Cash at December 31, 2020 ~$361 million
Subsequent event: January 2021 financing (net) $434 million
Total pro forma cash $795 million
*See reconciliation for GAAP to non-GAAP in Appendix
© 2021 Invitae Corporation. All Rights Reserved. 14
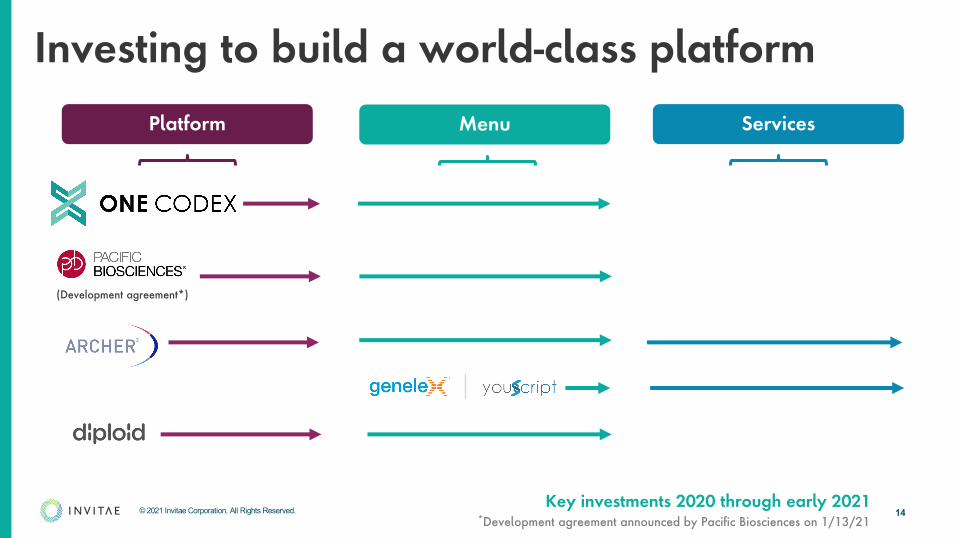
Investing to build a world-class platform
Menu ServicesPlatform
(Development agreement*)
Key investments 2020 through early 2021*Development agreement announced by Pacific Biosciences on 1/13/21
© 2021 Invitae Corporation. All Rights Reserved.
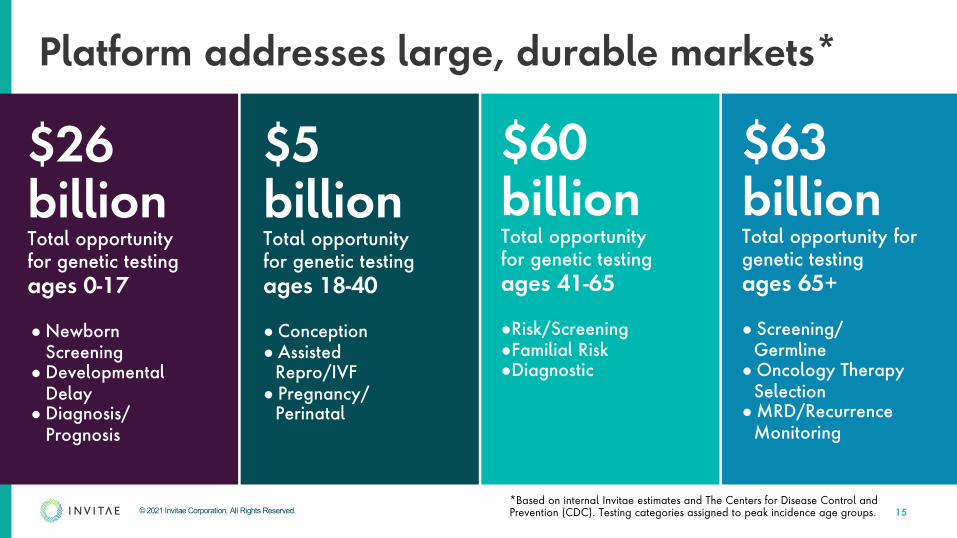
$26 billionTotal opportunity for genetic testing ages 0-17
● Newborn Screening
● Developmental Delay
● Diagnosis/ Prognosis
$5billionTotal opportunity for genetic testing ages 18-40
● Conception ● Assisted
Repro/IVF● Pregnancy/
Perinatal
$60 billionTotal opportunity for genetic testing ages 41-65
●Risk/Screening●Familial Risk●Diagnostic
$63 billion Total opportunity for genetic testing ages 65+
● Screening/ Germline
● Oncology Therapy Selection
● MRD/Recurrence Monitoring
*Based on internal Invitae estimates and The Centers for Disease Control and Prevention (CDC). Testing categories assigned to peak incidence age groups.
Platform addresses large, durable markets*
15

© 2021 Invitae Corporation. All Rights Reserved.
A strategy to reach billions
16
Expand content
Improve customer
experience
Drive volume
Attract partners Growth
Lowercosts
Lower prices

© 2021 Invitae Corporation. All Rights Reserved.
Applying that strategy to scaling operations
Product launch cycles
Innovate on behalf of customers
Scalable global “Ops”*
Production and data partners*
Operating leverage
LowerCOGS
Improve cash flow
17*Adaptable, quick strike, precise, multi-nodal dynamic
Customers firstSpeed matters Cash generation fuels investment
Org development Reimagine the possibilities
© 2021 Invitae Corporation. All Rights Reserved.
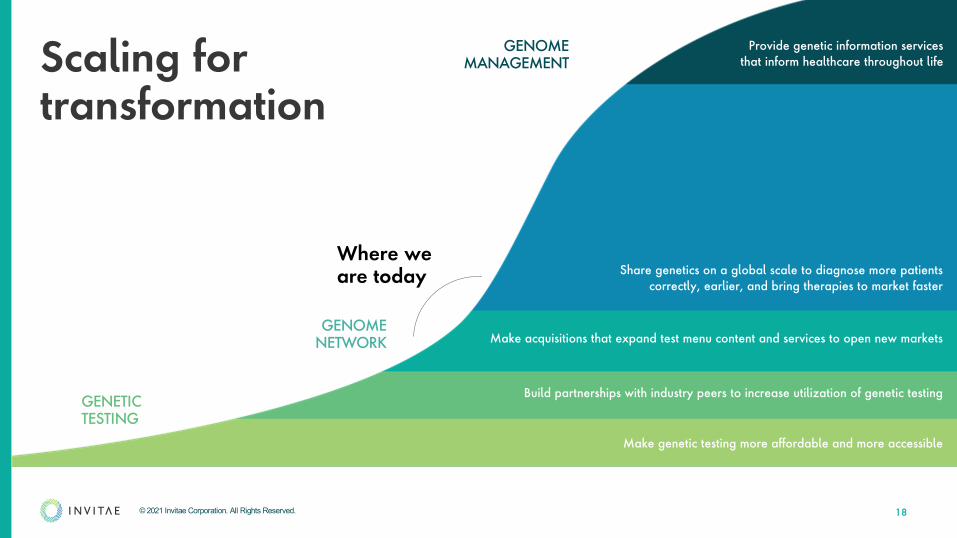
Provide genetic information services that inform healthcare throughout life
Share genetics on a global scale to diagnose more patients correctly, earlier, and bring therapies to market faster
Build partnerships with industry peers to increase utilization of genetic testing
Make acquisitions that expand test menu content and services to open new markets
Make genetic testing more affordable and more accessible
Scaling for transformation
Where we are today
GENOME NETWORK
GENETIC TESTING
GENOME MANAGEMENT
18
© 2021 Invitae Corporation. All Rights Reserved.
Right time, right plan, right team
Disruptive platform transforming genetics
into better health
Proven leader driving high growth and industry impact
Ecosystem that drives better outcomes for all
19

© 2021 Invitae Corporation. All Rights Reserved.
Q&A


© 2021 Invitae Corporation. All Rights Reserved.
Appendix
22
© 2021 Invitae Corporation. All Rights Reserved.
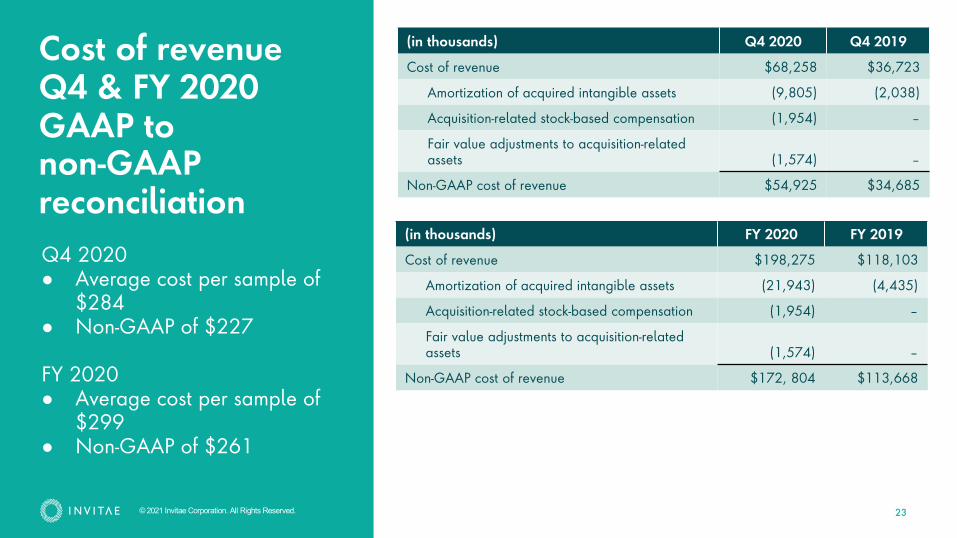
Cost of revenue Q4 & FY 2020 GAAP to non-GAAP reconciliation
23
(in thousands) Q4 2020 Q4 2019
Cost of revenue $68,258 $36,723
Amortization of acquired intangible assets (9,805) (2,038)
Acquisition-related stock-based compensation (1,954) –
Fair value adjustments to acquisition-related assets (1,574) –
Non-GAAP cost of revenue $54,925 $34,685
Q4 2020● Average cost per sample of
$284● Non-GAAP of $227
FY 2020● Average cost per sample of
$299 ● Non-GAAP of $261
(in thousands) FY 2020 FY 2019
Cost of revenue $198,275 $118,103
Amortization of acquired intangible assets (21,943) (4,435)
Acquisition-related stock-based compensation (1,954) –
Fair value adjustments to acquisition-related assets (1,574) –
Non-GAAP cost of revenue $172, 804 $113,668
© 2021 Invitae Corporation. All Rights Reserved.
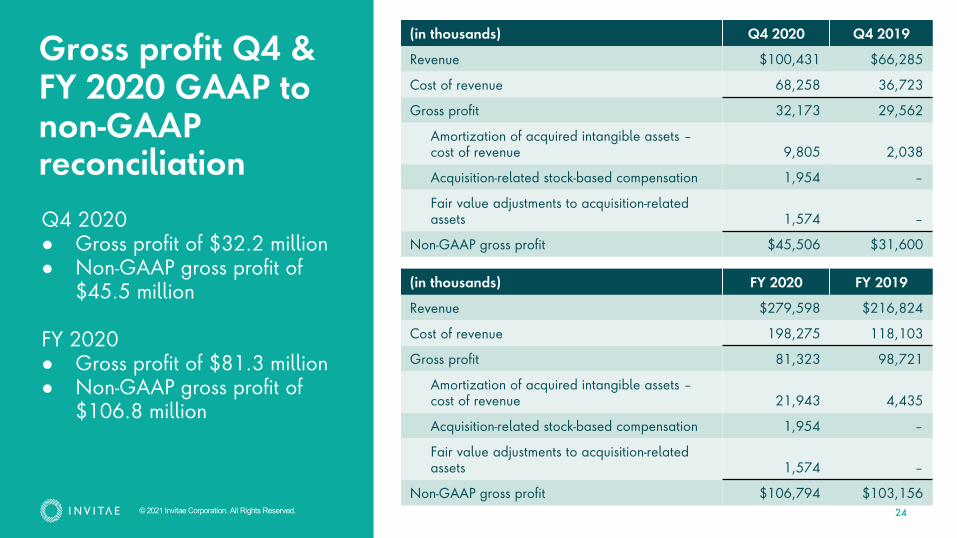
Gross profit Q4 & FY 2020 GAAP to non-GAAP reconciliation
24
(in thousands) Q4 2020 Q4 2019
Revenue $100,431 $66,285
Cost of revenue 68,258 36,723
Gross profit 32,173 29,562
Amortization of acquired intangible assets –cost of revenue 9,805 2,038
Acquisition-related stock-based compensation 1,954 –
Fair value adjustments to acquisition-relatedassets 1,574 –
Non-GAAP gross profit $45,506 $31,600Q4 2020● Gross profit of $32.2 million ● Non-GAAP gross profit of
$45.5 million
FY 2020● Gross profit of $81.3 million ● Non-GAAP gross profit of
$106.8 million
(in thousands) FY 2020 FY 2019
Revenue $279,598 $216,824
Cost of revenue 198,275 118,103
Gross profit 81,323 98,721
Amortization of acquired intangible assets –cost of revenue 21,943 4,435
Acquisition-related stock-based compensation 1,954 –
Fair value adjustments to acquisition-relatedassets 1,574 –
Non-GAAP gross profit $106,794 $103,156
© 2021 Invitae Corporation. All Rights Reserved.
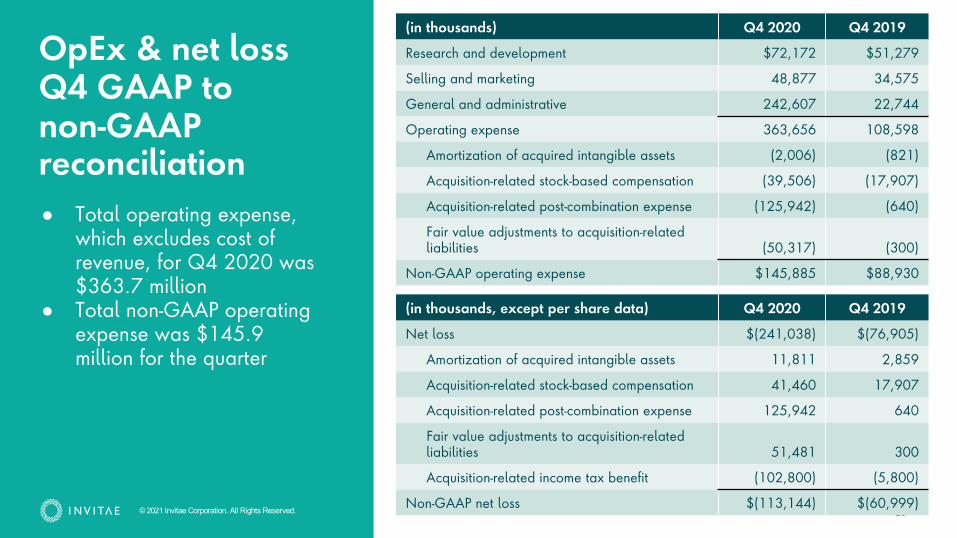
OpEx & net loss Q4 GAAP to non-GAAP reconciliation
25
(in thousands) Q4 2020 Q4 2019
Research and development $72,172 $51,279
Selling and marketing 48,877 34,575
General and administrative 242,607 22,744
Operating expense 363,656 108,598
Amortization of acquired intangible assets (2,006) (821)
Acquisition-related stock-based compensation (39,506) (17,907)
Acquisition-related post-combination expense (125,942) (640)
Fair value adjustments to acquisition-related liabilities (50,317) (300)
Non-GAAP operating expense $145,885 $88,930
(in thousands, except per share data) Q4 2020 Q4 2019
Net loss $(241,038) $(76,905)
Amortization of acquired intangible assets 11,811 2,859
Acquisition-related stock-based compensation 41,460 17,907
Acquisition-related post-combination expense 125,942 640
Fair value adjustments to acquisition-relatedliabilities 51,481 300
Acquisition-related income tax benefit (102,800) (5,800)
Non-GAAP net loss $(113,144) $(60,999)
● Total operating expense, which excludes cost of revenue, for Q4 2020 was $363.7 million
● Total non-GAAP operating expense was $145.9 million for the quarter
© 2021 Invitae Corporation. All Rights Reserved.
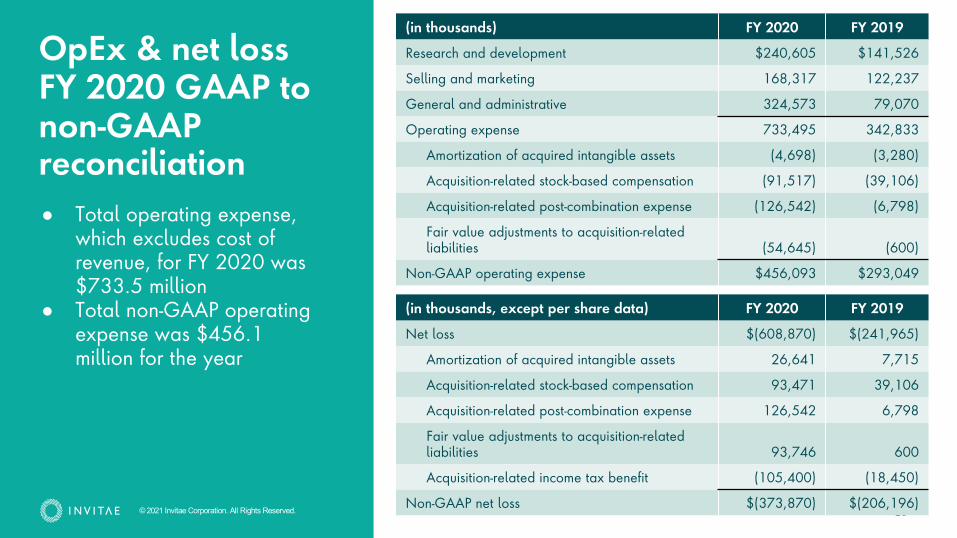
OpEx & net loss FY 2020 GAAP to non-GAAP reconciliation
26
(in thousands) FY 2020 FY 2019
Research and development $240,605 $141,526
Selling and marketing 168,317 122,237
General and administrative 324,573 79,070
Operating expense 733,495 342,833
Amortization of acquired intangible assets (4,698) (3,280)
Acquisition-related stock-based compensation (91,517) (39,106)
Acquisition-related post-combination expense (126,542) (6,798)
Fair value adjustments to acquisition-related liabilities (54,645) (600)
Non-GAAP operating expense $456,093 $293,049
(in thousands, except per share data) FY 2020 FY 2019
Net loss $(608,870) $(241,965)
Amortization of acquired intangible assets 26,641 7,715
Acquisition-related stock-based compensation 93,471 39,106
Acquisition-related post-combination expense 126,542 6,798
Fair value adjustments to acquisition-relatedliabilities 93,746 600
Acquisition-related income tax benefit (105,400) (18,450)
Non-GAAP net loss $(373,870) $(206,196)
● Total operating expense, which excludes cost of revenue, for FY 2020 was $733.5 million
● Total non-GAAP operating expense was $456.1 million for the year
© 2021 Invitae Corporation. All Rights Reserved.
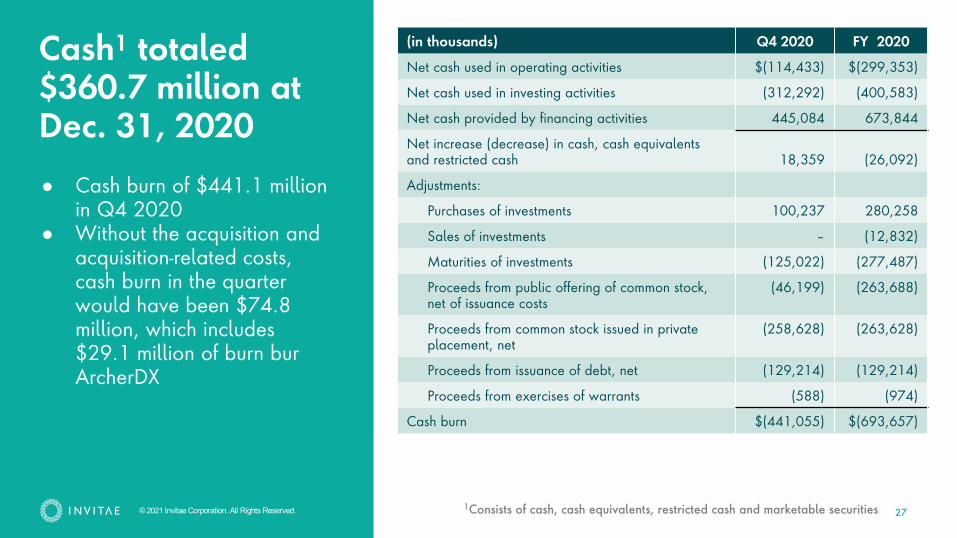
Cash1 totaled $360.7 million at Dec. 31, 2020
27
(in thousands) Q4 2020 FY 2020
Net cash used in operating activities $(114,433) $(299,353)
Net cash used in investing activities (312,292) (400,583)
Net cash provided by financing activities 445,084 673,844
Net increase (decrease) in cash, cash equivalents and restricted cash 18,359 (26,092)
Adjustments:
Purchases of investments 100,237 280,258
Sales of investments – (12,832)
Maturities of investments (125,022) (277,487)
Proceeds from public offering of common stock, net of issuance costs
(46,199) (263,688)
Proceeds from common stock issued in private placement, net
(258,628) (263,628)
Proceeds from issuance of debt, net (129,214) (129,214)
Proceeds from exercises of warrants (588) (974)
Cash burn $(441,055) $(693,657)
● Cash burn of $441.1 million in Q4 2020
● Without the acquisition and acquisition-related costs, cash burn in the quarter would have been $74.8 million, which includes $29.1 million of burn bur ArcherDX
1Consists of cash, cash equivalents, restricted cash and marketable securities