
FROM CONVENTIONAL TO IT BASED VISUAL … · FROM CONVENTIONAL TO IT BASED VISUAL ... From...
27
www.itcon.org - Journal of Information Technology in Construction - ISSN 1874-4753 ITcon Vol. 22 (2017), Tezel & Aziz, pg. 220 FROM CONVENTIONAL TO IT BASED VISUAL MANAGEMENT: A CONCEPTUAL DISCUSSION FOR LEAN CONSTRUCTION SUBMITTED: May 2016 REVISED: June 2017 PUBLISHED: October 2017 at http://www.itcon.org/2017/12 EDITOR: Turk Ž. Algan Tezel, Research Fellow, School of the Built Environment, University of Salford; Email: [email protected] Zeeshan Aziz, Senior Lecturer, School of the Built Environment, University of Salford; Email: [email protected] SUMMARY: Lean construction and construction automation are two of the important efforts to improve the performance of the construction industry. However, apart from a small number of scholarly articles and implementation prototypes, the lean and digital construction movements seem to be largely running independent of each other. This paper aims at exploring those connections between Visual Management (VM), a fundamental information management strategy in lean construction, and emerging technologies, demonstrating the synergy between the two concepts over potential implementation scenarios and establishing their conceptual connections in construction. Consequently, the hypothesis of the paper is there is a significant synergy between emerging technologies (construction automation) and visual/sensory information management strategies (Visual Management) in lean construction. The hypothesis is explored by (i) discussing how emerging technologies can support conventional VM tools and techniques and (ii) presenting a conceptual architecture to integrate emerging technologies, such as the Internet of Things, Augmented Reality, context aware and mobile computing, the use of drones and quadcopters, auto identification (AutoID) systems and laser scanning, to support lean construction and VM on construction sites. Futuristic scenarios for the implementation of the context-aware VM in application areas such as production control, production levelling, quality control, project planning and control, plant maintenance and safety control are examined from a lean construction perspective, alongside the presentation of a higher-level implementation architecture to integrate various VM and emerging technology components to support the implementation in a holistic picture. The use of such scenario based approach was found useful in summarising the technology components, their interconnections and possible implementation areas in relation with VM. This paper demonstrates how the integration of conventional and IT based visual management approaches is within reach and holds the potential to enhance the construction and maintenance phase of complex, large-scale construction projects by reviewing the synergies between operational VM concepts and IT. KEYWORDS: Lean Construction, Visual Management, BIM, Mobile Computing, Context Awareness, Internet of Things, Augmented Reality REFERENCE: Algan Tezel, Zeeshan Aziz (2017). From conventional to IT based visual management: a conceptual discussion for lean construction. Journal of Information Technology in Construction (ITcon), Vol. 22, pg. 220-246, http://www.itcon.org/2017/12 COPYRIGHT: © 2017 The author(s). This is an open access article distributed under the terms of the Creative Commons Attribution 4.0 International (http://creativecommons.org/licenses/by/4.0/), which permits unrestricted use, distribution, and reproduction in any medium, provided the original work is properly cited.
Transcript of FROM CONVENTIONAL TO IT BASED VISUAL … · FROM CONVENTIONAL TO IT BASED VISUAL ... From...

www.itcon.org - Journal of Information Technology in Construction - ISSN 1874-4753
ITcon Vol. 22 (2017), Tezel & Aziz, pg. 220
FROM CONVENTIONAL TO IT BASED VISUAL MANAGEMENT: A CONCEPTUAL DISCUSSION FOR LEAN CONSTRUCTION
SUBMITTED: May 2016
REVISED: June 2017
PUBLISHED: October 2017 at http://www.itcon.org/2017/12
EDITOR: Turk Ž.
Algan Tezel, Research Fellow,
School of the Built Environment, University of Salford;
Email: [email protected]
Zeeshan Aziz, Senior Lecturer,
School of the Built Environment, University of Salford;
Email: [email protected]
SUMMARY: Lean construction and construction automation are two of the important efforts to improve the
performance of the construction industry. However, apart from a small number of scholarly articles and
implementation prototypes, the lean and digital construction movements seem to be largely running independent
of each other. This paper aims at exploring those connections between Visual Management (VM), a fundamental
information management strategy in lean construction, and emerging technologies, demonstrating the synergy
between the two concepts over potential implementation scenarios and establishing their conceptual connections
in construction. Consequently, the hypothesis of the paper is there is a significant synergy between emerging
technologies (construction automation) and visual/sensory information management strategies (Visual
Management) in lean construction. The hypothesis is explored by (i) discussing how emerging technologies can
support conventional VM tools and techniques and (ii) presenting a conceptual architecture to integrate emerging
technologies, such as the Internet of Things, Augmented Reality, context aware and mobile computing, the use of
drones and quadcopters, auto identification (AutoID) systems and laser scanning, to support lean construction
and VM on construction sites. Futuristic scenarios for the implementation of the context-aware VM in application
areas such as production control, production levelling, quality control, project planning and control, plant
maintenance and safety control are examined from a lean construction perspective, alongside the presentation of
a higher-level implementation architecture to integrate various VM and emerging technology components to
support the implementation in a holistic picture. The use of such scenario based approach was found useful in
summarising the technology components, their interconnections and possible implementation areas in relation
with VM. This paper demonstrates how the integration of conventional and IT based visual management
approaches is within reach and holds the potential to enhance the construction and maintenance phase of complex,
large-scale construction projects by reviewing the synergies between operational VM concepts and IT.
KEYWORDS: Lean Construction, Visual Management, BIM, Mobile Computing, Context Awareness, Internet of
Things, Augmented Reality
REFERENCE: Algan Tezel, Zeeshan Aziz (2017). From conventional to IT based visual management: a
conceptual discussion for lean construction. Journal of Information Technology in Construction (ITcon), Vol. 22,
pg. 220-246, http://www.itcon.org/2017/12
COPYRIGHT: © 2017 The author(s). This is an open access article distributed under the terms of the Creative
Commons Attribution 4.0 International (http://creativecommons.org/licenses/by/4.0/),
which permits unrestricted use, distribution, and reproduction in any medium, provided
the original work is properly cited.

ITcon Vol. 22 (2017), Tezel & Aziz, pg. 221
1. INTRODUCTION
Starting from the late 1930s, an alternative and more dynamic production mind-set to mitigate the weaknesses of
mass production and ultimately to catch up with their Western competitors has been successfully developed at
Toyota Corporation in Japan out of several constraints and necessities (Fujimoto, 1999). The constant growth of
Toyota was essentially attributed to this production mind-set. Therefore, it has increasingly been a subject of
interest to scholars and practitioners for more than 40 years (Holweg, 2007). Due to its clear focus on the reduction
of production wastes and maximizing resource utilization, the production system at Toyota was broadly dubbed
as the lean production system (Womack et al, 1990). With its many components, the lean production mind-set has
been spreading from the automotive industry to many other industries such as healthcare, services, construction
and IT (Koskela, 1992, Bowen and Youngdahl, 1998, Poppendieck and Poppendieck, 2003, Poksinska, 2010). The
reflections of the lean production system on the construction industry have been discussed under the term “lean
construction” since the early 1990s (Salem et al, 2005).
One of the fundamental elements of the lean production system is Visual Management (VM) (Liker, 2004). VM
is a management strategy that emphasises using sensory information systems to increase process transparency or
the communication ability of process elements (Tezel et al, 2015). VM and its tools are used to realize,
communicate and coordinate the lean production system’s targets in the workplace (Galsworth, 2005). Many of
the operational information needs are addressed within the VM strategy. For instance, the lean idea of pull-based
production (as opposed to the “push” in mass production) is realized and coordinated in the field by the exchange
of a certain amount of simple cards or artefacts, called kanbans (Monden, 1998). To limit work-in-progress and to
better control production rates, production is not allowed without the exchange of a kanban card as a production
signal and a demand from the succeeding work unit. When the management issues a certain amount of kanban
cards to the work units by the planned production rate (or takt rate), the control of the production at the operational
level becomes more transparent and is self-executed by the workforce. Kanban cards are one of the reflections of
the VM strategy on the lean production system.
Recently, IT tools have been actively used to collect construction field data to support lean construction and VM
(Barbosa et al. 2013, Kirchbach et al, 2014). Also, while keeping their core purpose intact, some of the
conventional VM tools and lean construction techniques have been successfully converted into IT-based
prototypes (Sacks et al, 2010a, Dave et al, 2014). In those prototypes, information visualization interfaces (often
BIM models) are displayed on large touch-screens in the field and supported by a lean construction engine (i.e. a
virtual kanban system linked the Last Planner System by Ballard (2000)) connected to the existing main-servers
and ERP systems. Although useful, those prototypes do not fully illustrate the extensive potential in the combined
use of lean construction techniques and emerging IT systems.
Lean construction, as a process focused approach, and emerging IT tools have the potential to transform and
facilitate construction operations. However, conceptual works discussing the connections between conventional
VM and lean construction techniques, and emerging technologies for the construction industry is still very limited.
Apart from a small number of scholarly articles and implementation prototypes, the lean and digital construction
movements seem to be largely running independent of each other. This paper aims at exploring those connections
between VM in lean construction and emerging IT systems. This is done by (i) discussing how emerging
technologies can support conventional VM tools and techniques and (ii) presenting a conceptual architecture to
integrate emerging technologies, such as the Internet of Things, Augmented Reality, context aware and mobile
computing, the use of drones and quadcopters, auto identification (AutoID) systems and laser scanning, after a
detailed review of the existing VM systems and related technologies. Futuristic scenarios of the implementation
of the context-aware VM in application areas such as production control, production levelling, quality control,
project planning and control, plant maintenance and safety control are discussed from a lean construction
perspective. Also, the relations and synergies between VM and emerging IT systems have been illustrated. The
focus of the paper is mainly limited to the construction and maintenance phase of complex, large-scale construction
projects.
2. VISUAL MANAGEMENT AND VISUAL TOOLS
Like many other lean production concepts, the literature on VM and its tools is mostly directed to practitioners
with an emphasis on “how” rather than “what” (Saurin et al, 2012). It is partly due to their intuitive design features

ITcon Vol. 22 (2017), Tezel & Aziz, pg. 222
and relative simplicity in the way they function. VM is essentially an information management strategy in the lean
production system with its many peculiar visual tools used in different managerial efforts, such as production
management, health and safety management, quality management, workplace management, human-resources
management etc (Suzaki, 1993, Liff and Posey, 2004, Parry and Turner, 2006). The direct effect of the adoption
of the VM strategy is an increase in the communication ability of process elements or process transparency
(Formoso et al, 2002). An increased process transparency can lead to a greater consistency in production outputs
(both process times and process end-products), simplification and coherence in decision making and production
control, increased work coordination, easier identification of problems and deviations, stimulation of contacts
among work units and broadened employee engagement and autonomy (Moser and Dos Santos, 2003).
VM is realized through its visual tools and there are four distinctive characteristics of those VM tools (Greif, 1991,
Suzaki, 1993, Galsworth, 2005); (i) the information in VM tools are presented to create information fields in the
workplace from which people can freely pull information in a self-service fashion, (ii) the information need is
determined ahead of time to prevent information deficiencies (pre-emptive approach), (iii) information display is
integrated into process elements (space, machinery, equipment, components, materials, tools, gadgets etc.), in the
direct interface between the operator and the process element (not in a file or server far from the production field),
and (iv) the communication is simple and relies little or none on verbal or textual information. Galsworth (1997)
further classifies VM tools as:
Visual indicator; just displays information and listening to its message depends solely on people’s
initiatives (i.e. safety signs),
Visual signal: grabs attention through signals and expects people to listen to the message. The
consequences of not listening to its message can be serious (i.e. traffic signs),
Visual control: limits, regulates and guides human response in terms size, direction, quantity,
timing etc. The human control of disobedience to the message is very minimal (i.e. traffic lanes or
kanban cards),
Visual guarantee: explicitly warns people of or totally controls/blocks critical cases. The human
control of disobedience is practically none (i.e. automatic crane stoppages under adverse weather
conditions). Those systems prevent human mistakes from turning into defects. They are sometimes
called poke-yoke systems.
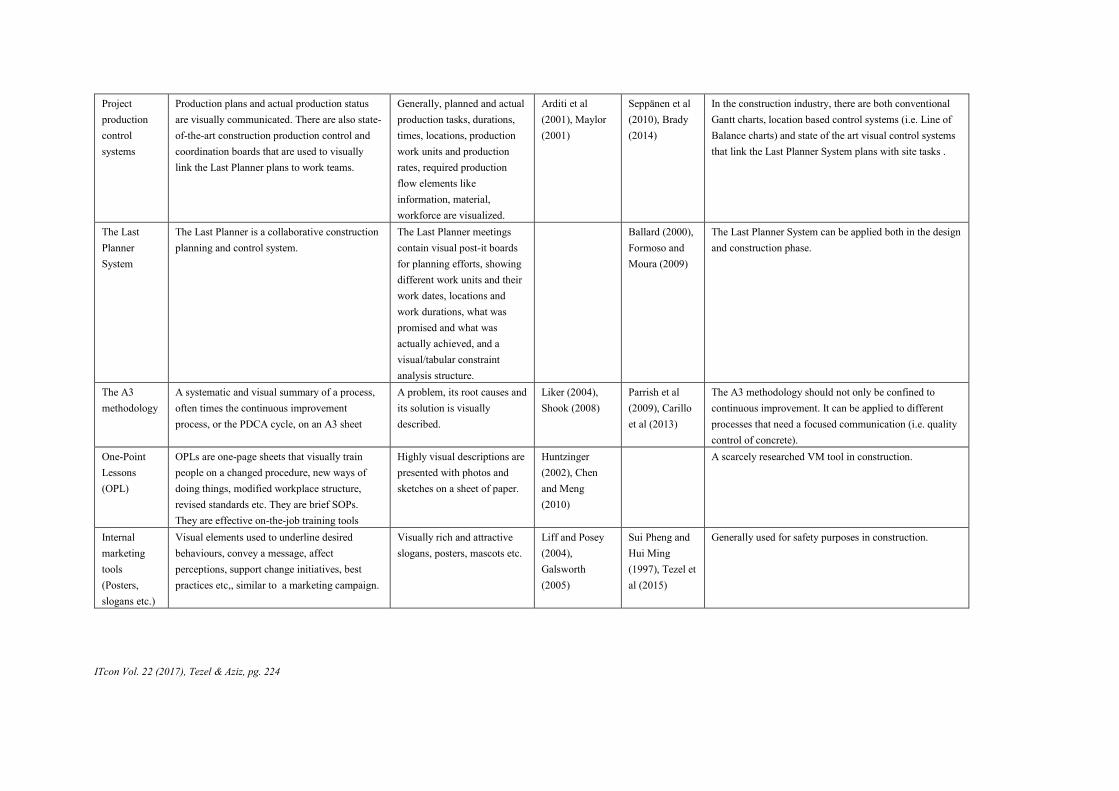
Table. 1 shows the commonly used conventional VM tools with their visualization elements and reflections on the
construction industry.

ITcon Vol. 22 (2017), Tezel & Aziz, pg. 223
TABLE. 1: Conventional Visual Management systems used in production and construction
VM
tools/systems
Definition Visualisation elements Production
management
references
Construction
management
references
General remarks
Poka-Yokes Electro-mechanical systems used either to warn
people of or to physically block/control
mistakes to increase process quality, overall
safety and to decrease production set-up times
Warning poka-yoke systems
are realised by integrated
sensory information to warn
people of process mistakes
before they turn into defects
of any sort. Control poka-
yokes are more automatic than
visual.
Shingo (1986),
Saurin et al
(2012)
Dos Santos and
Powell (1999),
Tommelein
(2008).
Despite its potential, a scarcely researched topic in
construction. It is highly related to integrating
information and control poka-yoke systems onto
construction components, materials, equipment, tools and
machinery.
Kanban
system
A visual control system used to signal a demand
(i.e. material, production, maintenance or safety
checks etc.) from the preceding work unit in a
“pull” fashion. Simple artefacts, such as cards or
tokens, are generally employed to realise those
signals.
Kanban signals generally
indicate the required work
type (production, maintenance
etc), where the work is
required, when the work is
required, by whom the work
is required.
Monden (1998),
Xanthopoulos et
al (2015)
Jang and Kim
(2007), Ko and
Kuo (2015)
Many successful kanban implementation cases in
construction can be found in the literature. Alongside
production, kanban has also been used to communicate
safety information on construction sites
Heijunka
boards
Visual boards that are used to level demand and
to control variability in production, material,
equipment use. It is often integrated with the
kanban system.
The demanded material,
equipment etc type, demand
volume or quantity, demand
rate or interval and demand
location are generally shown
on heijunka boards. An
operator levels those
demands.
Coleman and
Vaghefi (1994),
Hüttmeir et al
(2009)
Barbosa et al
(2013), Emuze
and Saurin
(2015),
Some successful examples of on-site concrete production
levelling and equipment demand levelling using heijunka
boards in construction can be found in the literature.
Andon
system
Audio-visual signalling boards used to take the
attention of supervisors to a possible or actual
disruption (i.e. quality, safety, information need
etc) in a production activity. Those disruptions
are often the subjects of continuous
improvement efforts.
The location and status of
production disruptions (i.e.
about to happen or already
happened) are generally
communicated.
Bamber and
Dale (2000),
Womack et al
(2009)
Kemmer et al.
(2006), Ko and
Kuo (2015).
Andon examples in construction are mostly from high-rise
building construction sites.
ITcon Vol. 22 (2017), Tezel & Aziz, pg. 224
Project
production
control
systems
Production plans and actual production status
are visually communicated. There are also state-
of-the-art construction production control and
coordination boards that are used to visually
link the Last Planner plans to work teams.
Generally, planned and actual
production tasks, durations,
times, locations, production
work units and production
rates, required production
flow elements like
information, material,
workforce are visualized.
Arditi et al
(2001), Maylor
(2001)
Seppänen et al
(2010), Brady
(2014)
In the construction industry, there are both conventional
Gantt charts, location based control systems (i.e. Line of
Balance charts) and state of the art visual control systems
that link the Last Planner System plans with site tasks .
The Last
Planner
System
The Last Planner is a collaborative construction
planning and control system.
The Last Planner meetings
contain visual post-it boards
for planning efforts, showing
different work units and their
work dates, locations and
work durations, what was
promised and what was
actually achieved, and a
visual/tabular constraint
analysis structure.
Ballard (2000),
Formoso and
Moura (2009)
The Last Planner System can be applied both in the design
and construction phase.
The A3
methodology
A systematic and visual summary of a process,
often times the continuous improvement
process, or the PDCA cycle, on an A3 sheet
A problem, its root causes and
its solution is visually
described.
Liker (2004),
Shook (2008)
Parrish et al
(2009), Carillo
et al (2013)
The A3 methodology should not only be confined to
continuous improvement. It can be applied to different
processes that need a focused communication (i.e. quality
control of concrete).
One-Point
Lessons
(OPL)
OPLs are one-page sheets that visually train
people on a changed procedure, new ways of
doing things, modified workplace structure,
revised standards etc. They are brief SOPs.
They are effective on-the-job training tools
Highly visual descriptions are
presented with photos and
sketches on a sheet of paper.
Huntzinger
(2002), Chen
and Meng
(2010)
A scarcely researched VM tool in construction.
Internal
marketing
tools
(Posters,
slogans etc.)
Visual elements used to underline desired
behaviours, convey a message, affect
perceptions, support change initiatives, best
practices etc,, similar to a marketing campaign.
Visually rich and attractive
slogans, posters, mascots etc.
Liff and Posey
(2004),
Galsworth
(2005)
Sui Pheng and
Hui Ming
(1997), Tezel et
al (2015)
Generally used for safety purposes in construction.

ITcon Vol. 22 (2017), Tezel & Aziz, pg. 225
Standard
operating
procedures
(SOP)
Instructions describing the optimum steps to
accomplish a work task.
Visualizing standard
operating procedures
containing information like
work sequences, production
rates and work-in-progress
levels.
Greif (1991), De
Treville et al
(2005)
Nakagawa
(2005), Mariz
et al (2012).
Visual
performance
boards
Key performance indicators (KPIs) of work
teams and workplace in general are shared in
special areas that are sometimes called obeya
rooms or performance areas for greater coverage
Target versus actual
performance figures are
shown together. Deviations
are highlighted clearly. Ways
to mitigate those deviations
are discussed and shown to
set a base for continuous
improvement efforts.
Suzaki (1993),
Kattman et al
(2012).
Salem et al.
(2005), Tezel et
al (2015)
Team meetings are held around those performance boards
(or in obeya rooms) to focus and trigger discussions.
5S A systematic workplace structuring and
housekeeping methodology, which refers to an
acronym for the “sorting”, “setting-in-order”,
“sweeping”, “standardizing” and “sustaining”
steps
Visual information of
workplace elements (space,
machinery, equipment, tools.
gadgets, materials, personnel)
on “what “, “where”,
“when”, “who” and “ how
many”. Visual cleaning
instructions, basic health and
safety checks and preventive
equipment/machinery
maintenance checks.
Osada (1991),
Hirano (1995)
Mastroianni
and
Abdelhamid
(2003),
Johansen and
Walter (2007)
The conventional 5S is hard to sustain, due to the highly
mobile and dynamic nature of construction sites.

ITcon Vol. 22 (2017), Tezel & Aziz, pg. 226
A key limitation in the existing (conventional) VM deployments within the construction industry has been that
they are designed primarily to deliver pre-programmed information, without extensively catering for the user
context and the dynamic site conditions. This could lead to a mismatch between what an application can deliver
and end-users’ real information requirements. In contrast to the existing static and pre-programmed VM
information provisioning, construction information flows are highly dynamic and incorporate multiple
perspectives of project team members. In that sense, the value of a VM system is in its ability to deliver the right
information to the right person at the right time, on an as-needed basis (Suzaki, 1993, Monden, 1998, Ortiz and
Park, 2011) to support lean construction efforts.
Many challenges in current construction processes in highly engineered and complex projects arise from poor
access to the right information at the right time to support critical decision making, resulting in a lack of co-
ordination and poor communications (Son et al, 2008). Construction drawings and operational data are often held
in an unstructured format and in disparate platforms (e.g. 2D CAD drawings, hand sketches of as-built conditions,
3D models, building photographs, satellite imagery, spread sheets, laser point clouds indicating as-built
information). Such information is often difficult to access or manage, resulting in considerable time spent on
accessing and retrieving relevant information. Despite recent technological improvements, managing a seamless
information flow between multiple stakeholders involved in a construction project is still a challenge. Construction
work is often characterized by errors, rework, lack of understanding of the project and processes, and conflicts.
Rapid and convenient access to relevant construction information, through improved awareness of user context
can lead to significant cost and time savings due to the accuracy and immediacy with which relevant project
information can be made available.
It is particularly challenging to extract that value and maintain this information flow on large, complex construction
sites where multiple trades work in different locations around the end product (constructed identity), under
different constraints. The main construction-site based information requirements from the construction production
planning and control perspective are shown in Table. 2 (Dave et al, 2014).
TABLE. 2: Construction information requirements for planning and control Information Requirements Information System Commonly Used Techniques/Technologies
Material Estimation, Inventory, Procurement Enterprise Resource Planning (ERP) systems
Equipment Asset management, resource booking, plant hire
(externally)
ERP systems
Manpower Human Resource Management, Subcontractor’s
payroll, ad-hoc
In most cases ad-hoc site based communication
Space Project Plans, Drawings and
Building Information Models
Currently no systems cater to the need of space
management for project execution
Design/Specs Design models (BIM, i.e. Architectural, Structural,
MEP), Drawings, Tendering and Estimating,
building regulations such as local or national
authorities
BIM systems and Tendering and Estimation
systems. Project extranets.
Predecessor A production management system Currently an ad-hoc verbal communication
system, or through
the Last Planner System’s collaborative
“huddle” meetings
External Conditions Weather forecast engines, safety management
system
These are indicative /predictive systems, but
their integration to the production system at the
task level may still be beneficial.

ITcon Vol. 22 (2017), Tezel & Aziz, pg. 227
A VM system could gain through integrating the information requirements with the elements of interactivity and
contextual awareness (e.g. user role, user location, engagement in specific tasks, areas of responsibility). This can
be achieved by increasing the automation level of a VM system. However, the degree of automation in VM
deployments has relatively been low with a distinctive reliance on human interaction with simple, low-cost,
cognitive methods (e.g. colour coding or shadowing) and artefacts (e.g. cards or signal lights) in the physical world
(Hirano, 1995, Galsworh, 2005, Tezel et al, 2015). This may to some extend be due to the lean production system’s
cautious approach to IT that manifests itself in the lean doctrine of using only proven (value adding) technology
(Sacks et al, 2010a). However, emerging technologies, which have continuously been better integrating with each
other, hold the potential to overcome some of the limitations of the current VM deployments. The critical
parameters for an enhanced VM system are; (i) better contextual awareness and dynamic information display
within complex, on-site information flows (Sacks et al, 2010b), (ii) timeliness/immediacy in control (shorter and
automated information feedback) (Kirchbach et al, 2014) and (iii) locating visual (sensory) information closer to
process elements, not only on the site office boards but also preferably on the workforce, equipment, machinery,
plant and space itself (ubiquity) (Formoso et al, 2002). Moreover, an IT enhanced VM system can potentially
support data collection from the workforce (two-way communication) and be better integrated with stakeholders’
(e.g. suppliers, clients, partners, designers, local authorities, professional bodies etc.) existing IT systems to
maintain the information flow thorough those stakeholders as well. In the subsequent sections, the potential of
emerging technologies to enhance VM in lean construction efforts is discussed under the light of a proposed IT
architecture conceptualised for large, complex construction projects.
3. TECHNOLOGY REVIEW
3.1 Building Information Modelling
In recent years, the use of parametric modelling based Building Information Models (BIM) and their potential to
work as a single repository of building data throughout the project life-cycle has been well recognised (Azhar,
2011, Bryde et al, 2013). The advent of multidimensional models (nD BIM) facilitates the extension of the use of
BIM models over the project life-cycle. However, the practical use of BIM and nD visualisation beyond the design
stage is still limited (Yabuki, 2010). Data and information contained within visual building models can be used to
support critical decision-making and to develop standardised VM interfaces; visual construction models open to
various data modifications. The parametric, machine-readable BIM models also enable deeper integration of
visualised models with other emerging technologies for further data manipulation and enhanced possibilities. For
instance, with the integration of a physics engine layer, BIM models can be turned into interactive games that are
used to visually train people on the issues such as safety, quality and the motives of Lean Construction itself
(Rüppel and Schatz, 2011). The discussion in this section will be limited to the possible use of BIM systems in
connection with Lean Construction support and VM in the construction and facilities management phases as there
is a significant positive synergy between lean construction and the use of BIM (Sacks et al, 2010a, Eastman et al,
2011).
There are attempts to holistically visualise the flows of construction site information on construction material,
equipment, manpower, space availability, design, predecessor activities and external/environmental conditions
through BIM models (Dave et al, 2014). One of the interesting efforts in information visualisation in building
construction projects is the KanBIM prototype, in which on-site process and product status information are
visualised on BIM models through the pulls or signals of the user interfaces displaying the maturity of tasks
planned and the status of work underway within the building construction context (Sacks et al, 2010b, Gurevich
and Sacks, 2014). Thus, the status of each task (on-going, stopped, having a problem) along with the source of a
work disruption can be seen at a glance and visually controlled on a BIM model. The system integrates and
visualises the Last Planner planning system outputs (short-term planning) collecting from and conveying
information to construction team leaders at the operational level through large LCD touch screens. Although partly
hampered by software interoperability, functionality and compatibility issues in application, the VisiLean software
prototype also offers similar, interesting workflow visualisation/simulation opportunities in connection with the
Last Planner system for highway construction planning and control efforts (Dave et al, 2013).
Even though very promising, in order to increase system mobility for construction/maintenance projects, the data
presentation and capturing (human interface at the operational level) in those systems could be realised with mobile
or wearable computing devices supported by cloud servers, instead of static touch screens. Both systems have

ITcon Vol. 22 (2017), Tezel & Aziz, pg. 228
limited context awareness, relatively higher dependency on the workforce/human involvement for information
update (possible latency in control) and are open to wider integration on the software site, for instance with ERP
systems, external and environmental information (e.g. weather), personnel management, to cover and visualise a
wider information flow. Moreover, site based and office activities in a construction project should be better
harmonized with a wider communication interface for production management (Dave et al., 2014). Shortly, there
is room for improvement in BIM based information flow visualization and control efforts for large, complex
construction and maintenance projects in the Lean Construction world.
In connection with the use of the Line of Balance planning method, which is quite relevant to visually controlling
repetitive tasks (Kenley and Seppanen, 2010), BIM systems can be used in the visualisation of space-based
scheduling for construction and maintenance projects. (Jongeling and Olofsson, 2007, Frandson and Tommelein,
2014). The adoption of such visualisation could also trigger some discussions on the automation of takt (production
pace) planning and use of cell production units, which are closely related to decreasing work-in-progress in
building construction projects (Dos Santos et al, 2002). BIM enabled 4D/5D visual simulations for resource, time,
safety, space, risk and constructability analysis have been adopted in complex building and industrial construction
projects (Gerber et al, 2010). 4D/5D BIM models are integrated with the Last Planner system and Just-in-Time
(JIT) based extensive/complex prefabrication efforts (e.g. duct work, mechanical, electrical and plumbing units,
reinforced concrete panels, cladding, dry wall structures etc.) for higher quality control and coordination in
building construction projects through the extensive integration of quantity-take offs and parametric models with
suppliers’ ERP and Computer Numerical Control (CNC) systems (Bhatla and Leite, 2012, Hamdi and Leite, 2012).
The use of BIM in facilities and operations management is also gaining momentum particularly in locating
components, facilitating real-time data access, checking maintainability, and automatically creating digital assets
(Becerik-Gerber et al, 2012). Those efforts can be perceived as eliminating/automating some non-value adding
activities in facilities management through the use of BIM. Data capturing for BIM models come to fore in
facilities/operations management and construction site progress tracking. Commonly used data capturing
techniques for BIM models in the construction and facilities management phases include laser scanning
(automated), photogrammetry (automated), barcode and RFID tagging with several affecting parameters (see
Table. 3) (Volk et al, 2014). The automated systems extract mainly spatial, colour and reflectivity information and
also require a data-driven object recognition layer for data processing (e.g. shape-based or material-based
matching) (Tang et al, 2010). Although the current data capturing approaches remain insufficient to accurately
identify the already-built technical components (i.e. HVAC/MEP systems), their courses, installation dates,
material layers or composites in facilities/operations management, refurbishment and retrofitting efforts
(Dickinson et al, 2009), they have been used to facilitate automated construction progress monitoring with
relatively high accuracy (Su et al, 2006, Golparvar-Fard et al, 2009, Turkan et al, 2012).
TABLE. 3: Data capturing techniques for BIM models Data capturing parameters Laser Scanning Photogrammetry RFID tagging Barcode tagging
Cost High Medium Medium Low
Time Medium Fast Fast Fast
Level of detail High High Medium Medium
Influence of size and complexity of the scene High High Low Low
Influence of environmental conditions
High High Low Low
Direct Importability into BIM
Yes Yes No No

ITcon Vol. 22 (2017), Tezel & Aziz, pg. 229
3.2 Context aware systems
Context is any information characterizing the situation of an entity (person, place or object) – such as location,
time, activity and the preferences (Dey, 2000). Context-aware computing involves the use of environmental
characteristics such as the user’s location, time, identity, profile and activity to inform the computing device so
that it may provide information to the user that is relevant to the current context (Burrell and Gay, 2001). Pashtan
(2005) described four key partitions of context parameters, including user static context (includes user profile, user
interests, user preferences), user dynamic context (includes user location, user current task, vicinity to other people
or objects), network connectivity (includes network characteristics, mobile terminal capabilities, available
bandwidth and quality of service) and environmental context (includes time of day, noise, weather, etc.).
Automated context awareness is often realised by the combined used of indoor/outdoor geolocationing, sensor
networks, identification systems (e.g. RFID tags), image processing (e.g. cameras) and input from external data
resources (e.g. weather conditions) (Kim, 2013, Lee et al, 2013).
Awareness of user context can enhance communications and collaboration in the construction industry by
providing a mechanism to determine whether an information is relevant to a particular context. While the user
context is often the most well-known context to be considered, it is important to highlight that there are other
project related entity contexts that may need to be provided for. In this way, it is possible to eliminate distractions
for mobile workers, related to the volume and level of information. Also, user interaction with the system can be
reduced by using context as a filtering mechanism to deliver only context relevant information to users. This has
the potential to increase usability, by decreasing the level of interaction required between the mobile devices and
the end users (Behzadan et al, 2008a). The advent of cloud computing, which is defined as clusters of distributed
computers (largely vast data centres and server farms), can provide on-demand resources and services over a
networked medium (usually the Internet) (Sultan and Bunt-Kokhuis, 2012). Cloud computing offers wider context
aware data access for mobile construction teams through wireless communication and BIM model visualisation
(Huerta-Canepa and Lee, 2010, Fathi et al, 2012, Redmond et al, 2012).
3.3 Mobile computing
Given the mobile and dynamic nature of construction production work, there is also a need to integrate the
advances in mobile computing into the work environment to provide a user-friendly and mobile access to
construction information (Costin et al., 2015). Using commercially available widescreen mobile devices such as
iPhones/iPads or Google Android based mobile devices, it is now possible to gain access to full design libraries,
construction documents and zoom in and out of drawings and Virtual Building Models, for the finest detail or a
broader overview (Hardin and McCool, 2015). Also, mobile Augmented Reality (AR) applications have begun to
develop for smart phones (Meža et al, 2015). This enables a display of augmented information such as a 3D model,
overlaid on a live camera view of the mobile device. Users can define virtual tags to identify key locations based
on their personal interest using commercial applications such as Layar and Wikitude. AR used with mobile devices
can enable a new kind of interaction with virtual asset models (Meža et al, 2015). Also, wearable computing
systems (i.e. Google glass or Apple watch), which are physically carried on human beings with significant
processing powers, have been disseminating rapidly for a greater support for mobile applications. Although
manually, mobile devices have been used to collect site data to support VM in lean construction efforts as well
(Barbosa et al, 2013).
3.4 Augmented Reality (AR)
Augmented Reality (AR) is a relatively new form of context-aware interface that allows placing the user in a real
environment augmented with additional information generated by computer (Barfield, 2015). Using AR-based
technologies, virtual models of a components of a construction project can be superimposed on display of a real-
world image in real time using different types of display devices such as smart phones, tablet computers, 3D
stereographic head mounted displays, or wearable computerised glasses. This can support delivery of highly
specific data and information to users to support site-based workflows and processes. Recent developments in
mobile processing units, camera quality, different sensors, wireless infrastructure and tracking technology enable
AR applications to be implemented even in demanding mobile environments such as construction sites (Behzadan
et al, 2008b, Irizarry et al, 2013). Many of the commercially available Apple and Android smart-phones currently
support augmented reality applications such as facial recognition, assisted direction and AR tourism, using

ITcon Vol. 22 (2017), Tezel & Aziz, pg. 230
compass, camera, and GPS system. AEC/FM industry is recognised as the prime candidate for the uptake of the
AR technology (Chi et al, 2013). Webster (1996) has designed an AR based system to guide construction workers
in the space frame structure assembly. EU funded STARMATE project focused on supporting technicians working
on complex maintenance operations and providing hands-on training using equipment in its natural environment
(Schwald et al, 2001). Schall et al (2009) developed a location-aware handheld augmented reality system to assist
utilities field-personnel. VTT-based AR4BC project (Woodward et al, 2010) developed a prototype application to
provide the user with a mobile view of a construction site augmented with BIM on two-way communication. Shen
et al (2006) and Shen et al (2010) presented a framework to support concurrent collaborative product design among
members of a multi-disciplinary team by highlighting how AR environments allow multiple users to interact and
comment, thus achieving higher levels of collaboration. In recent years, the AR technology has also been
popularised by the launch of XBOX 360, which includes a motion-tracking sensor, capable of tracking gestures
and user location and body shapes. Different prototype applications have recently been developed using a
combination of Augmented Reality (using Kinetic sensors) and Virtual Reality glasses to provide users with full
immersion into virtual environments.
The combined use of a BIM server with AR engines supported by mobile computers (e.g. the iPad) holds the
potential for a real-time visual control interface and creating virtual prototyping for operational people in the
construction and maintenance phases of projects (Golparvar-Fard, 2009, Woodward et al, 2010, Kuula et al, 2012;
Wang et al, 2013). Those AR systems typically include tracking the user's position and orientation in space,
calibrating the current position with the position in virtual environment, processing data and merging digital and
real environment, and displaying AR (Madden, 2011). Thus, within a working model, the user is able to point its
mobile or wearable device to an already constructed/being constructed spatial element (e.g. corridor, wall, column,
floor etc) and visualize on the pad screen the different BIM layers (structural, architectural, MEB and other nD
layers) and other related information (e.g. cost, schedule, responsible, maintenance and quality requirements)
corresponding to the pointed space. Supporting processes transparency and ubiquity on the site, the user is able to
see what is supposed to be in the corresponding geometry according to the BIM model to visually control the
construction and maintenance. There are several technical challenges for a working prototype. The system relies
on precisely tracking the location and orientation of a mobile computing device indoors and/or outdoors. For a
higher accurate positioning, techniques like using reference images, differential global positioning system, point
clouding, laser scanning, computer vision, feature based tracking radio frequency identification and Bluetooth
based micro-location systems can be tested (Saidi et al, 2011). The software interoperability between off-the-shelf
BIM software and AR engines should also be attained.
An extension of AR is Spatial Augmented Reality (SAR), in which video-projectors, optical elements, holograms,
radio frequency tags and other tracking technologies are employed to display graphical information directly onto
physical objects without requiring the user to carry or wear a graphical display (Carmigniani et al, 2011). The
developments in mini project models (e.g. the AAXA–P2 Pico projector) have added momentum to SAR
applications (Jansen et al, 2015, Knibbe et al, 2015). The practical use of this system for construction/maintenance
projects can be in rapid design evaluation, better communication of the design intent, improved stakeholder/client
engagement, extended information visualisation and simulation and as a visual enabling technology for the Last
Planner meetings (Nee et al, 2012).
3.5 Use of drones for surface scanning and auto-identification
Drones or Unmanned Aerial Vehicles (UAV) have been tested for their effective use in construction for a while
(Irizarry et al, 2012, Siebert and Teizer, 2014). The use of drones in connection with 3D models and BIM systems
for visual progress monitoring, site survey, safety and quality analysis seems promising, given construction and
maintenance projects often extend over large areas that can be more comprehensively and easily scanned from the
air by drones. Moreover, drones can be programmed to fly autonomously with a relatively less requirement for
ground control (Siebert and Teizer, 2014, Varela et al, 2014). The non-value adding, costly and time consuming
activities of progress monitoring, on-site asset and material tracking, quality assurance/control and as-built model
creation can be visualised and automated to a degree. This automation will also decrease the amount of mistakes
made in those routine tasks. The three main expected outcomes; higher visualisation and process transparency,
reducing the amount of non-value adding activities and minimising defects match well with the Lean Construction
principles (Sacks et al, 2010a)

ITcon Vol. 22 (2017), Tezel & Aziz, pg. 231
3.6 Laser scanning
The use of Light Detection and Ranging (LiDAR), Laser Detection and Ranging (LADAR) and 3D laser scanners
provides a wide range of opportunities for asset management and real-time site monitoring for construction projects
in every phase of their project lifecycle (Randall, 2011). They are effective in locating topographic features,
defining feature geometries and creating 3D surfaces. The main advantage of those systems over different imaging
techniques discussed in the construction automation literature is their being comparatively easier to use and more
mature technologies (Zhang and Arditi, 2013). Promising results were obtained by using the surface scanning
technologies in identifying earth-moving amounts (Hashash et al., 2005), controlling highway pavement thickness
(Walters et al., 2008), construction progress comparisons (Akinci et al, 2006, Turkan et al, 2012) and measuring
road surface deterioration levels (Jaselskis et al, 2005). In addition, some commercial hardware/software systems
based on mounting lightweight LiDAR scanners onto drones and quad-rotors that are capable of collecting 700.000
data points per second at an altitude of 40 meters are now available to choose from. However, their costs may not
be trivial, which renders a cost/benefit analysis necessary. When the hardware/software cost is prohibiting, high-
definition cameras mounted on drones and integrated with an image-processing engine (Kim and Shim, 2013) or
novel 3D photogrammetry techniques such as ‘Structure-from-Motion’ (Westoby et al, 2012) can also be
investigated for large-area site monitoring with possible functionality and accuracy trade-offs.
Scanning distance, point cloud density and output speed are important parameters affecting the decision on the
technology to be used in surface scanning (Randall, 2011). Particularly with the LADAR and LiDAR technologies,
it is possible to achieve detailed point clouds with just a couple of scans (Turkan et al, 2012). On the other hand,
flash LADAR scans yield rapid outputs on highly active sites (Randall, 2011). Another concern is the total weight
of scanners to be carried on drones. Lighter and more compact scanners have been released to the market.
Additional algorithm layers can be used to enhance automatic object identification of the scans (Bosche et al,
2013). Clear data collection, processing and management procedures should be in place to ensure that point clouds
provided as outputs by those combined systems are reasonably free of noise, distortion, and of higher quality with
sufficient details (point density). It should be also noted that a fully automated and reliable system is yet to be
achieved in a real construction environment. Hence, human intervention and management of the data seem
necessary. The point clouds captured by drones can also be forwarded to BIM models (Wang et al, 2014), which
enables using various nD BIM capabilities. It is necessary to bind the real-time output provided by the technology
to construction management processes.
3.7 RFID scanning
Another aspect to the drone applications for visual controls in construction/maintenance projects is the combined
use of drones with Radio-Frequency identification (RFID) readers to attain rapid, wide-area auto-identification
and tracking. The use of the RFID technology in construction is not new. The main advantages of RFID tags are
that unlike laser barcodes, they do not require a line of sight for information exchange, they are relatively durable
in harsh construction environments and information can be both read from and written on them (Moselhi and El-
Omari, 2006). RFID tags are successfully employed in monitoring processes, in which mostly pre-fabricated
materials are used, and updating material inventories (Lu et al, 2011). Location of workers, assets, equipment
(construction and personnel protection) can be tracked in real time by using the RFID technology and Global
Positioning System (GPS) for safety management, facilities management, processes management, and activity
base (i.e. welding) progress measurement purposes (Shen et al, 2012, Kelm et al, 2013, Shahi et al, 2013, Lin et
al, 2014). The information from RFID tags can also be integrated into BIM models.
Recently, a practical experimentation of using drones with RFID readers to identify and track structural steel
bundles in multiple, large storage yards by using active and passive RFID tags with promising results has been
reported (Swedberg, 2014). Some commercial drone mounted RFID reading system designed mainly for retails
stores are now available for purchase. Cost, communication range and medium (air, underwater and underground),
and interference in cluttered areas should be the parameters to be considered choosing an appropriate RFID tagging
technology (i.e. integrated circuit low, high, ultra-high frequency passive, semi-passive, active, ultra wide band or
chipless RFID tags) (Chawla and Ha, 2007, Plessky and Reindl, 2010).

ITcon Vol. 22 (2017), Tezel & Aziz, pg. 232
3.8 The Internet of Things (IoT)
The novel paradigm Internet of Things (IoT) is an umbrella term that envisions a pervasive network of integrated
things, such as wireless sensors and actuators, mobile and wearable computing devices, every-day objects with
processing power and RFID/Auto-ID tags collectively making sense of their local situation and interacting with
each other and human users (Atzori et al, 2010, Miorandi et al, 2012). The idea can be traced back from Weiser’s
ubiquitous computing vision (Weiser, 1991) and it was popularised by Sterling’s description of a new category of
space-time objects that are aware of their surroundings and can memorize real-world events (Sterling, 2005).
Despite many technological or ethical challenges, like networking infrastructure, standardization, interoperability,
data semantics, ad-hoc composition and coupling of things, data security and privacy issues (Bandyopadhyay and
Sen, 2011), the paradigm carries the potential to embed a dynamic and collective ‘smartness’ into otherwise static
and inanimate human environments (e.g. homes, offices, workplaces, roads, cities, country-wide facilities etc.)
(Gubbi et al, 2013). The practical use of the IoT is relevant to uncontrolled and complex work environments like
construction sites, where process elements are spatially distributed, mobile and exposed to environmental
conditions. Wireless sensors (e.g. fiber optic/fiber Bragg grating and piezoelectric) and the auto-ID system network
enables real-time context awareness in environmental and structural conditions, identity, time, activity type,
activity location and reasons (Perera et al, 2014). Thus, It also fits well with the generic goals of the VM strategy;
embedding information into processes, facilitating information flow and increasing workplace autonomy through
increased process transparency.
Kortuem et al. (2010) demonstrate a small-scale smart object network; an activity-aware hand tool, a policy-aware
chemical storage barrel and a process-aware pneumatic pavement breaker communicating with construction
workers through wearable devices to support the safety and process management efforts of a highway maintenance
project. Ding et al (2013) propose an IoT based safety-early warning system for preventing accidents/structural
failures in underground soil excavation conditions for a metro construction project that relies on an integrated
system of RFID tags for personnel tracking, a network of fiber-optic sensors for structural health monitoring and
portable devices. It should be noted that the dominant research perspective for the early use of the IoT paradigm
and its related concepts in construction has been safety management (Chae and Yoshida, 2010, Carbonari et al,
2011, Teizer, 2015). The potential of the paradigm for the construction industry still needs wider discussions from
other construction management dimensions. Moreover, the paradigm’s vision of collective contextual sensing (e.g.
a group of smart things sensing and evaluating a situation together) and extended or global scale connection of
smart objects through the Internet have not been achieved yet.
4. EMERGING TECHNOLOGIES TO SUPPORT CONVENTIONAL VM SYSTEMS
Through a dedicated logic layer, the visualization elements (information content) of each conventional VM system
described in Table. 1 can be supported by the combined use of the reviewed emerging technologies for further
automation, mobility, real-time feedback and context awareness. Also, those IT-supported systems will better
facilitate a two-way communication. For instance, a work team can easily comment or propose a change in a SOP
using their mobile computers. Some emerging technologies can be more relevant to some conventional VM tools
and systems. Table. 4 displays a summary of the potential of emerging technologies to support conventional VM
systems. In the table, the conventional VM systems commonly used in lean construction efforts have been showed
with the emerging technologies that are more relevant to particular VM systems. In the rest of this section, the
scope of those connections for improved VM practices are explained. The “X” in the table denotes the existence
of a significant synergy between a particular technology and operational VM tool in developing applications.
5S: BIM systems can present on mobile systems a dynamic visualisation background for general site
standardization; site layout, standard material, component, machinery, tool locations, quantities and identifications
with their corresponding responsible personnel. Context awareness, AutoID systems and mobile technologies can
yield work unit specific workplace standardization information, along with preventive health and safety, and
maintenance information. AR systems combined with mobile technologies can be used to communicate what
workplace element should actually be where and how to perform various preventive health and safety, and
maintenance checks correctly.
Visual performance boards: The IoT integrated into tools, equipment, components and machinery can
automatically generate and communicate performance data. Also, surface scanning and advanced photogrammetry

ITcon Vol. 22 (2017), Tezel & Aziz, pg. 233
can be used to rapidly capture actual productivity and quality performance data. Supervisors can give instant
feedback over large construction areas on other performance aspects like 5S audits or the health and safety
condition of a specific work units or locations by using mobile devices. As image processing engines improve,
those general evaluations can also be automated on a set of standard assessment frameworks. The collated
performance data can be complied as per the needs of different work units and can be transferred onto mobile
systems and BIM models. Construction work units can see different performance information content as per their
trade, work locations, work requirements (i.e. plans, health and safety and quality requirements) and work times
(day or night).
TABLE. 4: Emerging technologies to support conventional VM systems and tools
BIM Context aware
systems
Mobile
computing (&
wearable
devices)
Augmented
reality systems
Surface scan
(Laser scanning,
photogrammetry)
AutoID
(RFID,
NFC)
The Internet
of Things
(IoT)
5S X X X X X
Visual
Performance
Boards
X X X X X
Standard
Operating
Procedures
X X X X
Internal Marketing X X X X X
One-Point-
Lessons
X X X X
The A3
methodology
X X X
The Last Planner
meeting boards
X X X X X X X
Project production
control systems
X X X X X X X
Andon system X X X X
Heijunka boards X X X X
Kanban System X X X X X
Poka Yokes X X X X
Standard operating procedures (SOP): Work units can see different SOPs as per their trade, work locations,
work requirements (plans, health and safety and quality requirements) and work times (day or night) with better
context awareness on mobile devices. Also, the elements of SOPs such as production rate and work-in-progress
amounts can be dynamically adjusted for different work conditions and times. AR tools combined with mobile
technologies can facilitate the demonstrations of SOPs. on actual work settings.
Internal marketing: The IoT, mobile computers and AutoID technologies will facilitate context specific internal
marketing on construction sites. For instance, during night times, sensors can identify work units on night shifts
and accordingly, internal marketing information for night-time safety precautions and requirements can be
reminded. The information content of those marketing efforts can be customised by the performance and
characteristics of work units for better outcomes. For example, a low productivity work team can be incentivised

ITcon Vol. 22 (2017), Tezel & Aziz, pg. 234
for more efficient work practices through messages on mobile computers as a communication medium. AR tools
combined with mobile devices can clearly illustrate the difference between good and bad practices.
One-Point-Lessons (OPL): Likewise SOPs, context awareness, mobile computers, AR tools and AutoID systems
can be used to facilitate OPLs on construction sites.
The A3 methodology: Highly customised A3 sheets to communicate and summarise various quality, safety and
continuous improvement processes can be automatically created for different work units working under different
contexts by using mobile devices and AutoID technologies. In this way, for instance, a concrete work team will
be able to see a different A3 process sheet than a cable laying team on their mobile devices.
The Last Planner System: Coordination and two-way communication among different work units are the keys
in creating the Last Planner meeting visuals and essentially executing the Last Planner System (Ballard, 2000).
Through mobile devices and web-services, work teams do not need to be co-located to have their Last Planner
meetings and to create those regular meeting visuals, and work constraints tables. This regular co-location need
can particularly be problematic and wasteful for large construction projects. Also, the key information of the Last
Planner meetings (what was promised versus what was actually achieved) can be better visualized to work units
on BIM models with areas of improvement. Those BIM models can be openly accessible through mobile devices.
Moreover, through AutoID technologies and the IoT , the production outputs of work units can be automatically
and accurately captured and recorded into the what was actually achieved as a part of the Last Planner visuals.
Surface scanning technologies can also be used on larger areas to rapidly record and visualize the what was actually
achieved part (actual performance). Construction work units can also at the same time manually input, modify or
comment on their work status and deliverables on BIM based models through the touch screens of their mobile
devices on a real time basis. On construction sites, AR can be used with mobile devices to communicate the range
of promises work teams need to fulfil within the Last Planner. For instance, by using AR visuals taken from BIM
models on their tablets or wearable glasses, a pipe fitting team can easily see in a specific location (i.e. on a specific
wall or floor), the amount and type of pipes they need to fit in that specific area to fulfil their promise as per their
Last Planner promises.
Project production control systems: 4D/5D BIM models have already been used to link BIM systems with work
schedules and costs. Their use should be directed towards mobile systems more for large-scale construction and
maintenance projects. Those models can be improved with the integration of BIM supported AR systems on
mobile devices to enable work units to compare what is actually planned and what is actually done. Through
AutoID technologies and the IoT, the production outputs of work units can be automatically and accurately
captured and recorded. Also, surface scanning technologies are relevant to large-scale projects to rapidly capture
the quality and status of work. Conventional visual control boards that are used to link the Last Planner plans to
site tasks in lean construction efforts can be turned into virtual visual control boards, on which work teams or
subcontractors can visualize, interact, coordinate, plan and control their site works according to the Last Planner
plans by using mobile devices and web-services instead of physical control cards. Those virtual visual control
systems will enable real-time automation of the work unit clash analysis by work locations, capturing and
addressing the information needs of work units to accomplish their planned tasks and calculation of the Plan
Percent Complete (PPC) ratios, which is the ratio of the number of realized activities according to the plans to the
total number of planned activities in a given time interval.
Andon system: BIM based andon systems similar to the KanBIM prototype can be further developed for mobile
devices. Work units can create manual andon signals by using mobile devices and AutoID technologies The IoT
also can be used to generate simpler andon signals (i.e. “production on-going”or “production stopped”, but not
“production may stop soon”) and communicate them on mobile devices of supervisors automatically for their
attention. BIM models can replace andon boards as the visualization background for andon signals.
Heijunka boards: Mobile computers, AutoID technologies and the IoT can be used to automatically or manually
create the demand for materials or tools/machinery use. Those demands can be either levelled with a levelling
engine without the involvement of a human-operator or by the decision of a supervisor. The levelled schedule for
materials or tool/machinery use can be communicated on mobile devices and BIM models.
Kanban system: BIM based kanban systems similar to the KanBIM prototype can be further developed for mobile
devices. AutoID technologies with mobile devices (as readers and writers of RFID tags) can be used as kanban
signals among work units. They are now capable of containing the kanban visualization information identified in

ITcon Vol. 22 (2017), Tezel & Aziz, pg. 235
Table 1. Also, with the IoT, inanimate objects can automatically generate kanban signals for different purposes
such as material replenishment, machinery/tool safety and maintenance check demand or machinery utilisation
status (idle, stopping, working etc).
Poka-Yokes: The IoT integrated into construction machinery, materials, components, tools and gadgets can be
programmed to communicate on mobile devices critical information to act as safety and quality poka-yokes. For
instance, sensors integrated into plants and work helmets can communicate with each other to warn work units (by
vibration and/or beeping) of any plant/worker interface type work hazard (proximity). Again, context awareness,
mobile devices and AutoID technologies will give way to creating customised poka-yoke systems for different
work teams working under different conditions and constraints.
Although there is a potential in the combined use of emerging technologies with conventional VM systems, a
conceptual IT architecture, which is presented in the subsequent section, is needed to facilitate the implementation
ideas outlined above and novel IT based VM and lean construction efforts to a greater extent.
5. FUTURE IMPLEMENTATION SCENARIOS FOR IT BASED VISUAL MANAGEMENT
For lean construction management, the visualisation through integrated BIM systems and aerial LiDAR scans can
be used as effective communication means in value capturing and evaluating alternatives at the design and
construction stages. They can also be used in the Last Planner meetings, to track site progress, site conditions for
safety and production output of first-run studies (e.g. productivity experiments in lean efforts), to facilitate takt
(rate of production) planning, to provide data for process simulation, to analyse continuous improvement efforts
in critical tasks, to automate progress calculations and quality checks, as material replenishment/purchase and
production “pull” signals, to monitor material and plant flow over the site, to produce VM performance metrics
for operational on-site staff, to generate more accurate and faster BIM based as-builts, to integrate information in
other BIM based flow visualisation efforts (e.g. KanBIM or VisiLean), and to assess surfaces and structural
elements for maintenance.
One common use of drones and RFID readers in providing visual controls can be in routine and rapid tracking of
on-site stocked materials to produce automatic “pull” signals for production and replenishment through an ERP
system on a Just-in-Time delivery basis. This can be particularly relevant to site-stock monitoring on large
construction sites. Hence, certain inventories and work-in-progress can be kept at their optimums by their
external/internal demands. On-site production or installation progress and actual material demand rates can also
be visually tracked via the combined technology. This looks particularly promising for construction/maintenance
projects in which many pre-fabricated materials are used. Additionally, necessary information from pre-fabricated
items for facilities management systems can be quickly scanned from drone mounted RFID readers.
Rapid reading of RFID tags by using drones enables two-way communication over larger open areas. This gives
way to using RFID tags as kanban pull signals for various requirements by the operational workforce. A certain
amount of RFID tags for different purposes can be given to work teams scattered on the site to enable the “pull”
for some materials, work processes/production from upstream units, equipment, safety, maintenance, and quality
check demands at the operational level. Various on-site process transparency increasing information, like planned
location of use and quantity of materials, equipment and worker groups according to daily plans, maintenance,
safety and process related information can be written on RFID tags for a better information flow. It seems
particularly applicable to sites where WLAN or 3G/4G mobile signal receptions are limited or unreliable. A
combined use of RFID tags, GIS and drones may enable the implantation of an andon quality control system for
mobile construction teams, a more static version of which has been successfully used in high-rise building
construction projects (Tezel et al., 2015). On RFID integrated boards, work teams can share their process flow
status that can be communicated to management through GIS and drones along with their site locations and team
IDs. Additionally, related VM metrics can be automatically produced for the work force through the RFID
readings.
The vision of combined use of the IoT and VM can find many practical applications at the operational and strategic
management level in construction/maintenance projects. In construction logistics, the real-time monitoring and
visualising of every link in a supply chain, from design to demolition, can be achieved via the RFID and the Near-

ITcon Vol. 22 (2017), Tezel & Aziz, pg. 236
Field Communication (NFC) technologies, enabling working on almost zero safety stocks and a reliable Just-in-
Time delivery system. A real-time access to the supply chain information will keep the workforce better informed
and the stock levels at their optimums. In warehouses, sensors can be used to visually track atmospheric and
environmental conditions, along with the quantity of materials, consumables, tools and the who is in possession
of what tool/equipment information at any time on the site. It is also possible to monitor the wear and tear on
critical construction material parts to enable preventive maintenance for higher safety and reliability. One-site
stocked materials and tools can be easily found and tracked by the workforce reducing the amount of material
losses and time spent looking for them. On-site theft, site restriction violations and material/equipment/plant
misuse can be reduced by visually controlling and real-time tracking of whether they have been moved from
restricted areas without permission. Sensors are useful for monitoring and visualizing structural (e.g. strain in soil
or concrete) and environmental conditions (e.g. temperature, moisture, rainfall, specific gas levels, wind speed etc)
for safety and quality management purposes. For instance, optimum site lightening can be automatically adjusted
according to daylight to prevent sight related accidents and mistakes.
For heavy plant operations, visually assisted driving and navigation, real-time traffic monitoring, route and
quantity/use optimization and levelling (visual plant heijunka), and collision prevention (mistake-proofing or
poka-yoke) along with maintenance tracking and support can be achieved through sensor networks. By using the
AutoID technology, equipment and plant may enable their operation by only authorised and trained personnel.
Hand tools and equipment can visually communicate their maintenance periods or conditions, replacement of their
consumables/parts and their working conditions (e.g. orientation, vibration, and noise) by creating visual signals.
The actuators on heavy plant and tools can be coupled with and fine-tuned by the information from sensors
measuring parameters like soil density, distance, temperature, soil grade in real-time to increase construction safety
and quality. Smart posters or boards integrated with AutoID technologies can visually present personalised and
dynamic visual information (e.g. performance metrics, work aids, protective equipment-PPE- requirements, level
or requirement of training for particular tasks) for different worker groups or managers by their corresponding IDs
integrated on their PPE or badges.
Smart cards or tokens can be used as kanban signals to pull material, information or work among process units.
Those cards may contain dynamic and additional information (e.g. not static but changing material amounts
according to the stocks, production demand and levelling, information on standardized work, routine maintenance
requirements on a plant or process safety) and can be easily tracked by a central monitoring system. The use of
tools or equipment can be dynamically limited to prevent overproduction as an important waste in lean
construction. Supervisors can upload information onto augmented site layouts and area maps that can provide for
instance, daily production planned information on a specific zone and traffic conditions on a site with some safety
information. A digital diary summarizing the important events and tasks for a project and supported by the IoT
can be maintained by the management and reached openly by the workforce through mobile or wearable computing
devices. Automated and rapid data collection on processes, real-time material, equipment and plant use will give
basis to close investigations for reduction of waste and a wide variety of process simulation, optimization and
improvement actions. The IoT and visual controls application domain is open to development and experimentation
by specific project conditions.
Figure 1 presents a futuristic implementation scenario architecture which brings together the key technology
components discussed above in a holistic picture, allowing for dynamic context relevant information provisioning
and feedback to allow for informed decision making. Figure 2 presents the activity diagram for the scenario
architecture. The key features of the implementation scenario are discussed as below:
Data collection layer: The data collection layer is primarily realized through a sensor network (the IoT), RFID
tags, a surface scanning and AutoID reading mechanism, which can optionally be mounted on drones or
quadcopters for larger sites, and GPS/GIS for geolocationing. Also, the elements of the data presentation layer
(black bland) can be used to collect on-site data from the work teams. Those technologies were found appropriate
to rapidly collect data from larger construction sites.
Data communication layer: The data communication layer can be divided into two main parts; on-site
communication and external communication. The on-site communication is realized with outdoor WLAN access
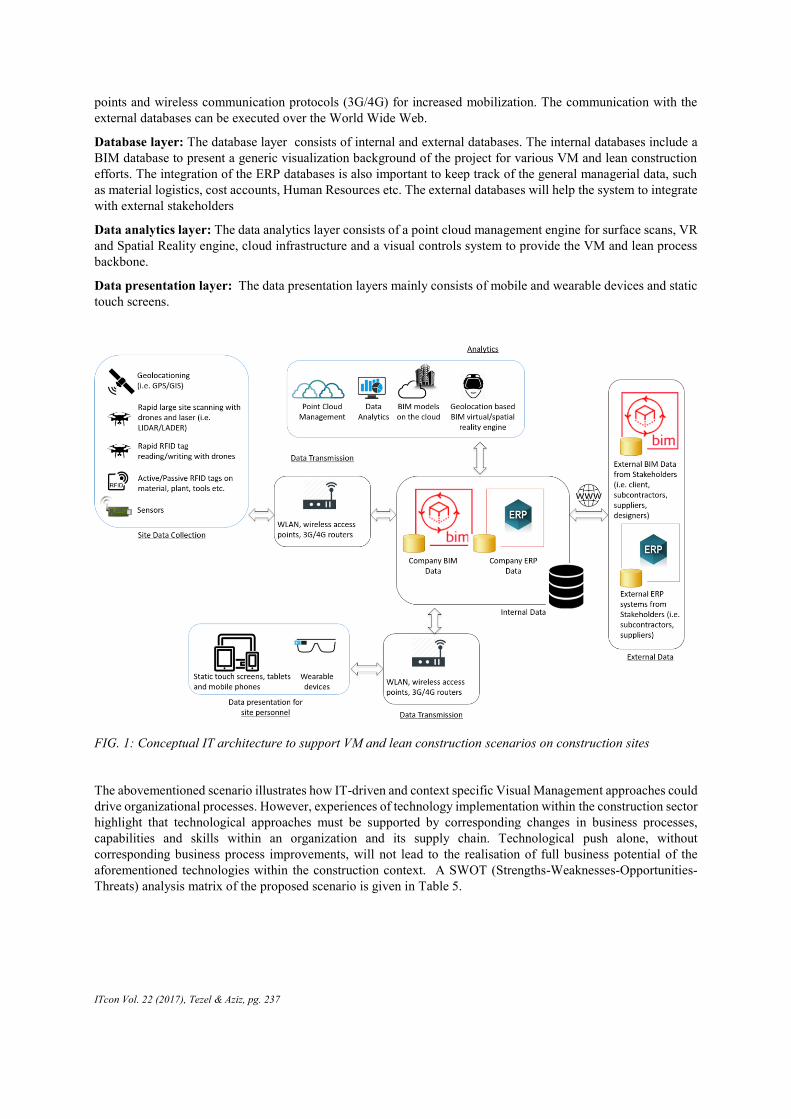
ITcon Vol. 22 (2017), Tezel & Aziz, pg. 237
points and wireless communication protocols (3G/4G) for increased mobilization. The communication with the
external databases can be executed over the World Wide Web.
Database layer: The database layer consists of internal and external databases. The internal databases include a
BIM database to present a generic visualization background of the project for various VM and lean construction
efforts. The integration of the ERP databases is also important to keep track of the general managerial data, such
as material logistics, cost accounts, Human Resources etc. The external databases will help the system to integrate
with external stakeholders
Data analytics layer: The data analytics layer consists of a point cloud management engine for surface scans, VR
and Spatial Reality engine, cloud infrastructure and a visual controls system to provide the VM and lean process
backbone.
Data presentation layer: The data presentation layers mainly consists of mobile and wearable devices and static
touch screens.
FIG. 1: Conceptual IT architecture to support VM and lean construction scenarios on construction sites
The abovementioned scenario illustrates how IT-driven and context specific Visual Management approaches could
drive organizational processes. However, experiences of technology implementation within the construction sector
highlight that technological approaches must be supported by corresponding changes in business processes,
capabilities and skills within an organization and its supply chain. Technological push alone, without
corresponding business process improvements, will not lead to the realisation of full business potential of the
aforementioned technologies within the construction context. A SWOT (Strengths-Weaknesses-Opportunities-
Threats) analysis matrix of the proposed scenario is given in Table 5.

ITcon Vol. 22 (2017), Tezel & Aziz, pg. 238
FIG. 2: Activity diagram for the conceptual IT architecture to support VM and lean construction scenarios on
construction sites
TABLE. 5: SWOT matrix of the proposed scenario
Strengths
Enabling automation and dynamic information
flow for conventional VM systems
Enriching the content and presentation of visual
information
Added context awareness to conventional VM
systems
Dissemination of VM systems onto the whole
construction site through added mobility (larger
coverage)
Improved process transparency in construction
operations
Converting a wide-set of conventional VM
systems into IT-based systems
Enabling novel on-site VM implementation
opportunities and scenarios that have not been
tried before
Weaknesses
Lack of technology integration and
interoperability
Lack of a comprehensive VM data analytics
Lack of the business case (cost/benefit and
return on investment analyses)
Lack of prototypes and implementation cases,
even if partial
Lack of trained workforce to work with IT
enabled VM systems
Initial and maintenance costs for the
implementation can be high
Lack of awareness of the opportunities for VM
with emerging technologies
Some system components may need to be
reconfigured with each new project.
Opportunities
Increasing attention to lean construction, and its
tools and techniques in the construction industry
with many successful implementation cases
Clear digital construction vision set out by
certain governments (i.e. level 2 BIM mandate
in the UK)
Intensifying technology integration efforts.
Decreasing technology costs
Raising awareness of and attention to certain
technological components (i.e. BIM)
Threats
Giving too much emphasis on the technology
side, neglecting the process and people
components
Insufficient supply chain (i.e. subcontractors
and suppliers) readiness to operationalise the
scenarios
Insufficient top management and/or client
support
Increasing the dependency of site operations on
technology – maintenance and smooth working
of the components become highly critical
Insufficient return on investment that will
negatively affect the adoption of similar efforts
in the field

ITcon Vol. 22 (2017), Tezel & Aziz, pg. 239
6. CONCLUSION AND RECOMMENDATIONS
Lean construction and emerging technologies are two of the prominent research and implementation areas that
have been frequently discussed to improve the overall performance of the construction industry. This paper aims
at bridging the gap between VM in lean construction, and the digital construction movements to an extent by
outlining how emerging technologies can add dimensions to conventional VM and lean construction practices,
particularly for large construction and maintenance projects. Many opportunities, in which emerging IT systems
can add the context awareness, mobility, dynamism and instant feedback features to conventional VM systems,
tools, and lean construction practices have been identified.
Although promising, the extended use of IT systems to support and replace conventional VM systems to facilitate
information flow on large construction and maintenance projects currently faces a number significant barriers such
as; (i) interoperability issues among emerging technologies, (ii) initial technology investment and maintenance
costs, (iii) lack of human capital that is competent in both lean construction processes and emerging IT, (iv) lack
of best practices and exemplary cases, (v) lack of proof of return on investment and the business cases, and (vi)
the project based, fragmented and highly competitive nature of the industry. To create the business case, the next
step in this research domain can be smaller-scale pilot efforts in real-life contexts in relation to the proposed
architecture, future implementation options or the synergy matrix in Table. 4.
There are also some driving parameters; (i) the attention to lean construction and VM has been increasing for
operational performance improvement in construction with many successful implementation cases, (ii) there is a
clear digital construction vision set by certain governments in the world that drives large construction organizations
to invest in digital technologies, (iii) some technological components have been fast maturing and receiving
significant attention by the industry (i.e. BIM), enabling their integration with many other technologies, and (iv)
increasing research on the integration of technology components as a consequence of the need to combine and link
their functions with each other.
The lean principle of using only reliable, thoroughly tested technology that serves people and processes (Liker,
2004) dictates a certain level of technological maturity in lean implementations, including VM. This may create
some initial resistance and hesitancy. However, as the technology becomes more affordable and better integrated
with each other, some of the outlined barriers will be overcome in time. Also, external driving factors like
government mandates will help those technologies penetrate into the industry further. On the other hand, more
macro concerns, such as the fragmented industrial structure, low profit margins rendering the industry too much
return on investment focused, the risk averse supply chain and human capital issues should be challenged with
more collaborative and integrated project delivery systems and training mechanism for an extended use of
emerging IT tools with VM and lean construction. Even if partial, a working prototype based on the synergies
described above will help create the business case for more extensive endeavours in the future. One of the first
steps to that prototype should be developing a VM analytics module carrying the conventional VM logic (tools
and systems) to the digital systems.
7. REFERENCES
Akinci B., Boukamp F., Gordon C., Huber D., Lyons C. and Park K. (2006). A formalism for utilization of
sensor systems and integrated project models for active construction quality control, Automation in
construction, Vol. 15, No. 2, 124-138.
Arditi D., Tokdemir O.B. and Suh K. (2001). Effect of learning on line-of-balance scheduling, International
journal of project management, Vol. 19, No. 5, 265-277.
Atzori L., Iera A. and Morabito G. (2010). The internet of things: A survey, Computer networks, Vol. 54, No.
15, 2787-2805.
Azhar S. (2011). Building information modeling (BIM): trends, benefits, risks, and challenges for the AEC
industry, Leadership and management in engineering, Vol. 11, No. 3, 241-252.
Ballard H.G. (2000). The last planner system of production control, Doctoral dissertation, University of
Birmingham, UK.

ITcon Vol. 22 (2017), Tezel & Aziz, pg. 240
Bamber L. and Dale B.G. (2000). Lean production: a study of application in a traditional manufacturing
environment, Production planning & control, Vol. 11, No. 3, 291-298.
Bandyopadhyay D. and Sen J. (2011). Internet of things: applications and challenges in technology and
standardization, Wireless personal communications, Vol. 58, No. 1, 49-69
Barbosa G., Andrade F., Biotto C. and Mota B. (2013). Heijunka system to level telescopic forklift activities
using tablets in construction site, In proceedings of the 21th annual conference of the international group
for lean construction, Fortaleza, Brazil.
Barfield W. (2015). Fundamentals of wearable computers and augmented reality, CRC press, USA.
Becerik-Gerber B., Ku K. and Jazizadeh F. (2012). BIM-enabled virtual and collaborative construction
engineering and management, Journal of professional issues in engineering education and practice, Vol.
138, No. 3, 234-245.
Behzadan A.H., Aziz Z., Anumba C.J. and Kamat V.R. (2008a). Ubiquitous location tracking for context-
specific information delivery on construction sites, Automation in construction, Vol. 17, No. 6, 737-748
Behzadan A.H., Timm B.W. and Kamat V.R. (2008b). General-purpose modular hardware and software
framework for mobile outdoor augmented reality applications in engineering, Advanced engineering
informatics, Vol. 22, No. 1, 90-105.
Bhatla A. and Leite F. (2012). Integration framework of BIM with the last planner system, In proceedings of the
20th annual conference of the international group for lean construction, San Diego, USA.
Bosché F., Guillemet A., Turkan Y., Haas C.T.and Haas R. (2013). Tracking the built status of MEP works:
assessing the value of a Scan-vs-BIM system, Journal of computing in civil engineering, Vol. 28, No. 4,
05014004.
Bowen D.E. and Youngdahl W.E. (1998). “Lean” service: in defense of a production-line
approach, International journal of service industry management, Vol. 9, No. 3, 207-225.
Brady D.A. (2014). Using visual management to improve transparency in planning and control in construction,
Doctoral dissertation, University of Salford, UK.
Bryde D., Broquetas M. and Volm J.M. (2013). The project benefits of building information modelling (BIM),
International journal of project management, Vol. 31, No. 7, 971-980.
Burrell J. and Gay G.K. (2001). Collectively defining context in a mobile, networked computing environment, In
extended abstracts of the ACM’s Human factors in computing systems conference, pp. 231-232.
Carbonari A., Giretti A. and Naticchia B. (2011). A proactive system for real-time safety management in
construction sites, Automation in construction, Vol. 20, No. 6, 686-698.
Carmigniani J., Furht B., Anisetti M., Ceravolo P., Damiani E. and Ivkovic M. (2011). Augmented reality
technologies, systems and applications, Multimedia tools and applications, Vol. 51, No. 1, 341-377.
Carrillo P., Ruikar K. and Fuller P. (2013). When will we learn? improving lessons learned practice in
construction, International journal of project management, Vol. 31, No. 4, 567-578.
Chae S. and Yoshida T. (2010). Application of RFID technology to prevention of collision accident with heavy
equipment, Automation in construction, Vol. 19, No. 3, 368-374.
Chawla V. and Ha D.S. (2007). An overview of passive RFID, Communications magazine, Vol. 45, No.9, 11-17.
Chen L. and Meng B. (2010). The application of value stream mapping based lean production system,
International journal of business and management, Vol. 5, No. 6, 203-209.
Chi H.L., Kang S.C. and Wang X. (2013). Research trends and opportunities of augmented reality applications in
architecture, engineering, and construction, Automation in construction, Vol. 33, 116-122.
Coleman B.J. and Vaghefi M.R. (1994). Heijunka (?): a key to the Toyota production system, Production and
inventory management journal, Vol. 35, No. 4, 31-35.

ITcon Vol. 22 (2017), Tezel & Aziz, pg. 241
Costin A.M., Teizer J. and Schoner B. (2015). RFID and BIM-enabled worker location tracking to support real-
time building protocol and data visualization, ITcon, Vol. 20, 495-517.
Dave B., Boddy S. and Koskela L. (2013). Challenges and opportunities in implementing Lean and BIM on an
infrastructure project, In proceedings of the 21st annual conference of the international group for lean
construction, Fortaleza, Brazil.
Dave B., Kubler S., Främling K. and Koskela L. (2014). Addressing information flow in lean production
management and control in construction, In proceedings of the 22nd annual conference of the
international group for lean construction, Oslo, Norway.
De Treville S., Antonakis J. and Edelson N.M. (2005). Can standard operating procedures be motivating?
reconciling process variability issues and behavioural outcomes, Total quality management and business
excellence, Vol. 16, No. 2, 231-241.
Dey A.K. (2000). Providing architectural support for building context-aware applications, Doctoral dissertation,
Georgia Institute of Technology.
Dickinson J., Pardasani A., Ahamed S. and Kruithof S. (2009). A survey of automation technology for realising
as-built models of services, In proceedings of the 1st international conference on improving construction
and use through integrated design solutions.
Ding L.Y., Zhou C., Deng Q.X., Luo H.B., Ye X.W., Ni Y.Q. and Guo P. (2013). Real-time safety early warning
system for cross passage construction in Yangtze Riverbed Metro Tunnel based on the internet of things,
Automation in construction, Vol. 36, 25-37.
Dos Santos A. and Powell J.A. (1999). Potential of poka-yoke devices to reduce variability in construction, In
proceedings of the 7th annual conference of the international group for lean construction, Berkeley,
USA.
Eastman C., Eastman C.M., Teicholz P. and Sacks R. (2011). BIM handbook: A guide to building information
modeling for owners, managers, designers, engineers and contractors, John Wiley & Sons, USA.
Emuze F.A. and Saurin T.A. (2015). Value and waste in lean construction, Routledge, UK.
Fathi A., Li Y. and Rehg J.M. (2012). Learning to recognize daily actions using gaze, In proceedings of
the Computer Vision–ECCV, 314-327.
Formoso C.T. and Moura C.B. (2009). Evaluation of the impact of the Last Planner System on the performance
of construction projects, In proceedings of the 17th annual conference of the international group for lean
construction, Taipei, Taiwan.
Formoso C.T., Santos A. d. and Powell J. A. (2002). An exploratory study on the applicability of process
transparency in construction sites, Journal of construction research, Vol. 3, No.1, 35-54.
Frandson A. and Tommelein I.D. (2014). Development of a takt-time plan: a case study, In proceedings of the .
ASCE Construction Research Congress.
Fujimoto T. (1999). The evolution of a manufacturing system at Toyota, Oxford university press, UK.
Galsworth G.D. (1997). Visual systems: harnessing the power of visual workplace, AMACOM, USA.
Galsworth G.D. (2005). Visual workplace: visual thinking, Visual-Lean enterprise press, USA.
Gerber D.J., Becerik-Gerber B. and Kunz A. (2010). Building information modeling and lean construction:
technology, methodology and advances from Practice, In proceedings of the 18th annual conference of
the international group for lean construction, Haifa, Israel.
Golparvar-Fard M., Peña-Mora F., Arboleda C.A. and Lee S. (2009). Visualization of construction progress
monitoring with 4D simulation model overlaid on time-lapsed photographs, Journal of computing in civil
engineering, Vol. 23, No. 6, 391-404.
Greif M. (1991). The visual factory: building participation through shared information, Productivity press,
USA.
ITcon Vol. 22 (2017), Tezel & Aziz, pg. 242
Gubbi J., Buyya R., Marusic S. and Palaniswami M. (2013). Internet of Things (IoT): A vision, architectural
elements, and future directions, Future generation computer systems, Vol. 29, No. 7, 1645-1660.
Gurevich U. and Sacks R. (2014). Examination of the effects of a KanBIM production control system on
subcontractors' task selections in interior works, Automation in construction, Vol. 37, 81-87.
Hamdi O. and Leite F. (2012). BIM and lean interactions from the BIM capability maturity model perspective: a
case study, In proceedings of the 20th annual conference of the international group for lean construction,
San Diego, USA.
Hardin B. and McCool D. (2015). BIM and construction management: proven tools, methods, and workflows,
John Wiley & Sons, USA.
Hashash Y.M.A., Oliveira Filho J.N., Su Y.Y. and Liu L.Y. (2005). 3D laser scanning for tracking supported
excavation construction, Geo-Frontiers, 24-26.
Hirano H. (1995). 5 Pillars of the visual workplace: the sourcebook for 5S implementation, Productivity press,
USA.
Holweg M. (2007). The genealogy of lean production, Journal of operations management, Vol. 25, No. 2, 420-
437.
Huerta-Canepa G. and Lee D. (2010). A virtual cloud computing provider for mobile devices, In proceedings of
the 1st ACM workshop on mobile cloud computing & services: social networks and beyond.
Huntzinger J. (2002). The roots of lean. Training within industry: the origin of kaizen, Association for
manufacturing Excellence, Vol. 18, No. 2, 14-23
Hüttmeir A., de Treville S., van Ackere A., Monnier L. and Prenninger J. (2009). Trading off between heijunka
and just-in-sequence, International journal of production economics, Vol. 118, No. 2, 501-507.
Irizarry J., Gheisari M. and Walker B.N. (2012). Usability assessment of drone technology as safety inspection
tools, ITcon, Vo.17, 194-212.
Irizarry J., Gheisari M., Williams G. and Walker B.N. (2013). InfoSPOT: a mobile Augmented Reality method
for accessing building information through a situation awareness approach, Automation in
construction, Vol. 33, 11-23.
Jang J.W. and Kim Y.W. (2007). Using the kanban for construction production and safety control, In
proceedings of the 15th annual conference of the international group for lean construction, Michigan,
USA.
Jansen Y., Dragicevic P., Isenberg P., Alexander J., Karnik A., Kildal J., ... and Hornbæk, K. (2015).
Opportunities and challenges for data physicalization. In proceedings of the 33rd annual acm conference
on human factors in computing systems, 3227-3236.
Jaselskis E.J., Gao Z. and Walters R.C. (2005). Improving transportation projects using laser scanning, Journal
of construction engineering and management, Vol. 131, No. 3, 377-384.
Johansen E. and Walter L. (2007). Lean construction: prospects for the German construction industry, Lean
construction journal, Vol. 3, No. 1, 19-32.
Jongeling R and Olofsson T. (2007). A method for planning of work-flow by combined use of location-based
scheduling and 4D CAD, Automation in construction, Vol. 16, No. 2, 189-198.
Kattman B., Corbin T.P., Moore L.E. and Walsh L. (2012). Visual workplace practices positively impact
business processes, Benchmarking: an international journal, Vol. 19, No. 3, 412-430.
Kelm A., Laußat L., Meins-Becker A., Platz D., Khazaee M.J., Costin, A. M., ... and Teizer, J. (2013). Mobile
passive Radio Frequency Identification (RFID) portal for automated and rapid control of Personal
Protective Equipment (PPE) on construction sites, Automation in construction, Vol. 36, 38-52.
ITcon Vol. 22 (2017), Tezel & Aziz, pg. 243
Kemmer S.L., Saraiva M.A., Heineck L.F., Pacheco A.V.L., Novaes M.D.V., Mourão C.A.M.A. and Moreira
L.C.R. (2006). The use of andon in high rise building, In proceedings of the 14th annual conference of
the international group for lean construction, Santiago, Chile.
Kenley R. and Seppänen O. (2009). Location-based management of construction projects: part of a new typology
for project scheduling methodologies, In proceedings of the winter simulation conference, 2563-2570.
Kirchbach K., Koskela L. and Gehbauer, F. (2014). Digital kanban for earthwork site management, In
proceedings of the 22nd annual conference of the international group for lean construction, Oslo,
Norway.
Kim J. and Shim D.H. (2013). A vision-based target tracking control system of a quadrotor by using a tablet
computer, In proceedings of the international conference on Unmanned Aircraft Systems (ICUAS), 1165-
1172.
Kim M.J. (2013). A framework for context immersion in mobile augmented reality, Automation in
construction, Vol. 33, 79-85.
Knibbe J., Benko H. and Wilson A.D. (2015). Juggling the effects of latency: motion prediction approaches to
reducing latency in dynamic projector-camera systems, Microsoft research technical report MSR-TR-
2015--35.
Ko C.H. and Kuo J.D. (2015). Making formwork construction lean, Journal of civil engineering and
management, Vol. 21, No. 4, 444-458.
Kortuem G., Kawsar F., Fitton D. and Sundramoorthy V. (2010). Smart objects as building blocks for the
internet of things, Internet computing, Vol. 14, No. 1, 44-51.
Koskela L. (1992). Application of the new production philosophy to construction, Department of Civil
Engineering, Stanford University, Palo Alto, USA.
Kuula T., Piira K., Seisto A., Hakkarainen M. and Woodward C. (2012). User requirements for mobile AR and
BIM utilization in building life cycle management, In proceedings of 12th international conference on
construction applications of virtual reality (CONVR 2012), 203-21.
Lee J.H., Song J.H., Oh K.S. and Gu, N. (2013). Information lifecycle management with RFID for material
control on construction sites, Advanced engineering informatics, Vol. 27, No. 1, 108-119.
Liff S. and Posey P.A. (2004). Seeing is believing: how the new art of visual management can boost
performance throughout your organization, AMACOM, USA.
Liker J.K. (2004). The Toyota way: 14 management principles from the world's greatest manufacturer,
McGraw-Hill, USA.
Lin Y.C., Cheung W.F. and Siao F.C. (2014). Developing mobile 2D barcode/RFID-based maintenance
management system, Automation in construction, Vol. 37, 110-121
Lu W., Huang G.Q. and Li H. (2011). Scenarios for applying RFID technology in construction project
management, Automation in construction, Vol. 20, No. 2, 101-106.
Madden L. (2011). Professional augmented reality browsers for smartphones: programming for junaio, layar
and wikitude, John Wiley & Sons, USA.
Mariz R.N., Picchi F.A., Granja A.D. and Melo R.S.S. (2012). A review of the standardized work application in
construction, In proceedings of the 20th annual conference of the international group for lean
construction, San Diego, USA.
Mastroianni R. and Abdelhamid T. (2003). The challenge: the impetus for change to lean project delivery, In
proceedings of the 11th annual conference of the international group for lean construction, Blacksburg,
USA.
Maylor H. (2001). Beyond the Gantt chart:: Project management moving on, European management
journal, Vol. 19, No. 1, 92-100.

ITcon Vol. 22 (2017), Tezel & Aziz, pg. 244
Meža S., Turk Ž. and Dolenc M. (2015). Measuring the potential of augmented reality in civil engineering,
Advances in engineering software, Vol. 90, 1-10.
Miorandi D., Sicari S. ,De Pellegrini F. and Chlamtac I. (2012). Internet of things: vision, applications and
research challenges, Ad hoc networks, Vo.10, No.7, 1497-1516.
Monden Y. (1998). Toyota production system: an integrated approach to just-in-time, Engineering and
management press, USA.
Moselhi O. and El-Omari S. (2006). Integrating bar coding and RFID to automate data collection from
construction sites, In proceedings of the joint international conference on computing and decision making
in civil and building engineering, 1734-1741
Moser L. and Dos Santos A. (2003). Exploring the role of visual controls on mobile cell manufacturing: a case
study on drywall technology, In proceedings of the 11th annual conference of the international group for
lean construction, Blacksburg, USA.
Nakagawa Y. (2005). Importance of standard operating procedure documents and visualisation to implement
lean construction, In proceedings of the 13th annual conference of the international group for lean
construction, Sydney, Australia.
Nee A.Y.C., Ong S.K., Chryssolouris G. and Mourtzis D. (2012). Augmented reality applications in design and
manufacturing, CIRP annals-manufacturing technology, Vol. 61, No. 2, 657-679.
Ortiz C.A. and Park M. (2011). Visual controls: applying visual management to the factory, CRC press, USA.
Osada T. (1991). The 5S’s, The Asian productivity organisation, USA.
Parrish K., Tommelein I.D. and Ballard G. (2009). Use of A3 reports to focus design and construction
conversations, In proceedings of the construction research congress for building a sustainable future
Parry G.C. and Turner C.E. (2006). Application of lean visual process management tools, Production planning
& control, Vol. 17, No. 1, 77-86.
Pashtan A. (2005). Mobile web services, Cambridge university press, UK.
Perera C., Zaslavsky A., Christen P. and Georgakopoulos D. (2014). Context aware computing for the internet of
things: a survey, Communications surveys & tutorials, Vol. 16, No. 1, 414-454.
Plessky V.P. and Reindl L.M. (2010). Review on SAW RFID tags, Ultrasonics, ferroelectrics, and frequency
control, Vol. 57, No. 3, 654-668.
Poksinska B. (2010). The current state of Lean implementation in health care: literature review, Quality
management in healthcare, Vol. 19, No. 4, 319-329.
Poppendieck M. and Poppendieck T. (2003). Lean software development: an agile toolkit, Addison-wesley,
USA.
Randall T. (2011). Construction engineering requirements for integrating laser scanning technology and building
information modelling, Journal of construction engineering and management, Vol. 137, No. 10, 797-805.
Redmond A., Hore A., Alshawi M. and West R. (2012). Exploring how information exchanges can be enhanced
through Cloud BIM, Automation in construction, Vol. 24, 175-183.
Rüppel, U. and Schatz K. (2011). Designing a BIM-based serious game for fire safety evacuation
simulations, Advanced engineering informatics, Vol. 25, No. 4, 600-611.
Sacks R., Koskela L., Dave B.A. and Owen R. (2010a). Interaction of lean and building information modeling in
construction, Journal of construction engineering and management, Vol. 136, No. 9, 968-980.
Sacks R., Radosavljevic M. and Barak R. (2010b). Requirements for building information modeling based lean
production management systems for construction, Automation in construction, Vol. 19, No. 5, 641-655.

ITcon Vol. 22 (2017), Tezel & Aziz, pg. 245
Saidi K.S., Teizer J., Franaszek M. and Lytle A.M. (2011). Static and dynamic performance evaluation of a
commercially-available ultra wideband tracking system, Automation in construction, Vol. 20, No, 5, 519-
530.
Salem O., Solomon J., Genaidy A. and Luegring M. (2005). Site implementation and assessment of lean
construction techniques, Lean construction journal, Vol. 2, No. 2, 1-21.
Saurin T.A., Ribeiro J.L.D. and Vidor G. (2012). A framework for assessing poka-yoke devices, Journal of
manufacturing systems, Vol. 31, No. 3, 358-366.
Schall G., Mendez E., Kruijff E., Veas E., Junghanns S., Reitinger B. and Schmalstieg D. (2009). Handheld
augmented reality for underground infrastructure visualization, Personal and ubiquitous computing, Vol.
13, No. 4, 281-291.
Schwald B., Figue J., Chauvineau E., Vu-Hong F., Robert A., Arbolino M., ... and Baldo O. (2001).
STARMATE: using Augmented Reality technology for computer guided maintenance of complex
mechanical elements, E-work and E-commerce, Vol. 1, 196-202
Seppänen O., Ballard G. and Pesonen, S. (2010). The combination of last planner system and location-based
management system, Lean construction journal, Vol. 6, No. 1, 43-54.
Shahi A., West J.S. and Haas C.T. (2013). Onsite 3D marking for construction activity tracking, Automation in
construction, Vol. 30, 136-143
Shen W., Hao Q. and Xue Y. (2012). A loosely coupled system integration approach for decision support in
facility management and maintenance, Automation in construction, Vol. 25, 41-48.
Shen Y., Ong S.K.and Nee A.Y. (2006). A framework for multiple-view product representation using
Augmented Reality, In proceedings of the international cyberworlds conference, 157-164
Shen Y., Ong S.K. and Nee A.Y.C. (2010). Augmented reality for collaborative product design and
development, Design studies, Vol. 31, No. 2, 118-145.
Shingo S. (1986). Zero quality control: source inspection and the poka-yoke system, Productivity press, USA.
Shook J. (2008). Managing to learn: using the A3 management process to solve problems, gain agreement,
mentor and lead, Lean Enterprise Institute, USA.
Siebert S. and Teizer J. (2014). Mobile 3D mapping for surveying earthwork projects using an Unmanned Aerial
Vehicle (UAV) system, Automation in construction, Vol. 41, 1-14.
Son J., Aziz Z. and Peña-Mora F. (2008). Supporting disaster response and recovery through improved situation
awareness, Structural survey, Vol. 26 No. 5, 411-425.
Sterling B. (2005). Shaping things - mediaworks pamphlets, The MIT press, USA.
Su Y.Y., Hashash Y.M.A. and Liu L.Y. (2006). Integration of construction as-built data via laser scanning with
geotechnical monitoring of urban excavation, Journal of construction engineering and management, Vol.
132, No. 12, 1234-1241.
Sui Pheng L. and Hui Ming K. (1997). Formulating a strategic marketing mix for quantity surveyors, Marketing
intelligence & planning, Vol. 15, No. 6, 273-280.
Sultan N. and Bunt-Kokhuis, S. (2012). Organisational culture and cloud computing: coping with a disruptive
innovation, Technology analysis & strategic management, Vol. 24, No. 2, 167-179.
Suzaki K. (1993). New shop floor management: empowering people for continuous improvement, Simon and
Schuster, USA.
Swedberg, C. (2014). RFID-reading drone tracks structural steel products in storage yard, RFID journal,
available at: http://www.rfidjournal.com/articles/view?12209.

ITcon Vol. 22 (2017), Tezel & Aziz, pg. 246
Tang P., Huber D., Akinci B., Lipman R. and Lytle A. (2010). Automatic reconstruction of as-built building
information models from laser-scanned point clouds: a review of related techniques, Automation in
construction, Vol. 19, No. 7, 829-843.
Teizer, J. (2015). Wearable, wireless identification sensing platform: self-monitoring alert and reporting
technology for hazard avoidance and training (SmartHat), ITcon, Vol. 20, 295-312.
Tezel A., Koskela L., Tzortzopoulos P., Formoso C.T. and Alves T. (2015). Visual management in Brazilian
construction companies: taxonomy and guidelines for implementation, Journal of management in
engineering, Vol. 31, No. 6, 05015001.
Tommelein I.D. (2008). 'Poka-yoke' or quality by mistake proofing desıgn and construction systems, In
proceedings of the 16th annual conference of the international group for lean construction, Manchester,
UK.
Turkan Y., Bosche F., Haas C.T. and Haas, R. (2012). Automated progress tracking using 4D schedule and 3D
sensing technologies, Automation in construction, Vol. 22, 414-421.
Varela G., Caamamo P., Orjales F., Deibe Á., López-Peña F. and Duro R. J. (2011). Swarm intelligence based
approach for real time UAV team coordination in search operations, In proceedings of the 3rd world
congress on nature and biologically inspired computing (nabic), pp. 365-370)
Volk R., Stengel J. and Schultmann F. (2014). Building Information Modeling (BIM) for existing buildings—
literature review and future needs, Automation in construction, Vol. 38, 109-127.
Walters R., Jaselskis E., Zhang J., Mueller K. and Kaewmoracharoen M. (2008). Using scanning lasers to
determine the thickness of concrete pavement. Journal of construction engineering and
management, Vol. 134, No. 8, 583-591.
Wang X., Kim M.J., Love P.E. and Kang S.C. (2013). Augmented Reality in built environment: classification
and implications for future research, Automation in construction, Vol. 32, 1-13.
Webster A., Feiner S., MacIntyre B., Massie W. and Krueger T. (1996). Augmented reality in architectural
construction, inspection and renovation, In proceedings of the 3rd ASCE congress on computing in civil
engineering, 913-919
Weiser M. (1991). The computer for the 21st century. Scientific american, Vol. 265, No. 3, 94-104.
Westoby M.J., Brasington J., Glasser N.F., Hambrey M.J. and Reynolds J.M. (2012). ‘Structure-from-
Motion’photogrammetry: a low-cost, effective tool for geoscience applications, Geomorphology, Vol.
179, 300-314.
Woodward C., Hakkarainen M., Korkalo O., Kantonen T., Aittala M., Rainio K. and Kähkönen K. (2010).
Mixed reality for mobile construction site visualization and communication, In proceedings of the 10th
international conference on construction applications of virtual reality (CONVR2010), 4-5.
Womack J.P., Jones D.T. and Roos D. (1990). The machine that changed the world, Rawson associates, New
York, USA.
Womack S.K., Armstrong T.J. and Liker J.K. (2009). Lean job design and musculoskeletal disorder risk: a two
plant comparison, Human factors and ergonomics in manufacturing & service industries, Vol. 19, No. 4,
279-293.
Xanthopoulos A.S., Koulouriotis D.E. and Botsaris P.N. (2015). Single-stage kanban system with deterioration
failures and condition-based preventive maintenance, Reliability engineering & system safety, Vol. 142,
111-122.
Yabuki N. (2010). Toward adoption of virtual construction in the infrastructure domain, Journal of society for
social management systems, SMS10-160.
Zhang C. and Arditi D. (2013). Automated progress control using laser scanning technology, Automation in
construction, Vol. 36, 108-116.


![Exploring visual attention and saliency modeling for task-based visual …€¦ · Exploring visual attention and saliency modeling for task-based visual analysis ... [22–24], computer](https://static.fdocuments.us/doc/165x107/5f0c58647e708231d434f0d8/exploring-visual-attention-and-saliency-modeling-for-task-based-visual-exploring.jpg)


