From Climate Risk to Financial Risk
39
From Climate Risk to Financial Risk: Climate scenarios, transition risk and climate stress- tests for financial institutions Stefano Battiston (Univ. of Zurich and Univ. of Venice) MATLAB Finance Conference. Climate finance panel Webinar Sept 30 2021 DISCLAIMER: reproduction of this material is not permitted without the consent of the author and appropriate citation of the publications cited in the slides
Transcript of From Climate Risk to Financial Risk
From Climate Risk to Financial Risk:Climate scenarios, transition risk and climate stress-
tests for financial institutions
Stefano Battiston (Univ. of Zurich and Univ. of Venice)
MATLAB Finance Conference. Climate finance panel Webinar
Sept 30 2021
DISCLAIMER: reproduction of this material is not permitted without the consent of the author and appropriate citation of the publications cited in the slides
Climate-related financial risk• Scientific evidence known since two decades (IPCC 2013, 2018) about:
– physical risk of unmitigated climate change– scale and pace of transformation required for mitigation
• Characteristics of climate risk (Battiston ea. 2017 Nat Clim. Ch.; Battiston 2019 in Banque de France FSR; Monasterolo 2020 Ann. Rev. Res. Econ.) – endogeneity: perceptions of climate risk impact on policy and investment decisions that make
difference between succeeding and failing mitigation– deep uncertainty: resulting from endogeneity + climate model uncertainy– tipping points: irreversible changes in system earth dynamics
• Climate risk recognised by financial authorities as source of financial risk only recently (NGFS 2019). Major step ahead. Yet, much work to do.
Stefano Battiston (UZH and UNIVE) 2
Climate risk: the mitigation challenge• Remarkable growth of sustainable finance (under various labels e.g. ESG, etc.). Yet
all economies failed to deliver emissions reductions under Paris Agreement. • Limiting global warming below 2C (Paris Agreement) requires profound
transformation of energy and production systems and consumption patterns • Scale and pace of transformation:
• large portions of assets are affected
• need for proactive role of financial system in reallocation of capital from high to low-carbon activities: can we take this for granted?
• transition risk stemming from expectations about the future scenarios
• Financial risk is key driver of financial actors’ investment decisions. Outcome of the transition depends on whether climate-related risk is taken into account by businesses and financial institutions.
• What conceptual framework to assess climate transition risk?
Stefano Battiston (UZH and UNIVE) 3
2021 Stefano Battiston, UZH and UNIVE Page 4
Assessment of transition risk: conceptual framework
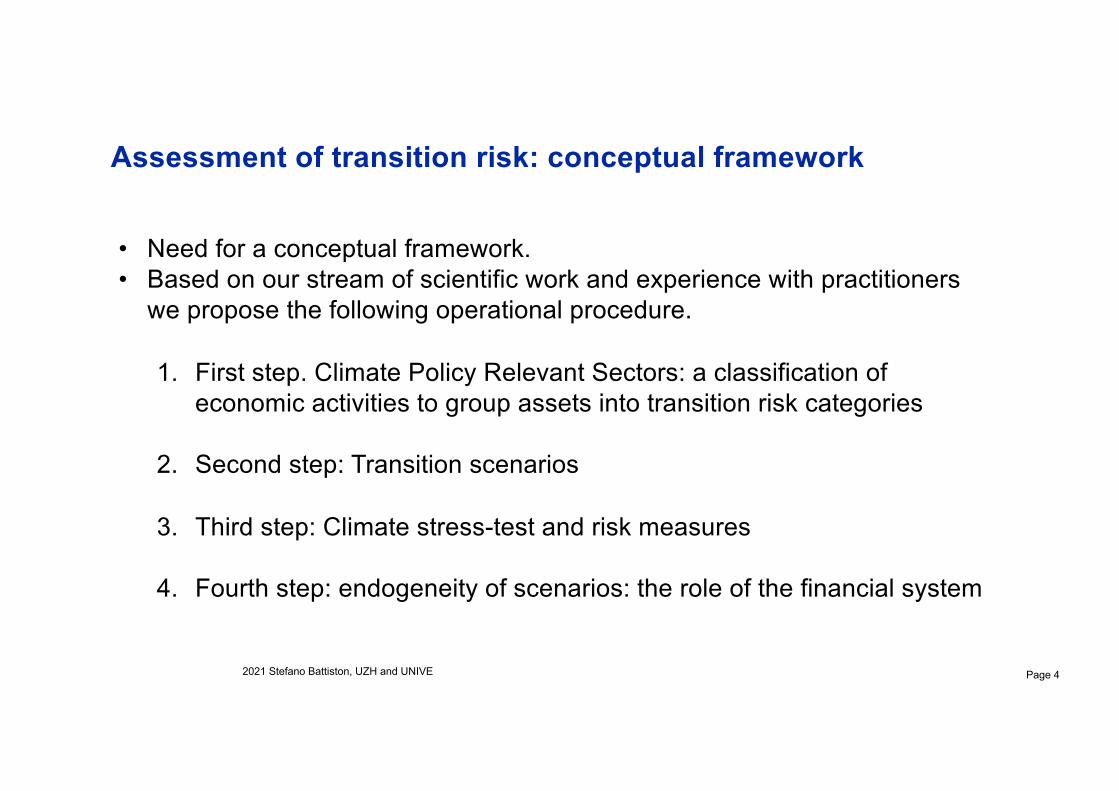
• Need for a conceptual framework. • Based on our stream of scientific work and experience with practitioners
we propose the following operational procedure.
1. First step. Climate Policy Relevant Sectors: a classification of economic activities to group assets into transition risk categories
2. Second step: Transition scenarios
3. Third step: Climate stress-test and risk measures
4. Fourth step: endogeneity of scenarios: the role of the financial system
2021 Stefano Battiston, UZH and UNIVE Page 5
First step. Classification of economic activities wrt to transition risk
GHG Emission Accounting. Issues for assessing transition risk
2021 Stefano Battiston, UZH and UNIVE
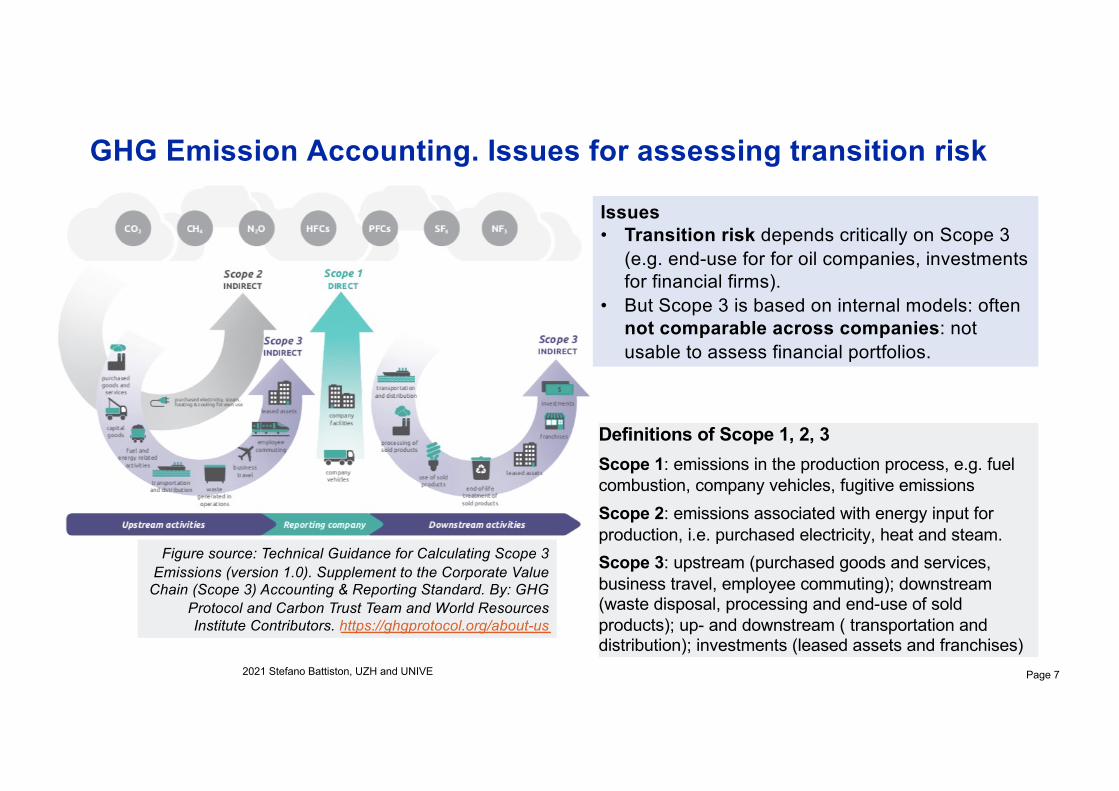
Definitions of Scope 1, 2, 3Scope 1: emissions in the production process, e.g. fuelcombustion, company vehicles, fugitive emissionsScope 2: emissions associated with energy input forproduction, i.e. purchased electricity, heat and steam.Scope 3: upstream (purchased goods and services, business travel, employee commuting); downstream(waste disposal, processing and end-use of soldproducts); up- and downstream ( transportation anddistribution); investments (leased assets and franchises)
Figure source: Technical Guidance for Calculating Scope 3 Emissions (version 1.0). Supplement to the Corporate Value
Chain (Scope 3) Accounting & Reporting Standard. By: GHG Protocol and Carbon Trust Team and World Resources Institute Contributors. https://ghgprotocol.org/about-us
Page 7
Issues• Transition risk depends critically on Scope 3
(e.g. end-use for for oil companies, investmentsfor financial firms).
• But Scope 3 is based on internal models: oftennot comparable across companies: not usable to assess financial portfolios.
Climate Policy Relevant SectorsMotivation• GHG emission indicators useful to track emission reductions, but not sufficient. E.g.
an electricity company with coal-based plants could reduce Scope 1 emissions intensity by expanding its business line in electricity trading.
• Tracking production and investments across technologies is also needed.
• Standard classifications of economic activities (NACE, NAICS, ISIC) include ~ 1000 sectors (at 4 digits). Designed for national accounting, but not for climate risk.
Problem: can we group NACE sectors in few categories with distinct features in terms of transition risk? Solution: 1. Identify key dimensions in energy value chain, policy processes, business model2. Remap NACE 4 digit codes into categories CPRS (level 1, 2, granular)
3. CPRS categories can be applied immediately across portfolios and jurisdictions.
Page 9Stefano Battiston (UZH), SNB-FINMA transition risk project 2021.06.16
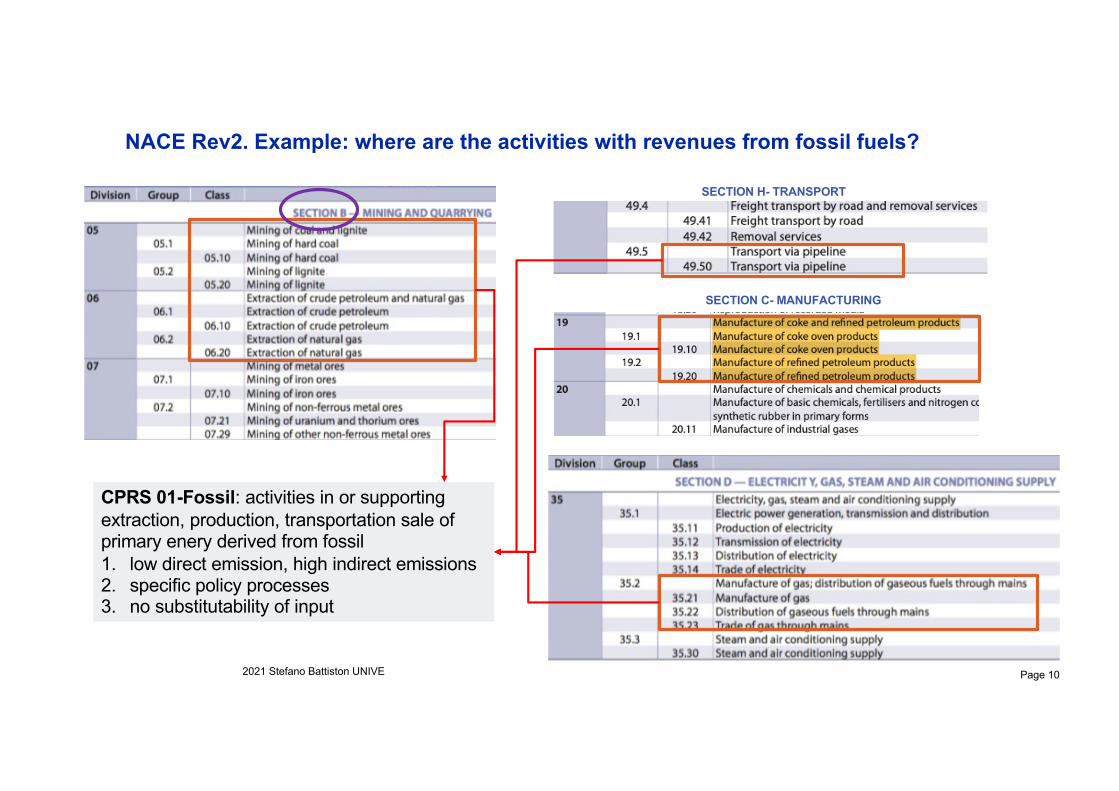
NACE Rev2. Example: where are the activities with revenues from fossil fuels?
2021 Stefano Battiston UNIVE Page 10
SECTION C- MANUFACTURING
CPRS 01-Fossil: activities in or supporting extraction, production, transportation sale of primary enery derived from fossil1. low direct emission, high indirect emissions2. specific policy processes3. no substitutability of input
SECTION H- TRANSPORT
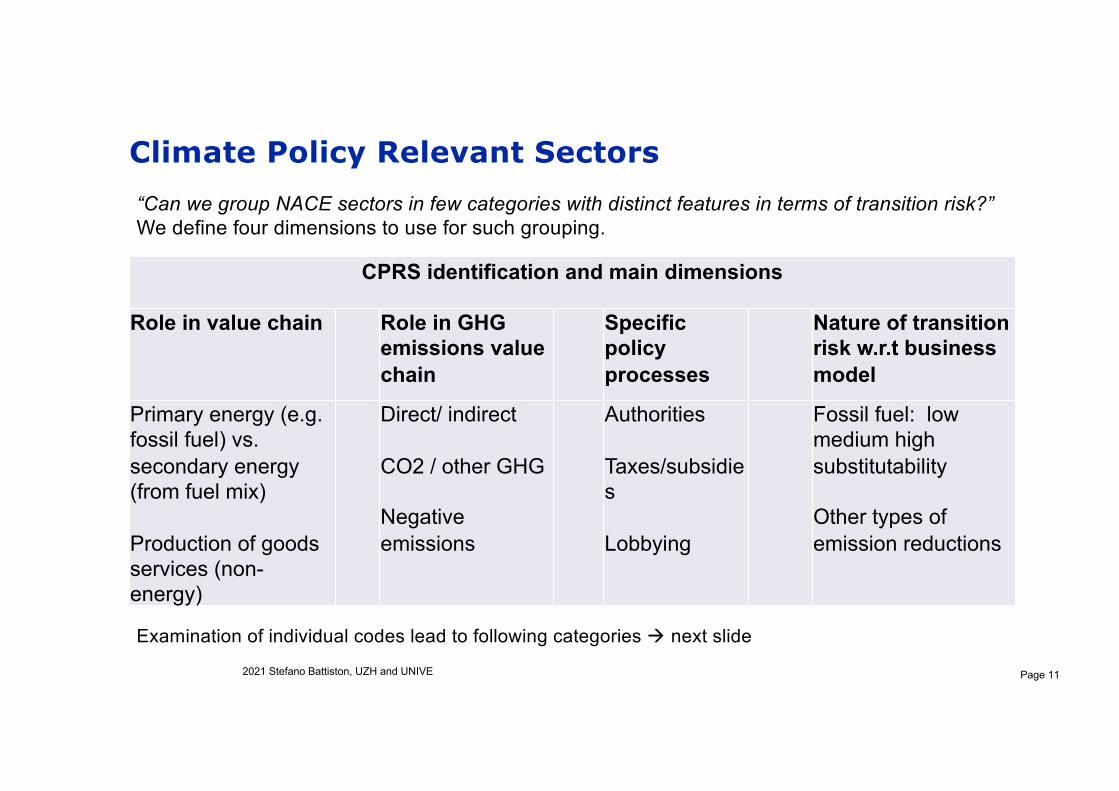
Climate Policy Relevant Sectors
CPRS identification and main dimensions
Role in value chain Role in GHG emissions valuechain
Specificpolicyprocesses
Nature of transitionrisk w.r.t businessmodel
Primary energy (e.g. fossil fuel) vs. secondary energy(from fuel mix)
Production of goodsservices (non-energy)
Direct/ indirect
CO2 / other GHG
Negative emissions
Authorities
Taxes/subsidies
Lobbying
Fossil fuel: lowmedium high substitutability
Other types ofemission reductions
2021 Stefano Battiston, UZH and UNIVE Page 11
“Can we group NACE sectors in few categories with distinct features in terms of transition risk?”We define four dimensions to use for such grouping.
Examination of individual codes lead to following categories à next slide
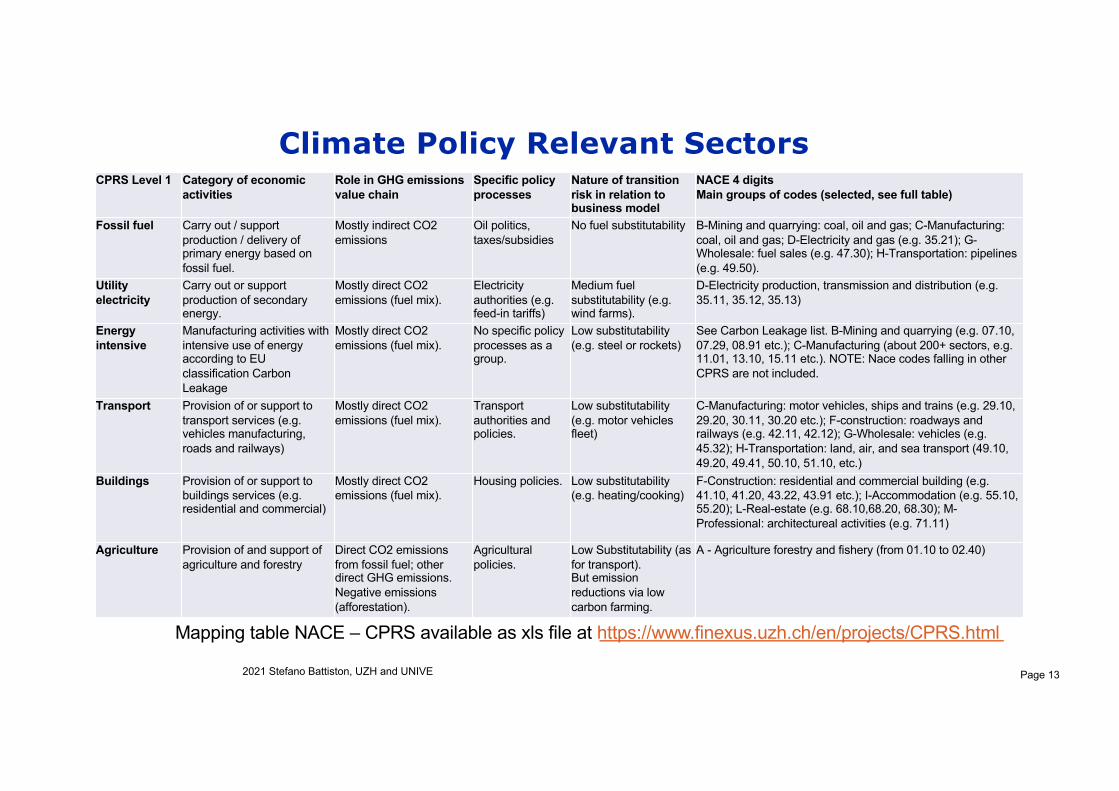
Climate Policy Relevant SectorsCPRS Level 1 Category of economic
activitiesRole in GHG emissionsvalue chain
Specific policyprocesses
Nature of transitionrisk in relation tobusiness model
NACE 4 digitsMain groups of codes (selected, see full table)
Fossil fuel Carry out / support production / delivery of primary energy based on fossil fuel.
Mostly indirect CO2 emissions
Oil politics, taxes/subsidies
No fuel substitutability B-Mining and quarrying: coal, oil and gas; C-Manufacturing: coal, oil and gas; D-Electricity and gas (e.g. 35.21); G-Wholesale: fuel sales (e.g. 47.30); H-Transportation: pipelines (e.g. 49.50).
Utility electricity
Carry out or support production of secondary energy.
Mostly direct CO2 emissions (fuel mix).
Electricity authorities (e.g. feed-in tariffs)
Medium fuel substitutability (e.g. wind farms).
D-Electricity production, transmission and distribution (e.g. 35.11, 35.12, 35.13)
Energy intensive
Manufacturing activities with intensive use of energy according to EU classification Carbon Leakage
Mostly direct CO2 emissions (fuel mix).
No specific policy processes as a group.
Low substitutability (e.g. steel or rockets)
See Carbon Leakage list. B-Mining and quarrying (e.g. 07.10, 07.29, 08.91 etc.); C-Manufacturing (about 200+ sectors, e.g. 11.01, 13.10, 15.11 etc.). NOTE: Nace codes falling in other CPRS are not included.
Transport Provision of or support to transport services (e.g. vehicles manufacturing, roads and railways)
Mostly direct CO2 emissions (fuel mix).
Transport authorities and policies.
Low substitutability (e.g. motor vehicles fleet)
C-Manufacturing: motor vehicles, ships and trains (e.g. 29.10, 29.20, 30.11, 30.20 etc.); F-construction: roadways and railways (e.g. 42.11, 42.12); G-Wholesale: vehicles (e.g. 45.32); H-Transportation: land, air, and sea transport (49.10, 49.20, 49.41, 50.10, 51.10, etc.)
Buildings Provision of or support to buildings services (e.g. residential and commercial)
Mostly direct CO2 emissions (fuel mix).
Housing policies. Low substitutability (e.g. heating/cooking)
F-Construction: residential and commercial building (e.g. 41.10, 41.20, 43.22, 43.91 etc.); I-Accommodation (e.g. 55.10, 55.20); L-Real-estate (e.g. 68.10,68.20, 68.30); M-Professional: architectureal activities (e.g. 71.11)
Agriculture Provision of and support of agriculture and forestry
Direct CO2 emissions from fossil fuel; other direct GHG emissions. Negative emissions (afforestation).
Agricultural policies.
Low Substitutability (as for transport). But emission reductions via low carbon farming.
A - Agriculture forestry and fishery (from 01.10 to 02.40)
2021 Stefano Battiston, UZH and UNIVE Page 13
Mapping table NACE – CPRS available as xls file at https://www.finexus.uzh.ch/en/projects/CPRS.html
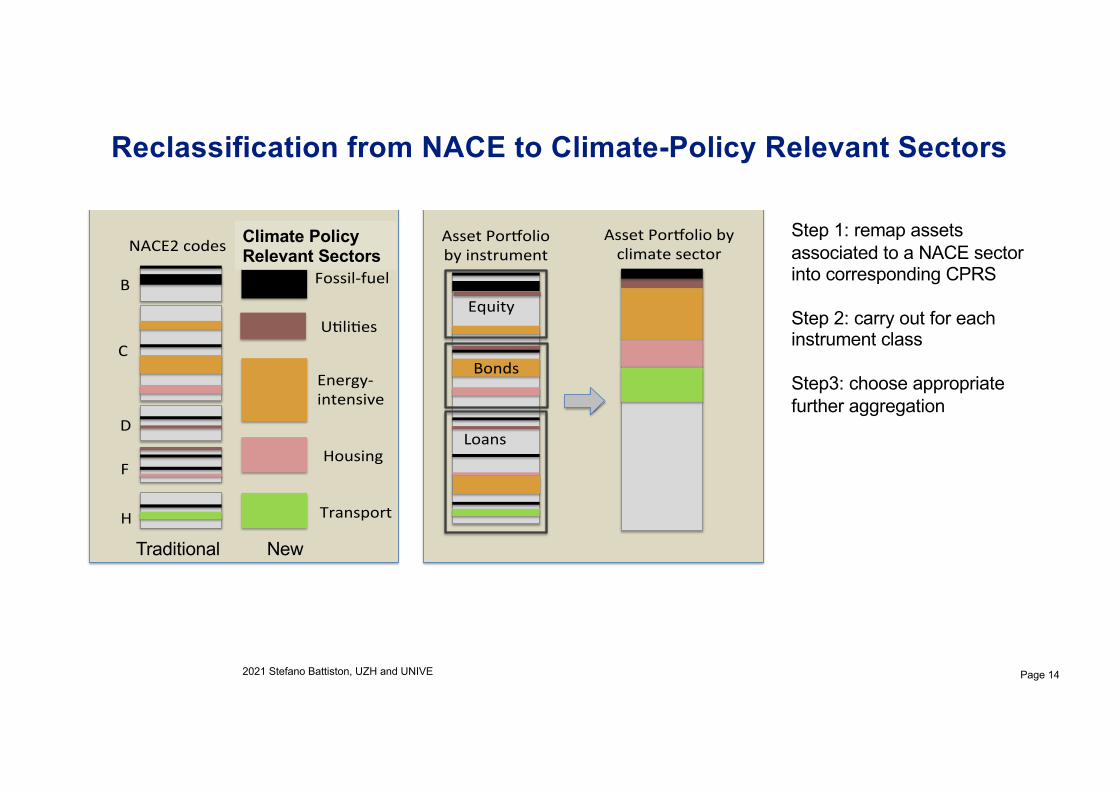
Reclassification from NACE to Climate-Policy Relevant Sectors
2021 Stefano Battiston, UZH and UNIVE Page 14
Fossil-fuel
U,li,es
Energy-intensive
Housing
Transport
B
C
D
F
H
NACE2codesClimate-sensi,vesectors
AssetPorBoliobyinstrument
Equity
Bonds
Loans
Reclassifica,onofeconomicsectorsfromNACE2intoclimate-sensi,vesectors
Classifica,onofassetsaccordingtoinstrumentandclimate-sensi,vesectors
AssetPorBoliobyclimatesector
Traditional New
Climate Policy Relevant Sectors
Step 1: remap assets associated to a NACE sector into corresponding CPRS
Step 2: carry out for each instrument class
Step3: choose appropriate further aggregation
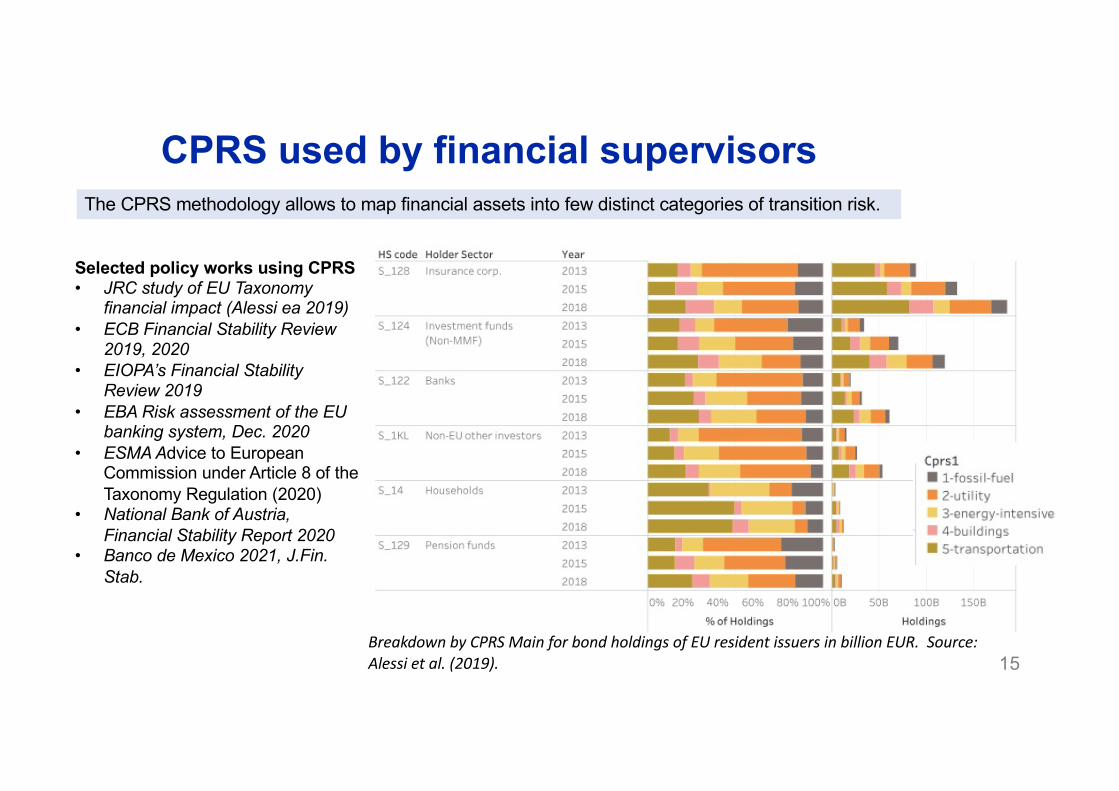
CPRS used by financial supervisors
Breakdown by CPRS Main for bond holdings of EU resident issuers in billion EUR. Source: Alessi et al. (2019).
Selected policy works using CPRS• JRC study of EU Taxonomy
financial impact (Alessi ea 2019)• ECB Financial Stability Review
2019, 2020• EIOPA’s Financial Stability
Review 2019• EBA Risk assessment of the EU
banking system, Dec. 2020• ESMA Advice to European
Commission under Article 8 of the Taxonomy Regulation (2020)
• National Bank of Austria, Financial Stability Report 2020
• Banco de Mexico 2021, J.Fin. Stab.
15
The CPRS methodology allows to map financial assets into few distinct categories of transition risk.
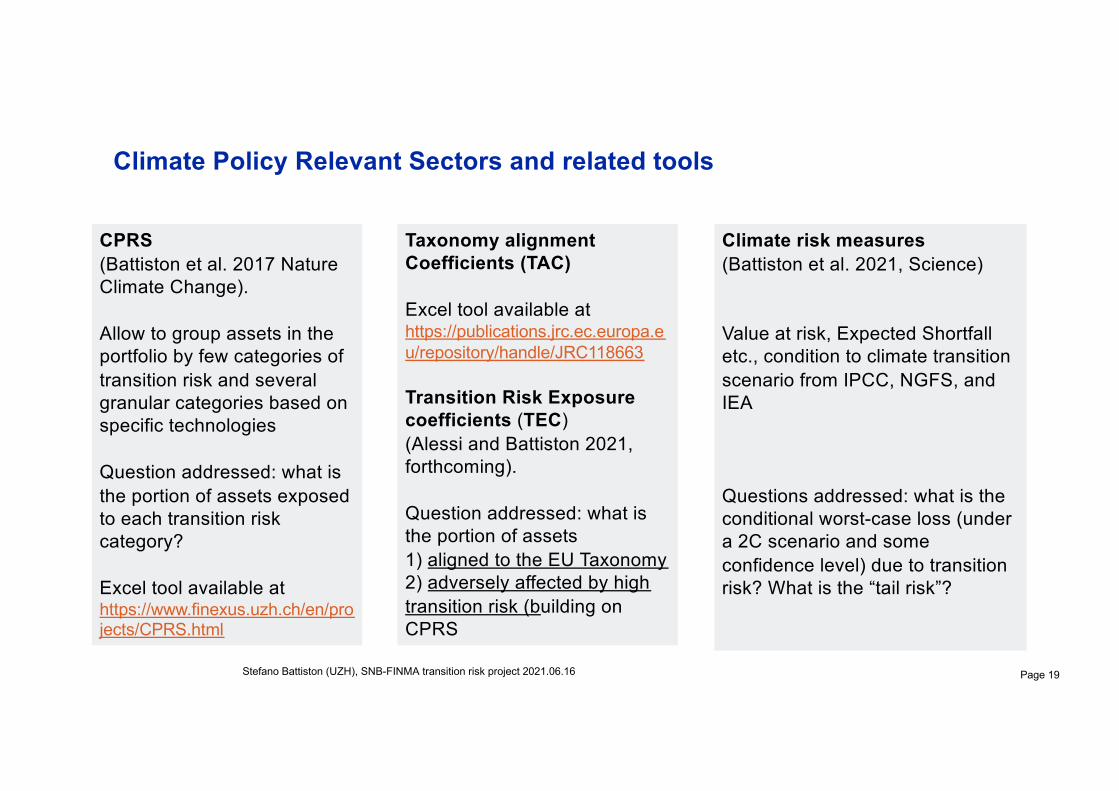
Climate Policy Relevant Sectors and related tools
Page 19Stefano Battiston (UZH), SNB-FINMA transition risk project 2021.06.16
CPRS(Battiston et al. 2017 Nature Climate Change).
Allow to group assets in the portfolio by few categories of transition risk and several granular categories based on specific technologies
Question addressed: what is the portion of assets exposed to each transition risk category?
Excel tool available athttps://www.finexus.uzh.ch/en/projects/CPRS.html
Climate risk measures (Battiston et al. 2021, Science)
Value at risk, Expected Shortfall etc., condition to climate transition scenario from IPCC, NGFS, and IEA
Questions addressed: what is the conditional worst-case loss (under a 2C scenario and some confidence level) due to transition risk? What is the “tail risk”?
Taxonomy alignment Coefficients (TAC)
Excel tool available at https://publications.jrc.ec.europa.eu/repository/handle/JRC118663
Transition Risk Exposure coefficients (TEC) (Alessi and Battiston 2021, forthcoming).
Question addressed: what is the portion of assets 1) aligned to the EU Taxonomy 2) adversely affected by high transition risk (building on CPRS
2021 Stefano Battiston, UZH and UNIVE Page 20
Second step. Transition scenarios.
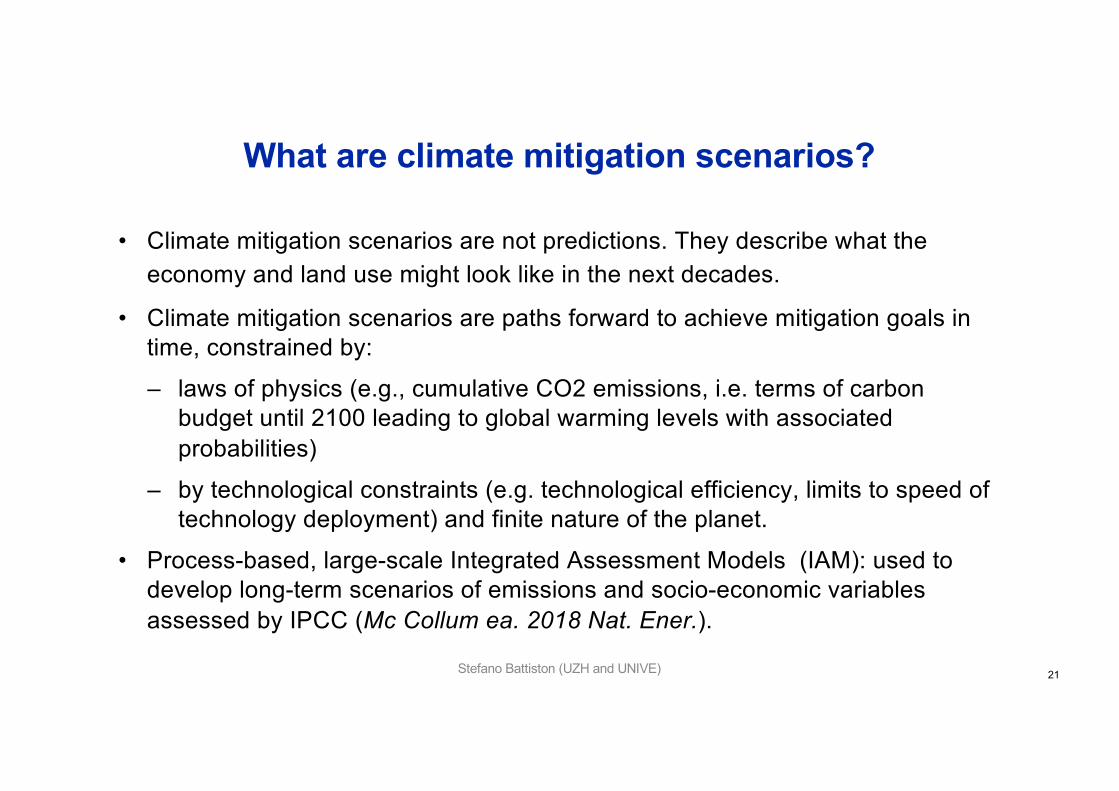
What are climate mitigation scenarios?
• Climate mitigation scenarios are not predictions. They describe what the economy and land use might look like in the next decades.
• Climate mitigation scenarios are paths forward to achieve mitigation goals in time, constrained by:
– laws of physics (e.g., cumulative CO2 emissions, i.e. terms of carbon budget until 2100 leading to global warming levels with associated probabilities)
– by technological constraints (e.g. technological efficiency, limits to speed of technology deployment) and finite nature of the planet.
• Process-based, large-scale Integrated Assessment Models (IAM): used to develop long-term scenarios of emissions and socio-economic variables assessed by IPCC (Mc Collum ea. 2018 Nat. Ener.).
Stefano Battiston (UZH and UNIVE) 21
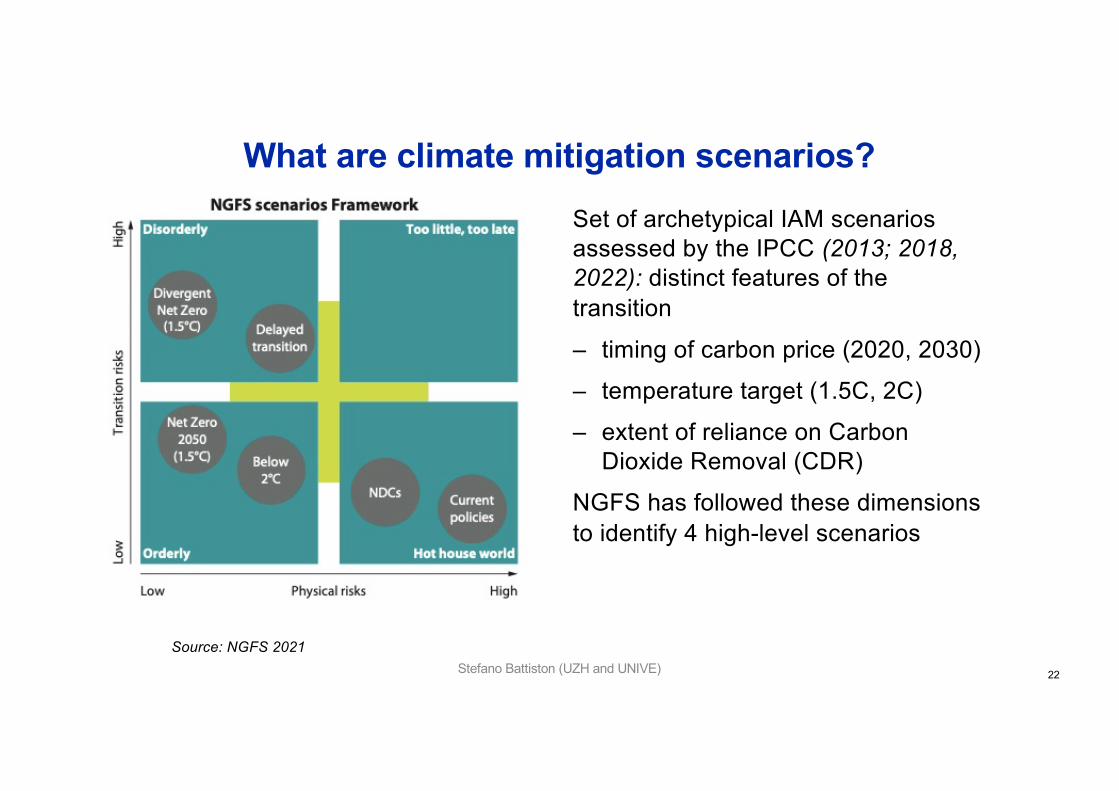
What are climate mitigation scenarios?Set of archetypical IAM scenarios assessed by the IPCC (2013; 2018, 2022): distinct features of the transition
– timing of carbon price (2020, 2030)
– temperature target (1.5C, 2C)
– extent of reliance on Carbon Dioxide Removal (CDR)
NGFS has followed these dimensions to identify 4 high-level scenarios
Source: NGFS 2021Stefano Battiston (UZH and UNIVE) 22
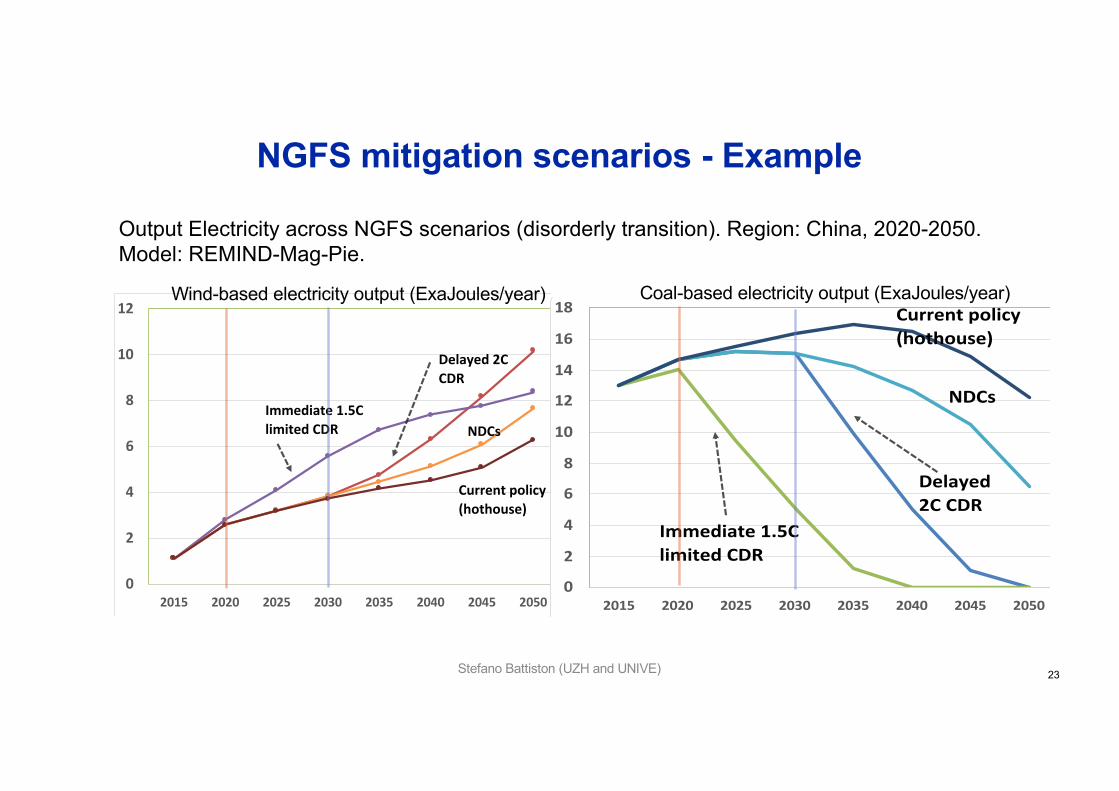
NGFS mitigation scenarios - Example
0
2
4
6
8
10
12
14
16
18
2015 2020 2025 2030 2035 2040 2045 2050REMIND-MAgPIE 1.7-3.0 Delayed 2C with CDR (Disorderly, Alt) REMIND-MAgPIE 1.7-3.0|China SecondaryEnergy|Electricity|Coal EJ/yr
REMIND-MAgPIE 1.7-3.0 Immediate 1.5C with limited CDR (Disorderly, Alt) REMIND-MAgPIE 1.7-3.0|ChinaSecondary Energy|Electricity|Coal EJ/yr
REMIND-MAgPIE 1.7-3.0 Nationally determined contributions (NDCs) (Hot house world, Alt) REMIND-MAgPIE1.7-3.0|China Secondary Energy|Electr icity|Coal EJ/yr
REMIND-MAgPIE 1.7-3.0 Current policies (Hot house world, Rep) REMIND-MAgPIE 1.7-3.0|China SecondaryEnergy|Electricity|Coal EJ/yr
Immediate 1.5C limited CDR
Current policy(hothouse)
NDCs
Delayed 2C CDR
0
2
4
6
8
10
12
2015 2020 2025 2030 2035 2040 2045 2050REMIND-MAgPIE 1.7-3.0 Delayed 2C with CDR (Disorderly, Alt) REMIND-MAgPIE 1.7-3.0|China SecondaryEnergy|Electricity|Wind EJ/yr
REMIND-MAgPIE 1.7-3.0 Immediate 1.5C with limited CDR (Disorderly, Alt) REMIND-MAgPIE 1.7-3.0|ChinaSecondary Energy|Electricity|Wind EJ/yr
REMIND-MAgPIE 1.7-3.0 Nationally determined contributions (NDCs) (Hot house world, Alt) REMIND-MAgPIE1.7-3.0|China Secondary Energy|Electr icity|Wind EJ/yr
REMIND-MAgPIE 1.7-3.0 Current policies (Hot house world, Rep) REMIND-MAgPIE 1.7-3.0|China SecondaryEnergy|Electricity|Wind EJ/yr
Immediate 1.5C limited CDR
Delayed 2C CDR
NDCs
Current policy(hothouse)
Output Electricity across NGFS scenarios (disorderly transition). Region: China, 2020-2050. Model: REMIND-Mag-Pie.
Coal-based electricity output (ExaJoules/year)Wind-based electricity output (ExaJoules/year)
Stefano Battiston (UZH and UNIVE) 23
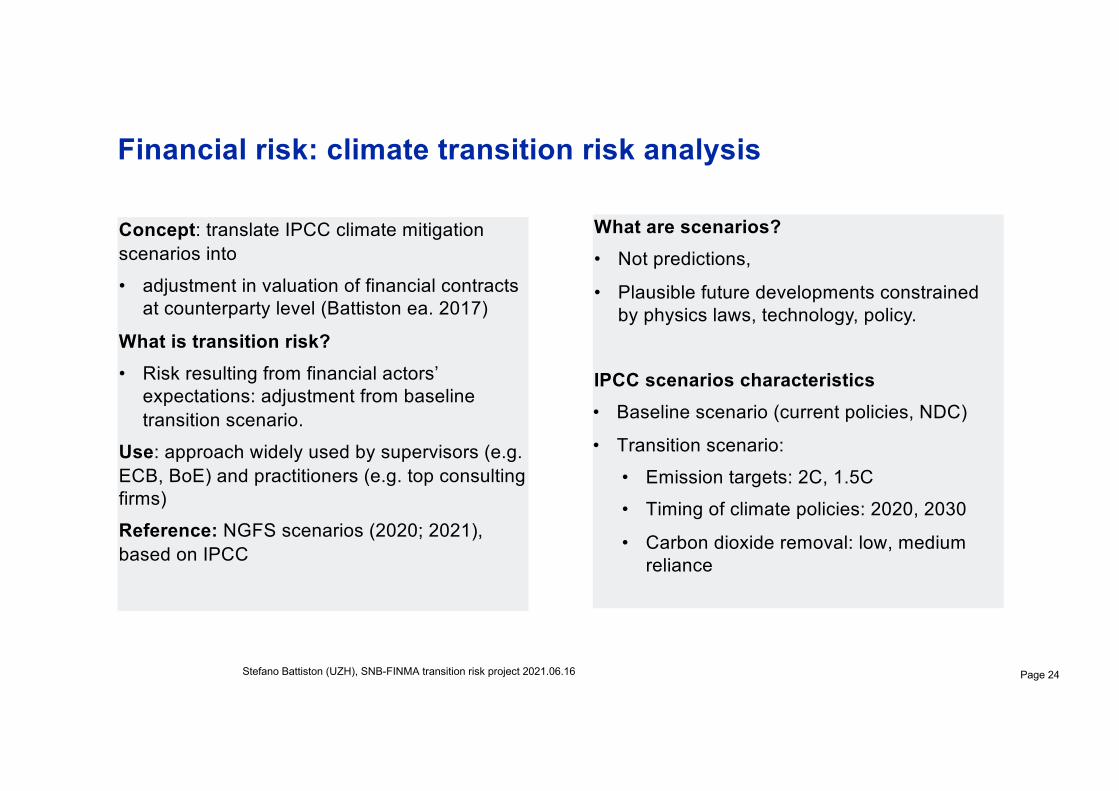
Financial risk: climate transition risk analysis
Concept: translate IPCC climate mitigation scenarios into
• adjustment in valuation of financial contracts at counterparty level (Battiston ea. 2017)
What is transition risk? • Risk resulting from financial actors’
expectations: adjustment from baseline transition scenario.
Use: approach widely used by supervisors (e.g. ECB, BoE) and practitioners (e.g. top consulting firms)
Reference: NGFS scenarios (2020; 2021), based on IPCC
Page 24Stefano Battiston (UZH), SNB-FINMA transition risk project 2021.06.16
What are scenarios? • Not predictions,
• Plausible future developments constrained by physics laws, technology, policy.
IPCC scenarios characteristics• Baseline scenario (current policies, NDC)
• Transition scenario:
• Emission targets: 2C, 1.5C
• Timing of climate policies: 2020, 2030
• Carbon dioxide removal: low, medium reliance
2021 Stefano Battiston, UZH and UNIVE Page 25
Third Step. Quantitative assessment of transition risk lossesScenario analysis - Climate stress-test
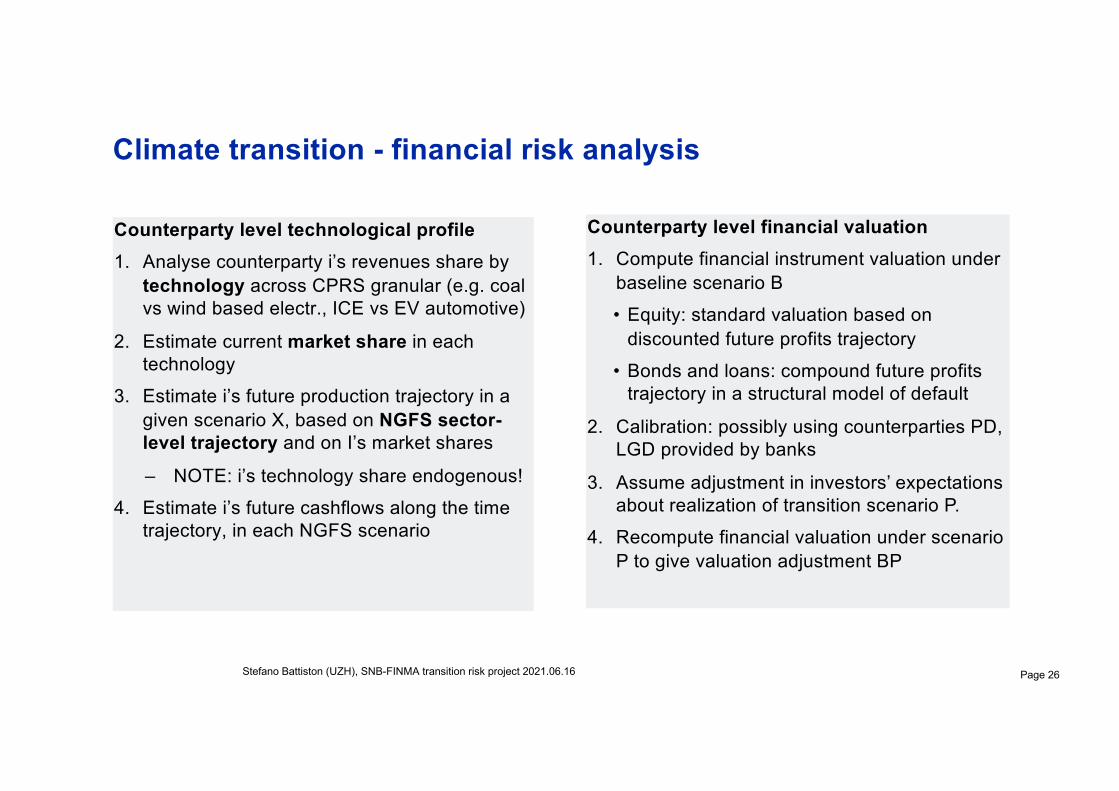
Climate transition - financial risk analysis
Counterparty level technological profile1. Analyse counterparty i’s revenues share by
technology across CPRS granular (e.g. coal vs wind based electr., ICE vs EV automotive)
2. Estimate current market share in each technology
3. Estimate i’s future production trajectory in a given scenario X, based on NGFS sector-level trajectory and on I’s market shares
– NOTE: i’s technology share endogenous!
4. Estimate i’s future cashflows along the time trajectory, in each NGFS scenario
Page 26Stefano Battiston (UZH), SNB-FINMA transition risk project 2021.06.16
Counterparty level financial valuation1. Compute financial instrument valuation under
baseline scenario B
• Equity: standard valuation based on discounted future profits trajectory
• Bonds and loans: compound future profits trajectory in a structural model of default
2. Calibration: possibly using counterparties PD, LGD provided by banks
3. Assume adjustment in investors’ expectations about realization of transition scenario P.
4. Recompute financial valuation under scenario P to give valuation adjustment BP
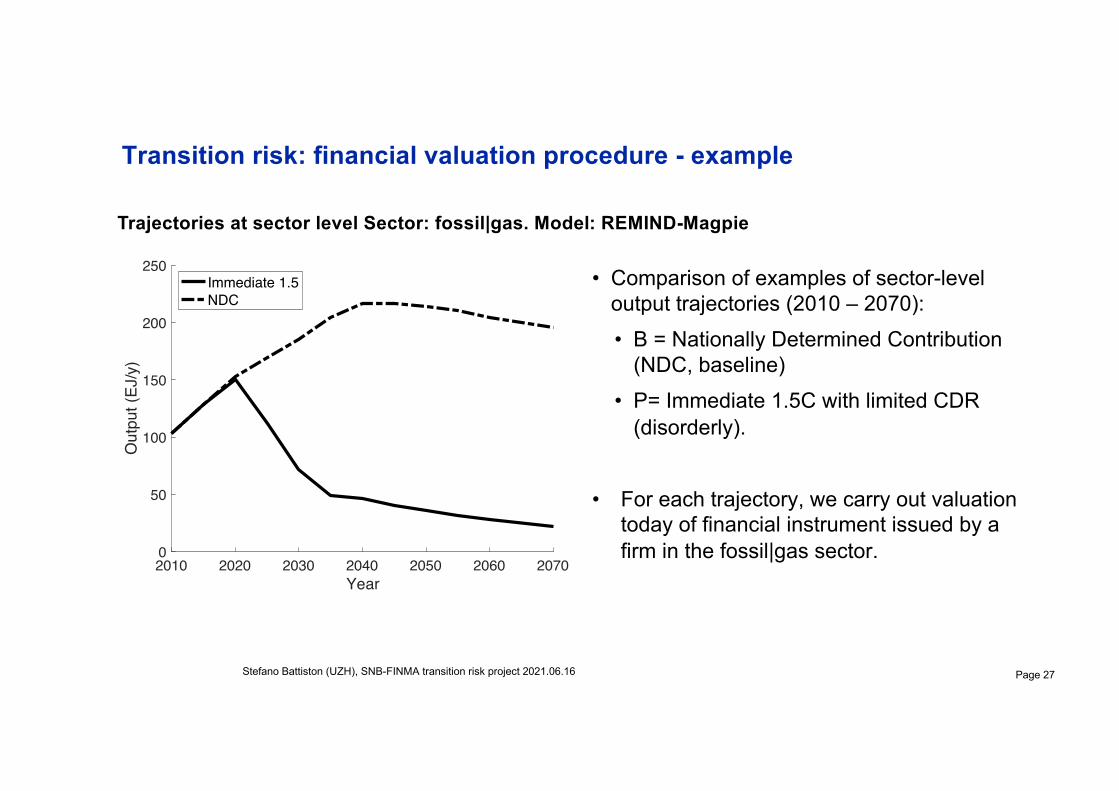
• Comparison of examples of sector-level output trajectories (2010 – 2070):• B = Nationally Determined Contribution
(NDC, baseline) • P= Immediate 1.5C with limited CDR
(disorderly).
• For each trajectory, we carry out valuation today of financial instrument issued by a firm in the fossil|gas sector.
Transition risk: financial valuation procedure - example
Stefano Battiston (UZH), SNB-FINMA transition risk project 2021.06.16 Page 27
2010 2020 2030 2040 2050 2060 2070Year
0
50
100
150
200
250
Out
put (
EJ/y
)
Immediate 1.5NDC
Trajectories at sector level Sector: fossil|gas. Model: REMIND-Magpie
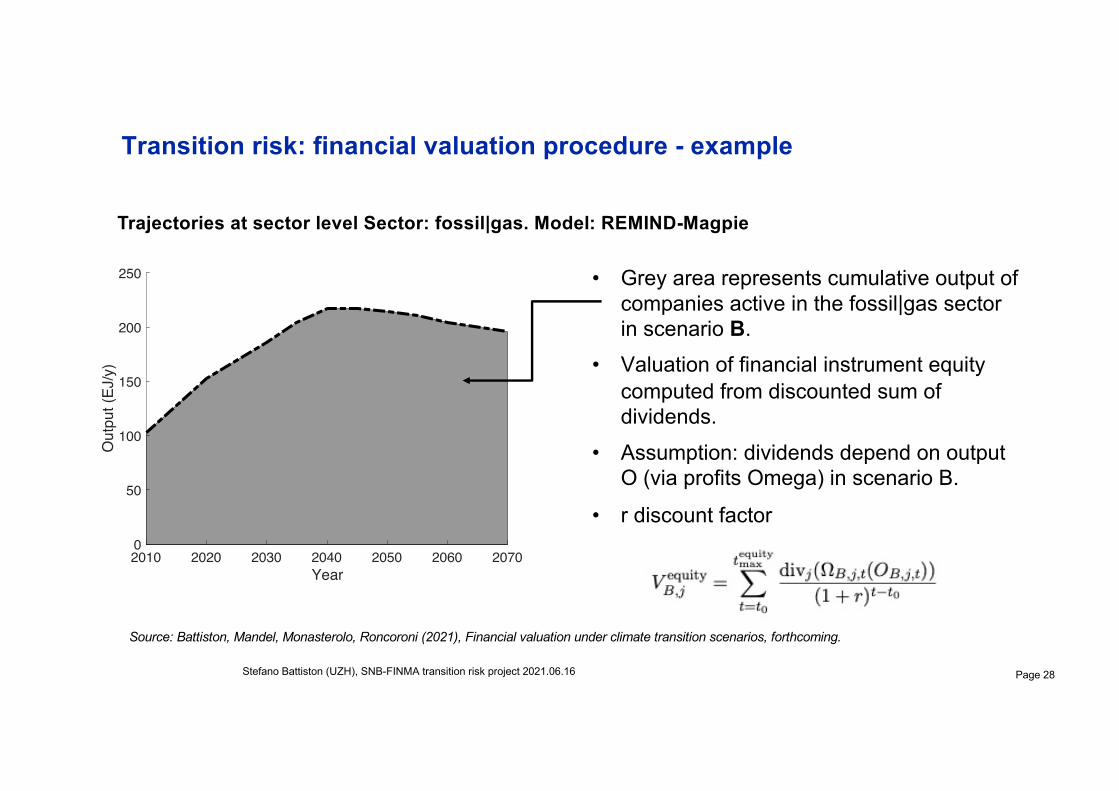
• Grey area represents cumulative output of companies active in the fossil|gas sector in scenario B.
• Valuation of financial instrument equity computed from discounted sum of dividends.
• Assumption: dividends depend on output O (via profits Omega) in scenario B.
• r discount factor
Transition risk: financial valuation procedure - example
Stefano Battiston (UZH), SNB-FINMA transition risk project 2021.06.16 Page 28
2010 2020 2030 2040 2050 2060 2070Year
0
50
100
150
200
250
Out
put (
EJ/y
)
Trajectories at sector level Sector: fossil|gas. Model: REMIND-Magpie
Source: Battiston, Mandel, Monasterolo, Roncoroni (2021), Financial valuation under climate transition scenarios, forthcoming.
2010 2020 2030 2040 2050 2060 2070Year
0
50
100
150
200
250
Out
put (
EJ/y
)
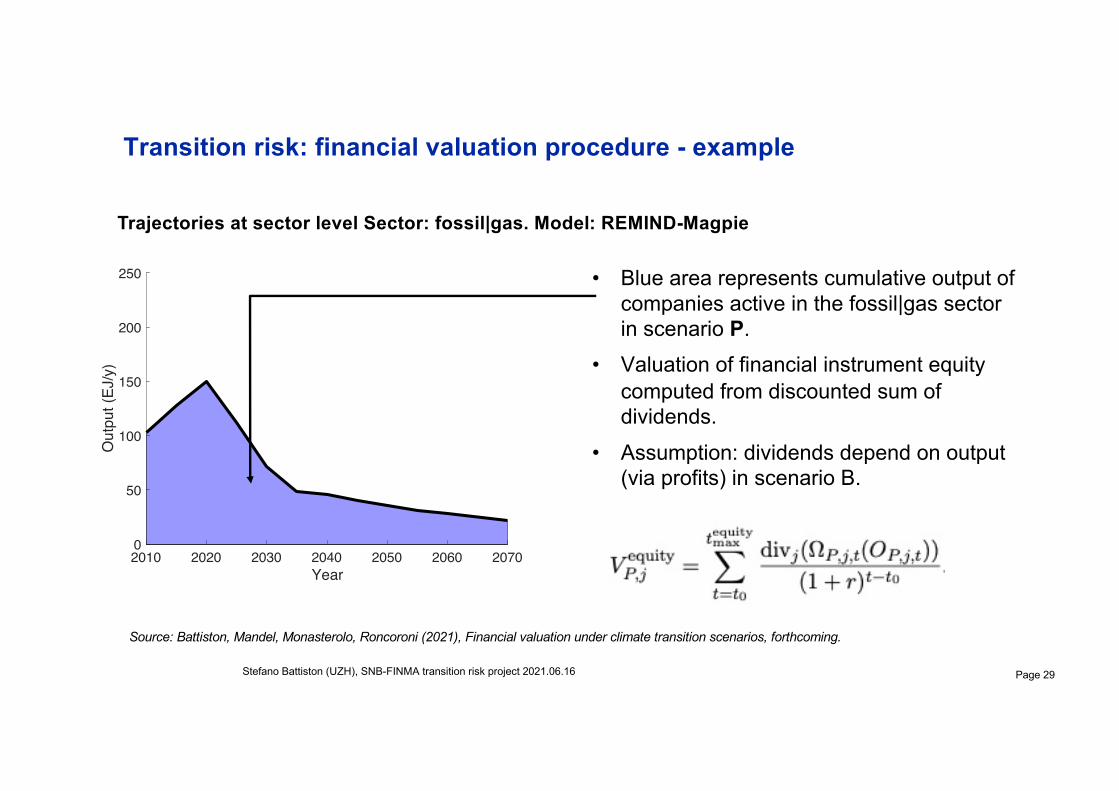
• Blue area represents cumulative output of companies active in the fossil|gas sector in scenario P.
• Valuation of financial instrument equity computed from discounted sum of dividends.
• Assumption: dividends depend on output (via profits) in scenario B.
Transition risk: financial valuation procedure - example
Stefano Battiston (UZH), SNB-FINMA transition risk project 2021.06.16 Page 29
Trajectories at sector level Sector: fossil|gas. Model: REMIND-Magpie
Source: Battiston, Mandel, Monasterolo, Roncoroni (2021), Financial valuation under climate transition scenarios, forthcoming.
2010 2020 2030 2040 2050 2060 2070Year
0
50
100
150
200
250
Out
put (
EJ/y
)
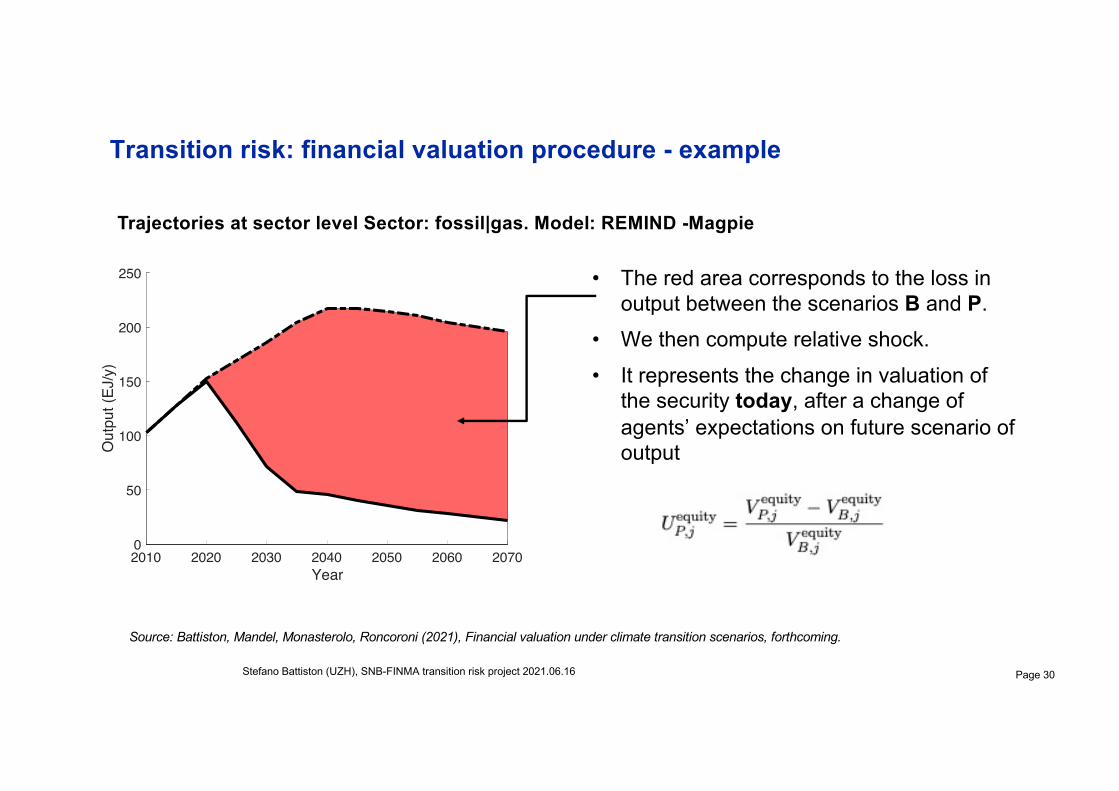
• The red area corresponds to the loss in output between the scenarios B and P.
• We then compute relative shock.• It represents the change in valuation of
the security today, after a change of agents’ expectations on future scenario of output
Transition risk: financial valuation procedure - example
Stefano Battiston (UZH), SNB-FINMA transition risk project 2021.06.16 Page 30
Trajectories at sector level Sector: fossil|gas. Model: REMIND -Magpie
Source: Battiston, Mandel, Monasterolo, Roncoroni (2021), Financial valuation under climate transition scenarios, forthcoming.
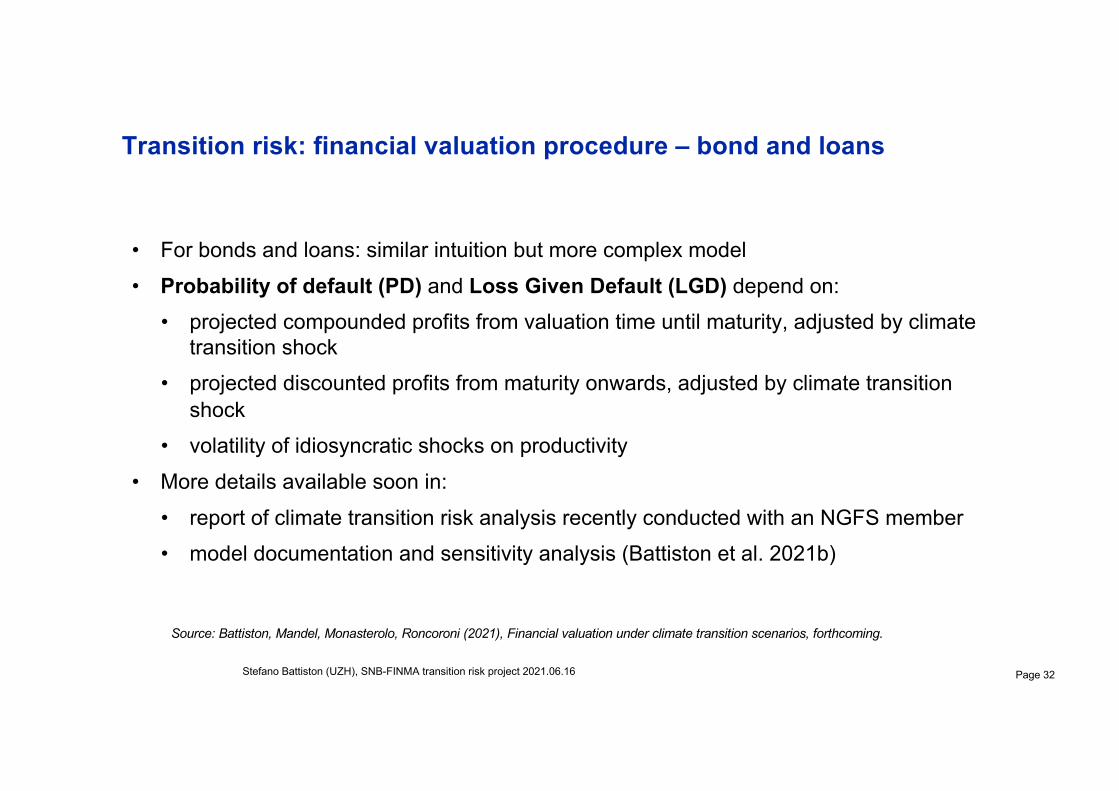
• For bonds and loans: similar intuition but more complex model• Probability of default (PD) and Loss Given Default (LGD) depend on:
• projected compounded profits from valuation time until maturity, adjusted by climate transition shock
• projected discounted profits from maturity onwards, adjusted by climate transition shock
• volatility of idiosyncratic shocks on productivity• More details available soon in:
• report of climate transition risk analysis recently conducted with an NGFS member• model documentation and sensitivity analysis (Battiston et al. 2021b)
Transition risk: financial valuation procedure – bond and loans
Stefano Battiston (UZH), SNB-FINMA transition risk project 2021.06.16 Page 32
Source: Battiston, Mandel, Monasterolo, Roncoroni (2021), Financial valuation under climate transition scenarios, forthcoming.
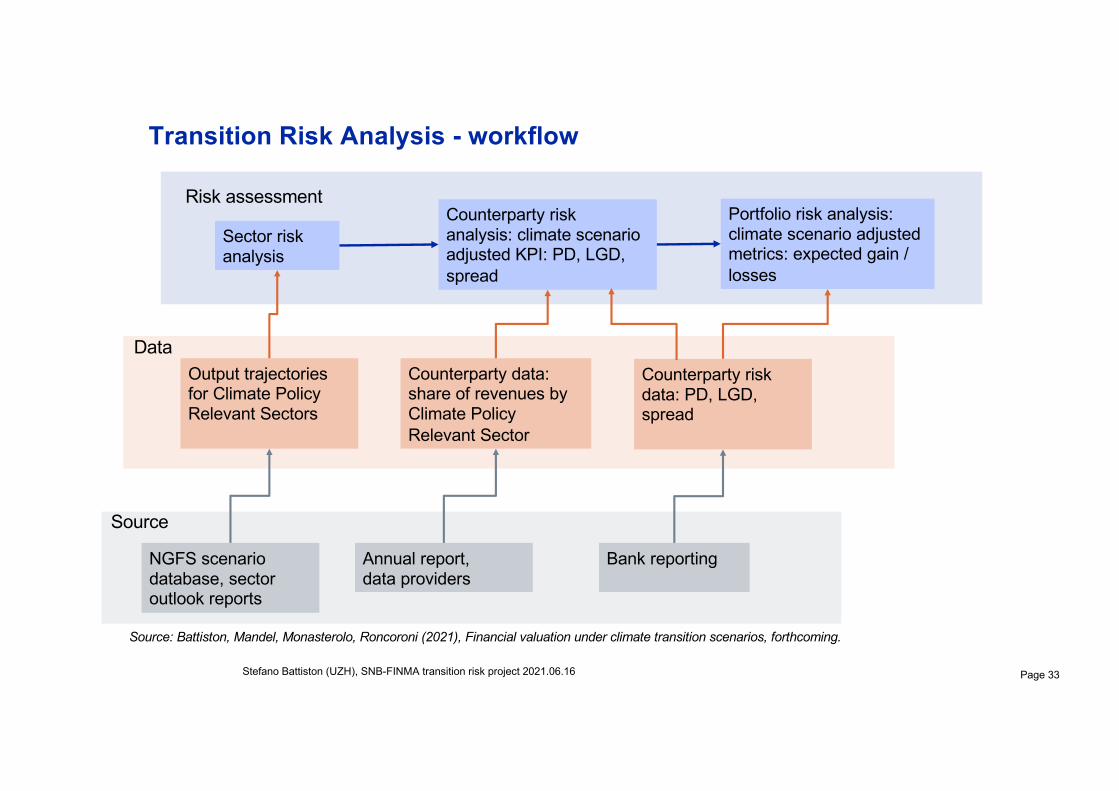
Transition Risk Analysis - workflow
Page 33Stefano Battiston (UZH), SNB-FINMA transition risk project 2021.06.16
Counterparty data: share of revenues by Climate Policy Relevant Sector
Output trajectories for Climate Policy Relevant Sectors
Sector risk analysis
Annual report, data providers
NGFS scenario database, sector outlook reports
Bank reporting
Counterparty risk analysis: climate scenario adjusted KPI: PD, LGD, spread
Portfolio risk analysis: climate scenario adjusted metrics: expected gain / losses
Risk assessment
Data
Source
Counterparty risk data: PD, LGD, spread
Source: Battiston, Mandel, Monasterolo, Roncoroni (2021), Financial valuation under climate transition scenarios, forthcoming.
2021 Stefano Battiston, UZH and UNIVE Page 34
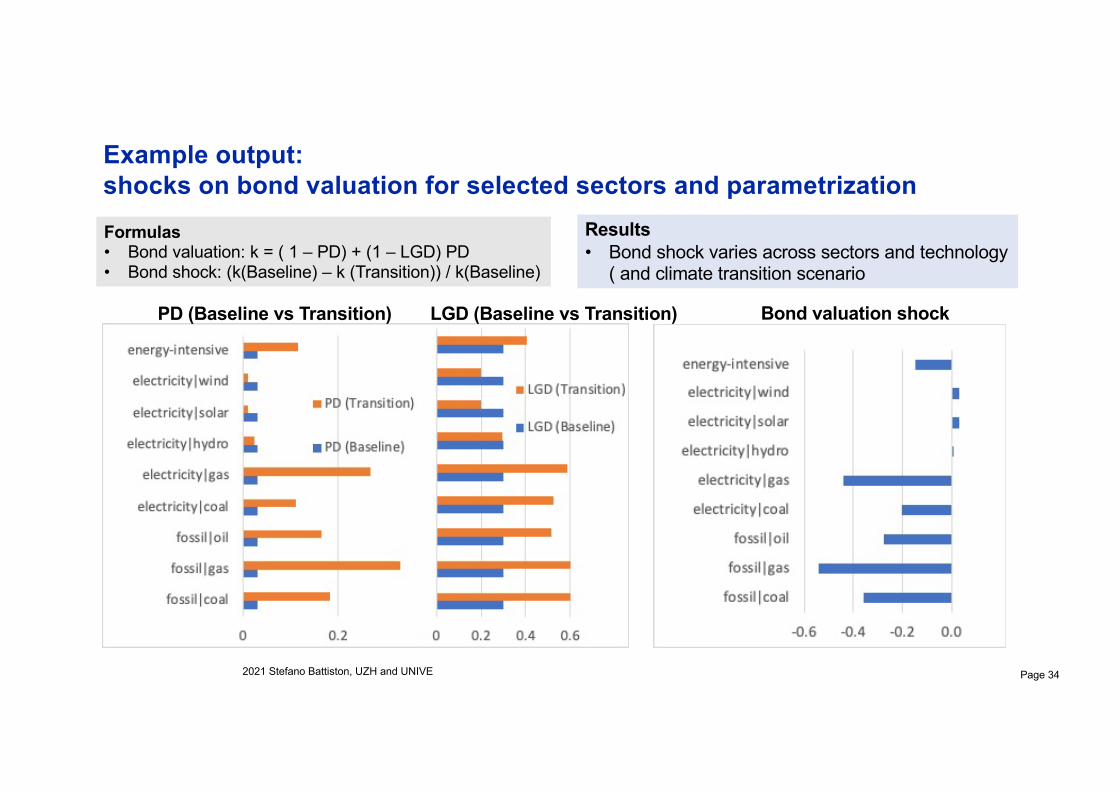
Example output: shocks on bond valuation for selected sectors and parametrizationFormulas• Bond valuation: k = ( 1 – PD) + (1 – LGD) PD • Bond shock: (k(Baseline) – k (Transition)) / k(Baseline)
PD (Baseline vs Transition) LGD (Baseline vs Transition) Bond valuation shock
Results• Bond shock varies across sectors and technology
( and climate transition scenario
2021 Stefano Battiston, UZH and UNIVE Page 35
Fourth Step. Endogeneity of transition scenarios
Endogeneity of risk and macro-financial feedback loop: take home message
• NGFS climate mitigation scenarios are already a reference tool for investors • Scenarios can shift markets’ expectations• But do not account for impact of financial actors’ looking at the scenarios themselves.
• This missing feedback loop is key for financial stability and for climate targets, because it can lead to under-investing wrt to climate targets.
• Missing endogeneity in mitigation scenarios matters for political economy of the low-carbon transition. achieving or missing climate targets
• Opportunity: we introduce a framework to model interaction expectations-scenarios: it generates new transition scenarios that are more coherent with investment needs and climate targets (Battiston ea. 2021, Science)
• Key role for policy credibility, implications for fiscal and financial policies
Stefano Battiston (UZH) 36
Source: Battiston S., Monasterolo I., Riahi K., van Ruijven B.J., Accounting for finance is key for climate mitigation pathways, Science, 28 May 2021. DOI: 10.1126/science.abf3877
0
2
4
6
8
10
12
2015 2020 2025 2030 2035 2040 2045 2050REMIND-MAgPIE 1.7-3.0 Delayed 2C with CDR (Disorderly, Alt) REMIND-MAgPIE 1.7-3.0|China SecondaryEnergy|Electricity|Wind EJ/yr
REMIND-MAgPIE 1.7-3.0 Immediate 1.5C with limited CDR (Disorderly, Alt) REMIND-MAgPIE 1.7-3.0|ChinaSecondary Energy|Electricity|Wind EJ/yr
REMIND-MAgPIE 1.7-3.0 Nationally determined contributions (NDCs) (Hot house world, Alt) REMIND-MAgPIE1.7-3.0|China Secondary Energy|Electr icity|Wind EJ/yr
REMIND-MAgPIE 1.7-3.0 Current policies (Hot house world, Rep) REMIND-MAgPIE 1.7-3.0|China SecondaryEnergy|Electricity|Wind EJ/yr
Immediate 1.5C limited CDR
Delayed 2C CDR
NDCs
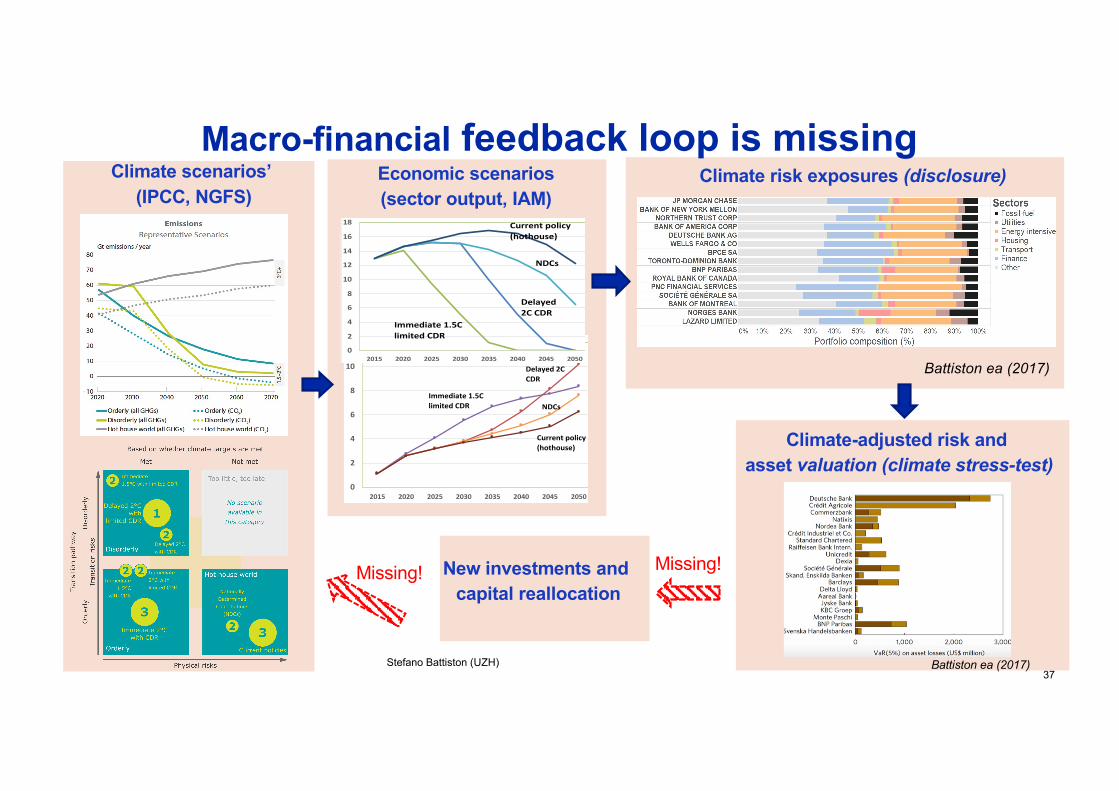
Current policy(hothouse) Climate-adjusted risk and
asset valuation (climate stress-test)
Climate risk exposures (disclosure)Climate scenarios’(IPCC, NGFS)
Economic scenarios (sector output, IAM)
0
2
4
6
8
10
12
14
16
18
2015 2020 2025 2030 2035 2040 2045 2050REMIND-MAgPIE 1.7-3.0 Delayed 2C with CDR (Disorderly, Alt) REMIND-MAgPIE 1.7-3.0|China SecondaryEnergy|Electricity|Coal EJ/yr
REMIND-MAgPIE 1.7-3.0 Immediate 1.5C with limited CDR (Disorderly, Alt) REMIND-MAgPIE 1.7-3.0|ChinaSecondary Energy|Electricity|Coal EJ/yr
REMIND-MAgPIE 1.7-3.0 Nationally determined contributions (NDCs) (Hot house world, Alt) REMIND-MAgPIE1.7-3.0|China Secondary Energy|Electr icity|Coal EJ/yr
REMIND-MAgPIE 1.7-3.0 Current policies (Hot house world, Rep) REMIND-MAgPIE 1.7-3.0|China SecondaryEnergy|Electricity|Coal EJ/yr
Immediate 1.5C limited CDR
Current policy(hothouse)
NDCs
Delayed 2C CDR
Battiston ea (2017)
New investments andcapital reallocation
Missing! Missing!
Macro-financial feedback loop is missing
Stefano Battiston (UZH) 37
4
Figure 1 Overview of the NGFS scenarios. Scenarios are indicated with bubbles and positioned according to their transition and physical risks. Representative scenarios are indicated with large bubbles while alternate scenarios are indicated with small bubbles. The number inside bubbles indicates the number of model variants available.
For each quadrant, a representative scenario (large bubble) has been selected by the NGFS to serve as
representative of this quadrant. Exploration of inherent uncertainties within each quadrant can thus make use
of exploring within one narrative the ranges produced by different models (for further details on model
characteristics and differences see section 3.1.1). Additionally, the alternative scenario narratives (small
bubbles) in each quadrant allow for a further exploration along defined dimensions.
The transition pathways all share the same underlying assumption on key socio-economic drivers, such as
harmonised development of population and economic developments. Further drivers such as food and energy
demand are also harmonised, though not at a precise level but in terms of general patterns. All these socio-
Battiston ea (2017)
Enabling or hampering role?
Stefano Battiston (UZH) 38
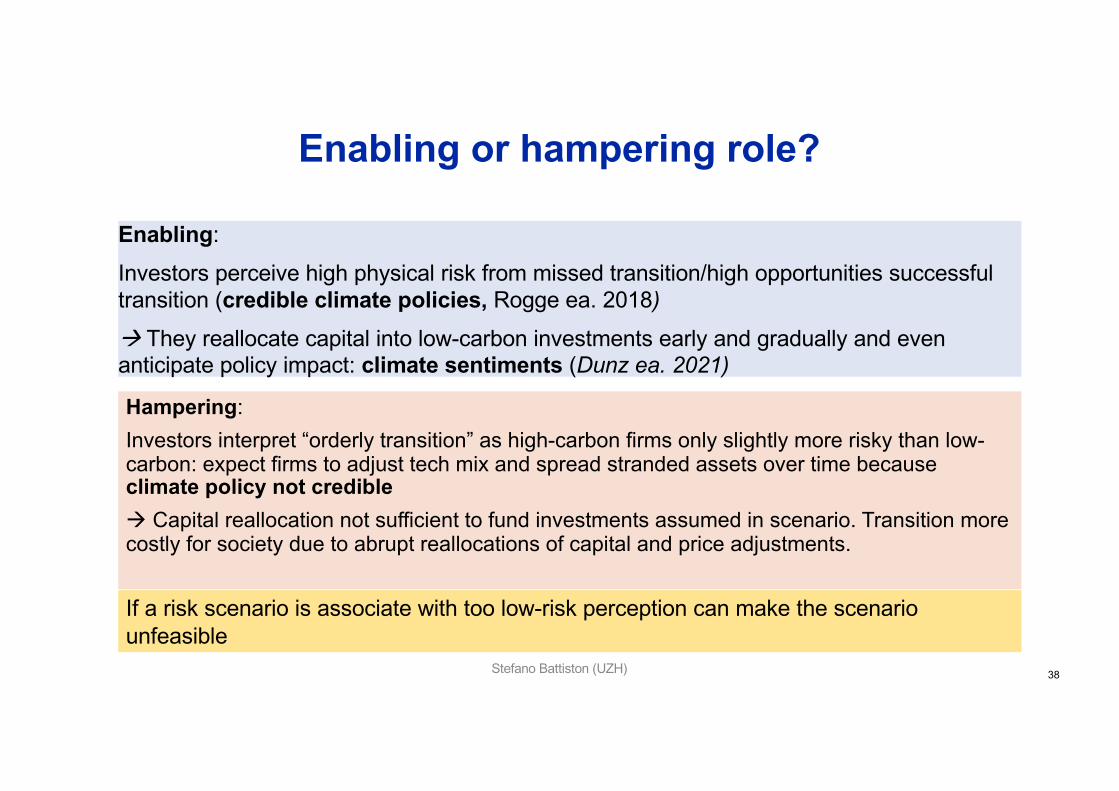
Enabling:
Investors perceive high physical risk from missed transition/high opportunities successful transition (credible climate policies, Rogge ea. 2018)
à They reallocate capital into low-carbon investments early and gradually and even anticipate policy impact: climate sentiments (Dunz ea. 2021)
If a risk scenario is associate with too low-risk perception can make the scenario unfeasible
Hampering: Investors interpret “orderly transition” as high-carbon firms only slightly more risky than low-carbon: expect firms to adjust tech mix and spread stranded assets over time because climate policy not credibleà Capital reallocation not sufficient to fund investments assumed in scenario. Transition more costly for society due to abrupt reallocations of capital and price adjustments.
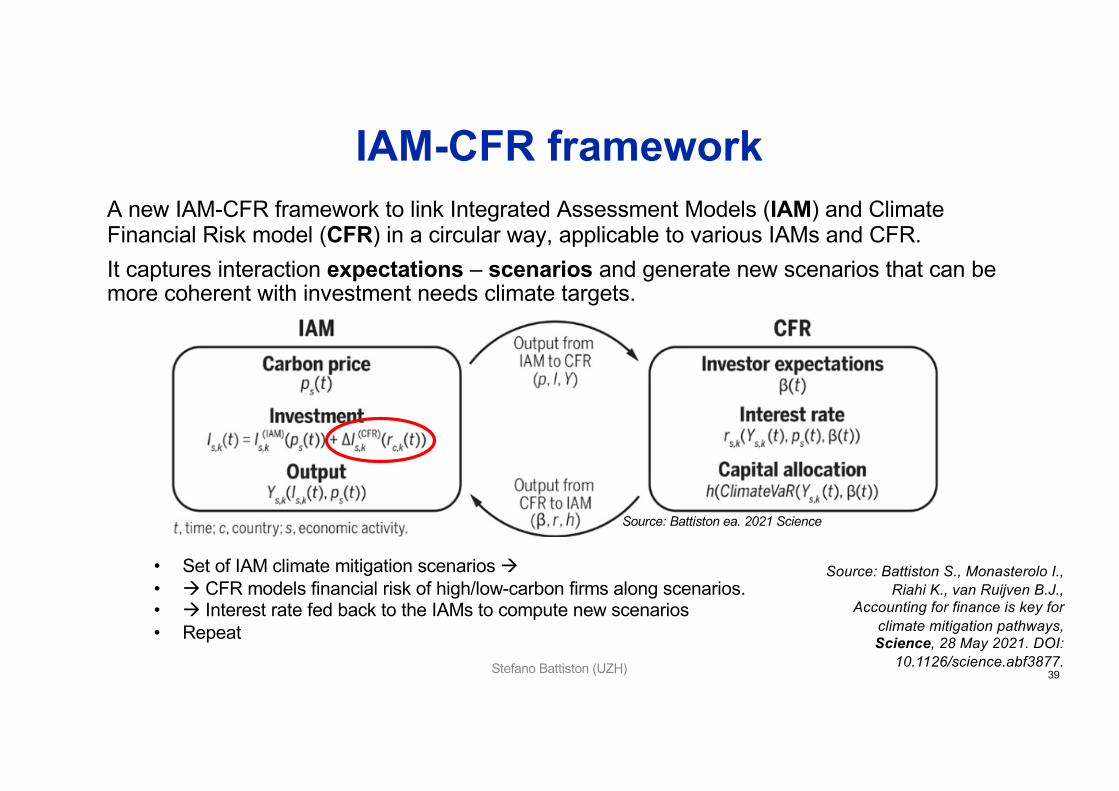
IAM-CFR frameworkA new IAM-CFR framework to link Integrated Assessment Models (IAM) and Climate Financial Risk model (CFR) in a circular way, applicable to various IAMs and CFR. It captures interaction expectations – scenarios and generate new scenarios that can be more coherent with investment needs climate targets.
• Set of IAM climate mitigation scenarios à• à CFR models financial risk of high/low-carbon firms along scenarios. • à Interest rate fed back to the IAMs to compute new scenarios• Repeat
Source: Battiston ea. 2021 Science
Stefano Battiston (UZH) 39
Source: Battiston S., Monasterolo I., Riahi K., van Ruijven B.J.,
Accounting for finance is key for climate mitigation pathways, Science, 28 May 2021. DOI:
10.1126/science.abf3877.
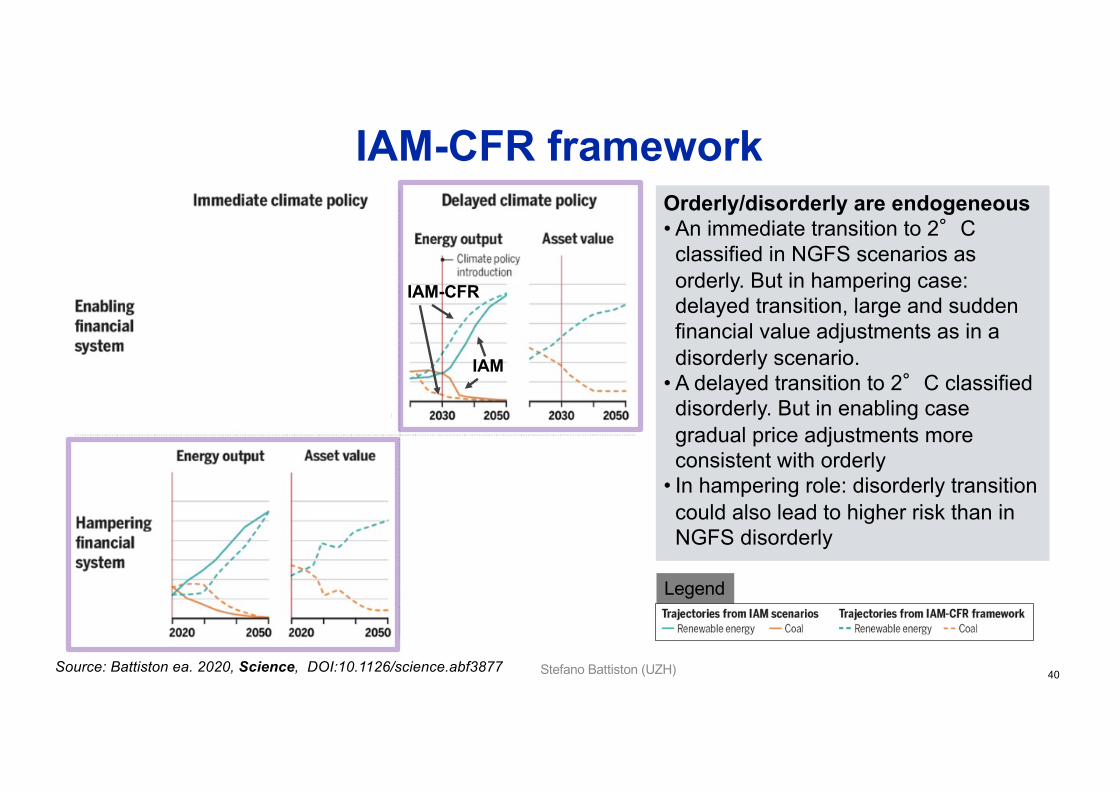
IAM-CFR frameworkOrderly/disorderly are endogeneous• An immediate transition to 2°C classified in NGFS scenarios as orderly. But in hampering case: delayed transition, large and sudden financial value adjustments as in a disorderly scenario.
• A delayed transition to 2°C classified disorderly. But in enabling case gradual price adjustments more consistent with orderly
• In hampering role: disorderly transition could also lead to higher risk than in NGFS disorderly
Legend:
IAM
IAM-CFR
Stefano Battiston (UZH) 40Source: Battiston ea. 2020, Science, DOI:10.1126/science.abf3877
IAM
Policy implications• Policy signal and policy credibility
• Role of policy credibility well-known in economics. Here: highlight its crucial role for low-carbon transition dynamics and for financial stability
• Fiscal policies• Neglecting role of finance implies carbon price projections could miss emissions
target because mitigation scenario does not necessarily imply a risk perception by the financial system that leads to investment reallocation assumed by the scenario. Similarly, for carbon subsidies phasing out.
• Thus, IAM-CFR framework could help IPCC community and NGFS to revise carbon price projections from climate mitigation models to be more consistent with role of financial system
• Financial policies • IAM-CFR could support financial authorities, within financial stability mandate, in
encouraging investors’ assessment of climate-related financial risk. • Limit underestimation of financial risk in climate stress-test exercises. • Implications for asset eligibility criteria in central banks’ collateral frameworks and
asset purchasing programs (e.g. Quantitative Easing)
Stefano Battiston (UZH) 41
ConclusionAssessment of transition risk requires a conceptual framework and a procedure:
1. Classification of economic activities to group assets into transition risk categories: Climate Policy Relevant Sectors
2. Transition scenarios: NGFS
3. Climate stress-test and risk measures4. Awareness of endogeneity of scenarios: the role of the financial
system
Page 42Stefano Battiston (UZH), SNB-FINMA transition risk project 2021.06.16
References
• Battiston, Stefano, Irene Monasterolo, Keywan Riahi, and Bas van Ruijven. 2021. “Accounting for Finance Is Key for Climate Mitigation Pathways.” Science: 28 May 2021, 10.1126/science.abf3877. https://science.sciencemag.org/content/early/2021/05/19/science.abf3877.
• Battiston, Stefano, and Irene Monasterolo. 2020. “On the Dependence of Investor’s Probability of Default on Climate Transition Scenarios.” ssrn 3743647.
• Battiston, Stefano, Antoine Mandel, Irene Monasterolo, Franziska Schütze, and Gabriele Visentin. 2017. “A Climate Stress-Test of the Financial System.” Nature Climate Change 7(4):283–88.
• Dunz, Nepomuk, Asjad Naqvi, and Irene Monasterolo. 2020. “Climate Transition Risk, Climate Sentiments, and Financial Stability in a Stock-Flow Consistent Approach.” JFS forthcoming.
• Roncoroni, Alan, Stefano Battiston, Luis Onesimo Leonardo Escobar Farfan, and Serafín Martinez-Jaramillo. 2020. “Climate Risk and Financial Stability in the Network of Banks and Investment Funds.” Journal of Financial Stability 54.
• IPCC, “Global warming of 1.5°C. An IPCC Special Report on the impacts of global warming of 1.5°C above pre-industrial levels and related global greenhouse gas emission pathways”, (2018). https://www.ipcc.ch/sr15/
• Network for Greening the Financial System, (NGFS), “A call for action” (2019)• Network for Greening the Financial System, (NGFS), “Guide for Supervisors Integrating climate-related and
environmental risks into prudential supervision” (2020). https://www.ngfs.net/en/guide-supervisors-integrating-climate-related-and-environmental-risks-prudential-supervision
• UNEP-FI, “Decarbonisation and Disruption. Understanding the financial risks of a disorderly transition using climate scenarios” (2021). https://www.unepfi.org/publications/banking-publications/decarbonisation-and-disruption/
Stefano Battiston (UZH) 43

Appendix
2021 Stefano Battiston, UZH and UNIVE Page 44
2021 Stefano Battiston, UZH and UNIVE Page 45
Remark on the notions of CPRS and stranded assets
The term stranded assets refers to assets the value of which could decrease as a result of the introduction of climate policies or regulations that discourage the utilization of the fossil fuel in the context of climate change mitigation. When it comes to a precise definition, there seem to be different uses of the term in the grey literature ranging from: • oil and gas reserves and infrastructures for drilling• the latter + financial assets of the firms that own the rights to use those reserves• the latter + plus other activities related to fossil industryNo specific or detailed list of NACE codes. Thus it is difficult to compare estimates of stranded assets across countries or investors.
CPRS are identified based on general criteria, cover activities affected both in terms of risk and opportunities, it is based on a publicly available list of NACE codes.
Resources
CPRS The table of correspondance NACE codes to CPRS is available for download at https://www.finexus.uzh.ch/en/projects/CPRS.html
EIOPA FSR December 2018.pdfECB https://www.ecb.europa.eu/pub/financial-stability/fsr/html/ecb.fsr201905~266e856634.en.html#toc1
2021 Stefano Battiston, UZH and UNIVE Page 46