From CATE to LYCCA Mike Taylor Particle Identification After the Secondary Target.
37
From CATE to LYCCA From CATE to LYCCA Mike Taylor Particle Identification After the Secondary Target Particle Identification After the Secondary Target
-
Upload
dayna-rice -
Category
Documents
-
view
218 -
download
1
Transcript of From CATE to LYCCA Mike Taylor Particle Identification After the Secondary Target.

From CATE to LYCCAFrom CATE to LYCCA
Mike Taylor
Particle Identification After the Secondary TargetParticle Identification After the Secondary Target
Rising Fast Beam CampaignRising Fast Beam Campaign
“Isospin Symmetry and Coulomb Effects Towards the Proton Drip-Line”
Proposed experiment: (M. A. Bentley, Oct 2003)
• ray spectroscopy of exotic proton rich nuclei
• Study the T=3/2 mirror nuclei 53Mn/53Ni, basis for Ph. D. thesis (G. Hammond)
58Ni 600 MeV/u~ 5x10⁸ pps
9Be 4 g/cm2
production target
9Be 700 mg/cm2
secondary target
55Ni ~ 175 MeV/u~ 4x10³ pps
• Analyse, correct and put the data into a form in which it can be compared to simulations
• Investigate properties that contribute to fragment ID such as the origin and extent of energy and velocity spreads
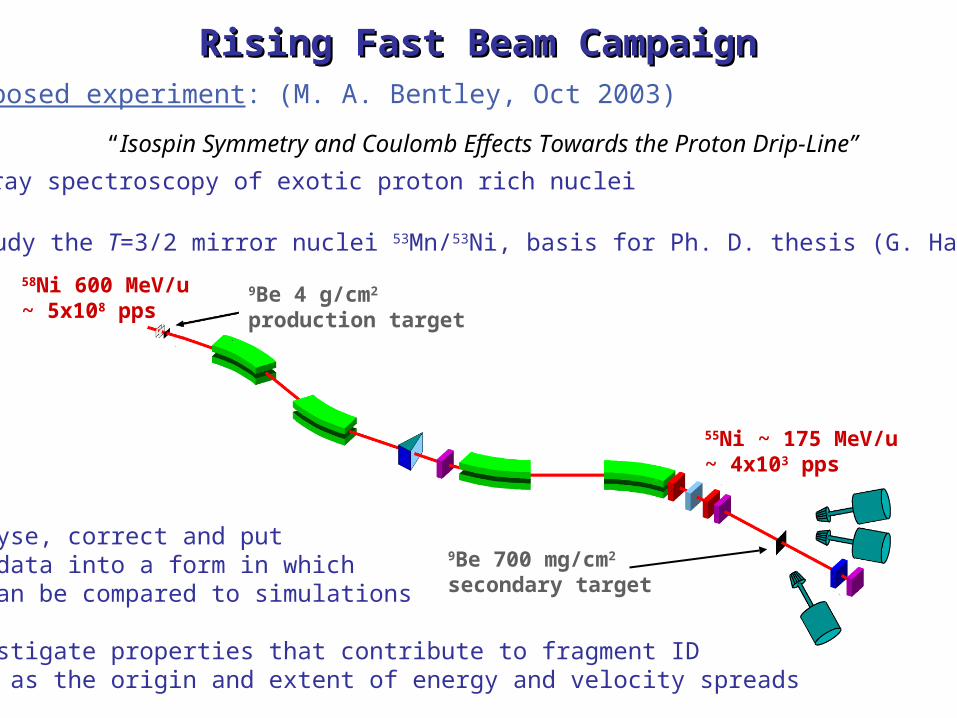
Range of nuclei producedRange of nuclei produced
• Many nuclei produced with greater or comparable intensity to the proposed nucleus of interest 53Ni
• Allows a systematic study of nuclear properties across a range of nuclei and isotopes
• Possibility of new γ-ray spectroscopy:
45Cr : No γ transitions observed
43V : Nothing observed, last proton only bound by ~120 keV
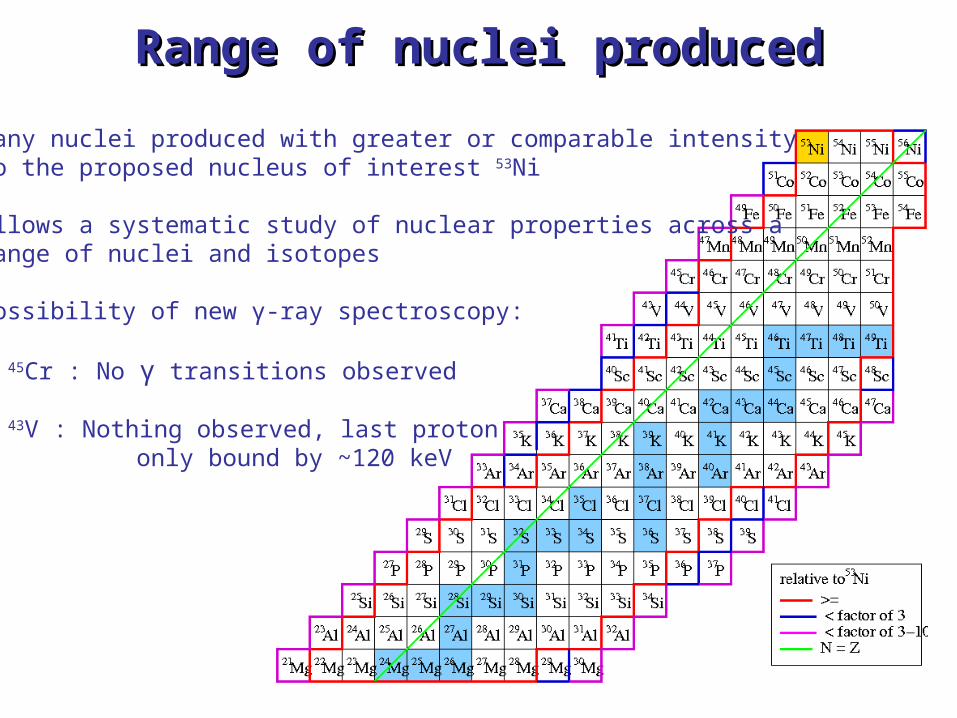
Particle Identification Detector (CATE)Particle Identification Detector (CATE)CAlorimeter TElescope (CATE) consists of an array of 9 position sensitive Si detectors (E) and an array of 9 CsI detectors (E)
Si detectors• 5cm x 5cm x 300μm• Fragment energy loss• (X,Y) position information (after corrections for “pin cushion” effect) CsI detectors
• 5.4cm x 5.4cm x 1cm• Fragment energy (after position dependence correction)
Si position correction implemented by G. Hammond

Ni
Mg
• Z resolution from energy loss
Requirements for Fragment IDRequirements for Fragment ID
• A resolution from total energy
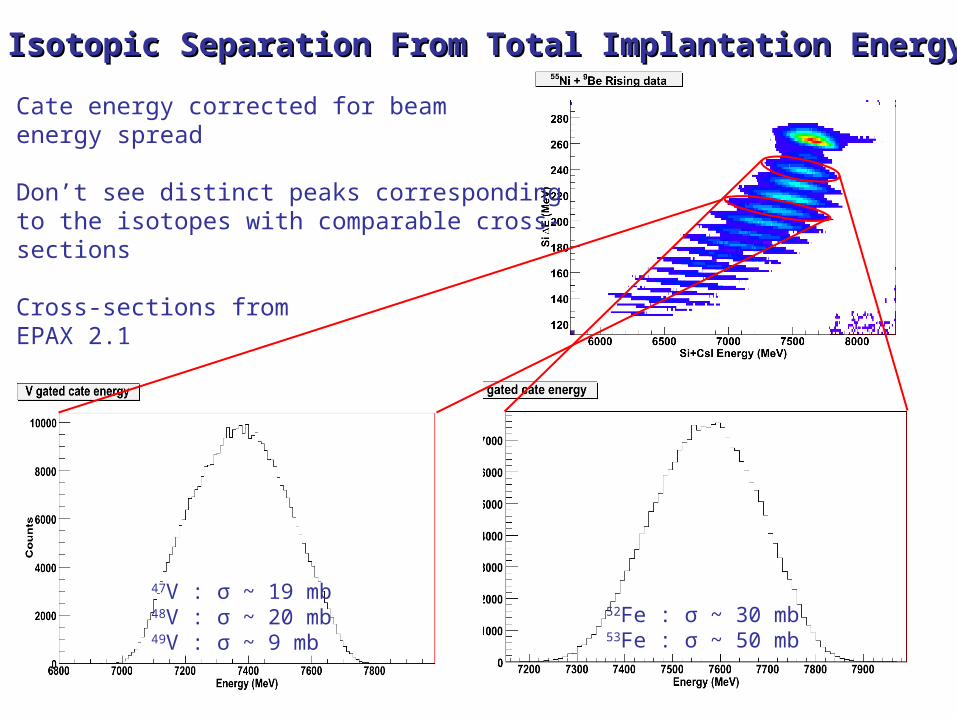
• Cate energy corrected for beam energy spread
• Don’t see distinct peaks corresponding to the isotopes with comparable cross- sections
• Cross-sections from EPAX 2.1
Isotopic Separation From Total Implantation EnergyIsotopic Separation From Total Implantation Energy
52Fe : σ ~ 30 mb 53Fe : σ ~ 50 mb
47V : σ ~ 19 mb48V : σ ~ 20 mb49V : σ ~ 9 mb

Iron AnalysisIron Analysis
*
*
** *
• Event-by-event tracking and β determination
• Doppler corrected, time gated and background subtracted
• NO mass gate
* 52Fe
53Fe*52Fe: E(2+→0+) = 849 keV E(4+→2+) = 1535 keV
53Fe: E(9/2–→7/2–) = 1328 keV E(11/2–→9/2–) = 1011 keV E(5/2–→1/2–) = 683 keV

a)
b)
c)
d)b c da
Mass Gated Gamma SpectraMass Gated Gamma Spectra
• Apply a series of gates on the corrected Total Cate energy spectrum
• Project out the associated gammas
• Clear differences in the resulting spectra are observed with varying Cate energy cuts
• Low statistics due to small cut regions

Mass Gated Fe Mass Gated Fe Gamma Gamma SpectraSpectra• To improve statistics can apply larger cuts, again different gamma spectra emerge
• 53Fe gamma at 861 keV

5252Fe Fe Gamma Gamma SpectrumSpectrum• Scaled 53Fe background spectrum subtracted
(2+→0+)
(4+→2+)

Fe Gamma Gated Mass SpectraFe Gamma Gated Mass Spectra
7506
7610
53Fe: FWHM = 2.75%
• Lot of work done on this topic by R. Lozeva: NIM A562, 298 (2006)
• For fragmentation, resolution quoted as being between 2-3% FWHM
52Fe
53Fe
*
*
*
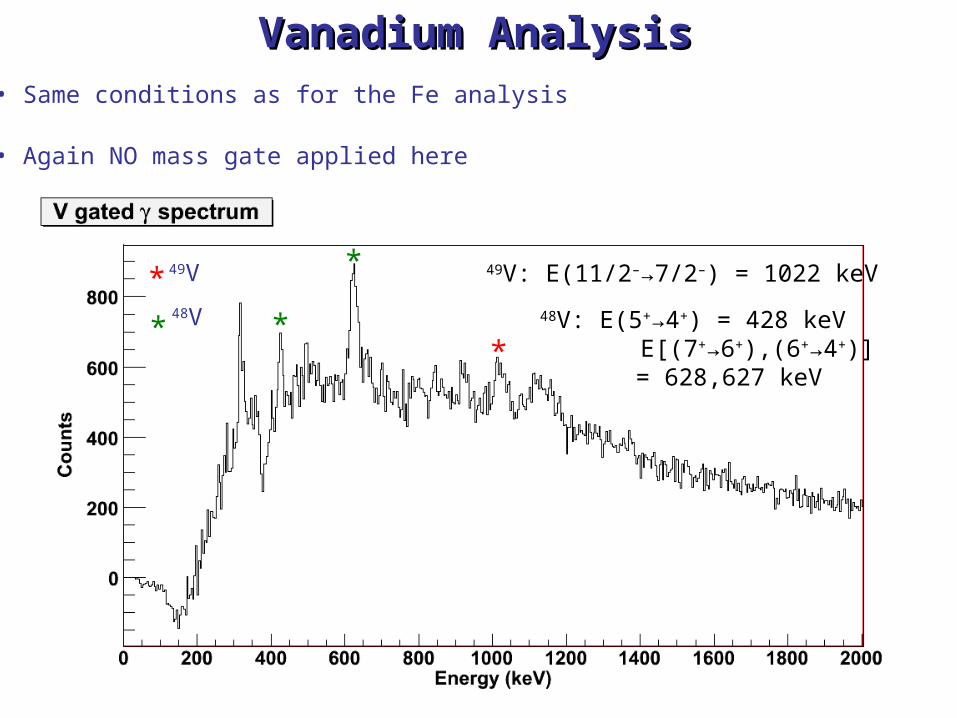
Vanadium AnalysisVanadium Analysis• Same conditions as for the Fe analysis
• Again NO mass gate applied here
* 49V
48V*
49V: E(11/2–→7/2–) = 1022 keV
48V: E(5+→4+) = 428 keV E[(7+→6+),(6+→4+)]
= 628,627 keV

V Gamma Gated Mass SpectraV Gamma Gated Mass Spectra
48V: FWHM = 5.5%
• Isotopic separation not clear
• Goldhaber spread increases with nucleon removal
48V
49V

*
*
54Ni: E(2+→0+) = 1392 keV E(4+→2+) = 1227 keV
Nickel AnalysisNickel Analysis• Without clear isotopic separation it is extremely difficult to produce clean gamma-ray spectra for low cross-section isotopes
• Cannot determine to which nucleus new gammas belong
54Ni : σ ~ 5 mb 53Ni : σ ~ 0.009 mb

Population of Excited Nuclear States investigated by In-Beam Gamma-Ray Spectroscopy of Relativistic Projectile Fragments
F. Becker et al., to be submitted to EPJ
• ABRABLA: population intensity as a function of spin• Comparison between calculations and experiment
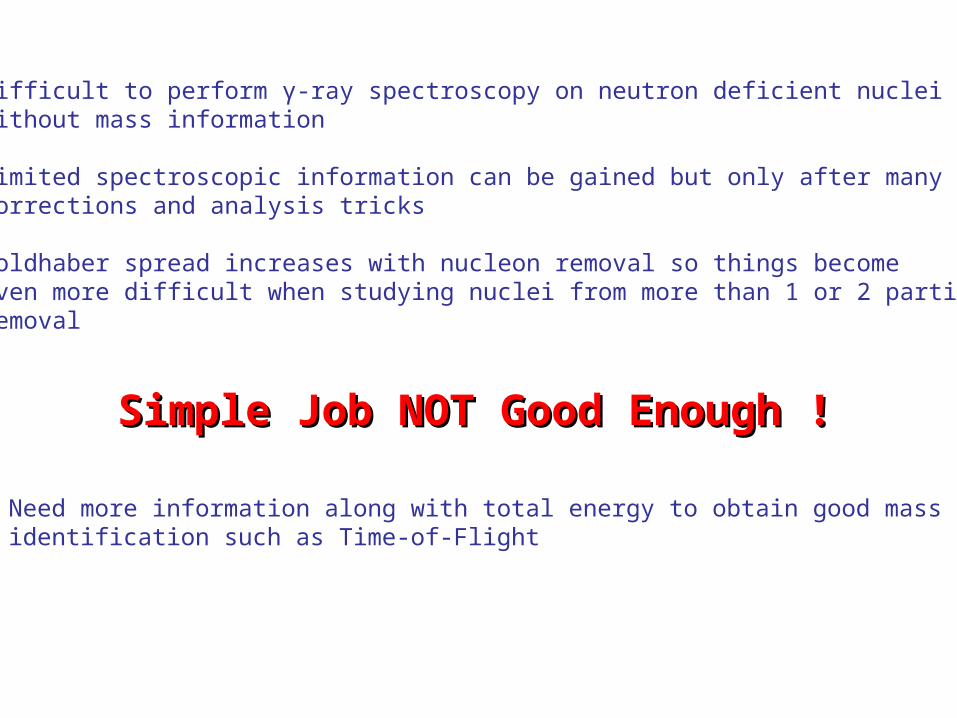
Simple Job NOT Good Enough !Simple Job NOT Good Enough !
• Difficult to perform γ-ray spectroscopy on neutron deficient nuclei without mass information
• Limited spectroscopic information can be gained but only after many corrections and analysis tricks
• Goldhaber spread increases with nucleon removal so things become even more difficult when studying nuclei from more than 1 or 2 particle removal
• Need more information along with total energy to obtain good mass identification such as Time-of-Flight
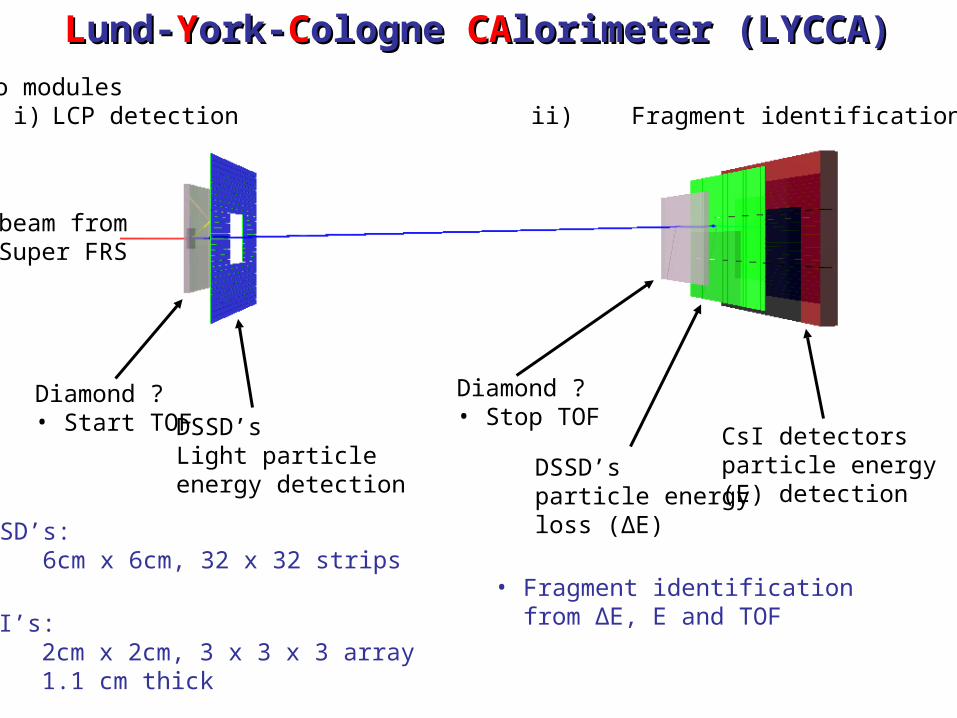
LLund-und-YYork-ork-CCologne ologne CACAlorimeter (LYCCA)lorimeter (LYCCA)
Diamond ? • Start TOF DSSD’s
Light particleenergy detection
Diamond ?• Stop TOF
DSSD’sparticle energyloss (ΔE)
CsI detectorsparticle energy(E) detection
DSSD’s: 6cm x 6cm, 32 x 32 strips
Two modulesi) LCP detection ii) Fragment identification
CsI’s: 2cm x 2cm, 3 x 3 x 3 array 1.1 cm thick
• Fragment identification from ΔE, E and TOF
beam from Super FRS
• Test the sensitive detector response with a simple simulation
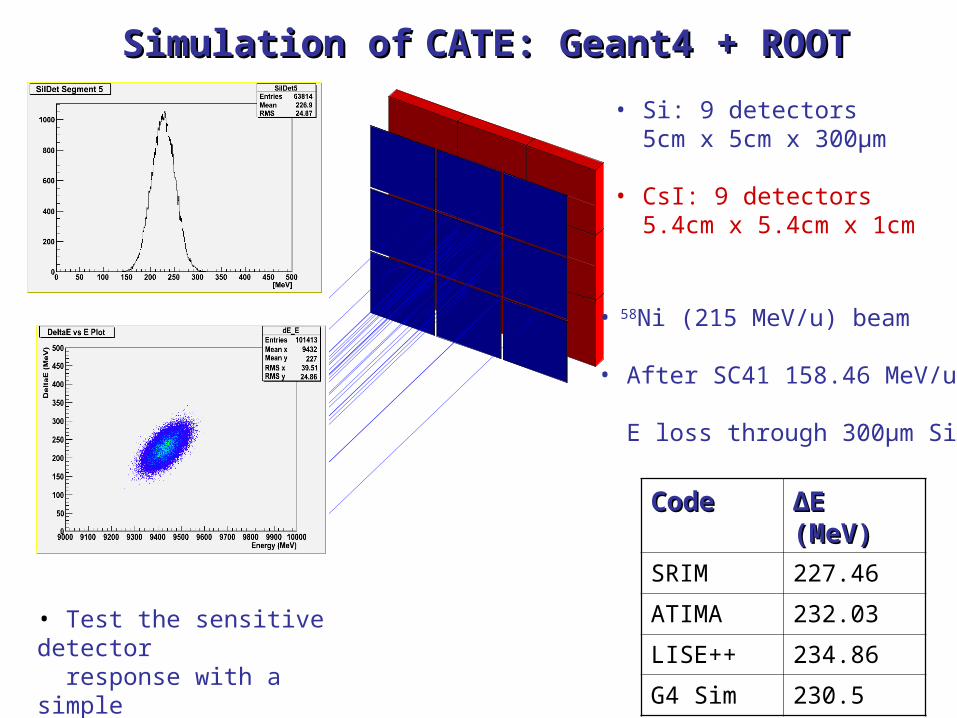
Simulation ofSimulation of CATE: Geant4 + ROOTCATE: Geant4 + ROOT
• 58Ni (215 MeV/u) beam • After SC41 158.46 MeV/u
E loss through 300μm Si
CodeCode ΔΔE (MeV)E (MeV)
SRIM 227.46
ATIMA 232.03
LISE++ 234.86
G4 Sim 230.5
• Si: 9 detectors 5cm x 5cm x 300μm
• CsI: 9 detectors 5.4cm x 5.4cm x 1cm
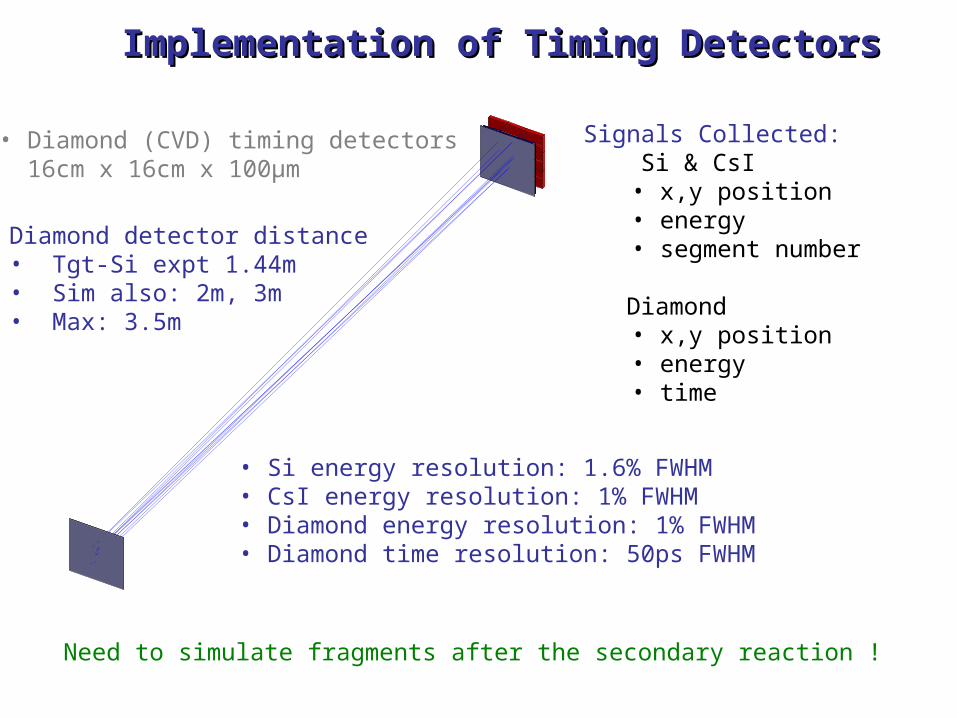
• Si energy resolution: 1.6% FWHM• CsI energy resolution: 1% FWHM• Diamond energy resolution: 1% FWHM• Diamond time resolution: 50ps FWHM
Implementation of Timing DetectorsImplementation of Timing Detectors
• Diamond (CVD) timing detectors 16cm x 16cm x 100μm
Diamond detector distance• Tgt-Si expt 1.44m• Sim also: 2m, 3m• Max: 3.5m
Signals Collected: Si & CsI
• x,y position• energy• segment number
Diamond• x,y position• energy• time
Need to simulate fragments after the secondary reaction !
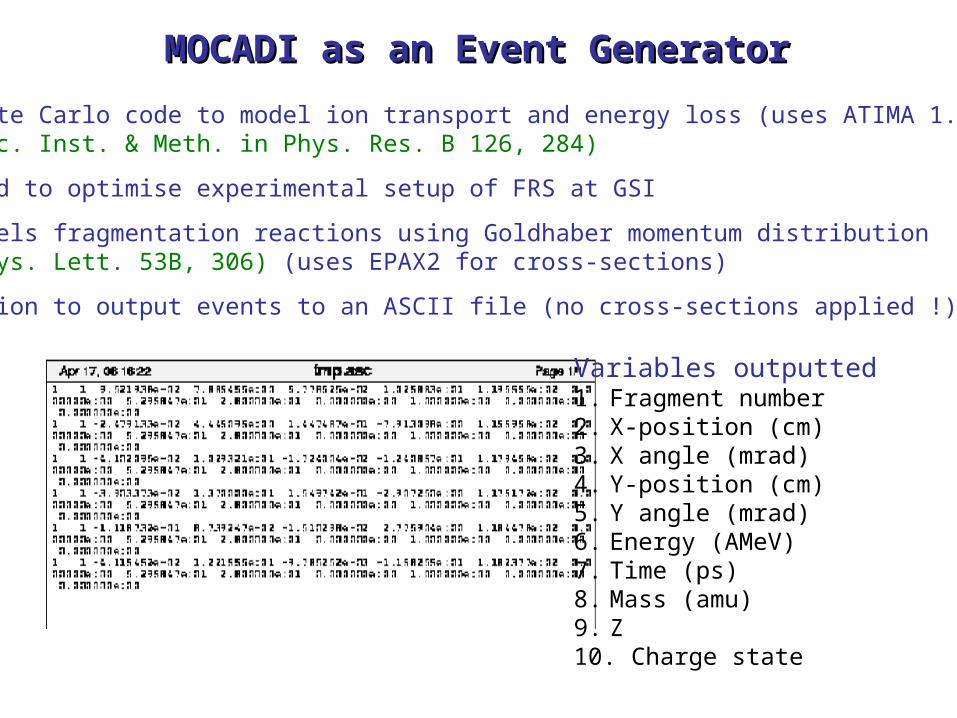
MOCADI as an Event GeneratorMOCADI as an Event Generator
• Monte Carlo code to model ion transport and energy loss (uses ATIMA 1.0) (Nuc. Inst. & Meth. in Phys. Res. B 126, 284)
• Used to optimise experimental setup of FRS at GSI
• Models fragmentation reactions using Goldhaber momentum distribution (Phys. Lett. 53B, 306) (uses EPAX2 for cross-sections)
• Option to output events to an ASCII file (no cross-sections applied !)
Variables outputted1. Fragment number2. X-position (cm)3. X angle (mrad)4. Y-position (cm)5. Y angle (mrad)6. Energy (AMeV)7. Time (ps)8. Mass (amu)9. Z10. Charge state

Generation of Simulation Event FileGeneration of Simulation Event File
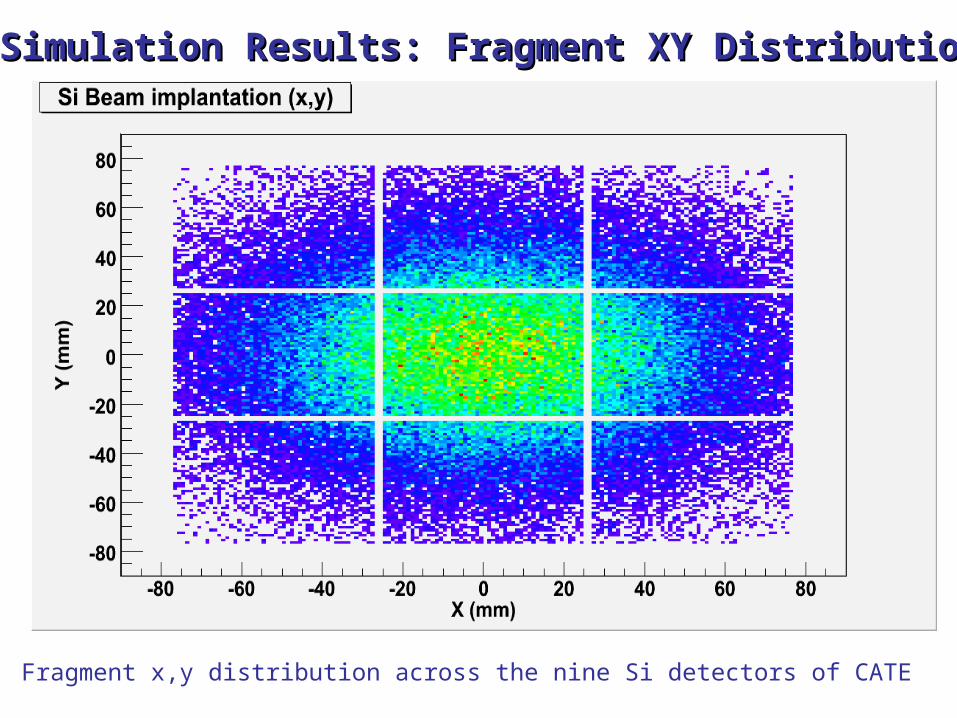
Simulation Results: Fragment XY DistributionSimulation Results: Fragment XY Distribution
Fragment x,y distribution across the nine Si detectors of CATE
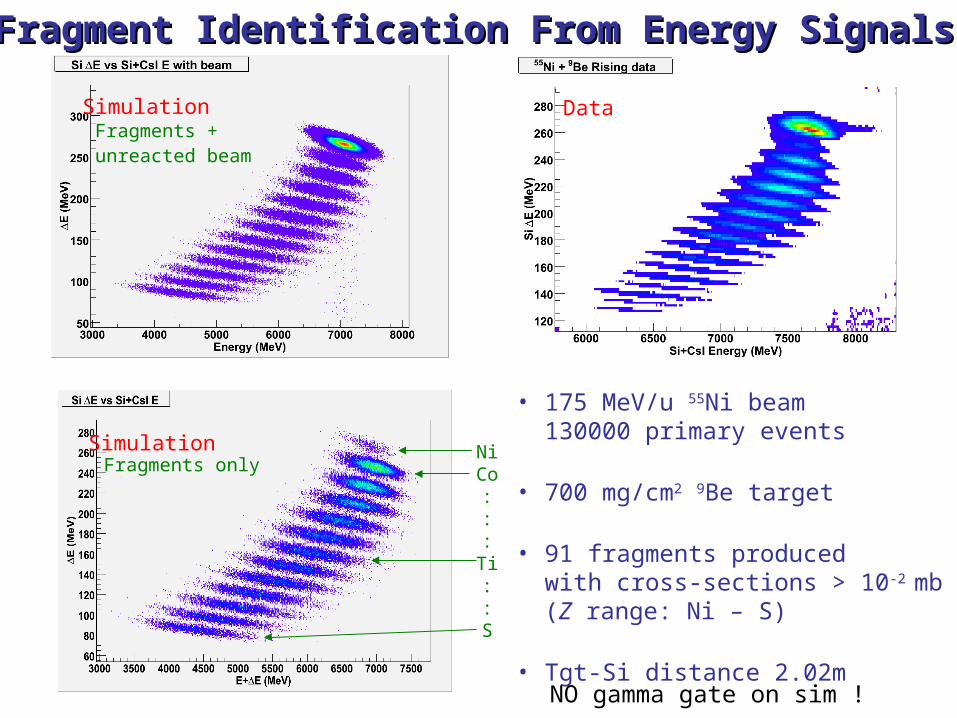
• 175 MeV/u 55Ni beam 130000 primary events
• 700 mg/cm2 9Be target
• 91 fragments produced with cross-sections > 10-2 mb (Z range: Ni – S)
• Tgt-Si distance 2.02m
Fragment Identification From Energy SignalsFragment Identification From Energy Signals
Simulation Data Fragments + unreacted beam
Simulation Fragments only
NiCo:::Ti::S
NO gamma gate on sim !
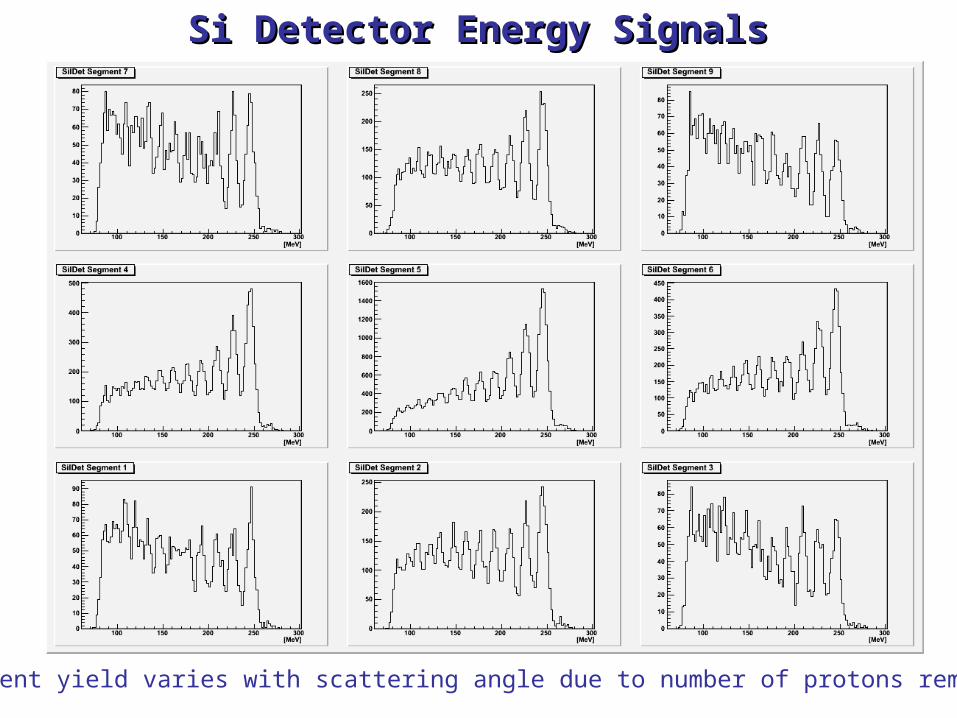
Si Detector Energy Si Detector Energy SignalsSignals
Fragment yield varies with scattering angle due to number of protons removed
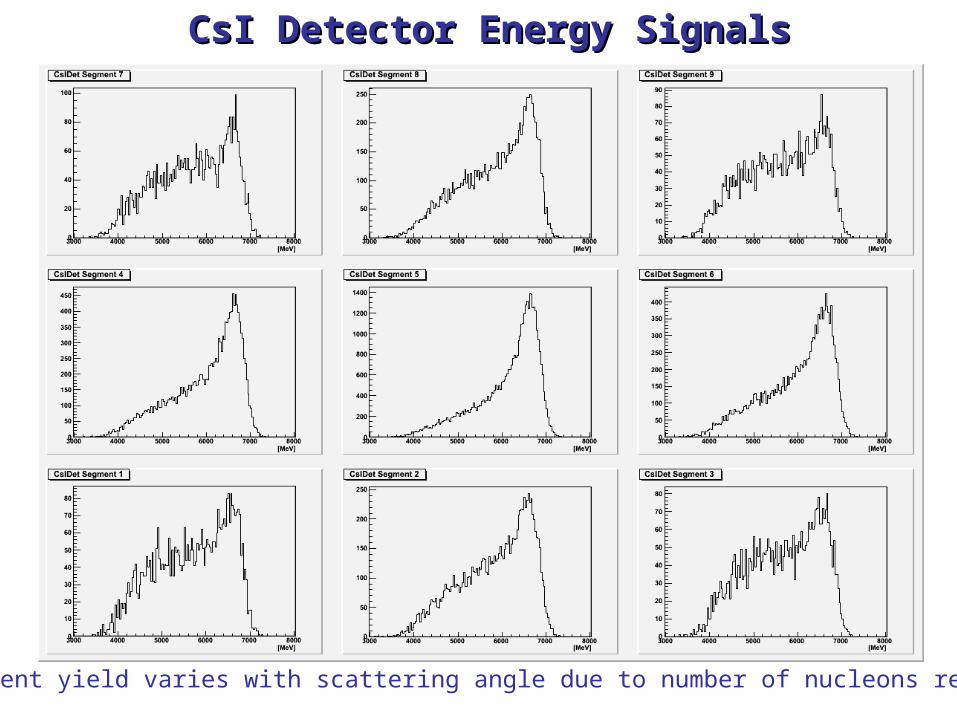
CsI Detector Energy SignalsCsI Detector Energy Signals
Fragment yield varies with scattering angle due to number of nucleons removed

Analysis of Time SignalsAnalysis of Time Signals
TOF distance = 2m 3m
• Separation better at 3m due to timing resolution being better as a percentage of the total TOF
• Separation worse at high energy due to the resolution being a percentage of the deposited energy
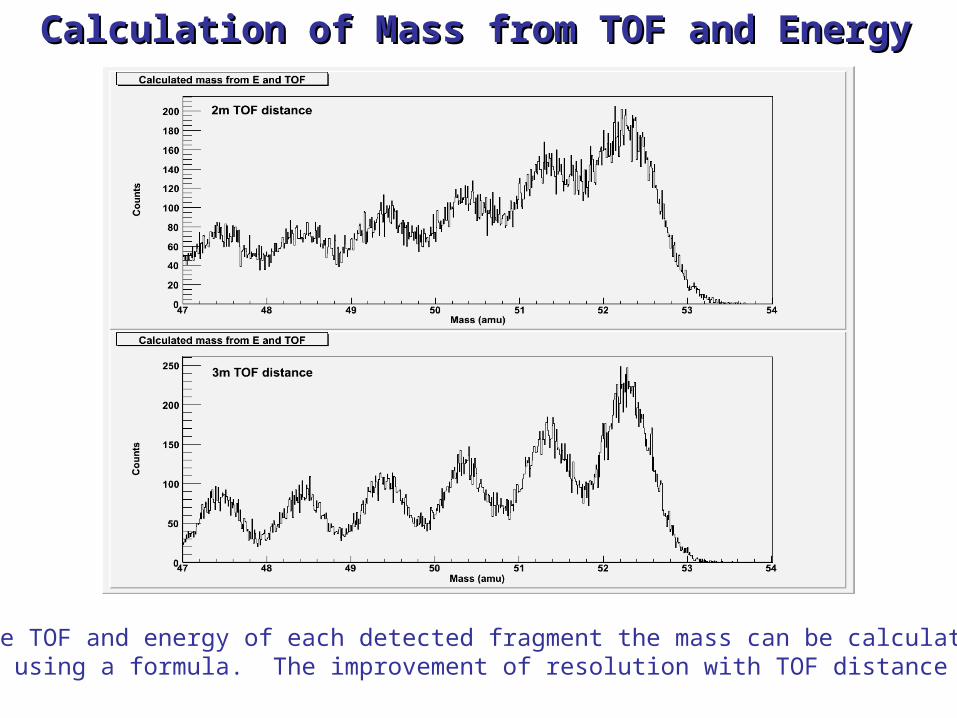
Calculation of Mass from TOF and EnergyCalculation of Mass from TOF and Energy
Using the TOF and energy of each detected fragment the mass can be calculated directly using a formula. The improvement of resolution with TOF distance is clear

ROOT Analysis File StructureROOT Analysis File Structure
• Raw signal and diagnostic spectra created and filled directly
• Raw and selected correlated signals written to a ROOT TTree object for further analysis
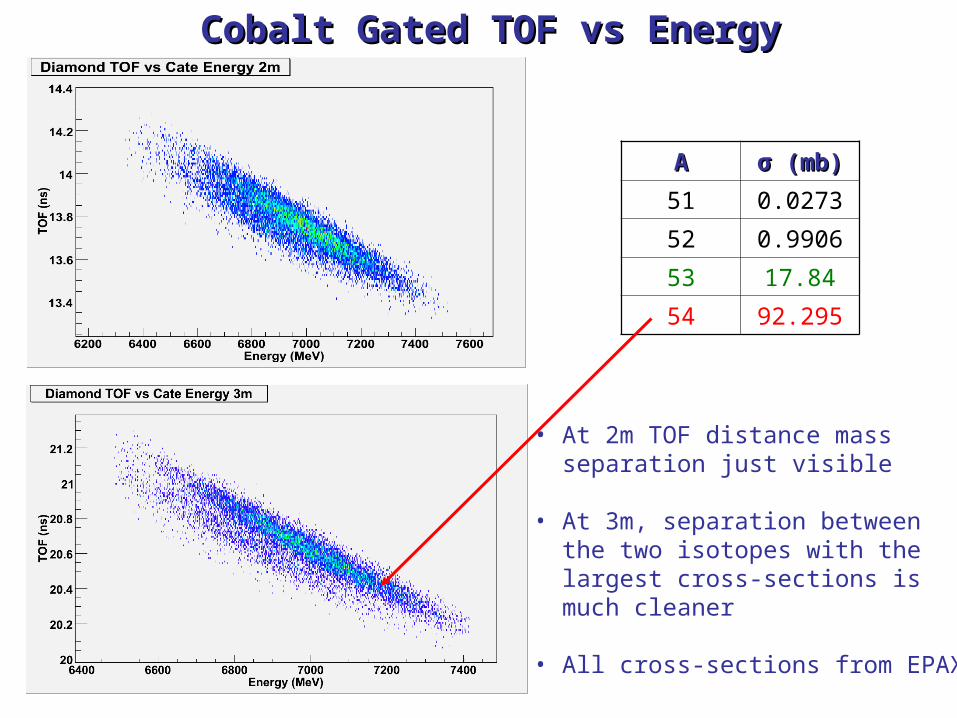
Cobalt Gated TOF vs EnergyCobalt Gated TOF vs Energy
AA σσ (mb) (mb)
51 0.0273
52 0.9906
53 17.84
54 92.295
• At 2m TOF distance mass separation just visible
• At 3m, separation between the two isotopes with the largest cross-sections is much cleaner
• All cross-sections from EPAX2
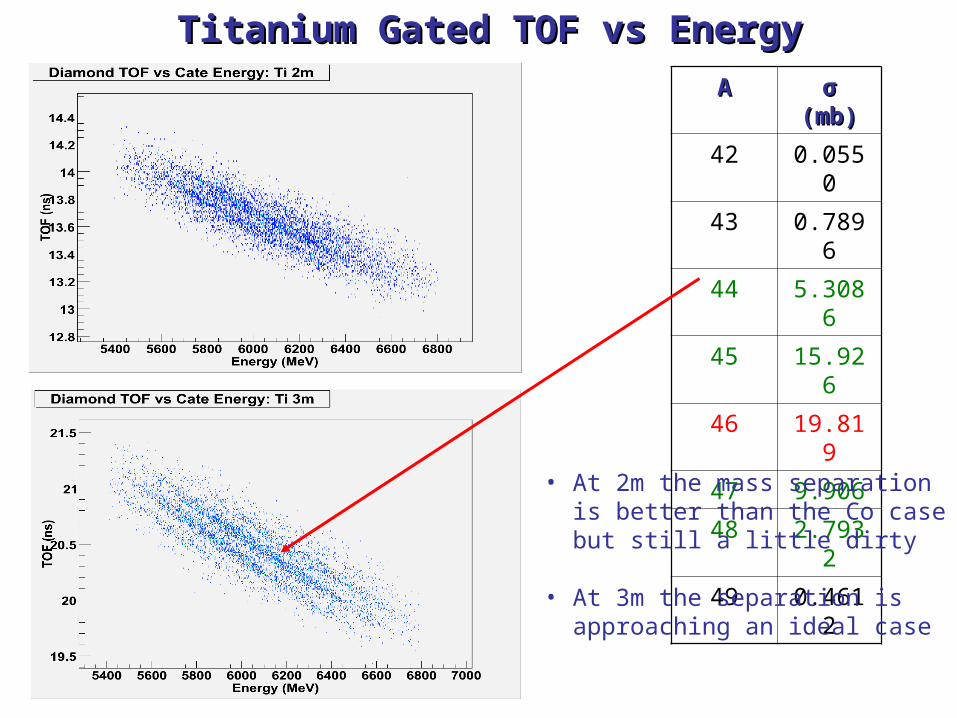
Titanium Gated TOF vs EnergyTitanium Gated TOF vs Energy
AA σσ (mb) (mb)
42 0.0550
43 0.7896
44 5.3086
45 15.926
46 19.819
47 9.906
48 2.7932
49 0.4612
• At 2m the mass separation is better than the Co case but still a little dirty
• At 3m the separation is approaching an ideal case

Sulphur Gated TOF vs EnergySulphur Gated TOF vs Energy
AA σσ (mb) (mb)
30 0.1002
31 0.9707
32 4.6244
33 10.605
34 10.454
35 4.859
36 1.4345
37 0.2938
38 0.0438
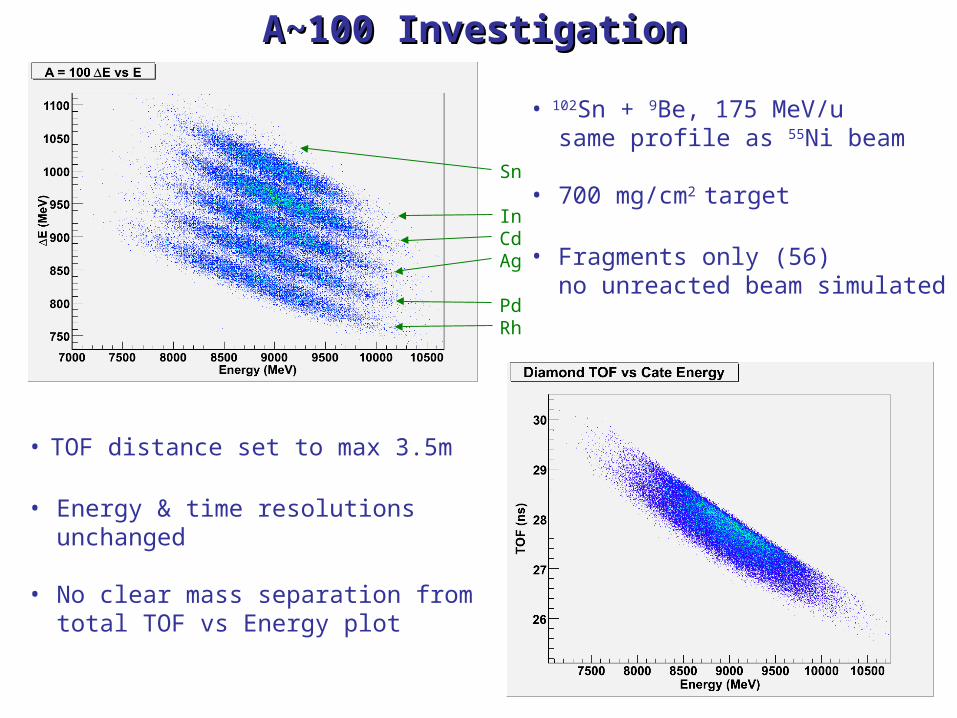
• 102Sn + 9Be, 175 MeV/u same profile as 55Ni beam
• 700 mg/cm2 target
• Fragments only (56) no unreacted beam simulated
A~100 InvestigationA~100 Investigation
Sn
InCdAg
PdRh
• TOF distance set to max 3.5m
• Energy & time resolutions unchanged
• No clear mass separation from total TOF vs Energy plot
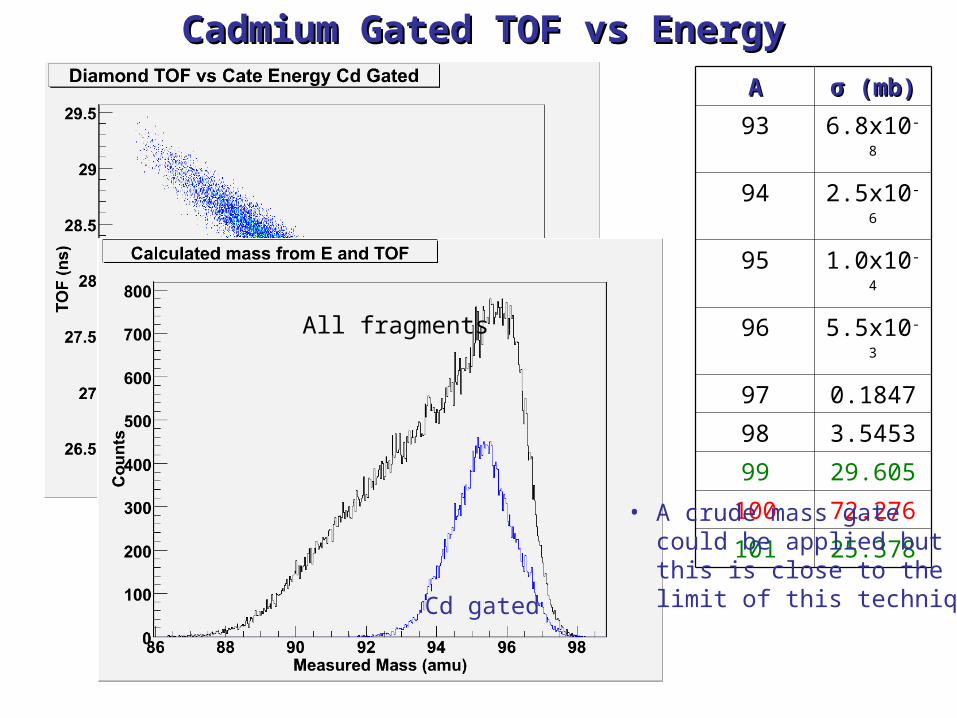
AA σσ (mb) (mb)
93 6.8x10⁻⁸
94 2.5x10⁻⁶
95 1.0x10⁻⁴
96 5.5x10⁻³
97 0.1847
98 3.5453
99 29.605
100 72.276
101 25.378
Cadmium Gated TOF vs EnergyCadmium Gated TOF vs Energy
All fragments
Cd gated
• A crude mass gate could be applied but this is close to the limit of this technique

(Lots) To Do: (Lots) To Do: (simulation wise)(simulation wise)
• Fix TOF distance to investigate detector resolution effects
• Test other timing options: Diamond – Si, Diamond – Scintilator
• Change to prototype geometry
• Simulate with Super FRS beam profile
• Simulate test experiments with final setupe.g.
• Integrate simulation into full HISPEC simulation
Beam Target Reaction36Ca Au Coulex55Ni Be Sec. Frag.102Sn Au Coulex132Sn Be Transfer
A ~ 200 Au Coulex

Towards a LYCCA PrototypeTowards a LYCCA Prototype
(2x3) Array of 6 x 6 cm DSSD’s
(2x3)x(3x3) Array of 2 x 2 cm CsI Detectors located 1cm behind the Si array
Scintillators are 1.1 cm thick 0.7 cm behind which are located 1 x 1 cm photodiodes
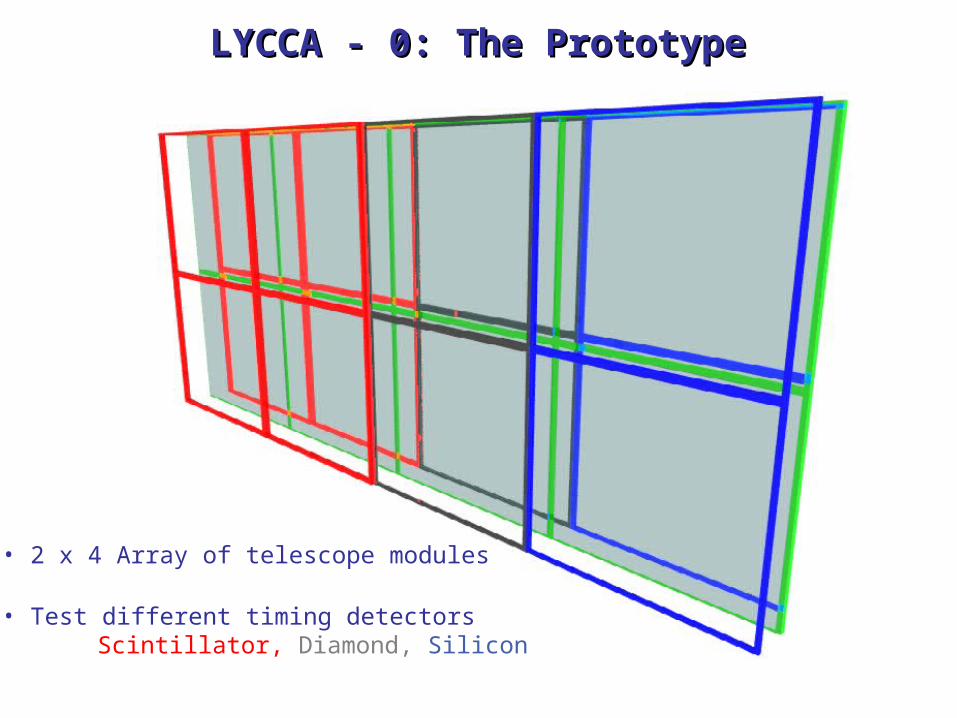
LYCCA - 0: The PrototypeLYCCA - 0: The Prototype
• 2 x 4 Array of telescope modules
• Test different timing detectorsScintillator, Diamond, Silicon
Collaborators
M. A. Bentley, University of York D. Rudolph, R. Hoischen, P. Golubev, Lund University
P. Reiter, University of KölnJ. Gerl, M. Górska, GSI Laboratory
+ Rising Collaboration, GSI+ NUSTAR Simulation group
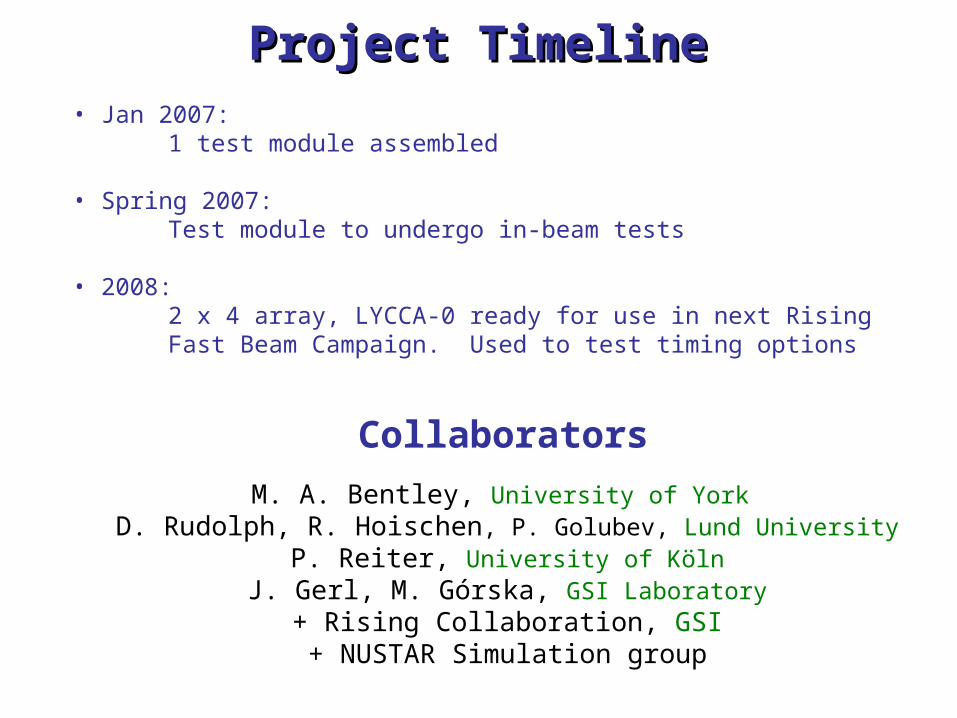
Project TimelineProject Timeline• Jan 2007:
1 test module assembled
• Spring 2007:Test module to undergo in-beam tests
• 2008:2 x 4 array, LYCCA-0 ready for use in next Rising Fast Beam Campaign. Used to test timing options