
From big bang to a galaxy of stars - alfi.lu · 10 BIG BANG TO GALAXY OF STARS “Ucits gave new...
72
From big bang to a galaxy of stars An assessment of Ucits after 30 years of evolution 30
Transcript of From big bang to a galaxy of stars - alfi.lu · 10 BIG BANG TO GALAXY OF STARS “Ucits gave new...

From big bang to a galaxy of stars An assessment of Ucits after 30 years of evolution
30

Important notice
This document was produced by, and the opinions expressed are those of, Broadridge Analytics Solutions Ltd (BASL), as of the date of writing. It has been prepared solely for information purposes and for the use of BASL’s client. The information and analysis contained in this publication have been compiled or arrived at from sources believed to be reliable but BASL cannot guarantee their accuracy or interpretation. This document does not constitute any kind of advice including investment advice and should not be acted on as such. BASL does not accept liability for any loss arising from any use of such publication. This publication is not intended to be a substitute for detailed research or the exercise of professional judgement.
Copyright © 2018 Broadridge Analytics Solutions Ltd
Published by Broadridge Analytics Solutions Ltd
Suite 501 Salisbury House
London Wall
London EC2M 5QQ
All rights reserved. No part of this publication may be reproduced, stored in any
retrieval system, or transmitted in any form or by any means, electronic, mechani-
cal, photocopying, recording or otherwise, without the prior permission of the
publishers.

Foreword Denise Voss, Chairman of ALFI
Thirty years ago, few would have foreseen the phenomenal success that Europe’s Ucits has become. ‘Undertakings for Collective Investment in Transferable Securities’ was an unlikely candidate to be a brand in its own
right, however today it is one of the EU’s most recognised financial exports, held by investors resident in over 70 countries around the globe. As the premier global investment fund, nearly two out of three Ucits distributed on a cross-border basis are from Luxembourg, and assets under management in Luxembourg Ucits continue to grow, recently reaching a new record of €3.6trn. We expect this trend to continue given the sound regulatory framework and reputation of Ucits, and the depth of global capability embedded in the structure.
All is not rosy, however. A new technological world faces the industry; savers who are looking for engaging, easy to use, customisable and, crucially, mobile solutions. Fund industry actors must now appeal to this demographic group. But, to make investing ‘on the go’ successful, they must also contribute to developing the sound financial knowledge these savers need to make smart choices with or without financial advice. This report highlights the opportunity but investor education is a critical component. ALFI’s recent relaunch of www.understandinginvesting.org, reflects our belief that investor education is essential both for the economic well-being of individuals and the global economy.
Internationally, ALFI is as active as ever with an intense promotional agenda to showcase the Grand Duchy’s investment fund ecosystem. In Latin America, Luxembourg Ucits are now among the preferred investment solutions for local pension funds and in Asia, we will continue to nurture the close relationships we maintain with the many fund markets in the region.
For 30 years ALFI has been committed to advancing Luxembourg’s position as the international fund centre of reference. We now look forward to another 30 years of commitment to achieving the full potential of Luxembourg Ucits and other funds in serving the financial health of investors and the economy.

Introduction Diana Mackay
The Big Bang for asset managers occurred 30 years ago when the European Parliament passed a directive giving Undertakings for Collective Investments in Transferable Securities the passport to access all retail
investors in what was then known as the European Community. This strange beast, now more commonly known as the Ucits Directive, triggered a period of explosive growth, turning an industry that was nascent in some countries and non-existent in others into a global brand boasting fund assets of nearly €10trn. The Big Bang caused a collection of just 5,500 funds to explode into a universe of 32,000 stars, many with sales appeal in markets beyond the gaze of the European rule makers.
Luxembourg was the first European country to seize the opportunity and the first to implement the Directive in 1988. And in this year that saw the birth of Alfi, action was taken that culminated in the smallest member of the European Community becoming the largest domicile for European funds, and the beating heart of the global fund market. European Ucits have become an accepted regulatory standard for retail funds in markets all over the world. They are an important export story with non-European markets accounting for 24% of Ucits’ assets. In terms of net sales in 2017, their share was even higher at 31%.
The 30-year history of Ucits has sometimes seemed a crooked path but proof of its resilience is clear from its ability to survive and thrive through market corrections and serious financial storms. I am privileged to have been in a position to track this regulatory success from its birth, and to have witnessed, and been able to measure, the extent of its global reach. This report represents the accumulated wisdom and data of the many stakeholders that have contributed to the past growth of Ucits. It also sets the scene for those that will guide its health for investors in the next thirty years.

5
Contents
Foreword 3
Introduction 4
Executive summary 6
Route to the top – a short history of Ucits 8
1 Three decades of exploration 11
2 European constellation 23
3 Into the wider universe 35
4 Distribution power 49
5 Future horizons 59
Appendices
1 Contributors & acknowledgements 67
2 Notes to sources 68

Executive summary
■ Ucits assets have the potential to grow at a compound rate of 5% in the next three decades: This growth rate would quadruple their asset base to over €42trn by the year 2048. This model suggests that average annual net sales flows would rise from €201bn in 2017 to €860bn in thirty years.
■ Consolidation may lead to a contraction in the number of Ucits available in the next 30 years. At the current rate of decline Ucits will number 17,500 in 2048 but their average size will be €2.4bn.
■ The Ucits Directive gave investment funds regulatory credibility: Its launch made offshore funds acceptable vehicles for retail investors thereby kick starting a period of explosive growth that took assets in long-term Ucits from €300bn to nearly €10trn in their first three decades of life. AIFMD has added a further €6trn of assets.
■ Luxembourg’s decision to be the first country to implement Ucits set the Grand Duchy on the fast track in attracting groups looking for a suitable domicile for their cross-border initiatives. Luxembourg now houses 36% of assets invested in Ucits.
■ In its brief history Ucits has proved resilient to market crises: Ucits has enjoyed periods of strong market growth and endured two significant crashes. Each market crisis has ultimately resulted in new investors appreciating the regulatory benefits of the structure.
■ Cross-border distribution is now no longer a dream but an integral feature of the regime: Pure cross-border groups are now amongst Europe’s ten largest asset management brands. Cross-border groups now account for 51% of all European long-term fund assets.
■ Ucits has made Europe a honey pot for fund groups worldwide: Groups from EU countries manage 56% of assets with US groups accounting for 30%.
6 B I G B A N G T O G A L A X Y O F S T A R S

■ Cross-border groups source 77% of their assets from Europe: Within this European portion, five countries account for 70% of assets. Italy has been the most successful market for these groups, followed by Switzerland and Germany.
■ Although designed for European investors Ucits has also proved to be a successful export: Asian markets account for 13% of cross-border assets, with Latin American markets contributing 3%. Hong Kong represents the largest market for Ucits in Asia, followed by Taiwan and Singapore.
■ China is seen to be the big prize for foreign managers: Few groups, however, have managed to compete with the local players for assets that remain focussed on domestic strategies. Plans to lift capital controls and grow third pillar pension provision could provide opportunity for the future.
■ Despite its success, it has been tough for pure-play cross-border groups to gather net new money: The average group has generated just €1bn of annual net sales from Europe and to achieve this each group has had to generate around €12bn of gross sales.
■ Mifid 2 has been a game changer disrupting the traditional value chain: The impact has been increased transparency and pricing pressure, leading to a new focus on low-cost passives. The wealth management segment, particularly those that were fee-based are least affected. They represent 43% of the European asset pool that is accessible to third party providers.
■ The CMU and local initiatives to enhance long term savings to meet severe demographic challenges will encourage future growth in Europe: Outside Europe regulators are likely to wish to protect their own markets but the Ucits brand means that the Ucits structure is most likely to be the adopted vehicle.
E X E C U T I V E S U M M A R Y 7

8 B I G B A N G T O G A L A X Y O F S T A R S
Decade 32007
2017
Route to the top A short history of Ucits
€1.8trn
1988
1987
€6.1trn
€9.7trn
2001
Global financial crisis
2007-2008
2011
Luxembourgbecomes first
country to implement
Ucits
Birth of Ucits
Ucits 3 adopted
Dotcom crash
Error 404
1997-2000
2002
Ucits AUM by
year
2004
new 10
countries join the EU
Decade 21997
Decade 1
1987
Ucits 4 & AIFMD adopted
The
is adopted
E U R O
2013
Taper tantrum
Ucits 5 adopted
2016

T H R E E D E C A D E S O F G R O W T H 9
Decade 32007
2017
Route to the top A short history of Ucits
€1.8trn
1988
1987
€6.1trn
€9.7trn
2001
Global financial crisis
2007-2008
2011
Luxembourgbecomes first
country to implement
Ucits
Birth of Ucits
Ucits 3 adopted
Dotcom crash
Error 404
1997-2000
2002
Ucits AUM by
year
2004
new 10
countries join the EU
Decade 21997
Decade 1
1987
Ucits 4 & AIFMD adopted
The
is adopted
E U R O
2013
Taper tantrum
Ucits 5 adopted
2016

10 B I G B A N G T O G A L A X Y O F S T A R S
“ Ucits gave new life to Luxembourg but the
relationship has been symbiotic and ...
Luxembourg has breathed new life into Ucits.
By providing a fund centre that is dedicated
to the asset management industry it has
offered a home that is ... attractive to those
looking to develop a long-term presence in the
European savings’ market. This is at the root
of Luxembourg’s success but it is also a critical
factor in the evolution of Ucits and the single
market dream”— Symbiosis in the Evolution of Ucits, Lipper, 2008

T H R E E D E C A D E S O F G R O W T H 11
1 Three decades of exploration
The stated goal of the European policy machine in launching Ucits was to create a passporting structure for fund sales within the European Community. Thus a fund legally created in one European domicile, assuming it met specified criteria, could be registered for sale in another. The limited ambitions of the European Commission at the time was the creation of a ‘level playing field’ for funds across Europe, but it established Europe as the global hub for fund investment and opened a door for retail savers to access the services of expert portfolio managers regardless of their location.
Prior to the Ucits Directive, the concept of cross-border business in the retail world was more or less non-existent, at least in Continental Europe. There was some interaction between Belgian investors buying coupon funds
based in Luxembourg but it was really only in the UK that cross-border business thrived and this was in the form of so-called offshore activity. For much of the 1970s and 1980s the offshore market was largely the province of British fund managers offering offshore funds to domestic investors, expatriates and other high net worth ‘third country’ nationals through low-cost tax centres in the Channel Islands, the Caribbean, Switzerland and Hong Kong. In many Continental European markets the concept of ‘offshore’ was decidedly negative and, indeed, until the mid-1980’s French investors were restricted from investing abroad. Investment in foreign funds was regarded as dangerous.
Decade 1: pan-European expansion
The Ucits Directive changed all this by giving funds, regardless of their domicile, regulatory credibility. In so doing it kick-started three decades of remarkable expansion of long-term investment for retail savers. Its development in the first decade was initially slow and in some ways unexpected. A single market of funds
11

12 B I G B A N G T O G A L A X Y O F S T A R S
that was agnostic to fund domicile and the residence of the end investor was a laudable dream but initial practicalities and market preferences made complete freedom of movement unrealistic. Luxembourg’s move to become the first country to implement the Directive paved the way for this central, multi-lingual private banking centre to become a host domicile to the early movers looking to take advantage of the opportunities that Ucits presented.
Luxembourg takes the lead
Luxembourg’s early implementation of Ucits in March 1988 put it more than a year ahead of Dublin, which formed its International Financial Services Centre and implemented the Directive in 1989. Five years later, about 75% of the 992 funds based in Luxembourg identified themselves as Ucits and were registered for sale in at least one other EC jurisdiction. Early implementation of the Directive in Luxembourg resulted in a wave of product launches there by the leading Continental European banks, thereby converting the country from a quiet banking backwater into a European fund centre with back office capabilities that enabled funds from any neighbouring nation to match the local offerings.
The historical importance of Ucits to Continental banks in this first phase of Ucits development cannot be overestimated. Belgium had historical ties with Luxembourg and the new regime further strengthened the ties. For other countries, the Grand Duchy offered the convenience of a single location with all the language and technical skills to establish funds that not only carried the imprimatur of the European Community, but also looked local. French and German banks could now use their extensive branch networks to market regulated savings products to retail investors alongside
their locally-based funds. For the Swiss, market access was the critical factor. Having voted against joining the European club, Luxembourg became a vital conduit for Swiss groups to access their private clients across Europe. The early cross-border pioneers also saw Luxembourg as a viable central hub from which they could more easily explore the Continental European markets, but in this first decade they were the minority.
0
2,0004,0006,0008,000
10,00012,00014,000
16,00018,00020,000
0
200400600800
1,0001,2001,400
1,6001,8002,000
1987 1988 1989 1990 1991 1992 1993 1994 1995 1996 1997
Fig 1.1: Growth of AUM (€bn) and # funds in 1st decade
Total net assets Lux AUM Number of funds
Source: Efama, Alfi, ICI

T H R E E D E C A D E S O F G R O W T H 13
Round-tripping
The first decade of Ucits was pan-European rather than cross-border in its orientation. It was an opportunity for the indigenous banks to move beyond their role as deposit-takers and, for the first time, flex their muscles in the more lucrative
Fig 2: Early advantages of Luxembourg for development of Ucits
Drivers of growth in initial adoption phase
Belgium
Strong historical and cultural ties with Luxembourg, and no local fund
infrastructure meant that Luxembourg Ucits filled an immediate demand
gap. Luxembourg funds offered a coupon allowing Belgian nationals
to manage complex inheritance taxes so the implementation of laws
enabling the launch of local Ucits meant a slow start for the domestic fund
industry.
Germany
Processing advantages – a fund based in Luxembourg could be launched
faster than an equivalent German-based fund. German groups discovered
the convenience and flexibility of being able to offer Luxembourg funds to
their local clients and owning a Luxembourg fund became fashionable!
SwitzerlandAn international client base and a position outside the EU made an
alternative home in Luxembourg an essential recourse for Swiss banks.
France
Luxembourg was less important to French providers, which thrived
on a large domestic market. Luxembourg Ucits offered no immediate
attraction to French investors over their local funds but a small number
of institutions found the large umbrella structures attractive for the
switching opportunities they allowed. Umbrella structures were not
available in France.
UK
For UK groups the Ucits opportunity was one of access to Continental
European investors but finding suitable distributors in these bank-
dominated countries proved challenging.

14 B I G B A N G T O G A L A X Y O F S T A R S
By 1993 round-trip
funds represented
58% of all
Luxembourg Ucits
provision of long-term savings products, which also introduced many to foreign exchange and other investment banking activities. These banks entered a pan-Europe phase of acquisition activity looking to develop equivalent domestic franchises in other European countries. For these organisations Luxembourg became a convenient domicile for funds destined for consumption by their home-market investors and insofar as they acquired or established entities in other countries, their aim was to manage local (or Luxembourg) funds for local investors.
The phrase ‘round-tripping’ was coined to describe the local sales focus of these early adopters of Ucits in Luxembourg. By the end of 1993 round-trip funds represented 58% of all Luxembourg Ucits. And, by linguistic extension the term ‘reverse round-trip’ also became a feature linked to funds that were launched in Luxembourg and notified for sale only in Luxembourg. These funds, predominately managed by German banks enabled clients to buy either Luxembourg or German funds through a single Luxembourg account. In this year more than half of all Luxembourg Ucits were sold into just one market. A mere 8% of Luxembourg-based Ucits were notified for sale in more than four markets and of all Ucits selling into this number of countries, Luxembourg Ucits accounted for 92%.
Decade 2: from boom to bust, and boom again
After a sluggish start the fund industry under the Ucits Directive boomed. By the end of its first decade the number of Ucits in Europe had exploded from 5,500 with €307bn of assets under management to over 17,000 with assets of €1.8trn1. The drivers were complex but essentially distilled into two areas:
▪ Interest rates reductions encouraging a long-term move out of cash and money market funds, into fixed income funds mainly investing in government bonds. Banks were the principle beneficiaries of this shift, which also kick-started the vibrant Italian fund industry.
▪ Rising appetite for equity funds, which culminated in the dot.com bubble of 1999 and, ultimately, in the crash that followed in 2000.
The dot.com bubble marked the end of the first decade for Ucits but also its first crisis of confidence. 1999 was the pivotal year when European investors piled into
1 Efama

T H R E E D E C A D E S O F G R O W T H 15
equity funds, specifically those investing in internet and technology stock. No pan-European sales data exists for this heady period but extrapolation from such data as was available at the time suggests that over €200bn of new money was invested in equity funds in 1999, with a further €143bn in 2000, of which €129bn was invested by Italians alone. The scale of this bubble can only really be appreciated by looking at subsequent equity flows, which have never since reached the 1999 volumes. Their best subsequent year was, in fact, 2017 when European funds registered €164bn of new money but, in contrast with 1999, this latest peak saw 65% of net inflow going into passively managed funds.
Shock waves from the dot.com crash
The crash came in the Spring of 2000 and with it collapsed the allfinanz ambitions of many European banks to dominate both the manufacture and distribution of funds. Their heavy involvement in encouraging savers into high-risk technology stocks, managed internally, rocked the confidence of their clients, many of whom saw the value of their holdings plummet by 50%-70%. On the plus side, they chose, or were persuaded to avoid, crystallising losses and although the new money tap was turned back to just a dribble, equity funds remained in positive territory until the financial crisis weighed in.
Source: Broadridge, latest data date – June 2018 Author estimates for 1999 and 2001 based on BVI and Assogestioni data for Germany and Italy.
(150)
(100)
(50)
0
50
100
150
200
1999 2001 2003 2005 2007 2009 2011 2013 2015 2017
Fig 1.2: Net sales of Equity funds from dot.com bubble to current date

16 B I G B A N G T O G A L A X Y O F S T A R S
European expansion and new growth
Meanwhile, the newly-launched Eurozone in 2000, and the subsequent widening of the European Union to embrace many Eastern European nations in 2004 led, to a rapid expansion of interest in European and Eurozone stock funds. This time, though, it was the cross-border groups that were the main beneficiaries. Mainstream retail investors, the core constituents of the banks, remained on the sidelines nursing their tech-stock losses, but wealth managers and third party distributors in search of performance sought the investment skills on offer from the pure-play fund houses. This was also a period of open- or guided-
architecture growth when banks saw advantage in using third party manufacturers to offset earlier disappointment in their own equity skills. Many banks shifted their strategies from allfinanz to distribution and fund selection strength.
Ucits 3 and inclusion of derivatives as eligible assets
At the start of this second decade of Ucits evolution, the European Commission published its proposals for Ucits 3 (1998), having failed to get agreement for Ucits 2. Ucits 3 was adopted in 2001 and expanded the range of investments permitted by Ucits funds to money market funds and funds of funds. Critically, the list of eligible assets included, for the first time, certain derivatives and hedge fund strategies aimed at sophisticated investors. ‘Newcits’ became the buzz word for these strategies to distinguish them from traditional products, that were all subsumed under the Ucits 3 umbrella. On the plus side, retail investors gained access to some regulated hedge fund strategies and, of these, absolute return strategies have become the most prolific.
These initiatives reinvigorated Ucits and fund industry fortunes leaving the dot.com crash a memory that could quickly be forgotten. By 2005 net sales of long-term funds had risen to a new high point of €371bn with bond funds enjoying their best year on record. Rising interest rates put an end to the bond boom in 2006 but equities continued to shine until the first rumblings of the financial crisis slammed the door to the second decade of Ucits.
0
5,000
10,000
15,000
20,000
25,000
30,000
35,000
40,000
0
1,000
2,000
3,000
4,000
5,000
6,000
7,000
1997 1998 1999 2000 2001 2002 2003 2004 2005 2006 2007
Fig 1.3: Growth of AUM (€bn) and # funds in 2nd decade
Total net assets Lux AUM Number of funds
Source: Efama, Alfi

T H R E E D E C A D E S O F G R O W T H 17
Decade 3: promises delivered or dashed?
The third decade of Ucits had an inauspicious start. With the financial markets seemingly spiralling out of control, investors sold out of every asset class with the sole exception of safe-haven money market funds. This was a year of unparalleled redemptions for long-term funds, which rose to €390bn by the year end. It was undoubtedly a painful period for fund groups but withdrawals in 2008 – the depth of the crisis – represented less than 10% of the €4.5trn then invested in funds. Crippled market performance, though, had a much greater impact on industry fortunes, wiping out more than a quarter of long-term fund assets.
Fears of the destruction of the Ucits brand and loss of trust amongst retail savers were rife. Ironically, though, although mainstream savers retreated to cash, others saw the benefits of the regulatory protection of Ucits and the period of pain was surprisingly brief. By 2010 assets had recovered to their 2007 peak and fund groups enjoyed two years of sales volumes that came close to €250bn a year. In a period of extraordinary distress that had many in the industry questioning how investor trust could be restored, some investors were benefiting from the unprecedented decline in market values. The regulatory protection offered by Ucits proved to be a draw for institutions and wealth managers who had previously viewed the vehicle as too expensive, at least for exposure in plain vanilla securities.
Post-Financial Crisis drivers of growth
The rebound could be distilled down to the following drivers:
▪ Record low interest rates, resulting from central bank policies to steer global economies from collapse.
“There is a high risk of investors losing confidence and the industry as a whole should be aware that the trust needed to build the culture of long-term savings, which is so indispensable to the future economic health of the European Community, may have been challenged.”
– John Baptiste de Franssu Building Long-Term Savings in Europe, 2009

18 B I G B A N G T O G A L A X Y O F S T A R S
▪ Wealth managers, quick to spot the capacity of emerging markets to recover earlier than the developed countries, and to take advantage of stock market rises fuelled by the proprietary trading that followed government quantitative easing strategies. Of €113bn that was redeemed from equities in 2008, €112bn returned in 2009.
▪ The chase for yield against the backdrop of low interest rates had the wealthy and some mainstream investors backing investment grade debt and other higher yielding bond funds.
▪ A new-found appreciation of the regulated status of Ucits, which compounded as Europe entered its debt crisis. Funds were seen to be safer than unregulated hedge funds and the ability to access hedge strategies in Ucits form seemed a better option for many. Meanwhile, interest rates were crumbling and cash deposits were vulnerable to being snatched by creditors in advance of a state bail out.
▪ Accommodative Central Bank policies in the form of quantitative easing created enormous opportunities for more sophisticated investors to front run the well-broadcast initiatives.
Expanding appetite and new opportunities
Amongst the wider retail franchise this was the decade of risk aversion and restraint. Fearful savers with the willing encouragement from their cash-strapped banks retreated to cash. Some banks sold off their asset management arms either willingly or under orders from European regulators – the price of rescue during the Eurozone credit crunch – leaving local and cross-border independents the space to innovate and expand.
In this decade of turmoil and opportunity the competitive landscape changed again, from one that was dominated by the large Continental
captive banks to one where independent houses, both local and cross-border, stepped into the spotlight. At the start of 2007 Europe’s ranking of largest managers of long-term funds was led by UBS and included just two cross-border groups. A decade later the number of pure-play cross-border groups had doubled, whilst those
0
5,000
10,000
15,000
20,000
25,000
30,000
35,000
40,000
0
2,000
4,000
6,000
8,000
10,000
12,000
2007 2008 2009 2010 2011 2012 2013 2014 2015 2016 2017
Fig 1.4: Growth of AUM (€bn) and # funds in 3rd decade
Total net assets Lux AUM Number of funds
Source: Efama, Alfi

T H R E E D E C A D E S O F G R O W T H 19
with a mixed franchise had expanded. Importantly, BlackRock, powered by its ETF business, had leapfrogged bank and independent competitors alike to become Europe’s largest asset management brand.
Incorporating alternatives into the passporting regime
During this period Ucits 4 and 5 were implemented, further facilitating cross-border expansion with the introduction of the management group passport, the launch of the simplified prospectus (which became the Key Investor Information Document or Kiid), and provisions to encourage efficiencies through pooling of assets (via master feeder funds) and fund mergers. Finally, within Ucits 5 were numerous provisions to increase the security of the depositary provisions and implement a remuneration regime for key staff that aligned their interests more closely with investors. As well as enhancing existing Ucits provisions the European Parliament also approved a further important expansion of the passport to include a number of so-called alternative products in the form of the Alternative Investment Fund Manager’s Directive (AIFMD) in 2011.
Fig 1.5: Market leaders – Dec 2006 (€bn)
Name Provenance AUM
1 UBS AG CH/X-Border 179
2 Crédit Agricole FR 179
3 Unicredit IT 150
4 DWS DE/X-Border 130
5 Fidelity X-Border 114
6 AXA Group FR/X-Border 100
7 JPMorgan X-Border 95
8 Eurizon IT 89
9 Union DE 86
10 Allianz GI DE 83
Total AUM – Top 10 1,202
Total AUM – All groups 4,443
Market share of top 10 groups 27%
Fig 1.6: Market leaders – Dec 2016 (€bn)
Name Provenance AUM
1 BlackRock X-Border 519
2 UBS AG CH/X-Border 231
3 DWS DE/X-Border 226
4 Intesa SP IT 160
5 Amundi FR/X-Border 151
6 JPMorgan X-Border 144
7 Union DE 144
8 AXA FR/X-Border 142
9 Fidelity X-Border 139
10 Schroders X-Border 138
Total AUM – Top 10 1,994
Total AUM – All groups 7,559
Market share of top 10 groups 26%
Source: Broadridge. Note: Data excludes money market funds and funds of funds.

20 B I G B A N G T O G A L A X Y O F S T A R S
The new category of Alternative Investment Funds (AIFs) introduced a sizeable new segment of investment activity embracing closed-ended investment funds, private equity and venture capital funds, real estate funds and hedge funds. The European trade association, Efama, show assets of funds now categorised as AIFs to have had €1.9trn of assets in 2007. By the end of 2017, this volume had expanded to reach nearly €6trn of which the bulk (27%) was invested in multi-asset products.
Although still a junior partner to Ucits, their growth has once again proven the power of regulation in facilitating market expansion. Demand for alternative products is rising, particularly in the current more volatile market climate. However, there remains some suspicion of the complex structures involved in some products, particularly hedge funds. Increasingly, asset managers find easier acceptance if the strategy can be brought within a Ucits wrapper. Some selectors specifically
include only Ucits into their selection criteria because their target market effectively excludes AIFs under the Mifid 2 rules. This, of course, will act as a break on the appeal of AIFs because although many AIF products are of interest to selectors, such as private equity, they want these products within a Ucits wrapper.
Into the next decade
The decade that began in the depths of the global financial crisis ultimately resulted in an accelerated expansion of Ucits and a wider regulatory framework for alternatives. It also resulted in the realisation of the cross-border dream for those early pioneers that made use of the facilities offered by Luxembourg and Dublin to access the European markets with a single range of funds. By the beginning of the fourth decade of Ucits, assets under management were on the cusp of breaching the €10trn mark with AIFs adding a further €6trn to the universe. More than a third of funds domiciled in Europe are sourcing assets from multiple European and global markets and, of these, 64% are based in Luxembourg, and a further 25% in Dublin. Ironically, the decision made by the US regulators three decades ago to
0.01.02.03.04.05.06.07.08.09.0
10.0
2007 2008 2009 2010 2011 2012 2013 2014 2015 2016 2017
Fig 1.7: AUM in Ucits v AIFs (€trn)
Ucits AIFs
Source: Efama Fact Book 2018, Alfi
‘I’m seeing an increased focus on Ucits-compliant non-directional strategies, including long/short equity’Discretionary Portfolio Manager | Sweden
‘We only accept Ucits funds, no AIFs on our shortlist.’Retail bank | Austria

T H R E E D E C A D E S O F G R O W T H 21
forego reciprocal access for Ucits into the US and SEC-registered funds into Europe, resulted in Europe becoming the central hub of cross-border fund traffic, and Ucits becoming the commonly accepted regulatory standard for funds around the world.
This important footprint will bode well for Ucits in the coming decade as populations in many of the newer markets are encouraged by their governments to take on the mantle of pension provision. Regulators in most non-European countries will wish to build a local fund franchise but the regulatory structures they use are most likely to be based on Ucits, which will ultimately facilitate access for European Ucits when doors begin to open.
In Europe the next decade will see the launch of the Capital Markets Union, an EU initiative that could be as important to the future growth of Ucits as the original Directive. At the core of this action plan is a desire to increase investment and the choices available to retail and institutional investors. Ultimately, the EU is seeking to deepen the capital markets by migrating some of the vast pool of deposit savings into managed investments. This is a multi-tentacled initiative but over the next decade we can expect Ucits to be a key beneficiary.
Europe2018: 74%2013: 77%
North America2018: 4%2013: 5% Asia
2018: 12%2013: 11%
La�n America2018: 3%2013: 3%
Fig 1.8: Global appeal of cross-border funds, by region
Bubble size repre-sents fund market AUM
Propor�on of cross-border AUM by region, 2018 vs 2013, %.
MEA2018: 1%2013: 1%
Source: Broadridge

22 B I G B A N G T O G A L A X Y O F S T A R S
“ When we choose a provider, we look at
minimum fund sizes of at least €100m as a
rule of thumb to safeguard consistency.
We also need UCITS-compliant funds. ”— Insurance fund selector | Germany

E U R O P E A N C O N S T E L L A T I O N 23
2 European constellation
The Ucits Directive created the regulatory energy that sparked a spectacular growth of long-term savings through funds in Europe. From a near-standing start of €307bn, the European industry has exploded into a constellation of over 32,000 Ucits with assets of nearly €10trn in long-term funds1. Although in its initial development phase it was the local European industries that were powered up, as the new century dawned the dream of the cross-border passport became a visible reality. Cross-border funds2 now account for nearly a third of all long-term Ucits, and 51% of assets3. The bulk of this business is sourced from European investors but an unintended consequence of this regulatory initiative was its early acceptance by investors in wider global markets.
The intention of the original architects of Ucits was to create a harmonised landscape for marketing funds across Europe. Discussions of some wider reciprocal agreements between the US and Europe rumbled along in the
background during the early phase of Ucits’ inception but the idea of opening up the US market to funds domiciled in Europe, and visa versa, proved to be an industry fantasy that arose out of the optimistic naivety of business strategists looking at market opportunity with little understanding of local cultures, savings preferences and competitive forces. To American eyes at that time Europe was seen to be a huge opportunity. It was a single market with 360 million or so consumers – a third larger than the US – with savings predominately committed to cash deposits. This status quo has changed very little in the first 30 years of Ucits; 40% of European household savings remains in cash and deposits, according to Central Bank statistics, with just 11.4% committed to investment funds4.
1 Efama2 Defined by Broadridge as funds that source less than 80% of their assets from one single country. 3 Broadridge, long-term funds, excluding funds of funds, June 2018 4 Efama Factbook, 2018
23

24 B I G B A N G T O G A L A X Y O F S T A R S
With no reciprocal trade agreement forthcoming between Europe and the USA, any group wanting a stake in the Ucits opportunity was forced to establish funds in the European Union and although some US groups were already present, the launch of Ucits resulted in multiple waves of newcomers from the US and elsewhere, establishing funds in either Luxembourg and Dublin to take advantage of this unique passport. Today, asset managers from some 48 non-EU countries take advantage of the Ucits Directive by basing funds in the EU and, of these, groups with a US provenance have the largest presence with fund assets of nearly €3trn, or 30% of the
entire European Ucits total5. Similar proportions can be seen in Europe’s largest host domicile, Luxembourg. However, the presence of US groups in Europe’s second host centre, Dublin, is all-powerful. Here they account for 72% of Irish-domiciled assets.
Territorial expansion
Although the Ucits Directive promised the so-called single market for funds, the ability of a single family of funds to sell into multiple markets was slow to emerge. Indeed, the early cross-border pioneers found it hard to track down distributors that were willing to sell their funds. They were unknown entities and treated with suspicion; banks were a closed door and their all-embracing presence left little room for newcomers. In these early days (1994) just 269 funds were registered for sale in five countries or more6. Today, there are 12,607 cross-border funds, each one registered to sell in an average of just over eight countries7.
By the end of 2016 cross-border activity had reached a pivotal point in its gestation, with assets finally overtaking those of Europe’s domestic players. This trend continued in 2017 when the assets of cross-border groups accounted for 51% of long-term funds (Fig 2.2). The power of the Ucits franchise is even more obvious when looking at the average volume of assets in cross-border funds, compared with their domestic
5 Broadridge, data at 30 June 2018. Data excludes funds of funds to avoid double counting.6 Lipper Analytical Strategy Report – Cross-Border Marketing 19957 Global Fund Distribution 2018, Alfi, data sourced from Lipper and PWC
Australasia1%
Carribean0%
EU56%
LatAm0%
MEA1%
N America30%
Wider Europe12%
Fig 2.1: Share of assets by group provenance
Source: Broadridge
0
1,000
2,000
3,000
4,000
5,000
2001
2002
2003
2004
2005
2006
2007
2008
2009
2010
2011
2012
2013
2014
2015
2016
2017
Fig 2.2: Growth of Cross-Border Fund AUM (€bn)
Domestic Cross-border
Source: Broadridge

E U R O P E A N C O N S T E L L A T I O N 25
counterparts. This analysis (Fig 2.3) shows cross-border funds to have overtaken domestic funds in the aftermath of the dot.com bubble, highlighting one of many factors encouraging the growth of cross-border strategies over the last two decades.
Drivers of cross-border opportunities
The Ucits framework provided the structure for cross-border development, but it was external market drivers that created the opportunities. The most important of these were:
▪ Increased consumer scepticism in the allfinanz banking model following the bursting of the dot.com bubble. The consumer shock that came from overselling practices at that time led to greater retail appetite for product choice that went beyond the in-house range.
▪ Introduction of D2C supermarket platforms and discount brokerages in the late 1990s, that encouraged greater consumer awareness of the wider choices of products that were available. Fund performance data was embedded in these sites and enabled cross-border providers to profile the superior performance of relevant funds in a period of equity bull markets. Although none of these D2C providers became significant distributors, they nonetheless played an important educational role.
▪ The global financial crisis, which served to highlight the security of regulated products making them increasingly attractive to wealth advisers who previously regarded funds as an expensive option for exposure to securities that they could easily access directly. At a time when developed markets were sinking into oblivion, the search for uncorrelated options such as emerging markets and absolute return strategies, further enhanced the use of funds because they were cheaper to access in this form, and they were regulated.
▪ An institutional drift towards funds for the regulatory comfort they offered, supported by asset managers, which launched, in particular, tracker products for their clients. The most recent iteration of this development is the growth of fund activity from fiduciaries and institutional gatekeepers like Mercers who are now enabling institutions to access their advisory/asset allocation strategies via Ucits funds.
0
50
100
150
200
250
300
350
400
450
2001
2002
2003
2004
2005
2006
2007
2008
2009
2010
2011
2012
2013
2014
2015
2016
2017
Fig 2.3: Growth of ave fund AUM (€bn)
Domestic Cross-border
Source: Broadridge

26 B I G B A N G T O G A L A X Y O F S T A R S
▪ Communication and particularly the dissemination of information via the internet, which created greater visibility of funds from other markets that might not otherwise have been spotted. In this way sight of successful local funds from boutiques now creates external demand and encourages the managers of such funds to expand their franchise. The huge success of Carmignac’s Patrimoine fund in 2009-2010 is an example of this dynamic at play.
Sales expansion
Net sales totals over the same period show even more energy, in part from the steady influx of new players, but also from new investors – sophisticated and institutional – that increased their commitment to funds. Rising interest in ETFs, a switch away from plain vanilla funds towards more complex solutions, and the delivery of greater choice, has helped the cross-border segment to accelerate. The slower pace of development from domestic groups was really linked to the bank franchise, which
suffered more acutely from the financial crisis and, mirroring the risk aversion of their retail clients, took much longer to recover.
The game has changed in the last few years and banks are now looking to increase profitability rather than boost cash buffers. Their captive clients, weary of impoverished interest rates are ready to consider more lucrative savings options even with some risk attached. These local players have therefore begun to recover some market share. It is worth noting here the growing importance of local boutiques as contributors to the domestic sales totals in some markets. Their role remains small but they are increasingly in the sights of fund selectors in their countries of operation.
Global passport success
The Ucits success story and its rapidly expanding reach into multiple global markets can be mapped through the registrations that Ucits funds have achieved over the years. However, the real test of their accomplishment is in the assets derived from these countries. These assets are invested in European Ucits but are sourced from investors both within and beyond Europe. According to Broadridge SalesWatch1 data, based on data declared by 67 of Europe’s leading cross-border groups, just
(300)
(200)
(100)
0
100
200
300
400
500
600
2002
2003
2004
2005
2006
2007
2008
2009
2010
2011
2012
2013
2014
2015
2016
2017
Fig 2.4: Net sales of Cross-Border v domestic funds (€bn)
Domestic Cross-border
Source: Broadridge

E U R O P E A N C O N S T E L L A T I O N 27
under a quarter of assets invested in their European Ucits are sourced from outside Europe, principally Asian and Latin American markets (see Chapter 3 for further details on these markets). The split of assets has changed very little over time although the overall volume of assets represented by the contributing groups have more than doubled since 2010. These groups registered assets of €2.6trn at the end of 2017.
Focus on Europe
Within Europe the asset split is weighted heavily towards five key markets, which represent 70% of the €1.9trn of assets booked by investors in Europe. The data set reveals assets sourced from nearly 40 countries in the wider European region, including Russia and Turkey. However, the majority of these markets are very small and only 14 contribute long-term assets of more than €10bn. Fig 2.6 illustrates the split and highlights those markets in which foreign or cross-border Ucits have enjoyed most traction. These are also the markets that have generated the largest sales volumes in recent years (see Market Dashboard below for a full profile of Europe’s top five markets).
With retail investor attention increasingly favouring products offered by the cross-border investment specialists, and more local players entering the cross-border arena, how successful have these expansionist strategies been in gathering new assets from European retail investors? Fig 2.4 shows a strong growth dynamic but this data also includes ETFs, Asian and other non-European inflows, as well net sales from institutions. A deep-dive into the sales activities of the Broadridge SalesWatch8 groups, which better reflect the appetite of third party retail buyers, reveals a more nuanced picture of a maturing industry where increasingly weighty gross sales volumes are necessary to maintain positive net sales traction. This is particularly the case for the largest and longest-standing cross-border groups that have built up sizeable pools of legacy assets that inevitably become vulnerable to redemption as investors shift
8 See Appendix 1 for detailed definition of this data
Asia-Pacific13%
Europe77%
LatAm3%
Other7%
Fig 2.5: Regional split of European Ucits by asset source
Source: Broadridge SalesWatch1 Data: Split based on assets of €2.6trn at 31 Dec 2017. Data excludes ETFs, Funds of Funds, SIFs and money market funds.
Italy23%
Switzerland17%
Germany12%
UK11%
Spain7%
Rest30%
Fig 2.6: Source of AUM from European investors in cross-border funds
Source: Broadridge SalesWatch1 Data: Split based on assets of €1.9trn at 31 Dec 2017. Data excludes ETFs, Funds of Funds, SIFs and money market funds.

28 B I G B A N G T O G A L A X Y O F S T A R S
their allocations in response to the changing waves of product demand. ETFs will be also a factor in the widening gap that has developed, almost uninterrupted, between gross and net sales totals since 2012. During this period, the steady take-up of ETFs, which predominately wear a Ucits hat, have eaten into the assets of certain core sectors, particularly in the equity arena.
The fact remains, though, that aspiring managers looking to penetrate the European markets, need to be aware that despite the large sales numbers that are thrown around in the public domain, the average pure-play cross-border group has historically generated
just under €1bn of annual net sales receipts from the European markets9. And, to achieve this volume, it was necessary for each group to achieve around €12bn of gross sales. The average obviously masks much bigger numbers from the largest contributing brands, but it highlights the amount of sales activity required to support the rising asset trend. Nonetheless, at the asset level, growth over the last decade of turmoil more or less matches that of the wider European universe where assets have risen by a factor of 1:8 with market performance and net sales contributing in more or less equal proportions.
There is much still to do to fully realise the single market dream in Europe but, after three decades of evolution, the playing field for cross-border and domestic groups is now more or less level. Cross-border funds have proved their ability to capture new business from all the European markets, and in some, they have built a sizeable market share.
9 Broadridge SalesWatch – calculated over the 10-year period to Dec 2017
(4,000)(2,000)
02,0004,0006,0008,000
10,00012,00014,00016,00018,000
2005
2006
2007
2008
2009
2010
2011
2012
2013
2014
2015
2016
2017
2018 a
nnualis
ed
Fig 2.7: Gross and net sales over time -per group average (€m)
Gross sales Net sales Linear (Gross sales) Linear (Net sales)
Source: Broadridge SalesWatch

29M A R K E T D A S H B O A R D
ITALYKey metrics – long-term funds (€bn) 2017
AUM CAGR (10 yr) Net sales
Domestic 475 2% 34
Cross-border 456 21% 68
TOTAL 931 8% 102
Foreign market share 49% 67%
Product focus (€bn) 2017
Domestic Net sales
1. Mixed Asset - Target Mat 6.3
2. Bond Global Currency 6.1
3. Asset Allocation 5.9
4. Mixed Asset Conservative 5.6
5. Bond Emerging Markets 5.1
Cross-border Net sales*
1. Mixed Asset Income --
2. Bond Global Currency --
3. Asset Allocation --
4. Bond Emerging Markets --
5. Bond Flexible --
% of passives in client portfolios: 19%
Bond45%
Equity27%
Mixed26%
Other2%
Cross-border AUM by investment type
(80,000)
(60,000)
(40,000)
(20,000)
0
20,000
40,000
60,000
2002 2003 2004 2005 2006 2007 2008 2009 2010 2011 2012 2013 2014 2015 2016 2017
Net sales history – 3-yr moving average (€m)
Domestic Cross-border
Broadridge. Data at 31 Dec 2017 with CAGR calculated from 2007. Data excludes ETFs, Money Market funds (incl Enhanced). Funds of Funds also excluded except in sector table. Cross-border data sourced from confidential data contributions from 67 groups to Broadridge SalesWatch service.
The Italian market has been the most
successful target for cross-border groups,
which have built up a market share of
nearly 50%. Bond funds are a strong
favourite but mixed asset funds are now
enjoying stronger growth. There is very little
difference in appetite between domestic
and cross-border sectors, although local
players dominate the Target Maturity space.
* Net sales data unavailable for reasons of confidentiality..
30 M A R K E T D A S H B O A R D
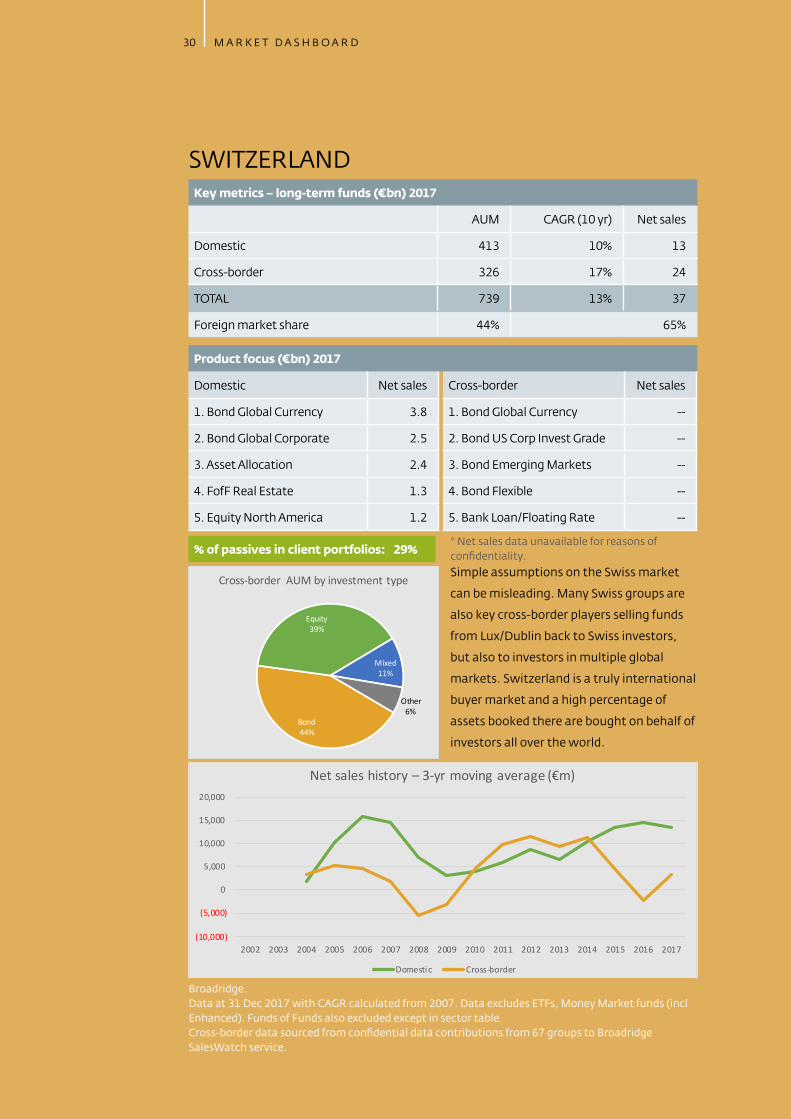
SWITZERLANDKey metrics – long-term funds (€bn) 2017
AUM CAGR (10 yr) Net sales
Domestic 413 10% 13
Cross-border 326 17% 24
TOTAL 739 13% 37
Foreign market share 44% 65%
Product focus (€bn) 2017
Domestic Net sales
1. Bond Global Currency 3.8
2. Bond Global Corporate 2.5
3. Asset Allocation 2.4
4. FofF Real Estate 1.3
5. Equity North America 1.2
Cross-border Net sales
1. Bond Global Currency --
2. Bond US Corp Invest Grade --
3. Bond Emerging Markets --
4. Bond Flexible --
5. Bank Loan/Floating Rate --
* Net sales data unavailable for reasons of confidentiality.. % of passives in client portfolios: 29%
Bond44%
Equity39%
Mixed11%
Other6%
Cross-border AUM by investment typeSimple assumptions on the Swiss market
can be misleading. Many Swiss groups are
also key cross-border players selling funds
from Lux/Dublin back to Swiss investors,
but also to investors in multiple global
markets. Switzerland is a truly international
buyer market and a high percentage of
assets booked there are bought on behalf of
investors all over the world.
(10,000)
(5,000)
0
5,000
10,000
15,000
20,000
2002 2003 2004 2005 2006 2007 2008 2009 2010 2011 2012 2013 2014 2015 2016 2017
Net sales history – 3-yr moving average (€m)
Domestic Cross-border
Broadridge. Data at 31 Dec 2017 with CAGR calculated from 2007. Data excludes ETFs, Money Market funds (incl Enhanced). Funds of Funds also excluded except in sector table. Cross-border data sourced from confidential data contributions from 67 groups to Broadridge SalesWatch service.

31M A R K E T D A S H B O A R D
GERMANYKey metrics – long-term funds (€bn) 2017
AUM CAGR (10 yr) Net sales
Domestic 590 3% 28
Cross-border 240 12% 15
TOTAL 830 4% 43
Foreign market share 29% 35%
Product focus (€bn) 2017
Domestic Net sales
1. Mixed Asset Conservative 6.1
2. Asset Allocation Alternative 4.8
3. Bank Loan/Floating Rate 3.4
4. Equity Global Income 2.3
5. FofF Asset Allocation 2.2
Cross-border Net sales
1. Bank Loan/Floating Rate --
2. Asset Allocation Alternative --
3. Mixed Asset Income --
4. Bond Global Currency --
5. Bond Flexible --
* Net sales data unavailable for reasons of confidentiality.. % of passives in client portfolios: 23%
Bond36%
Equity40% Mixed
19%
Other5%
Cross-border AUM by investment type One of the first markets to become truly
accessible to cross-border Ucits, Germany
remains a key target for cross-border Ucits
although the pace of sales was curtailed
by the financial crisis and has only recently
recovered to its earlier form. Mixed asset
funds have been the product of choice but
competition from local providers is stiff.
(15,000)
(10,000)
(5,000)
0
5,000
10,000
15,000
20,000
25,000
2002 2003 2004 2005 2006 2007 2008 2009 2010 2011 2012 2013 2014 2015 2016 2017
Net sales history – 3-yr moving average (€m)
Domestic Cross-border
Broadridge. Data at 31 Dec 2017 with CAGR calculated from 2007. Data excludes ETFs, Money Market funds (incl Enhanced). Funds of Funds also excluded except in sector table. Cross-border data sourced from confidential data contributions from 67 groups to Broadridge SalesWatch service.

32 M A R K E T D A S H B O A R D
UKKey metrics – long-term funds (€bn) 2017
AUM CAGR (10 yr) Net sales
Domestic 1,182 7% 63
Cross-border 219 24% 10
TOTAL 1,401 8% 73
Foreign market share 16% 14%
Product focus (€bn) 2017
Domestic Net sales
1. Equity Global 27.4
2. FofF Balanced 5.6
3. Bond Target Maturity 4.7
4. Equity Europe ex UK 4.4
5. FofF Dynamic 3.6
Cross-border Net sales
1. Bond Global Currency --
2. Bond Global Corporates --
3. Bond Emerging Markets --
4. Equities Europe ex UK --
5. Bonds Emerging Markets --
* Net sales data unavailable for reasons of confidentiality.. % of passives in client portfolios: 24%
Bond52%
Equity37%
Mixed10%
Other1%
Cross-border AUM by investment typeThe UK market is Europe’s most open in
terms of distribution structures, but also
one of the least accessible. Headline data
suggests huge potential but most of the
cross-border groups that are winning
assets are groups with a strong domestic
presence. The Brexit factor is affecting
appetite, shifting investor focus from UK
equities to global stock funds.
(10,000)
0
10,000
20,000
30,000
40,000
2002 2003 2004 2005 2006 2007 2008 2009 2010 2011 2012 2013 2014 2015 2016 2017
Net sales history – 3-yr moving average (€m)
Domestic Cross-border
Broadridge. Data at 31 Dec 2017 with CAGR calculated from 2007. Data excludes ETFs, Money Market funds (incl Enhanced). Funds of Funds also excluded except in sector table. Cross-border data sourced from confidential data contributions from 67 groups to Broadridge SalesWatch service.

33M A R K E T D A S H B O A R D
SPAINKey metrics – long-term funds (€bn) 2017
AUM CAGR (10 yr) Net sales
Domestic 181 -2% 10
Cross-border 143 19% 27
TOTAL 324 3% 37
Foreign market share 44% 73%
Product focus (€bn) 2017
Domestic Net sales
1. FofF Bond Europe Currency 5.2
2. Asset Allocation 3.7
3. FofF Balanced 3.3
4. FofF Asset Allocation 3.2
5. Bond EUR Short Term 2.6
Cross-border Net sales
1. Bond EUR Short Term --
2. Bond Flexible --
3. Bond Global Currency --
4. Bank Loan/Floating Rate --
5. Mixed Asset Income --
* Net sales data unavailable for reasons of confidentiality.. % of passives in client portfolios: 16%
Bond46%
Equity38%
Mixed15%
Other1%
Cross-border AUM by investment typeThe recent success of cross-border groups
in Spain is linked to the Spanish banks’
strategy of using funds of funds for
their client investments. These are open
architecture products that feed heavily on
cross-border Ucits. The exclusion of funds
of funds from the headline data therefore
contributes to the stalled asset growth from
the local fund groups.
(30,000)
(20,000)
(10,000)
0
10,000
20,000
2002 2003 2004 2005 2006 2007 2008 2009 2010 2011 2012 2013 2014 2015 2016 2017
Net sales history – 3-yr moving average (€m)
Domestic Cross-border
Broadridge. Data at 31 Dec 2017 with CAGR calculated from 2007. Data excludes ETFs, Money Market funds (incl Enhanced). Funds of Funds also excluded except in sector table. Cross-border data sourced from confidential data contributions from 67 groups to Broadridge SalesWatch service.

34 B I G B A N G T O G A L A X Y O F S T A R S
“ The industry is proving more successful
than we originally thought at capturing the
assets of HNWIs – many of them in emerging
markets”— PWC Asset Management 2020: Taking Stock, June 2017

I N T O T H E W I D E R U N I V E R S E 35
3 Into the wider universe
Durability and brand recognition continue to underpin the sales success of Ucits outside Europe. However, alongside emergent sales opportunities headwinds are forming, raising questions about the long-term growth outlook for one of the region’s most successful exports. Whether developing a Ucits footprint in Asia, Latin America or the Middle East, competition is stiff and local regulations are complex so cross-border fund groups must adapt their business models and hone their product offering to compete with increasingly sophisticated domestic providers.
With 30 years under its belt the Ucits framework has withstood financial crises and adapted to new regulations and shifting investor demands. Its acceptance as a regulatory standard outside Europe was unexpected
in its early days, but subsequently extolled as an important European success story. Its path has not been smooth; the inclusion of derivatives under the Ucits 3 Directive caused consternation amongst non-European regulators who feared the entry of complex products that had the potential to undermine the Ucits brand, and investor confidence. It survived and non-European investors now account for 23% of assets invested in European Ucits. Nonetheless, while many markets continue to open their doors to Ucits, protectionist moves in some of the fastest growing wealth management centres have the potential to challenge the distribution muscle and resilience of all but the largest and most visible product providers.
Asia Pacific region
Growing wealth in the Asian Pacific region (Apac) is a huge draw card for international asset managers. According to the latest Cap Gemini Global Wealth Report1, Apac and North America powered the growth in numbers of the world’s
1 Published June 2018
35

36 B I G B A N G T O G A L A X Y O F S T A R S
wealthiest investors, accounting for 75% of the increase in the global high net worth population in 2017 and 69% of the rise in HNWI wealth2. The report also notes that Asia Pacific region maintained its growth momentum and expanded its lead over North America, reaching a record 6.2 million HNWIs with $21.6tn in financial wealth. As a relatively sophisticated client base this wealth community clearly represents a growing opportunity for international product providers as they look to diversify and gain access to niche asset classes.
The importance of the mass affluent and mass retail investors should also be considered since over 70% of total Apac wealth is held by these segments. While financial literacy remains low, opportunities are likely to increase as lower interest rates and the downward trend in investment returns means more initiatives will have to be introduced to promote pensions savings. While money market funds account
for the majority of new flows in Apac, the current impetus to mobilise savings and invest in riskier assets is only going to get more intense, even in ultra-conservative countries such as Japan.
Hong Kong, Singapore and Taiwan
Notwithstanding the significant opportunity that these developments represent, the constituent Apac markets are at varying stages of sophistication and addressability. Fig 3.3 shows the countries that are most open to third-party foreign asset managers and cross-border Ucits funds are Hong Kong, Singapore and Taiwan3 where cross-border market share represented 46%, 66% and 54% of their respective investment fund industries in June 2018. Offshore funds or sub-advised funds form a significant proportion of assets under management in these markets.
2 A total of 1.2 million new HNWIs accounting for $4.6trn in new wealth3 Broadridge SalesWatch data – see Appendix 1
0500
1,0001,500
2,000
2,5003,000
3,5004,000
2013 2018
Fig 3.1: Apac AUM by Domicile (€m)
Cross Border Domestic
Source: Broadridge3
(100,000)
0
100,000
200,000
300,000
400,000
500,000
600,000
2010 2011 2012 2013 2014 2015 2016 2017 H1 2018
Fig 3.2: Apac net sales by domicile (€m)
Domestic Cross-border
Source: Broadridge3

I N T O T H E W I D E R U N I V E R S E 37
Taiwan is something of an anomaly and merits a special mention. Curbs on offshore fund launches resulted in significant outflows from Ucits products in 2015 and 2016, but sales have dramatically recovered as more asset managers have taken advantage of an incentive scheme that rewards offshore providers for boosting their local presence. The Taiwanese authorities are clearly keen to expand the domestic market, but the carrot and stick approach adopted has, paradoxically, lifted offshore fund business in the country.
South Korea, Japan and Thailand
In other markets such as South Korea, Japan and Thailand, international managers must work with local partners to access the domestic wealth pools. In Korea, for example, it is currently more costly to invest directly in an offshore fund than it is to invest locally due to tax and regulatory issues. The same holds true for Australia. Unsurprisingly, observers says that regulators are more likely to look favourably on foreign managers who show a demonstrable commitment to establishing a sustained local presence. It is notable that in January 2017, the South Korean FSC announced that it will revise asset management regulations to further open the sector. Under the proposed new rules, foreign asset managers will be allowed to sell to a wider group of professionals. However, product partnerships and distribution tie-ups will be increasingly the norm as foreign managers look for a cost efficient means of expansion. It is worth pointing out that Japan’s offshore assets as a percentage of onshore assets can be deceptive as sub-advised assets are significant in this country and not always visible.
India
India is one of the most challenging markets to penetrate as is evidenced by the number of managers that have exited the country in recent years. Offshore funds have yet to gain traction in the country and the majority of onshore funds invest locally. However, India’s asset management space is growing as a result of government support and an increasingly professional wealth management industry. Broadridge forecasts double digit growth in mutual funds and ETFs from 2016-2021.
0
50
100
150
200
250
2013 2018 2013 2018 2013 2018
Hong Kong Singapore Taiwan
Fig 3.3: Apac AUM growth by market (€m)
Cross Border Domestic
Source: Broadridge3

38 B I G B A N G T O G A L A X Y O F S T A R S
China
China is seen by most foreign managers as the main prize and foreign funds can be distributed via a foreign bank or local wealth manager using their overseas investment quota (QDII). However, it is domestic focused strategies that are in demand and currently few international fund houses have made inroads here. That said, managers should keep an eye on developments in China, as plans to lift capital controls on outbound investments and grow the country’s third pillar pension segment will likely create opportunities to launch retail pension funds via fund of funds structures.
Apac investor appetite
The bulk of mutual fund assets sourced from Apac investors lie in fixed income and equities. Two notable exceptions are China and South Korea where money market funds dominate. Weaning investors off money market funds in these countries will be a challenge, though Chinese investors are starting to diversify and multi-asset funds along with fixed income funds will likely gain market share over the next three years.
Equities Apac, thematic equities and mixed asset funds have enjoyed the strongest sales flows across the region over the past three quarters, though every market has its own nuances. In Taiwan, for example, fixed income funds dominate but more money is starting to be diverted into mixed funds, which will benefit foreign asset management firms more than local players. The multi-asset segment has grown in popularity in several Apac countries as it provides a means to access diversified investment strategies and suits the more conservative mind-set of many Asian
investors. Those that come with income components remain popular across the region, particularly in South East Asia where demand has been relatively untapped. Managers need to keep mixed asset funds simple in order for investors to understand and feel comfortable with these products.
Social responsibility and ESG
There has been a lot of talk about the need for managers to adapt their product offerings to include an ESG component. While support for ethically invested
multi-asset along with
fixed income funds are
expected to grow
market share over the
next three years

I N T O T H E W I D E R U N I V E R S E 39
funds has gained significant traction in Europe and North America, they are only now making an impact in Apac. A number of global managers are registering and promoting their ESG strategies by leveraging on the success they have built in other regions. Whilst just four of the largest 20 international ESG funds are passively managed, seven passive funds made the top 20 list by net new flows at the end of 2017. Examples of global managers importing these strategies include HSBC, launching two funds with a lower carbon investment strategy targeted at Hong Kong retail investors in April 2018 and Natixis Asset Management rolling out a green bond fund and a sustainable equity fund through its boutique asset management unit (Mirova). Both funds are for sale in Hong Kong and Singapore.
Passives and ETFs
ETFs have been steadily making inroads in Apac and it is likely that ETF Connect – the planned trading link between Hong Kong and mainland China’s two stock exchanges – will give the sector a much needed boost. Currently, Apac institutions are increasing and broadening ETF usage, but the bulk of flows have been directed to US and European exchanges. Retail penetration, on the other hand, remains low and requires a more favourable regulatory framework to improve uptake. While Japan will remain the largest ETF market in Apac, we expect China (and Hong Kong due to ETF connect) to be the two fastest growing markets in the region. Nearly 70% of the projected growth is expected to come from new flows and ETF assets in the region are expected to reach $1.9trn by 20254.
Passport threat
Observers have suggested that the most significant threat to Ucits in Asia comes from recent passporting initiatives looking to emulate and, arguably, to replace Ucits. These include:
▪ The China mainland/Hong Kong Mutual Recognition of funds (MRF) scheme,
4 Broadridge forecasts
0
500
1,000
1,500
2,000
2,500
3,000
3,500
4,000
2013 2018
Fig 3.4: Growth of AUM in mutual fund vs ETF (€bn)
ETFs
Mutual Funds
Source: Broadridge3

40 B I G B A N G T O G A L A X Y O F S T A R S
▪ The Asean Collective Investment scheme (CIS) between Singapore, Malaysia, Thailand,
▪ The Asia Region Fund Passport (ARPF) between Australia, New Zealand, Singapore, Thailand, Korea and Japan.
Like Ucits these schemes allow approved funds that are domiciled in one country to be distributed in another participating country and vice versa. While Hong Kong investors have shown a moderate interest in buying China mutual funds and the CIS has attracted a modest number of participating funds, asset volumes remain low. Many observers believes ARPF could be equally disappointing. The main drawback is the problems posed by the different tax rules in each jurisdiction, which will be very difficult to align. Further measures will need to be taken in order to provide real impetus to these regional schemes.
Forward view on Asia
With so much wealth being generated throughout Apac, and as the needs of investors continue to evolve, Ucits will continue to play an important role because they facilitate economies of scale, allow the central management of product strategies and are firmly embedded in the investment culture of the region. International managers can succeed if they focus on a limited range of products and choose their markets wisely – a scatter gun approach can never work in Apac. Beyond the most addressable markets, a local presence is required and attention to detail is key. Managers have learnt to their cost that applying the same marketing and distribution strategies across disparate markets rarely works and parachuting sales staff in from Europe without the requisite language skills and cultural training can prove to be a costly and unproductive strategy.
Latin America
International managers have traditionally approached Latin America through the region’s pension schemes (AFPs and Afores) because of their size, transparency, growth outlook and addressability. According to Broadridge data5, total professionally managed pension scheme assets reached $850bn at the end of 2017, of which $309bn was managed by third party asset managers.
5 Broadridge Money in Motion

I N T O T H E W I D E R U N I V E R S E 41
Appetite for cross border Ucits products remained robust throughout 2017 as pension scheme administrators sought expertise in emerging market debt, European, Asian and North American equities. And while the global share of LatAm Ucits remains tiny at just 2%, regulatory changes to the region’s pensions systems and shifting dynamics in the region’s wealth management sector are enticing new entrants to its shores. However, this view needs to be treated with caution because the perceived opportunities presented by the pension systems can be deceptive.
As Fig 4 shows, addressable pension assets are fairly evenly split within the private (DB & DC) and the public Cap AFP Afores systems. Cap is the largest component with 44% or $150bn of the total addressable pool, followed by defined benefit with $100bn or 35% of the addressable assets.
Andean markets
With their similar regulations and ease of access, the Andean markets (Chile, Colombia and Peru) present the greatest opportunity for international managers. While Chile is the most established market for both local and international managers, other Cap systems modelled on Chile represent a growing opportunity due to their favourable demographics and appetite for mutual funds rather than mandates.
Fig 4: LatAm addressable institutional assets, €bn
Total
institutional AUM
Addressable
AUM
Addressable
%
DBPrivate 170 101 59%
Public 64 1 2%
DC Private 98 59 61%
CAP
Chile 208 82 39%
Mexico 161 22 14%
Columbia 86 20 23%
Peru 48 10 21%
Costa Rica 10 1 8%
846 296 35%
Source: Broadridge.
Brazil accounts for 90% of this segment, which, due to regulatory restrictions, can only be accessed by means of local players.
Mexico CAP system, Afores, is only accessible through ETFs listed on the local stockmarket or via pension mandates. From Jan investment in Ucits is possible
The Andean market (Chile, Colombia, & Peru) presents the greatest opportunity for foreign managers, thanks to similar regulations and single point of contact from abroad or through third-party representatives.
1
1
2
2
3
3

42 B I G B A N G T O G A L A X Y O F S T A R S
Total institutional asset management in Chile reached $208bn at the end of 2017 with the addressable component representing $82bn. This compares to $86bn of AUM in Colombia’s Cap public DC scheme of which $20bn is addressable, and $48bn in Peru’s public pension scheme of which $10bn is addressable. It is worth noting that some of Chile’s largest AFPs, such as Provida, typically have between 40%-45% of their assets in foreign vehicles.
Mexico
While Mexico is one of the largest pension markets in the region with assets of $161bn and an addressable asset pool of $22bn, until recently the Cap system was only accessible through ETFs listed on a local stock exchange or through mandates given by one of the pension managers. However, Consar, the local pension regulator, introduced new guidelines in January allowing pension funds to invest in mutual funds with 20% allocation to overseas Ucits. These guidelines require further clarification, but international managers are confident that they are well placed to win assets as pension scheme administrators are eager to access international securities via foreign mutual fund structures because they are less expensive and more accessible than mandates – this is especially true for smaller schemes.
Brazil
On the face of it Brazil appears a compelling opportunity, accounting for 90% of private and public DB and private DC assets6. However, until recently it was impractical to target the Brazilian pension schemes. While pension funds could, in
6 Broadridge, Money in Motion
0
200
400
600
800
1,000
2013 2018
Fig 3.5: LatAm AUM by Domicile (€bn)
Cross Border Domestic
Source: Broadridge
(10,000)
0
10,000
20,00030,000
40,000
50,000
60,00070,000
80,000
2010 2011 2012 2013 2014 2015 2016 2017 H1 2018
Fig 3.6: LatAm net sales by domicile (€m)
Domestic Cross-border
Source: Broadridge
0
20
40
60
80
100
2013 2018 2013 2018 2013 2018
Chile Colombia Peru
Fig 3.7: LatAm AUM growth by market (€m)
Cross Border Domestic
Source: Broadridge3

I N T O T H E W I D E R U N I V E R S E 43
theory, invest 10% of assets overseas, few rarely took advantage of this option. The process was cumbersome and domestic fixed income offered better risk-adjusted returns due to the relatively high interest rates in the country. With the recent fall in interest rates, however, pension administrators are looking overseas for yield. That said the home bias for local and high local rates still exists. Managers need to have a truly differentiated story or a huge brand to lean on as local fund pickers prefer to go with what they know.
LatAm investor appetite
Equities dominated Latin American pension fund flows in 2017 and as investors re-risked they pulled money out of passive and into active strategies. Around $6bn was redeemed from developed market equity index funds, with a significant portion ending up in emerging market equities and debt. Multi-sector funds also registered strong flows, particularly from Brazilian institutional investors. On the index side, emerging market equity was the only index bucket that gathered meaningful flows.
Tax amnesties shake-up retail distribution
While the AFPs and Afores will likely remain the main draw for international managers, a growing and now visible wealth management industry has also piqued interest. Large firms such as MFS have been active in this space for some time, but new entrants, such as Scandinavia’s Evli asset management and Edinburgh head-quartered Kames Capital, have recently entered the market, offering niche products – some with an alternatives focus – to both pension funds and HNWIs.
The introduction of tax amnesties, which allow citizens to report undeclared assets outside of the home country, has shaken up the wealth management industry in the region, unlocking an estimated $300bn of wealth. Traditionally, wealthy LatAm investors parked money in Switzerland or the US offshore hub of Miami. When the tax amnesties were introduced, it was thought that a significant proportion of this money would be repatriated. Spotting a lucrative asset gathering opportunity, many international managers turned their attention to the onshore market, hoping to win a share of the repatriated pie.

44 B I G B A N G T O G A L A X Y O F S T A R S
Strategies for accessing LatAm market share
Few have been successful because favourable tax treatments for onshore products has led to a rush of locally-based launches that have taken momentum away from Ucits. However, the money has been slow to come. Larger clients still prefer to keep their savings abroad as most remember decades of political unrest, currency devaluations and economic instability. Despite this local consultant, Frederick Bates7, believes local product is the future for an emerging segment of savers but warns, ‘If you do go local beware of competing against your potential asset management clients. A safer play is to join the locals and provide your Ucits to one of their funds of funds aimed at the mass affluent segment. The high net worth will buy a local product but they generally do so for more sophisticated strategies such as private equity and debt due to tax advantages’.
Recommended strategies according to Bates include:
1. Consider the retail segment
Although the pension segment is more transparent and easier to cover, the retail market is more profitable and the money much stickier. A focus on pension assets is often unrewarding; either the money is not forthcoming, fees are pushed too low or the scheme redeems 100% of the money invested after a short period of time. In the retail channel independent advisers typically go for the higher fee share classes and are therefore a more profitable option.
The tax amnesties arguably make the retail segment more attractive. Individual bonds – a traditionally preferred option for investors – are a case in point. They are now less tax-efficient because they pay dividends creating a potential tax liability on the income. Ucits bond funds, however, offer accumulation share classes with no dividend payments that therefore reduce the tax burden on income. That said the client could incur a future capital gain when they sell the fund, resulting in a tax consequence. Many advisers view this structure as more tax efficient because tax can often be deferred when the investor redeems the position. The situation is similar to the tax deferral available in the US IRA structure. Another advantage with a Ucits bond fund is the high price point for investors wishing to buy higher yielding individual bonds – $200,000 being a typical minimum. This has made diversification difficult for individual investors unless they have considerable assets. Ucits provides the ultimate diversification and active management tool helping to avoid costly mishaps such as unexpected defaults.
7 Managing Director of Becon Investment Management, an independent third-party distributor focused on the US offshore and Latin American markets

I N T O T H E W I D E R U N I V E R S E 45
2. Build the right connections
A meaningful network of connections is vital and time spent with the fund selection teams and heads of all the private banks is an important investment. Identifying the big hitters is tricky because people are constantly swapping life with the big institutions for taking independent status but establishing these contacts is the best way of gaining traction. Just getting on a recommended list is less than half the battle. Advisers hold the keys to the execution of the trades and many don’t even follow those recommended lists.
3. Go local
The cost of establishing a local presence can be off-putting, with one third-party marketer suggesting a ball park figure of $2bn. Flying in from Europe or Miami and flying out again after concluding business – is now frowned upon by wholesale intermediaries. Chile is often the first choice for putting boots on the ground, but the largest markets do not always present the best opportunities. The big numbers may highlight Chile but don’t ignore the interesting opportunities from countries like Uruguay, Argentina, Columbia and Panama.
4. Consider strategic partnerships
A strategic partnership can make all the difference to a manager’s chance of success. PGIM, for example, has set its sights on Chile, entering into a partnership with Chilean asset manager Banchile Administradora General de Fondas SA which will distribute PGIM’s Ucits funds to local investors. BlackRock, meanwhile, has doubled its business in Mexico to $62bn following the acquisition of the asset management arm of Citibanamex, a subsidiary of Citigroup.
5. Focus on one market
Better to go small and deep – high quality relationships are vital and will not survive the rooky errors of not speaking Spanish or Portuguese, or omitting to have fund documentation translated into either language. Given the tough competition it helps to have a niche offering that can open doors but they are generally not appealing to advisers because the tax amnesties mean that every time a portfolio is rebalanced, it potentially triggers capital gains tax consequences. Also, the typical range of share classes might not be enough to satisfy the needs of retail advisers. Whilst the trend in institutional is towards lower fees it is not necessarily the case elsewhere.

46 B I G B A N G T O G A L A X Y O F S T A R S
Middle East
The Middle East currently represents just 1% of global Ucits sales, yet cross-border managers view the region as an increasingly important part of their global distribution strategy as cross-border assets continue to expand. Local distributors
understand Ucits, a structure that has been used in many instances by the region’s regulators as a model for domestic fund structures. While sales have been impacted by the fall in oil prices in recent years, the overall growth outlook for Ucits is encouraging thanks in part to a vibrant and expanding wholesale channel.
The investment market in the Middle East is forecast to double between 2012 and 2020 with assets rising to $1.5 trillion by 20208, according to PwC. Sovereign Wealth Funds continue to be the primary driver along with a growing Ultra HNW population, though it is notable that the biggest SWF in the region (Adia) appears to have reduced its reliance on external managers in recent years, with externally managed assets dropping to 55% in 2016 from 65% at the end of 2014. While lower oil prices are primarily responsible for redemptions, fees are also under the spotlight. A sustained recovery in the oil price and more competitive fee structures could well reverse the flows.
The United Arab Emirates is the centre of the asset management industry in the Middle East and most managers access the region via one of three designated free zones. The DIFC is the most popular with around 210 wealth and asset management firms including Amundi, which opened up an office in May 2017 to better service its institutional clients. Other managers that are building a presence in the
8 Asset Management 2020: Taking Stock, June 2017
0
50
100
150
200
250
300
2013 2018
Fig 3.8: MEA AUM by Domicile (€bn)
Cross Border Domestic
Source: Broadridge
(10,000)
(5,000)
0
5,000
10,000
15,000
20,000
25,000
2010 2011 2012 2013 2014 2015 2016 2017 H1 2018
Fig 3.9: MEA net sales by domicile (€m)
Cross-border Domestic
Source: Broadridge
0
10
20
30
2013 2018 2013 2018 2013 2018
Bahrain Saudi Arabia UAE
Fig 3.10: MEA AUM growth by market (€m)
Cross Border Domestic
Source: Broadridge3

I N T O T H E W I D E R U N I V E R S E 47
DIFC include Italy’s Azimut, which last year acquired 80% of New Horizon Capital Management (a boutique asset manager based in the DIFC). Abu Dhabi Global Market (ADGM) has also attracted big names, most notably Standard Life Aberdeen, which set up an onshore sales office back in 2015.
As the chart opposite reveals, most of the funds registered for sale in the financial free zones are European Ucits for the onshore UAE market. The regulatory framework applicable to foreign funds is constantly evolving, but generally not to the detriment of Ucits. In the UAE, for example, it is relatively straightforward to market foreign funds provided they are registered with the Securities and Commodities Authority (SCA), though a ruling issued in 2016 meant that all foreign funds must be distributed through a local licensed agent. It is probably safe to assume that the financial centres will be keen to encourage managers to domicile funds in their respective jurisdictions, but given its first mover advantage and wide acceptance by asset owners and distributors Ucits is likely to remain the vehicle of choice.
Future
There is always a risk that domestic regulators develop stricter criteria for Ucits fund distribution as they seek to build-up their onshore fund industries. At the same time regional passporting schemes could well mature to become a viable alternative to Ucits vehicles in certain parts of the world. But it is questionable whether local fund firms can develop the necessary scale and investment skills to compete with established cross-border players and their decades of global investment expertise. It is also hard to imagine a scenario whereby Asian regulators put aside their national differences to develop an efficient and cost effective regional fund passport that bypasses currency, taxation and legislative barriers.
There remains many areas of untapped potential, from the groaning pension market of Australia to emerging wealth management opportunities in Uruguay, Argentina and the established free zones of the Middle East. For as long as clients require access to local and international investment exposure, there should be sufficient opportunities for those domestic and cross-border fund providers that are prepared to adapt their product offerings and business strategies as the global distribution landscape evolves. And, for now, Ucits remains the vehicle of choice for regulators and investors alike.
For now, Ucits remains
the vehicle of choice for
regulators and investors
alike

48 B I G B A N G T O G A L A X Y O F S T A R S
“ I think that Mifid 2 will be one of the most
important factors influencing change in the
fund industry over the next few years. In my
opinion, its impact will be generally positive,
because it will lead to greater transparency
and to the use of an open-architecture model
on the part of an increasing number of
distributors”— Advisory Portfolio Manager, Spain
D I S T R I B U T I O N P O W E R 49
4 Distribution power
The progress of Ucits is intricately tied to the distribution structures that exist in Europe and their evolution, which is now undergoing a seismic change in response to Europe’s latest directive, Mifid 2. This game-changing regulatory initiative was implemented on 1 January 2018 and its full impact has yet to be felt. However, many of the responses now evident from distributors in Europe were already underway, encouraged by some early-bird regulatory initiatives from the UK and the Netherlands, and general market forces. Whether the new directive will discourage or expand the Ucits franchise remains in question but its importance is undeniable.
The distribution landscape in Europe is, with the exception of the UK, commonly thought to be dominated by the indigenous banks. Their influence remains important and they retain ultimate control over the
direction of most retail investor savings. Distribution structures have evolved during the three decades of Ucits with the doors to third party products opening to varying degrees in each country.
Evolving distribution structures
First promise of open architecture emerged in the late 1990s and the launch of discount brokerages that then doubled up as fund supermarkets. Many of these platforms still remain and, in reality, these D2C options are Europe’s primary gesture to open architecture. They also remain small, accounting for little more than 1% of industry assets1. Other platforms evolved into B2B operations, acting as administrative hubs to facilitate order aggregation and efficiencies between underlying distributors and their fund providers. The primary distributors of funds to retail investors are either closed, distributing their own funds to captive
1 Broadridge, Fund Radar estimates
49

50 B I G B A N G T O G A L A X Y O F S T A R S
clients, or they sell a limited number of third party funds through preferred partner agreements. Guided architecture is the norm for third party funds, operating through the primary channels shown in Fig 4.1 above.
Enter Mifid 2
Mifid 2 is now changing the distribution world in ways that have yet to reveal themselves. The Directive delved deep into practices across the financial spectrum. For the asset management industry the relevant clauses were brief but profound. They related to product transparency and the correct identification of ‘target market’ for every fund sold in an effort to ensure best practice in the delivery of
suitable products to end-investors. Of greater significance, though, was the commission ban. It was far from all-embracing; it banned the taking of retrocessions by distributors claiming to be independent and, for those non-independents that continued to claim commissions, proof of service to justify the commissions was required. Moreover, distributors would, for the first time be required to notify their clients in their annual statements of the amounts they were taking from their clients’ investments for the service.
For the asset
management industry
the relevant clauses of
Mifid 2 were brief but
profound.
0%10%20%30%40%50%60%70%80%90%
100%
AUT B/LUX FRA DEU ITA NLD ESP SWE CHE GBR
Fig 4.1: Split of accessible AUM by channel
Bank IFA Discretionary Advisory Insurance Funds of funds
Source: Broadridge, Distribution 360 Data based on calculations of accessible third party assets derived from fund selector interviews. Discretionary and Advisory channels are both from private bank/wealth management segment. See Appendix 1 for further details of methodology.

D I S T R I B U T I O N P O W E R 51
The switch to an unbundled fee was first initiated in the UK under the Retail Distribution Review (RDR) rules that were implemented in 2013. In 2014 the Dutch authorities implemented similar provisions that were more widespread in effect because they covered all financial services and involved positive encouragement for distributors to ensure that their clients were given access to the lowest-cost product options. These earlier initiatives heralded a new public focus on fund charges and the launch of countless new share classes that were automatically visible to fund selectors, regardless of their domicile. As a result, demand for low-cost or ‘clean’ share classes developed considerable traction well before the full rigour of Mifid 2 provisions came into force.
Changing value chain
The value chain that had governed the industry since its inception was in jeopardy well before EU regulators stepped in, but it was truly broken by Mifid 2. Whereas previously fund providers had controlled the payment structure, the commission ban meant that distributors now decided how the fee cake was to be sliced. Assuming a desire to ensure that the client pays no more than would have previously been paid through the old management fee structure, distributors now had the power to contain the manager’s fee and/or bulk up the portfolio with low-cost passives in order to retain their own margins. Many in the wealth management segment already had client fee arrangements in place so, in theory, they were the least likely to suffer a detrimental impact. However, increased bureaucracy from
Manufacturer IntermediaryEnd
customer
Power shifting
Fig 4.2: Disruption to the value chain
Pricing pressure• Passives• Reduced buy-lists• Own-brand funds
Value for money• Alpha innovation• Brand & service• D2C response
Source: Broadridge

52 B I G B A N G T O G A L A X Y O F S T A R S
the requirement to deliver additional statement information, and report on client suitability and target market issues, is having an impact on cost across all distributor segments. European fund selectors now cite regulation as the biggest driver of industry change for them. And ranking beneath regulation are a variety of issues that reflect the responses to these industry-changing rules that distributors are either experiencing or anticipating.
Response #1 – Pricing pressure & focus on passives
The greater inclusion of ETFs and low-cost trackers in client portfolios is the obvious and most immediately felt impact of the retrocession ban. The trends favouring passives have been rising since the financial crisis, but Mifid 2 has undoubtedly added fuel to the fire. Nonetheless, at the headline level, exposure to passives in Europe remains very low at 15.8% of long-term assets2 – less than half the exposure of these products in the US, currently set at 38%. However, the headline figure masks a much higher weighting of passives amongst the third party distributors on whom cross-border Ucits rely. In this segment passively managed funds now account for 22% of assets in client portfolios and in countries where the commission ban has been most rigorously applied, like the Netherlands, the weighting is over 40%. Elsewhere the average is much lower but growing consistently across the board. Selectors in Italy, Spain and France continue to favour actively managed funds but their exposure to passives can be expected to increase steadily in the coming years.
The widespread acceptance of low-cost passive funds, coupled with the regulatory overview on charging structures has inevitably led to pricing pressures across the board. Fund selectors will now look at the value proposition on offer and argue for access to the lowest-cost available share class. In some countries, Spain for example, the regulators require distributors to put their clients into the lowest-priced share class and increasingly high prices are being cited by fund selectors as a reason for removing a fund from the buy list.
2 Broadridge
Fig 4.3: Top five drivers of industry change
1. Regulation
2. Pricing/cost
3. Architecture of fund industry
4. Active v passive investment
5. Distribution
Source: Broadridge Fund Buyer Focus Ranking based on 937 fund selector interviews conducted in 2017
0%
5%
10%
15%
20%
25%
30%
35%
40%
45%
Overall AUT B/LUX FRA DEU ITA NLD ESP SWE CHE GBR
Fig 4.4: Share of passives in third party distributor client portfolios 2017
Source: Broadridge Fund Buyer Focus Based on 937 fund selector interviews in 2017

D I S T R I B U T I O N P O W E R 53
The fear of ETFs and low-cost trackers becoming the default option for retail clients is real but still some way from realisation. Certainly, many fund selectors are reporting larger allocations to passive funds. Moreover, the launch of numerous robo-advice platform operating asset allocation models based entirely on passive funds has occupied financial press headlines in recent years. Equally, though, there is a robust constituency of distributors who wish to differentiate their services by using actively managed funds. Price is now a more important factor in the fund selection equation, but it is seldom judged in simple isolation.
Response # 2 – Contracting buy lists
The regulatory pressures, particularly those on the reporting side, are expected to force many selection units to reduce the number of groups they work with and focus on the bulge-bracket groups able to provide broad product menus and end-to-end service levels. There is some evidence that buy lists or, the number of supplier relationships that distributors have, are shrinking.
This is not a recent phenomenon. Across all markets the average number of supplier agreements per distributor has dropped from 42 in 2014 to 38 in 2017. Such averages mask clear differences in dynamics particularly at the channel level where marginal buy-list declines are evident amongst discretionary and advisory portfolio managers. On the other hand the 2017 interview data showed funds of funds, IFAs and insurance selectors to have increased the numbers of preferred partners they work with.
Most important in terms of placing power are the retail banks where buy lists are the shortest and
“ Active funds really must offer
returns that justify the product
price, otherwise we will seek to
replace them with lower-priced,
passive equivalents.”— IFA, Netherlands
“ In the coming months a lot of
our passives providers will
see a reduction in business
volumes with us, because of
general reorientation of our
portfolios towards more-active
investment solutions.”— Discretionary PM, Italy
-
20
40
60
80
100
Overal
l
Advisory
PM
Discretio
nary PM Fo
fF IFA
Insur
ance Bank
Superm
arket
Fig 4.5: Ave # of suppliers by channel 2017
Source: Broadridge Fund Buyer Focus Based on 937 fund selector interviews in 2017

54 B I G B A N G T O G A L A X Y O F S T A R S
most likely to experience the further contraction in the coming years. Asset management represents an important stream of profitability for the large indigenous banks that control the wealth of Continental European savers. The due diligence requirements of Mifid 2 involve considerable administrative resource and expense that can be eased by transferring more assets into their own captive funds (via sub-advisory arrangements or transfer to internal management). Equally, profitability can be enhanced or retained by negotiating access to lower-cost funds with a smaller number of elite manufacturers.
This channel, above all others, is arguably becoming less accessible and more likely to focus on relationships with the largest brand manufacturers. It is currently estimated to represent just 15% of assets invested in third party Ucits, but this market share is a simplification of the power of the banks, which usually embrace multiple underlying channels and selection units that may act independently, but are nonetheless under the influence of head offices that may see cost benefits in simplifying selection processes.
Response #3: New distribution models
As distributors become more proficient in managing fee-based business models, some will see an advantage in taking greater ownership of the chargeable elements they have previously outsourced. The coming years are likely to see a land grab from a variety of asset management stake holders looking to secure revenue streams for the future. Chief amongst these are:
▪ Distributors launching own-brand funds
The temptation for larger entities to enter the manufacturing space has already become evident in the UK with some IFA distributors launching their own low-cost actively managed funds in addition to selling third-party products3. This was big news in the UK where the line between distribution and manufacture
3 ‘Hargreaves Lansdown to launch equity fund’, The Financial Times, 16 November 2016
“we will see a reduction in
variety ... as distribution arms
will stop offering certain fund
ranges due to the directives on
target markets.”— Bank, Germany
Bank15%
Wealth -Discretionary
18%
Wealth - Advisory25%
Insurance24%
IFA7%
Funds of Funds11%
Fig 4.6: Market share of accessible assets by channel
Source: Broadridge, Distribution 360

D I S T R I B U T I O N P O W E R 55
has been quite hard. In Continental Europe many channels offer their own-brand funds and it remains a common structure for the banks. The fear is that there will be a reversion to the traditional vertically-integrated business model.
▪ Increased use of sub-advisory relationships
Anecdotal evidence points to significant expansion in the use of sub-advisers by Europe’s larger distributors. This activity is not easy to measure because an untold number of arrangements are in the form of advisory agreements, where money is not transferred to the sub-advisor via formal mandates. This type of informal arrangement is popular because it is more flexible and can more easily be unwound by the promoter of the fund. Broadridge data shows formal mandates to have been worth €434bn in 2017. More recent data from InstiHub Analytics4 values the market now at €550bn with new mandates worth more than €1bn recorded in the second quarter of 2018. The increased use of sub-advisers is unlikely to damage the brand and strength of Ucits funds, but it adjusts the nature of the distribution opportunities available.
▪ Robo-advice
Electronic trading platforms have existed since the dot.com bubble but they have now morphed from simple execution and administration offerings to providing engaging client profiling structures designed to match an individual’s appetite for risk to packaged risk-rated portfolios of funds. These robo services are now offered by banks to their captive clients, independents looking to disrupt the incumbents, and some asset managers who have also stepped into the arena. The most powerful recent asset management entrant is Vanguard with a UK proposition that could well be rolled out to other markets in time.
Robo advisers or electronic D2C services are viewed by many to be the fastest growing distribution channel, and by some to be disrupters, but will they upset the applecart for incumbent asset managers and distributors or provide new opportunities to access a segment of the market that is currently under-served or ignored by industry stakeholders?
According to the latest research from Techfluence, Europe is home to 98 robo-advisers, up from 73 in April 2017. Together they manage an estimated €2.5bn of client assets. Data calculated at the end of November 2017 show Nutmeg in the UK to be the largest with just over €1bn of assets, followed by Scalable
4 Firms scoop €1bn sub-advised mandates in record Q2, Ignites Europe, 23 August 2018
“We are going to use a lot more
tech-based advisers and robo-
advice for our solutions. There
will be increasing competition
for the human adviser from
technology-based advisers.”— Bank, Germany

56 B I G B A N G T O G A L A X Y O F S T A R S
Capital from Germany with €600m (though this is understood to have since surpassed €1bn), and Moneyfarm from Italy with €375m. On the basis of these data, the footprint of even the largest robo groups is tiny. However, they serve a community of savers that are either unwilling or unable to pay for full service advice and they also deliver useful educational tools into the market that will help to engage consumers that might otherwise avoid the complex world of long-term savings.
▪ Migration to discretionary services
The heavy weight of compliance on fund selectors is causing a steady drift towards use of discretionary services that allow the distributor to populate risk-rated client portfolios without having to run client suitability tests for each fund selected. This function could be outsourced, as has occurred in the UK where 37% of financial advisers were thought to be using the services of outsourced discretionary managers in 20165. In Europe, though, the service is likely to be run internally with advisory clients being migrated to new discretionary portfolios. For these selectors some outsourcing operates but in the allocation to flexible mixed asset funds run by external fund managers.
Response # 4: Consolidation
With pricing pressure building and fund costs under intense scrutiny many expect the fragmented European industry to consolidate. Consolidation has been the
mantra of consultants since the early days of Ucits, but the number of asset management groups in play has never shrunk. Instead the population has expanded in line with the changing opportunities that have fuelled industry growth. Fund selectors, in particular, view consolidation to be an inevitability for asset managers and generally see this as a positive response that will introduce the cost efficiencies that come with scale. They are looking for greater service commitment to support their evolving business models and this is more likely to be available from larger units.
At the same time, however, choice is important and distributors remain great advocates of an industry that fosters the creativity and the commitment that comes from smaller specialist players.
5 GlobalData Financial Services, 2016
“[Consolidation] will be positive
for the industry and the medium-
sized companies because they
will become larger and able to
resist the major players in the
sector.”— Fund of Funds, France

D I S T R I B U T I O N P O W E R 57
Whilst some mid-sized groups will undoubtedly aspire to become one of the giants of the industry, there is a sturdy stream of vibrant mid-tier managers that are forming a new wave of protagonists, preaching the benefits of active management. The lesson is probably one of adapting to the changing environment. This may take the form of mergers but other options are also available so the consolidation process is likely to be slow.
Response # 5: New products
Production innovation has been one of the most important responses from asset management groups to the pricing pressure that has come from regulation. The upside has been the secular and expanding demand for products offering solutions, most often, although not exclusively, delivered in the form of a variety of mixed asset options. The mixed asset sector has been one of the few sweet spots in the asset management armoury to be immune from passive pressure. Demand has been huge from all distribution channels and the number of new launches in this space has increased. In 2007 a third of active long-term fund launches were mixed asset funds and they accounted for €68bn of new money.
Market volatility has also led to increased demand for hedge funds and other alternative products in regulated form, either under AIFMD or Ucits. These funds are less easy to replicate with quant techniques and, like mixed asset funds, they have avoided downward pricing pressure.
Boom or bust for Ucits
There is no doubt that Mifid 2 has introduced some considerable challenges for fund manufacturers and distributors alike. Its full impact will take time to be felt and there are flaws that will require regulatory adjustment as they become evident. Mifid 2 is changing the shape of the fund industry, but there is nothing in the directive likely to undermine the brand and global presence of Ucits. Indeed, demand for increased transparency should ultimately strengthen the value of its brand.
“Within the huge available
range of alternative-investment
solutions are those with a Ucits-
compliant format... that are now
available to small investors”— IFA, Spain

58 B I G B A N G T O G A L A X Y O F S T A R S
“ We always overestimate the change that will
occur in the next two years and underestimate
the change that will occur in the next ten.
Don’t let yourself be lulled into inaction.”—Bill Gates, The Road Ahead

F U T U R E H O R I Z O N S 59
5 Future horizons
The first thirty years saw five Directives governing and enhancing Ucits, and the adoption of Ucits as a global regulatory standard. It has become the default option for the long-term savings of retail investors, and increasingly institutions, throughout Europe and a brand accepted by regulators in many non-European countries. This is the status of Ucits in 2018 but what will the industry look like in 2048? Technological innovation, disrupters, demographic pressures and market upheavals will all contribute in ways that are difficult to predict today. Added to this are factors that cannot be anticipated over such an extended time frame. Is the Ucits brand strong enough to meet the future challenges?
A thirty-year time horizon presents huge scope to discuss the many disrupters that are currently baying at the fringes of the asset management world – artificial intelligence and its impact on portfolio construction;
client segmentation and cost savings; product innovation moving towards solutions-based portfolios with ethical standards modelled for individual taste and risk levels; competition from new players looking to take advantage of the overly complex value chain; and a better-informed investor looking for direct involvement in developing his/her financial health.
Overriding all this noise is the building pressure on Europeans to fund their retirement needs. According to the European Commission the dependency ratio (the number of people aged 65 years and above relative to those aged from 15 to 64) in Europe is set to double over the next thirty years to reach 51%1. Whereas today four people work to support each retired person, by 2048 the ratio will be just 2:1.
1 European Commission, The Demographic Future of Europe – from Challenge to Opportunity, 2006

60 B I G B A N G T O G A L A X Y O F S T A R S
This is the background against which the future of Ucits must be judged, although any assessment of the detailed impact of these complex macro-economic issues goes beyond the scope of this report. To avoid a drift into these areas this assessment of Ucits in over the next three decades is restricted specifically to developments that might enhance or inhibit the power of the Ucits brand in Europe and wider global markets.
Asset growth
The trajectory of Ucits fund assets over the past three decades has been steep and remarkably healthy given the market cycles it has thus far endured. Indeed, each crisis, rather than damage Ucits, has in fact resulted in greater buy-in from communities that were previously peripheral. Despite periodic set-backs, assets have expanded at a compound growth rate of 12% over the past 30 years. Alternative funds under AIFMD have enjoyed a similar growth rate, albeit over a shorter time frame.
This history reflects the industry’s development from a nascent state to one that is now maturing, and therefore unlikely to maintain the same growth rate in the coming thirty years. Indeed, the thirty-year growth rate masks the slower pace of development in the most recent ten-year period, which dropped back to just 5%. The backdrop for Europe is of a slowing growth rate, but equally the demographic challenge of rising dependency ratio should encourage greater commitment of
2007 2017 2027 20472037
10
20
30
40
50
6.1 9.715.9
25.8
42.1
5.3
8.6
7.6
4.7
AUM Growth
2.9
3.22.0
1.6
AUM Net sales contributionto market growth
Market performance contributionto market growth
5% CAGR
Fig 5.1: Est growth of Ucits to 2047 (€trn)
Source: Broadridge estimates based on EFAMA data history

F U T U R E H O R I Z O N S 61
savings to Ucits in order to fund retirement needs. The estimates illustrated in Fig 5.1 assume a continuance of the 5% growth rate over the next thirty years. This may seem low and no doubt the market will periodically experience higher rates, but the calculation of the sales and market performance contribution to asset growth helps to validate this percentage as a viable level. The model takes the historical European norm of net sales, or new money, accounting for 53% of asset growth with market performance contributing the remaining 47%. This produces an annual average of €324bn of net inflows per year over the next ten years, rising to €860bn per year in the third decade. By way of comparison, the most recent ten-year period has produced average net sales of €183bn, a figure that includes the steep redemptions of 2008 and also the record highs of 2017 (€682bn)2. As assets accumulate so does the potential for accelerating contributions from both market performance and net inflows.
If Luxembourg retains its current share of Ucits assets (36%), the model suggests that the Grand Duchy could host some €15trn of Ucits assets by 2048.
This growth assessment also takes account of the following assumptions:
▪ The injection of an additional €1trn during the period in the form of new money from deposit accounts in response to the EU’s Capital Markets Union initiative and the launch of a pan-European pension plan that incorporates Ucits into its scope. The timing of this new money is unpredictable but the inflow also has to be weighed against the decumulation phase of the baby-boomer generation, which could offset the injection of new money from pensions and the CMU initiative.
▪ Continuing organic growth at the same rate from investors in non-European markets. Our expectation is that these investors will contribute an increasing share of new business that will offset slower growth from the leading European market contributors. There is also the potential that the Eastern European markets that have been slow to develop will also become more important, but no additional account is taken of this factor.
▪ The passive/active tension is unlikely to go away but whatever the proportions of each, they will be predominately in a Ucits format and so will have no impact on overall asset totals.
This is a benign market scenario that assumes no dramatic disruption that would destroy the Ucits brand nor the introduction of an alternative competing option that
2 Data is based Efama historical data set for long-term funds only and include money market funds. Sales and market performance percentage calculation based on Broadridge data.

62 B I G B A N G T O G A L A X Y O F S T A R S
is as yet beyond imagination. Market cycles will inevitably turn from bull to bear and back again, but their effect is accommodated in the averaging of growth rates over time. Even with this benign scenario, the Ucits universe quadruples in size over the next three decades.
Challenges to the benign scenario
Without looking up to the stars to find challenges that are improbable or beyond the limits of our imagination, there are a number of threats that should concern the community of Ucits supporters:
▪ A financial crisis linked directly to the activities of Ucits managers.
The 2007 Global Financial Crisis and the subsequent credit crunch temporarily affected the fund industry but ultimately it was rooted in the banking sector. A crisis of equivalent magnitude arising from funds would seriously dent or possibly destroy the Ucits brand. The type of incidence that could be contemplated is a flash crash in some relatively illiquid sectors, particularly those that have attracted a lot of ETF attention. The imposition of temporary gates to limit redemptions would severely damage Ucits if done on a wide scale. The response from regulators could draconian and potentially restrict retail investors to plain vanilla products. Ucits would probably survive but in a considerably curtailed form.
▪ Distribution contraction
Some contraction in the distribution of funds arising from regulations like Mifid 2 and the ban on commissions, which could effectively disenfranchise smaller investors by making advisory services unaffordable. This challenge potentially comes in two forms: First the migration of many bank clients into standardised discretionary portfolios, possibly heavily invested in ETFs or low-cost trackers, or the increasing use of sub-advised multi-asset portfolios rather than direct investment in underlying funds. The progress of Ucits is unlikely to be dramatically affected by these responses unless distributors, at some point, decide to build their portfolios on direct investments rather than funds. This seems unlikely and although distribution deals with third party players may see some temporary contraction, the ultimate products will still be Ucits.

F U T U R E H O R I Z O N S 63
The second challenge will come from investors seeing the true cost of their investments in a year of underperformance. This could well occur in 2019 when investors will see such statements for the first time. Their reaction might well be to retreat back to deposit accounts where interest rates are beginning to creep up, or invest in alternatives like property.
▪ Brexit
The outcome of the Brexit negotiations is unknown but there is a strong likelihood that UK groups, without a fund footprint in either Luxembourg or Dublin, will lose their passport rights. Most have taken action to migrate relevant activities to Europe and to boost the presence of staff in their chosen domiciles. Indeed the Luxembourg regulator, the CSSF, has recently reported3 that 15 new fund managers had received fund authorisations and that some 3,000 jobs might migrate to the centre to support post-Brexit activity over time. Brexit certainly represents disruption for the industry but it is unlikely to have any negative impact on the Ucits structure. Indeed, it could be argued that the huge efforts that most UK groups have taken to establish and/or bolster their presence in Luxembourg and Dublin is testament to the importance of the Ucits franchise.
▪ Return to high interest rates
One of the most important drivers of recent asset growth has been the all-pervasive and prolonged interest rate drought, driving retail investors out of their beloved deposit accounts. Rising interest rates will act as an equally strong pull back to deposits. The rate of change may be slow but any period of market volatility will deflect attention from funds unless providers are able to deliver smart money market fund accounts for retail savers, that have monthly savings attributes and simple switching mechanisms to allow investors to adjust their risk positions.
▪ Consolidation
Consolidation in this seemingly heavily fragmented market has been the cry of consultants and commentators for most of the history of Ucits. The cry continues but has become louder in the wake of Mifid 2 and the downward pressure on fees. Whether the number of suppliers will reduce from the current level of around 1,700 is a moot point. Much will depend on the extent of pricing pressure and whether new opportunities arise. However, a contraction of the number of products available is on the cards. It is no longer viable for managers to support sub-optimal funds and the rationalisation of product ranges is already
3 The Financial Times, Luxembourg lures asset managers ahead of Brexit, 2 September 2018

64 B I G B A N G T O G A L A X Y O F S T A R S
underway, albeit at a rather slow pace. Over the past five years 2% of funds have been culled and, assuming continuance of this trend at the same pace, the number of funds available in 2048 will whittle down to around 17,500 from the current level of 32,000. This will have the effect of increasing the average fund size from its current level of €304m to €2.4bn. The number of Ucits will be reduced but the value of each will be considerably enhanced.
▪ Export limitations
The Ucits standard has been adopted in multiple non-European countries, many of which are currently designated emerging markets with higher growth rates than expected of Europe. Access to these markets has been an important bi-product of Ucits but asset managers cannot assume that they will open up further. As fund investment increases in importance, so governments and regulators will seek to encourage their local industries by either forcing cross-border providers to launch domestic funds, or imposing rules that limit the attractions of imported Ucits. The various Asian passporting regimes, whilst now in their infancy, have the potential to push European Ucits back to their home turf. If these regimes develop traction, the European regulators may be faced with having to discuss reciprocity enabling Asian-based funds access to Europe in order to retain access for Ucits. There are lessons to be learned from the early days of Ucits and similar discussions with the US. The reluctance by the US authorities to accept regulatory equivalence and reciprocal access effectively reduced the US to a purely domestic market, whilst Europe became the centre of international traffic. European regulators should be wary of adopting a protectionist approach.
Improved opportunities
Set against these potential challenges to Ucits are a number of areas of future expansion:
▪ Regulation and tax incentives
The CMU initiative, designed to encourage retail investment and bring down market barriers to cross-border Ucits, is an important step towards creating a framework for encouraging greater participation by savers. How this will be engineered is difficult to know but, meanwhile, action at an individual market level could be additionally successful. The UK pioneered this approach with

F U T U R E H O R I Z O N S 65
tax incentives via the ISA wrapper. Similar tax-incentivised products are now available in France and the recent launch in Italy of the PIR is currently attracting attention there. As the pension time bomb gets ever closer to exploding, local initiatives of this nature will direct new money into Ucits.
▪ Private pension provision
The European Commission has now launched proposals for a Pan-European Pension Plan designed to offer nationals access to a single pension that can be moved to different EU countries with their working contributors. Meanwhile, the next thirty years will see governments forced to adopt new measures to encourage reduced reliance on the state for retirement income. Ucits and Ucits’ managers will be beneficiaries of such developments. The Swedish PPM system is one that has been critical for local Ucits. Elsewhere, insurance-based products may become the norm but the underlying investments could well include Ucits.
▪ New distribution structures
Robo-advice has been the buzz phrase of recent years and this remains an area of interest to distributors and fund managers alike. The first phase of their development was the launch of independent platforms offering consumers direct access to pre-packaged risk-rated portfolios. The simplicity of these structures has made them very attractive to savers that are unwilling to seek advice. However, they have struggled to build significant assets. In the coming years banks are likely to monopolise this form of distribution because of its convenience in managing captive client money. The involvement of banks will considerably expand the role of robo-advice and potentially help to educate savers into becoming investors through engaging online tools. To the extent that they are able to introduce funds to a new generation of savers, the role of Ucits will be enhanced.
Final words
No assessment of the future can cover all eventualities. The challenges and opportunities set out above are merely suggestions that have emerged from the thought processes involved in preparing this report. The success of the Ucits brand is remarkable but the industry cannot afford to be complacent. Like any brand it needs to be guarded by all those who benefit from its recognition because any lapse will be destructive not only to the pool of assets invested in Ucits, but also to the investors worldwide that have been persuaded to believe in the brand.

66 A P P E N D I C E S

A P P E N D I C E S 67
Appendix 1Contributors and acknowledgments
Authors
Diana Mackay Diana is Managing Director of Broadridge Analytics Solutions and a recognised expert on market dynamics and trends in the investment fund arena having initiated the first authoritative research on Ucits and the European markets for investment funds in 1990. This research has included numerous pioneering data gathering projects designed to aid fund management groups develop their strategies for gathering assets not just in Europe’s diverse markets but on a global basis. Diana has been called as an expert witness to the European Parliament, was a member of the working group charged with defining the scope of Ucits IV, and has participated in numerous industry Think Tanks. She sits on the Strategic Board of Alfi.
Barbara WallBarbara is Director of EMEA Insights at Broadridge Financial Solutions, a global fintech leader and provider of communications, technology, data and analytics. Prior to entering the financial services profession (2010), Barbara worked for 17 years as a journalist and columnist with the International Herald Tribune and New York Times.
Frederick BatesFrederick is a senior executive of BECON, a 3rd party distributor of Ucits across retail channels in both Latin America and US Offshore. He has 20 years of industry experience focused on positioning investment capabilities to both institutional and retail intermediary clients around the world including the Americas, EMEA, and Apac. Prior to joining BECON he held the title Managing Director and headed MFS Investment Management’s Global Relationship Management team for non-US Retail channels.
Special thanks and acknowledgements
Special thanks are also due to all those unnamed individuals who have worked tirelessly over the decades to develop meaningful data to inform and guide policy-makers, commentators and industry stakeholders. Chief amongst these

68 A P P E N D I C E S
organisations are the European Fund and Asset Management Association (Efama) and, of course, the Association of the Luxembourg Fund Industry (Alfi), which have collected the most authoritative data set for the 30-year history of Ucits.
Historical data is largely sourced to Efama and Alfi, with some additional input from early Lipper sources, specifically the annual European Fund Industry Directory that was published from 1991 to 1998. More recent data, has also been sourced to Broadridge Analytics Solutions, which is now the guardian of a unique data set that identifies the geographical source of assets, as well as the most granular data set of European fund asset and net sales activity, dating back to 2002.
Appendix 2Notes to sources
Historical asset history The history as represented in Figs 1.1, 1.3 and 1.4 is based on data from ICI, for the period 1987 to 1991, and Efama for the period 1992 to latest data. This data include all Ucits for the period measured by Efama although definitional changes have affected the counts, specifically:
▪ Ucits data for the Netherlands are included from 2015;
▪ Data for Switzerland and Turkey that are regulated as Ucits are included;
▪ Data was reclassified in 2014 to include only those funds with investments that strictly adhered to the Ucits Directive.
Luxembourg data quoted throughout and in these historical graphs are from Alfi/CSSF and follow the Efama definitions both pre and post the 2014 definitional change.
Estimated net sales flows Reference to estimated net sales data is from the Broadridge FundFile database with data calculated from 2002. This data is based on a calculation that removes performance from asset growth to produce a monthly net sales figure for all funds domiciled in Europe. These funds are categorised as cross-border if less than 80% of their assets are sourced from just one country.

A P P E N D I C E S 69
Cross-border net sales by source of business Data from Broadridge SalesWatch, based on the geographical source of assets and sales (gross and net) as disclosed by 67 of Europe’s largest cross-border groups representing €2.6trn of assets at the end of 2017. This data is contributed under confidentiality agreements that prohibit disclosure of sales volumes at the sector level. Sector tables in the Market Dashboards in Chapter 2 show the true ranking of sectors by net sales, but not the volume of net sales because of confidentiality restrictions.
Distribution data Measurement of accessible assets by distribution channel, as in Fig 4.1, is from Broadridge’s annual Distribution 360 Report. This is based on estimates derived from disclosed data from Fund Buyer Focus interviews (see below).
Distributor quotes and data sourced to Broadridge Fund Buyer Focus is based on around 1,000 interviews with European fund selectors conducted annually. These selectors are based in ten European countries and their opinions and perceptions represent third party assets valued at €3.2trn.
General trends References to Broadridge Fund Radar relate to a monthly publication tracking European industry developments and trends with archive dating back to 2010.


Important notice
This document was produced by, and the opinions expressed are those of, Broadridge Analytics Solutions Ltd (BASL), as of the date of writing. It has been prepared solely for information purposes and for the use of BASL’s client. The information and analysis contained in this publication have been compiled or arrived at from sources believed to be reliable but BASL cannot guarantee their accuracy or interpretation. This document does not constitute any kind of advice including investment advice and should not be acted on as such. BASL does not accept liability for any loss arising from any use of such publication. This publication is not intended to be a substitute for detailed research or the exercise of professional judgement.
Copyright © 2018 Broadridge Analytics Solutions Ltd
Published by Broadridge Analytics Solutions Ltd
Suite 501 Salisbury House
London Wall
London EC2M 5QQ
All rights reserved. No part of this publication may be reproduced, stored in any
retrieval system, or transmitted in any form or by any means, electronic, mechani-
cal, photocopying, recording or otherwise, without the prior permission of the
publishers.