From analysis to design and back - European Commission · Visualisation of large data sets From...
21
Visualisation of large data sets From design to analysis and back C. Versino European Commission Joint Research Centre [email protected] 2016 Visualisation Workshop Valencia, 17-18 May 2016
Transcript of From analysis to design and back - European Commission · Visualisation of large data sets From...

Visualisation of large data sets
From design to analysis and back
C. Versino
European Commission
Joint Research Centre
2016 Visualisation Workshop
Valencia, 17-18 May 2016

Outline
• Issues in data retrieval & analysis over large data sets
• The data visualisation process & the possible interventions
• Example visualisations
• Conclusive remarks
2 2016 Visualisation Workshop

Invisible ‘Big Data’
3
Issue #1
2016 Visualisation Workshop

Data access – (Traditional)
4
Issue #2
question answer
data
2016 Visualisation Workshop

Precision vs. Accuracy of information
5
“Even if the amount of knowledge in the world is increasing, the
gap between what we know and what we think we know
may be widening. This syndrome is often associated with very
precise-seeming predictions that are not at all accurate. (…)
not accurate not precise
accurate not precise
not accurate precise
accurate precise
Issue #3
Reference Nate Silver
2016 Visualisation Workshop

Data access – (By visualisation)
6
question answer
data
2016 Visualisation Workshop

What is data visualisation?
Data visualisation is the process of
transforming, composing and
encoding data by graphical attributes,
for analysis and communication,
with the goal of producing insight and evidence.
7
References • Alberto Cairo • Stephen Few • Edward Tufte
(fast) Visual perception
Reasoning (slow)
Analyst + IT tools = Intelligence Augmentation (<> Artificial Intelligence)
2016 Visualisation Workshop

The visualisation process (4 levels of interventions)
8
Data composition & visual encoding
Data gathering
Explore Question Understand
Make a point Findings Report ...
Analytical interactions: adding / removing dimensions, sorting, filtering, highlighting, aggregating / disaggregating, drilling, grouping, zooming/panning, re-visualising, re-expressing, re-scaling ...
Data preparation (raw data + meta-data)
Reference Stephen Few 2016 Visualisation Workshop
1
2
4
3

Raw data – Data integrity – Data sushi
Why raw data?
• Overview of the data (data integrity, accuracy) and
detailed views as required.
• Result data views generated on demand
on dimensions of interest to the analyst.
• ‘Validate the author’ of data views.
• Facilitate blending with other data sources.
9
Data sushi:
“A visualisation which is beautiful on the outside
and has raw data on the inside” Reference Jock Mackinlay

10
Example #1 Export control policy
Data visualisation – For communication
1 2 4 3

11
S. Blunsden, C. Versino VideoZoom storyboard
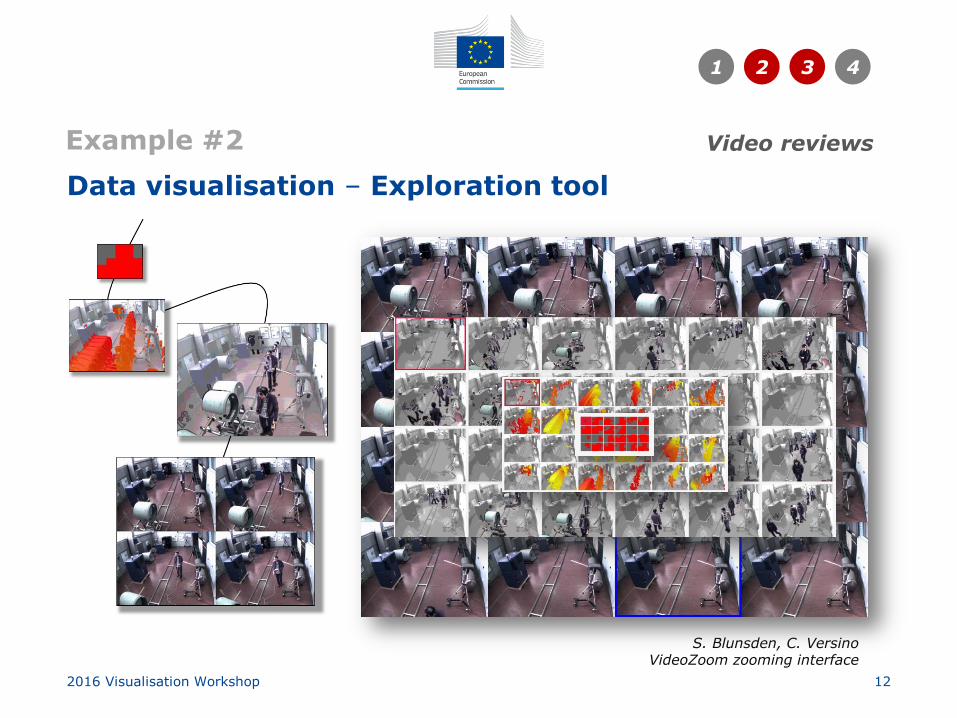
Example #2
Data visualisation – Exploration tool
2016 Visualisation Workshop
1 2 4 3
Video reviews
12
S. Blunsden, C. Versino VideoZoom zooming interface
Example #2 Video reviews
Data visualisation – Exploration tool
2016 Visualisation Workshop
1 2 4 3

Data visualisation – Promote awareness of existence of data sources
Example #3 Strategic Trade Atlas for World Customs Organisation
1 2 4 3
2016 Visualisation Workshop C. Versino, P. Heine
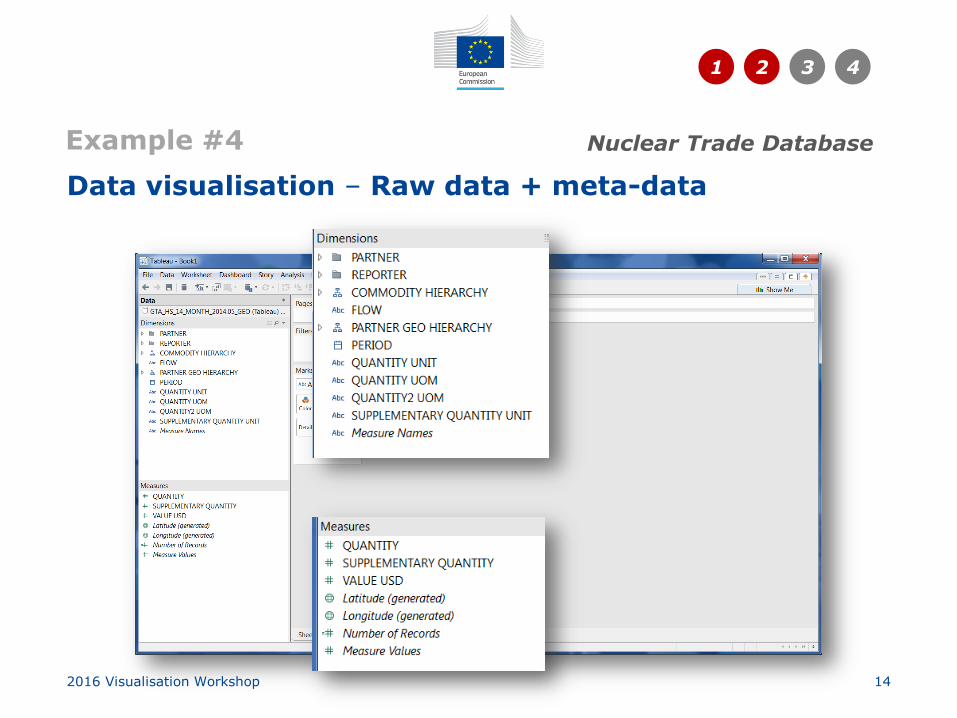
Data visualisation – Raw data + meta-data
14
Example #4
1 2 4 3
Nuclear Trade Database
2016 Visualisation Workshop

Data visualisation – Data composition by drag & drop
15
1 2 4 3
Example #4 Nuclear Trade Database
2016 Visualisation Workshop
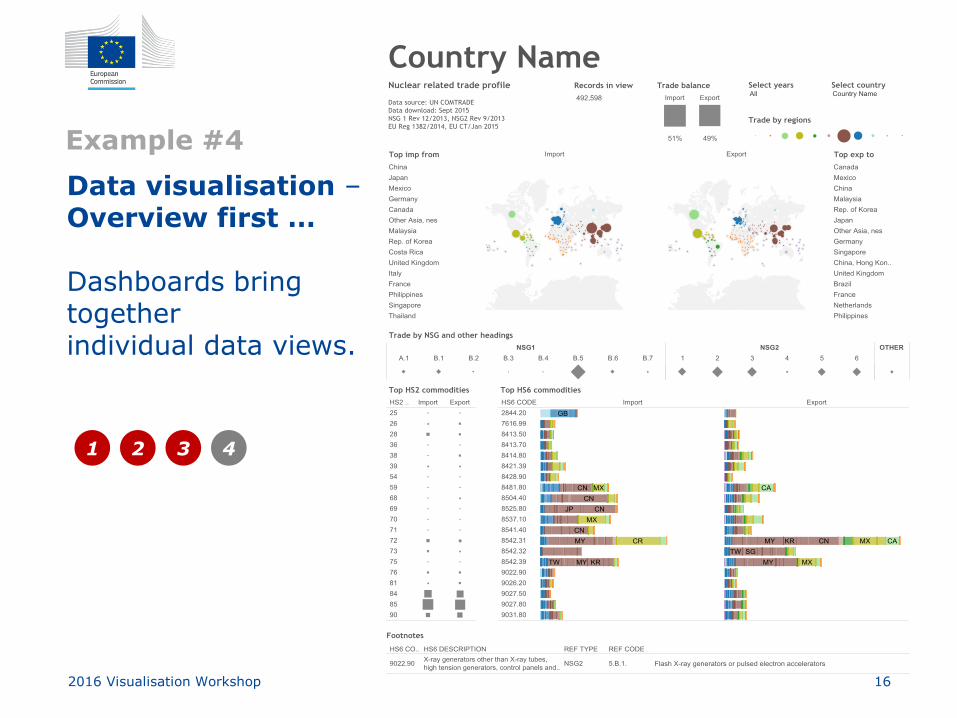
Data visualisation – Overview first … Dashboards bring together individual data views.
16
Example #4
2016 Visualisation Workshop
1 2 4 3

Data visualisation – … details on demand Interactivity: exploration based on data distribution (avoid empty results).
17
Example #4
1 2 4 3
2016 Visualisation Workshop

Outlook: Faceted browsing of visualisation recommendations
18
1 2 4 3
K. Wongsuphasawat, D. Moritz, A. Anand, J. Mackinlay, Bi. Howe, J. Heer. Voyager: Exploratory Analysis via Faceted Browsing of Visualization Recommendations
IEEE Trans. Visualization & Comp. Graphics (Proc. InfoVis), 2016

Conclusive remarks (1)
• Issues in data retrieval and analysis arise when:
• The data are ‘invisible’
• Data access starts by questions and not by data presentation
• Retrieval and analysis systems strive more for results’ precision
than accuracy.
• Data visualisation approaches can mitigate these issues in that
priority is given to data presentation.
• This encourages data exploration by the analyst,
enabling more accurate results and higher data integrity.
19 2016 Visualisation Workshop

Conclusive remarks (2)
• “Overview first, details on demand”.
• Visual data summarisation is useful in the analysis process.
• Interactive: use the data distribution to avoid zero-result queries
(faceted search approach).
• Added valued in data preparation:
relate generic data to the analyst’s specific domain of interest.
• Analyst & tool designer: can be the same person…
20 2016 Visualisation Workshop

Acknowledgements
The work presented is funded by the European Commission, Joint Research Centre, in projects:
Strategic Trade Analysis for Non Proliferation and VideoZoom.
[1] CAIRO A. The Functional Art: An Introduction to Information Graphics and Visualization. Peachpit Press, ISBN-10: 0-
321-83473-9, 2012.
[2] FEW S. Now You See it. Analytics Press, ISBN 0970601980, 2009.
[3] TUFTE E. The Visual Display of Quantitative Information. Graphics Press, ISBN 0961392142, 2001.
[4] SILVER N. The Signal and the Noise: Why Most Predictions Fail but Some Don’t. ISBN 978-1-101 59595-4, 2012.
[5] MACKINLAY J. Jock’s Dream of Data Sushi. Presentation at Tapestry, 2014.
https://www.youtube.com/watch?v=EsyMkuMM8HU
[6] VERSINO C. Pattern Recognition by Humans and Machines. Symposium on International Safeguards: Linking Strategy,
Implementation and People. IAEA, Vienna, 20-24 October 2014.
[7] VERSINO C, HEINE P. Strategic Trade Atlas. Country-Based Views. EUR 27739 EN. Print: ISBN 978-92-79-55003-4
ISSN 1018-5593 doi:10.2789/104834. Online: ISBN 978-92-79-55002-7 ISSN 1831-9424 doi: 10.2789/98360.
References