Frictions in Saving and Claiming: An Analysis of Unclaimed ...
38
Corina Mommaerts University of Wisconsin-Madison Anita Mukherjee University of Wisconsin-Madison The research reported herein was performed pursuant to a grant from the U.S. Social Security Administration (SSA) funded as part of the Retirement and Disability Consortium. The opinions and conclusions expressed are solely those of the author(s) and do not represent the opinions or policy of SSA or any agency of the Federal Government. Neither the United States Government nor any agency thereof, nor any of their employees, makes any warranty, express or implied, or assumes any legal liability or responsibility for the accuracy, completeness, or usefulness of the contents of this report. Reference herein to any specific commercial product, process or service by trade name, trademark, manufacturer, or otherwise does not necessarily constitute or imply endorsement, recommendation or favoring by the United States Government or any agency thereof. Frictions in Saving and Claiming: An Analysis of Unclaimed Retirement Accounts
Transcript of Frictions in Saving and Claiming: An Analysis of Unclaimed ...

Corina Mommaerts University of Wisconsin-Madison
Anita Mukherjee University of Wisconsin-Madison
The research reported herein was performed pursuant to a grant from the U.S. Social Security Administration (SSA) funded as part of the Retirement and Disability Consortium. The opinions and conclusions expressed are solely those of the author(s) and do not represent the opinions or policy of SSA or any agency of the Federal Government. Neither the United States Government nor any agency thereof, nor any of their employees, makes any warranty, express or implied, or assumes any legal liability or responsibility for the accuracy, completeness, or usefulness of the contents of this report. Reference herein to any specific commercial product, process or service by trade name, trademark, manufacturer, or otherwise does not necessarily constitute or imply endorsement, recommendation or favoring by the United States Government or any agency thereof.
Frictions in Saving and Claiming: An Analysis of Unclaimed
Retirement Accounts

Frictions in Saving and Claiming: An Analysis of Unclaimed Retirement Accounts Page 2
Abstract
Personal retirement savings form a critical source of late-life income among Americans. These savings accounts, which are typically linked to an employer, are increasingly spread across multiple accounts as individuals experience greater job mobility. Such dispersion makes it more difficult to both remember and manage these accounts, thereby putting them at risk of going “unclaimed.” This paper uses newly collected data from state unclaimed property databases to provide a first estimate of the extent of unclaimed retirement savings. These data allow us to explore both account value distributions and demographic correlates of unclaimed account holders. We estimate that three percent of retirees have an unclaimed retirement account with an average value of $550, and discuss why these statistics are likely to represent lower bounds based on federal escheatment rules. The estimates suggest that nationally in 2016, there were 70,000 unclaimed retirement accounts totaling $38 million. To explore the value of policies that might reduce the incidence of unclaimed accounts such as automatic roll-overs and account reminders, we build and numerically analyze a model of dealing with such accounts that incorporates account management costs and forgetting.
JEL codes: D14, D15, D18, D31, J14, J26
Keywords: retirement savings, unclaimed property, defined contribution, memory, hassle costs
Authors: Mommaerts: Department of Economics, University of Wisconsin-Madison, [email protected]; Mukherjee: Department of Risk and Insurance, Wisconsin School of Busi-ness, University of Wisconsin-Madison, [email protected]. Acknowledgement: We thank J. Michael Collins, our conference discussant Maria Fitzpatrick, Casey Rothschild, Justin Sydnor, and seminar participants at the Social Security Administration and the Uni-versity of Wisconsin-Madison for helpful comments. We thank Lois Miller, Arpita Patnaik, and Alan Yang for excellent research assistance and Erin Egan for useful conversations about state unclaimed property databases. We are also grateful to the Wisconsin Alumni Research Fund’s Fall Competition Research Grant for providing funds for research assistance. See following link for most updated version of this manuscript: https://bit.ly/2mNFMiF. Manuscript Date: September 30, 2019.

Frictions in Saving and Claiming: An Analysis of Unclaimed Retirement Accounts Page 3
1 Introduction
Many retirees in the United States receive retirement benefits from previous employers
in the form of pensions or contributions to individual retirement accounts. In contrast to
Social Security benefits, which are relatively automated, employer-based retirement accounts
must be tracked and managed by individuals over time. Across cohorts of retirees, the
management of these accounts is rapidly changing as current workers experience increased
mobility (Farber, 2010) and face a shift from defined benefit pensions to defined contribution
plans (Friedberg and Webb, 2005).
One concern about the changing retirement landscape is the increased burden that this
places on individuals: a greater number of jobs over one’s life translates to a greater number
of retirement accounts, creating scope for mismanagement or neglect of saved retirement
funds. Failing to manage retirement funds by not taking the required minimum distributions
is costly; if the account owner has not done so by age 70.5, the account is subject to heavy
penalties (50 percent of the required distribution) and the account value could quickly
dissipate. The neglect of retirement funds is the subject of current policy attention, and
many initiatives have been proposed to counter such welfare losses including default rollover
of retirement funds over one’s working career or a national database of retirement fund
information (Register, 2017; Warren, 2018). While the issue appears to be widespread, there
is no consensus about the number of people or the amount of funds that are impacted.
The aim of this study is to fill a gap in the retirement literature by providing a
first empirical estimate of the distribution of unclaimed retirement assets. To the best
of our knowledge, no empirical work has examined this question. The paper has two main
objectives. The first is to collect and analyze previously untapped data to study the size,
distribution, and predictors of unclaimed retirement assets. The second is to use these
findings to motivate a conceptual framework of retirement savings and claiming frictions
which we use to illustrate the value of policies that reduce the incidence of unclaimed
retirement assets.
We obtain novel account-level data from state unclaimed property divisions. All 50
states and Washington, D.C. collect various types of unclaimed property totaling billions of
dollars each year. While the data quality varies across states, most states provide property
level information on the size of the account, property type, year it was reported, and names
and addresses of the owner and holder of the property, typically going back to the 1980s.
We have usable data from 13 states, including large states like California, Texas, Ohio, and

Frictions in Saving and Claiming: An Analysis of Unclaimed Retirement Accounts Page 4
Florida. We supplement these data with geographic and population-level data from the
American Community Survey and decennial Census to further characterize the populations
at risk for unclaimed retirement assets.
As these state unclaimed property data have not been tapped for research analysis, we
first provide background on the rules and regulations dictating escheatment of unclaimed
assets to the state. We show that these databases contain a substantial amount of funds:
among our sample of 13 states (which accounts for around 40 percent of the country’s
population), nine million accounts totaling nearly $2 billion were reported unclaimed in 2016,
and the total amount of funds still unclaimed from all years is $22 billion from 100 million
accounts. These accounts predominantly consist of insurance property, security-related cash,
account balances, and uncashed checks.
We then isolate retirement-related property, including Individual Retirement Accounts
(IRAs), uncashed pension checks, and other pension and profit-sharing plans. We find that
most of these accounts are related to defined contribution retirement plans. Retirement
assets are typically deemed “unclaimed” when their owners do not take required minimum
distributions (RMDs) by age 70.5 plus a dormancy period of three to five years. In our
sample of 13 states, more than 36,500 retirement-related accounts were reported to unclaimed
property databases in 2016, totaling more than $18 million. Under the assumption that the
population at risk for unclaimed accounts consists of people at least 74 years old, that is
roughly 4 percent of the at-risk population. We then extrapolate these numbers to the entire
United States and find that almost 70,000 retirement accounts were categorized as unclaimed
in 2016, totaling more than $38 million, suggesting that 3.3 percent of 74 year olds in 2016
had an unclaimed retirement account, with an average value of $547.
To better characterize the population of individuals with unclaimed retirement assets
and shed light on vulnerable populations, we supplement our data with county-level demographic
characteristics from the American Community Survey and first- and last-name prevalence
data to predict gender and race. We find that individuals with unclaimed retirement assets
are 10 percentage points less likely to be female, 12 percentage points more likely to be
of Hispanic origin, and more likely to have a last known address in larger, more urban
counties. Other county-level characteristics, such as the age makeup, educational attainment,
migration, and median household income are similar between individuals with an unclaimed
retirement asset and the population-weighted average county characteristics, and we suspect
that county-level aggregates are too broad to detect meaningful differences.
Having established the descriptive statistics, the second contribution of this paper is

Frictions in Saving and Claiming: An Analysis of Unclaimed Retirement Accounts Page 5
to build and numerically analyze a savings and consumption model of retirement account
management. The goal of the model is to (1) illustrate trade-offs inherent in managing
retirement accounts over the life cycle and (2) quantify the welfare impact of different policies
aimed to change these trade-offs. The model features two periods and captures “at-risk”
retirement accounts as those that are left with a prior employer.
Two frictions in the model generate unclaimed accounts at retirement: first, there is
a one-time cost to managing the retirement account after job separation, which is meant
to capture the time, hassle, and other psychic utility costs of rolling over and generally
managing the retirement account (e.g., putting the funds into an IRA that the individual
can easily track over time). The shape of this cost with respect to time since job separation
is unclear; it may be smaller at job separation and increase over time if adjustment costs
related to job transitions are correlated, or if it is harder to find information about the
account over time (if, for example, the retirement plan was sold to another plan manager).
Alternatively, the costs may be highest at job separation if the cost of time is high due to
related adjustment costs that must be paid at the same time (e.g., moving locations).
The second friction in the model is related to memory: because one can delay managing
retirement accounts for decades, it is plausible that one may not remember that a previously
unmanaged account exists. We characterize this friction as a probability of remembering the
account, conditional on it not yet being managed. The combination of (possibly decreasing or
U-shaped) management costs and decreasing probability of remembering accounts generates
a trade-off between managing an account at job separation at a relatively high cost versus
waiting to manage it during a time of lower costs but with the risk of not remembering it in
the first place.
We then provide a numerical illustration of the model and show that individuals would
be willing to exchange a fraction of their income for (a) automatic roll-overs, which would
lower the cost of managing the account at job separation (possibly to zero); (b) reminders
about the account, which would increase the probability of remembering it at a later date;
and (c) access to a database of retirement accounts, which would allow them to more easily
find the account at a later date (though they still risk not remembering the existence of the
account).
This study relates to three main bodies of literature in economics. The first is the large
literature on retirement savings adequacy (Poterba, 2014). Several studies have examined
whether households are saving enough for retirement (Scholz et al., 2006; Skinner, 2007),
while others have studied the role of specific factors such as financial literacy (Lusardi and

Frictions in Saving and Claiming: An Analysis of Unclaimed Retirement Accounts Page 6
Mitchell, 2014), information (Mastrobuoni, 2011), and “leakages” (i.e., cash-outs) at job
separation (Armour et al., 2016; Clark et al., 2014; Munnell and Webb, 2015). To the best
of our knowledge, the present paper fills a gap in this large literature by being the first to
focus on unclaimed retirement accounts.
The second stream of related literature studies consumer choice and policy design to
shift behavior towards what is deemed more optimal. One strand in this literature finds that
defaults, frequently in the form of auto-enrollment policies, can increase retirement savings
rates (Madrian and Shea, 2001; Benartzi and Thaler, 2007). The benefits of auto-enrollment
are complemented by research demonstrating inertia in retirement plan choices (Kim et al.,
2016). A previously unrecognized drawback of default policies such as auto-enrollment is
that these accounts are less salient (as shown in Ekerdt and Hackney (2002)) and thus more
vulnerable to remaining unclaimed.
Our study is also related to the literature within economics on forgetting, hassle costs,
and generally “leaving money on the table”. Models of forgetting have been examined in
disparate economic settings such as payments for a lab experiment (Ericson, 2011) and lapse-
based insurance (Gottlieb and Smetters, 2014), with the main takeaway being that people
exhibit overconfidence in their prospective memory. Such models have not yet been extended
to the retirement setting. Hassle costs are another phenomenon that could explain unclaimed
accounts. These costs have been found to be important in the context of tax filings (Benzarti,
2015), health insurance (Baicker et al., 2012), and unemployment insurance (Ebenstein and
Stange, 2010). In the latter two settings, the idea is that difficulties in the paperwork or
processes may prevent people from accessing benefits. We interpret our descriptive results
within a framework of forgetting and hassle costs, and show that alternative policies that
aid memory or reduce hassle costs produce welfare gains for individuals.
The rest of the paper is organized as follows. In the next section, we provide background
on the channels through which retirement assets become unclaimed and where they are
held. Section 3 describes our main source of data for unclaimed retirement assets—account-
level data from state unclaimed property databases—and Section 4 presents a descriptive
analysis of these data. In this section, we also provide a national estimate of the extent
of unclaimed retirement assets and compare the individuals who own these accounts to the
general population. Section 5 develops and analyzes a model of costly retirement savings
management and memory to illustrate the trade-off between managing accounts early versus
waiting and potentially forgetting about the account at retirement. We also estimate the
model parameters and use it to quantify the relative welfare gains of various current policies
designed to improve retirement account management. Finally, Section 6 concludes.

Frictions in Saving and Claiming: An Analysis of Unclaimed Retirement Accounts Page 7
2 Background: retirement assets and unclaimed accounts
This section describes in brief the retirement savings landscape in the United States,
with a focus on how and when retirement savings flow between accounts. We also detail the
processes by which an account is considered unclaimed and the rules by which such accounts
are escheated to state unclaimed property databases.
2.1 Retirement asset flows
Retirement savings in the United States typically consist of Social Security or other
public pensions, plus private retirement savings. Private retirement savings can be accrued
individually (such as in Individual Retirement Accounts (IRAs)), but are frequently tied to
employment, whereby employers either offer a defined benefit (DB) or defined contribution
(DC) plan (such as 401(k)s). Retirement benefits through employers have changed dramatically
over the past 30 years, shifting from predominantly DB to DC plans ever since the beginning
of DC plans in 1978. These plans carry significant tax advantages: in traditional DC
plans, contributions and earnings are tax-free until distributions are taken in retirement.
An exception is Roth DC plans, which began in 1998; in these plans, taxes are paid on
contributions but not earnings.
The purpose of these tax advantages is to encourage retirement savings, and thus there
are many regulations on when and where retirement assets can be withdrawn or moved, and
by whom. Retirement assets can flow in and out of plans for a variety of reasons, including (1)
individual decisions such as “leakages” or roll-overs prior to retirement, (2) plan decisions
at job separation or plan termination, and (3) flows upon retirement. It is important to
understand these flows for understanding how retirement assets end up “unclaimed” and
where they end up.
First, retirement assets flow between accounts due to plan participant actions whereby
individuals withdraw funds either for consumption or to roll over to another account. Retirement
savings “leakage” is a term used to describe withdrawals of retirement savings prior to
retirement for consumption (Armour et al., 2016; Munnell and Webb, 2015). These cash-outs
carry a 10 percent early withdrawal tax penalty, though there are exceptions for cash-outs
taken for first time home purchases, higher education expenses, and certain medical expenses.
Plan participants may also choose to move assets between accounts (without penalty), either

Frictions in Saving and Claiming: An Analysis of Unclaimed Retirement Accounts Page 8
at job separation (e.g., moving funds from an employer-sponsored account to an individual
retirement account (IRA)) or to consolidate various accounts.
Second, retirement assets may change hands at other times prior to retirement that
individuals do not initiate. A primary example of this is when employees leave retirement
accounts with their employers at job separation. This presents a potential challenge to
former employers regarding what to do with these accounts. Figure 1 shows the default
path of retirement funds at job separation and what plan managers can do. For DB plans,
the “funds” remain with the plan. For DC plans, if the funds in the account amount to
more than $5,000, the funds remain with the plan unless they are actively rolled over by the
participant. Amounts between $1,000 and $5,000 must be transferred to a “forced-transfer
IRA account,” which often contain higher fees and are more conservatively invested in order
to satisfy legal requirements of balance preservation (GAO, 2014). Finally, for amounts less
than $1,000 the plan has the option of a forced-transfer IRA or a forced cash-out (which is
subject to early withdrawal fees if not rolled over in time).
Figure 1: Default Path of Retirement Funds at Job Separation
Notes: Figure shows the path of retirement funds at job separation for non-terminating plans. DC indicates defined contribution; DB indicates defined benefit.
The other main example of a “default” flowpath of funds is when a plan terminates,
which can occur when a firm folds or simply stops offering a plan to new employees. When
this occurs for DB plans, all terminating DB plans are required to be put in the care of
the Pension Benefit Guaranty Corporation (PBGC). For DC plans, there is more flexibility.
As of 2018, these too can be put in care of the PBGC, but they may also create forced-
transfers IRA accounts, purchase annuities, or transfer the saved funds to bank balances on

Frictions in Saving and Claiming: An Analysis of Unclaimed Retirement Accounts Page 9
behalf of the plan participants. In some states, terminating DC plans may also escheat the
participant’s funds to the state (see Section 2.3 for more details on state escheatment).
Third, individuals withdraw from their retirement savings accounts at retirement.
There are rules about the earliest age at which one can take a distribution without penalty
(such as 59.5 for IRAs), but there are also regulations surrounding the latest age at which
someone must begin taking a distribution and the minimum amount of that distribution:
a “Required Minimum Distribution” (RMD) is the minimum amount an individual must
withdraw from an account each year. Generally, RMD rules start at age 70.5 or (if later)
the year the individual retires for traditional accounts, or death for Roth accounts.
This section mapped out the flow of retirement assets between accounts and into
centralized systems such as the PBGC or state accounts. We next discuss the rules by
which retirement funds go “unclaimed” and how the flows and rules described in this section
can lead to unclaimed retirement assets.
2.2 Unclaimed retirement assets
Unclaimed retirement savings are “savings that individuals are entitled to receive, but
have not claimed because employers or other entities that maintain their retirement accounts
cannot locate the individuals or because the individuals have forgotten about the savings”
(GAO, 2019).1 Whether or not an individual “claims” a retirement account is not a well-
defined concept on its own, as by definition retirement accounts are long-term savings vehicles
that could be untouched for decades without being “forgotten” or otherwise unclaimed. We
thus clarify the definition of “unclaimed” as an account whose owner does not receive their
RMD by age 70.5 plus a state-defined dormancy period of two to five years (examples of these
state-level dormancy periods are provided in Greenblatt and Rosenman (1996)). Dormancy
generally means that the account owner has no account activity and fails to respond to
notices about distributions.
This RMD-based definition of unclaimed retirement assets is used by various agencies
to regulate the issue of unclaimed, or “abandoned,” or “lost” retirement accounts. States
require that account holders escheat unclaimed funds to the state beyond the RMD and
a pre-specified dormancy (no activity) period, with penalties for not doing so in time.
Complications arise in this process for two reasons. First, and perhaps foremost, federal
law via the Employee Retirement Income Security Act of 1974 (ERISA) “preempts” state
1We add to this definition the case when individuals may not have forgotten the savings but cannot locate it or otherwise face high barriers to claiming it.
Frictions in Saving and Claiming: An Analysis of Unclaimed Retirement Accounts Page 10
laws and carries fewer escheatment obligations. In particular, ERISA may exempt the
escheatment of large-value unclaimed retirement accounts as defined by those above $1,000;
since these funds may stay with the plan, the state unclaimed property data will contain
only a subset of unclaimed retirement accounts (and will likely over-represent the financially
vulnerable, who experience greater job mobility and may accrue various smaller-value retirement
accounts). These small balance accounts are also more likely to be neglected or forgotten,
making them of greater interest for this research study. Second, because states wish to
encourage the reporting of unclaimed assets, penalties for failing to do so are not consistently
levied. Again, this will lead to an underestimate of unclaimed retirement accounts in the
state unclaimed property databases.
2.3 Escheatment to states
Every state hosts an unclaimed property database aimed to link individuals with
their assets. States require agencies to “escheat” the funds once the property has become
abandoned or unclaimed after a pre-specified dormany period, typically about three to five
years for retirement accounts. The escheatment process transfers ownership of the account to
the state. States typically incorporate these funds to their state budgets and allow account
owners a long time period to find and claim their money.
A key motivation for escheatment is that states can make coordinated efforts to reach
the unclaimed account owners, thereby increasing the probability that the funds will be
reunited with their owners.2 Information on the unclaimed accounts is typically readily
available via a name search on an online website specific to the state, and states undertake
a variety of efforts (e.g., newspaper postings; third-party help in collecting updated contact
information) to locate account owners. If an owner contacts the state, he or she must furnish
the required documents to verify their ownership. Once approved, the state ensures that the
owner receives his or her funds, possibly after subtracting certain obligations such as owed
taxes or other outstanding fees (e.g., parking tickets).
The state unclaimed property databases generate meaningful activity, with owners
having claimed $25 million in retirement savings in 2016 according to data from 15 states
as studied in a GAO report (2019). (Note that this report was limited to a description
of aggregated state-level data, not account-level data as we study in this paper.) These
2At one extreme, the state of Wisconsin uses state tax records to locate unclaimed account owners and simply mails checks for the unclaimed amounts without any form requirements. This practice is somewhat unique to Wisconsin because in that state, the unclaimed property division is housed within the Department of Revenue.

Frictions in Saving and Claiming: An Analysis of Unclaimed Retirement Accounts Page 11
unclaimed accounts had an average value of $601 from 401(k) plan checks and $5,817
from traditional lRAs. The prevalence of unclaimed accounts in state unclaimed property
databases has sparked an industry of “finders,” which are third party firms that help individuals
search for and claim such property for a fee. The fee is frequently charged on a percentage
basis, highlighting the high dollar value in many such accounts.
In Section 3, we provide a more detailed overview of these state unclaimed property
data and discuss their limitations. We also discuss their relative advantage to other sources
of data on unclaimed retirement accounts.
2.4 Current policies and practices to prevent unclaimed accounts
Reducing the number of unclaimed retirement accounts is a key policy concern in the
United States. Congress is currently debating The Retirement Savings Lost and Found Act
of 2018, which is focused entirely on this issue. This Act would increase an online database
of pension and 401(k) plan account owners to facilitate finding information about their plans
and current contact information. (Note: this goes far beyond the current PBGC registry,
which contains pension plan information for only terminating plans and just recently started
collecting information on defined contribution accounts.) It would also clarify the rules for
categorizing account owners as “missing” and place a greater burden on employers and plan
managers to find these individuals.3
The reason for current political action regarding unclaimed retirement accounts is that
the existing guidelines appear to be inconsistent and insufficient. The core law defining
action is ERISA, which stipulates a broad set of guidelines for employers and plan managers
including the communication with account owners and fiduciary responsibilities for account
management. The main focus of ERISA is to protect retirement savings for individuals; its
core goal is not about unclaimed property. For example, ERISA dictates that all plans4 must
provide account owners with information about plan features and funding. Yet, because
ERISA does not specify certain details—for example, what constitutes dormancy or the
duration of the dormancy period—there is room for account owners to be subject to varying
rules by state. ERISA also mandates that plan administrators perform due diligence in
locating unclaimed account owners, and there has been a grey area in how to comply with this
effort since the IRS discontinued a letter-forwarding service that helped plans reach account
3The full text of this Act is available here: https://www.govtrack.us/congress/bills/115/s2474. 4Certain retirement plans are not subject to ERISA, namely those maintained by government agencies,
religious institutions, or nonprofits.

Frictions in Saving and Claiming: An Analysis of Unclaimed Retirement Accounts Page 12
owners using contact information from tax filings.5 Relatedly, because ERISA preempts
state law, firms face inconsistent penalties from state agencies when failing to meet ERISA
requirements.
We note that while there is policy impetus to reduce the number of unclaimed accounts,
other policies such as default auto-enrollment into retirement savings may unknowingly harm
individuals along this particular dimension. In particular, if auto-enrolled savings are less
salient to the employee, they will be less likely to know to manage these accounts upon job
separation or at retirement. Other policies also generate potential problems; for example,
account holders cannot mix savings from ERISA and non-ERISA plans in the same account
(while keeping the ERISA qualified status), generating friction to consolidating savings.
International comparison: Unclaimed retirement account can only be an issue in
economies with significant levels of formal labor, personal retirement savings, and job mobility.
The set of countries that can provide an example for the United States is thus limited. A
GAO report (2014) conducted an international comparison of efforts to minimize unclaimed
retirement accounts, and found that the key intervention was the creation and management
of a pension registry so that account owners can locate up-to-date plan information about
their accounts. Denmark provides a gold standard in this effort, but other countries such as
The Netherlands, Belgium, and Australia, have also put in place registries that offer wider
coverage than the United States does. The stated goals of these registries include helping
individuals to keep track of their retirement accounts, encourage consolidation, and providing
the government with information on this issue for tax and policy purposes.
3 State Unclaimed Property (SUP) Data
Our main data source for unclaimed retirement accounts comes from state unclaimed
property (SUP) databases. These data contain account-level information on each unclaimed
property, and include details such as the type of account, amount in the account, and names
and addresses of the account owner (e.g., an individual) and account holder (e.g., a firm or
plan manager). The name and geographic information of the account owner enable inference
5The Department of Labor issued clarification on the due diligence in 2014, stating that plan fiduciaries complete certain processes in their attempt to locate account owners. Specifically, plans must use certified mail; check related plan records (such as group health insurance plans) for contact information; use the addresses of plan beneficiaries for updated contact information; and use electronic search tools such as “Google searches, social media research and public data sources to locate participants and/or beneficiaries.” The details are available here: https://www.dol.gov/agencies/ebsa/ employers-and-advisers/guidance/field-assistance-bulletins/2014-01.

Frictions in Saving and Claiming: An Analysis of Unclaimed Retirement Accounts Page 13
of related account characteristics such as the owner’s gender and neighborhood covariates.
A key advantage of the SUP data is that it is available in a generally standard format from
each state due to consolidated reporting codes set by the National Association of Unclaimed
Property Administrators (NAUPA).
A drawback of the SUP data is that states vary in the amount of detail provided
to researchers based on state-level Freedom of Information Act obligations; in addition to
needing to contact each state individually, this constraint makes it difficult to assemble
a complete national dataset. Another drawback of the SUP data (as mentioned) is that
federal regulation created by ERISA—which limits the types of unclaimed retirement funds
that firms must escheat to the state—supercedes state guidance on this topic, meaning that
the SUP data capture only a subset of unclaimed retirement accounts.
Despite these drawbacks, the SUP data appear to be the most reliable source of
information on unclaimed retirement accounts. Two alternate sources for these data are
the Pension Benefit Guaranty Corporation (PBGC) and data from IRS Form 5500, which
we also explored.6 Both data sources impose serious limitations, however; the PBGC until
recently only collected data on defined benefit accounts from terminated plans, and the IRS
Form 5500 contains unclear reporting instructions that generate inaccuracies in the data.
Other candidate sources of information include private firm data or information from the
SSA Form 8955 (“Annual Registration Statement Identifying Separated Participants With
Deferred Vested Benefits”), but these are not readily available to researchers.
Data collection process and status: As mentioned, the SUP data were collected
by contacting the relevant department in each state. Each state maintains a database of
unclaimed property, typically housed in the state’s Department of Commerce, Department of
Treasury, or Department of Revenue. We corresponded with each state’s unclaimed property
division by e-mail and/or telephone in late 2018. As of this report, we heard back from 37
states and obtained data from 17 of them. The amount of detail in the SUP data that is
available to the public and/or academic researchers varies by state, so for some states we
have more detailed records than others. For example, North Dakota only releases the counts
of unclaimed properties by type, but does not release the dollar amount. For Texas, we
obtained more detailed information including the dollar amount of each property, property
owner most recent address, property holder name and address, and detailed property type
for both currently unclaimed properties and previously claimed properties.7
6Appendix A provides details on these efforts. 7Most states charge a nominal fee to obtain the data due to programming costs required in preparing
and sending the necessary files. Some states such as Texas waived this fee due to the academic nature of the
Frictions in Saving and Claiming: An Analysis of Unclaimed Retirement Accounts Page 14
We have thus far obtained data from: Alaska, California, Connecticut, Florida, Hawaii,
Louisiana, Massachusetts, Minnesota, Missouri, North Carolina, North Dakota, Nevada, New
York, Ohio, Pennsylvania, Texas, and Wisconsin. We exclude data from Missouri, North
Carolina, New York, and Pennsylvania in our main analysis because they contain incomplete
information on key variables. As a result, our core sample consists of information from 13
states.
3.1 Identifying retirement accounts
The SUP data contain numerous property types—NAUPA lists 123 categories—including
uncashed checks, securities, insurance property, mineral proceeds, and trusts (Section 4
provides details on this breakdown). We isolate retirement accounts according to the codes
listed in Table 1, which include pension checks, Individual Retirement Accounts (IRAs),
pension and profit-sharing plans, and annuities.8 The number of retirement account codes
has expanded over time (for example, the “IR” codes were introduced in 2010 and gradually
adopted by states since that year). Two categories in Table 1 merit further description
based on our understanding: the first is “pension checks”, which represents uncashed checks
sent by plans to encourage required minimum distributions. The second is “pension and
profit-sharing plans”, which despite the name, consists of defined contribution plans (GAO,
2019).
4 Descriptive analysis
In this section, we provide descriptive statistics on the extent of unclaimed retirement
accounts in the SUP data. We supplement these data with information from the American
Community Survey, the Census, and names databases to further ascertain the characteristics
of these unclaimed account owners.
research, whereas other states such as Wyoming quoted a fee ($1,000) that exceeded our immediate research budget.
8We corroborated this classification, which we created based on the NAUPA codes, with Erin Egan, Vice President of NAUPA’s midwestern region and Director of Wisconsin’s Bureau of Tax Operations.

Frictions in Saving and Claiming: An Analysis of Unclaimed Retirement Accounts Page 15
Table 1: NAUPA codes categorized as retirement accounts
Code Description
CK11 PENSION CHECKS IR01 TRADITIONAL IRA - CASH IR02 TRAD IRA - MUTUAL FUNDS IR03 TRAD IRA - SECURITIES IR04 RESERVED FOR TRADITIONAL IRA IR05 ROTH IRA - CASH IR06 ROTH IRA - MUTUAL FUNDS IR07 ROTH IRA - SECURITIES IR08 RESERVED FOR ROTH IRA IR09 IRA OTHER - RESERVED 1 IR10 IRA OTHER - RESERVED 2 MS14 PENSION & PROFIT SHARING PLANS 05 IRA’s-Securities 55 Annuities 71 IRAs 78 Pensions, retirement funds
Notes: NAUPA (National Association of Unclaimed Property Administrators) Codes used to categorize unclaimed property. Codes starting with “IR” were introduced in 2010 and gradually adopted by states. Codes without any alphabetic characters are exclusive to California.
4.1 Summarizing the raw SUP data
We begin by summarizing the raw data from the SUP data. Before constricting our
discussion to retirement accounts, Figure 2 shows the total amount of unclaimed property
funds (solid line, left y-axis) and total number of accounts (dashed line, right y-axis) as
of 2018 by year in which the account was reported to be unclaimed for the 13 states in
our sample (which comprise about 40 percent of the national population). There are a
few features that stand out. First, these databases contain a substantial amount of funds.
Among the accounts that went unclaimed in 2016 (that are still unclaimed), the states in
our sample collected close to $2 billion from roughly nine million accounts. Second, the
significant increase in accounts and funds over time demonstrates the “stock” nature of this
data: since our data is a snapshot of the currently unclaimed accounts, the amounts from
previous years decreases as account owners discover and claim their lost accounts.9 The total
stock of currently unclaimed property in our sample is $22 billion from 100 million accounts.
Since the data conform to property type codes set forth by the National Association
9In future work, we plan to couple this unclaimed property data with claimed property data to understand the characteristics and hazard rates of claiming property.

Frictions in Saving and Claiming: An Analysis of Unclaimed Retirement Accounts Page 16
Figure 2: Unclaimed property by year (sample)
02
46
810
Tota
l num
ber o
f acc
ount
s (m
illio
ns)
050
010
0015
0020
00To
tal a
mou
nt h
eld
($ m
illio
ns)
1980 1990 2000 2010 2020Year reported
Total amount ($ mil) Total number of accounts (mil)
Notes: Figure shows the stock of unclaimed property funds in 2018 by year the account was reported to the state unclaimed property division for our sample of 13 states. Solid red line is total amount in millions of dollars (left y-axis) and dashed red line is total number of accounts (right y-axis).
of Unclaimed Property Administrators (NAUPA), information across states is available in a
similar format and thus property types can be consistently categorized. Figure 3 reports the
distribution of property types, broadly defined, and shows that many of these accounts are
insurance property and securities, account balances, and uncashed checks. While unclaimed
retirement assets are spread across these categorizations, one category that is exclusively
made up of retirement assets is “IR,” or IRAs (red line). While small in comparison to other
broad categories, this category was only recently adopted by states, and many retirement-
related assets are still classified under the other broad categories usch as “CK” (uncashed
checks) and “MS” (miscellaneous property).
We now turn to the subsample of unclaimed property that is categorized as unclaimed
retirement accounts. As discussed in more detail in Section 3, we categorize unclaimed
property as an unclaimed retirement account if it is categorized as an IRA (traditional or
Roth), pension or profit-sharing plan, pension check, annuity, or retirement fund.10
Figure 4 shows the total amount of unclaimed retirement funds (solid line, left y-axis)
and total number of unclaimed retirement accounts (dashed line, right y-axis) as of 2018 by
10Retirement accounts span several of the broad categorizations from Figure 3, so they are not readable from this figure alone. However, they are still a small fraction of overall unclaimed property, suggesting that unclaimed property may be an issue that is not unique to retirement funds. Additionally, as NAUPA categorizations have recently incorporated specific IRA categorizations, we expect more unclaimed retirement accounts to appear.

Frictions in Saving and Claiming: An Analysis of Unclaimed Retirement Accounts Page 17
Figure 3: Distribution of funds by type of unclaimed property (sample)
AC
CK
IN
MI
MS
SC
UTTR, CTZZ, IR0
100
200
300
400
Tota
l fun
ds ($
mill
ions
)
1980 1990 2000 2010 2020Year
Notes: Figure shows the stock (in millions of dollars) of unclaimed property funds in 2018 by broad NAUPA code and by year the account was reported to the state unclaimed property division for our sample of 13 states. NAUPA codes are: AC (account balances), CK (uncashed checks), CT (court deposits), IN (insurance property), IR (IRA), MI (mineral proceeds), MS (miscellaneous property), SC (security related cash), SD (tangible property), TR (trust property), UT (utilities), and ZZ (other, plus CS—educational savings accounts— and HS—health savings accounts). The solid red line is IR (which are a subset of unclaimed retirement assets).

010
000
2000
030
000
Tota
l num
ber o
f acc
ount
s
05
1015
20To
tal a
mou
nt h
eld
($ m
illio
ns)
1980 1990 2000 2010 2020Year reported
Total amount ($ millions) Total number of accounts
Frictions in Saving and Claiming: An Analysis of Unclaimed Retirement Accounts Page 18
the year in which the account was reported to be unclaimed for the 13 states in our sample.
To produce this amount, we aggregate the amounts in all types of unclaimed retirement
accounts.11 We observe that the amounts and number of accounts are increasing over time,
from close to zero in the 1980s to $20 million from 30,000 accounts in 2018. This dramatic
increase over time is likely due to two features: first, more accounts are going unclaimed over
time, and second, the fact that this is a stock measure from 2018 and that individuals can
claim unclaimed property at any time suggests that accounts from earlier years may have
already been claimed.
Figure 4: Unclaimed retirement funds by year (sample)
Notes: Figure shows the stock of unclaimed retirement funds in 2018 by year the account was reported to the state unclaimed property division for our sample of 13 states. Solid red line is total amount in millions of dollars (left y-axis) and dashed red line is total number of accounts (right y-axis).
Figure 5 expands on this figure and shows the 99th , 95th , 75th , 50th (median), 25th ,
and 1st percentiles (arranged from darkest to lightest) of the distribution of amounts in
unclaimed retirement accounts for this sample, with levels in panel (a) and logs in panel
(b). Most unclaimed accounts appear to be of relatively little value; the median amount
unclaimed is less than $500. Yet, the 95th percentile of accounts have values over $2,000,
and the 99th percentile of accounts has values over $13,000.
11The breakdown by NAUPA codes is provided in Figure A.3. We do not further focus on the account type breakdown because NAUPA codes identifying the breakdown are selected by the plan holders without strict guidelines and not necessarily reliable.

Frictions in Saving and Claiming: An Analysis of Unclaimed Retirement Accounts Page 19
Figure 5: Distribution of unclaimed retirement funds by year (sample)
(a) Distribution of amounts in levels (b) Distribution of amounts in logs
99th
95th
1st-75th050
0010
000
1500
0A
mou
nt ($
)
1980 1990 2000 2010 2020Year reported
99th
95th
75th
50th
25th
1st
-50
510
Log
amou
nt ($
)1980 1990 2000 2010 2020
Year reported
Notes: Figure shows the 99th , 95th , 75th , 50th (median), 25th , and 1st percentiles (arranged from darkest to lightest) of distribution of amounts in unclaimed retirement accounts for the stock of unclaimed retirement funds in 2018 by year the account was reported to the state unclaimed property division for our sample of 13 states. Panel (a) reports the distribution in levels and panel (b) reports the distribution in logs.
4.2 Constructing a national estimate
We next summarize these numbers from the SUP data and use them to construct a
national estimate of unclaimed retirement accounts. The first row of Table 2 summarizes
the raw data from the previous subsection for 2016, with the number of accounts, total
funds, and mean amount per account in columns 1 through 3, respectively, and then the
population aged 74 and average number of accounts per 74 year old in columns 4 and 5,
respectively. From the raw data (without any extrapolation), under the assumption that
all unclaimed retirement accounts enter SUP databases through the mechanism described in
Section 2, approximately 4 percent of 74 year olds have an unclaimed retirement account,
with on average over $600.
Table 2: Unclaimed retirement account summary and extrapolation, 2016
Sample # accts Total funds ($) Mean amt ($) Pop. age 74 Accts per 74 % US 74 pop
Data 36,529 18,347,524 633 898,227 .041 .43 National (extrap.) 69,507 38,012,684 547 2,094,035 .033 1.00
Notes: Table reports aggregate retirement-related unclaimed properties by our sample of 13 states and the extrapolated national sample. Data sources include state unclaimed property data and the United States Census Bureau Estimated State Population by Characteristics for 2016.
Frictions in Saving and Claiming: An Analysis of Unclaimed Retirement Accounts Page 20
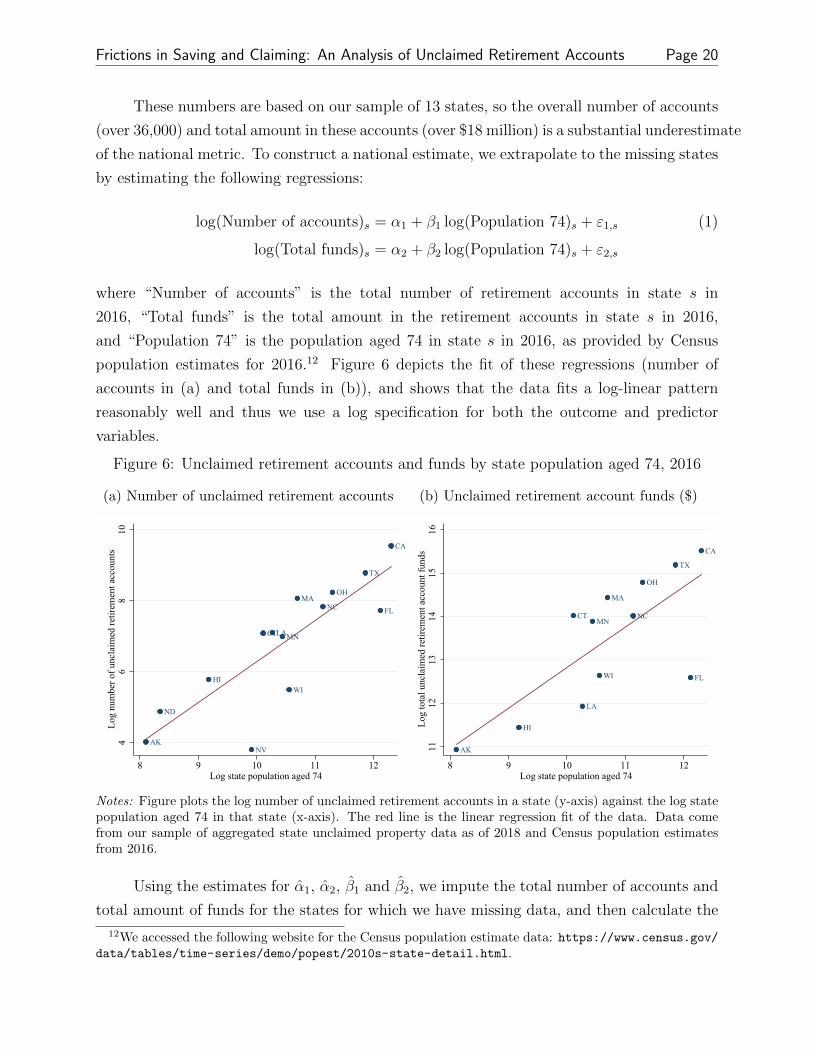
These numbers are based on our sample of 13 states, so the overall number of accounts
(over 36,000) and total amount in these accounts (over $18 million) is a substantial underestimate
of the national metric. To construct a national estimate, we extrapolate to the missing states
by estimating the following regressions:
log(Number of accounts)s = α1 + β1 log(Population 74)s + ε1,s (1)
log(Total funds)s = α2 + β2 log(Population 74)s + ε2,s
where “Number of accounts” is the total number of retirement accounts in state s in
2016, “Total funds” is the total amount in the retirement accounts in state s in 2016,
and “Population 74” is the population aged 74 in state s in 2016, as provided by Census
population estimates for 2016.12 Figure 6 depicts the fit of these regressions (number of
accounts in (a) and total funds in (b)), and shows that the data fits a log-linear pattern
reasonably well and thus we use a log specification for both the outcome and predictor
variables.
Figure 6: Unclaimed retirement accounts and funds by state population aged 74, 2016
(a) Number of unclaimed retirement accounts (b) Unclaimed retirement account funds ($)
AK
CA
CT
FL
HI
LA
MA
MN
NV
NC
ND
OH
TX
WI
46
810
Log
num
ber o
f unc
laim
ed re
tirem
ent a
ccou
nts
8 9 10 11 12Log state population aged 74
AK
CA
CT
FL
HI
LA
MA
MNNC
OH
TX
WI
1112
1314
1516
Log
tota
l unc
laim
ed re
tirem
ent a
ccou
nt fu
nds
8 9 10 11 12Log state population aged 74
Notes: Figure plots the log number of unclaimed retirement accounts in a state (y-axis) against the log state population aged 74 in that state (x-axis). The red line is the linear regression fit of the data. Data come from our sample of aggregated state unclaimed property data as of 2018 and Census population estimates from 2016.
Using the estimates for α̂1, α̂2, β̂ 1 and β̂
2, we impute the total number of accounts and
total amount of funds for the states for which we have missing data, and then calculate the 12We accessed the following website for the Census population estimate data: https://www.census.gov/
data/tables/time-series/demo/popest/2010s-state-detail.html.

Frictions in Saving and Claiming: An Analysis of Unclaimed Retirement Accounts Page 21
average size of the accounts using both the raw and imputed data. The second row of Table 2
shows that extrapolating to the entire United States suggests that almost 70,000 unclaimed
retirement accounts entered state unclaimed property databases in 2016 totaling over $38
million, and that suggests about 3.3 percent of 74 year olds in 2016 have an unclaimed
retirement account averaging a little under $550.
There are several important caveats that suggest that these numbers are substantial
underestimates of the true extent of unclaimed retirement assets. First, some unclaimed
retirement assets are funneled to other sources, such as the PBGC (which collects assets
from terminating plans; see Appendix A). Second, even among accounts that are supposed
to enter SUP databases, there is evidence that compliance is a substantial issue, and thus
many retirement assets remain with their plan managers instead of escheated to the state.
Finally, because all of our state databases are stocks (snapshots) of the net amount of
unclaimed accounts at the time of our data request, it is likely that in 2016 there were many
more accounts that were later claimed after outreach efforts by the state. Thus our preferred
interpretation of the numbers—at least in the first three columns—in Table 2 is that they
are a lower bound to the true extent of unclaimed retirement accounts.
In the next subsection, we further explore the characteristics of the individuals who
own these unclaimed accounts.
4.3 Characteristics of unclaimed account owners
What are the characteristics of these individuals who end up with unclaimed retirement
property? To shed light on this question, we exploit the fact that our data contain first name,
last name, and last known address of each account owner, as well as the name and address
of the former holder of each account. We link the first name of the account holder to Social
Security “Baby Names” data that provides the frequency of all first names by gender for
individuals with a Social Security number from 1880 onward, which allows us to predict
the gender of each individual in our data.13 Similarly, we predict the fraction of account
holders who are Hispanic by matching surnames in our SUP data to the decennial Census
Surnames File from 2000.14 This Census data file contains frequency data on surnames
reported at least 100 times in the decennial census, along with Hispanic origin and race
13More details, and downloadable data, can be found here: https://catalog.data.gov/dataset/ baby-names-from-social-security-card-applications-national-level-data.
14More details, and downloadable data, can be found here: https://www.census.gov/data/developers/ data-sets/surnames.2000.html.

Frictions in Saving and Claiming: An Analysis of Unclaimed Retirement Accounts Page 22
category percentages, at the national level.15 Finally, we link the ZIP code of the last known
address of the account owner to American Community Survey (ACS) county-level data to
examine average characteristics of the counties of unclaimed account owners compared to
the general population.16
Table 3 reports average characteristics of unclaimed retirement account holders in
column 1 and average characteristics of the overall 74 year old population in column 2.
From the “Name analysis” in the first two rows, we find that while 54 percent of the overall
74 year old population is female, only 45 percent of the unclaimed retirement account owner
population is female. This suggests that unclaimed retirement accounts disproportionately
belong to males, which is perhaps unsurprising since retirement accounts are more generally
likely to belong to males given their higher attachment to the labor force. The name analysis
also suggests that unclaimed retirement account owners are disproportionately Hispanic: a
predicted 24 percent of unclaimed retirement account owners are Hispanic, while the overall
74 year old population is only 12 percent Hispanic.
Table 3: Characteristics of Unclaimed Retirement Account Owners
Unclaimed retirement Overall 74 year account owners old population
Name analysis Percent female 0.45 0.54 Percent Hispanic 0.24 0.12
County-level analysis Average county population 2,116,785 158,137 Percent age 65+ 0.13 0.14 Percent white 0.69 0.72 Percent married 0.48 0.48 Percent bachelor degree 0.31 0.30 Percent born in state 0.57 0.57 Percent moved across state in past year 0.02 0.02 Percent own home 0.63 0.63 Median household income ($) 60,167 58,881 Percent of families below poverty line 0.11 0.11 Unemployment rate 8.60 7.60
Notes: Table reports average characteristics of individuals with unclaimed retirement assets (column 1) and average characteristics of 74 year olds (column 2). Data come from state unclaimed property data, Census population data, names databases derived from 2000 Census data and Social Security Administration data, and ACS county-level data.
The “County-level analysis” rows show that unclaimed retirement account owners
15We attempted to also predict other races but this analysis did not yield conclusive predictions; thus, we only report results for the Hispanic ethnicity.
16For ZIP codes that span multiple counties, we assign it the county for which the ZIP code covers the largest population in the 2010 Census.

Frictions in Saving and Claiming: An Analysis of Unclaimed Retirement Accounts Page 23
reside in much larger counties with higher unemployment rates and slightly fewer whites,
but are otherwise not very different in terms of the percent age 65 and over, married, with
a bachelor degree, born in state, moved across state in the past year, own home, below the
poverty line, and the median household income. Thus, the county-level analysis does not
appear to allow us to discern differential characteristics of unclaimed retirement account
owners from the general population.
In sum, our analysis of state unclaimed property data shows that in 2016, around
70,000 retirement accounts totaling $38 million went unclaimed, suggesting that 3.3 percent
of 74 year olds have an unclaimed retirement account averaging $550. While this may not
sound like a large number in the grand scheme of retirement assets in the United States, we
believe this is a substantial underestimate of the true amount. We also think that it could
be a much lower number than what it would have been if it was never lost (as discussed in
Section 2). Finally, even $500 can be a substantial amount of money for certain populations.
To get a better sense of the value that individuals would place on policies that would reduce
the incidence of lost accounts, the next section illustrates a model of unclaimed retirement
assets and alternative policies to reduce the issue.
5 Two-period model of retirement savings management
In this section, we develop a conceptual framework for understanding the mechanisms
through which retirement assets go unclaimed. The goal is to (a) illustrate the trade-offs
involved in managing retirement accounts, which can sometimes lead to lost accounts, and
(b) illustrate how different policies can minimize or alleviate these trade-offs. To do this,
we build a simple two-period model of retirement savings management in which individuals
decide whether to undertake costly management of their retirement accounts at some point
after a job change. Individuals not doing so risk forgetting about their accounts in the future.
5.1 Description of the model
The model consists of two periods: working life (the first period) and retirement (the
second period). During working life, individuals earn income y and accumulate retirement
savings s in an employer account. At the end of the period, individuals leave their employer
and must choose whether to pay a cost D1 to “deal with the account” or otherwise leave
it with the employer and risk not remembering it in the second period. In the second

Frictions in Saving and Claiming: An Analysis of Unclaimed Retirement Accounts Page 24
period (retirement), if the account was not previously managed and individual remembers
the account (with probability pr), they can choose to pay a cost D2 to “deal with it” or not.
Consumption in retirement then consists of Social Security SS and—if managed—retirement
savings s. 17
Flow utility in each period is given by:
Ut(·) = u(ct) + IDt Dt (2)
in which ct is consumption and Dt is a utility cost of dealing with an employer account,
which is meant to capture the time, hassle, and other psychic utility costs of rolling over and
generally managing the retirement account (e.g., putting the funds into an IRA that they
can easily track over time). This cost is likely larger at job change, since individuals have
many other tasks to manage at the same time (D1 > D2) but we allow any combinination
of (D1, D2) in our analysis. IDt is an indicator for whether they dealt with the account in
that period.
The cost of waiting to manage the account is that individuals may not remember the
account in the second period if they do not manage it in the first period. We capture this
“rational forgetting” by a probability of remembering the employer account pr in the second
period, if not managed in the first period.
The combination of decreasing management costs plus the risk of forgetting accounts
left with previous employers induces a trade-off between dealing with the account at job
separation (at a higher cost) versus dealing with it later at a lower cost but with a chance
that it may not be remembered and end up lost. If and when an individual deals with their
account will depend on the size of these costs, the chance of forgetting the account, and the
other primitives of the model (such as the size of the Social Security payment and the size
of the retirement savings account).
17We assume that there is no additional savings beyond s and SS (i.e., individuals cannot save more from y) and they cannot borrow against s or SS to consume more than y in the first period.

Frictions in Saving and Claiming: An Analysis of Unclaimed Retirement Accounts Page 25
5.2 Individual problem
The decision an individual makes in this model is whether to deal with their retirement
account: ID1 and ID2 . Working backwards, the individual in retirement enjoys utility of:
U2(·; ID1 = 1) =u(SS + s)
U2(Ipr = 0; ID1 = 0) =u(SS) (3)
U2(Ipr = 1; ID1 = 0) = max u(SS + sID2 ) − ID2 D2 ID2
depending on whether the individual managed the account prior to retirement (ID1 ) and, if
not, whether they remembered it in retirement (Ipr ). In the final case—in which they had
not managed the account in the first period yet still remembered it in the second period—
they trade off utility of u(SS) when choosing not to manage the account with utility of
u(SS + s) − D2 when choosing to manage the account.
In the first period, the individual takes into account these second period utilities, and
solves the following maximization problem:
max V1(y, s, D1, D2, pr) = u(y) − ID1 D1 + βEpr U2(Ipr ; ID1 ) (4)ID1
Thus, the individual trades off paying a cost D1 to manage their account for the benefit of
consumption s in retirement against “rationally procrastinating” by waiting until the second
period to pay a smaller cost (D2) but at the risk of not remembering the account (dictated
by the rate of remembering pr).
5.3 Comparative statics
This model illustrates the tension between dealing with an account and potentially
losing an account by showing who will not deal with their accounts. To see this, temporarily
assume no discounting and that everyone is risk-neutral, so their utility functions are linear.18
In that case, the second period decision of whether to manage the account (which only occurs
if it wasn’t managed in period one and they remembered it in the second period) is simply
that they will manage it if the amount in the account (s) is larger than the cost of managing
it (D2), and they will abandon it if D2 > s. In the first period, they will manage the account
18We allow for risk aversion when we calibrate the model below. Risk aversion will make individuals care more about the probability of remembering pr.

Frictions in Saving and Claiming: An Analysis of Unclaimed Retirement Accounts Page 26
if the cost of doing it now (versus in the second period) is smaller than the potential lost
savings of not remembering in the second period, or:
D1 − D2 < s(1 − pr)
The left-hand side of this equation is the relative cost of doing it in the first period (D1)
instead of the second period (D2), and the right-hand side is the potential lost benefit of
waiting to do it, which is that you might not remember in the second period (1 − pr) and
lose the savings s. 19
In summary, this model illustrates that the individuals who are at risk of losing their
accounts are:
• Those with high costs of managing an account (high D1 and D2), such as individuals
with low financial literacy, those with not enough time to take care of it and not enough
money to pay someone else to do it, and those with otherwise high hassle costs.
• Those with high costs of managing the account at job separation (D1) and low probability
of remembering the account in the future (low pr).
• Those with low balances in the account (low s).
These comparative statics also demonstrate potential policy tools to alleviate the
problem of lost accounts:
1. Reminders about accounts, which would increase pr. This could be welfare-improving
if it then allows individuals with high hassle costs in the first period (high D1) to
rationally delay managing their account to a lower-cost period without the risk of not
remembering.
2. Database of retirement accounts: this would allow individuals to more easily find
accounts that they may have not dealt with in a while and thus may have switched
owners, etc. This could lower D2, but not D1 since at job separation they likely know
where the account is.
3. Auto-rollovers: this would automatically “deal” with the accounts, lowering the cost
D1, possibly even to zero.
19This assumes that they will manage the account in the second period if they have the option; if not, the equation would be D1 < s.

Frictions in Saving and Claiming: An Analysis of Unclaimed Retirement Accounts Page 27
5.4 Numerical illustration
Here we numerically illustrate the features of the two-period model by calibrating
and solving the model using the parameter values in Table 4. We normalize income to
y = 1.0, and set retirement savings to s = 0.25, Social Security to SS = 0.2, and shut down
discounting or interest (β = R = 1.0). We use a log utility function, which makes individuals
risk averse.
Table 4: Parameters of two-period model
Parameter Value Description
y 1.0 Earnings in first period s 0.25 Amount of savings in retirement account SS 0.20 Social Security in second period pr U[0,1] Probability of remembering account in second period D1 U[0,1] Utility cost of managing account in first period D2 U[0,1] Utility cost of managing account in second period β 1.0 Discount factor R 1.0 Interest rate u(·) log(·) Utility function
We allow for heterogeneity along three dimensions: (1) pr, the probability of remembering
the retirement account in the second period if it is not managed in the first period, (2) D1,
the utility cost of managing it in the first period, and (3) D2, the utility cost of managing it
in the second period. Figure 7 shows the fraction of individuals who manage the account in
the first period for different costs of doing so on the x-axis and different terciles of the cost
in the second period (shaded red lines). As expected, as the cost of managing the account in
the first period increases, the fraction of individuals who manage the account at that point
decreases. This is particularly true for those with lower future costs of managing the account
(the low D2 line) than for those with higher future costs (the high D2 line) because those
with lower cost in the future are more willing to risk forgetting about the account for the
prospect of paying a lower cost to manage it.
We use this model to conduct policy experiments in which we reduce the utility cost
of managing the account to zero in either the first period (D1 = 0) or the second period
(D2 = 0). This counterfactual is meant to capture policies such as auto-rollovers, which
require minimal if any effort by individuals to manage their accounts when they change
employers. We measure the value to individuals of these policies by the willingness to pay out

Frictions in Saving and Claiming: An Analysis of Unclaimed Retirement Accounts Page 28
Figure 7: Share of individuals managing account in first period, by costs
0.2
.4.6
.81
Shar
e de
alin
g in
per
iod
1 (I D
1=1)
0 .2 .4 .6 .8 1Cost of dealing in period 1 (D1)
All D2 Low D2 Middle D2 High D2
Notes: Simulations from the two-period model. Graph shows the fraction of individuals who deal with their retirement account in the first period, by the utility cost of doing so in the first period (D1, x-axis) and the utility cost of doing so in the second period (D2, red gradient). The dashed black lines shows the overall fraction of individuals dealing with the account by the first period cost. Low D2 is the bottom tercile (0.00-0.33), Middle D2 is the middle tercile (0.34-0.66), and High D2 is the top tercile (0.67-1.00). Within each pair of (D1, D2), individuals additionally differ in the probability of remembering their account in the second period, pr.
of income to be indifferent between environments with and without the policy experiments:
Policy experiment A (D1 = 0): V1(y, s, D1, D2, pr) = V1(y − WTPA, s, 0, D2, pr) (5)
Policy experiment B (D2 = 0): V1(y, s, D1, D2, pr) = V1(y − WTPB, s, D1, 0, pr) (6)
In equation (5), WTPA determines the amount of income individuals would be willing to
forgo in order to have D1 = 0, while in equation (6), WTPB determines the income they
would be willing to forgo to have D2 = 0. Figure 8 shows the willingness to pay for D1 = 0
(panel a) and D2 = 0 (panel b) for different values of D1, D2, and pr. In both panels, the
willingness to pay for the policy increases as D1 and D2 increase and is always positive
except when D1 is already close to zero. The main difference between the two policies is
that the willingness to pay for D1 = 0 is much higher—around double—the willingness to
pay for D2 = 0 (the magnitudes for WTPB are similar if D2 is plotted on the x-axis). This
is because the former policy relieves all risk of forgetting about the account, while the latter
policy still subjects individuals to the risk that they will not remember the account in the
second period.
The numerical analysis reveals considerable willingness to pay for policy vehicles that

Frictions in Saving and Claiming: An Analysis of Unclaimed Retirement Accounts Page 29
Figure 8: Willingness to pay for zero utility cost of managing account, by original costs
(a) Willingness to pay for D1 = 0 (Policy A) (b) Willingness to pay for D2 = 0 (Policy B)
0.2
.4.6
Willi
ngne
ss to
pay
for D
1=0
0 .2 .4 .6 .8 1Cost of dealing in period 1 (D1)
All D2 Low D2 Middle D2 High D2
0.2
.4.6
Willi
ngne
ss to
pay
for D
2=0
0 .2 .4 .6 .8 1Cost of dealing in period 1 (D1)
All D2 Low D2 Middle D2 High D2
Notes: Simulations from the two-period model. Graph shows willingness to pay out of income y for zero utility cost of managing the account in the first period (D1 = 0, Panel (a)) and in the second period (D2 = 0, Panel (b)). The dashed line shows the average willingness to pay by the original D1, and the red gradient shows the average cost for those with low D2 (0.00-0.33), middle D2 (0.34-0.66), and high D2 (0.67-1.00). Within each pair of (D1, D2), individuals additionally differ in the probability of remembering their account in the second period, pr.
would reduce the probability with which a retirement account is unclaimed at retirement.
The model also shows that the results are sensitive to whether individuals face higher costs
of dealing with their retirement accounts at job separation or a later date. It would be
worthwhile for policymakers to identify whether individuals are heterogeneous in these costs
so they can better target the timing of possible interventions.
6 Discussion and conclusions
The retirement savings landscape in the United States places a great deal of responsibility
on individuals: how much to save, which saving vehicles to use, choice of investment funds,
and more. Additionally, individuals must keep track of the increasingly numerous savings
accounts accumulated over their working lives. Failing to do so can result in serious penalties
that eventually erode the balances in unclaimed accounts. While there is considerable
literature on various aspects of retirement saving, there is a marked gap in the study of
these unclaimed accounts. The present paper aims to fill this gap by providing the first set
of stylized facts regarding the extent of unclaimed retirement assets. The contribution is
then extended by analysis of a theoretical model of retirement saving featuring frictions in
claiming.

Frictions in Saving and Claiming: An Analysis of Unclaimed Retirement Accounts Page 30
The stylized facts presented in this paper result from the collection and analysis of a
previously unstudied data source: state unclaimed property databases. We estimate that
there were 70,000 unclaimed retirement accounts in 2016, translating to one such account for
3 percent of retirees. These statistics are surely underestimates due to imperfect compliance
with state unclaimed property reporting requirements. We combine these data with county-
and ZIP code- level data to examine whether certain individuals characteristics are linked
with unclaimed accounts, but find that the issue is widespread and not concentrated among
any one demographic.
To interpret this phenomenon, we develop and numerically analyze a model of retirement
saving and consumption featuring account management costs and imperfect memory. Our
simulations reveal that individuals would achieve significant welfare gains from policies that
help them find and remember accounts linked with previous employers. In particular,
individuals would benefit from reminders about such accounts, a database of unclaimed
retirement accounts, and defaults enabling auto-rollover of retirement funds to more salient
accounts. Reminders are potentially easy to implement and have shown to be effective in
helping older Americans manage their finances in other settings, e.g., in paying property taxes
(Moulton et al., 2019). Databases containing information on unclaimed retirement accounts
would also help financial planners, counselors, and family members help individuals who are
concerned about having lost track of such accounts. A related solution would be to have
these individuals—as long as they hold fiduciary responsibility—review such information for
concerned account holders well before the accounts are at risk for becoming unclaimed.
The key limitation in our analysis is under-measurement of the unclaimed retirement
assets, a problem that cannot be remedied without propietary data that would force focus on
a specific subsample. Specifically, the state unclaimed property databases contain a subset
of unclaimed retirement accounts due to the preemption of federal ERISA guidelines and
the imperfect compliance of firms to state escheatment policies. Yet, these data are also the
most complete picture of unclaimed retirement assets at the general population level due to
the systematic reporting and categorization of unclaimed property.
The findings in this report help inform a variety of potential policy considerations.
For example, states vary in the effort they exert to connect unclaimed property with their
owners, and there could be greater coordination to improve these efforts. In Wisconsin, the
unclaimed property division matches account owners’ Social Security numbers to addresses
using the state’s tax database, and sends a check for unclaimed property to owners without
them having to undergo any formal process. Automating and facilitating efforts in these
ways can help reduce the amount of unclaimed property. Specific to retirement, tax codes

Frictions in Saving and Claiming: An Analysis of Unclaimed Retirement Accounts Page 31
could be modified to remove the penalty associated with early withdrawals of retirement
savings due under a larger amount than is currently allowed during job changes to help
people port their savings and avoid losing them.
We hope that future work will use proprietary data to augment our analysis and better
describe the set of individuals vulnerable to unclaimed retirement assets. For example,
perhaps individuals with low average job duration are at highest risk of losing track of their
accounts. Or, perhaps a subset of individuals who are auto-enrolled into retirement savings
plans do not know about them, and thus fail to keep track of them over time. From a
market perspective, such patterns are important to identify as they can help inform the
benefits and costs of different retirement savings vehicles: the cost to households of keeping
track of such accounts has not yet been incorporated to such evaluations in a meaningful
way. Such research would help improve retirement policy in the United States, as changing
patterns in employment and retirement benefits may create challenges for people to access
their own savings.

Frictions in Saving and Claiming: An Analysis of Unclaimed Retirement Accounts Page 32
References
Armour, P., M. D. Hurd, and S. Rohwedder (2016). Trends in pension cash-out at job change
and the effects on long-term outcomes. In Insights in the Economics of Aging, pp. 15–39.
University of Chicago Press.
Baicker, K., W. J. Congdon, and S. Mullainathan (2012). Health insurance coverage and
take-up: Lessons from behavioral economics. The Milbank Quarterly 90 (1), 107–134.
Benartzi, S. and R. Thaler (2007). Heuristics and biases in retirement savings behavior.
Journal of Economic Perspectives 21 (3), 81–104.
Benzarti, Y. (2015). How taxing is tax filing? leaving money on the table because of hassle
costs. Technical report, Working Paper.
Clark, R. L., M. S. Morrill, and D. Vanderweide (2014). Defined benefit pension plan
distribution decisions by public sector employees. Journal of Public Economics 116, 73–
88.
Ebenstein, A. and K. Stange (2010). Does inconvenience explain low take-up? evidence from
unemployment insurance. Journal of Policy Analysis and Management 29 (1), 111–136.
Ekerdt, D. J. and J. K. Hackney (2002). Workers’ ignorance of retirement benefits. The
Gerontologist 42 (4), 543–551.
Ericson, K. M. M. (2011). Forgetting we forget: Overconfidence and memory. Journal of
the European Economic Association 9 (1), 43–60.
Farber, H. S. (2010). Job loss and the decline in job security in the united states. In Labor
in the new economy, pp. 223–262. University of Chicago Press.
Friedberg, L. and A. Webb (2005). Retirement and the evolution of pension structure.
Journal of Human Resources 40 (2), 281–308.
GAO (2014, November). 401(k) plans: Greater protections needed for forced transfers
and inactive accounts. Technical report, United States Government Accountability Office
Report.
GAO (2019, January). Retirement accounts: Federal action needed to clarify tax treatment
of unclaimed 401(k) plan savings transferred to states. Technical report, United States
Government Accountability Office Report.

Frictions in Saving and Claiming: An Analysis of Unclaimed Retirement Accounts Page 33
Gottlieb, D. and K. Smetters (2014). Lapse-based insurance. Working paper .
Greenblatt, R. E. and K. M. Z. Rosenman (1996). Erisa preemptions of state unclaimed
property and escheat laws. Benefits Law Journal 9 (1).
Kim, H. H., R. Maurer, and O. S. Mitchell (2016). Time is money: Rational life cycle inertia
and the delegation of investment management. Journal of Financial Economics 121 (2),
427–447.
Lusardi, A. and O. S. Mitchell (2014). The economic importance of financial literacy: Theory
and evidence. Journal of Economic Literature 52 (1), 5–44.
Madrian, B. C. and D. F. Shea (2001). The power of suggestion: Inertia in 401 (k)
participation and savings behavior. Quarterly Journal of Economics 116 (4), 1149–1187.
Mastrobuoni, G. (2011). The role of information for retirement behavior: Evidence
based on the stepwise introduction of the social security statement. Journal of Public
Economics 95 (7-8), 913–925.
Moulton, S., J. M. Collins, C. Loibl, D. R. Haurin, and J. Brown (2019). Reminders to
pay property tax payments: A field experiment of older adults with reverse mortgages.
Available at SSRN 3445419 .
Munnell, A. and A. Webb (2015). The impact of leakages from 401(k)s and iras. Center for
Retirement Research at Boston College (15-2).
Poterba, J. M. (2014). Retirement security in an aging population. American Economic
Review 104 (5), 1–30.
Register, F. (2017). Pension benefit guaranty corporation: Missing participants. Federal
Register: The Daily Journal of the United States 82 (245), 60800–60833.
Scholz, J. K., A. Seshadri, and S. Khitatrakun (2006). Are americans saving “optimally” for
retirement? Journal of political economy 114 (4), 607–643.
Skinner, J. (2007). Are you sure you’re saving enough for retirement? Journal of Economic
Perspectives 21 (3), 59–80.
Warren, E. (2018). S2474: Retirement savings lost and found act of 2018. Technical report,
Senate Finance Committee.

Frictions in Saving and Claiming: An Analysis of Unclaimed Retirement Accounts Page 34
Appendix A: Additional data on unclaimed retirement
assets
This appendix provides an overview of additional data sources containing information
on unclaimed retirement assets.
IRS Form 5500
The Internal Revenue Service (IRS) collects information on unclaimed (or more specifically,
“unpaid”) pension benefits in its Form 5500 series, which is a set of tax forms that employers
with employee benefit plans must fill out to satisfy annual reporting requirements under
ERISA and the Internal Revenue Code. It is “intended to assure that employee benefit
plans are operated and managed in accordance with certain prescribed standards and that
participants and beneficiaries, as well as regulators, are provided or have access to sufficient
information to protect the rights and benefits of participants and beneficiaries under employee
benefit plans.”20 In general, all administrators of pension benefit plans covered by ERISA
must file an annual return/report on Form 5500 (or Form 5500-SF for plans with fewer than
100 participants), irrespective of whether the plan is tax-qualified, benefits no longer accrue,
contributions were not made in the plan year, contributions were no longer made, or whether
the plan was a defined benefit or defined contribution plan. Plan sponsors must generally
file the return on the last day of the seventh month after their plan year ends.
Effective for the 2009 plan year, plans are asked in Form 5500 (Schedule H or I,
depending on which form the plan must fill out):
Has the plan failed to provide any benefit when due under the plan?
and must answer yes, no, and if yes, the dollar amount. Appendix Figure A.1 shows the
percent of plans answering yes, and among those answering yes, the average amount of
benefits the plan failed to provide. Prior to 2016, less than 3% of plans reported failing to
provide benefits In 2016 the fraction of plans reporting unpaid benefits rose to over 1%.
The drastic change in reporting in 2016 was due to a large amount of confusion over the
interpretation of the question, which was clarified in 2015 and again in 2016. Prior to 2015,
the instructions did not include any guidance on what constituted a reportable “failure” to
20https://www.dol.gov/agencies/ebsa/employers-and-advisers/plan-administration-and-compliance/ reporting-and-filing/form-5500

Frictions in Saving and Claiming: An Analysis of Unclaimed Retirement Accounts Page 35
provide benefits, and the instructions simply stated: “You must check ‘Yes’ if any benefits
due under the plan were not timely paid or not paid in full. Include in this amount the total of
any outstanding amounts that were not paid when due in previous years that have continued to
remain unpaid. It has generally been answered by plans taking into account terms that require
the plan’s normal administrative procedures for commencing a benefit be followed in order
to initiate benefit payments.” From these instructions alone, it was unclear to many plan
sponsors whether required minimum distributions (RMDs) for missing participants counted,
so in 2015 the Internal Revenue Service clarified that unpaid RMDs counted for individuals
70.5 and over.21 In 2016, the IRS provided a further clarification that plan sponsors need
not report unpaid RMDs for those who “cannot be located after reasonable efforts or where
the plan is in the process of engaging in such reasonable efforts at the end of the plan year
reporting period.”
Because of the confusion and clarifications that suppress many of the unclaimed benefits,
we do not believe the Form 5500 data to be as useful in understanding the extent of unclaimed
pension accounts. However, for completeness we still provide summary statistics on unpaid
benefits in Figure A.1. Panel (a) shows the fraction of firms filing a Form 5500 of some
variety that report unpaid benefits, which hovers around 0.2 percent of firms until 2016,
when around 1 percent of large firms report unpaid benefits. Similarly, panel (b) shows
the total amount of unpaid benefits (in millions of dollars) across firms reporting unpaid
benefits. We find that overall, 25-45 million dollars are reported most years, with another
spike in 2016. Interestingly, these numbers are in the same ballpark as our estimates using
state unclaimed property databases.
PBGC Missing Participants program data
The Pension Benefit Guarantee Corporation (PBGC) was created by the Employee
Retirement Income Security Act (ERISA) of 1974 to guarantee payment of private defined-
benefit pensions. In 1994 it introduced the Missing Participants program with the aim
to “connect missing participants with their benefits in terminated plans that are closing
out”.22 In this program, all terminating plans that are unable to locate beneficiaries (after
a thorough search) are required to file with the program. The types of plans required to file
has expanded over the years: originally, only PBGC-insured defined benefit plans were part
of the Missing Participants program, but smaller plans are now also part of the program and
21Specifically, 5 percent owners who were age 70.5 and over or non-5 percent owners who were age 70.5 and over who were retired or separated from employment.
22https://www.pbgc.gov/prac/missing-p-defined-contribution

Frictions in Saving and Claiming: An Analysis of Unclaimed Retirement Accounts Page 36
Figure A.1: Unpaid benefits reporting in Form 5500
(a) Fraction of firms reporting unpaid benefits (b) Total unpaid benefits reported ($ millions) 0
.005
.01
Frac
tion
of fi
rms r
epor
ting
unpa
id b
enef
its
2008 2010 2012 2014 2016 2018Year
Universe of firms Schedule H firmsSchedule I firms SF firms
050
100
Tota
l unp
aid
bene
fits (
$ m
illio
ns)
2008 2010 2012 2014 2016 2018Year
Universe of firms Schedule H firmsSchedule I firms SF firms
Notes: Data from 2009-2017 Form 5500 (Schedules H and I) and Form 5500-SF filings, from the question “Has the plan failed to provide any benefit when due under this plan? ” The universe of firms is all firms with employee benefit plans.
more recently, defined contribution plans that terminated after January 1, 2018 are now part
of the program.23 Plans must file Form MP, which contains plan information, and Schedule
A or B, which provide individual information about missing distributees.24
We obtained aggregated data from Form MP through a Freedom of Information Act
request in November 2016, including plan-level information on the number of missing participants,
the amount owed to the PBGC, the year of distribution, and some geographic information.
The data include all PBGC records. Figure A.2 plots the total number of missing participants
by year (with amounts due to PBGC in dark gray and with “irrevocable commitments” in
light gray) in bars on the left y-axis and the total amount due to PBGC (in $ millions) in
the black line on the right y-axis. The total number of missing participants is around 1500
per year, though it has been rising in more recent years, and the total amount has risen from
around $2 million a year in 2010 to $6 million in 2013.
Because most DC plans not covered until very recently, and because this database only
covers terminating plans (which are a small fraction of retirement plans), we do not believe
this data to have an accurate picture of unclaimed retirement assets in the United States.
23Some specific types of plans, such as church plans, governmental plans, and non-ERISA plans, remain uncovered by the Missing Participants program.
24Schedule A is for “transferring plans,” which transfer all benefits to PBGC, and Schedule B is for “notifying plans,” which only provide account information but not the benefits.
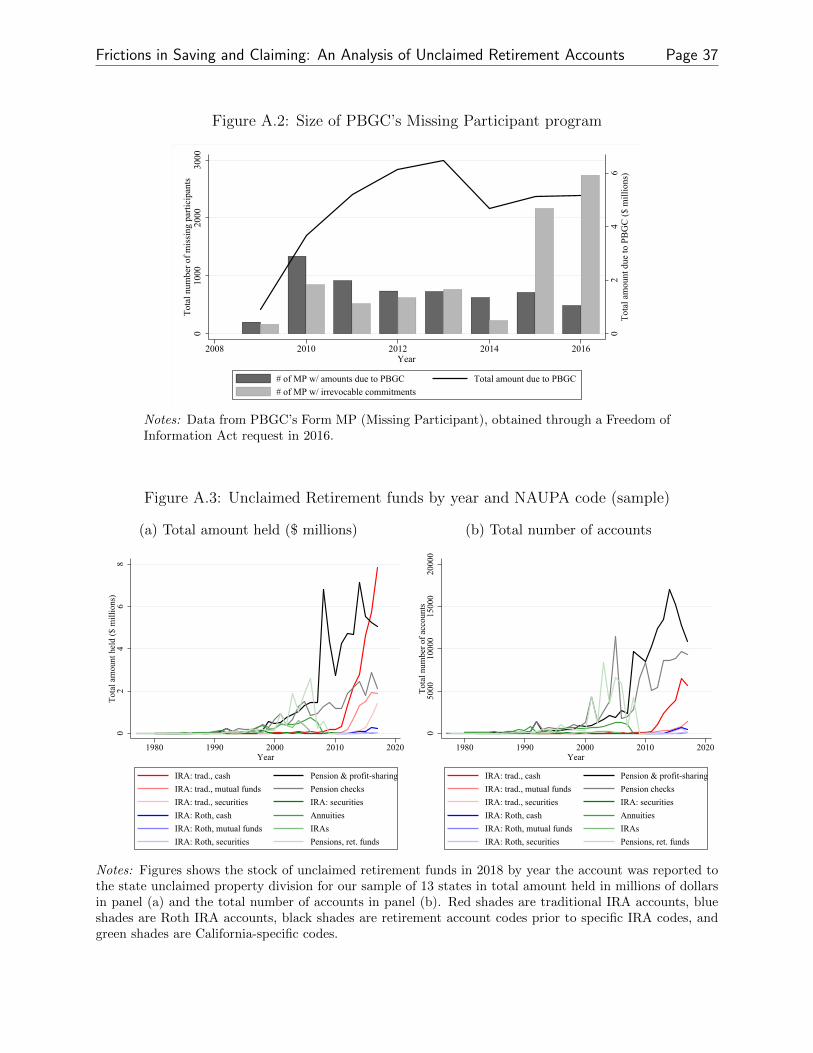
Frictions in Saving and Claiming: An Analysis of Unclaimed Retirement Accounts Page 37
Figure A.2: Size of PBGC’s Missing Participant program
02
46
Tota
l am
ount
due
to P
BG
C ($
mill
ions
)
010
0020
0030
00To
tal n
umbe
r of m
issi
ng p
artic
ipan
ts
2008 2010 2012 2014 2016Year
# of MP w/ amounts due to PBGC# of MP w/ irrevocable commitments
Total amount due to PBGC
Notes: Data from PBGC’s Form MP (Missing Participant), obtained through a Freedom of Information Act request in 2016.
Figure A.3: Unclaimed Retirement funds by year and NAUPA code (sample)
(a) Total amount held ($ millions) (b) Total number of accounts
02
46
8To
tal a
mou
nt h
eld
($ m
illio
ns)
1980 1990 2000 2010 2020Year
IRA: trad., cashIRA: trad., mutual fundsIRA: trad., securitiesIRA: Roth, cashIRA: Roth, mutual fundsIRA: Roth, securities
Pension & profit-sharingPension checksIRA: securitiesAnnuitiesIRAsPensions, ret. funds
050
0010
000
1500
020
000
Tota
l num
ber o
f acc
ount
s
1980 1990 2000 2010 2020Year
IRA: trad., cashIRA: trad., mutual fundsIRA: trad., securitiesIRA: Roth, cashIRA: Roth, mutual fundsIRA: Roth, securities
Pension & profit-sharingPension checksIRA: securitiesAnnuitiesIRAsPensions, ret. funds
Notes: Figures shows the stock of unclaimed retirement funds in 2018 by year the account was reported to the state unclaimed property division for our sample of 13 states in total amount held in millions of dollars in panel (a) and the total number of accounts in panel (b). Red shades are traditional IRA accounts, blue shades are Roth IRA accounts, black shades are retirement account codes prior to specific IRA codes, and green shades are California-specific codes.

This Would Be the Title of the Paper Page
4