FREY+CIE TELECOM AG Ihr ICT Integrator · PDF file12.15 Lunch & Networking 13.30...
75
FREY+CIE TELECOM AG Ihr ICT Integrator
Transcript of FREY+CIE TELECOM AG Ihr ICT Integrator · PDF file12.15 Lunch & Networking 13.30...
FREY+CIE TELECOM AG
Ihr ICT Integrator
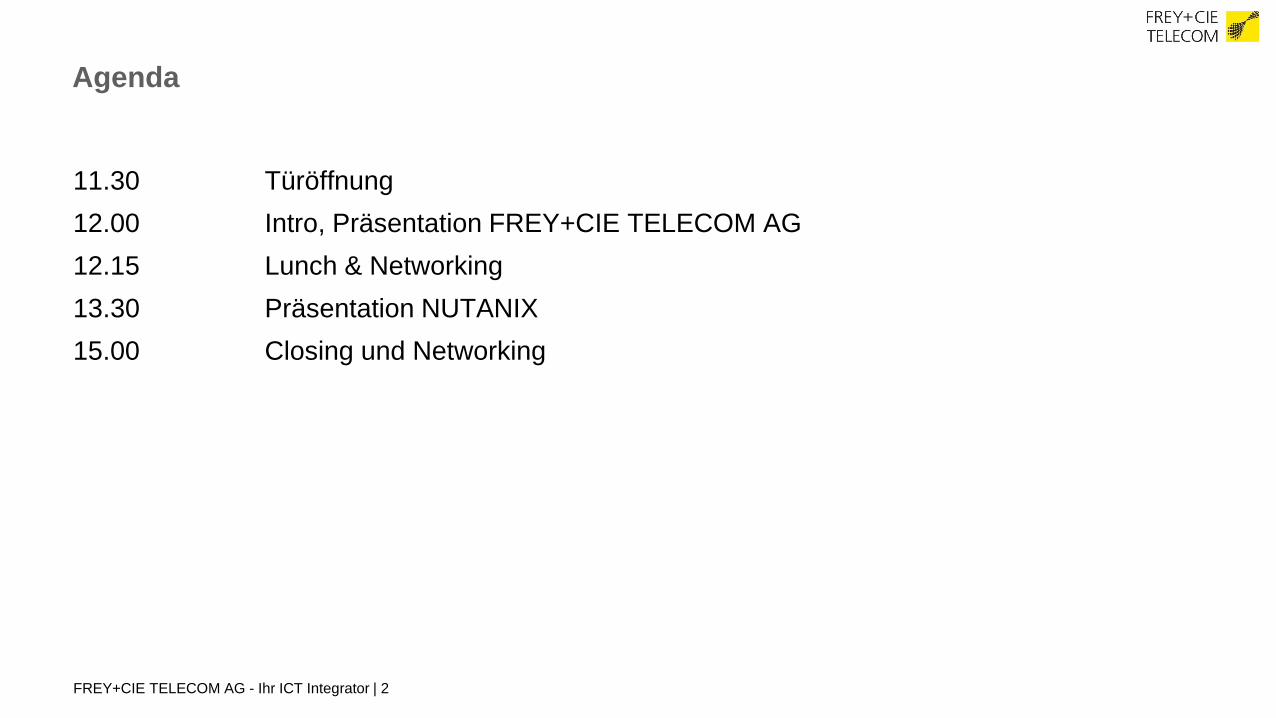
Agenda
11.30 Türöffnung
12.00 Intro, Präsentation FREY+CIE TELECOM AG
12.15 Lunch & Networking
13.30 Präsentation NUTANIX
15.00 Closing und Networking
FREY+CIE TELECOM AG - Ihr ICT Integrator | 2

FREY+CIE TELECOM AG - Ihr ICT Integrator | 3
FREY + CIE
Techinvest 22 Holding
«Die Firmengruppe»
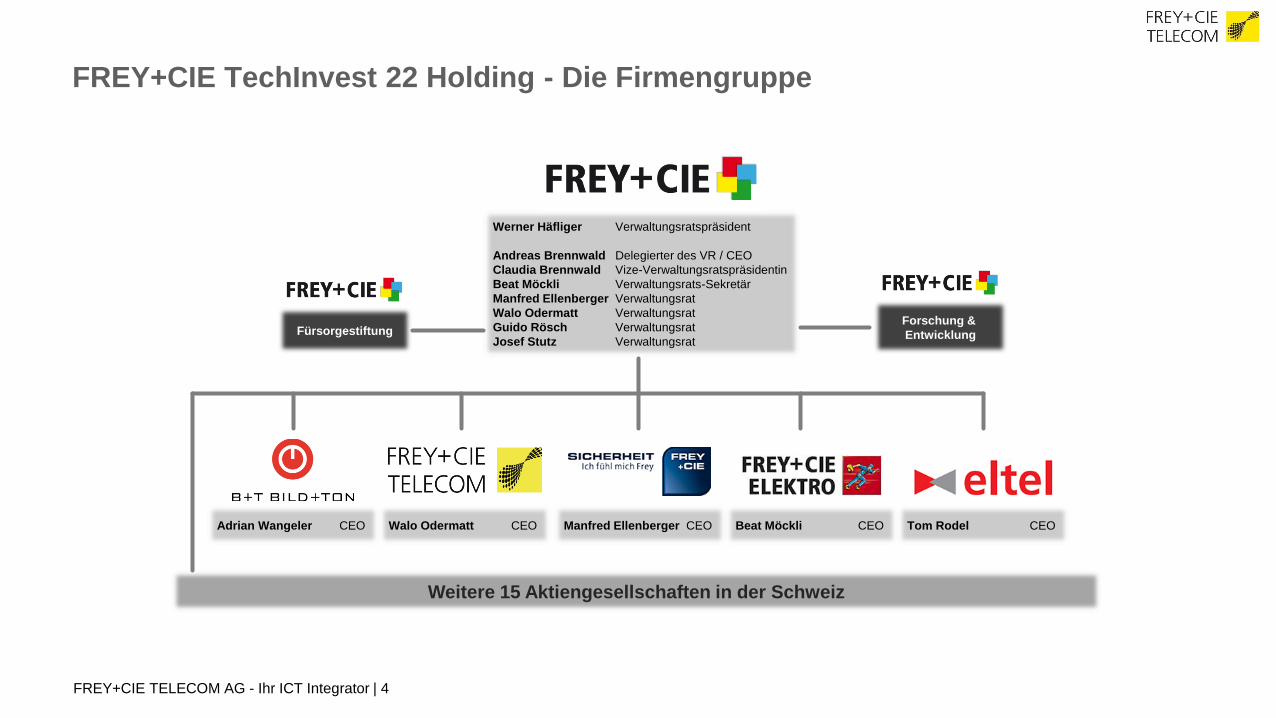
FREY+CIE TechInvest 22 Holding - Die Firmengruppe
FREY+CIE TELECOM AG - Ihr ICT Integrator | 4
Werner Häfliger Verwaltungsratspräsident
Andreas Brennwald Delegierter des VR / CEO
Claudia Brennwald Vize-Verwaltungsratspräsidentin
Beat Möckli Verwaltungsrats-Sekretär
Manfred Ellenberger Verwaltungsrat
Walo Odermatt Verwaltungsrat
Guido Rösch Verwaltungsrat
Josef Stutz Verwaltungsrat
Adrian Wangeler CEO Walo Odermatt CEO Manfred Ellenberger CEO Beat Möckli CEO Tom Rodel CEO
Weitere 15 Aktiengesellschaften in der Schweiz
FürsorgestiftungForschung &
Entwicklung

Die FREY+CIE Techinvest 22 Holding AG
100%iger Aktionär aller FREY+CIE Unternehmen
Komplett eigenfinanzierte Unternehmung
50 leitende Mitarbeiter sind Aktionäre
Über 800 Mitarbeiter sind in der ganzen Schweiz unterwegs
FREY+CIE TELECOM AG - Ihr ICT Integrator | 5
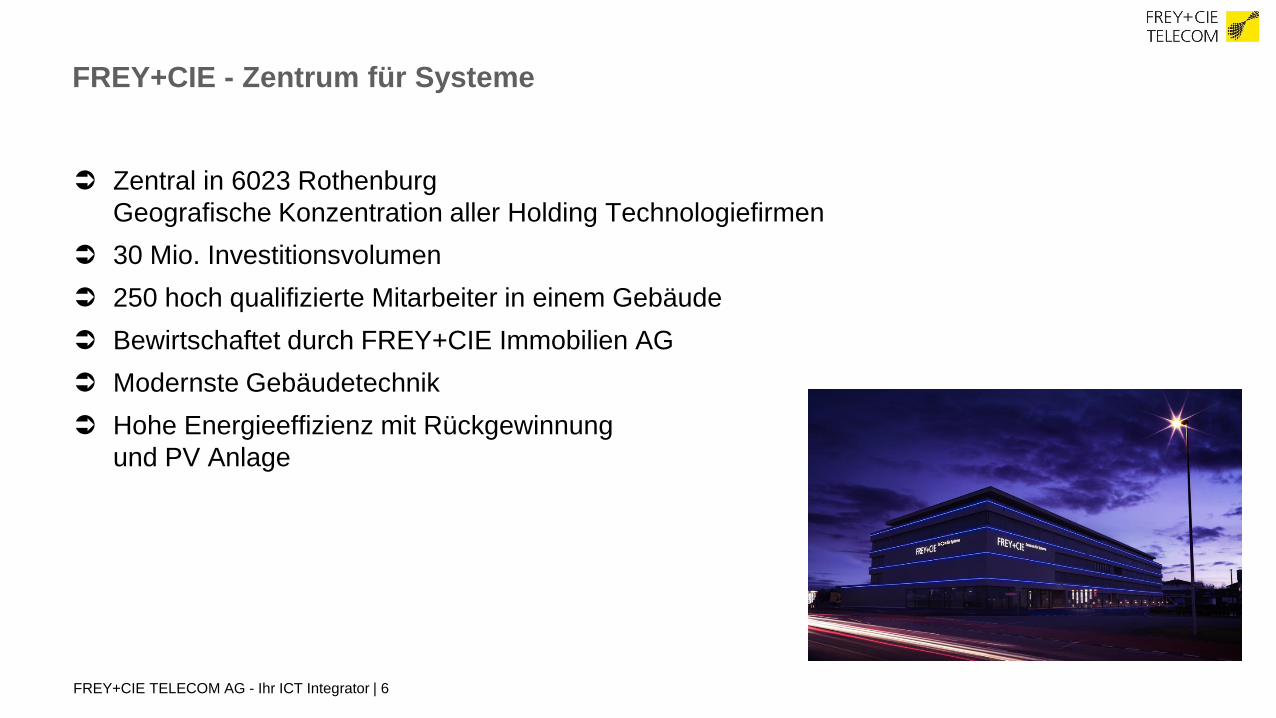
FREY+CIE - Zentrum für Systeme
Zentral in 6023 Rothenburg
Geografische Konzentration aller Holding Technologiefirmen
30 Mio. Investitionsvolumen
250 hoch qualifizierte Mitarbeiter in einem Gebäude
Bewirtschaftet durch FREY+CIE Immobilien AG
Modernste Gebäudetechnik
Hohe Energieeffizienz mit Rückgewinnung
und PV Anlage
FREY+CIE TELECOM AG - Ihr ICT Integrator | 6

FREY+CIE TELECOM AG - Ihr ICT Integrator | 7
FREY + CIE TELECOM AG
«Ihr ICT Integrator»

Die FREY+CIE TELECOM AG
Gegründet als Aktiengesellschaft 1991
Mitglied der Frey + Cie Techinvest 22 Holding AG
Über 50 Mitarbeiter sind in der ganzen Schweiz unterwegs
Zertifizierungen und Partnerschaften über das ganze ICT Spektrum
Mitglied in diversen Dach- & Fachverbänden
FREY+CIE TELECOM AG - Ihr ICT Integrator | 8
FREY+CIE TELECOM AG - Ihr ICT Integrator | 10
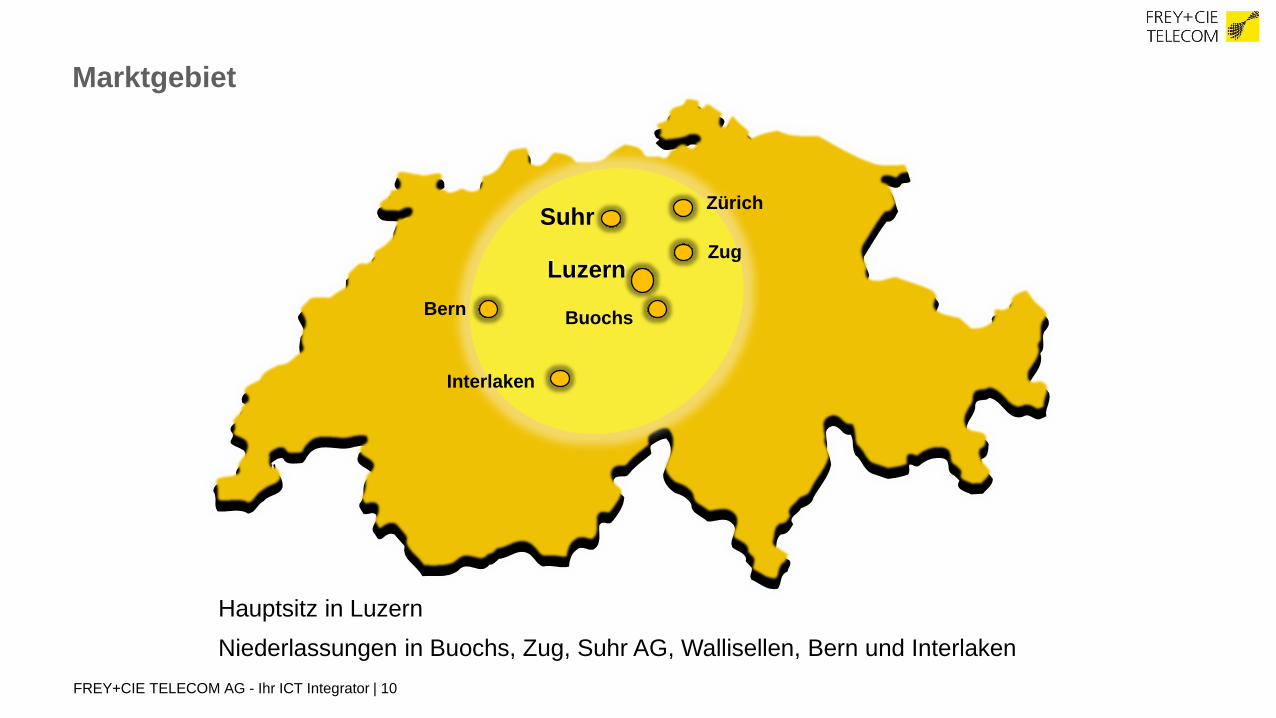
Marktgebiet
Bern
Interlaken
LuzernZug
Zürich
Hauptsitz in Luzern
Niederlassungen in Buochs, Zug, Suhr AG, Wallisellen, Bern und Interlaken
Suhr
Buochs
FREY+CIE TELECOM AG - Ihr ICT Integrator | 11
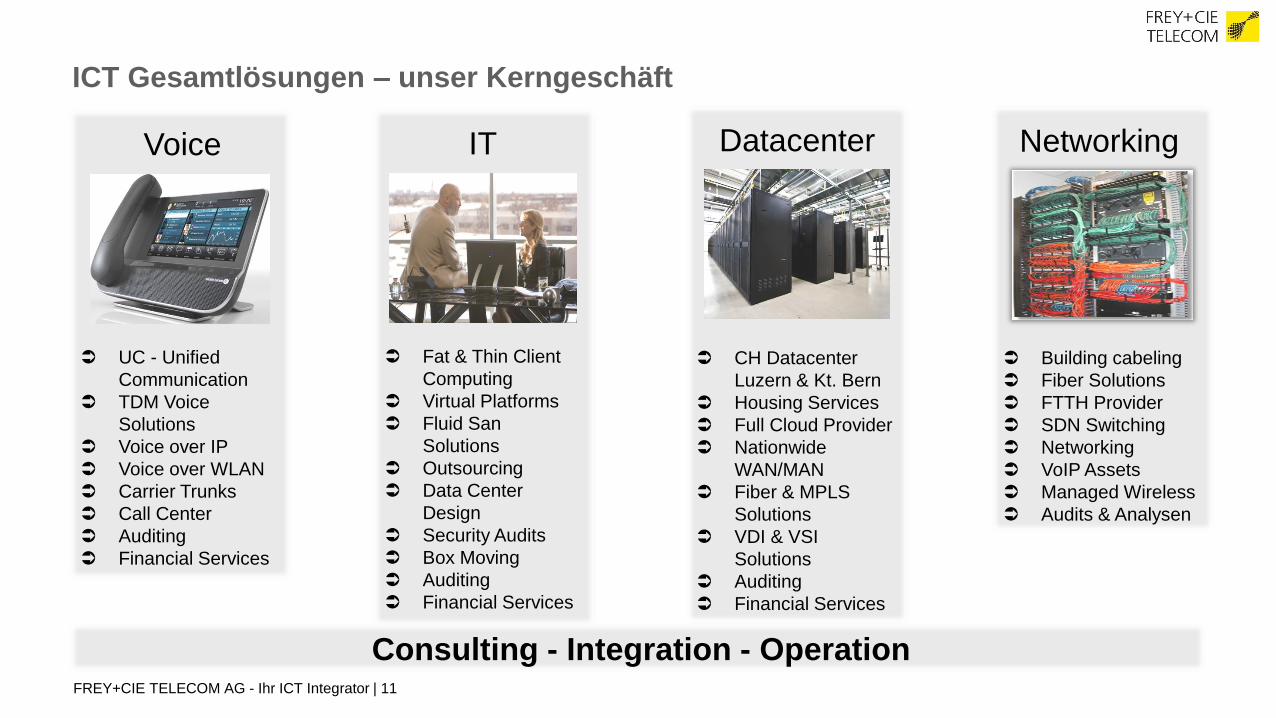
ICT Gesamtlösungen – unser Kerngeschäft
Consulting - Integration - Operation
UC - Unified
Communication
TDM Voice
Solutions
Voice over IP
Voice over WLAN
Carrier Trunks
Call Center
Auditing
Financial Services
Fat & Thin Client
Computing
Virtual Platforms
Fluid San
Solutions
Outsourcing
Data Center
Design
Security Audits
Box Moving
Auditing
Financial Services
CH Datacenter
Luzern & Kt. Bern
Housing Services
Full Cloud Provider
Nationwide
WAN/MAN
Fiber & MPLS
Solutions
VDI & VSI
Solutions
Auditing
Financial Services
Building cabeling
Fiber Solutions
FTTH Provider
SDN Switching
Networking
VoIP Assets
Managed Wireless
Audits & Analysen
Voice IT Datacenter Networking

FREY+CIE TELECOM AG - Ihr ICT Integrator | 12
Neues Datacenter in 6023 Rothenburg
Aktuellste Datacenter Technologien (Stand 2015)
30kVa Photovoltaik Nutzung
Wärmerückgewinnung für Gebäudeheizung & Kühlung
Redundante Energieversorgungen (Twin Carrier / Diesel)
High Performance IP Transit Access – Equinix / Swisscom / UPC Global
Georedundanz (Kanton Bern)
Höchste Verfügbarkeit
Sämtliche am Markt angebotenen Cloud
Lösungen verfügbar
Gebaut für die Bedürfnisse der KMU
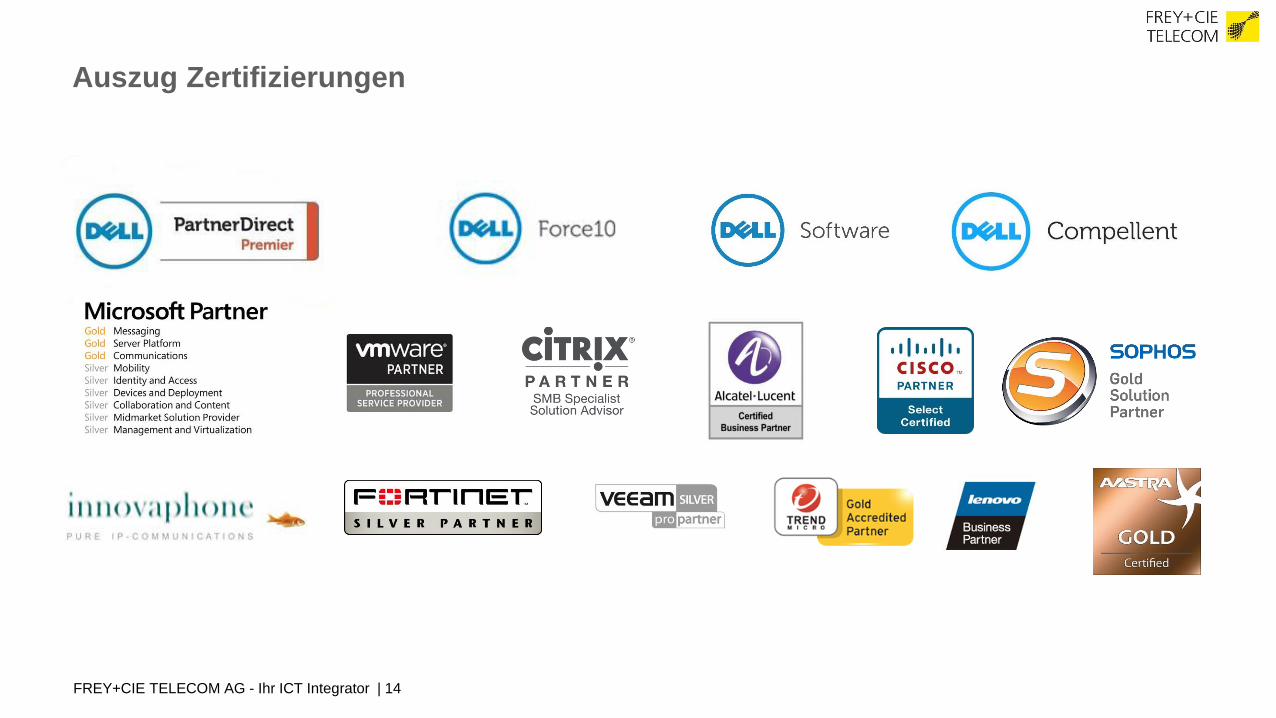
Auszug Zertifizierungen
FREY+CIE TELECOM AG - Ihr ICT Integrator | 14

1st Visit - Mögliche Follow Up’s
FREY+CIE TELECOM AG - Ihr ICT Integrator | 16
Tech Talk mit unseren System Engineers
Lösungs-Demo in Ihrem Hause
Kostenlose Evaluations Produkte zum Testen
Erstellen einer Basisanalyse
Erstellen eines Basisdesigns

FREY+CIE TELECOM AG - Ihr ICT Integrator | 17
Besten Dank für Ihre Aufmerksamkeit.
Gerne beantworten wir Ihre Fragen
Die Präsentationen dieses Anlasses finden Sie unter:
https://www.freytelecom.ch/de/company/events/event-downloads
oder via QR Code auf Ihrem Eintrittsbadge

Dell - Restricted - Confidential1
Elevate IT with Acropolis on Dell XCDell XC Series Web-Scale Converged Appliancepowered by Nutanix software
André Wicki Beat MüllerStorage Solution Engineer System Engineer [email protected] [email protected]
Dell - Restricted - Confidential2
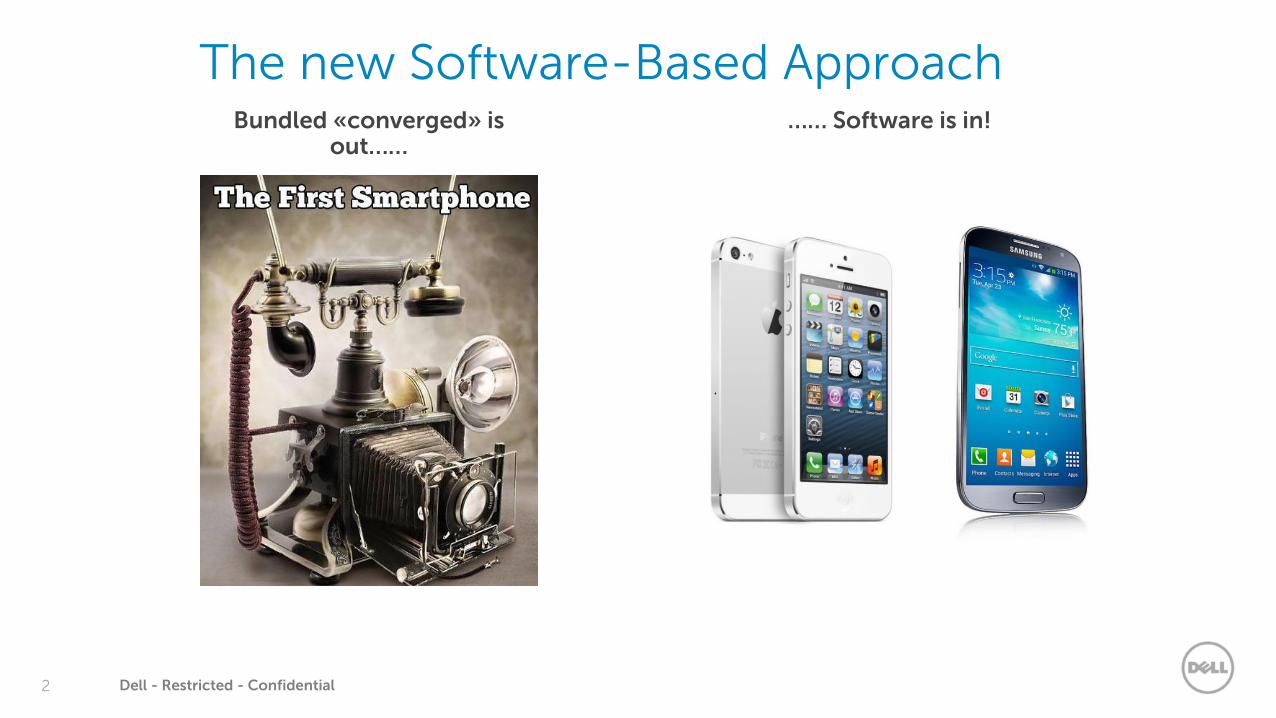
The new Software-Based ApproachBundled «converged» is
out………… Software is in!

Dell - Restricted - Confidential3
The Best IT Infrastructure Is
You Can’t See

Dell - Restricted - Confidential4
Web-Scale: Design Points for Invisible
Design Principles
• x86 servers: fail-fast systems
• No special purpose appliances
• All intelligence and services in software
• Extensive automation and rich analytics
• Distributed everything
Benefits
• Linear, predictable scale-out
• Always-on systems
• Fast innovation in software
• Operational simplicity
• Lower TCO
Dell - Restricted - Confidential5
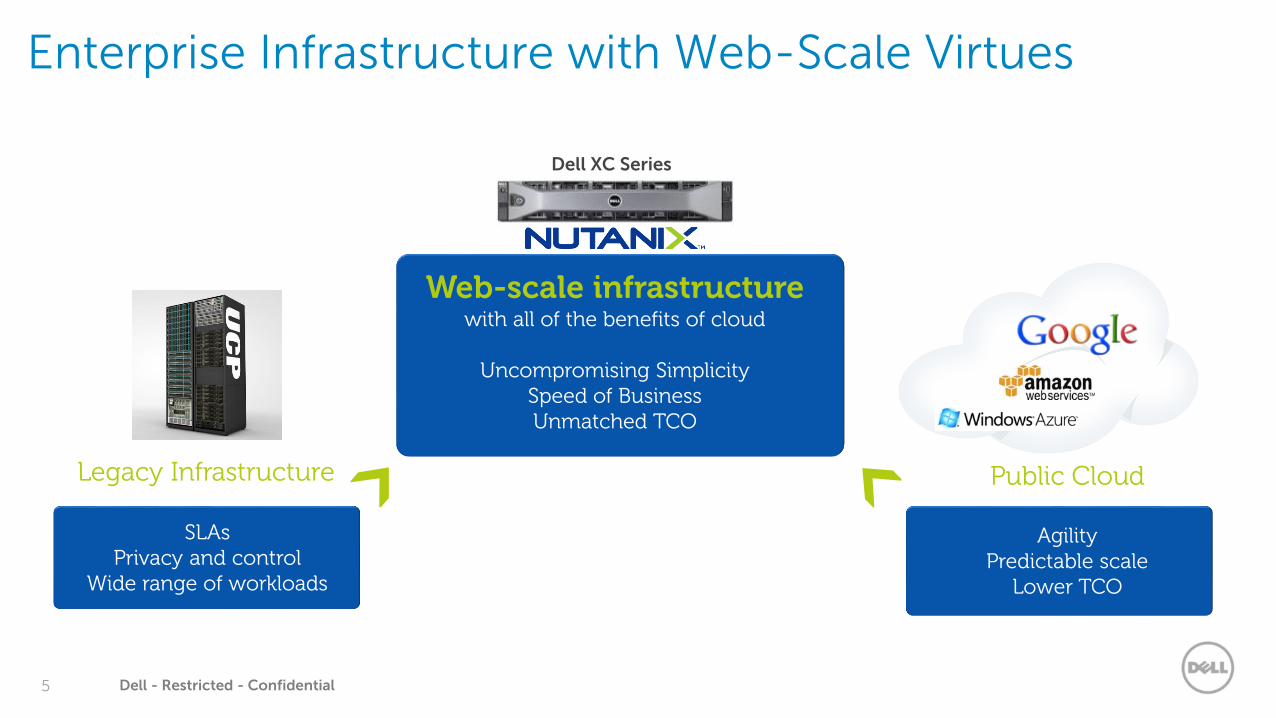
Enterprise Infrastructure with Web-Scale Virtues
AgilityPredictable scale
Lower TCO
Public Cloud
Web-scale infrastructure with all of the benefits of cloud
Uncompromising SimplicitySpeed of BusinessUnmatched TCO
SLAsPrivacy and control
Wide range of workloads
Legacy Infrastructure
Dell XC Series
Dell - Restricted - Confidential6
Storage
Network
SAN
Scale-out
Servers
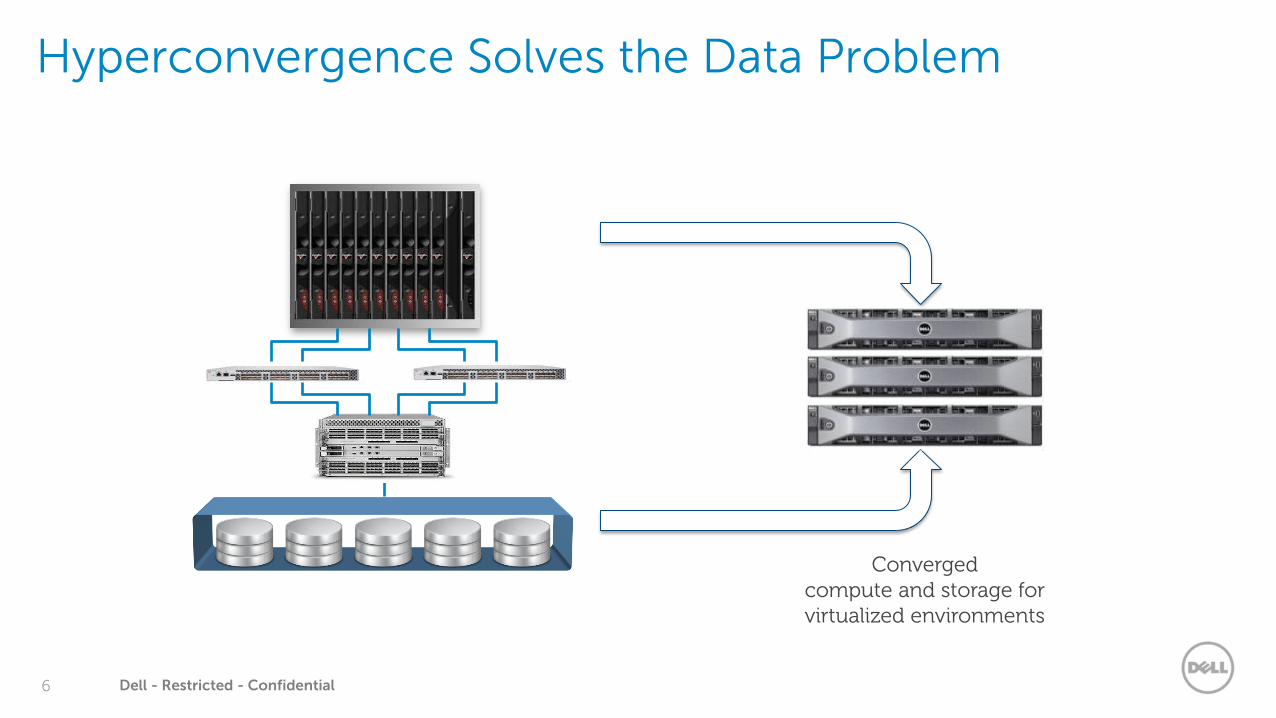
Hyperconvergence Solves the Data Problem
Converged compute and storage for virtualized environments

Dell - Restricted - Confidential7
Nutanix Choice: Invisible Infrastructure on Dell XC
DELL, Cisco, Arista, Brocade, Avaya
ESXi
…
Nutanix
Hyper-V
Cisco, Arista, Brocade, Avaya
HP, Cisco
NetApp, EMC
Qlogic, Emulex
VMware, MSFT, Redhat
Brocade, Cisco
…KVMAHV

Dell - Restricted - Confidential8
Web-Scale Foundation
Distributed Data, Metadata and Services + Always-on Operation
Enterprise Storage
Snapshots, clones, deduplication, compression, locality, tiering, caching, balancing
Data Protection
Converged local backups, remote backups + multi-site DR, backup to cloud, continuous availability
Security
Security development lifecycle, custom STIG, data at rest encryption, two-factor authentication
Resilience
Data path redundancy, tunable redundancy, availability domains, data integrity checks

Dell - Restricted - Confidential9
Linear Scale-Out Architecture
XC630-10Balanced compute and storage
XC730-12CStorage only
10G
bp
s E
the
rne
tIOPS Storage
XC630-10
XC630-10
XC730-12C

Dell - Restricted - Confidential10
Challenges of Legacy Virtualization in a SAN World
LUN-centric Storage
Virtualized Computing
Hypervisors have taken on data services that
belong in storage
VM-centric Data Services
Hypervisor
Storage
Dell - Restricted - Confidential12
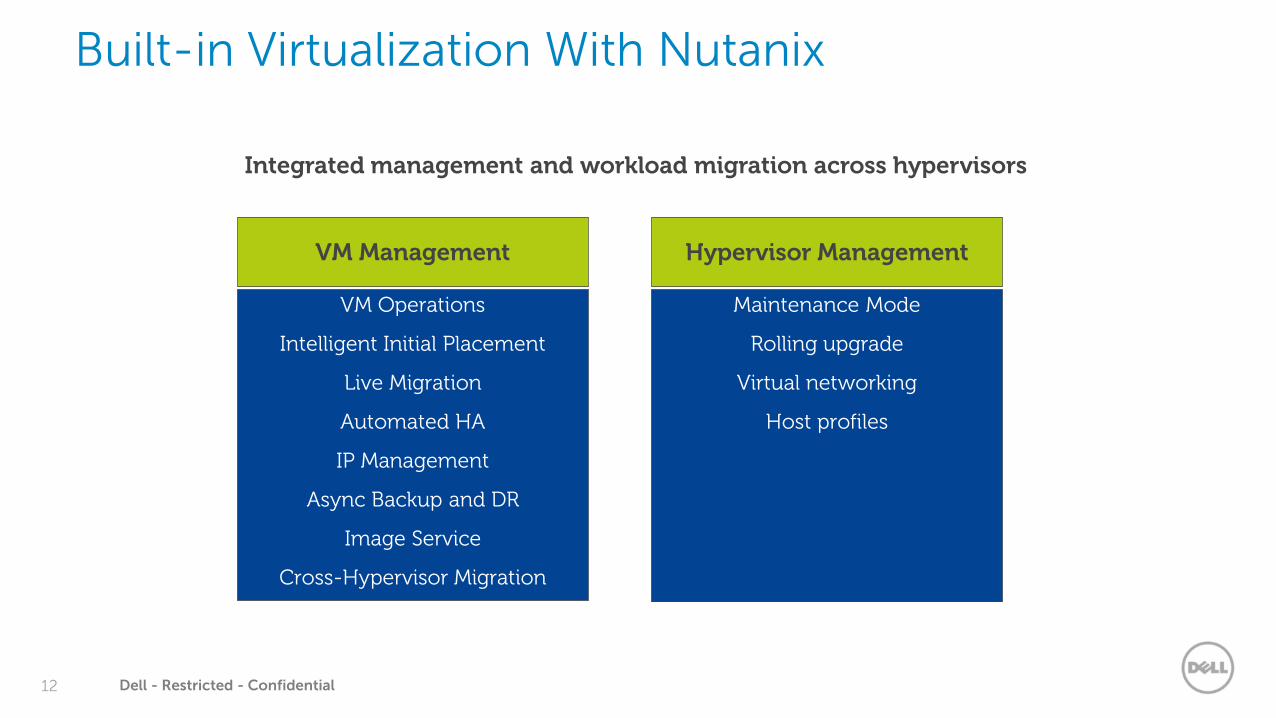
Built-in Virtualization With Nutanix
Integrated management and workload migration across hypervisors
VM Operations
Intelligent Initial Placement
Live Migration
Automated HA
IP Management
Async Backup and DR
Image Service
Cross-Hypervisor Migration
Maintenance Mode
Rolling upgrade
Virtual networking
Host profiles
Hypervisor ManagementVM Management

Dell - Restricted - Confidential13
X C P
NUTANIX
Invisible Infrastructure
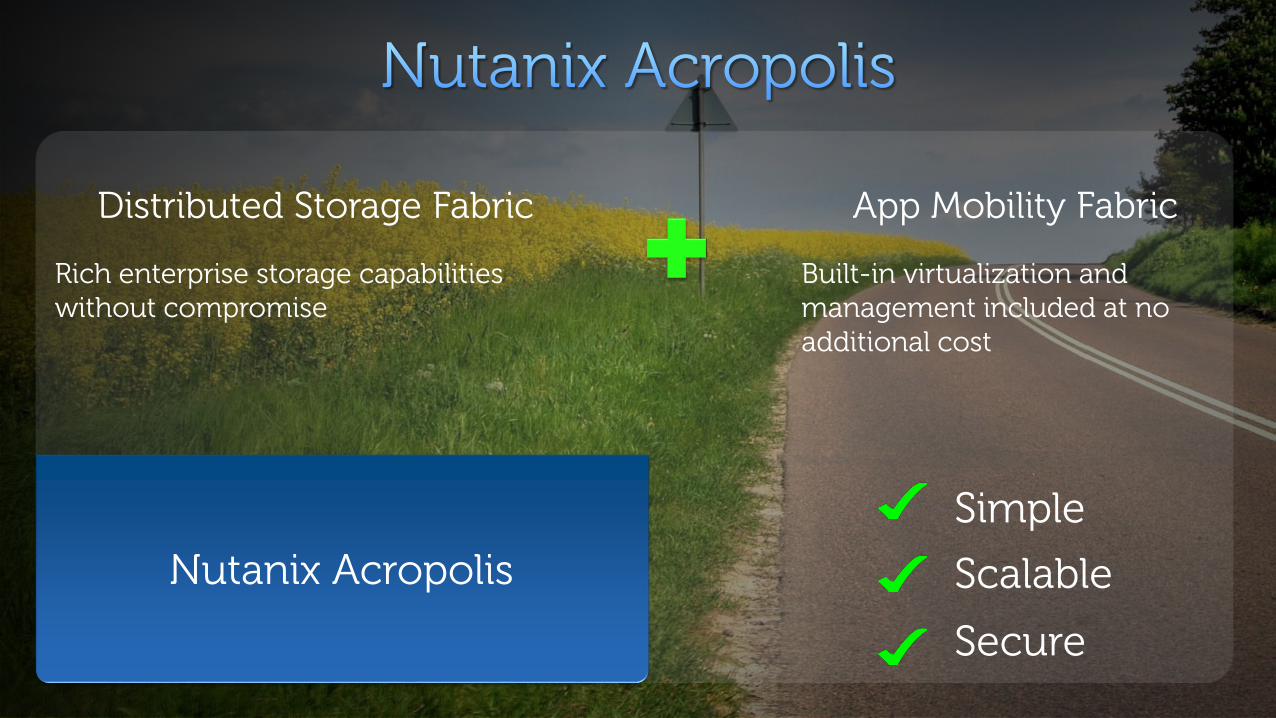
Nutanix Acropolis
Nutanix Prism
Turnkey infrastructure platform that converges compute, storage and virtualization to run any application, at any scale
Comprehensive management solution that radically simplifies datacenter storage and virtualization operations
Dell - Restricted - Confidential14
Distributed Storage Fabric
Rich enterprise storage capabilities without compromise
App Mobility Fabric
Built-in virtualization and management included at no additional cost
Simple
Secure
ScalableNutanix Acropolis

Dell - Restricted - Confidential15
Nutanix Web-Scale Architecture
Eliminates SAN and NAS
arrays
Tier 1 Workloads(running on all nodes)
Nutanix Controller VM(one per node)
Node 2
VM VM VM CVM
X86
Node N
VM VM VM CVM
X86
Node 1
VM VM VM CVM
X86
Local + Remote(Flash + HDD)
Distributed Storage Fabric
intelligent tiering, VM-centric management and more…
Snapshots Clones Compression Deduplication
ESXi
Acropolis App Mobility Fabric
AHV Hyper-V ESXi AHV Hyper-V ESXi AHV Hyper-V
Workload Mobility and Hypervisor
Choice
Locality Tiering DR Resilience
Dell - Restricted - Confidential16
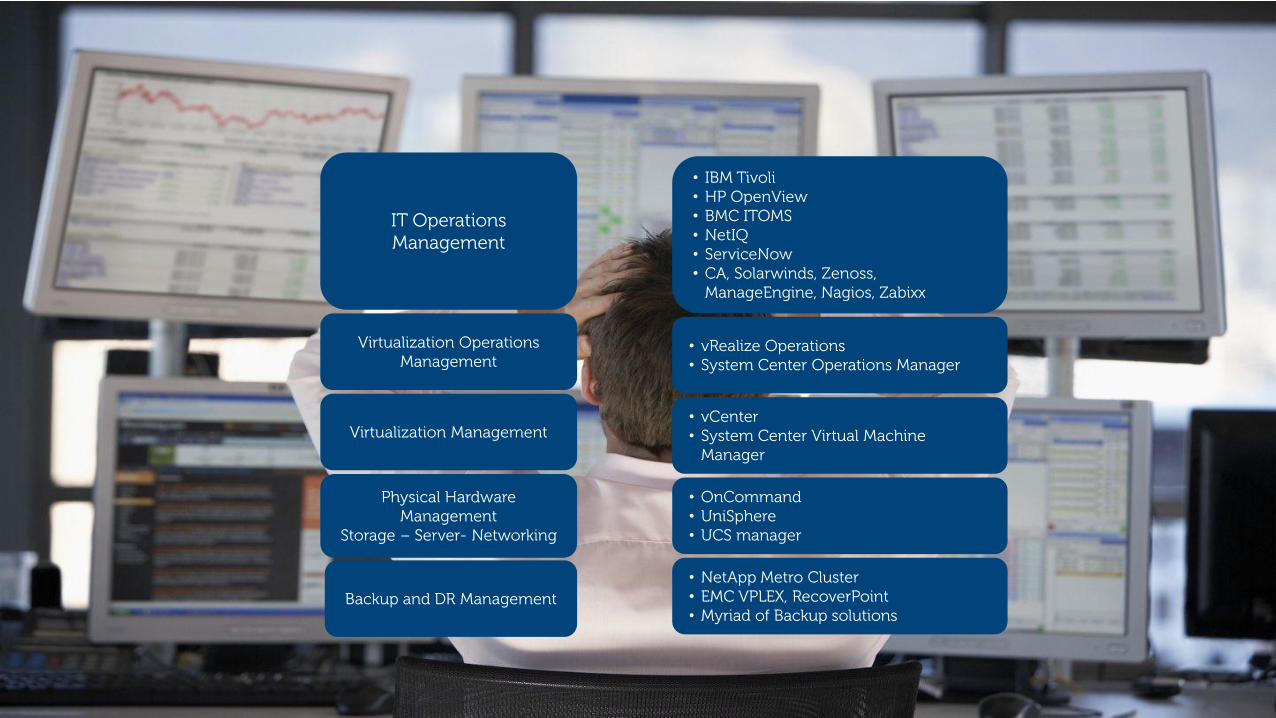
Backup and DR Management
Physical Hardware Management
Storage – Server- Networking
Virtualization Management
Virtualization Operations Management
IT Operations Management
• NetApp Metro Cluster• EMC VPLEX, RecoverPoint• Myriad of Backup solutions
• OnCommand• UniSphere• UCS manager
• vCenter• System Center Virtual Machine
Manager
• vRealize Operations• System Center Operations Manager
• IBM Tivoli• HP OpenView• BMC ITOMS• NetIQ• ServiceNow• CA, Solarwinds, Zenoss,
ManageEngine, Nagios, Zabixx
Dell - Restricted - Confidential17
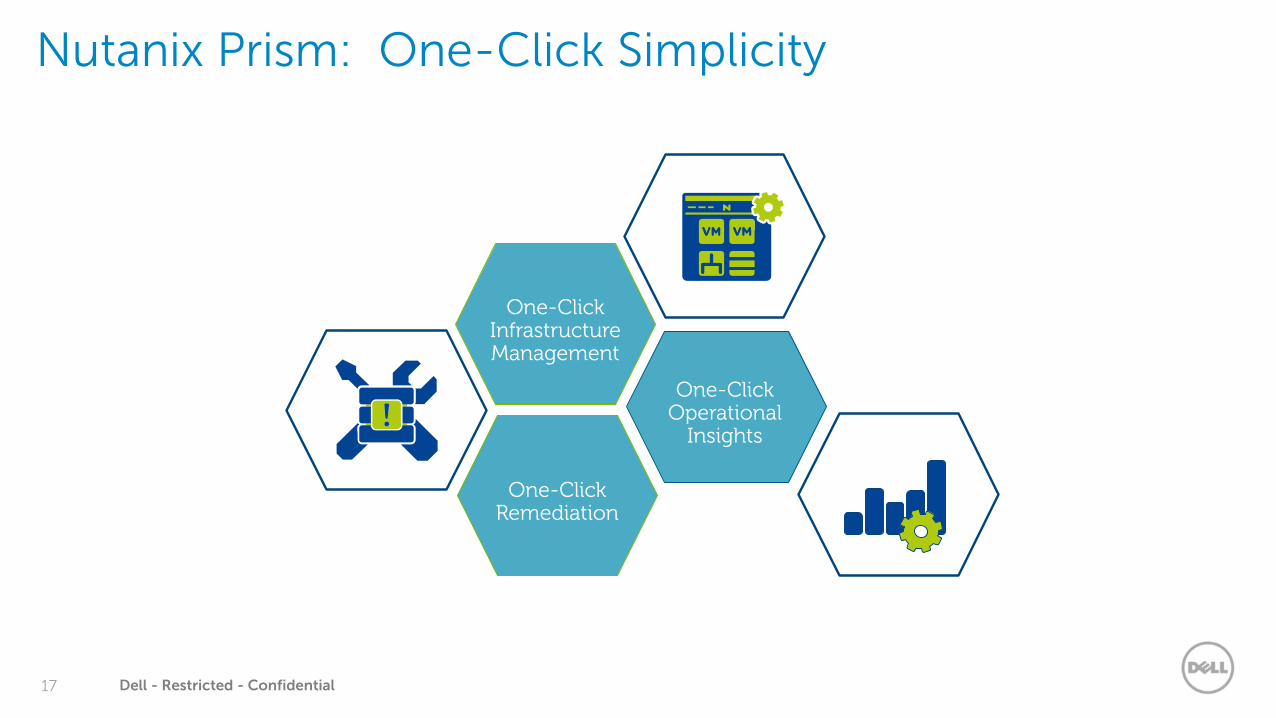
One-Click Operational
Insights
One-Click Infrastructure Management
One-Click Remediation
Nutanix Prism: One-Click Simplicity

Dell - Restricted - Confidential18
• Storage Management
• Cluster Management
• VM Management
• Network Management
One-click Infrastructure Management
• Proactive Alert Analysis
• Service Impact Analysis
• Intelligent Root Cause Analysis
• Remediation Advisor
One-click Remediation
• Capacity Behavior Trends
• Capacity Optimization Advisor
• What-if Analysis
• Customizable Dashboards
One-click Operational Insights
Simplified Datacenter Management

Dell - Restricted - Confidential19
Dell and Nutanix Converge on Datacenter Efficiency
Q3 2015
XC 2.1 products announced at .NEXT
2013
Initial discussions between Dell and Nutanix execs
Q2 2015
XC 2.0 on 13G platform begin shipping
June 2014Partnership and product
strategy announced
Dell – Nutanix Partnership
Q4 2014 First XC appliances ship on 12G server platform
• XC Series 2.1• Storage node• GPU support• Nutanix
Acropolis Hypervisor
Q4 2015
XC 2.1 products Start Shipping; XC2.2 Announced
XC Series 2.2 4 node in 2U appl.All flash applianceSelf-encrypting drives
• Nutanix Partnership• XC Series Announced
• XC Series 1.012G Nodes • XC Series 2.0
13G Nodes
Dell - Restricted - Confidential20
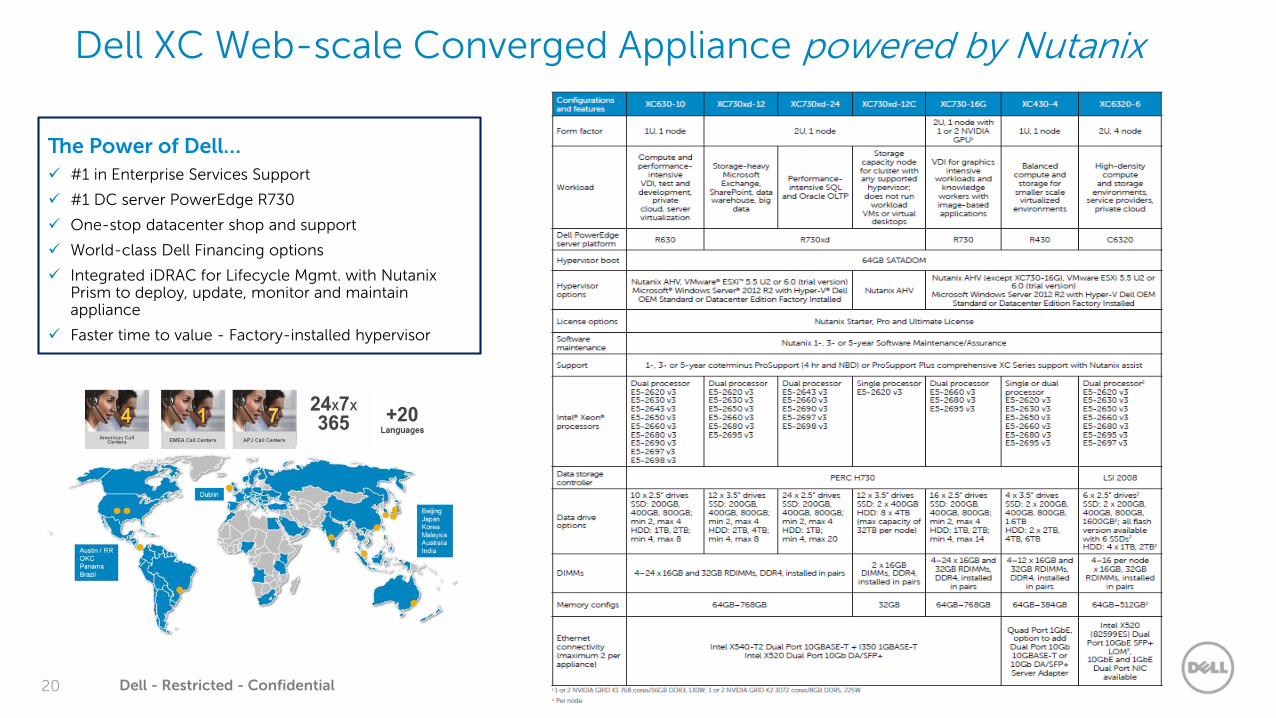
Dell XC Web-scale Converged Appliance powered by Nutanix
The Power of Dell…
#1 in Enterprise Services Support
#1 DC server PowerEdge R730
One-stop datacenter shop and support
World-class Dell Financing options
Integrated iDRAC for Lifecycle Mgmt. with Nutanix Prism to deploy, update, monitor and maintain appliance
Faster time to value - Factory-installed hypervisor

Dell - Restricted - Confidential21
Why Dell XC Appliances Powered by Nutanix?
Bringing simplicity, scale and efficiency to enterprises through web-scale converged infrastructure
– Industry-leading x86 server platform helps reduce TCO and improve system lifecycle
management (iDRAC)
– Preconfigured, validated and tested solutions reduce risk and time-to-value
– Global capabilities for supply chain, deployment, support and finance improves product
availability and quality assurance
– Tight integration with Nutanix at all levels with a full PM team brings latest Nutanix
software and updates from Nutanix Portal

Dell - Restricted - Confidential22
Dell XC Series: Common Use Cases/Workloads
Remote/Branch Office
Enterprise Applications
Disaster Recovery
Virtual applications thrive on Dell XC Series!
Powered by
Server Virtualization
XC
Private Cloud
XC
Virtual Desktop
Infrastructure
XC
Acropolis
Acropolis

Dell - Restricted - Confidential23
Nutanix is Leader in Gartner MQ for Integrated Systems
ONLY hyperconverged Leader and remains most visionary YTY
Complete infrastructure co. providing customers flexibility of choice of hypervisors and cloud usage
Gained market credibility and established a worldwide presence
The Acropolis scale-out architecture along with the ability to scale compute & storage independently, enables users to grow Nutanix deployments incrementally to meet application needs
1750 customers
Over 70 countries
6 continents
Founded in 2009
IDC declares Nutanix dominant leader in hyper-converged assessment with 52% market share!
1H 2014
“The company is taking advantage of its early success and customer knowledge to a continued shift into larger organizations, new geographic markets, and additional mission-critical workloads.”
“Leading position in mindshare, as well as market share.”
“Nutanix systems have diversified from targeted or specialized workloads like VDI to Tier 1 applications and highly virtualized general business workloads like SAP, Oracle, Microsoft Exchange, SQL Server, SharePoint, Splunk, and Unified Communications.”
Dell is teaming with a Leader, Nutanix delivering XC Series
Dell - Restricted - Confidential24
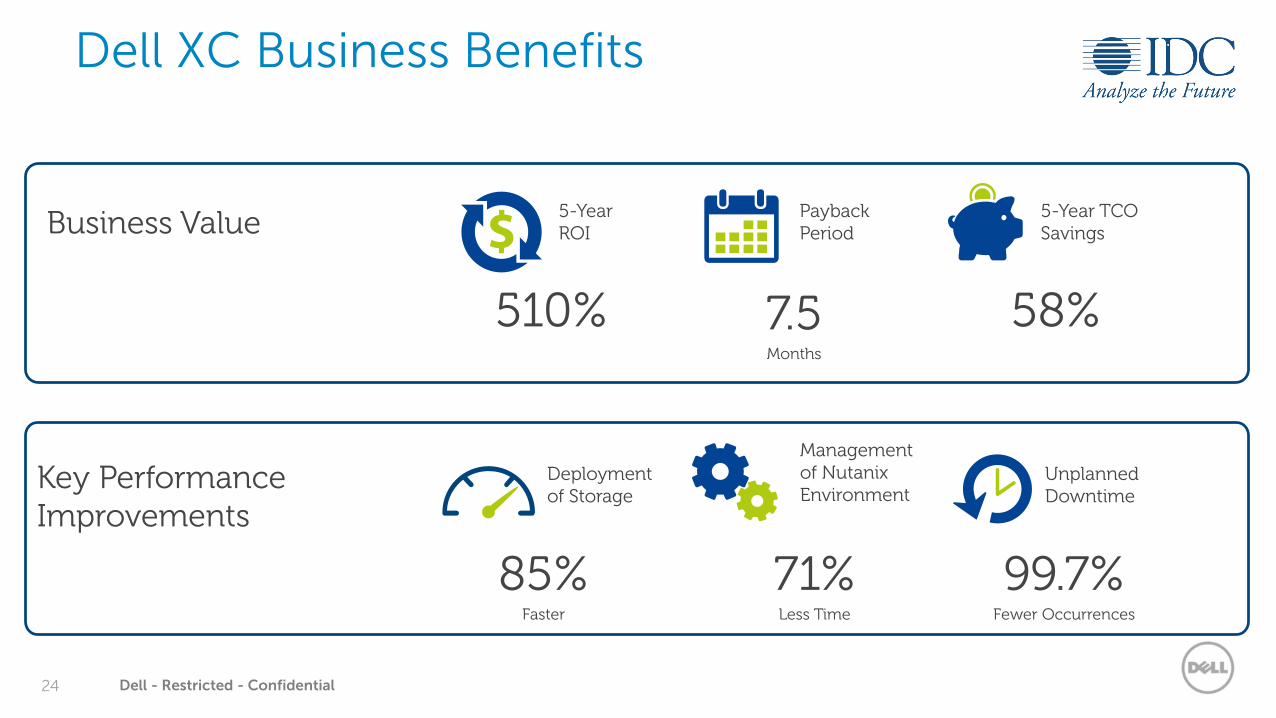
5-YearROI
510%
PaybackPeriod
7.5Months
5-Year TCOSavings
58%
Management of Nutanix Environment
71%Less Time
UnplannedDowntime
99.7%Fewer Occurrences
Deploymentof Storage
85%Faster
Key Performance Improvements
Business Value
Dell XC Business Benefits

Dell - Restricted - Confidential25
Faster Time to Value with Dell XC
Compared to traditional VDI solutions
6X Fastertime to value
Lower cost than traditional solutions for desktop virtualization
1U or 2U Compute and Storage Solution powered
by Nutanix software
27%
Source: Wikibon.org
Business agility• Pay as you grow, scale-out expansion.
Enterprise reliability
• Backed by Dell and based on proven
PowerEdge servers and fault-
tolerant software architecture.
Simple and efficient
• Preconfigured solution with
flexible ratios of compute and
storage.
Highly scalable compute and storage solution for VDI, private cloud, test &
dev, and big data
VMware, Microsoft, Hadoop and
Splunk reference architectures

Dell - Restricted - Confidential26
Dell XC – Customer Wall of FamePublic Sector
Manufacturing
Retail
Education
Healthcare
Technology
Financial Services
Energy

Dell - Restricted - Confidential27
Williams Grand Prix EngineeringOne of the world’s leading Formula 1 racing teams
• Physical rack space savings of ~40%
• Reduced administration time by 50%
• Improved decision making by quicker VDI application performance
• Simple installation and dismantle trackside –Quick time to value
Benefits• Performance and scalability challenges
• Administrator bandwidth reached
• Existing NetApp SAN resiliency issues
• Slow decision making, limited value for trackside team
Challenges
“It was so far beyond our previous architecture. We simulated different workloads and got 10–11 times the throughput we were getting on our NAS.”
- Williams Team Member
Download the case study here…

Dell - Restricted - Confidential28
Dell XC Series helps your business by…
Making IT infrastructure invisible allowing you to focus on your business
Providing a Future-ready datacenter for agility reacting to market conditions
Lowering TCO by making it easy to deploy and manage infrastructure
Enabling IT shift from operation to innovation

Dell - Restricted - Confidential29
DEMO
Confidential
Thank you.

Dell - Restricted - Confidential31
BACKUP
Specs

Dell - Restricted - Confidential32
XC430-4 Flexible Configurations(Starter/ROBO Workloads)
XC430-4 with 1/2 Processor Sockets, 4x3.5” Data, 12 DIMMs, Short Depth <24” (vs. 30”) Rack Flange to Chassis Rear Wall CPU Options – Single or Dual CPU
– E5-2620v3 – 6 core 2.4/3.2GHz– E5-2630v3 – 8 core 2.4/3.2GHz– E5-2650v3 – 10 core 2.3/3.0GHz– E5-2660v3 – 10 core 2.6GHz– E5-2680v3 – 12 core 2.5/3.3GHz– E5-2695v3 – 14 core 2.3GHz
Memory Option – Up to 8 (Single CPU) or 12 (Dual CPU) DIMMs, DDR4– 64GB – 384GB (4-12) DIMMs installed in pairs– 16GB RDIMMS and 32 GB RDIMMS
Hypervisor Options – ESXi 6.0, Hyper-V, Acropolis Hypervisor
Drive Options – 4 x 3.5” slots for data drives– SSD – 2 x 200GB, or 400GB, or 800GB and 800GB– HDD – 2 X 2TB or 4TB or 6TB
NIC Options – Quad Port 1GbE, Add Dual Port 10Gb 10GbaseT or Dual Port 10Gb DA/SFP+ Server Adapter
4 x 3.5 inch short depth configuration.

Dell - Restricted - Confidential33
XC630-10 Flexible Configurations(Compute Intensive/ROBO/VDI)
XC630-10 with 2 CPU Sockets, SATADOM Boot, 10x2.5” Data, 24 DIMMs, 145W CPUCPU Options
– E5-2620v3 – 6 core 2.4/3.2GHz (ROBO)
– E5-2643v3 – 6 core 3.4GHz
– E5-2630v3 – 8 core 2.4/3.2GHz
– E5-2650v3 – 10 core 2.3/3.0GHz
– E5-2660v3 – 10 core 2.6GHz
– E5-2680v3 – 12 core 2.5/3.3GHz
– E5-2690v3 – 12 core 2.6/3.5GHz
– E5-2697v3 – 14 core 2.6GHz
– E5-2698v3 – 16 core 2.3/3.6GHz
Memory Option – 24 DIMMs, DDR4
– 64GB – 768GB/4-24 DIMMs installed in pairs
– 16GB RDIMMS and 32 GB RDIMMS
Hypervisor Options – ESXi 6.0, Hyper-v, Acropolis Hypervisor
Drive Options – 10 x 2.5” slots
– SSD – Min 2 – Max 4 - 200GB, 400GB and 800GB
– HDD – Min 4 – Max 8 - 1TB –2TB
10 x 2.5 inch configuration.
Underlined features are New!

Dell - Restricted - Confidential34
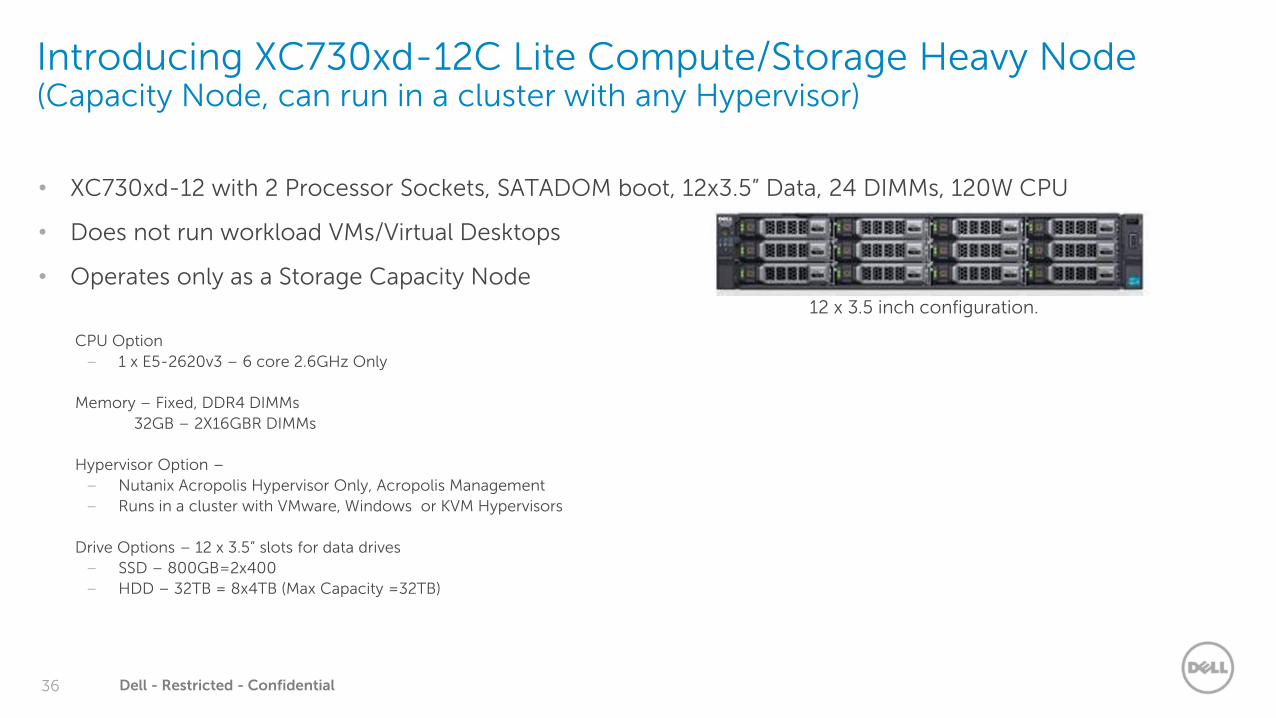
Introducing XC730xd-12C Lite Compute/Storage Heavy Node(Capacity Node, can run in a cluster with any Hypervisor)
• XC730xd-12 with 2 Processor Sockets, SATADOM boot, 12x3.5” Data, 24 DIMMs, 120W CPU
• Does not run workload VMs/Virtual Desktops
• Operates only as a Storage Capacity Node
CPU Option
– 1 x E5-2620v3 – 6 core 2.6GHz Only
Memory – Fixed, DDR4 DIMMs
32GB – 2X16GBR DIMMs
Hypervisor Option –
– Nutanix Acropolis Hypervisor Only, Acropolis Management
– Runs in a cluster with VMware, Windows or KVM Hypervisors
Drive Options – 12 x 3.5” slots for data drives
– SSD – 800GB=2x400GB
– HDD – 32TB = 8x4TB (Max Capacity =32TB)
12 x 3.5 inch configuration.

Dell - Restricted - Confidential35
XC730xd-24 Flexible Configurations(Performance Intensive/DB: MS SQL, Oracle)XC730xd-24 with 2 CPU Sockets, 2x2.5” Boot, 20x2.5” Data, 24 DIMMs, 145W CPU
CPU Options (Target- High-end)
– E5-2643v3 – 6 core 3.4GHz
– E5-2660v3 – 10 core 2.6GHz
– E5-2690v3 – 12 core 2.6/3.5GHz
– E5-2697v3 – 14 core 2.6GHz
– E5-2698v3 – 16 core 2.3/3.6GHz
Memory Option – Up to 24 DIMMs, DDR4
– 64GB – 768GB/4-24 DIMMs installed in pairs
– 16GB RDIMMS and 32 GB RDIMMS
Hypervisor Options – ESXi 6.0, Hyper-v, KVM
Drive Options – 24 x 2.5” slots for Data Drives
– SSD – Min 2 – Max 4/200GB, 400GB and 800GB
– HDD – Min 4 – Max 20 (Max Capacity Config: 32TB)/1TB, 2TB
35
24 x 2.5 inch configuration.
Underlined features are New!
Dell - Restricted - Confidential36
Introducing XC730xd-12C Lite Compute/Storage Heavy Node(Capacity Node, can run in a cluster with any Hypervisor)
• XC730xd-12 with 2 Processor Sockets, SATADOM boot, 12x3.5” Data, 24 DIMMs, 120W CPU
• Does not run workload VMs/Virtual Desktops
• Operates only as a Storage Capacity Node
CPU Option
– 1 x E5-2620v3 – 6 core 2.6GHz Only
Memory – Fixed, DDR4 DIMMs
32GB – 2X16GBR DIMMs
Hypervisor Option –
– Nutanix Acropolis Hypervisor Only, Acropolis Management
– Runs in a cluster with VMware, Windows or KVM Hypervisors
Drive Options – 12 x 3.5” slots for data drives
– SSD – 800GB=2x400GB
– HDD – 32TB = 8x4TB (Max Capacity =32TB)
12 x 3.5 inch configuration.
Dell - Restricted - Confidential37
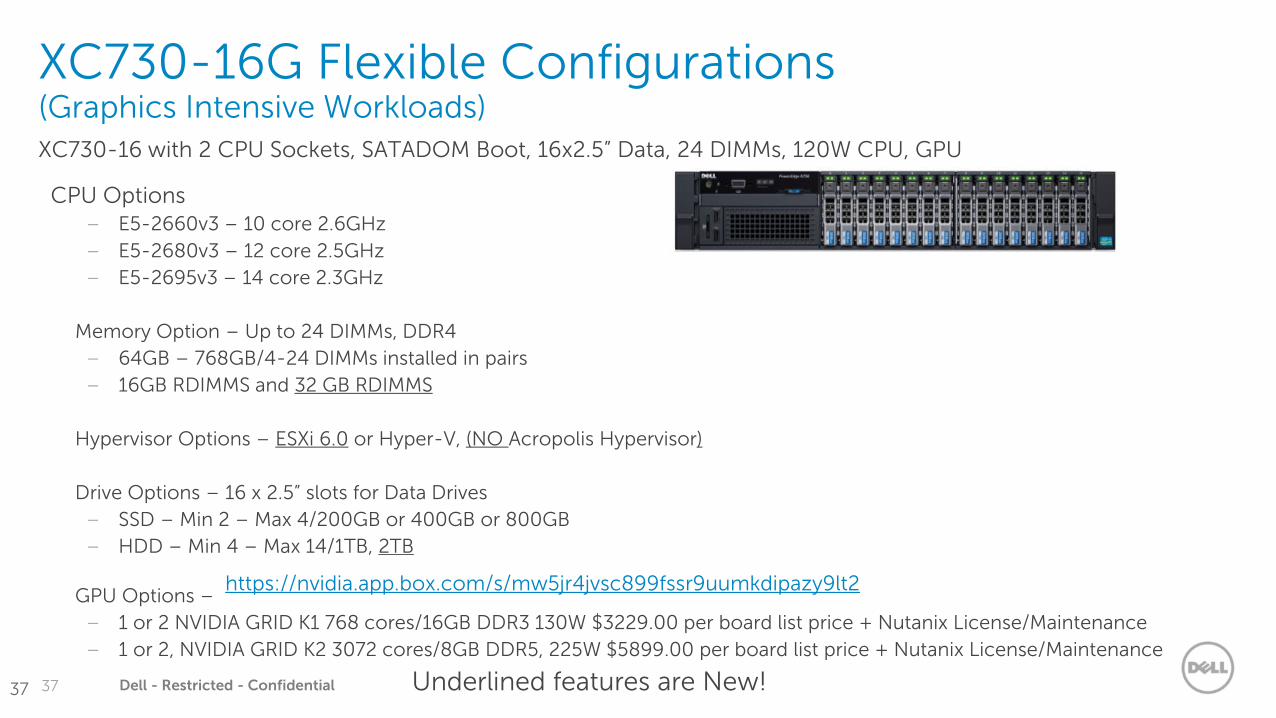
XC730-16G Flexible Configurations(Graphics Intensive Workloads)XC730-16 with 2 CPU Sockets, SATADOM Boot, 16x2.5” Data, 24 DIMMs, 120W CPU, GPU
CPU Options– E5-2660v3 – 10 core 2.6GHz
– E5-2680v3 – 12 core 2.5GHz
– E5-2695v3 – 14 core 2.3GHz
Memory Option – Up to 24 DIMMs, DDR4
– 64GB – 768GB/4-24 DIMMs installed in pairs
– 16GB RDIMMS and 32 GB RDIMMS
Hypervisor Options – ESXi 6.0 or Hyper-V, (NO Acropolis Hypervisor)
Drive Options – 16 x 2.5” slots for Data Drives
– SSD – Min 2 – Max 4/200GB or 400GB or 800GB
– HDD – Min 4 – Max 14/1TB, 2TB
GPU Options –
– 1 or 2 NVIDIA GRID K1 768 cores/16GB DDR3 130W $3229.00 per board list price + Nutanix License/Maintenance
– 1 or 2, NVIDIA GRID K2 3072 cores/8GB DDR5, 225W $5899.00 per board list price + Nutanix License/Maintenance
37 Underlined features are New!
https://nvidia.app.box.com/s/mw5jr4jvsc899fssr9uumkdipazy9lt2

Dell - Restricted - Confidential38
Use CaseVirtual GPU Per-VM Resources
vGPUProfile*
# per GPU**
# per Board
CUDA Cores (Shared)
Frame Buffer
(Dedicated)
Max Displays (2560x1600)
DesignerGRID K280Q
1 2 1536 4GB 4
DesignerGRID K260Q
2 4 1536 2GB 4
Designer/Power User
GRID K240Q
4 8 1536 1GB 2
Designer/Power User
GRID K220Q
8 16 1536 512MB 2
Entry Designer GRID K180Q 1 4 192 4GB 4
Power User GRID K160Q 2 8 192 2GB 4
Power User GRID K140Q 4 16 192 1GB 2
Power User GRID K120Q 8 32 192 512MB 2* K2xxQ profiles based on GRID K2 board with 2 physical GPUs. K1xxQ profiles based on GRID K1 board with 4 physical GPUs** Each physical GPU can be configured to provide a single vGPU profile; individual GPUs on the same GRID board can each be configured separately.
GRID K2
GRID K1
Grid vGPU Profiles
Dell - Restricted - Confidential39
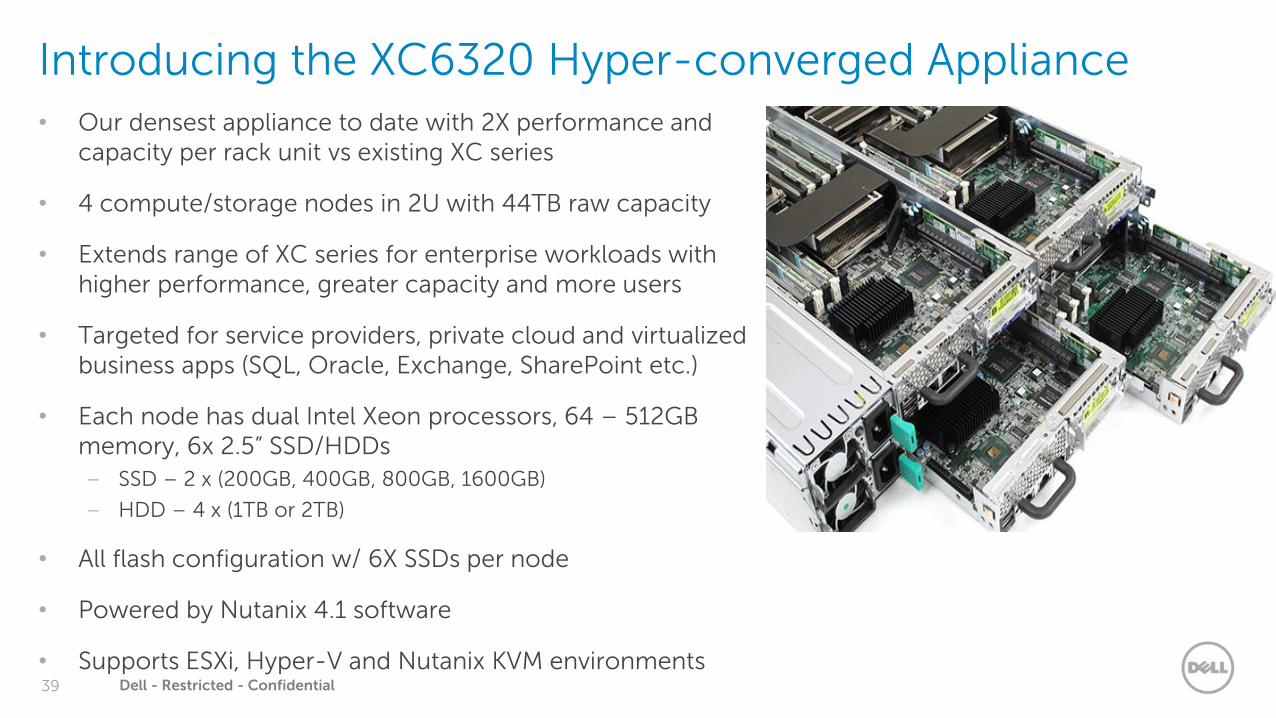
Introducing the XC6320 Hyper-converged Appliance• Our densest appliance to date with 2X performance and
capacity per rack unit vs existing XC series
• 4 compute/storage nodes in 2U with 44TB raw capacity
• Extends range of XC series for enterprise workloads with higher performance, greater capacity and more users
• Targeted for service providers, private cloud and virtualized business apps (SQL, Oracle, Exchange, SharePoint etc.)
• Each node has dual Intel Xeon processors, 64 – 512GB memory, 6x 2.5” SSD/HDDs
– SSD – 2 x (200GB, 400GB, 800GB, 1600GB)
– HDD – 4 x (1TB or 2TB)
• All flash configuration w/ 6X SSDs per node
• Powered by Nutanix 4.1 software
• Supports ESXi, Hyper-V and Nutanix KVM environments

Dell - Restricted - Confidential40
Rear connectors
USB
PSU 1 & 210GbE LOMSFP+ ports 1 &2
iDRAC Sys Mgmt port (RJ45)
Micro USBserial port
VGA port
Power button
Dell - Restricted - Confidential41
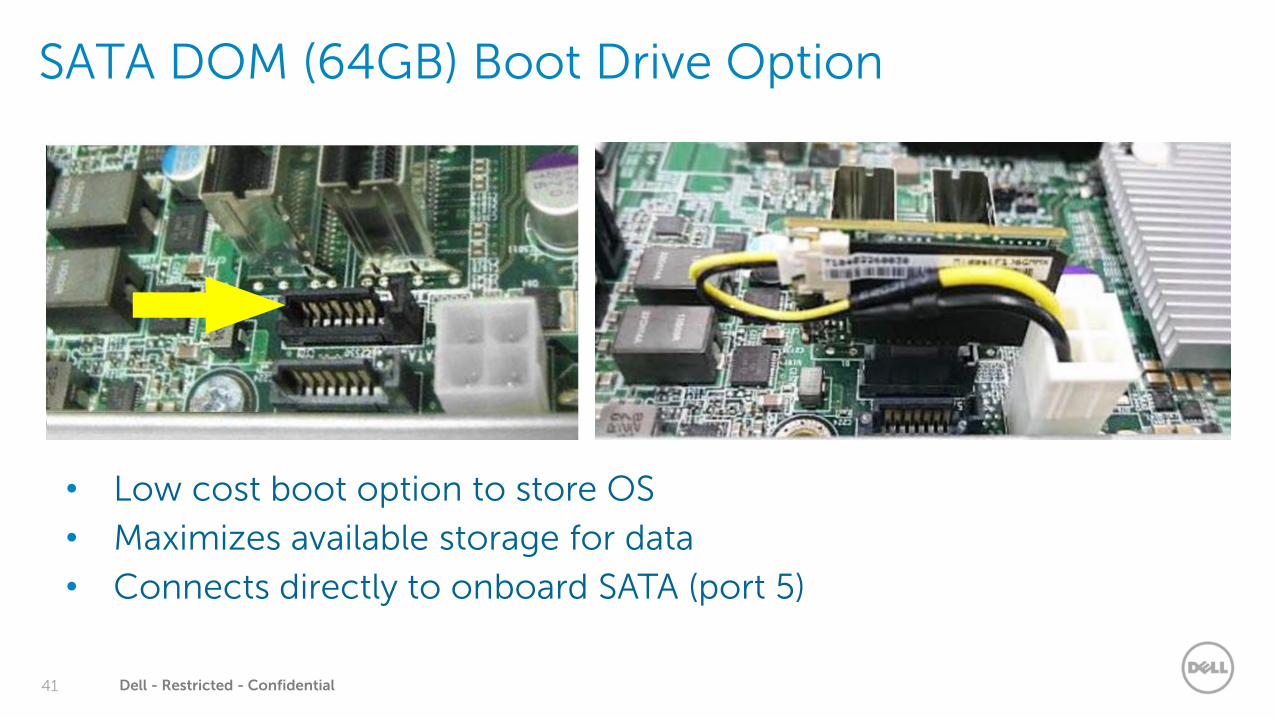
SATA DOM (64GB) Boot Drive Option
• Low cost boot option to store OS
• Maximizes available storage for data
• Connects directly to onboard SATA (port 5)
Dell - Restricted - Confidential42
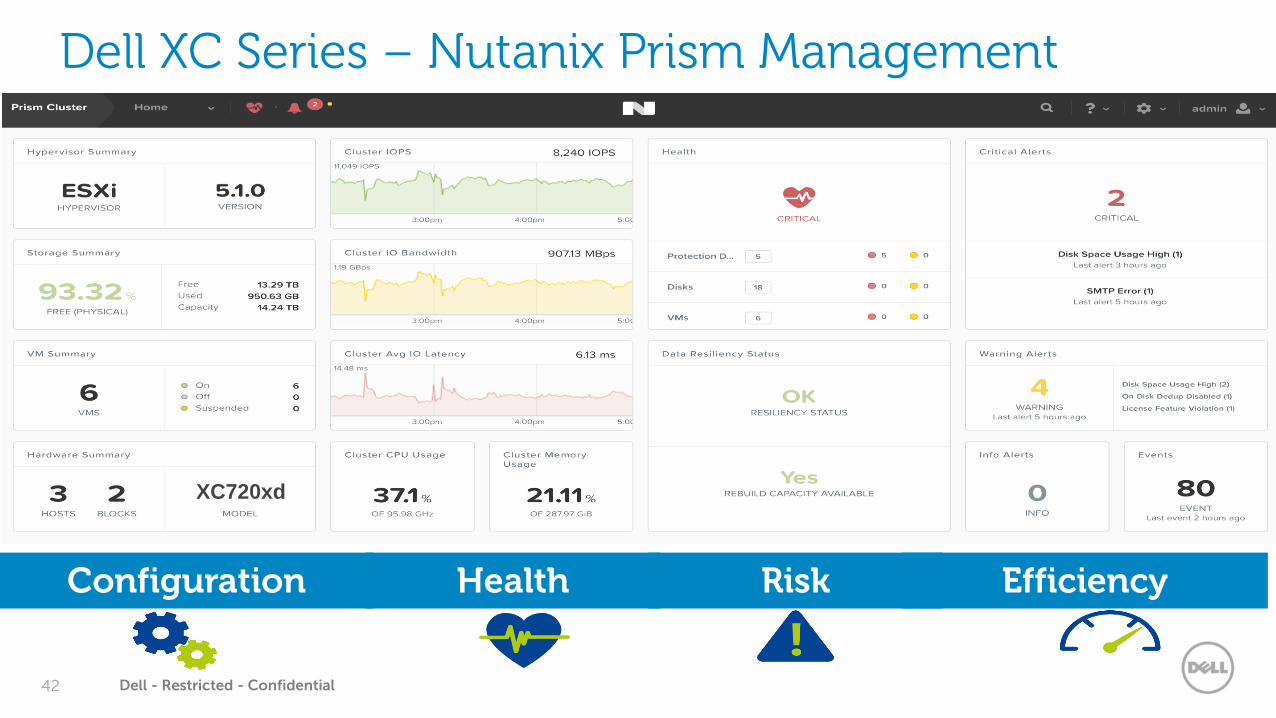
Dell XC Series – Nutanix Prism Management
Configuration Health Risk Efficiency
XC720xd
Dell - Restricted - Confidential43

Document #258075 ©2015 IDC. www.idc.com | Page 1
IDC White Paper | Quantifying the Business Value of Dell XC Powered by Nutanix Software
EXECUTIVE SUMMARY
Years of IT infrastructure advancements have helped to drive out vast amounts of costs
within the datacenter. Technologies like server and storage virtualization, data deduplication,
and flash-based storage systems (to name just a few) have contributed to improvements
of utilization rates, performance, and resiliency for most organizations. Unfortunately,
organizations still struggle with deeply rooted operational inefficiencies related to IT
departments with silos of technology and expertise that lead to higher complexity, limited
scalability, and suboptimal levels of agility. The recent tectonic shifts caused by the rise of
3rd Platform applications that focus on social, mobile, cloud, and big data environments
have amplified the pains associated with these structural inefficiencies. These environments
require new levels of scale, automation, and agility that do not align well with the current
practice of independently buying and managing discrete datacenter resources. Thus we see
an increasing number of companies deploying integrated systems as a way to gain additional
operational benefits provided by standardized systems, centralized management, and
increased levels of automation. Companies have several architectural choices when deploying
integrated systems, but the fastest growing is known as hyperconverged infrastructure.
Hyperconverged solutions provide a new level of convergence through a cluster of shared
nothing, industry-standard systems that utilize software-defined storage constructs to
abstract and pool all resources, which are then dynamically provisioned for all storage and
compute services.
IDC’s interviews with organizations using Nutanix hyperconverged infrastructure solutions
and Dell XC hyperconverged appliances powered by Nutanix software (Dell XC) to run key
business applications highlighted the value they are achieving with these hyperconverged
solutions. IDC projects that, on average, these organizations’ use of IT solutions powered by
Nutanix software will yield total five-year discounted benefits worth $7.85 million and a return
on investment (ROI) of 510% by:
Quantifying the Business Value of Dell XC Powered by Nutanix Software
Sponsored by: Nutanix and Dell
Authors: Matthew Marden Eric Sheppard
August 2015
Business Value HighlightsAverage five-year ROI:
510%Five-year discounted benefits per organization:
$7.85MFive-year TCO savings:
58%Payback period:
7.5 MonthsStorage deployment (faster):
85%Management of Nutanix environment (less time):
71%Reduction in unplanned downtime:
99.7%

Document #258075 ©2015 IDC. www.idc.com | Page 2
IDC White Paper | Quantifying the Business Value of Dell XC Powered by Nutanix Software
The highly virtualized and scale-out nature of hyperconverged infrastructure helps organizations to quickly scale compute and storage resources at a very granular level and with near-zero downtime.
» Serving as a cost-effective and incrementally scalable infrastructure
» Offering an efficient IT infrastructure platform that simplifies infrastructure deployment,
management, and troubleshooting
» Providing a highly resilient infrastructure that supports the business with minimal downtime
» Enabling the business and users with greater IT agility and scalability, faster time to value, and
improved performance of key business applications
Situation OverviewAn organization’s ability to be competitive locally and globally has become inseparable from
decisions made within its datacenter. Today’s IT departments are expected to move quickly with
the businesses they support and ultimately be a key contributor to initiatives designed to improve
a business’ bottom line, expand its revenue streams, or strengthen its relationships with customers.
In short, decisions made within IT departments have never been more important to the broader
business than they are today. Unfortunately, decades-old datacenter practices that have helped
drive down capital costs have also created rigid islands of infrastructure managed by administrators
with narrow areas of expertise. To better align with the rapidly changing needs of their business,
datacenters must adjust from a world with silos of infrastructure-centric decisions to an environment
that enables workload-centric decisions.
Many IT departments are now replacing silos of datacenter infrastructure with fully integrated
systems to better align with the challenges discussed previously. While there are many architectural
choices one can make when moving to integrated systems, hyperconverged infrastructure
deployments are growing faster than any other. This strong market adoption growth can be traced
back to the ability of hyperconverged infrastructure to truly collapse core storage and compute silos
into a cluster of industry-standard servers that are highly virtualized and managed through a single
pane of glass. Hyperconverged solutions help datacenters reduce capital costs by standardizing core
building blocks for compute and storage workloads. They eliminate the need for costly centralized
storage systems and Fibre Channel switches, all of which must be purchased, powered, cooled,
and managed independently. But savings do not stop there. The highly virtualized and scale-out
nature of hyperconverged infrastructure helps organizations to quickly scale compute and storage
resources at a very granular level and with near-zero downtime. Thus IT departments can eliminate
the costly practice of overprovisioning. In short, hyperconverged solutions help improve datacenters
so that infrastructure can be purchased, deployed, managed, upgraded, and expanded far more
efficiently than traditional architectures. Support for multi-hypervisors and a robust set of enterprise-
class applications helps ensure hyperconverged solutions can be leveraged within the most
demanding datacenters.

Document #258075 ©2015 IDC. www.idc.com | Page 3
IDC White Paper | Quantifying the Business Value of Dell XC Powered by Nutanix Software
Nutanix Acropolis is a scale-out data fabric for storage, compute, and virtualization. Acropolis combines the attributes of software-defined storage with built-in virtualization to create a turnkey hyperconverged infrastructure solution that can run any application and scale to meet the needs of today’s demanding applications.
Nutanix Xtreme Computing Platform As an early pioneer of this space, Nutanix has amassed a large set of enterprise customers with
its Xtreme Computing Platform (XCP). Made up of two product families, Nutanix Acropolis and
Nutanix Prism, XCP is designed to enable application infrastructure independence through its
app mobility feature, native virtualization, and search capability. An overview of the software
and hardware components of XCP are outlined in the sections that follow.
XCP Software
» Acropolis. Nutanix Acropolis is a scale-out data fabric for storage, compute, and
virtualization. Acropolis combines the attributes of software-defined storage with built-in
virtualization to create a turnkey hyperconverged infrastructure solution that can run
any application and scale to meet the needs of today’s demanding applications. Nutanix
Acropolis is made up of three foundational components:
•Distributed Storage Fabric. This component provides the core data services
such as the distributed file system, data deduplication, automated tiering, and
snapshots. It supports multiple storage protocols such as NFS and iSCSI, which is
an important capability for customers looking to unify a large number of disparate
workloads onto a single platform.
• App Mobility Fabric. The Acropolis App Mobility Fabric provides virtual machine
(VM) placement, VM migration, and VM conversion, as well as cross-hypervisor
high-availability and integrated disaster recovery.
•Acropolis Hypervisor. While the Distributed Storage Fabric fully supports
traditional hypervisors such as VMware vSphere and Microsoft Hyper-V, Acropolis
also includes a native hypervisor based on the well-known Linux KVM hypervisor
that provides enhanced security and self-healing capabilities based on SaltStack
and enterprise-grade VM management. Acropolis Hypervisor will be the first
hypervisor to plug into the App Mobility Fabric.
» Prism. Prism is a management solution from Nutanix that gives administrators an easy
way to manage their virtual environments. Prism greatly simplifies managing Nutanix
environments by combining several aspects of datacenter management into a single
consumer-grade solution. Prism leverages machine learning technology to mine large
volumes of system data and generate actionable insights for optimizing all aspects of
virtual infrastructure management.

Document #258075 ©2015 IDC. www.idc.com | Page 4
IDC White Paper | Quantifying the Business Value of Dell XC Powered by Nutanix Software
IDC asked interviewees, which included IT managers and business decision makers at these organizations, a variety of quantitative and qualitative questions about the impact of their use of Nutanix solutions on their operations, businesses, and costs.
Hardware
Customers have the option of purchasing Nutanix appliances (NX Series) or Dell XC Web-scale
appliances (XC Series). Both series offer different resource configurations that are optimized for
a wide range of workload profiles. While all systems come with compute, memory, and storage
resources, customers can build clusters with a mix of configurations within the same series.
Nutanix has partnered with Dell to create a hyperconverged solution built with Nutanix software
and Dell hardware. The result is Dell’s XC Web-scale converged appliances. These systems
became generally available during the fourth calendar quarter of 2014.
The Business Value of Dell XCStudy Demographics
IDC interviewed 13 organizations for this study: 10 organizations using Nutanix XCP solutions
and 3 organizations using Dell XC Web-scale appliances (collectively, “Nutanix solutions”)
in April and May 2015. IDC asked interviewees, which included IT managers and business
decision makers at these organizations, a variety of quantitative and qualitative questions
about the impact of their use of Nutanix solutions on their operations, businesses, and costs.
These organizations either migrated workloads from legacy traditional three-tier (server,
storage, network) datacenter infrastructures or deployed new workloads on Nutanix solutions.
Interviewed organizations ranged from service providers with fewer than 100 employees to
larger organizations with up to 18,000 employees, with an average employee base of 4,094.
There was also diversity in terms of business application bases, with an average of 185 and a
range from 12 to 1,500 (see Table 1).
Demographics of Interviewed Organizations Average Median Range
Number of employees 4,094 1,500 45 to 18,000
Number of IT staff 210 62 2 to 1,500
Number of internal IT users 3,738 1,260 45 to 18,000
Number of business applications 185 40 12 to 1,500
Number of terabytes, total environment (raw) 857 200 20 to 5,120
Countries United States, Canada, the United Kingdom, France, Sweden, Switzerland, Australia
Industries Manufacturing, insurance, financial services, healthcare, automobile racing, government, gaming, retail, service provider
TABLE 1
Source: IDC, 2015

Document #258075 ©2015 IDC. www.idc.com | Page 5
IDC White Paper | Quantifying the Business Value of Dell XC Powered by Nutanix Software
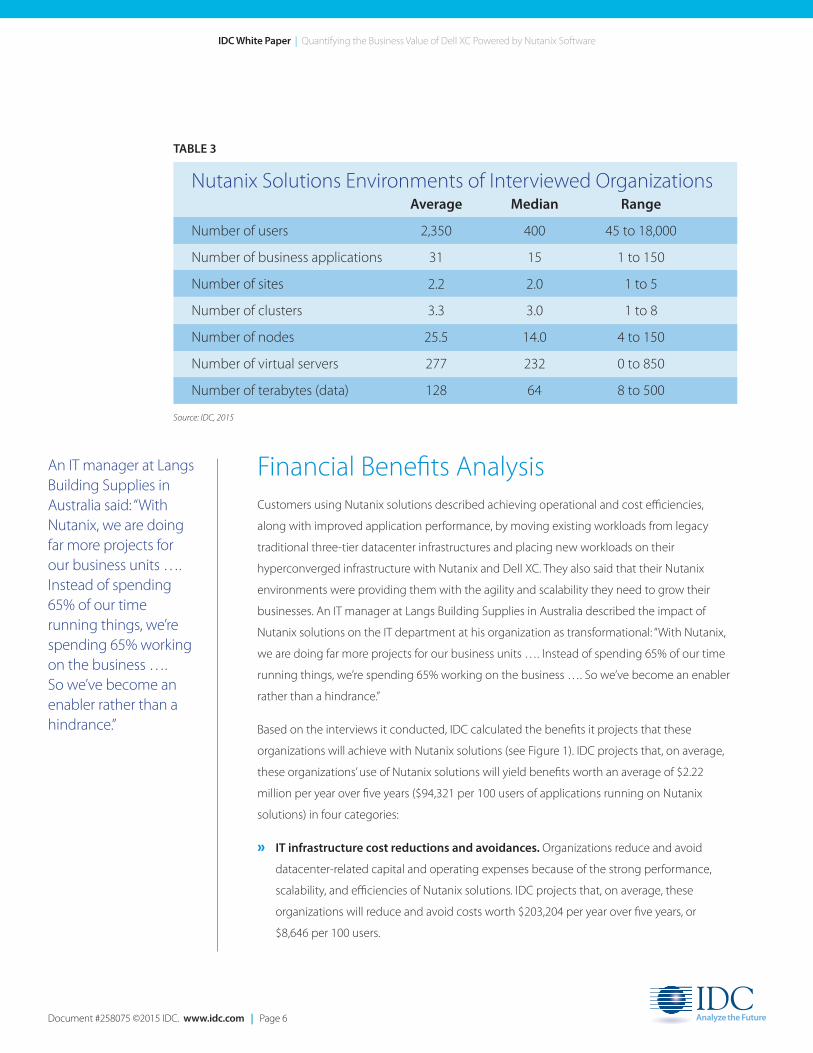
Interviewed organizations range from running all of their business applications on their Nutanix infrastructure to several applications, with several expressing their intention to grow their Nutanix workload environments. On average, these organizations have 2,350 employees using 31 applications and 277 virtual machines with about 128TB of storage running within their Nutanix environments.
Nutanix Workloads and Environments
Customers interviewed for this study are running various workloads on their Nutanix
solutions, and all interviewed organizations have put multiple workloads on Nutanix and
Dell XC. In addition, several organizations noted their intention to expand their Nutanix
environments based on positive results with deployments of Nutanix solutions thus far. Table
2 provides an overview of the workloads and business applications select organizations
interviewed for this study are running on their Nutanix solutions.
Interviewed organizations range from running all of their business applications on their
Nutanix and Dell XC infrastructure to several applications, with several expressing their
intention to grow their Nutanix workload environments. Table 3 provides an overview of the
Nutanix solutions interviewed organizations have deployed. On average, these organizations
have 2,350 employees using 31 applications and 277 virtual machines with about 128TB of
storage running within their Nutanix environments.
Overview of Select Organizations’ Workloads on Nutanix SolutionsIndustry Workload Description
Construction Enterprise resources provisioning platform, HR, payroll, communications applications
Insurance Application virtualization with Citrix
Financial Windows Server infrastructure applications
Medical/hospital Desktop virtualization with Citrix, in process of deploying other workloads on Nutanix solutions
Services provider Customer-facing enterprise applications, including healthcare applications and software
Gaming Web workloads, Splunk
TABLE 2
Source: IDC, 2015
Document #258075 ©2015 IDC. www.idc.com | Page 6
IDC White Paper | Quantifying the Business Value of Dell XC Powered by Nutanix Software
An IT manager at Langs Building Supplies in Australia said: “With Nutanix, we are doing far more projects for our business units …. Instead of spending 65% of our time running things, we’re spending 65% working on the business …. So we’ve become an enabler rather than a hindrance.”
Financial Benefits AnalysisCustomers using Nutanix solutions described achieving operational and cost efficiencies,
along with improved application performance, by moving existing workloads from legacy
traditional three-tier datacenter infrastructures and placing new workloads on their
hyperconverged infrastructure with Nutanix and Dell XC. They also said that their Nutanix
environments were providing them with the agility and scalability they need to grow their
businesses. An IT manager at Langs Building Supplies in Australia described the impact of
Nutanix solutions on the IT department at his organization as transformational: “With Nutanix,
we are doing far more projects for our business units …. Instead of spending 65% of our time
running things, we’re spending 65% working on the business …. So we’ve become an enabler
rather than a hindrance.”
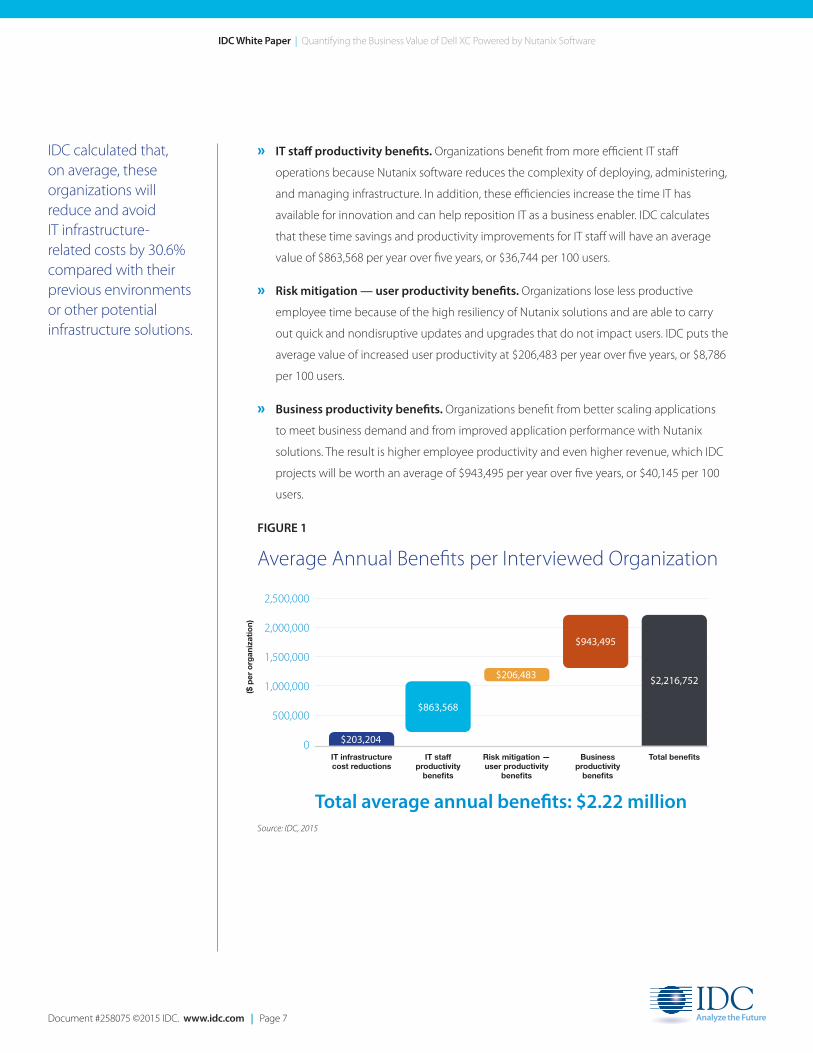
Based on the interviews it conducted, IDC calculated the benefits it projects that these
organizations will achieve with Nutanix solutions (see Figure 1). IDC projects that, on average,
these organizations’ use of Nutanix solutions will yield benefits worth an average of $2.22
million per year over five years ($94,321 per 100 users of applications running on Nutanix
solutions) in four categories:
» IT infrastructure cost reductions and avoidances. Organizations reduce and avoid
datacenter-related capital and operating expenses because of the strong performance,
scalability, and efficiencies of Nutanix solutions. IDC projects that, on average, these
organizations will reduce and avoid costs worth $203,204 per year over five years, or
$8,646 per 100 users.
Nutanix Solutions Environments of Interviewed Organizations Average Median Range
Number of users 2,350 400 45 to 18,000
Number of business applications 31 15 1 to 150
Number of sites 2.2 2.0 1 to 5
Number of clusters 3.3 3.0 1 to 8
Number of nodes 25.5 14.0 4 to 150
Number of virtual servers 277 232 0 to 850
Number of terabytes (data) 128 64 8 to 500
TABLE 3
Source: IDC, 2015
Document #258075 ©2015 IDC. www.idc.com | Page 7
IDC White Paper | Quantifying the Business Value of Dell XC Powered by Nutanix Software
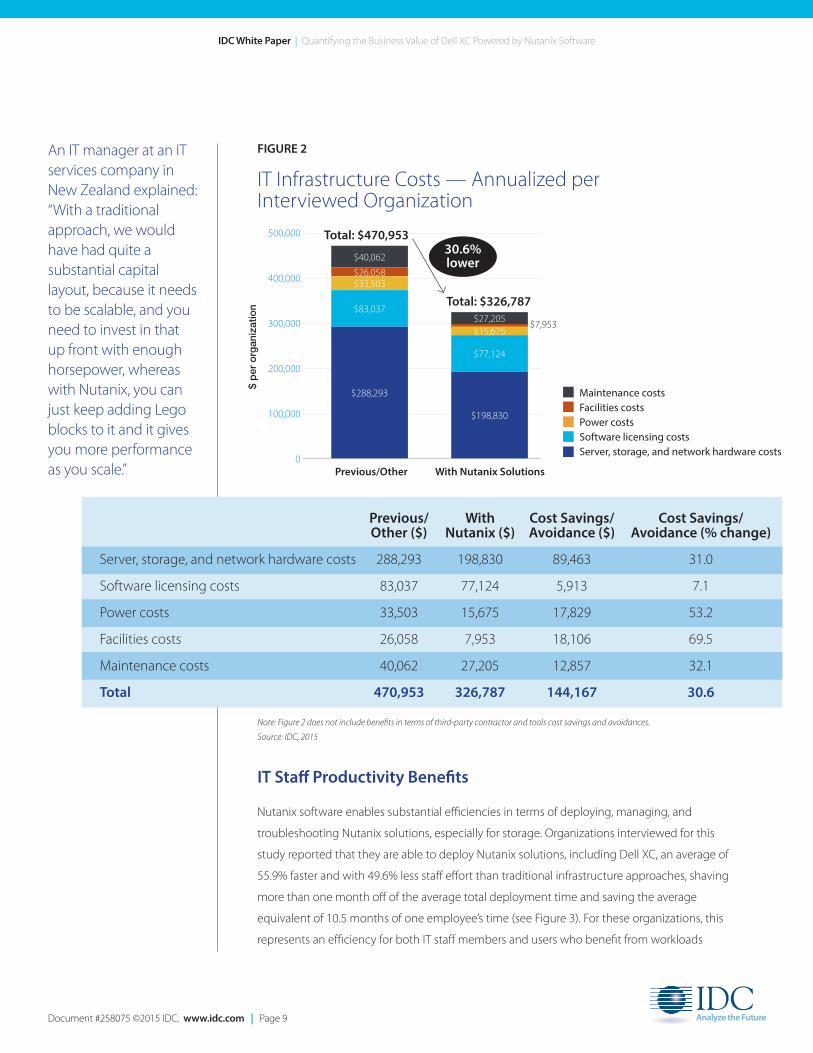
IDC calculated that, on average, these organizations will reduce and avoid IT infrastructure-related costs by 30.6% compared with their previous environments or other potential infrastructure solutions.
» IT staff productivity benefits. Organizations benefit from more efficient IT staff
operations because Nutanix software reduces the complexity of deploying, administering,
and managing infrastructure. In addition, these efficiencies increase the time IT has
available for innovation and can help reposition IT as a business enabler. IDC calculates
that these time savings and productivity improvements for IT staff will have an average
value of $863,568 per year over five years, or $36,744 per 100 users.
» Risk mitigation — user productivity benefits. Organizations lose less productive
employee time because of the high resiliency of Nutanix solutions and are able to carry
out quick and nondisruptive updates and upgrades that do not impact users. IDC puts the
average value of increased user productivity at $206,483 per year over five years, or $8,786
per 100 users.
» Business productivity benefits. Organizations benefit from better scaling applications
to meet business demand and from improved application performance with Nutanix
solutions. The result is higher employee productivity and even higher revenue, which IDC
projects will be worth an average of $943,495 per year over five years, or $40,145 per 100
users.
FIGURE 1
Average Annual Benefits per Interviewed Organization
Source: IDC, 2015
2,500,000
2,000,000
1,500,000
1,000,000
500,000
0 $203,204
$863,568
$206,483
$943,495
$2,216,752
IT infrastructure cost reductions
($ p
er o
rgan
izat
ion)
IT staff productivity
benefits
Risk mitigation — user productivity
benefits
Total average annual benefits: $2.22 million
Business productivity
benefits
Total benefits
Document #258075 ©2015 IDC. www.idc.com | Page 8
IDC White Paper | Quantifying the Business Value of Dell XC Powered by Nutanix Software
An IT manager at Protected Trust explained: “We’d probably have to buy another SAN at our disaster recovery site without Nutanix …. We’d be at a million dollars total of additional SAN costs.”
According to an IT manager at the County of San Mateo: “We’re at about 20% of the footprint we used to have. One of my staff’s favorite things is to show visitors rows of racks of servers that have gone away and point to one rack where Nutanix is and say, ‘all that is over there.’”
IT Infrastructure Cost Reductions and Avoidances
Nutanix solutions, including Dell XC, serve as a cost-effective infrastructure platform for business
applications used by interviewed organizations. IDC calculated that, on average, these organizations
will reduce and avoid IT infrastructure-related costs by 30.6% compared with their previous
environments or other potential infrastructure solutions. These cost efficiencies come on top of
other benefits discussed in this study, such as improved scalability, operating efficiencies, and higher
performance. Customers reported savings with Nutanix solutions for both hardware and software as
well as substantial reductions in costs associated with power and datacenter space (see Figure 2).
Interviewed organizations described a number of ways that their Nutanix solutions have enabled
them to achieve cost efficiencies:
» Storage optimization. Provisioning storage can be complex and costly in traditional datacenter
architectures. However, Nutanix solutions help organizations reduce the need to overprovision
and increase storage utilization rates by providing storage as a single resource pool that can be
easily moved between workloads and increased as needed. In addition, the high resiliency of
Nutanix solutions can help avoid costs associated with provisioning storage for secondary and
disaster recovery sites. According to an IT manager at Protected Trust, a United States-based IT
services company: “We’d probably have to buy another SAN at our disaster recovery site without
Nutanix …. We’d be at a million dollars total of additional SAN costs.”
» Reduced datacenter footprint. Nutanix solutions require substantially lower power
consumption (50.6% on average) and datacenter space (67.2% on average), helping
organizations to minimize infrastructure operating costs. An IT manager at a U.S. governmental
organization said, “We’ve saved more than 50% on power by moving to Nutanix, and the impact
on floorspace needed is huge.” Another manager at the County of San Mateo reported: “We’re at
about 20% of the footprint we used to have. One of my staff’s favorite things is to show visitors
rows of racks of servers that have gone away and point to one rack where Nutanix is and say, ‘all
that is over there.’”
» Enabling ease of scalability. Several interviewed IT managers likened Nutanix solutions to Lego
blocks, a comparison that expresses the ease of expanding resources to meet demand with
Nutanix rather than having to acquire the various resources, including server, storage, network
hardware, and software licenses, to meet potential demand. An IT manager at an IT services
company in New Zealand explained the cost benefit of this: “With a traditional approach, we
would have had quite a substantial capital layout, because it needs to be scalable, and you need
to invest in that up front with enough horsepower, whereas with Nutanix, you can just keep
adding Lego blocks to it and it gives you more performance as you scale.”
Document #258075 ©2015 IDC. www.idc.com | Page 9
IDC White Paper | Quantifying the Business Value of Dell XC Powered by Nutanix Software
An IT manager at an IT services company in New Zealand explained: “With a traditional approach, we would have had quite a substantial capital layout, because it needs to be scalable, and you need to invest in that up front with enough horsepower, whereas with Nutanix, you can just keep adding Lego blocks to it and it gives you more performance as you scale.”
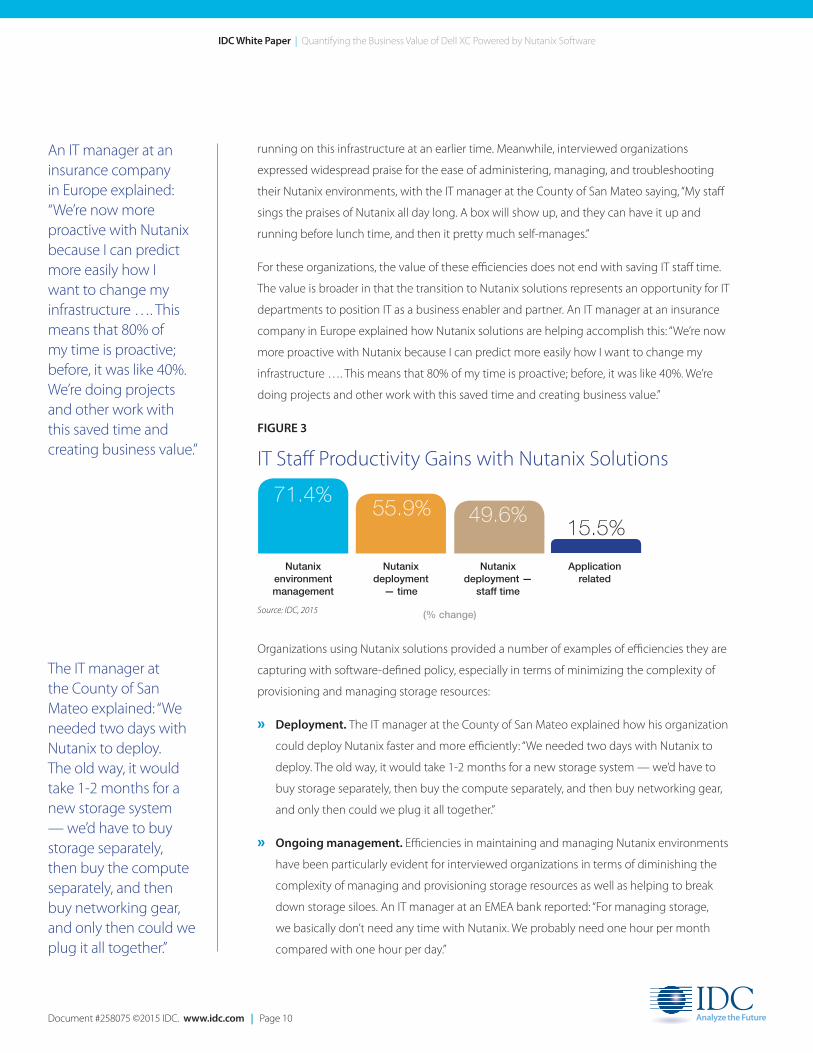
IT Staff Productivity Benefits
Nutanix software enables substantial efficiencies in terms of deploying, managing, and
troubleshooting Nutanix solutions, especially for storage. Organizations interviewed for this
study reported that they are able to deploy Nutanix solutions, including Dell XC, an average of
55.9% faster and with 49.6% less staff effort than traditional infrastructure approaches, shaving
more than one month off of the average total deployment time and saving the average
equivalent of 10.5 months of one employee’s time (see Figure 3). For these organizations, this
represents an efficiency for both IT staff members and users who benefit from workloads
FIGURE 2
IT Infrastructure Costs — Annualized per Interviewed Organization
500,000
400,000
300,000
200,000
100,000
0Previous/Other With Nutanix Solutions
Maintenance costsFacilities costsPower costsSoftware licensing costsServer, storage, and network hardware costs
$40,062
$27,205
$26,058
$7,953
$33,503
$83,037
$77,124
$288,293
$198,830
Total: $470,953
Total: $326,787
$ p
er o
rgan
izat
ion
$15,675
Previous/ With Cost Savings/ Cost Savings/ Other ($) Nutanix ($) Avoidance ($) Avoidance (% change)
Server, storage, and network hardware costs 288,293 198,830 89,463 31.0
Software licensing costs 83,037 77,124 5,913 7.1
Power costs 33,503 15,675 17,829 53.2
Facilities costs 26,058 7,953 18,106 69.5
Maintenance costs 40,062 27,205 12,857 32.1
Total 470,953 326,787 144,167 30.6
Note: Figure 2 does not include benefits in terms of third-party contractor and tools cost savings and avoidances. Source: IDC, 2015
30.6% lower
Document #258075 ©2015 IDC. www.idc.com | Page 10
IDC White Paper | Quantifying the Business Value of Dell XC Powered by Nutanix Software
An IT manager at an insurance company in Europe explained: “We’re now more proactive with Nutanix because I can predict more easily how I want to change my infrastructure …. This means that 80% of my time is proactive; before, it was like 40%. We’re doing projects and other work with this saved time and creating business value.”
The IT manager at the County of San Mateo explained: “We needed two days with Nutanix to deploy. The old way, it would take 1-2 months for a new storage system — we’d have to buy storage separately, then buy the compute separately, and then buy networking gear, and only then could we plug it all together.”
running on this infrastructure at an earlier time. Meanwhile, interviewed organizations
expressed widespread praise for the ease of administering, managing, and troubleshooting
their Nutanix environments, with the IT manager at the County of San Mateo saying, “My staff
sings the praises of Nutanix all day long. A box will show up, and they can have it up and
running before lunch time, and then it pretty much self-manages.”
For these organizations, the value of these efficiencies does not end with saving IT staff time.
The value is broader in that the transition to Nutanix solutions represents an opportunity for IT
departments to position IT as a business enabler and partner. An IT manager at an insurance
company in Europe explained how Nutanix solutions are helping accomplish this: “We’re now
more proactive with Nutanix because I can predict more easily how I want to change my
infrastructure …. This means that 80% of my time is proactive; before, it was like 40%. We’re
doing projects and other work with this saved time and creating business value.”
Organizations using Nutanix solutions provided a number of examples of efficiencies they are
capturing with software-defined policy, especially in terms of minimizing the complexity of
provisioning and managing storage resources:
» Deployment. The IT manager at the County of San Mateo explained how his organization
could deploy Nutanix faster and more efficiently: “We needed two days with Nutanix to
deploy. The old way, it would take 1-2 months for a new storage system — we’d have to
buy storage separately, then buy the compute separately, and then buy networking gear,
and only then could we plug it all together.”
» Ongoing management. Efficiencies in maintaining and managing Nutanix environments
have been particularly evident for interviewed organizations in terms of diminishing the
complexity of managing and provisioning storage resources as well as helping to break
down storage siloes. An IT manager at an EMEA bank reported: “For managing storage,
we basically don’t need any time with Nutanix. We probably need one hour per month
compared with one hour per day.”
FIGURE 3
IT Staff Productivity Gains with Nutanix Solutions
Source: IDC, 2015
Nutanix environment management
Nutanix deployment
— time
Nutanix deployment —
staff time
(% change)
Application related
71.4%55.9% 49.6%
15.5%

Document #258075 ©2015 IDC. www.idc.com | Page 11
IDC White Paper | Quantifying the Business Value of Dell XC Powered by Nutanix Software
Most organizations interviewed for this study said that they have yet to experience any unplanned downtime since deploying Nutanix. On average, these organizations have experienced under 1.5 minutes of unplanned downtime per year running important business applications on Nutanix.
Risk Mitigation — User Productivity Benefits
Interviewed organizations reported that they have substantially reduced the impact of
unplanned outages related to their datacenter infrastructure since deploying their Nutanix
solutions, including Dell XC. In fact, most organizations interviewed for this study said that
they have yet to experience any unplanned downtime since deploying Nutanix. On average,
these organizations have experienced under 1.5 minutes of unplanned downtime per year
running important business applications on Nutanix. In addition, they cited being able to
carry out zero-downtime upgrades as another advantage of their Nutanix environments,
which help them ensure more robust application performance and resiliency without
impacting users during upgrades. On a per-user basis, IDC calculates that productive time lost
due to unplanned and planned downtime has gone from 1.84 hours per year to minutes per
year, almost a 100% reduction in productive time lost (see Table 4).
Risk Mitigation Key Performance Indicators Previous/ With Nutanix Other Solutions Difference Benefit (%) Unplanned downtime
Unplanned downtime instances per year 3.28 0.08 3.20 97.7
Time to resolve unplanned downtime (hours) 2.13 0.31 1.81 85.3
Unplanned downtime per year (minutes) 418.0 1.4 416.6 99.7
Productive hours lost per year per user due 1.34 0.00 1.33 99.7 to unplanned downtime
Planned downtime
Planned downtime instances per year 6.00 0.00 6.00 100.0
Time to resolve planned downtime (hours) 3.56 0.00 3.56 100.0
Productive hours lost per year per user due to 0.50 0.00 0.50 100.0 planned downtime
Total productive hours lost due to 1.84 0.00 1.84 100.0 downtime per year per user
TABLE 4
Source: IDC, 2015

Document #258075 ©2015 IDC. www.idc.com | Page 12
IDC White Paper | Quantifying the Business Value of Dell XC Powered by Nutanix Software
The cost and operational efficiencies of Nutanix solutions, along with their high resiliency, mean that organizations running workloads in a Nutanix environment have a substantially lower total cost of ownership (TCO) compared with legacy or alternative infrastructure solutions. IDC calculates that, on average, these organizations will reduce their TCO by 58.3% over five years (see Figure 4).
TCO of Nutanix Solutions
The cost and operational efficiencies of Nutanix solutions, including Dell XC, along with
their high resiliency, mean that organizations running workloads in a Nutanix environment
have a substantially lower total cost of ownership (TCO) compared with legacy or alternative
infrastructure solutions. IDC calculates that, on average, these organizations will reduce their
TCO by 58.3% over five years (see Figure 4).
Previous/ With Cost Savings/ Cost Savings/ Other ($) Nutanix ($) Avoidance ($) Avoidance (% change)
Datacenter hardware and opex 2,291,531 1,637,847 653,684 28.5
Nutanix deployment — staff time 177,707 89,539 88,168 49.6
Nutanix management — staff time 916,991 261,979 655,012 71.4
Nutanix support — staff time 1,626,070 294,021 1,332,049 81.9
User productivity — unplanned downtime 467,943 1,615 466,328 99.7
Total 5,480,242 2,285,001 3,195,241 58.3
Source: IDC, 2015
FIGURE 4
Five-Year TCO of Nutanix Solutions per Interviewed Organization6,000,000
5,000,000
4,000,000
3,000,000
2,000,000
1,000,000
0
Previous/Other With Nutanix Solutions
User productivity — unplanned downtimeNutanix support — staff timeNutanix management — staff timeNutanix deployment — staff timeDatacenter hardware and opex
$467,943
$1,626,070
$294,021$1,615
$89,539
$916,991
$177,707
$2,291,531$1,637,847
Total: $5.48M
$ p
er o
rgan
izat
ion
$261,979
Total: $2.29M
58.3% lower

Document #258075 ©2015 IDC. www.idc.com | Page 13
IDC White Paper | Quantifying the Business Value of Dell XC Powered by Nutanix Software
An IT manager at a United States–based federal systems integrator said: “We called up Nutanix, and in 72 hours, we were up and running. With a different vendor, I couldn’t have even gotten a PO in this time …. It probably would have been at least three weeks. There would have been no way to achieve what we did.”
According to the IT manager at Protected Trust: “Nutanix impacts the performance of our services to the end user, which means they are happier …. That results in more sales for us. There are customers that we probably would not have gotten if it weren’t for Nutanix. The impact to revenue is probably [in the] millions — $1-2 million per year currently.”
Business Productivity Benefits
Interviewed organizations also credited Nutanix solutions such as Dell XC with enabling
them to better meet business challenges. By moving to a hyperconverged infrastructure,
these organizations have improved the agility of their IT services, which enables them to
better meet business demand. Nutanix software and increased virtualization are helping
these organizations provision storage and server resources in far less time, which shortens
development cycles for applications and services and makes IT more nimble and flexible
in supporting the business. As a result, these organizations can better address business
opportunities as they arise, and their users benefit from having access to new applications
and application updates sooner. For interviewed organizations, these performance
improvements translate to an ability to provide scalable IT services for supporting business
operations, higher revenue, and decreased operational costs in the form of higher user
productivity. Table 5 shows business productivity KPIs of these businesses.
Interviewed organizations provided a number of examples of how Nutanix solutions have
positively impacted their businesses and users:
» Scalable business. An IT manager at a United States–based federal systems integrator
credited the scalability it achieved with Nutanix for getting 2,000 employees onboarded
in a matter of days to support an important business objective: “We called up Nutanix, and
in 72 hours, we were up and running. With a different vendor, I couldn’t have even gotten
a PO in this time …. It probably would have been at least three weeks. There would have
been no way to achieve what we did.”
» More sales. The IT manager at Protected Trust explained that its customers were seeing
improved performance of the services it provides, which translates to higher customer
satisfaction and ultimately more revenue: “Nutanix impacts the performance of our
services to the end user, which means they are happier …. That results in more sales for us.
There are customers that we probably would not have gotten if it weren’t for Nutanix. The
impact to revenue is probably [in the] millions — $1-2 million per year currently.”
» Performance. The IT manager at Langs Building Supplies explained how Nutanix was
speeding up batch processes: “We do batch jobs all the time, but the main one is invoicing
every day. That used to take pretty much all night, a full eight hours, but now it runs in an
hour and 15 minutes. Sometimes, it wouldn’t be finished the next morning, but now, we
start at 4 p.m. and it’s done before we leave the office.”

Document #258075 ©2015 IDC. www.idc.com | Page 14
IDC White Paper | Quantifying the Business Value of Dell XC Powered by Nutanix Software
The IT manager at Langs Building Supplies explained: “We do batch jobs all the time, but the main one is invoicing every day. That used to take pretty much all night, a full eight hours, but now it runs in an hour and 15 minutes. Sometimes, it wouldn’t be finished the next morning, but now, we start at 4 p.m. and it’s done before we leave the office.”
ROI Analysis
IDC uses a discounted cash flow methodology to calculate the ROI and payback period. ROI
is the ratio of the net present value (NPV) and discounted investment. Payback period is the
point at which cumulative benefits equal the initial investment.
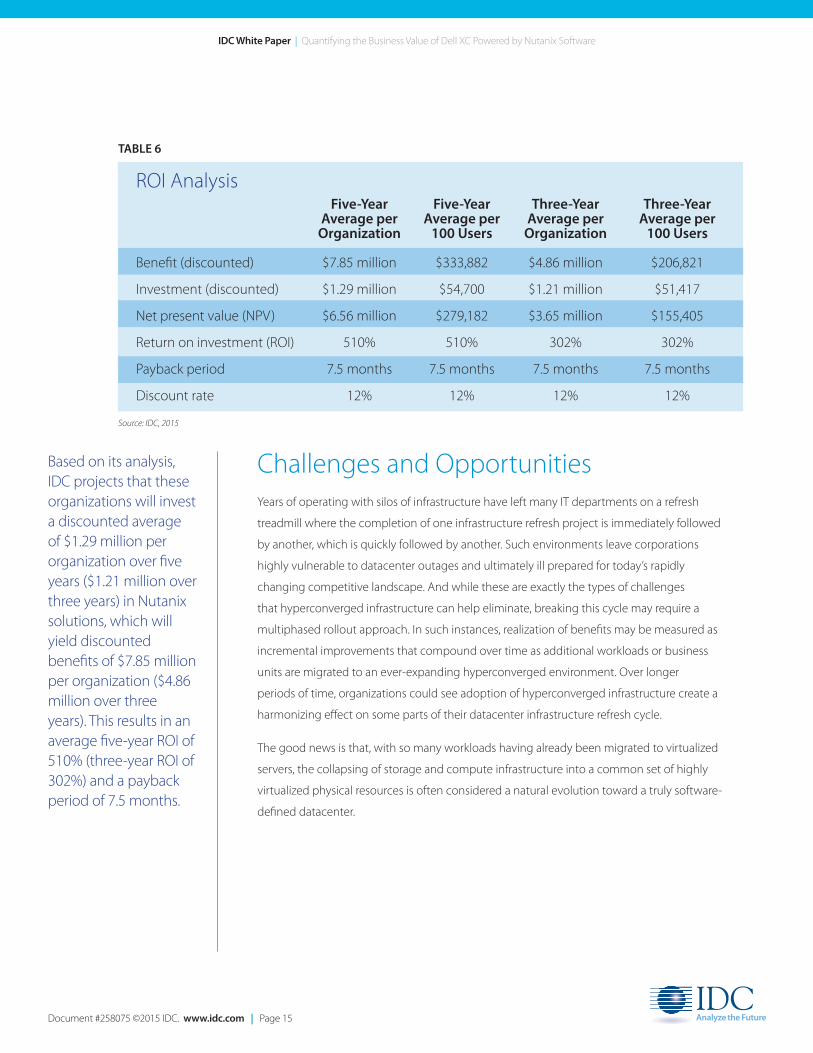
Table 6 presents IDC’s analysis of the average discounted benefits, investment, and return on
investment (ROI) for the Nutanix and Dell customers interviewed for this study. Based on its
analysis, IDC projects that these organizations will invest a discounted average of $1.29 million
per organization over five years ($1.21 million over three years) in Nutanix solutions, which
will yield discounted benefits of $7.85 million per organization ($4.86 million over three years).
This results in an average five-year ROI of 510% (three-year ROI of 302%) and a payback period
of 7.5 months.
Business Productivity Key Performance Indicators Change
Improved application performance (%) 50.6
Reduced time to release for applications (%) 37.8
Reduced time needed per new storage deployment (%) 85.3
Reduced time needed per storage upgrade (%) 82.6
Reduced time per physical server deployment (%) 69.8
Reduced time per virtual server deployment (%) 64.8
Average user productivity improvement (%) 3.1
Average revenue increase per year per interviewed organization — operational efficiencies ($) 499,560
Average revenue increase per year per interviewed organization — reduced downtime ($) 190,863
TABLE 5
Source: IDC, 2015
Document #258075 ©2015 IDC. www.idc.com | Page 15
IDC White Paper | Quantifying the Business Value of Dell XC Powered by Nutanix Software
Based on its analysis, IDC projects that these organizations will invest a discounted average of $1.29 million per organization over five years ($1.21 million over three years) in Nutanix solutions, which will yield discounted benefits of $7.85 million per organization ($4.86 million over three years). This results in an average five-year ROI of 510% (three-year ROI of 302%) and a payback period of 7.5 months.
Challenges and OpportunitiesYears of operating with silos of infrastructure have left many IT departments on a refresh
treadmill where the completion of one infrastructure refresh project is immediately followed
by another, which is quickly followed by another. Such environments leave corporations
highly vulnerable to datacenter outages and ultimately ill prepared for today’s rapidly
changing competitive landscape. And while these are exactly the types of challenges
that hyperconverged infrastructure can help eliminate, breaking this cycle may require a
multiphased rollout approach. In such instances, realization of benefits may be measured as
incremental improvements that compound over time as additional workloads or business
units are migrated to an ever-expanding hyperconverged environment. Over longer
periods of time, organizations could see adoption of hyperconverged infrastructure create a
harmonizing effect on some parts of their datacenter infrastructure refresh cycle.
The good news is that, with so many workloads having already been migrated to virtualized
servers, the collapsing of storage and compute infrastructure into a common set of highly
virtualized physical resources is often considered a natural evolution toward a truly software-
defined datacenter.
ROI Analysis Five-Year Five-Year Three-Year Three-Year Average per Average per Average per Average per Organization 100 Users Organization 100 Users Benefit (discounted) $7.85 million $333,882 $4.86 million $206,821
Investment (discounted) $1.29 million $54,700 $1.21 million $51,417
Net present value (NPV) $6.56 million $279,182 $3.65 million $155,405
Return on investment (ROI) 510% 510% 302% 302%
Payback period 7.5 months 7.5 months 7.5 months 7.5 months
Discount rate 12% 12% 12% 12%
TABLE 6
Source: IDC, 2015
Document #258075 ©2015 IDC. www.idc.com | Page 16
IDC White Paper | Quantifying the Business Value of Dell XC Powered by Nutanix Software
IDC’s research demonstrates that organizations running workloads on Nutanix solutions are benefiting from cost and staff efficiencies, the ability to scale their infrastructure incrementally, very high resiliency, and strong application performance.
Summary and ConclusionOrganizations increasingly require IT infrastructures that support the speed at which their
businesses must operate through simplicity, efficiencies, agility, and strong performance.
Hyperconverged infrastructure solutions, which enable organizations to minimize or nearly
eliminate inefficiencies and complexity associated with maintaining storage and compute
silos, have emerged as a strong potential solution for such organizations. IDC’s research
demonstrates that organizations running workloads on Nutanix solutions such as Dell XC are
benefiting are benefiting from cost and staff efficiencies, the ability to scale their infrastructure
incrementally, very high resiliency, and strong application performance. This is helping
interviewed Nutanix solutions customers better meet business challenges and has led many
of them to establish plans for expanding their hyperconverged workload environment with
Nutanix solutions.
Appendix 1: MethodologyIDC utilized its standard ROI methodology for this project. This methodology is based on
gathering data from current users of Nutanix solutions and Dell XC Web-scale converged
appliances as the foundation for the model. Based on these interviews, IDC performs a three-
step process to calculate the ROI and payback period:
» Measure the savings from reduced IT costs (staff, hardware, software, maintenance, and
IT support), increased user productivity, and improved revenue over the term of the
deployment.
» Ascertain the investment made in deploying the solution and the associated training and
support costs.
» Project the costs and savings over a five-year period and calculate the ROI and payback for
the deployed solution.
IDC bases the payback period and ROI calculations on a number of assumptions, which are
summarized as follows:
» Time values are multiplied by burdened salary (salary + 28% for benefits and overhead) to
quantify efficiency and manager productivity savings.
» Downtime values are a product of the number of hours of downtime multiplied by the
number of users affected.
» The impact of unplanned downtime is quantified in terms of impaired end-user

Document #258075 ©2015 IDC. www.idc.com | Page 17
IDC White Paper | Quantifying the Business Value of Dell XC Powered by Nutanix Software
productivity and lost revenue.
» Lost productivity is a product of downtime multiplied by burdened salary.
» Lost revenue is a product of downtime multiplied by the average revenue generated per hour.
» The net present value of the five-year savings is calculated by subtracting the amount that
would have been realized by investing the original sum in an instrument yielding a 12% return
to allow for the missed opportunity cost. This accounts for both the assumed cost of money
and the assumed rate of return.
Because every hour of downtime does not equate to a lost hour of productivity or revenue
generation, IDC attributes only a fraction of the result to savings. As part of our assessment, we
asked each company what fraction of downtime hours to use in calculating productivity savings
and the reduction in lost revenue. IDC then taxes the revenue at that rate.
Further, because IT solutions require a deployment period, the full benefits of the solution are not
available during deployment. To capture this reality, IDC prorates the benefits on a monthly basis
and then subtracts the deployment time from the first-year savings.
Appendix 2: Nutanix Customer Quotes Used In This StudyAn IT manager at Langs Building Supplies in Australia: “With Nutanix, we are doing far more
projects for our business units …. Instead of spending 65% of our time running things, we’re
spending 65% working on the business …. So we’ve become an enabler rather than a hindrance.”
An IT manager at Protected Trust in the United States: “We’d probably have to buy another SAN at
our disaster recovery site without Nutanix …. We’d be at a million dollars total of additional SAN
costs.”
An IT manager at a U.S. governmental organization: “We’ve saved more than 50% on power by
moving to Nutanix, and the impact on floorspace needed is huge.” Another manager at the
County of San Mateo reported: “We’re at about 20% of the footprint we used to have. One of my
staff’s favorite things is to show visitors rows of racks of servers that have gone away and point to
one rack where Nutanix is and say, ‘all that is over there.’”
An IT manager at an IT services company in New Zealand: “With a traditional approach, we would
have had quite a substantial capital layout, because it needs to be scalable, and you need to invest
in that up front with enough horsepower, whereas with Nutanix, you can just keep adding Lego
Document #258075 ©2015 IDC. www.idc.com | Page 18
IDC White Paper | Quantifying the Business Value of Dell XC Powered by Nutanix Software
blocks to it and it gives you more performance as you scale.”
An IT manager at the County of San Mateo: “My staff sings the praises of Nutanix all day long.
A box will show up, and they can have it up and running before lunch time, and then it pretty
much self-manages.”
An IT manager at an insurance company in Europe: “We’re now more proactive with Nutanix
because I can predict more easily how I want to change my infrastructure …. This means that
80% of my time is proactive; before, it was like 40%. We’re doing projects and other work with
this saved time and creating business value.”
The IT manager at the County of San Mateo: “We needed two days with Nutanix to deploy.
The old way, it would take 1-2 months for a new storage system — we’d have to buy storage
separately, then buy the compute separately, and then buy networking gear, and only then
could we plug it all together.”
An IT manager at an EMEA bank: “For managing storage, we basically don’t need any time
with Nutanix. We probably need one hour per month compared with one hour per day.”
An IT manager at a United States–based federal systems integrator: “We called up Nutanix,
and in 72 hours, we were up and running. With a different vendor, I couldn’t have even gotten
a PO in this time …. It probably would have been at least three weeks. There would have been
no way to achieve what we did.”
The IT manager at Protected Trust: “Nutanix impacts the performance of our services to
the end user, which means they are happier …. That results in more sales for us. There are
customers that we probably would not have gotten if it weren’t for Nutanix. The impact to
revenue is probably [in the] millions — $1-2 million per year currently.”
The IT manager at Langs Building Supplies: “We do batch jobs all the time, but the main one is
invoicing every day. That used to take pretty much all night, a full eight hours, but now it runs
in an hour and 15 minutes. Sometimes, it wouldn’t be finished the next morning, but now, we
start at 4 p.m. and it’s done before we leave the office.”
Note: All numbers in this document may not be exact due to rounding.
IDC Global Headquarters
5 Speen Street Framingham, MA 01701 USA 508.872.8200 Twitter: @IDC idc-insights-community.com www.idc.com
Copyright Notice
External Publication of IDC Information
and Data — Any IDC information that is
to be used in advertising, press releases,
or promotional materials requires prior
written approval from the appropriate
IDC Vice President or Country Manager.
A draft of the proposed document
should accompany any such request.
IDC reserves the right to deny approval
of external usage for any reason.
Copyright 2015 IDC. Reproduction without
written permission is completely forbidden.
About IDC International Data Corporation (IDC) is the premier global provider of market intelligence, advisory services, and events for the information technology, telecommunications and consumer technology markets. IDC helps IT professionals, business executives, and the investment community make fact-based decisions on technology purchases and business strategy. More than 1,100 IDC analysts provide global, regional, and local expertise on technology and industry opportunities and trends in over 110 countries worldwide. For 50 years, IDC has provided strategic insights to help our clients achieve their key business objectives. IDC is a subsidiary of IDG, the world’s leading technology media, research, and events company.

Document #258075 ©2015 IDC. www.idc.com | Page 1
IDC White Paper | Quantifying the Business Value of Dell XC Powered by Nutanix Software
EXECUTIVE SUMMARY
Years of IT infrastructure advancements have helped to drive out vast amounts of costs within
the datacenter. Technologies like server and storage virtualization, data deduplication, and flash-
based storage systems (to name just a few) have contributed to improvements of utilization rates,
performance, and resiliency for most organizations. Unfortunately, organizations still struggle with
deeply rooted operational inefficiencies related to IT departments with silos of technology and
expertise that lead to higher complexity, limited scalability, and suboptimal levels of agility. The recent
tectonic shifts caused by the rise of 3rd Platform applications that focus on social, mobile, cloud,
and big data environments have amplified the pains associated with these structural inefficiencies.
These environments require new levels of scale, automation, and agility that do not align well with
the current practice of independently buying and managing discrete datacenter resources. Thus we
see an increasing number of companies deploying integrated systems as a way to gain additional
operational benefits provided by standardized systems, centralized management, and increased levels
of automation. Companies have several architectural choices when deploying integrated systems, but
the fastest growing is known as hyperconverged infrastructure. Hyperconverged solutions provide a
new level of convergence through a cluster of shared nothing, industry-standard systems that utilize
software-defined storage constructs to abstract and pool all resources, which are then dynamically
provisioned for all storage and compute services.
IDC’s interviews with organizations using Nutanix hyperconverged infrastructure solutions and Dell XC
hyperconverged appliances powered by Nutanix software (Dell XC) to run key business applications
highlighted the value they are achieving with these hyperconverged solutions. IDC projects that, on
average, these organizations’ use of IT solutions powered by Nutanix software will yield total five-year
discounted benefits worth $7.85 million and a return on investment (ROI) of 510% by:
» Serving as a cost-effective and incrementally scalable infrastructure
» Offering an efficient IT infrastructure platform that simplifies infrastructure deployment,
management, and troubleshooting
» Providing a highly resilient infrastructure that supports the business with minimal downtime
» Enabling the business and users with greater IT agility and scalability, faster time to value, and
improved performance of key business applications
Quantifying the Business Value of Dell XC Powered by Nutanix Software
Sponsored by: Nutanix and Dell
Authors: Matthew Marden Eric Sheppard
August 2015
Business Value HighlightsAverage five-year ROI:
510%Five-year discounted benefits per organization:
$7.85MFive-year TCO savings:
58%Payback period:
7.5 MonthsStorage deployment (faster):
85%Management of Nutanix environment (less time):
71%Reduction in unplanned downtime:
99.7%