Fresh Food 2015: New Insights and System Refresher€¦ · Asia Pacific Australasia ... Home and...
24
FRESH FOOD 2015: NEW INSIGHTS AND SYSTEM REFRESHER August 2016
Transcript of Fresh Food 2015: New Insights and System Refresher€¦ · Asia Pacific Australasia ... Home and...

FRESH FOOD 2015: NEW INSIGHTS AND SYSTEM REFRESHER
August 2016

NEW INSIGHTS
Industry Overview
SYSTEM REFRESHER
About Our Research

Key facts and figures in 2015INDUSTRY OVERVIEW
2% global volume
growth in 2015, slightly
down from 2014
43.4 million tonnes absolute volume
growth in 2015
Chinaranks first, accounting
for 42% of global volume sales
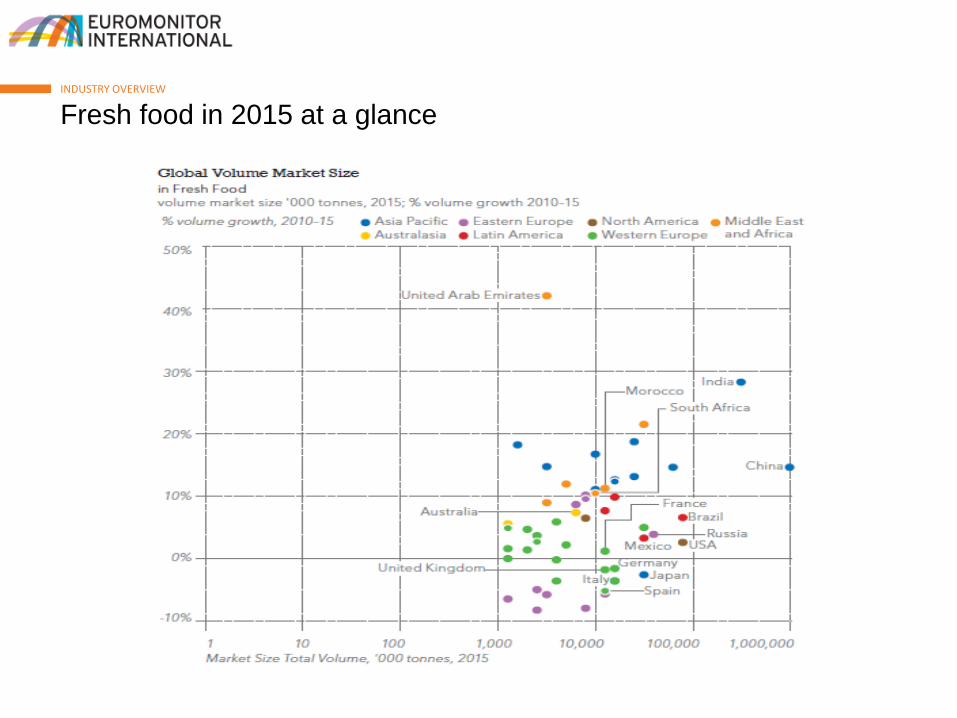
Fresh food in 2015 at a glanceINDUSTRY OVERVIEW

Globally, pulses was the best performer in 2015, having increased by 7% in volume terms. They provide an affordable source of protein and are particularly important across developing and emerging markets. The success of pulses is largely attributed to 4% growth in India, where some 360 million vegetarians rely heavily on pulses for dietary protein. India alone accounted for 56% of global fresh pulse volume sales, totalling 51 million tonnes in 2015.
Fish/seafood and eggs closely followed pulses with 3% overall volume growth each. These categories were particularly dynamic in the Middle East and Africa, Asia Pacific and Latin America, where consumers were increasingly able to improve their protein intake and afford more expensive fish and seafood in addition to the staple of eggs.
The Middle East and Africa led regional growth with a near 4% volume increase in 2015. Growing disposable incomes and health awareness particularly boosted sales of fresh fruits, meat and eggs in the Middle East and Africa.
Western Europe and North America remained sluggish, with volume growth under 1%, due to busy lifestyles, a high proportion of single-person households and stronger consumer preferences for the convenience and “added value” nature of packaged/processed food.
Growth driven by emerging marketsINDUSTRY OVERVIEW

-3 2 7 12 17 22
Asia Pacific
Australasia
Eastern Europe
Latin America
MEA
North America
Western Europe
World
% growth
Fresh Meat: Volume Growth Globally and by Region 2010-2015
2010-2015
At the global level, overall meat consumption recorded 2% growth in volume terms in 2015, in line with positive performance over 2010-2015.
Demand for meat has been driven by emerging markets, where increased prosperity and rising populations resulted in growing consumption of relatively expensive meat.
The Middle East and Africa and Asia Pacific performed most dynamically, recording growth of 4% and 3%, respectively, in 2015 and were the only two regions where beef and veal recorded growth.
At the same time, in Western Europe meat continued to decline, posting a 0.3% decrease in 2015.
Improved performance of meat in North America in 2015 was due in large part to strong increases in pork sales in the US.
Meat continues to decline in Western EuropeINDUSTRY OVERVIEW
-4
-2
0
2
4
6
8
10
Western Europe USA Germany France Italy Spain UK
% v
olu
me
gro
wth
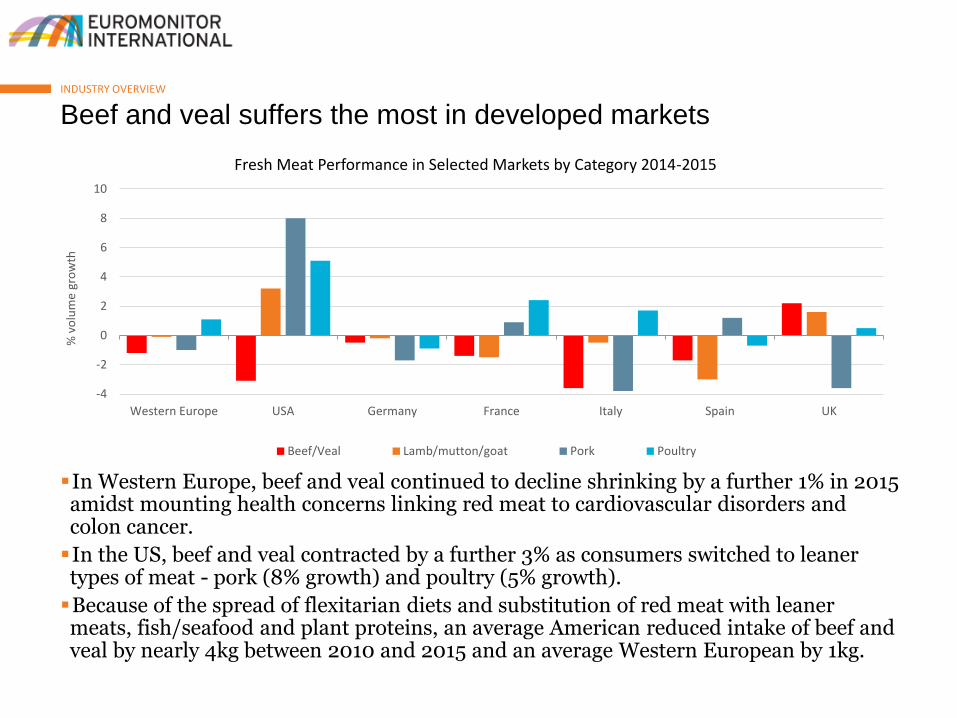
Fresh Meat Performance in Selected Markets by Category 2014-2015
Beef/Veal Lamb/mutton/goat Pork Poultry
In Western Europe, beef and veal continued to decline shrinking by a further 1% in 2015 amidst mounting health concerns linking red meat to cardiovascular disorders and colon cancer.
In the US, beef and veal contracted by a further 3% as consumers switched to leaner types of meat - pork (8% growth) and poultry (5% growth).
Because of the spread of flexitarian diets and substitution of red meat with leaner meats, fish/seafood and plant proteins, an average American reduced intake of beef and veal by nearly 4kg between 2010 and 2015 and an average Western European by 1kg.
Beef and veal suffers the most in developed marketsINDUSTRY OVERVIEW
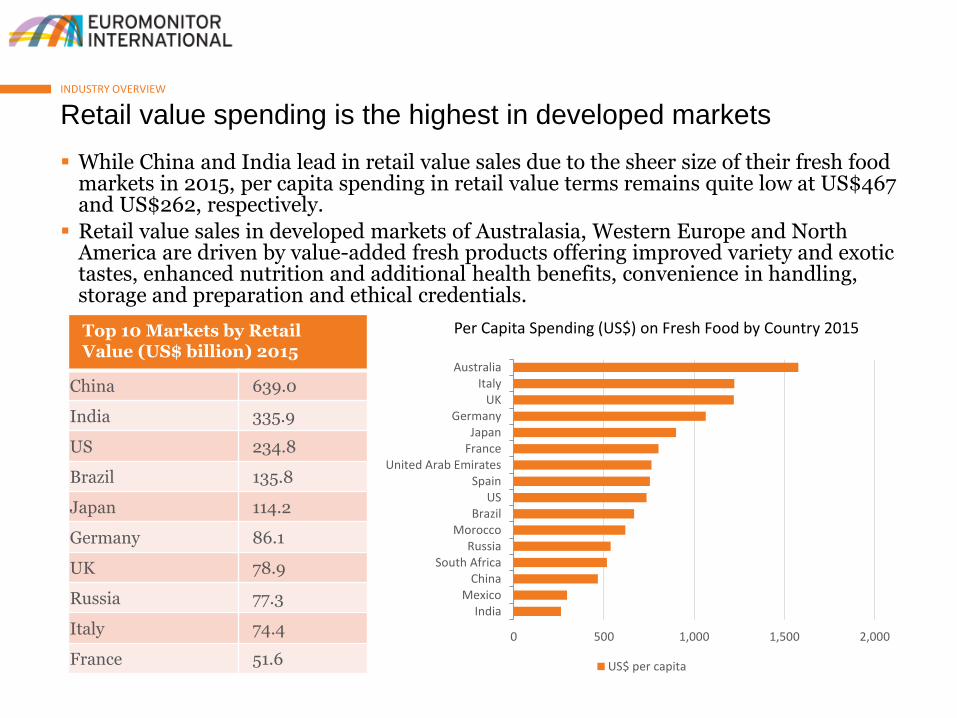
Top 10 Markets by Retail Value (US$ billion) 2015
China 639.0
India 335.9
US 234.8
Brazil 135.8
Japan 114.2
Germany 86.1
UK 78.9
Russia 77.3
Italy 74.4
France 51.6
While China and India lead in retail value sales due to the sheer size of their fresh food markets in 2015, per capita spending in retail value terms remains quite low at US$467 and US$262, respectively.
Retail value sales in developed markets of Australasia, Western Europe and North America are driven by value-added fresh products offering improved variety and exotic tastes, enhanced nutrition and additional health benefits, convenience in handling, storage and preparation and ethical credentials.
Retail value spending is the highest in developed markets INDUSTRY OVERVIEW
0 500 1,000 1,500 2,000
IndiaMexico
ChinaSouth Africa
RussiaMorocco
BrazilUS
SpainUnited Arab Emirates
FranceJapan
GermanyUK
ItalyAustralia
Per Capita Spending (US$) on Fresh Food by Country 2015
US$ per capita

Organic demand is the strongest in fresh fruits, vegetables and meat, primarily in the markets of Western Europe, North America and Australia. Here, consumers have higher disposable income to afford more expensive organics and appreciate benefits offered by produce with organic credentials. In the UK, for example, consumption of organic fruits increased by 2% in 2012-2015, while conventionally-grown fruit declined by 1%.
Organics are also highly accessible and often combine other ethical credentials such as fair trade, locally produced or responsibly sourced. While higher costs of organic products remain an issue, both premium retailers and discounters continuously expand their organic offerings to cater to two main types of organic consumers. The former target wealthy consumers, willing to pay high prices for a mix of quality organic products, and the latter target less affluent, cost-sensitive middle-class consumers seeking organics at competitive prices. In Germany and the UK, hard discounters Aldi and Lidl carry extended assortments of fresh organic produce from fruits and vegetables, to starchy roots, pulses and meat and poultry at highly affordable prices.
.
Organics enjoy growing demand across boardersINDUSTRY OVERVIEW
0% 10% 20% 30% 40% 50% 60% 70% 80% 90% 100%
UK
Spain
France
Germany
Italy
Organic vs Conventional Fruits in Selected Markets 2015
Organic Conventional
0% 10% 20% 30% 40% 50% 60% 70% 80% 90% 100%
Spain
UK
Germany
France
Italy
Organic vs Conventional Vegetables in Selected Markets 2015
Organic Conventional

Increasing numbers of consumers place importance on clean, safe and healthy eating as well as on environmental and social issues. Those who tend to chose organic products over conventional, also prefer sustainably- and responsibly-sourced produce with a minimal carbon footprint.
The origin of products often becomes their unique selling point. Consumers respond positively to products that can be traced back to the supplier, while growers, farmers and retailers explain methods of farming and farm-to-shelf logistics to cater to those seeking:
Locally-sourced produce
Naturally-grown and organic foods
Sustainably- and responsibly-sourced produce
Products with high animal welfare marks
Fair trade products
Ethical values are high on consumers’ agenda INDUSTRY OVERVIEW
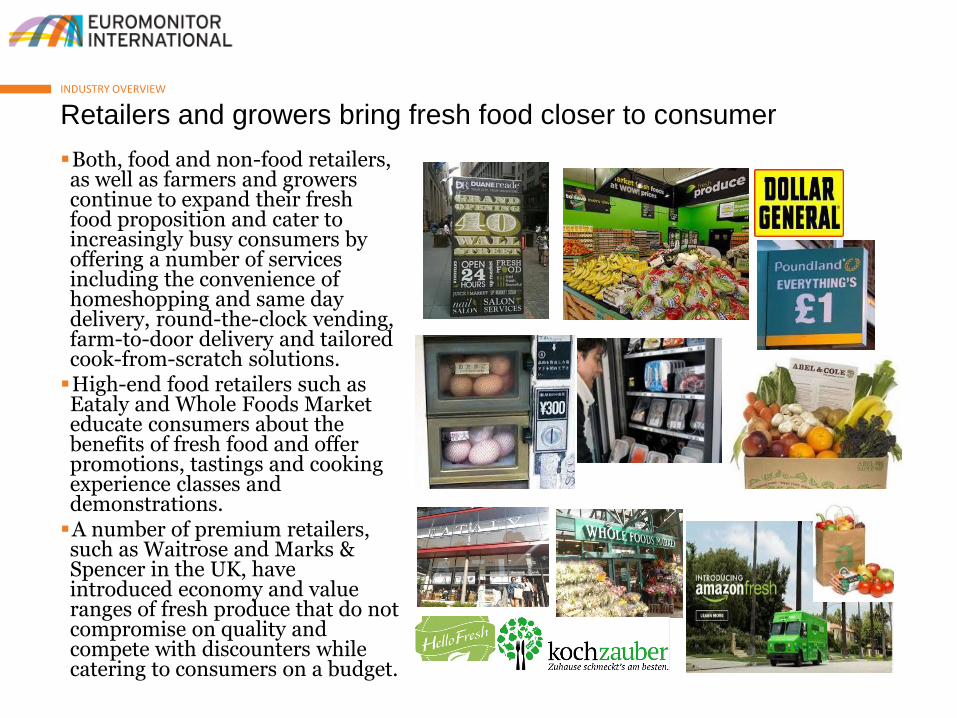
Both, food and non-food retailers, as well as farmers and growers continue to expand their fresh food proposition and cater to increasingly busy consumers by offering a number of services including the convenience of homeshopping and same day delivery, round-the-clock vending, farm-to-door delivery and tailored cook-from-scratch solutions. High-end food retailers such as Eataly and Whole Foods Market educate consumers about the benefits of fresh food and offer promotions, tastings and cooking experience classes and demonstrations. A number of premium retailers, such as Waitrose and Marks & Spencer in the UK, have introduced economy and value ranges of fresh produce that do not compromise on quality and compete with discounters while catering to consumers on a budget.
Retailers and growers bring fresh food closer to consumerINDUSTRY OVERVIEW

Traditional fresh food retailers, such as independent small grocers, food specialists and open markets, maintain significant share of sales across many geographies. They are particularly strong in markets with low proliferation of modern retailers - supermarkets/hypermarkets, discounters and convenience stores. In India, for example, there were only 4,587 supermarkets in 2015 - a number close to that in the Netherlands -independent grocers (or kirana stores) contributed 81% of fresh food in 2015.The role of small grocers and specialists, such as butchers, fishmongers and greengrocers, remains important in developed markets where consumers value these channels over large-scale retailers for the superior variety, quality and freshness of produce on offer.
Traditional channels maintains their importance INDUSTRY OVERVIEW
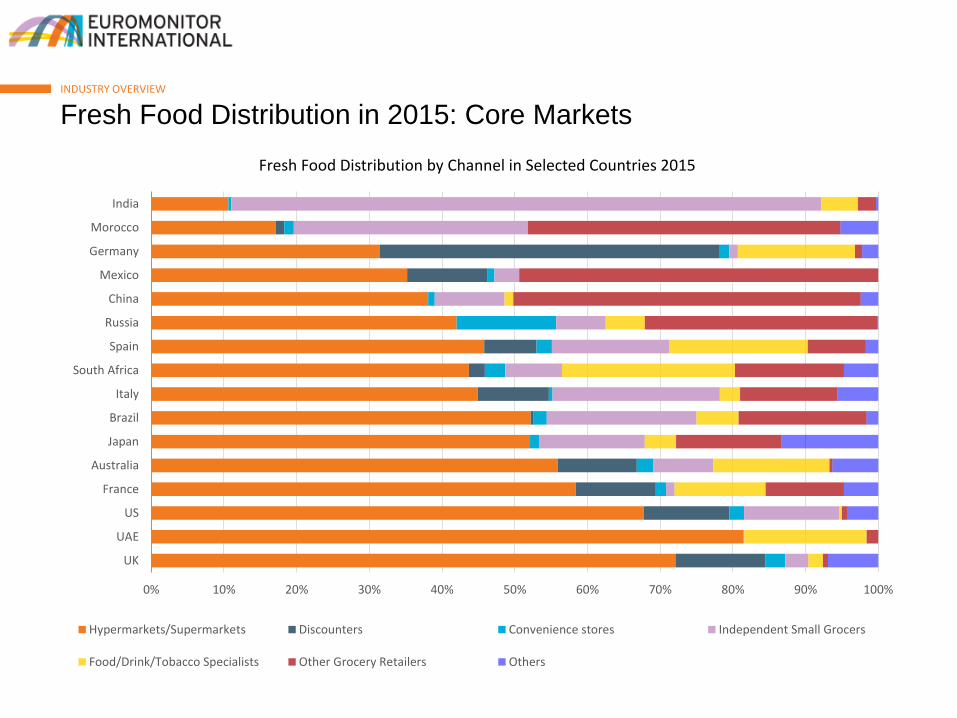
Fresh Food Distribution in 2015: Core MarketsINDUSTRY OVERVIEW
0% 10% 20% 30% 40% 50% 60% 70% 80% 90% 100%
UK
UAE
US
France
Australia
Japan
Brazil
Italy
South Africa
Spain
Russia
China
Mexico
Germany
Morocco
India
Fresh Food Distribution by Channel in Selected Countries 2015
Hypermarkets/Supermarkets Discounters Convenience stores Independent Small Grocers
Food/Drink/Tobacco Specialists Other Grocery Retailers Others

NEW INSIGHTS
Industry Overview
SYSTEM REFRESHER
About Our Research
Euromonitor International is a global market research company, providing strategic intelligence on industries, companies, economies and consumers around the world.
Comprehensive international coverage and insight across consumer and B2B markets makes our research an essential resource.
Clients in more than 106 countries rely on Euromonitorfor actionable, unbiased insight supporting decisions on how, where and when to grow their business.
Our independent view of the business environment, competitive landscape and drivers of industry growth helps validate strategic priorities, redirect assumptions and uncover new opportunities.
About Euromonitor InternationalABOUT OUR RESEARCH
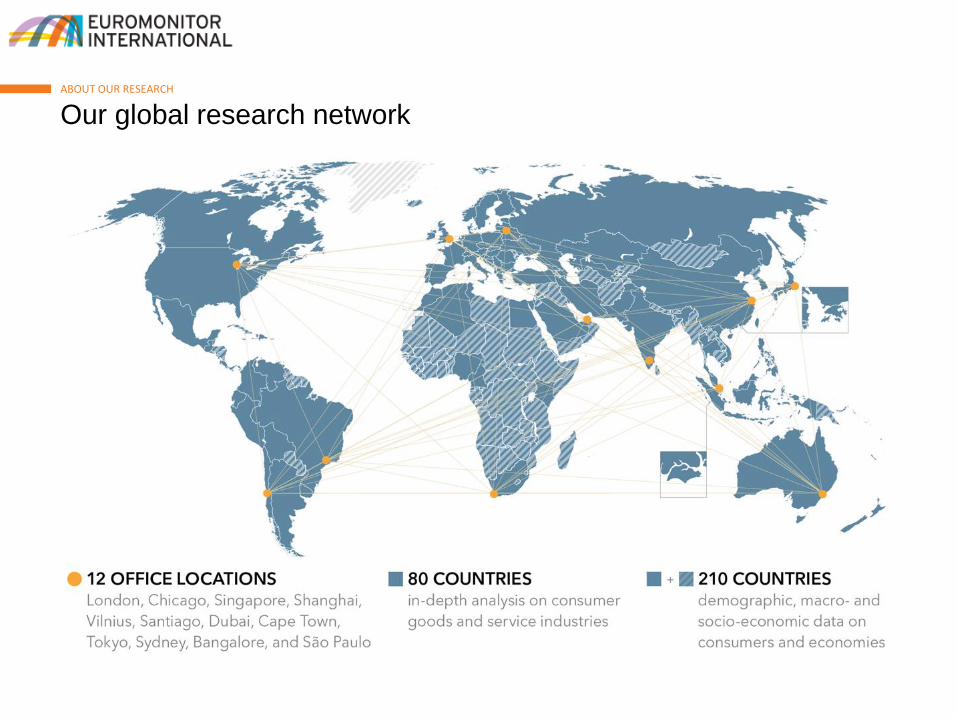
Our global research networkABOUT OUR RESEARCH
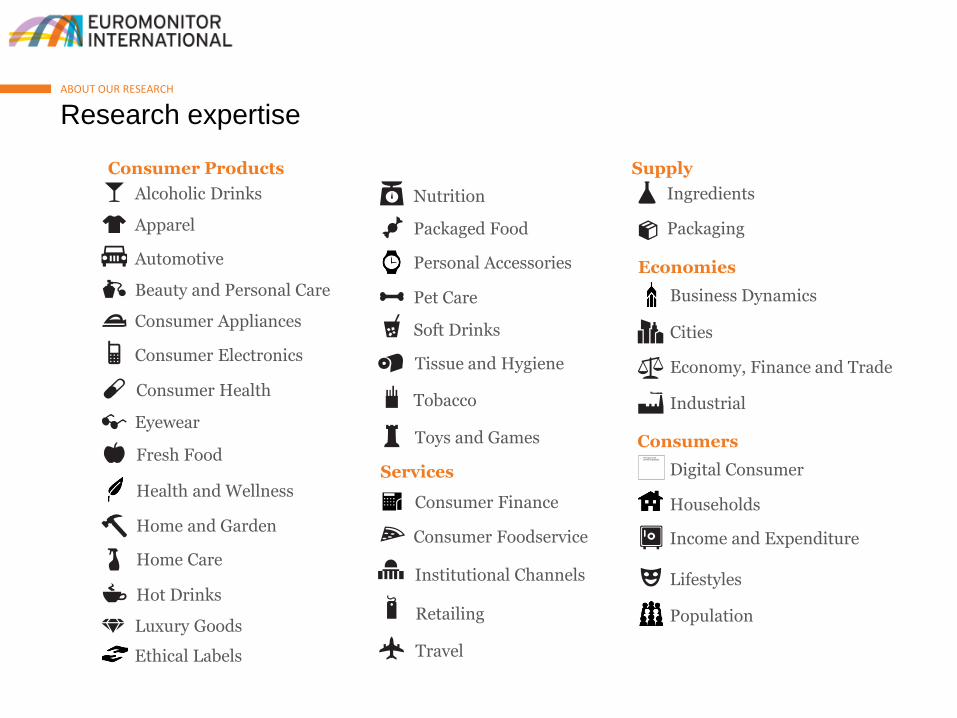
Research expertiseABOUT OUR RESEARCH
Consumer Products Supply
Alcoholic Drinks Ingredients
Apparel
Automotive
Beauty and Personal Care
Consumer Appliances
Consumer Electronics
Eyewear
Fresh Food
Health and Wellness
Home and Garden
Home Care
Hot Drinks
Consumer Health
Luxury Goods
Nutrition
Packaged Food
Personal Accessories
Pet Care
Soft Drinks
Tobacco
Toys and Games
Tissue and Hygiene
Services
Consumer Foodservice
Institutional Channels
Consumer Finance
Retailing
Travel
Packaging
Economies
Business Dynamics
Cities
Economy, Finance and Trade
Industrial
Consumers
Lifestyles
Income and Expenditure
Households
Population
Ethical Labels
Digital Consumer
Our fresh food geographic coverageABOUT OUR RESEARCH
AT BE FR DE
DK GR IE IT FI NL
NO PT SE ES CH
TR GB
CN HK IN ID
JP MY PH SG
KR TW TH VN
AU NZ
EG IS MO
SA ZA UAE
AR BR CL CO
MX PU VE
CA US
BU CS HU PL
RO RU SK UK
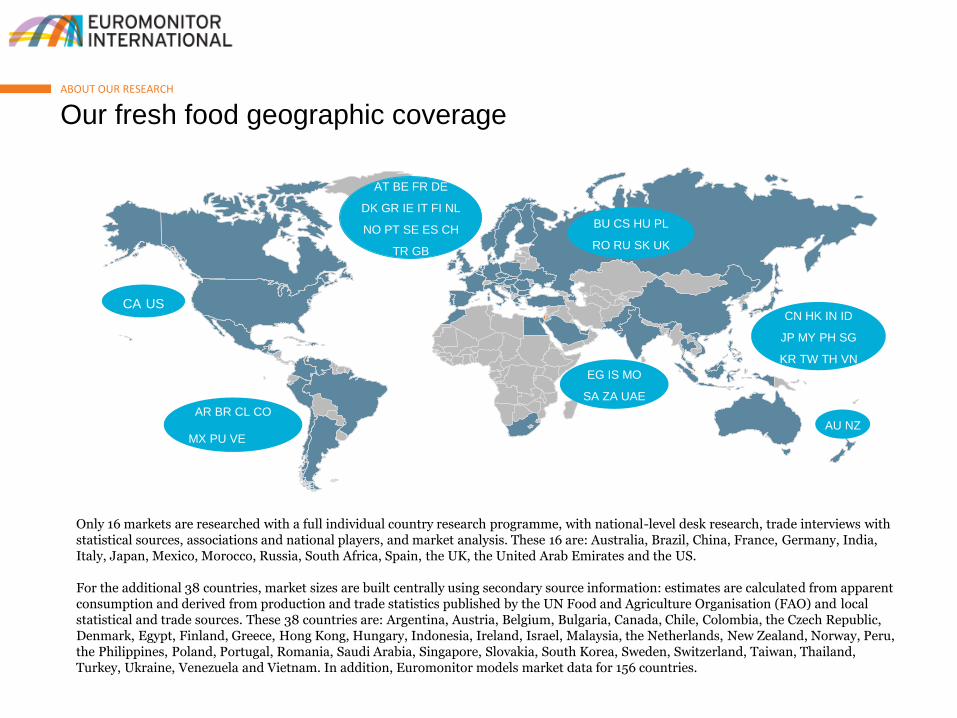
Only 16 markets are researched with a full individual country research programme, with national-level desk research, trade interviews with statistical sources, associations and national players, and market analysis. These 16 are: Australia, Brazil, China, France, Germany, India, Italy, Japan, Mexico, Morocco, Russia, South Africa, Spain, the UK, the United Arab Emirates and the US.
For the additional 38 countries, market sizes are built centrally using secondary source information: estimates are calculated from apparent consumption and derived from production and trade statistics published by the UN Food and Agriculture Organisation (FAO) and local statistical and trade sources. These 38 countries are: Argentina, Austria, Belgium, Bulgaria, Canada, Chile, Colombia, the Czech Republic, Denmark, Egypt, Finland, Greece, Hong Kong, Hungary, Indonesia, Ireland, Israel, Malaysia, the Netherlands, New Zealand, Norway, Peru, the Philippines, Poland, Portugal, Romania, Saudi Arabia, Singapore, Slovakia, South Korea, Sweden, Switzerland, Taiwan, Thailand, Turkey, Ukraine, Venezuela and Vietnam. In addition, Euromonitor models market data for 156 countries.
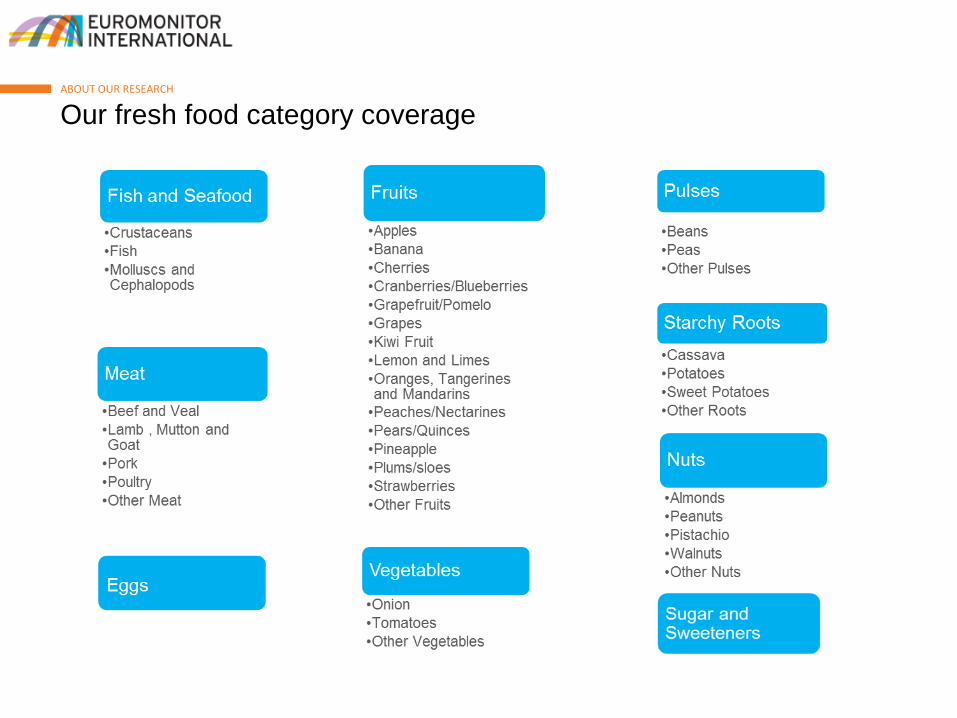
Our fresh food category coverageABOUT OUR RESEARCH
Apparent consumption
Animal feed
Wastage
Consumption by farmers
Industrial processing
Euromonitor’sfresh food volume
data
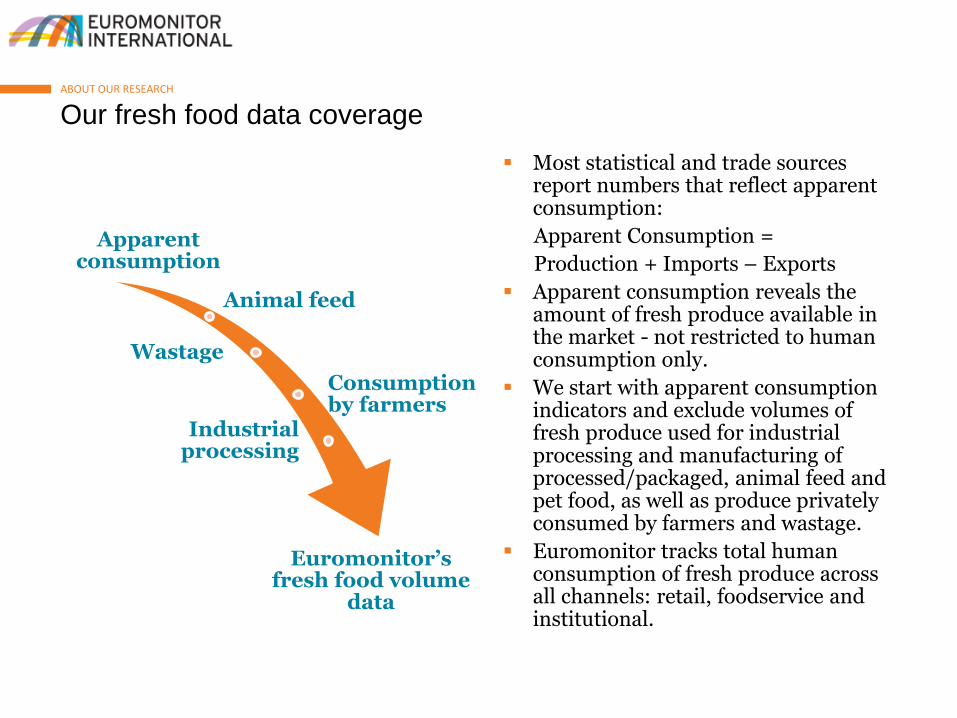
Most statistical and trade sources report numbers that reflect apparent consumption:
Apparent Consumption =
Production + Imports – Exports
Apparent consumption reveals the amount of fresh produce available in the market - not restricted to human consumption only.
We start with apparent consumption indicators and exclude volumes of fresh produce used for industrial processing and manufacturing of processed/packaged, animal feed and pet food, as well as produce privately consumed by farmers and wastage.
Euromonitor tracks total human consumption of fresh produce across all channels: retail, foodservice and institutional.
Our fresh food data coverageABOUT OUR RESEARCH
System update and improvements for 2016ABOUT OUR RESEARCH
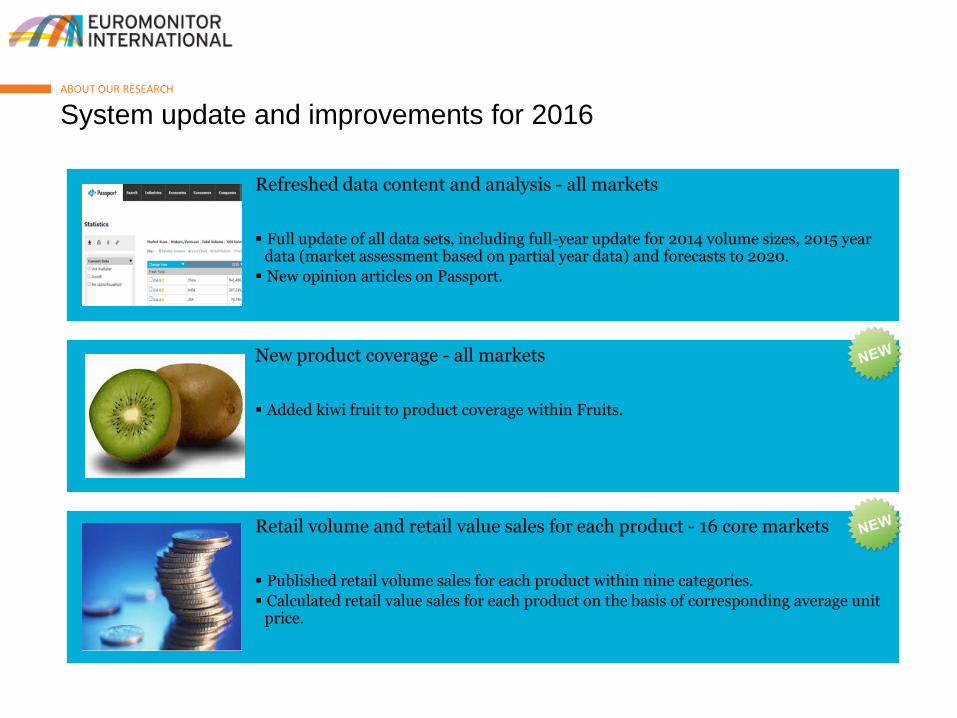
Refreshed data content and analysis - all markets
Full update of all data sets, including full-year update for 2014 volume sizes, 2015 year data (market assessment based on partial year data) and forecasts to 2020.
New opinion articles on Passport.
New product coverage - all markets
Added kiwi fruit to product coverage within Fruits.
Retail volume and retail value sales for each product - 16 core markets
Published retail volume sales for each product within nine categories.
Calculated retail value sales for each product on the basis of corresponding average unit price.

Our approach to calculating retail value salesABOUT OUR RESEARCH
Price checks were carried out across a broad mix of modern and traditional grocery retailing channels from supermarkets and discounters to independent grocers and open markets.
Average retail unit prices were calculated for each product within nine researched categories. This was done on the basis of collected prices that reflected broad price range.
Prices for seasonal produce, such as fruits and vegetables, were annualised using monthly retail prices reported by national statistical and trade sources.
Retail sales in volume terms were estimated and introduced for each product.
Average retail unit prices were applied to newly researched retail volumes to calculate retail value sales for each product in 2015. Value indicators have been subsequently extrapolated to all years of historic and forecast periods, factoring in inflation.
Retail value sizes expressed in local currency were generated for the first time. Values can also be viewed in US dollar, euro, UK pound, Japanese yen and Swiss franc in current and fixed exchange rates.

CONTACT DETAILS
Blog: http://blog.euromonitor.com/category/fresh-food
Anastasia Alieva
Head of Fresh [email protected]
This research from Euromonitor International is part of a global strategic
intelligence system that offers a complete picture of the commercial
environment. Also available from Euromonitor International:
Global Briefings
Timely, relevant insight published every month on the state of the market,
emerging trends and pressing industry issues.
Interactive Statistical Database
Complete market analysis at a level of detail beyond any other source. Market
sizes, market shares, distribution channels and forecasts.
Strategy Briefings
Executive debate on the global trends changing the consumer markets of the
future.
Global Company Profiles
The competitive positioning and strategic direction of leading companies
including uniquely sector-specific sales and share data.
Country Market Insight Reports
The key drivers influencing the industry in each country; comprehensive
coverage of supply-side and demand trends and how they shape future outlook.
Learn More
To find out more about Euromonitor
International's complete range of
business intelligence on industries,
countries and consumers please visit
www.euromonitor.com or contact your
local Euromonitor International office:
Bangalore +91 80 4904 0500
Cape Town +27 21 524 3000
Chicago +1 (312) 922 1115
Dubai +971 4 372 4363
London +44 (0) 207 251 8024
Santiago +56 2 2 9157200
São Paulo +55 11 2970 2150
Shanghai +86 21 603 21088
Singapore +65 6429 0590
Sydney +61 2 9581 9200
Tokyo +81 3 3436 2100
Vilnius +370 5 243 1577
Experience more...