Fresh Del Monte Produce Inc. - Annual report
128
Fresh Del Monte Produce Inc. 2014 Annual Report A Global Diversified Food Company
Transcript of Fresh Del Monte Produce Inc. - Annual report

Fresh Del Monte Produce Inc.2014 Annual Report
A Global Diversified Food Company


UNITED STATESSECURITIES AND EXCHANGE COMMISSION
Washington, D.C. 20549
FORM 10-K
(Mark One)
ANNUAL REPORT PURSUANT TO SECTION 13 OR 15(d) OF THE SECURITIES EXCHANGE ACT OF 1934
For the fiscal year ended December 26, 2014
OR
TRANSITION REPORT PURSUANT TO SECTION 13 OR 15(d) OF THE SECURITIES EXCHANGE
ACT OF 1934
For the transition period from to .
Commission file number 1-14706
FRESH DEL MONTE PRODUCE INC.(Exact Name of Registrant as Specified in Its Charter)
The Cayman Islands N/A(State or Other Jurisdiction of
Incorporation or Organization)(I.R.S Employer
Identification No.)
c/o Intertrust SPV (Cayman) Limited190 Elgin Avenue
George Town, Grand Cayman, KY1-9001Cayman Islands N/A
(Address of Registrant’s Principal Executive Offices) (Zip Code) (305) 520-8400
(Registrant’s telephone number including area code)
Please send copies of notices and communications from the Securities and Exchange Commission to:
c/o Del Monte Fresh Produce Company241 Sevilla Avenue
Coral Gables, Florida 33134(Address of Registrant’s U.S. Executive Offices)
Securities registered pursuant to Section 12(b) of the Act:
Title of Each Class Name of Each Exchange on Which RegisteredOrdinary Shares, par value $0.01 per share New York Stock Exchange
Securities registered pursuant to Section 12(g) of the Act: None

Indicate by check mark if the Registrant is a well-known seasoned issuer, as defined in Rule 405 of the Securities Act. Yes No
Indicate by check mark if the Registrant is not required to file reports pursuant to Section 13 or Section 15(d) of the Act. Yes No
Indicate by check mark whether the Registrant: (1) has filed all reports required to be filed by Section 13 or 15(d) of the Securities Exchange Act of 1934 during the preceding 12 months (or for such shorter period that the Registrant was required to file such reports), and (2) has been subject to such filing requirements for the past 90 days. Yes No
Indicate by check mark whether the registrant has submitted electronically and posted on its corporate Web site, if any, every Interactive Data File required to be submitted and posted pursuant to Rule 405 of Regulation S-T (§232.405 of this chapter) during the preceding 12 months (or for such shorter period that the registrant was required to submit and post such files). Yes No
Indicate by check mark if disclosure of delinquent filers pursuant to Item 405 of Regulation S-K is not contained herein, and will not be contained, to the best of Registrant’s knowledge, in definitive proxy or information statements incorporated by reference in Part III of this Form 10-K or any amendment to this Form 10-K.
Indicate by check mark whether the Registrant is a large accelerated filer, an accelerated filer, a non-accelerated filer, or a smaller reporting company. See the definitions of “large accelerated filer,” “accelerated filer” and “smaller reporting company” in Rule 12b-2 of the Exchange Act. (Check one):
Large accelerated filer Accelerated filer
Non-accelerated filer Smaller reporting company
Indicate by check mark whether the Registrant is a shell company (as defined in Rule 12b-2 of the Act). Yes No
The aggregate market value of Ordinary Shares held by non-affiliates at June 27, 2014, the last business day of the registrant’s most recently completed second quarter, and was $1,089,216,544 based on the number of shares held by non-affiliates of the registrant and the reported closing price of Ordinary Shares on June 27, 2014 of $30.47.
As of February 6, 2015, there were 52,879,014 ordinary shares of Fresh Del Monte Produce Inc. issued and outstanding.
DOCUMENTS INCORPORATED BY REFERENCE Portions of the Registrant’s definitive Proxy Statement for the 2015 Annual General Meeting of Shareholders to be filed with the Securities and Exchange Commission within 120 days after the end of the registrant’s fiscal year are incorporated by reference in Part III of this report.

TABLE OF CONTENTS
PagePART I
Item 1. Business
Item 1A. Risk Factors
Item 1B. Unresolved Staff Comments
Item 2. Properties
Item 3. Legal Proceedings
Item 4. Mine Safety Disclosure
PART II
Item 5. Market for Registrant’s Common Equity, Related Stockholder Matters and Issuer Purchases of Equity Securities
Item 6. Selected Financial Data
Item 7. Management’s Discussion and Analysis of Financial Condition and Results of Operations
Item 7A. Quantitative and Qualitative Disclosures about Market Risk
Item 8. Financial Statements and Supplementary Data
Item 9. Changes in and Disagreements with Accountants on Accounting and Financial Disclosure
Item 9A. Controls and Procedures
Item 9B. Other Information
PART III
Item 10. Directors, Executive Officers and Corporate Governance
Item 11. Executive Compensation
Item 12. Security Ownership of Certain Beneficial Owners and Management and Related Stockholder Matters
Item 13. Certain Relationships and Related Transactions, and Director Independence
Item 14. Principal Accountant Fees and Services
PART IV
Item 15. Exhibits and Financial Statement Schedules
SIGNATURES
EXHIBIT INDEX
1
14
20
21
22
22
23
26
27
46
47
112
112
112
113
113
113
113
113
114
119
118

Forward-Looking Statements
In this Annual Report (the “Report”), references to “$” and “dollars” are to United States dollars. References in this Report to "Fresh Del Monte", “we”, “our” and “us” refer to Fresh Del Monte Produce Inc. and its subsidiaries, unless the context indicates otherwise. Percentages and certain amounts contained herein have been rounded for ease of presentation. Any discrepancies in any table between totals and the sums of amounts listed are due to rounding. As used herein, references to the years ended 2012, 2013 and 2014 are to fiscal years ended December 28, 2012, December 27, 2013 and December 26, 2014, respectively. This Report, information included in future filings by us and information contained in written material, press releases and oral statements, issued by or on behalf of us contains, or may contain, statements that constitute forward-looking statements in particular, information in Item 1. Business and Item 7. Management’s Discussion and Analysis of Financial Condition and Results of Operations – Trend Information, contained in this Report. In this Report, these statements appear in a number of places and include statements regarding the intent, beliefs or current expectations of us or our officers (including statements preceded by, followed by or that include the words “believes”, “expects”, “anticipates” or similar expressions) with respect to various matters, including our plans and future performance. These forward-looking statements involve risks and uncertainties. Fresh Del Monte’s actual plans and performance may differ materially from those in the forward-looking statements as a result of various factors, including (i) the uncertain global economic environment and the timing and strength of a recovery in the markets we serve, and the extent to which adverse economic conditions continue to affect our sales volume and results, including our ability to command premium prices for certain of our principal products, or increase competitive pressures within the industry, (ii) the impact of governmental initiatives in the United States and abroad to spur economic activity, including the effects of significant government monetary or other market interventions on inflation, price controls and foreign exchange rates, (iii) the impact of governmental trade restrictions, including adverse governmental regulation that may impact our ability to access certain markets, (iv) our anticipated cash needs in light of our liquidity, (v) the continued ability of our distributors and suppliers to have access to sufficient liquidity to fund their operations, (vi) trends and other factors affecting our financial condition or results of operations from period to period, including changes in product mix or consumer demand for branded products such as ours, particularly as consumers remain price-conscious in the current economic environment; anticipated price and expense levels; the impact of crop disease, severe weather conditions, such as flooding, or natural disasters, such as earthquakes, on crop quality and yields and on our ability to grow, procure or export our products; the impact of prices for petroleum-based products and packaging materials; and the availability of sufficient labor during peak growing and harvesting seasons, (vii) the impact of pricing and other actions by our competitors, particularly during periods of low consumer confidence and spending levels, (viii) the impact of foreign currency fluctuations, (ix) our plans for expansion of our business (including through acquisitions) and cost savings, (x) our ability to successfully integrate acquisitions into our operations, (xi) the impact of impairment or other charges associated with exit activities, crop or facility damage or otherwise, (xii) the timing and cost of resolution of pending and future legal and environmental proceedings or investigations, (xiii) the impact of changes in tax accounting or tax laws (or interpretations thereof), and the impact of settlements of adjustments proposed by the Internal Revenue Service or other taxing authorities in connection with our tax audits, and (xiv) the cost and other implications of changes in regulations applicable to our business, including potential legislative or regulatory initiatives in the United States or elsewhere directed at mitigating the effects of climate change. All forward-looking statements in this report are based on information available to us on the date hereof, and we assume no obligation to update any such forward-looking statements.
The forward-looking statements are not guarantees of future performance and involve risks and uncertainties. It is important to note that our actual results may differ materially from those in the forward-looking statements as a result of various factors. The accompanying information contained in this Report, identifies important factors that could cause our actual results to differ materially from those in the forward-looking statements.
The volume data included in this Report has been obtained from our records. Except for volume data for Fresh Del Monte, the market share, volume and consumption data contained in this Report have been compiled by us based upon data and other information obtained from third-party sources, primarily from the Food and Agriculture Organization of the United Nations (the “FAO”), and from our surveys of customers and other company-compiled data. Except as otherwise indicated, volume data contained in this Report is shown in millions of 40-pound equivalent boxes.

1
PART I
Item 1. Business
History and Development of Fresh Del Monte
Our legal name is Fresh Del Monte Produce Inc., and our commercial name is Del Monte Fresh Produce. We are an exempted holding company, incorporated under the laws of the Cayman Islands on August 29, 1996. At December 26, 2014, the close of our most recent fiscal year, members of the Abu-Ghazaleh family directly owned approximately 35.3% of our outstanding Ordinary Shares.
Our principal executive office is located at 190 Elgin Avenue, George Town, Grand Cayman, KY1-9001, Cayman Islands. The address of our U.S. executive office is Del Monte Fresh Produce Company, 241 Sevilla Avenue, Coral Gables, Florida 33134. Our telephone number at our U.S. executive office is (305) 520-8400. Our Internet address is http://www.freshdelmonte.com. The electronic version of this Annual Report on Form 10-K, along with other information about us, our operations and our results and other documents filed with the Securities and Exchange Commission (“SEC”) can be found on our Web site. Information on our Web site is not a part of this Report on Form 10-K.
Our global business, conducted through our subsidiaries, is primarily the worldwide sourcing, transportation and
marketing of fresh and fresh-cut produce together with prepared food products in Europe, Africa and the Middle East. We source our fresh produce products (bananas, pineapples, melons, tomatoes, grapes, apples, pears, peaches, plums, nectarines, cherries, citrus, avocados, blueberries and kiwi) primarily from Central and South America, Africa, the Philippines, North America and Europe. We source our prepared food products primarily from Africa, Europe and the Middle East. Our products are sourced from company-owned operations, through joint venture arrangements and through supply contracts with independent producers. We distribute our products in North America, Europe, Asia, the Middle East, Africa and South America.
In March 2014, we acquired approximately 2,600 acres of farmland in Florida for $16.0 million related to the other fresh produce segment for expansion of our tomato operations. This 2014 acquisition, together with the other tomato acquisition in Florida and Virginia that we made in 2013, provides us with year-round U.S. production capability and enables us to provide our customers with high-quality, locally grown tomatoes, further strengthening our competitive position in the produce industry.
In December 2014, we acquired two pineapple plantations in Costa Rica totaling approximately 1,370 acres consisting of agricultural production land, packing houses and farm equipment for $12.8 million. This acquisition expands our productive capacity of gold pineapples in Costa Rica by approximately 1.5 million boxes annually.
Our capital expenditures totaled $149.1 million in 2014. Approximately $75.8 million of our capital expenditures were related to the other fresh produce segment consisting principally of expansion of our tomato operations in the United States, a new fresh-cut fruit facility in Japan, and expansion and improvements to production facilities in Costa Rica, Chile, the Philippines and the Middle East. Approximately $48.2 million of our 2014 capital expenditures were related to the banana segment, consisting primarily of expansion of our production operations in the Philippines, improvements and expansion of our production operations in Central America, and distribution centers in North America and Europe. Approximately $21.1 million of our capital expenditures in 2014 was related to the prepared food segment, consisting principally of expansion and improvements to production facilities in Kenya, Costa Rica, Jordan and Greece. Also, included in our capital expenditures in 2014 was approximately $4.0 million for information technology systems.
Our capital expenditures totaled $159.5 million in 2013, consisting primarily of approximately $49.6 million for expansion and improvements to production facilities in Costa Rica, Guatemala, the Philippines and Chile related to the banana and other fresh produce segments; $39.3 million for expansion of our tomato and vegetable assets in North America related to the other fresh produce segment; $16.8 million principally for improvements and expansion of production facilities in Kenya, Greece and Jordan related to the prepared food segment; $32.7 million principally for the construction of distributions centers in Canada and France and improvements and expansion of distribution centers in the United States and the Middle East principally related to the banana and other fresh produce segment; and $8.3 million for expansion of our fresh-cut production facilities primarily in North America related to the other fresh produce segment. During 2013, capital expenditures also included approximately $9.7 million for the acquisition of two refrigerated vessels and related shipping equipment and $3.1 million for information technology systems.
The principal capital expenditures planned for 2015 consist primarily of the expansion and improvement of production facilities in Costa Rica, the Philippines, Kenya, Nicaragua, Mexico and Chile. In addition, we also plan capital expenditures for expansion and improvements of our distribution and fresh-cut facilities in North America, the Middle East and Asia and production facilities in the United Arab Emirates.

2
Business Overview We are one of the world’s leading vertically integrated producers, marketers and distributors of high-quality fresh and
fresh-cut fruit and vegetables, as well as a leading producer and distributor of prepared fruit and vegetables, juices, beverages and snacks in Europe, Africa and the Middle East. We market our products worldwide under the DEL MONTE® brand, a symbol of product innovation, quality, freshness and reliability since 1892. Our global sourcing and logistics network allows us to provide consistent delivery of high-quality fresh produce, juices, beverages, processed fruit and vegetables and value-added services to our customers.
We have leading market positions in the following product categories. We believe we are:
• the largest marketer of fresh pineapples worldwide;
• the third-largest marketer of bananas worldwide;
• a leading marketer of branded fresh-cut fruit in the United States, Japan, the United Kingdom, United Arab Emirates and Saudi Arabia;
• a leading grower, re-packer and marketer of tomatoes in the United States;
• a leading year-round marketer of branded grapes in the United States;
• a leading marketer of branded non-tropical fruit in selected markets; and
• a leading marketer for branded canned fruit and pineapple in the European Union (EU), other European markets, and the Middle East.
We source and distribute our fresh produce products globally. Our products are grown primarily in Central and South America, Africa and the Philippines. We also source products from North America and Europe. Our products are sourced from company-controlled farms and independent growers. At year end 2014, we transported our fresh produce to markets using our fleet of 15 owned and six chartered refrigerated vessels, and we operated four port facilities in the United States. We also operated 39 distribution centers, generally with cold storage and banana ripening facilities in our key markets worldwide, including the United States, Germany, Japan, South Korea, Hong Kong, France the United Arab Emirates and Saudi Arabia. We also operate 16 fresh-cut facilities in the United States, the United Kingdom, Japan, the United Arab Emirates and Saudi Arabia, some of which are located within our distribution centers. Through our vertically integrated network, we manage the transportation and distribution of our products in a continuous temperature-controlled environment. This enables us to preserve quality and freshness, and to optimize product shelf life, while ensuring timely and year-round distribution. Furthermore, our position as a volume producer and shipper of bananas allows us to lower our average per-box logistics cost and to provide regular deliveries of our premium fresh fruit to meet the increasing demand for year-round supply.
We market and distribute our products to retail stores, club stores, wholesalers, distributors and foodservice operators in more than 100 countries around the world. North America is our largest market, accounting for 54% of our net sales in 2014. Europe, the Middle East and Asia regions are our other major markets, accounting for 19%, 14% and 11% of our net sales in 2014, respectively. Our distribution centers and fresh-cut facilities address the growing demand from supermarket chains, club stores, foodservice providers, mass merchandisers and independent grocers to provide value-added services, including the preparation of fresh-cut produce, ripening, customized sorting and packing, just-in-time and direct-store-delivery and in-store merchandising and promotional support. Large national chains are increasingly choosing fewer suppliers who can serve all of their needs on a national basis. We believe that there is a significant opportunity for a company like ours with a full fresh and fresh-cut produce line, a well-recognized brand, a consistent supply of quality produce and a national distribution network to become the preferred supplier to these large retail and convenience store chains, and foodservice customers. We believe that we are uniquely positioned as a preferred supplier, and our goal is to expand this status by increasing our leading position in fresh-cut produce, expanding our banana and pineapple business and diversifying our other fresh produce selections. We are a multinational company offering a variety of fresh produce in all major markets along with fresh-cut produce in selected markets and a prepared food product line that includes prepared fruit and vegetables, juices, beverages and snacks in Europe, Africa, the Middle East and countries formerly part of the Soviet Union.
Our strategy is a combination of maximizing revenues from our existing infrastructure, entering new markets and strict cost control initiatives. We plan to continue to capitalize on the growing global demand for fresh produce and expand our reach

3
into existing and new markets. We expect sales growth of fresh produce in key markets by increasing our sales volume and per unit sales prices as permitted by market conditions. Our strategy includes increasing volumes from existing production and distribution facilities in order to improve operating efficiencies and reduce per unit costs. We plan additional investments in production facilities in order to expand our product offering in established markets and continue with our recent expansion in growth markets, such as the Middle East, Africa and countries formerly part of the Soviet Union. We also plan additional investments in our North America and Asia distribution and fresh-cut fruit facilities to support our planned growth in these markets.
Products Sourcing and Production
Our products are grown and sourced primarily in Central and South America, Africa and the Philippines. We also source
products from North America and Europe. In 2014, 46% of the fresh produce we sold was grown on company-controlled farms and the remaining 54% was acquired primarily through supply contracts with independent growers. Costa Rica is our most significant sourcing location representing approximately 34% of our total sales volume of fresh produce products and where 40% of our property, plant and equipment was located in 2014.
We produce, source, distribute and market a broad array of fresh produce throughout the world, primarily under the DEL MONTE® brand, as well as under other proprietary brands, such as UTC® and Rosy®. We also produce, distribute and market prepared fruits and vegetables, juices, beverages and snacks under the DEL MONTE® brand, as well as other proprietary brands, such as Fruit Express™, Just Juice®, Fruitini® and other regional trademarks in Europe, Africa, the Middle East and countries formerly part of the Soviet Union.
The following table indicates our net sales by product for the last three years:
Year ended
December 26, 2014 December 27, 2013 December 28, 2012 (U.S. dollars in millions)Net sales by product category: Banana $ 1,804.7 46% $ 1,692.2 46% $ 1,544.6 45%Other fresh produce:
Gold pineapples 577.2 15% 509.7 14% 512.8 15%Fresh-cut produce 381.1 10% 408.3 11% 391.0 11%Non-tropical fruit 413.9 10% 394.5 11% 332.1 10%Melons 126.8 3% 115.6 3% 113.8 3%Tomatoes 109.9 3% 82.4 2% 72.7 2%Vegetables 52.2 1% 55.3 1% 54.6 2%Other fruit, products and services 83.6 2% 72.7 2% 67.8 2%
Total other fresh produce 1,744.7 44% 1,638.5 44% 1,544.8 45%Prepared food 378.1 10% 353.0 10% 331.8 10%
Total $ 3,927.5 100% $ 3,683.7 100% $ 3,421.2 100%
See Note 22, “Business Segment Data”, to the Consolidated Financial Statements included in Item 8. Financial Statements and Supplementary Data for further information.
Bananas
Bananas are the leading internationally traded fresh fruit in terms of volume and dollar sales and one of the best-selling fresh fruit in the United States. Based on the latest available data by the FAO, Europe and North America are the world’s largest banana markets and Asia is the third largest market. Bananas are a key produce department product due to its high turnover and the premium margins obtained by retailers.
Bananas have a relatively short growing cycle and are grown in tropical locations with humid climates and heavy rainfall, such as Central and South America, the Caribbean, the Philippines and Africa. Bananas are grown throughout the year in these locations, although demand and prices fluctuate based on the relative supply of bananas and the availability of seasonal and alternative fruit.

4
We believe that we are the world’s third-largest marketer of bananas, based on internally generated data. Our banana sales in North America, Europe, Asia and the Middle East accounted for approximately 49%, 21%, 17% and 11% of our net sales of bananas in 2014, respectively. We produced approximately 37% of the banana volume we sold in 2014 on company-controlled farms, and we purchased the remainder from independent growers.
Bananas are one of the best-selling fresh produce items, as well as a high-margin product for many of our customers. Accordingly, our ability to provide our customers with a year-round supply of high-quality DEL MONTE® bananas is important to maintaining our existing customer relationships and attracting new customers. Our position as a volume shipper of bananas has also allowed us to make regular shipments of a wide array of other fresh produce, such as pineapples, melons and plantains, reducing our average per-box logistics costs and maintaining higher quality produce with a longer shelf life.
We produce bananas on company-controlled farms in Costa Rica, Guatemala, Brazil and the Philippines and we purchase
bananas from independent growers in Costa Rica, Ecuador, Colombia, Guatemala, Cameroon and the Philippines. Although our supply contracts are primarily long-term, we also make purchases in the spot market, primarily in Ecuador. In Ecuador and Costa Rica, there are minimum export prices for the sale of bananas, which are established and reviewed on a periodic basis by the respective governments.
Due in part to limitations in the Philippines on foreign ownership of land, we purchase the majority of bananas in the Philippines through long-term contracts with independent growers. Approximately 78% of our Philippine-sourced bananas are supplied by one grower, representing 14% of the Philippines banana industry volume in 2014. In the Philippines, we have leased approximately 3,900 hectares of land where we have planted approximately 2,500 hectares of bananas for the Asia and the Middle East markets.
Gold Pineapples
Pineapples are grown in tropical and sub-tropical locations, including the Philippines, Costa Rica, Hawaii, Thailand, Malaysia, Brazil, Indonesia and various countries in Africa. In contrast to bananas, pineapples have a long growing cycle of 18 months, and require re-cultivation after one to two harvests. Pineapple growing requires a higher level of capital investment, as well as greater agricultural expertise as compared with growing bananas.
The premium pineapples, such as our Del Monte Gold® Extra Sweet pineapple, which has an enhanced taste, golden shell color, bright yellow flesh and higher vitamin C content, has replaced the Champaka and other traditional pineapple varieties in popularity and demand and has led to increased competition.
We believe that we are the number one marketer of fresh pineapples worldwide, based on internally generated data.
Pineapple sales in North America, Europe, Asia and the Middle East accounted for 62%, 20%, 13% and 5%, respectively, of our net sales of pineapples in 2014. From 1996 to 2014, our volume of the Del Monte Gold® Extra Sweet pineapple increased from 2.5 million boxes to 32.4 million boxes. Based on the latest available FAO data, for the 10-year period from 2001 to 2011, the volume of pineapple sales in Europe, North America, Asia and the Middle East increased by 159%, 150% and 88% and 1,069%, respectively. We believe that a substantial portion of this growth is due to our introduction of the Del Monte Gold® Extra Sweet pineapple. As a result of our continued expansion of existing pineapple operations, we expect to continue to increase the sales volume of our extra sweet pineapples in the near future with extra sweet pineapples grown in Costa Rica and the Philippines.
The principal production and procurement areas for our gold pineapples are Costa Rica and the Philippines. Given the complexity of pineapple cultivation relative to our bananas, a higher percentage of the fresh pineapples we sell (81% by volume in 2014) is produced on company-controlled farms.
Fresh-Cut Produce Fresh-cut produce first gained prominence in many U.S. and European markets with the introduction of washed and cut
vegetables. While packaged salads continue to lead the category of fresh-cut produce sales, the category has expanded significantly to include pineapples, melons, mangos, grapes, citrus and assorted vegetable produce items that are washed, cut and packaged in a ready-to-use form. Market expansion has been driven largely by consumer demand for convenient, fresh, healthy and ready-to-eat food alternatives, as well as significant demand from foodservice operators. Within this market, we believe that there has been increasing differentiation between companies active primarily in the packaged salad market and other companies, like us, that can offer a wide variety of fresh-cut fruit and vegetable items.
The majority of fresh-cut produce is sold to consumers through retail and club store settings, as well as non-conventional
settings such as convenience stores, gas stations and airports. We believe that outsourcing by food retailers will increase, particularly

5
as food safety regulations become more stringent and retailers demand more value-added services. We believe that this trend should benefit large branded suppliers like us, who are better positioned to invest in state of the art fresh-cut facilities and food safety systems and to service regional and national chains and foodservice operators, as well as supercenters, mass merchandisers, club stores and convenience stores. We also believe that large branded suppliers benefit from merchandising, branding and other marketing strategies for fresh-cut products, similar to those used for branded processed food products, which depend substantially on product differentiation.
We believe that the fresh-cut produce market continues to be one of the fastest-growing categories in the fresh produce
segment, largely due to consumer trends favoring healthy and conveniently packaged ready-to-eat foods. We established a platform in this industry through acquisitions and by building upon our existing fresh-cut pineapple business. We believe that our experience in this market coupled with our sourcing and logistics capabilities and the DEL MONTE® brand have enabled us to achieve a leading position in this highly fragmented market. Based on the latest supermarket scan data as supplied by an independent market syndicated data provider for 2014, we believe that we are the market leader in branded fresh-cut fruit in the United States and the leading supplier of fresh-cut fruit to the convenience and club store channels. Our fresh-cut fruit products include Del Monte Gold® Extra Sweet pineapples, melons, grapes, citrus, apples, mangos, kiwis and other fruit items. The fruit we use in our fresh-cut operations are sourced within our integrated system of company-controlled farms and from GAP-certified (good agricultural practices) independent growers. We also offer fresh-cut vegetables for prepared salads. We purchase our vegetables for these purposes from GAP-certified independent growers principally in the United States, Europe and in the Middle East. Our purchase contracts for both fruit and vegetables are typically short-term and vary by produce item. Our fresh-cut products are sold in the United States, the United Kingdom, the Middle East and Japan.
Non-Tropical Fruit Non-tropical fruit includes grapes, apples, pears, peaches, plums, nectarines, cherries, avocados, citrus and kiwis.
Generally, non-tropical fruit grows on trees, bushes or vines that shed their leaves seasonally. Approximately 31% of our non-tropical fruit net sales are from grapes. Fresh grapes are a favorite quick, easy and healthy snack among consumers young and old. In addition to their taste, a growing body of research on fresh grapes suggests that grapes may offer significant health benefits as well. Fresh grapes are a well-known fruit worldwide, fitting into almost any lifestyle. For 2013, The Packer, an industry publication, reported that nearly 30% of consumers said that they used fresh grapes as a healthy snack during the past 12 months, and that grapes remained a top performer for food retailers, generating approximately 5.7% of a retailers' total produce sales. Based on the United States Department of Agriculture (“USDA”), Economic Research Service, the per capita consumption of fresh grapes during the 2013-2014 season was approximately 7.8 pounds. Fresh grapes are also processed for the production of wine, raisins, juices and canned products. The higher production cost and higher product value of fresh grapes result from more intensive production practices than are required for grapes grown for processing. While California supplies the majority of total grape volume, imports have made fresh grapes available year-round in the United States, with shipments mostly from Chile. Most U.S. production is marketed from May to October. Chilean grapes dominate the market from December to April.
Approximately 31% of our non-tropical fruit net sales are from the sale of avocados. According to the latest published
statistics from the USDA, for the 10-year period from 2004 to 2014, avocado imports to the United States increased by 190%. Per capita consumption of avocados in the United Sates also increased significantly in the last 10 years. According to the Economic Research Service of the USDA, per capita consumption of avocados reached approximately 5.9 pounds during the 2013-2014 season, resulting in approximately 1.9 billion pounds of avocados being consumed in the United States.
We sell a variety of non-tropical fruit, including all of the types referred to above. In 2014, non-tropical fruit sales in North America, Europe, the Middle East, Asia and South America accounted for approximately 54%, 4%, 26%, 10% and 6%, respectively, of our total net sales of non-tropical fruit. We obtain our supply of non-tropical fruit from company-owned farms in Chile and from independent growers principally in Chile, the United States and Mexico. In Chile, we purchase non-tropical fruit from independent growers and also produce a variety of non-tropical fruit on approximately 5,800 acres of company-owned or leased land. Our avocados are sourced principally from Mexico. In Mexico, we have our own sourcing operations, ensuring a consistent supply of high-quality avocados during the growing season. Purchase contracts for non-tropical fruit are typically made on an annual basis.
6
Melons
According to the latest available FAO data, for the 10-year period from 2001 to 2011, the volume of imports of cantaloupes and other melons increased in Europe, North America, Asia and the Middle East by 47%, 3%, 44% and 90% respectively. Based on USDA Economic Research Service, during 2013, total per capita consumption of melons in the United States reached approximately 25.9 pounds, of which 8.3 pounds were cantaloupes. Melons are one of the highest volume fresh produce items, and this category includes many varieties, such as cantaloupe, honeydew, specialty melons and watermelon. During the summer and fall growing seasons in the United States, Canada and Europe, demand is met in large part by local suppliers of unbranded or regionally branded melons. By contrast, in North America and Europe, imports significantly increase, and melons generally command premium pricing from November to May. Melons are grown in temperate and tropical locations and have a relatively short growing cycle.
We sell a variety of melons including cantaloupe, honeydew, watermelon and specialty melons. Cantaloupes represented
approximately 73% of our melon sales volume in 2014. We are a significant producer and distributor of melons from November to May in North America by sourcing melons from our company-controlled farms and independent growers in Central America, where production generally occurs during this period. Melons sold in North America and Europe from November to May generally command a higher price due to fewer operators and the lack of availability of alternative fruit. Melon sales in North America accounted for 98% of our net sales of melons in 2014. Based on volume, we produced 92% of the melons we sold in 2014 on company-controlled farms and purchased the remainder from independent growers.
We are able to provide our customers in North America with a year-round supply of melons from diverse sources. For example, we supply the North America market during its summer season with melons from Arizona, California and the East Coast of the United States. In Arizona, we have our own melon growing operation on approximately 3,000 acres of leased land.
We have devoted significant research and development efforts towards maintaining our expertise in melons, especially
cantaloupes. Melon crop yields are highly sensitive to weather conditions and are adversely affected by high levels of rain during the growing period of the fruit. We have developed specialized melon growing technology that we believe has reduced our exposure to the risk of unfavorable weather conditions and significantly increased our yields.
Tomatoes
The United States is the second largest producer of tomatoes in the world, behind China. Mexico and Canada are also important suppliers of fresh tomatoes within North America. For 2013, The Packer, an industry publication, reported that nearly 75% of consumers purchased tomatoes during the past 12 months, and that tomatoes remained a top performer for food retailers, generating approximately 5.7 % of a retailers' total produce sales.
We source our tomatoes mainly from the United States, Mexico, Canada and Guatemala. The tomato category is highly
fragmented with many growers, re-packers and wholesalers in various geographic regions of the United States. As a high volume item, tomatoes are important for our network of distribution and re-packing facilities. This product category allows us to add value through leveraging our purchase volumes to reduce costs and perform the sorting, packaging and custom labeling locally, in addition to delivering on a just-in-time basis to retail chains and foodservice customers. With our fresh-cut fruit and vegetable facilities, we add additional value by incorporating tomatoes into our consumer-packaged products. We have developed a greenhouse tomato operation in Guatemala where we source volume for the North America market. During October 2013, we acquired approximately 7,200 total acres of agricultural production land, packing houses and farm equipment in Florida and Virginia in order to expand our tomato category in North America. In March 2014, we acquired an additional 2,600 acres of agricultural production land in Florida. We believe these acquisitions of field tomato and vegetable assets complement our state-of-the-art greenhouse operation in Costa Rica and Guatemala and give us the opportunity to continue to expand our tomato and vegetable product offerings. It provides us with year-round U.S. production capabilities and enables us to provide our customers with high-quality, locally grown tomatoes, further strengthening our competitive position in the produce industry.
Vegetables We distribute and market a variety of vegetables including potatoes, onions, bell peppers and cucumbers. While we sell
bulk product, we also use our size and distribution network to find opportunities to add value such as sorting and packaging. We source our vegetables from independent growers in North and Central America and from our own greenhouse operation in Costa Rica. We plan to use the newly acquired agricultural production land in Florida and Virginia to grow vegetables for the North America market.

7
Other Fruit, Products and Services We produce, distribute and market a variety of other fruit, including strawberries, plantains and mangos, as well as various
other varieties of fruit. We source these other fruit items from company controlled farms and independent growers in Costa Rica, Colombia, Guatemala and the United States.
Included in Other Fruit, Products and Services is also our third-party ocean freight business and our third-party plastics and box manufacturing business. Our third-party ocean freight business allows us to generate incremental revenue on vessels’ return voyages to our product sourcing locations and when space is available on outbound voyages to our major markets, which reduces our overall shipping costs. Our plastics and box manufacturing business produces bins, trays, bags and boxes. The box manufacturing business is intended mainly to satisfy internal packaging requirements. In the case of the plastic manufacturing business, we principally sell these products to third parties and also use a portion for our own internal packaging requirements.
Prepared Food
We have a royalty-free perpetual license to use the DEL MONTE® Trademark in connection with the production, manufacture, sale and distribution of prepared foods and beverages in over 100 countries throughout Western, Eastern and Central Europe, Africa, the Middle East and countries formerly part of the Soviet Union. In Europe, Del Monte is the premier brand with an approximate 90 year history associated with fruit-based or fruit-derived products and is the leading brand for canned fruit and pineapple in many Western European markets. The DEL MONTE® brand has had a presence in the United Kingdom, the largest market, since 1926 and is perceived to be a quality brand with high consumer awareness. The DEL MONTE® brand has a reputation with both consumers and retailers for value, quality and reliability.
We produce, distribute and market prepared pineapple, peaches, fruit cocktail, pears, tomatoes, fruit juices and other fruit and vegetables. Our prepared pineapple products are sourced from our own facility in Kenya. Our deciduous prepared food products, which include peaches, fruit cocktail, pears and apricots are principally sourced from our own facility in Greece and from independent producers. Our tomato products are sourced from our own facility in Greece and from independent producers in Europe and the Middle East. We also distribute and market beverages, including ambient juices and juice drinks as well as various snacks. Our prepared food products are sold primarily under the DEL MONTE® label and under the buyers’ own label for major retailers. We also produce and market industrial products that are composed of fruit that has been processed in our production facilities in the form of purees, pulps and concentrates for further processing (juice, yogurt, cake manufacture and pizza) and for sale to the foodservice industry worldwide. We expect to continue investing in new product development to increase revenue, maintain our premium price position and market leadership in our product categories. We plan to expand our offerings in the snack category by offering multiple varieties and sizes of fruit and vegetables in plastic pots and pouches with new and improved recipes and various juices, targeting the convenience store and foodservice trade in addition to the traditional retail stores in selected European and Middle East markets. We are focusing on improving the European prepared food business and concentrating on higher growth markets in the Middle East.
Our prepared food segment also includes our Jordanian food business. This business includes a state-of-the-art vertically integrated poultry business, including poultry farms, hatcheries, a feed mill, a slaughterhouse and a meat processing plant in Jordan. Our Jordanian poultry business is the leading provider of poultry products to retail stores and foodservice operators in that country. The meat processing operation provides meat products for the Jordanian market and to other Middle East and North African markets.
Logistics Operations
We market and distribute our products to retail stores, foodservice operators, wholesalers and distributors in over 100 countries around the world. As a result, we conduct complex logistics operations on a global basis, transporting our products from the countries in which they are grown to the many markets in which they are sold worldwide. Maintaining fruit at the appropriate temperature is an important factor in preventing premature ripening and optimizing product quality and freshness. Consistent with our reputation for high-quality fresh produce, we must preserve our fresh fruit in a continuous temperature-controlled environment, beginning with the harvesting of the fruit in the field through its distribution to our end markets.
We have a fully integrated logistics network, which includes land and sea transportation through a broad range of refrigerated environments in vessels, port facilities, containers, trucks and warehouses. Our objective is to maximize utilization of our logistics network to lower our average per-box logistics cost, while remaining sufficiently flexible to redeploy capacity or shipments to meet fluctuations in demand in our key markets. We believe that our control of the logistics process is a competitive advantage because we are able to continuously monitor and maintain the quality of our produce and ensure timely and regular

8
distribution to customers on a year-round basis. Because logistics costs are also our largest expense other than our cost of products, we devote substantial resources to managing the scheduling and availability of various means of reliable transportation.
We transport our fresh produce to markets worldwide using our fleet of 15 owned and six chartered refrigerated vessels. In addition, we also spot charter refrigerated vessels during the year based on seasonal requirements. The majority of our chartered vessels are chartered for terms of two to 10 years. We believe that our fleet of owned vessels, combined with longer-term charters, is effective in reducing our ocean freight costs and mitigates our exposure to the volatility of the charter market. We also operate a fleet of approximately 4,500 refrigerated containers, 13% are owned and the remaining 87% are under operating leases. Our logistics system is supported by various information systems. As a vertically integrated food company, managing the entire distribution chain from the field to the customer requires the technology and infrastructure to meet our customers’ complex delivery needs.
Sales and Marketing
DEL MONTE® is a 120-year old brand that is recognized by consumers worldwide for quality, freshness and reliability. We employ a variety of marketing tools, including but not limited to advertising, public relations and promotions, to reinforce our brand equity with consumers and the trade. Depending on the product and market, we also provide technical, logistical and merchandising support aimed at safeguarding the superior quality of our products to the ultimate consumer. Our sales and marketing activities are conducted by our sales force located at our sales offices worldwide and at each of our distribution centers. Our commercial efforts are supported by marketing professionals located in key markets and regional offices. A key element of our sales and marketing strategy is to use our distribution centers and fresh-cut facilities as a means of providing value-added services to our customers.
We actively support our customers through technical training in the handling of fresh produce, in-store merchandising support, joint promotional activities, market research and inventory and other logistical support. Since most of our customers carry only one branded product for each fresh produce items, our marketing and promotional efforts for fresh produce emphasize trade advertising and in-store promotions.
We have an exclusive worldwide license to the Controlled Ripening Technology (“CRT”), one of the most recent innovations in banana packaging. CRT packaging was created for individual single-serve packages, a 10-pound institutional pack and 40-pound bulk as well as bagged banana boxes. This packaging utilizes state-of-the-art technology to help improve the ripening and handling process while helping retailers increase banana sales, reduce product losses and maximize profits by extending the product’s yellow shelf life.
The level of marketing investment necessary to support the prepared food business is significantly higher than that required for the fresh produce and fresh-cut fruit and vegetable business. We have utilized a variety of promotional tools to build the DEL MONTE® brand and engage consumers in key markets in Europe, Africa and the Middle East. In certain European markets, we utilize distributors to perform product distribution, sales and marketing activities for the prepared food business. Under these distribution agreements, the sales, warehousing, logistics, marketing and promotion functions are all performed by the distributor. This strategy of utilizing independent distributors enables us to reduce distribution and sales and marketing expenses. In addition, we plan to expand our prepared food business by entering new markets in Eastern Europe, Africa and the Middle East and by expanding our offerings in the snack category, targeting the convenience store and foodservice trade in selected European and Middle East markets.
During 2014, one customer, Wal-Mart, Inc. (including its affiliates), accounted for approximately 11% of our total net sales. These sales are reported in our banana, other fresh produce and prepared food segments. No other customer accounted for 10% or more of our net sales. In 2014, the top 10 customers accounted for approximately 29% of our net sales.
Note 22, “Business Segment Data” included in Item 8. Financial Statements and Supplementary Data contains information
regarding net sales to external customers attributable to each of our reportable segments and geographic regions, gross profit by each of our reportable segments, total assets attributable to each of our geographic regions, and information concerning the dependence of our reportable segments on foreign operations, for each of the years 2014, 2013 and 2012, respectively.
North America
In 2014, 54% of our net sales were in North America. In North America, we have established a highly integrated sales and marketing network that builds on our ability to control transportation and distribution throughout our extensive logistics network. We operate a total of 23 distribution centers and fresh-cut facilities in North America. Our distribution centers have ripening capabilities and/or other value-added services. In 2013, we constructed a new state-of-the-art distribution center in

9
Ontario, Canada including fresh-cut production and banana ripening rooms. We also operate four port facilities, which include cold storage facilities.
Our logistics network provides us with a number of sales and marketing advantages. For example, because we are able to maintain the quality of our fresh produce in a continuous temperature-controlled environment, we are under less pressure to fully sell a shipment prior to its arrival at port. We are thus better able to manage the timing of our sales to optimize our margins. Our ability to off-load shipments for cold storage and distribution throughout our network also improves ship utilization by minimizing in-port docking time. Our logistics network also allows us to manage our inventory among distribution centers to effectively respond to changes in customer demand.
We have sales professionals in locations throughout the United States and Canada. We sell to leading grocery stores and other retail chains, wholesalers, mass merchandisers, supercenters, foodservice operators, club stores, convenience stores and distributors in North America. These large customers typically take delivery of our products at the port facilities, which we refer to as FOB delivery. We also service these customers, as well as an increasing number of smaller regional chains and independent grocers, through our distribution centers.
Europe
In 2014, 19% of our net sales were in Europe. We distribute our fresh produce and prepared food products throughout Europe. Our fresh produce products are distributed to leading retail chains, smaller regional customers as well as to wholesalers and distributors through direct sales and distribution centers. In the United Kingdom, we have a sales and marketing office in Staines, England and operate a fresh-cut facility in Wisbech, England. In Germany, we have a sales and marketing office in Hamburg and operate a distribution center in the Frankfurt area. In France, we recently opened a distribution center with banana ripening capabilities in the Paris area to service an expanding customer base. In the Netherlands, Spain, Portugal, Italy and Poland, we have sales and marketing entities that perform direct sales of our fresh produce products.
Our prepared food products are distributed through independent distributors throughout most of Europe. In the United Kingdom, our prepared food products are distributed using a combination of both independent distributors and our own marketing entity.
Middle East and North Africa
In 2014, 14% of our net sales were in the Middle East and North Africa. We distribute our products through independent distributors and company-operated distribution facilities. In recent years, we have increased our sales in the Middle East market through distributors and established our own direct sales initiatives. Our distribution/manufacturing center in Dubai, United Arab Emirates (“UAE”) is a state-of-the-art facility with just-in-time delivery capabilities that includes banana ripening and cold storage facilities, fresh-cut fruit and vegetable operations, an ultra-fresh juice manufacturing operation and prepared food manufacturing. We distribute these products in the UAE and export them to other Middle East countries. We also operate a distribution center in Abu-Dhabi, UAE that includes banana ripening and cold storage facilities and we operate a lettuce farm on leased land in Ras Al Khaimah, UAE. In Saudi Arabia, through our 60%-owned joint venture, we own two distribution centers with banana ripening, cold storage facilities and fresh-cut fruit and vegetable operations and prepared food manufacturing capabilities for juices, potatoes and sandwiches. One of the distribution centers is located in Riyadh, the capital city of Saudi Arabia, and the other distribution center is located in Jeddah, the second largest city in the country. These strategically located distribution centers distribute our fresh produce and prepared food products to this growing market. In addition, we market and distribute prepared food products in the UAE, Jordan, Saudi Arabia and various other Middle East and North African markets. In Jordan, we own a state-of-the-art vertically integrated poultry business including poultry farms, hatcheries, feed mill, slaughterhouse and a meat processing plant. We are the leading provider of poultry products to retail stores and foodservice operators in that country. In Jordan, we also own a meat processing operation that provides meat products for the local market and for export to other Middle East and North African markets. In 2014, as part of our expansion in the region, we opened a sales and marketing office in Qatar. We also have sales and marketing offices in Turkey, Ukraine and in Russia. We believe that the Middle East, North Africa and countries formerly part of the Soviet Union represent an area for increased sales and development of our fresh and prepared food products. Utilizing our extensive knowledge of this region, we plan to capitalize on this opportunity with increased focus and investments in these markets.

10
Asia In 2014, 11% of our net sales were in Asia. We distribute our products in Asia through direct marketing and large
distributors. Our principal markets in this region are Japan, South Korea, mainland China and Hong Kong. In Japan, we distribute 100% of the products we sold in 2014 through our own direct sales and marketing organization. As part of our expansion in Japan, we recently opened a new fresh-cut facility in Kobe. Our products are distributed from four distribution centers located at strategic ports in Japan with cold storage and banana ripening operations.
We also engage in direct sales and marketing activities in South Korea and Hong Kong. In other Asian markets, including mainland China, we sell to local distributors. We have one distribution center and banana ripening facility in Hong Kong. In South Korea, we have three distribution centers that utilize state-of-the art ripening technology which increase our ability to offer value-added services to our customers.
South America In South America, we have direct sales and marketing activities in Chile and also utilize local distributors in this region.
Our sales in these markets focus mainly on non-tropical fruit including grapes, apples, pears, peaches, plums, cherries, kiwi and nectarines.
Competition We compete based on a variety of factors, including the appearance, taste, size, shelf life and overall quality of our fresh
produce, price and distribution terms, the timeliness of our deliveries to customers and the availability of our produce items. The fresh produce business is highly competitive, and the effect of competition is intensified because our products are perishable. Competition in the sale of bananas, pineapples, melons and the other fresh fruit and vegetables that we sell comes from competing producers and distributors. Our sales are also affected by the availability of seasonal and alternative produce. While historically our main competitors have been multinational banana and pineapple producers, our significantly increased product offering in recent years has resulted in additional competition from a variety of companies. These companies include local and regional producers and distributors in each of our fresh produce and fresh-cut product categories.
The extent of competition varies by product. In the pineapple and non-tropical fruit markets, we believe that the high degree of capital investment and cultivation expertise required, as well as the longer length of the growing cycle, makes it relatively difficult to enter the market. Increased competition in the production and sale of Del Monte Gold ® Extra Sweet pineapples could adversely affect our results. We expect these competitive pressures to continue.
In the banana market, we continue to face competition from a limited number of large multinational companies. At times, particularly when demand is greater than supply, we also face competition from a large number of relatively small banana producers. Unlike the pineapple and non-tropical fruit markets, there are few barriers to entry into the banana market. Supplies of bananas can be increased relatively quickly due to bananas relatively short growing cycle and the limited capital investment required for banana growing. As a result of changes in supply and demand, as well as seasonal factors, banana prices fluctuate significantly.
In the melon market, we compete with producers and distributors of both branded and unbranded melons. From June to October, the peak North American and European melon-growing season, many growers enter the market with less expensive unbranded or regionally branded melons due to the relative ease of growing melons during this period, the short growth cycle and reduced transportation costs resulting from the proximity of the melon farms to the markets. These factors permit many smaller domestic growers to enter the market. During the offshore growing season from November to May, we compete with growers principally in Central America. In recent years, there has been an abundant supply of melons in the market during the offshore growing season, which has negatively affected our results.
The fresh-cut produce market is highly fragmented, and we compete with a wide variety of local and regional distributors of branded and unbranded fresh-cut produce and, in the case of certain fresh-cut vegetables, a small number of large, branded producers and distributors. However, we believe that our principal competitive challenge is to capitalize on the growing trend of retail chains and independent grocers to outsource their own on-premises fresh-cut operations. We believe that our sales strategy, which emphasizes not only our existing sources of fresh produce, but also a full range of value-added services, strict compliance with food safety standards and our national distribution capability, positions us to increase our share of this market.
The processed fruit and beverage markets are mature markets characterized by high levels of competition and consumer
awareness. Consumer choices are driven by price and/or quality. Large retailers with their “buyers own label” (“BOL”) products

11
appeal to price-conscious consumers, while brand names are the key differentiator for quality-focused consumers. In the processed food and beverage markets in Europe, Africa and the Middle East, we compete with various local producers, large retailers with their BOL products, as well as with large international branded companies. It is in the branded section that our processed foods products, specifically, canned fruit and pineapple in many European countries, hold a leading position in these markets. The mature state of the market in Western Europe, together with the strength and sophistication of the large retailers there, account in part for the increasing presence of BOL products in many food and beverage categories. In the past few years, we have faced increased competitive pressure, particularly in the U.K. market, for branded processed food and beverage products. At the same time, our marketing and distribution costs in these European markets have increased. In order to reduce our costs and increase our competitiveness in the processed food business, we use distributors in certain key European markets to perform product distribution and sales and marketing activities. Under these arrangements, the sales, warehousing, logistics, marketing and promotion functions are all performed by the distributor. In the United Kingdom, we have also outsourced our beverage production. This strategy takes advantage of lower cost and established marketing and distribution networks and enables us to reduce costs and increase our competitiveness in these mature markets.
Quality Assurance To ensure the consistent high quality of our products, we have a quality assurance group that maintains detailed quality
specifications for all our products so that they meet or exceed minimum regulatory requirements. Our specifications require extensive sampling of our fresh produce at each stage of the production and distribution process to ensure high quality and proper sizing, as well as to identify the primary sources of any defects. Our fresh produce is evaluated based on both external appearance and internal quality, using size, color, porosity, translucence and sweetness as criteria. Only fresh produce meeting our stringent quality specifications is sold under the DEL MONTE® brand.
We are able to maintain the high quality of our products by growing a substantial portion of our own produce and working
closely with our independent growers. We insist that all produce supplied by our independent growers meet the same stringent quality requirements as the produce grown on our farms. Accordingly, we monitor our independent growers to ensure that their produce will meet our agricultural and quality control standards, offer technical assistance on certain aspects of production and packing and, in some cases, manage the farms. The quality assurance process begins on the farms and continues as harvested products enter our packing facilities. Where appropriate, we cool the fresh produce at our packing facilities to maximize quality and optimize shelf life. As an indication of our commitment to quality, many of our operations have received certificates of compliance from the International Standards of Operation, in environmental compliance (14001) and production processes (9001). We are also GlobalGap certified and in 2011, all of our operations that produce or handle high risk foods (tomatoes, melons or leafy greens) achieved certification to the Hazard Analysis & Critical Control Points ("HACCP") based safe quality food standard. HACCP is a management system in which food safety is addressed through the analysis and control of biological, chemical and physical hazards from raw material production, procurement and handling, to manufacturing, distribution and consumption of the finished product. Taken together, these certifications reflect our commitment to quality and the strictest standards of food safety.
Government Regulation
Agriculture and the sale and distribution of fresh produce are subject to extensive regulation by government authorities in the countries where the produce is grown and the countries where it is marketed. We have internal policies and procedures to comply with the most stringent regulations applicable to our products, as well as a technical staff to monitor pesticide usage and compliance with applicable laws and regulations. We believe we are in material compliance with these laws and regulations.
We are also subject to various government regulations in countries where we market our products. The countries in which
we market a material amount of our products are the United States, Canada, the countries of the European Union (“EU”), Japan, China, South Korea, Jordan, the UAE and Saudi Arabia. These government regulations include:
• sanitary regulations, particularly in the United States and the EU; • regulations governing pesticide use and residue levels, particularly in the United States, United Kingdom,
Germany and Japan; and • regulations governing traceability, packaging and labeling, particularly in the United States and the EU. Any failure to comply with applicable regulations could result in an order barring the sale of part or all of a particular
shipment of our products or, in an extreme case, the sale of any of our products for a specified period. In addition, we believe there has been an increasing emphasis on the part of consumers, as well as retailers, wholesalers, distributors and foodservice operators,

12
on food safety issues, which could result in our business and operations being subject to increasingly stringent food safety regulations or guidelines.
European Union Banana Import Regulations
In December 2007, most of the African, Caribbean and Pacific countries (ACP), including Cameroon, signed a bilateral agreement with the EU that allows ACP bananas duty free access to the EU market without quantitative limitation commencing January, 1, 2008. Our Cameroon sourced bananas fall under this agreement.
In December 2009, the EU entered into an agreement with certain Latin America banana exporting countries to settle a long running dispute over banana import tariffs. This agreement was ratified in May 2010. Under this agreement, the EU will gradually reduce import tariffs on bananas from Latin America on an annual basis from the current level of €132 per ton in 2014 to €114 per ton by 2019, except for countries under Free Trade Agreements (FTA's). Countries under FTA's that signed bilateral agreements with the EU in 2012 are benefiting from accelerated but gradual reduction of import duties. The FTA's are in effect for Central American countries, Columbia, and Peru. The duty for FTA countries was €117 per ton in 2014, and the duty is €110 per ton for 2015 and will be reduced to €75 per ton by January 1, 2020. Our Columbia and Central America sourced bananas benefit from this FTA agreement.
Environmental Proceedings The management, use and disposal of some chemicals and pesticides are inherent aspects of our production operations.
These activities and other aspects of production are subject to various environmental laws and regulations, depending upon the country of operation. In addition, in some countries of operation, environmental laws can require the investigation and, if necessary, remediation of contamination related to past or current operations. We are not a party to any dispute or legal proceeding relating to environmental matters where we believe that the risk associated with the dispute or legal proceeding would be material, except as described in Item 3. Legal Proceedings and Note 17, “Litigation” to the Consolidated Financial Statements included in Item 8. Financial Statements and Supplementary Data in connection with the Kunia Well Site.
On May 10, 1993, the EPA identified a certain site at our plantation in Hawaii for potential listing on the National Priorities List under the Comprehensive Environmental Response, Compensation and Liability Act of 1980, as amended. See Item 3. Legal Proceedings and Note 17, “Litigation” to the Consolidated Financial Statements included in Item 8. Financial Statements and Supplementary Data.
Research and Development, Patents and Licenses, Etc.
Our research and development programs have led to improvements in agricultural and growing practices and product packaging technology. These programs are directed mainly at reducing the cost and risk of pesticides, using natural biological agents to control pests and diseases, testing new varieties of our principal fruit varieties for improved crop yield and resistance to wind damage and improving post-harvest handling. We have also been seeking to increase the productivity of low-grade soils for improved banana growth and experimenting with various other types of fresh produce. Our research and development efforts are conducted by our staff of professionals and include studies conducted in laboratories, as well as on-site field analysis and experiments. Our research and development professionals are located at our production facilities and in the United States, and we provide our growers with access to improved technologies and practices. We operate research and development facilities in the United States and Costa Rica where we conduct various research activities relating to the development of new fruit varieties.
Some of the research and development projects include:
• the development of the Del Monte Gold® Extra Sweet pineapple and other pineapple and melon varieties; and • improved irrigation methods and soil preparation for melon planting.
Our total corporate research and development expenses were $4.1 million, $4.4 million and $4.0 million for 2014, 2013
and 2012, respectively, and are included in selling, general and administrative expenses in the Consolidated Financial Statements.
We have the exclusive right to use the DEL MONTE® brand for fresh fruit, fresh vegetables and other fresh and fresh-cut produce and certain other specified products on a royalty-free basis under a worldwide, perpetual license from Del Monte Corporation, an unaffiliated company that owns the DEL MONTE® trademark. Del Monte Corporation and several other unaffiliated companies manufacture, distribute and sell under the DEL MONTE® brand canned or processed fruit, vegetables and other produce, as well as dried fruit, snacks and other products. Our licenses allow us to use the trademark “DEL MONTE®” and

13
the words “DEL MONTE® ” in association with any design or logotype associated with the brand. The licenses also give us certain other trademarks and trademark rights, on or in connection with the production, manufacture, sale and distribution of fresh fruit, fresh vegetables, other fresh produce and certain other specified products. In addition, the licenses allow us to use certain patents and trade secrets in connection with the production, manufacture, sale and distribution of our fresh fruit, fresh vegetables, other fresh produce and certain other specified products.
We also have a royalty-free perpetual license to use the DEL MONTE® trademark in connection with the production, manufacture, sale and distribution of all food and beverage products in Europe, Africa, the Middle East and countries formerly part of the Soviet Union.
We also sell produce under several other brands for which we have obtained registered trademarks, including UTC®, Rosy®, Fruit Express®, Just Juice®, Fruitini® and other regional brands. Seasonality
In part, as a result of seasonal sales price fluctuations, we have historically realized a greater portion of our net sales and of our gross profit during the first two calendar quarters of the year. The sales price of any fresh produce item fluctuates throughout the year due to the supply of and demand for that particular item, as well as the pricing and availability of other fresh produce items, many of which are seasonal in nature. For example, the production of bananas is continuous throughout the year and production is usually higher in the second half of the year, but the demand for bananas varies because of the availability of other fruit. As a result, demand for bananas is seasonal and generally results in higher sales prices during the first six months of the calendar year. We make most of our sales of non-tropical fruit from October to May. In the melon market, the entry of many growers selling unbranded or regionally branded melons during the peak North American and European melon growing season results in greater supply, and therefore lower selling prices, from June to October. As a result of greater demand during the fourth quarter, the prepared food business is expected to have higher net sales and gross profit during this period. These seasonal fluctuations are illustrated in the following table, which presents certain unaudited quarterly financial information for the periods indicated:
Year endedDecember 26,
2014December 27,
2013Net sales:
First quarter $ 982.3 $ 918.8Second quarter 1,131.3 1,023.9Third quarter 884.6 861.1Fourth quarter 929.3 879.9
Total $ 3,927.5 $ 3,683.7Gross profit:
First quarter $ 106.7 $ 98.6Second quarter 121.5 105.9Third quarter 73.9 53.0Fourth quarter 62.7 32.9
Total $ 364.8 $ 290.4
Employees
At year end 2014, we had approximately 45,000 employees worldwide, substantially all of whom are year-round employees. Approximately 77% of these persons are employed in production locations. We believe that our overall relationship with our employees and unions is satisfactory.

14
Organizational Structure
We are organized under the laws of the Cayman Islands and, as set forth in our Amended and Restated Memorandum of Association, we are a holding company for the various subsidiaries that conduct our business on a worldwide basis. Our significant subsidiaries, all of which are directly or indirectly wholly owned, are:
Subsidiary Country of IncorporationCorporacion de Desarrollo Agricola Del Monte S.A. Costa RicaDel Monte Fresh Produce Company United StatesDel Monte Fresh Produce International Inc. LiberiaDel Monte Fresh Produce N.A., Inc. United StatesDel Monte Fund B.V. CuracaoDel Monte International GmbH SwitzerlandDel Monte Fresh Produce Sarl Luxembourg
Web site Access to Reports
We file annual, quarterly and current reports, and amendments to those reports, proxy statements and other information with the SEC. You may access and read our filings without charge through the SEC’s Web site at www.sec.gov. You may also read and copy any document we file with the SEC at the SEC’s Public Reference Room located at 100 F Street, NE, Room 1580, Washington, D.C. 20549. Please call the SEC at 1-800-SEC-0330 for further information on the Public Reference Room.
Our annual reports on Form 10-K, quarterly reports on Form 10-Q, current reports on Form 8-K, and all amendments to those reports can be viewed on the Company’s Web site at www.freshdelmonte.com as soon as reasonably practicable after such material is electronically filed with, or furnished to, the SEC. Information on our Web site is not a part of this Annual Report on Form 10-K.
In addition, copies of our annual report may be obtained free of charge, upon written request to attention: Investor Relations, c/o Del Monte Fresh Produce Company, 241 Sevilla Avenue, Coral Gables, Florida 33134.
Item 1A. Risk Factors
We are subject to many risks and uncertainties that may affect our future financial performance and our stock price. Some of the risks and uncertainties that may cause our financial performance to vary or that may materially or adversely affect our financial performance or stock price are discussed below.
We could realize losses and suffer liquidity problems due to declines in sales prices for bananas, pineapples and other fresh produce.
Our profitability depends largely upon our profit margins and sales volumes of bananas, pineapples and other fresh produce. In 2012, 2013 and 2014, banana sales accounted for the most significant portion of our total net sales, and historically pineapple sales have accounted for the most significant portion of our total gross profit.
Supplies of bananas can be increased relatively quickly due to the banana’s relatively short growing cycle and the limited capital investment required for banana growing. As a result of imbalances in supply and demand and import regulations, banana prices fluctuate; consequently, our operating results could be adversely affected.
Sales prices for bananas, pineapples and other fresh produce are difficult to predict. It is possible that sales prices for bananas and pineapples will decline in the future, and sales prices for other fresh produce may also decline. In recent years, there has been increasing consolidation among food retailers, wholesalers and distributors. We believe the increasing consolidation among food retailers may contribute to further downward pressure on our sales prices. In the event of a decline in sales prices or sales volumes, we could realize significant losses, experience liquidity problems and suffer a weakening in our financial condition. A significant portion of our costs is fixed, so that fluctuations in the sales prices have an immediate impact on our profitability. Our profitability is also affected by our production costs, which may increase due to factors beyond our control.

15
Due to fluctuations in the supply of and demand for fresh produce, our results of operations are seasonal, and we realize a greater portion of our net sales and gross profit during the first two quarters of each year.
In part as a result of seasonal sales price fluctuations, we have historically realized a greater portion of our gross profit during the first two quarters of each year. The sales price of any fresh produce item fluctuates throughout the year due to the supply of and demand for that particular item, as well as the pricing and availability of other fresh produce items, many of which are seasonal in nature. For example, the production of bananas is continuous throughout the year and production is usually higher in the second half of the year, but the demand for bananas during that period varies because of the availability of seasonal and alternative fruit. As a result, demand for bananas is seasonal and generally results in higher sales prices during the first six months of each calendar year. In the melon market, the entry of many growers selling unbranded or regionally branded melons during the peak North American and European melon growing season results in greater supply, and therefore, lower sales prices from June to October. In the North American and European regions, we realize most of our sales and gross profit for melons, grapes and non-tropical fruit from November to May. In the prepared food business, we historically realize the largest portion of our net sales and gross profit in the third and fourth quarters of the year.
Crop disease, severe weather, natural disasters and other conditions affecting the environment, including the effects of climate change, could result in substantial losses and weaken our financial condition.
Crop disease, severe weather conditions, such as floods, droughts, windstorms and hurricanes, and natural disasters, such as earthquakes, may adversely affect our supply of one or more fresh produce items, reduce our sales volumes, increase our unit production costs or prevent or impair our ability to ship products as planned. This is particularly true in the case of our premium pineapple product, the Del Monte Gold® Extra Sweet pineapple, because a substantial portion of our production is grown in one region in Costa Rica. Since a significant portion of our costs are fixed and contracted in advance of each operating year, volume declines due to production interruptions or other factors could result in increases in unit production costs, which could result in substantial losses and weaken our financial condition. We have experienced crop disease, insect infestation, severe weather and other adverse environmental conditions from time to time, including hurricanes, droughts, floods and earthquakes in our sourcing locations. Severe weather conditions may occur with higher frequency or may be less predictable in the future due to the effects of climate change. When crop disease, insect infestations, severe weather, earthquakes and other adverse environmental conditions destroy crops planted on our farms or our suppliers’ farms or prevent us from exporting them on a timely basis, we may lose our investment in those crops or our purchased fruit cost may increase.
The fresh produce and prepared food markets in which we operate are highly competitive.
The fresh produce and prepared food business is highly competitive, and the effect of competition is intensified because most of our products are perishable. In banana and pineapple markets, we compete principally with a limited number of multinational and large regional producers. In the case of our other fresh fruit and vegetable products, we compete with numerous small producers, as well as regional competitors. Our sales are also affected by the availability of seasonal and alternative fresh produce. The extent of competition varies by product. To compete successfully, we must be able to strategically source fresh produce and prepared food of uniformly high quality and sell and distribute it on a timely and regular basis. In addition, our profitability has depended significantly on the sale of our Del Monte Gold ® Extra Sweet pineapples. Increased competition in the production and sale of Del Monte Gold ® Extra Sweet pineapples could adversely affect our results. We expect these competitive pressures to continue.
We are subject to material currency exchange risks because our operations involve transactions denominated in various currencies.
We conduct operations in many areas of the world involving transactions denominated in various currencies, and our results of operations, as expressed in dollars, may be significantly affected by fluctuations in rates of exchange between currencies. Although a substantial portion of our net sales (41% in 2014) are denominated in non-dollar currencies, we incur a significant portion of our costs in dollars. Although we periodically enter into currency forward contracts as a hedge against currency exposures, we may not enter into these contracts during any particular period or these contracts may not adequately offset currency fluctuations. We generally are unable to adjust our non-dollar local currency sales prices to compensate for fluctuations in the exchange rate of the dollar against the relevant local currency. In addition, there is normally a time lag between our costs incurred and collection of the related sales proceeds. Accordingly, if the dollar appreciates relative to the currencies in which we receive sales proceeds, our operating results may be negatively affected. Our costs are also affected by fluctuations in the value, relative to the U.S. dollar, of the currencies of countries in which we have significant production operations, with a weaker dollar resulting in increased production costs.

16
Our strategy of diversifying our product line, expanding into new geographic markets and increasing the value-added services that we provide to our customers may not be successful.
We are diversifying our product line through acquisitions and internal growth. In addition, we have expanded our service offerings to include a higher proportion of value-added services, such as the preparation of fresh-cut produce, ripening, customized sorting and packing, direct-to-store delivery and in-store merchandising and promotional support. This strategy represents a significant departure from our traditional business of delivering our products to our customers at the port. In recent periods, we have made significant investments in distribution centers, new growing operations and, fresh-cut and prepared food facilities through capital expenditures and have expanded our business into new geographic markets. We may not be successful in anticipating the demand for these products and services, in establishing the requisite infrastructure to meet customer demands or the provision of these value-added services. During recent years, we incurred significant asset impairment and other charges as a result of our continuing efforts to align our diversified product lines to meet market demand. During 2014, we incurred $2.2 million in asset impairment charges principally related to an under-performing distribution center in Germany, certain areas of a non-tropical fruit plantation in Chile due to adverse weather conditions.
The fair value of the prepared food unit’s trademarks are highly sensitive to differences between estimated and actual cash flows and changes in the related discount rate used to evaluate the fair value of these assets. If we are unable to recover from current challenging economic conditions in Europe, the prepared food reporting unit trademarks may be at risk for impairment in the future.
If we are not successful in our diversification efforts, our business, financial condition or results of operations could be materially and adversely affected.
The loss of one or more of our largest customers, or a reduction in the level of purchases made by these customers, could negatively impact our sales and profits.
Sales to Wal-Mart, Inc., our largest customer, amounted to approximately 11% of our total net sales in 2014 and our top 10 customers collectively accounted for approximately 29% of our total net sales. We expect that a significant portion of our revenues will continue to be derived from a relatively small number of customers. We believe these customers make purchase decisions based on a combination of price, product quality, consumer demand, customer service performance, desired inventory levels and other factors that may be important to them at the time the purchase decisions are made. Changes in our customers' strategies or purchasing patterns, including a reduction in the number of brands they carry, may adversely affect our sales. Additionally, our customers may face financial or other difficulties which may impact their operations and cause them to reduce their level of purchases from us, which could adversely affect our results of operations. Customers also may respond to any price increase that we may implement by reducing their purchases from us, resulting in reduced sales of our products. If sales of our products to one or more of our largest customers are reduced, this reduction may have a material adverse effect on our business, financial condition, and results of operations. Any bankruptcy or other business disruption involving one of our significant customers also could adversely affect our results of operations.
Increased prices for fuel, packaging materials or short-term refrigerated vessel charter rates could increase our costs significantly.
Our costs are determined in large part by the prices of fuel and packaging materials, including containerboard, plastic, resin and tin plate. We may be adversely affected if sufficient quantities of these materials are not available to us. Any significant increase in the cost of these items could also materially and adversely affect our operating results. Other than the cost of our products (including packaging), sea and inland transportation costs represent the largest component of cost of products sold.
During 2013, cost of fuel decreased 7%, containerboard increased 4% and fertilizer decreased 13% as compared with 2012. During 2014, cost of fuel decreased 5%, containerboard increased 1% and fertilizer decreased 8%. In addition, we are subject to the volatility of the charter vessel market because six of our refrigerated vessels are chartered. These charters are principally for periods of two to 10 years. Charter rates have generally remained stable over the past three years. As a result, significant increases in fuel, packaging material, fertilizer and charter rates would materially and adversely affect our results.
Compliance with regulation aimed at mitigating the effects of climate change, as discussed elsewhere in these Risk Factors, could also increase the cost of fuel for our shipping and logistics operations. We might be unable to adjust our product pricing to reflect our increased costs. Even if we are able to adjust our product pricing, our customer's buying patterns could change to reflect a greater reliance on local production rather than imports.

17
We are subject to the risk of product contamination and product liability claims.
The sales of our products involve the risk of injury to consumers. Such injuries may result from tampering by unauthorized personnel, product contamination or spoilage, including the presence of foreign objects, substances, chemicals, or residues introduced during the growing, packing, storage, handling or transportation phases. While we are subject to governmental inspection and regulations and believe our facilities comply in all material respects with all applicable laws and regulations, including internal product safety policies, we cannot be sure that consumption of our products will not cause a health-related illness in the future or that we will not be subject to claims or lawsuits relating to such matters. Even if a product liability claim is unsuccessful, the negative publicity surrounding any assertion that our products caused illness or injury could adversely affect our reputation with existing and potential customers and our brand image. In addition, claims or liabilities of this sort might not be covered by our insurance or by any rights of indemnity or contribution that we may have against others. We maintain product liability insurance in an amount that we believe is adequate. However, we cannot be sure that we will not incur claims or liabilities for which we are not insured or that exceed the amount of our insurance coverage, resulting in significant cash outlays that would materially and adversely affect our results and financial condition.
We are subject to legal and environmental risks that could result in significant cash outlays.
We are involved in several legal and environmental matters that, if not resolved in our favor, could require significant cash outlays and could materially and adversely affect our results of operations and financial condition. In addition, we may be subject to product liability claims if personal injury results from the consumption of any of our products.
The U.S. Environmental Protection Agency (“EPA”) has placed a certain site at our former plantation in Oahu, Hawaii on the National Priorities List under the Comprehensive Environmental Response, Compensation and Liability Act of 1980. Under an order entered into with the EPA, we completed a remedial investigation and engaged in a feasibility study to determine the extent of the environmental contamination. The remedial investigation report was finalized in January 1999 and approved by the EPA in February 1999. A final draft feasibility study was submitted for EPA review in December 1999 and updated in December 2001 and October 2002, and approved by the EPA in April 2003. In September 2003, the EPA issued the Record of Decision (“ROD”). The EPA estimated in the ROD that the remediation costs associated with the cleanup of our plantation would range from $12.9 million to $25.4 million. Certain portions of the EPA’s estimates were discounted using a 3% interest rate. The undiscounted estimates are between $14.8 million to $28.7 million. As of December 26, 2014, there is $13.8 million included in other noncurrent liabilities and $0.8 million included in accounts payable and accrued expenses in our Consolidated Balance Sheets relating to the Kunia well site clean-up, which we expect to expend in 2015. During 2014, as a result of a meeting held with the EPA which resulted in changes to the remediation work being performed, we reduced the liability related to the Kunia well site clean-up by $1.4 million. Going forward, we expect to expend approximately $0.8 million in 2015, and $4.7 million for 2016 through 2019 on this matter. See Item 3. Legal Proceedings and Note 17, “ Litigation ” to the Consolidated Financial Statements included in Item 8. Financial Statements and Supplementary Data. In addition, we are involved in several actions in U.S. and non-U.S. courts involving allegations by numerous Central American and Philippine plaintiffs that they were injured by exposure to a nematocide containing the chemical Dibromochloropropane (“DBCP”) during the 1970’s. See Item 3. Legal Proceedings and Note 17, “Litigation” to the Consolidated Financial Statements included in Item 8. Financial Statements and Supplementary Data.
Environmental and other regulation of our business, including potential climate change regulation, could adversely impact us by increasing our production cost or restricting our ability to import certain products into the United States.
Our business depends on the use of fertilizers, pesticides and other agricultural products. The use and disposal of these products in some jurisdictions are subject to regulation by various agencies. A decision by a regulatory agency to significantly restrict the use of such products that have traditionally been used in the cultivation of one of our principal products could have an adverse impact on us. For example, most uses of methyl bromide, a pesticide used for fumigation of imported produce (principally melons) for which there is currently no known substitute, were phased out in the United States in 2006. However, various exemptions will allow its use offshore until 2015. Also, under the Federal Insecticide, Fungicide and Rodenticide Act, the Federal Food, Drug and Cosmetic Act and the Food Quality Protection Act of 1996, the EPA is undertaking a series of regulatory actions relating to the evaluation and use of pesticides in the food industry. Similarly, in the EU, regulation (EC) No. 1107/2009 which became effective on June 14, 2011, fundamentally changed the pesticide approval process from the current risk base to hazard criteria based on the intrinsic properties of the substance. These actions and future actions regarding the availability and use of pesticides could have an adverse effect on us. In addition, if a regulatory agency were to determine that we are not in compliance with a regulation in that agency’s jurisdiction, this could result in substantial penalties and a ban on the sale of part or all of our products in that jurisdiction.

18
There has been a broad range of proposed and promulgated state, national and international regulation aimed at reducing the effects of climate change. Such regulations apply or could apply in countries where we have interests or could have interests in the future. In the United States, there is a significant possibility that some form of regulation will be enacted at the federal level to address the effects of climate change. Such regulation could take several forms that could result in additional costs in the form of taxes, the restriction of output, investments of capital to maintain compliance with laws and regulations, or required acquisition or trading of emission allowances. Climate change regulation continues to evolve, and while it is not possible to accurately estimate either a timetable for implementation or our future compliance costs relating to implementation, we do not believe that such regulation is reasonably likely to have a material effect in the foreseeable future on our business, results of operations, capital expenditures or financial position.
We are exposed to political, economic and other risks from operating a multinational business.
Our business is multinational and subject to the political, economic and other risks that are inherent in operating in numerous countries. These risks include those of adverse government regulation, including the imposition of import and export duties and quotas, currency restrictions, expropriation and potentially burdensome taxation. For example, banana import regulations have in prior years restricted our access to the EU banana market and increased the cost of doing business in the EU. In December 2009, the EU entered into an agreement with certain Latin America banana exporting countries to settle the long running dispute over banana import tariffs. This agreement was ratified in May 2010. Under this agreement, the EU will gradually reduce import tariffs on bananas from Latin America on an annual basis from the current level of €132 per ton in 2014 to €114 per ton by 2019, except for countries under Free Trade Agreements (FTA's). Countries under FTA's that have signed bilateral agreements with the EU in 2012 are benefiting from accelerated but gradual reduction of import duties. FTA's are effect for Central American countries, Columbia, and Peru. The duty for FTA countries was €117 per ton in 2014, and the duty is €110 per ton for 2015 and will be reduced to €75 by January 1, 2020. We cannot predict the impact of further changes to the banana import tariffs or new quotas on the EU banana market.
Costa Rica and Ecuador, countries in which we operate, have established “minimum” export prices for bananas that are used as the reference point in banana purchase contracts from independent producers, thus limiting our ability to negotiate lower purchase prices. These minimum export price requirements could potentially increase the cost of sourcing bananas in countries that have established such requirements.
We are also subject to a variety of government regulations in countries where we market our products, including the United States, the EU, Asia, countries of the Middle East and Africa. Examples of the types of regulation we face include:
• sanitary regulations;
• regulations governing pesticide use and residue levels; and
• regulations governing packaging and labeling.
If we fail to comply with applicable regulations, it could result in an order barring the sale of part or all of a particular shipment of our products or, possibly, the sale of any of our products for a specified period. Such a development could result in significant losses and could weaken our financial condition.
Acts or omissions of other companies could adversely affect the value of the DEL MONTE® brand.
We depend on the DEL MONTE® brand in marketing our products. We share the DEL MONTE® brand with unaffiliated companies that manufacture, distribute and sell canned or processed fruit and vegetables, dried fruit, snacks and other products. Acts or omissions by these companies, including an instance of food-borne contamination or disease, may adversely affect the value of the DEL MONTE® brand. As a result, our reputation and the value of the DEL MONTE ® brand may be adversely affected by negative consumer perception.
Our success depends on the services of our senior executives, the loss of whom could disrupt our operations.
Our ability to maintain our competitive position is dependent to a large degree on the services of our senior management team. We may not be able to retain our existing senior management personnel or attract additional qualified senior management personnel.

19
Our acquisition and expansion strategy may not be successful.
Our growth strategy is based in part on growth through acquisitions or expansion, which poses a number of risks. We may not be successful in identifying appropriate acquisition candidates, consummating acquisitions on satisfactory terms or integrating any newly acquired or expanded business with our current operations. We may issue additional Ordinary Shares, incur long-term or short-term indebtedness, spend cash or use a combination of these for all or part of the consideration paid in future acquisitions or expansion of our operations. The execution of our acquisition and expansion strategy could entail repositioning or similar actions that in turn require us to record impairments, restructuring and other charges. Any such charges would reduce our earnings.
Our indebtedness could limit our financial and operating flexibility and subject us to other risks.
Our ability to obtain additional debt financing or refinance our debt on acceptable terms, if at all, in the future for working capital, capital expenditures or acquisitions may be limited either by financial considerations or due to covenants in existing debt agreements.
Our ability to meet our financial obligations will depend on our future performance, which will be affected by prevailing economic conditions and financial, business and other factors, some of which are beyond our control. Our ability to meet our financial obligations also may be adversely affected by the seasonal nature of our business, the cyclical nature of agricultural commodity prices, the susceptibility of our product sourcing to crop disease, severe weather and other adverse environmental conditions and other factors.
Since we are a holding company, our ability to meet our financial obligations depends primarily on receiving sufficient funds from our subsidiaries. The payment of dividends or other distributions to us by our subsidiaries may be restricted by the provisions of our credit agreements and other contractual requirements and by applicable legal restrictions on payment of dividends and other distributions.
If we were unable to meet our financial obligations, we would be forced to pursue one or more alternative strategies, such as selling assets, restructuring or refinancing our indebtedness or seeking additional equity capital, strategies which could be unsuccessful. Additional sales of our equity capital could substantially dilute the ownership interest of existing shareholders.
Our current credit facility imposes certain operating and financial restrictions on us. Our failure to comply with the obligations under this facility, including maintenance of financial ratios, could result in an event of default, which, if not cured or waived, would permit the lender to accelerate the indebtedness due under the facility.
We are controlled by our principal shareholders.
Members of the Abu-Ghazaleh family, including our Chairman and Chief Executive Officer and one of our directors, are our principal shareholders. Together, as of February 6, 2015, they beneficially own 36.1% of our outstanding Ordinary Shares, and our Chairman and Chief Executive Officer holds, and is expected to continue to hold, an irrevocable annual proxy to vote all of these shares. We expect our principal shareholders to continue to use their interest in our Ordinary Shares to significantly influence the direction of our management, the election of our entire board of directors, the method and timing of the payment of dividends, subject to applicable debt covenants and to determine substantially all other matters requiring shareholder approval and to control us. The concentration of our beneficial ownership may have the effect of delaying, deterring or preventing a change in control, may discourage bids for the Ordinary Shares at a premium over their market price and may otherwise adversely affect the market price of the Ordinary Shares.
A substantial number of our Ordinary Shares are available for sale in the public market, and sales of those shares could adversely affect our share price.
Future sales of our Ordinary Shares by our principal shareholders, or the perception that such sales could occur, could adversely affect the prevailing market price of our Ordinary Shares. Of the 52,879,014 Ordinary Shares outstanding as of February 6, 2015, 19,079,121 Ordinary Shares are owned by the principal shareholders and are “restricted securities.” These “restricted securities” can be registered upon demand and are eligible for sale in the public market without registration under the Securities Act of 1933 (the “Securities Act”), subject to compliance with the resale volume limitations and other restrictions of Rule 144 under the Securities Act.

20
Our organizational documents contain a variety of anti-takeover provisions that could delay, deter or prevent a change in control.
Various provisions of our organizational documents and Cayman Islands law may delay, deter or prevent a change in control of us that is not approved by our board of directors. These provisions include:
• a classified board of directors;
• a prohibition on shareholder action through written consents;
• a requirement that general meetings of shareholders be called only by a majority of the board of directors or by the Chairman of the Board;
• advance notice requirements for shareholder proposals and nominations;
• limitations on the ability of shareholders to amend, alter or repeal our organizational documents; and
• the authority of the board of directors to issue preferred shares with such terms as the board of directors may determine.
In addition, a change of control would constitute an event of default under our current credit facility, which would have a material adverse effect on us. These provisions also could delay, deter or prevent a takeover attempt.
Our shareholders have limited rights under Cayman Islands law.
We are incorporated under the laws of the Cayman Islands, and our corporate affairs are governed by our Amended and Restated Memorandum and Articles of Association and by the Companies Law of the Cayman Islands. Principles of law relating to matters, such as the validity of corporate procedures, the fiduciary duties of our management, directors and controlling shareholders and the rights of our shareholders differ from those that would apply if we were incorporated in a jurisdiction within the United States. Further, the rights of shareholders under Cayman Islands law are not as clearly established as the rights of shareholders under legislation or judicial precedent applicable in most U.S. jurisdictions. As a result, our public shareholders may have more difficulty in protecting their interests in the face of actions by the management, directors or controlling shareholders than they might have as shareholders of a corporation incorporated in a U.S. jurisdiction. In addition, there is doubt as to whether the courts of the Cayman Islands would enforce, either in an original action or in an action for enforcement of judgments of U.S. courts, liabilities that are predicated upon the U.S. federal securities laws. Item 1B. Unresolved Staff Comments
None.

21
Item 2. Properties
The following table summarizes the approximate plantation acreage under production that are owned or leased by us and the principal products grown on such plantations by location as of the end of 2014:
Acres UnderProduction
LocationAcres
OwnedAcres
Leased ProductsCosta Rica 44,400 6,600 Bananas, Pineapples, MelonsGuatemala 8,800 4,000 Bananas, MelonsBrazil 3,700 — Bananas, Other CropsChile 4,300 1,500 Non-Tropical FruitKenya — 10,600 PineapplesPhilippines — 10,600 Bananas, PineapplesUnited States 4,200 3,000 Melons, Tomatoes
Our significant properties include the following: North America
We operate a total of 23 distribution centers in the United States and Canada of which ten are also fresh-cut facilities. We own eight of our distribution centers, consisting of a 200,000 square foot distribution center in Dallas, Texas, a distribution center in Plant City, Florida and Goodyear Arizona, a repack facility in Winder, Georgia, and fresh-cut facilities in Kankakee, Illinois, Portland, Oregon and Sanger, California. During 2013, we constructed a new state-of-the-art distribution center with fresh-cut facility in Ontario, Canada on owned land. The remaining 15 distribution centers are leased from third parties. All of our distribution centers have ripening capabilities and/or other value-added services. In addition, we lease four port facilities that include cold storage capabilities.
Europe
We own and operate a distribution center in the Frankfurt area of Germany. We also own and operate a fresh-cut facility in Wisbech, England. During 2013, we opened a new leased distribution center with banana ripening capability in a suburb of Paris, France. We own and operate a production facility for prepared fruit, tomato products and snacks in Larissa, Greece.
Asia
Our products are distributed from four leased distribution centers located at strategic ports in Japan with cold storage and banana ripening operations. In Japan, we also operate two fresh-cut fruit facilities. One is owned and the other one is leased. In addition, we lease three distribution centers in South Korea and lease a distribution center in Hong Kong. Our distribution centers include state-of-the art ripening technology and other value-added services.
South America
In Brazil, we own approximately 30,000 acres of land of which 3,700 acres are under production. In Uruguay, we own approximately 7,800 acres of which 4,200 acres contain a citrus plantation that is leased to a third party.
Africa
We own and operate a warehouse and cannery in Kenya.
Middle East
In Jordan, we own an integrated poultry business including poultry farms, hatcheries, a feed mill, a poultry slaughterhouse and a meat processing plant. In the UAE, we own a combined distribution/manufacturing center in Dubai. This state-of-the-art facility includes banana ripening and cold storage facilities, fresh-cut fruit and vegetable operations, an ultra fresh juice manufacturing operation and prepared food manufacturing. We also operate a lettuce farm on leased land in Ras Al Khaimah,

22
UAE. In addition, we lease and operate a distribution center in Abu-Dhabi, UAE that includes banana ripening and cold storage facilities. In Saudi Arabia, we own 60% of a joint venture that operates two owned distribution centers strategically located in Jeddah and Riyadh, with banana ripening, cold storage facilities and fresh-cut products and prepared food manufacturing capabilities.
Maritime and Other Equipment (including Containers)
We own a fleet of 15 and charter another six refrigerated vessels. In addition, we own or lease other related equipment, including approximately 4,500 refrigerated container units and 160 trucks and refrigerated trailers used to transport our fresh produce in the United States. In the Middle East, we own approximately 260 trucks principally used to deliver fresh produce and prepared food products to customers.
Other Properties
We own our U.S. executive headquarters building in Coral Gables, Florida, our Central America regional headquarters building in San Jose, Costa Rica and our South America regional headquarters building in Santiago, Chile. We own our office space in Guatemala City, Guatemala and Amman, Jordan. Our remaining office space in North America, Europe, Asia, Central and South America and the Middle East is leased from third parties.
We believe that our property, plant and equipment are well maintained in good operating condition and adequate for our present needs. Except as noted in Item 3. Legal Proceedings and Note 17, “Litigation” to the Consolidated Financial Statements included in Item 8. Financial Statements and Supplementary Data, we know of no other environmental issues that may affect the utilization of our property, plant and equipment. For further information with respect to our property, plant and equipment, see Note 6, “Property, Plant and Equipment ” to the Consolidated Financial Statements filed as part of this Report.
The principal capital expenditures planned for 2014 consist primarily of the expansion and improvement of production facilities in Costa Rica, Kenya, the Philippines, Nicaragua and Chile combined with expansion and improvements of our distribution and fresh-cut facilities in North America and Asia and production facilities in the Middle East.
Item 3. Legal Proceedings
See Note 17, “Litigation” to the Consolidated Financial Statements included in Item 8. Financial Statements and Supplementary Data. Item 4. Mine Safety Disclosures
Not applicable.

23
PART II Item 5. Market for Registrant’s Common Equity, Related Stockholder Matters and Issuer Purchases of Equity
Securities
Ordinary Share Prices and Related Matters
Our Ordinary Shares are traded solely on the New York Stock Exchange ("NYSE"), under the symbol FDP, and commenced trading on October 24, 1997, the date of our initial public offering.
The following table presents the high and low sales prices of our Ordinary Shares:
High Low2014 First quarter $ 28.30 $ 25.39Second quarter $ 30.47 $ 26.50Third quarter $ 33.47 $ 29.48Fourth quarter $ 34.28 $ 29.682013 First quarter $ 27.74 $ 25.96Second quarter $ 28.08 $ 24.91Third quarter $ 30.74 $ 27.66Fourth quarter $ 30.19 $ 26.51
Dividend Policy
In February 2013, our Board of Directors increased the quarterly cash dividend from $0.10 to $0.125 per ordinary share. We paid an aggregate of $27.9 million and $28.2 million in dividends during the years ended December 26, 2014 and December 27, 2013, respectively. Because we are a holding company, our ability to pay dividends and to meet our debt service obligations depends primarily on receiving sufficient funds from our subsidiaries. Pursuant to our credit facility, we may declare and pay dividends and distributions in cash solely out of and up to 50% of our net income for the year immediately preceding the year in which the dividend or distribution is paid, or at such time the dividend is paid or declared, as the case may be, subject to certain other credit facility conditions, when the Consolidated Leverage Ratio is less than 3.25 to 1.0. It is also possible that countries in which one or more of our subsidiaries are located could institute exchange controls, which could prevent those subsidiaries from remitting dividends or other payments to us. Dividends are payable when, as, and if declared by our board of directors, and we cannot assure that dividends will be paid in the future.
Shareholders
As of February 6, 2015, we had 72 shareholders of record, which excludes shareholders whose shares were held by brokerage firms, depositories and other institutional firms in “street name”.

24
Performance Graph
The following graph compares the cumulative five-year total return of holders of FDP ordinary shares with the cumulative total returns of the S&P 500 index and the S&P 500 Food Products index. The graph tracks the performance of a $100 investment in our common stock and in each of the indexes (with the reinvestment of all dividends) from January 1, 2010 to December 26, 2014.
1/1/2010 12/31/2010 12/30/2011 12/28/2012 12/27/2013 12/26/2014Fresh Del MonteProduce Inc.
93.37 105.65 107.18 112.87 125.86 162.54
S&P 500 126.46 145.51 148.59 172.37 228.19 205.14S&P 500 FoodProducts
117.38 131.23 150.52 161.81 214.05 211.61
The stock price performance included in this graph is not necessarily indicative of future stock price performance.

25
Share Repurchase Program
The following table provides information regarding our purchases of Ordinary Shares during the periods indicated:
Period
Total Number of
Shares Purchased (1)
AveragePrice
Paid perShare
Total Number ofShares Purchasedas Part of PubliclyAnnounced Plans
or Programs
Maximum DollarValue of Sharesthat May Yet Be
Purchased Underthe Program (2)
September 28, 2014through
October 31, 2014 — $ — — $ —
November 1, 2014through
November 30, 2014 — $ — — $ —
December 1, 2014through
December 26, 2014(3) 3,048,596 $ 33.99 3,048,596 $ 112,063,249
Total 3,048,596 $ 33.99 3,048,596 $ 112,063,249
(1) As of December 26, 2014, we repurchased and retired 4,577,772 of our ordinary shares.
(2) On May 1, 2013, we announced that our Board of Directors approved a three-year stock repurchase program of up to $300 million of our ordinary shares.
(3) Includes 2,363,996 ordinary shares purchased at a purchase price of $34.50 in a modified Dutch auction tender offer completed on December 8, 2014. The modified Dutch auction tender offer was conducted as part of the stock repurchase program described in note 2.

26
Item 6. Selected Financial Data
Our fiscal year end is the last Friday of the calendar year or the first Friday subsequent to the end of the calendar year, whichever is closest to the end of the calendar year.
The following selected financial data for the years ended December 31, 2010, December 30, 2011, December 28, 2012, December 27, 2013 and December 26, 2014 is derived from our audited Consolidated Financial Statements for the applicable year, prepared in accordance with U.S. generally accepted accounting principles.
The following selected financial data should be read in conjunction with Item 7. Management’s Discussion and Analysis of Financial Condition and Results of Operations and our Consolidated Financial Statements and accompanying notes contained in Item 8. Financial Statements and Supplementary Data in this Report.
Year ended
December 26,2014
December 27,2013
December 28,2012
December 30,2011
December 31,2010
(U.S. Dollars in millions, except share and per share data)Statement of Income Data: Net sales $ 3,927.5 $ 3,683.7 $ 3,421.2 $ 3,589.7 $ 3,552.9Cost of products sold 3,562.7 3,393.3 3,079.5 3,270.2 3,280.5
Gross profit 364.8 290.4 341.7 319.5 272.4Selling, general and administrative expenses 175.8 176.9 177.2 190.4 166.8Loss (gain) on disposal of property, plant and equipment 4.3 4.9 (0.2) (3.1) (9.2)Goodwill and trademark impairment charges — 99.6 — — —Asset impairment and other charges, net 11.2 37.1 3.3 16.3 37.3
Operating income (loss) 173.5 (28.1) 161.4 115.9 77.5Interest expense, net 2.6 2.2 2.3 5.7 9.9Other expense (income), net 12.0 (13.6) 1.9 9.7 7.5
Income (loss) before income taxes 158.9 (16.7) 157.2 100.5 60.1Provision for (benefit from) income taxes 14.3 17.2 12.2 5.7 (0.7)
Net income (loss) $ 144.6 $ (33.9) $ 145.0 $ 94.8 $ 60.8
Less: net income (loss) attributable to noncontrolling interest 2.2 0.5 1.8 2.3 (1.4)Net income (loss) attributable to Fresh Del Monte ProduceInc. $ 142.4 $ (34.4) $ 143.2 $ 92.5 $ 62.2
Net income (loss) per ordinary share attributable to Fresh Del Monte Produce Inc. - Basic $ 2.54 $ (0.61) $ 2.47 $ 1.57 $ 1.03
Net income (loss) per ordinary share attributable to Fresh Del Monte Produce Inc.- Diluted $ 2.53 $ (0.61) $ 2.46 $ 1.56 $ 1.02
Dividends declared per ordinary share $ 0.50 $ 0.50 $ 0.40 $ 0.30 $ 0.05
Weighted average number of ordinary shares: Basic 55,966,531 56,426,294 57,937,245 58,893,832 60,535,978Diluted 56,347,092 56,426,294 58,121,501 59,163,282 60,710,939
Balance Sheet Data (at period end): Cash and cash equivalents $ 34.1 $ 42.5 $ 39.9 $ 46.9 $ 49.1Working capital 631.5 633.0 563.5 522.2 513.8Total assets 2,675.3 2,589.2 2,533.4 2,504.0 2,517.7Total debt 266.9 251.4 126.2 215.5 295.6Shareholders' equity 1,787.9 1,751.2 1,831.4 1,715.1 1,631.5

27
Item 7. Management’s Discussion and Analysis of Financial Condition and Results of Operations
Overview
We are one of the world’s leading vertically integrated producers, marketers and distributors of high-quality fresh and fresh-cut fruit and vegetables, as well as a leading producer and marketer of prepared fruit and vegetables, juices, beverages and snacks in Europe, Africa and the Middle East. We market our products worldwide under the DEL MONTE® brand, a symbol of product innovation, quality, freshness and reliability since 1892. Our global sourcing and logistics system allows us to provide regular delivery of consistently high-quality produce and value-added services to our customers. Our major producing operations are located in North, Central and South America, Asia and Africa. Production operations are aggregated on the basis of our products: bananas, other fresh produce and prepared foods. Other fresh produce includes pineapples, melons, tomatoes, non-tropical fruit (including grapes, apples, pears, peaches, plums, nectarines, avocados, citrus and kiwis), fresh-cut produce and other fruit and vegetables and a plastic product and box manufacturing business and third-party ocean freight services. Prepared foods include prepared fruit and vegetables, juices, beverages, snacks, poultry and meat products. Strategy
Our strategy is a combination of maximizing revenues from our existing infrastructure, entering new markets and strict cost control initiatives. We plan to continue to capitalize on the growing global demand for fresh produce and expand our reach into existing and new markets. We expect sales growth of our fresh produce products in key markets by increasing sales volume and per unit sales prices as permitted by market conditions. Our strategy includes increasing volumes from existing production and distribution facilities in order to improve operating efficiencies and reduce per unit costs. We plan additional investments in production facilities to expand our product offering in established markets and continue with our recent expansion in growth markets, such as the Middle East, Africa and countries formerly part of the Soviet Union. We also plan additional investments in our North America distribution and fresh-cut fruit facilities and production operations to support our planned growth in this market.
Net Sales
Our net sales are affected by numerous factors, including mainly the balance between the supply of and demand for our produce and competition from other fresh produce companies. Our net sales are also dependent on our ability to supply a consistent volume and quality of fresh produce to the markets we serve. For example, seasonal variations in demand for bananas as a result of increased supply and competition from other fruit are reflected in the seasonal fluctuations in banana prices, with the first six months of each year generally exhibiting stronger demand and higher prices, except in those years where an excess supply exists. In 2014, our overall banana sales volume increased by 5% and our average per unit sales prices increased by 2%. Our net sales of other fresh produce were positively impacted by higher sales volumes of avocados, pineapples and tomatoes combined with higher sales volume of our fresh-cut products in the Middle East and Asia. In our prepared food business, we generally realize the largest portion of our net sales and gross profit in the third and fourth quarters of the year. During 2014, our prepared food net sales increased principally as a result of higher production in our poultry operations in Jordan combined with improved pricing and production volume of our industrial products.
Since our financial reporting currency is the U.S. dollar, our net sales are significantly affected by fluctuations in the value of the currency in which we conduct our sales versus the dollar, with a strong dollar versus such currencies resulting in decreased net sales in dollar terms. Including the effect of our foreign currency hedges, net sales for 2014 were positively impacted by $18.4 million, as compared to 2013, principally as a result of a stronger euro and Korean won, partially offset by a weaker Japanese yen versus the U.S. dollar.
During 2014, our net sales were positively affected by higher sales volumes of bananas and avocados principally sourced from independent growers in Costa Rica, Ecuador, Colombia and Mexico and by higher sales volume of fresh-cut products in the Middle East and Asia that resulted from an expanded customer base and improved demand for our products. Also, our net sales were positively affected by our expansion into new markets in the Middle East. Our net sales growth in recent years has been achieved primarily through increased sales volume in existing markets of other fresh produce, primarily pineapples, fresh-cut products and non-tropical fruit and favorable pricing on our Del Monte Gold® Extra Sweet pineapple combined with increased sales volume and per unit sales prices of bananas in existing and new markets. Our net sales growth in recent years has also been attributable to a broadening of our product line with the expansion of our fresh-cut produce business, specifically increased sales to the foodservice sector and convenience stores combined with our expansion into new markets. We expect our net sales growth to continue to be driven by increased sales volumes across all of our segments. In the Middle East, we expect to continue to increase our net sales of our fresh produce and prepared food product offerings as a result of our expansion in various markets in the region

28
such as Turkey, Qatar and other regional markets. We also expect to increase our sales by developing new products in the prepared food segment, targeting the convenience store and foodservice trade in selected European and Middle East markets and to continue to expand our sales of beverage products in the Middle East, European and Sub-Sahara African markets.
Cost of Products Sold
Cost of products sold is principally composed of two elements, product and logistics costs. Product cost for our produce is primarily composed of cultivation (the cost of growing crops), harvesting, packaging, labor, depreciation and farm administration. Product cost for produce obtained from independent growers is composed of procurement and packaging costs. Logistics costs include land and sea transportation and expenses related to port facilities and distribution centers. Sea transportation cost is the most significant component of logistics costs and is comprised of the cost of vessel operating expenses and chartering refrigerated vessels. Vessel operating expenses for our owned vessels include operations, maintenance, depreciation, insurance, fuel (the cost of which is subject to commodity price fluctuations), and port charges. For chartered vessels, operating expenses include the cost of chartering the vessels, fuel and port charges. Variations in containerboard prices, which affect the cost of boxes and other packaging materials, and fuel prices can have a significant impact on our product cost and our profit margins. Also, variations in the production yields, fertilizers and other input costs and the cost to procure products from independent growers can have a significant impact on our costs. Containerboard, plastic, resin and fuel prices have historically been volatile. During 2013, cost of fuel decreased 7%, containerboard increased 4% and fertilizer decreased 13% resulting in a reduction of cost of product sold of approximately $10.8 million. Also included in 2013, were $1.4 million in inventory write-off due to adverse weather conditions in Chile and $0.1 million inventory write-off related to the shut-down of a watermelon farm in Costa Rica. During 2014, cost of fuel decreased 5%, containerboard increased 1% and fertilizer decreased 8% resulting in a reduction of cost of product sold of $8.8 million. Also included in cost of product in 2014, were $0.5 million of inventory write-off related to the restructuring of our plastic business in Chile in the other fresh produce segment. During 2014, cost of product sold benefited from lower vessel operating expenses and lower distribution costs.
In general, changes in our volume of products sold can have a disproportionate effect on our gross profit. Within any particular year, a significant portion of our cost of products sold is fixed, both with respect to our operations and with respect to the cost of produce purchased from independent growers from whom we have agreed to purchase all the products they produce. Accordingly, higher volumes produced on company-owned farms directly reduce the average per-box cost, while lower volumes directly increase the average per-box cost. In addition, because the volume that will actually be produced on our farms and by independent growers in any given year depends on a variety of factors, including weather, that are beyond our control or the control of our independent growers, it is difficult to predict volumes and per-box costs. During 2014, cost of product sold was positively affected by increased production of pineapples in our Costa Rican operation, resulting is lower per unit fruit cost while procurement costs for bananas increased principally due to competition.
Since our financial reporting currency is the U.S. dollar, our costs are affected by fluctuations in the value of the currency in which we have significant operations versus the dollar, with lower costs resulting from a strong U.S. dollar. During 2014, cost of products sold was positively impacted by approximately $24.3 million as compared with 2013 due to a stronger U.S. dollar versus the various currencies in which we have significant operations, principally Costa Rica and Chile.
Selling, General and Administrative Expenses
Selling, general and administrative expenses primarily include the costs associated with selling in countries where we have our own sales force, advertising and promotional expenses, professional fees, general corporate overhead and other related administrative functions. During 2014, we decreased our selling, general and administrative expenses in Europe principally as a result of cost saving initiatives. We incurred overall higher excutive compensation and legal expenses and in the Middle East, as a result of our continued expansion, we incurred higher administration expense.
Loss (Gain) on Disposal of Property, Plant and Equipment Loss (gain) on disposal of property, plant and equipment was a loss of $4.3 million in 2014 resulting principally from
the disposal of low-yielding banana plants in Costa Rica and Guatemala in order to replant and improve productivity, partially offset by a gain on sale of shipping-related and other surplus equipment. In 2013, the loss on disposal of property, plant and equipment of $4.9 million was principally due to the disposal of low-yield banana plants in Costa Rica and Guatemala in order to re-plant and improve yields, partially offset by a gain from the sale of a refrigerated vessel and other surplus equipment.

29
Goodwill and Trademark Impairment Charges
During the fourth quarter of 2013, we recorded a goodwill and trademark impairment of $99.6 million. We impaired 100% of the goodwill and partially impaired the trademark associated with our 2004 acquisition of the prepared food business in Europe, Africa, the Middle East and countries formerly part of the Soviet Union. This impairment was principally due to the failure of this business to meet our expectations due to under-performance of the prepared food business in Europe combined with the recent cyclical downturn in industrial products.
Asset Impairment and Other Charges, Net
In 2014, we recorded asset impairment and other charges totaling $11.2 million principally related to unfavorable litigation in Europe, the closure of under-utilized distribution centers in the United Kingdom and Germany, restructuring activities in Chile, Germany, France and Brazil, and adverse weather conditions in Chile. Partially offsetting these charges were credits of $4.2 million related to our former pineapple operation in Kunia, Hawaii.
In 2013, we recorded asset impairment and other charges totaling $37.1 million principally due to exit activity in Brazil related to bananas, pineapples and melons, the closure of under-utilized facilities in Germany, Poland and the United Kingdom, restructuring costs in the United Kingdom, France and Cameroon, the closure of under-performing banana areas in Costa Rica and the Philippines and the unfavorable settlement of litigation in the United States. Partially offsetting these charges was a gain on the sale of a previously impaired facility in the United Kingdom.
Interest Expense
Interest expense consists primarily of interest on borrowings under working capital facilities that we maintain and interest on other long-term debt primarily for capital lease obligations. In 2014, our interest expense increased primarily due to higher average outstanding debt.
Other Expense (Income), Net
Other (income) expense, net, primarily consists of currency exchange gains or losses, equity gains and losses in unconsolidated companies and other miscellaneous income and expense items. During 2014, other (income) expense, net principally included higher foreign exchange losses. During 2013, other (income) expense, net, includes a $16.6 million gain related to a favorable judgment awarded in litigation combined with lower foreign exchange losses and $1.6 million in financial charges as a result of an unfavorable court ruling related to value added tax reporting in South America.
Provision for Income Taxes
The provision for income taxes in 2014 was $14.3 million. Income taxes consist of the consolidation of the tax provisions, computed on a separate entity basis, in each country in which we have operations. Since we are a non-U.S. company with substantial operations outside the United States, a substantial portion of our results of operations is not subject to U.S. taxation. Several of the countries in which we operate have favorable tax rates. We are subject to U.S. taxation on our operations in the United States. From time to time, tax authorities in various jurisdictions in which we operate audit our tax returns and review our tax positions. There are audits presently pending in various countries. There can be no assurance that any tax audits, or changes in existing tax laws or interpretations in countries in which we operate, will not result in an increased effective tax rate for us.

30
Results of Operations
The following table presents, for each of the periods indicated, certain income statement data expressed as a percentage of net sales:
Year endedDecember 26,
2014December 27,
2013December 28,
2012Statement of Income Data: Net sales 100.0% 100.0% 100.0%Gross profit 9.3 7.9 10.0Selling, general andadministrative expenses 4.5 4.8 5.2Operating income (loss) 4.4 (0.8) 4.7Interest expense 0.1 0.1 0.1Net income (loss) attributable to
Fresh Del Monte Produce Inc. 3.6 (0.9) 4.2
The following tables present for each of the periods indicated (i) net sales by geographic region, (ii) net sales by product category and (iii) gross profit by product category and, in each case, the percentage of the total represented thereby:
Year ended
December 26, 2014 December 27, 2013 December 28, 2012 (U.S. dollars in millions)Net sales by geographic region: North America $ 2,113.4 54% $ 1,968.3 54% $ 1,821.1 53%Europe 736.1 19% 713.4 19% 704.3 21%Middle East 554.3 14% 524.3 14% 387.4 11%Asia 434.5 11% 425.6 12% 422.2 12%Other 89.2 2% 52.1 1% 86.2 3%
Total $ 3,927.5 100% $ 3,683.7 100% $ 3,421.2 100%
Year ended
December 26, 2014 December 27, 2013 December 28, 2012 (U.S. dollars in millions)Net sales by product category: Banana $ 1,804.7 46% $ 1,692.2 46% $ 1,544.6 45%Other fresh produce 1,744.7 44% 1,638.5 44% 1,544.8 45%Prepared food 378.1 10% 353.0 10% 331.8 10%
Total $ 3,927.5 100% $ 3,683.7 100% $ 3,421.2 100%
Gross profit by product category: Banana $ 109.1 30% $ 62.1 21% $ 89.7 26%Other fresh produce 210.4 58% 192.8 67% 205.8 60%Prepared food 45.3 12% 35.5 12% 46.2 14%
Total $ 364.8 100% $ 290.4 100% $ 341.7 100%

31
2014 Compared with 2013
Net Sales. Net sales in 2014 were $3,927.5 million compared with $3,683.7 million in 2013. The increase in net sales of $243.8 million was attributable to higher net sales in all of our segments.
• Net sales of bananas increased by $112.5 million principally due to higher sales volume in North America and Europe and higher per unit sale prices in Europe, Asia and the Middle East. Worldwide banana sales volume increased by 5%.
Europe banana net sales increased due to higher per unit sale prices, principally as a result of lower industry supplies, favorable exchange rates and an increase in sales volume.
North America banana net sales increased due to higher sales volume primarily as a result of an expanded customer base.
Middle East banana net sales remained relatively flat as an increase in per unit sale prices due to lower industry volumes were offset by lower sales volumes. Shipments from the Philippines were reduced principally due to unfavorable growing conditions.
Asia banana net sales increased as a result of higher per unit sales prices principally due to lower industry supplies. Partially offsetting these increases in net sales was lower sales volumes as a result of reduced shipments from the Philippines due to unfavorable growing conditions, and unfavorable yen exchange rates.
• Net sales in the other fresh produce segment increased $106.2 million principally as a result of higher net sales of pineapples, tomatoes, non-tropical fruit and melons, partially offset by lower net sales of fresh-cut fruit.
Net sales of pineapples increased principally due to higher sales volumes in North America and Europe as a result of increased production from Costa Rica, partially offset by a slight decrease in per unit sales prices. Worldwide sales volume increased 14%.
Net sales of tomatoes increased principally due to additional production volume from of our new Florida and Virginia operations. Partially offsetting these increases in net sales were lower per unit sales prices principally due to product mix.
Net sales of non-tropical fruit increased principally due to higher sales volumes of avocados in North America and apples in the Middle East, primarily a result of increased customer demand. Partially offsetting these increases in net sales were lower sales of grapes, stonefruit and other deciduous fruit as a result of reduced shipments from Chile due to unfavorable growing conditions.
Net sales of melons increased due to higher per unit sales price and sales volume in North America as a result of favorable market conditions, partially offset by lower sales volumes in Europe.
Net sales of fresh-cut products decreased principally due to lower sales volume in Europe that resulted from the loss of business in our fresh-cut fruit operation in the United Kingdom and lower sales volume in North America, principally due to labor shortages. Partially offsetting these decreases in net sales were higher sales volumes in the Middle East and Asia as a result of increased customer demand.
• Net sales in the prepared food segment increased $25.1 million principally due to higher sales volumes of poultry products in Jordan resulting from improved production, and higher sales volumes of industrial pineapple products in Europe, primarily a result of reduced competition from Asian producers. Also, contributing to the increase in net sales were higher sales volume of canned pineapples, principally as a result of an expanded customer base and higher beverage sales in the Middle East and Europe due to expansion into new markets. Partially offsetting these increases in net sales were lower sales volumes of deciduous fruit in Europe as a result of lower supplies.
Cost of Products Sold. Cost of products sold was $3,562.7 million in 2014 compared with $3,393.3 million in 2013, an increase of $169.4 million. This increase in cost of products sold was primarily attributable to a 7% increase in sales volumes combined with higher banana procurement costs. Partially offsetting these increases in cost of product sold was lower vessel operating expenses and lower fuel cost combined with lower distribution costs and favorable exchange rates in Costa Rica.
Gross Profit. Gross profit was $364.8 million in 2014 compared with $290.4 million in 2013, an increase of $74.4 million. This increase was attributable to higher gross profit in all of our segments.
• Gross profit in the banana segment increased $47.0 million primarily due to higher per unit sales prices and sales volumes in Europe and higher per unit sales prices in the Middle East. Also, contributing to the increase in gross profit were

32
favorable exchange rates in Europe combined with lower vessel operating expenses and lower distribution costs. Partially offsetting these increases in gross profit was higher fruit cost as a result of increases in procurement cost from independent growers. Worldwide banana per unit sales prices increased 2% and per unit cost decreased 1%.
• Gross profit in the other fresh produce segment increased $17.6 million principally due to higher gross profit on pineapples, melons and non-tropical fruit, partially offset by lower gross profit on fresh-cut products and tomatoes.
Gross profit on pineapples increased primarily due to higher sales volumes in North America primarily as a result of higher production due to favorable growing conditions in our Costa Rica operations. Also contributing to the increase in gross profit was lower fruit cost as a result of improved yields. Worldwide pineapple per unit sales prices decreased 1% and per unit cost decreased 2%.
Gross profit on melons increased principally due to higher per unit selling prices in North America as a result of lower industry-wide volumes during the offshore melon season combined with lower per unit cost as a result of lower ocean freight and production costs.
Gross profit on fresh-cut products decreased principally due to lower sales volumes and higher labor and distribution costs in our North America operations combined with lower sales volume that resulted from the loss of business in our fresh-cut fruit operations in the United Kingdom. Partially offsetting these decreases in gross profit was higher gross profit in the Middle East principally due to higher sales volumes and lower costs.
Gross profit on tomatoes decreased due to a labor shortage in Florida combined with low yields during our first growing year in our new tomato operations.
• Gross profit in the prepared food segment increased by $9.8 million principally as a result of lower production cost and increased sales volumes in our Jordanian poultry operations combined with higher sales volume and pricing on our industrial pineapple products and higher per unit sales prices on canned deciduous fruit principally a result of improved market conditions. Partially offsetting these increases in gross profit was higher cost for canned pineapples in Europe related to additional import duties charged by the European Union. These additional import duties charged by the European Union are expected to be rescinded during 2015.
Selling, General and Administrative Expenses. Selling, general and administrative expenses decreased by $1.1 million to $175.8 million in 2014 compared with $176.9 million in 2013. The decrease was principally due to lower selling, general and administrative expenses in Europe as a result of cost reduction initiatives. Partially offsetting these decreases were higher excutive compensation and legal expenses combined with higher admistration expenses in the Middle East as a result of expansion in the region. Loss on Disposal of Property, Plant and Equipment. The loss on disposal of property, plant and equipment of $4.3 million in 2014 and $4.9 million in 2013 related principally to the disposal of low-yield banana plants in Costa Rica and Guatemala in order to replant and improve productivity, partially offset by a gain on sale of shipping-related and other surplus equipment.
Asset Impairment and Other Charges, Net. Asset impairment and other charges, net, was $11.2 million in 2014 compared with $37.1 million in 2013.
Asset impairments and other charges (credits), net, for 2014 were:• A credit of $(2.9) million primarily as a result of a favorable settlement of litigation related to the Kunia environmental
remediation site in Hawaii in the other fresh produce segment;• a credit of $(1.3) million for the reversal of accrued environmental liabilities, net of other charges, primarily related to
the Kunia well site clean-up in Hawaii as a result of a meeting held with the EPA which resulted in changes to the remediation work being performed in our other fresh produce segment;
• $8.8 million in other charges related to litigation regarding the infringement of European Union competition rules by a former indirect subsidiary not controlled by us in our banana segment;
• $1.4 million in other charges related to severance benefits as a result of discontinued export operations in our banana segment in Brazil;
• $1.3 million asset impairment charge related to the adverse effect to our non-tropical fruit plantations of continued drought conditions in Chile in the other fresh produce segment;
• $1.7 million in contract termination charges related to under-utilized distribution centers and administrative offices in the United Kingdom primarily related to the banana segment;
• $0.6 million in asset impairment and other charges related to the restructuring of our plastics business in Chile in our other fresh produce segment;

33
• $0.7 million in other charges related to severance benefits as a result of our decision to change to an independent distributor for our prepared food business segment in Germany and France;
• $0.5 million in asset impairment related to an under-performing distribution center in our banana segment in Germany;• $0.3 million in asset impairment charge related to a web domain in the other fresh produce segment; and• $0.1 million in other charges related to severance benefits for an under-performing fresh-cut facility in the United Kingdom
in the other fresh produce segment.
Asset impairments and other charges (credits), net, for 2013 were:• $11.4 million in asset impairments related to our decision to discontinue exporting bananas from Brazil and close certain
low-yield farms. The remaining farms will produce bananas only for the local market;• a credit of $(2.5) million related to the sale of a previously impaired under-utilized facility in the United Kingdom related
to the banana segment;• $2.2 million in other charges for unfavorable litigation related to a class action complaint for unpaid wages in North
America related to the other fresh produce segment; • $4.3 million in asset impairment for the closure of certain areas of a banana plantation in Costa Rica;• $9.0 million in other charges for the settlement of an unfavorable outcome to breach of contract litigation in North
America;• $7.1 million in asset impairment related to previously announced exit activities in Brazil in the other fresh produce
segment;• $2.6 million in asset impairments and other charges related to the closure of two underutilized distribution centers in
Germany in the banana segment;• $0.7 million in severance expense due to the restructuring of our fresh-cut fruit operations in the United Kingdom related
to the other fresh produce segment;• $0.2 million in contract termination costs in the United Kingdom principally related to the banana segment;• $0.1 million in asset impairment in Chile due to adverse weather conditions related to the other fresh produce segment;• $0.8 million in severance expense due to restructuring in our Cameroon banana operations;• $0.2 million in severance expense due to restructuring of our sales office in France related to the prepared food segment;• $0.3 million in asset impairments and other charges related to the closure of a watermelon farm in Costa Rica in the other
fresh produce segment; • $0.7 million in asset impairment related to the closure of certain areas of a banana plantation in the Philippines due to
underperformance;• $0.2 million in termination benefits related to the closure of two distribution centers in Poland in the banana segment;
and• a net credit of $(0.2) million related to over-accrued exit activity costs in Hawaii in the other fresh produce segment.
Operating Income (Loss). Operating income in 2014 was $173.5 million compared with an operating loss of $(28.1) million in 2013, an increase of $201.6 million. The increase in operating income was due to higher gross profit, lower asset impairment and other charges, lower selling, general and administrative expenses and lower loss on disposal of property, plant and equipment.
Interest Expense. Interest expense was $3.2 million in 2014 as compared with $2.9 million in 2013, an increase of $0.3 million. The increase was principally due to higher average loan balances.
Other Expense (Income), Net. Other expense (income), net, was expense of $12.0 million in 2014 as compared with income of $(13.6) million in 2013. The change in other expense (income), net, of $25.6 million is principally attributable to a $16.6 million gain related to a favorable judgment awarded in litigation and a gain on sale of equity securities recorded during 2013, partially offset by higher foreign exchange losses during 2014. Provision for Income Taxes. Provision for income taxes was $14.3 million in 2014 as compared with $17.2 million in 2013. The decrease in the 2014 tax provision is primarily related to a benefit resulting from a successful appeal to reinstate net operating losses in a foreign jurisdiction in 2014. Fair Value Measurements
Potential impairment exists if the fair value of a reporting unit to which goodwill has been allocated is less than the carrying value of the reporting unit. The amount of the impairment to recognize, if any, is calculated as the amount by which the carrying value of goodwill exceeds its implied value. Future changes in the estimates used to conduct the impairment review, including revenue projection, market values and changes in the discount rate used, could cause the analysis to indicate that our goodwill is impaired in subsequent periods and result in a write-off of a portion or all of goodwill. The discount rate used is based on independently calculated risks, our capital mix and an estimated market risk premium. The fair value of the prepared food reporting unit's

34
trademarks is highly sensitive to differences between estimated and actual cash flows and changes in the related discount rate used to evaluate the fair value of these assets. If we are unable to recover from challenging economic conditions in Europe and we fail to meet our current expectations, the prepared food reporting unit's trademarks may be at risk for future impairment. We disclosed the sensitivities related to the prepared food reporting unit’s trademarks in our annual financial statements included in our Annual Report on Form 10-K for the year ended December 26, 2014.
Seasonality Interim results are subject to significant variations and may not be indicative of the results of operations that may be expected for the entire 2014 fiscal year. See the information under the caption “Seasonality” provided in Item 1. Business, of our Annual Report on Form 10-K for the year ended December 26, 2014.
2013 Compared with 2012
Net Sales
Net sales in 2013 were $3,683.7 million compared with $3,421.2 million in 2012. The increase in net sales of $262.5 million was primarily attributable to higher net sales of bananas, other fresh produce and prepared food.
• Net sales in the banana segment increased by $147.6 million due to higher sales in all regions. Worldwide banana sales volume increased 7%.
Middle East banana net sales increased principally due to higher sales volumes that resulted from increased shipments from Central America to new markets in the region combined with higher per unit sales prices. Specifically, the opening of our new sales offices in Turkey and the Ukraine combined with continued expansion in other regional markets has allowed us to significantly increase our sales volume in the region.
Europe banana net sales increased primarily due to higher sales volume as a result of an expanded customer base in Germany combined with increased direct sales initiative in the Southern Europe markets such as the opening of a new sales office in Portugal. Partially offsetting these increases were lower per unit sales prices as a result of lower consumer demand due to a weak economy and unfavorable exchange rates, principally a weaker euro.
North America banana net sales increased primarily due to a 7% increase in sales volumes that resulted from higher customer demand. Partially offsetting these increases in net sales were lower per unit sales prices primarily a result of competition and high industry supplies.
Asia banana net sales increased principally due to higher per unit sales prices resulting from lower industry supply and favorable market conditions. Partially offsetting these increases in net sale were lower sales volumes as the effects of a typhoon during the fourth quarter of 2012 resulted in a significant volume reduction during the first half of 2013. Also contributing to the lower per unit sales prices was a weak Japanese yen.
• Net sales in the other fresh produce segment increased by $93.7 million principally as a result of higher sales of non-tropical fruit, fresh-cut products and tomatoes, partially offset by lower net sales of non-produce operations and lower net sales of pineapples.
Net sales of non-tropical fruit increased principally due to an increase in sales volumes and per unit sales prices of avocados in North America combined with higher sales volumes of apples and citrus in the Middle East primarily a result of expansions in these markets. Also, contributing to the increase in net sales were higher sales volume of grapes in North America and the Middle East principally due to increased supplies from Chile.
Net sales of fresh-cut products increased primarily due to higher per unit sales prices and sales volumes in North America and the Middle East that resulted from an expanded customer base and improved demand for our products in North America combined with expansion into new markets and introduction of new products in the Middle East. In Asia, net sales of fresh-cut products increased due to improved demand for our fresh-cut pineapple products. Partially offsetting these increases in net sales of fresh-cut products were lower sales volumes in Europe that resulted from our closure of a fresh-cut prepared salad facility in the United Kingdom in 2012 and the loss of business in our fresh-cut fruit operation in the United Kingdom.

35
Net sales of tomatoes increased primarily due to higher per unit sales prices that resulted from low industry supplies caused by inclement weather.
Net sales of non-produce operations decreased principally due to a temporary volume reduction that resulted from downtime for plant improvement in our Chilean plastic operation.
Net sales of pineapples decreased slightly principally due to lower sales volume and per unit sales prices in Asia that resulted from decreased production in the Philippines and a weak Japanese yen. Also, contributing to the decrease in net sales were lower sales volume in Europe as a result of weak demand and unfavorable euro exchange rates. Partially offsetting these decreases in net sales were higher sales volumes in North America and the Middle East primarily as a result of increased customer demand. Worldwide pineapple sales volume decreased 2% and per unit sales prices increased 1%.
• Net sales in the prepared food segment increased by $21.2 million principally due to higher sales volume of canned pineapple and per unit sales prices of industrial products in Europe principally as a result of improved market conditions combined with higher beverage sales volumes in the Middle East and Africa as a result of expanded production in our new Saudi Arabian juice operation and our Kenya facility. Also contributing to the increase were higher net sales of poultry and meat products in Jordan due to improved market conditions.
Cost of Products Sold
Cost of products sold was $3,393.3 million in 2013 compared with $3,079.5 million in 2012, an increase of $313.8 million. This increase in cost of products sold was primarily attributable to an overall 6% increase in sales volumes; increased fruit cost that resulted from higher procurement and production cost; higher ocean freight cost primarily a result of shipping additional volumes of Central American bananas to the Middle East; increased vessel operating expenses and higher distribution costs in the Middle East, North America and Europe. Also contributing to the increase in 2013 was a $1.4 million deferred growing crop inventory write-off as a result of adverse weather condition in our Chilean non-tropical fruit growing operations. Partially offsetting these increases in cost of product sold were lower fuel and fertilizer costs. In 2012, we recorded $0.7 million in inventory write-offs related to our previously discontinued pineapple and melon operations in Brazil and $0.4 million in inventory write-offs and clean-up costs and a credit of $(0.2) million for insurance reimbursements related to floods in Costa Rica.
Gross Profit
Gross profit was $290.4 million in 2013 compared with $341.7 million in 2012, a decrease of $(51.3) million. The decrease
in gross profit was attributable to lower gross profit in all of our segments.
• Gross profit on the banana segment decreased by $27.6 million principally due to higher fruit cost resulting from higher procurement and production costs, lower selling prices in Europe principally the result of unfavorable exchange rates and lower per unit selling prices in North America due to competitive market pricing. Also contributing to the decrease were higher ocean freight costs in the Middle East due to increased shipments from Central America. Partially offsetting these decreases in banana gross profit were higher sales prices in Asia and the Middle East. Worldwide banana per unit sales prices increased 3% and per unit costs increased 5%.
• Gross profit in the other fresh produce segment decreased by (13.0) million due to lower gross profit on fresh-cut products, non-tropical fruit, non-produce operations and melons, partially offset by higher gross profit on pineapples.
Gross profit on fresh-cut products decreased principally due to higher production and logistics costs in North America and the Middle East, partially offset by higher per unit sale prices in North America, Europe and the Middle East and higher sales volumes in Asia.Gross profit on non-tropical fruit decreased primarily due to higher fruit costs on apples in the Middle East and lower selling prices on grapes in Europe.Gross profit on non-produce operations decreased as a result of lower sales in our Chilean plastic operations due to a temporary volume reduction that resulted from downtime for plant improvement.Gross profit on melons decreased primarily due to higher fruit, ocean freight and logistic costs.Gross profit on pineapples increased primarily due to higher sales volumes in North America and the Middle East partially offset by lower sales volumes in Asia.

36
• Gross profit on the prepared food segment decreased by (10.7) million principally as a result of lower selling prices for canned pineapple and deciduous products and higher costs for canned pineapple and industrial products, partially offset by higher gross profit on poultry and meat products in Jordan.
Selling, General and Administrative Expenses
Selling, general and administrative expenses decreased by $0.3 million to $176.9 million in 2013 compared with $177.2 million in 2012. The decrease was primarily due to lower executive compensation and professional and legal fees, partially offset by higher selling and marketing expenses in North America and higher selling, marketing and administrative expenses in the Middle East as a result of expanding sales.
Loss (Gain) on Disposal of Property, Plant and Equipment Loss on disposal of property, plant and equipment of $4.9 million in 2013 principally related to the disposal of low-
yielding banana plants in Central America in order to replant and improve productivity, partially offset by a gain on the disposal of a refrigerated vessel and other surplus equipment. Gain on disposal of property, plant and equipment of $(0.2) million in 2012 was related to gains on sale of shipping related equipment, partially offset by losses on disposal of low-yielding banana plants.
Goodwill and Trademark Impairment
As a result of the failure of the prepared food business in Europe to meet our expectations due to under-performance and a recent cyclical downturn in industrial products, we recorded $99.6 million of asset impairment charges. These impairment charges consist of $75.7 million of goodwill impairment and $23.9 million of trademark impairments related to the 2004 acquisition of the Prepared Food business in Europe, Africa, the Middle East and the countries formerly part of the Soviet Union.
Asset Impairment and Other Charges, Net
Asset impairment and other charges, net were $37.1 million in 2013 as compared with $3.3 million in 2012, an increase of $33.8 million.
Asset impairment and other charges (credits) for 2013 were as follows:
• $11.4 million in asset impairments related to our decision to discontinue exporting bananas from Brazil and close certain low-yield farms. The remaining farms will produce bananas only for the local market;
• $7.1 million in asset impairment related to the previously announced exit activities in Brazil in the other fresh produce segment;
• $4.3 million in asset impairment for the closure of certain areas of a banana plantation in Costa Rica;• $0.7 million in asset impairment for the closure of certain areas of a banana plantation in the Philippines.• $9.0 million in other charges for the settlement of an unfavorable outcome to breach of contract litigation in North
America; • $2.2 million in other charges for unfavorable litigation related to a class action complaint for unpaid wages in North
America related to the other fresh produce segment;• $0.3 million asset impairment due to the closure of a watermelon farm in Costa Rica related to the other fresh produce
segment;• $2.6 million in asset impairment, severance expense and contract termination costs as a result of the closure of two
under-utilized distribution centers in Germany related to the banana segment;• $0.2 million in termination benefits related to the closure of two distribution centers in Poland related to the banana
segment;• $0.7 million in severance expense due to the restructuring of our fresh-cut fruit operations in the United Kingdom
related to the other fresh produce segment;• $0.2 million in contract termination costs in the United Kingdom principally related to the banana segment;• $0.1 million in asset impairment in Chile due to adverse weather conditions related to the other fresh produce segment;• $0.8 million in severance expense due to restructuring in our Cameroon banana operations;• $0.2 million in severance expense due to restructuring of our sales office in France related to the prepared food
segment;• $(2.5) million in credits due to the gain on sale of a previously impaired under-utilized facility in the United Kingdom
principally related to the banana segment;• a net credit of $(0.2) million related to over-accrued exit activity in Hawaii related to the other fresh produce segment.

37
Asset impairment and other charges (credits) for 2012 were as follows:
• $2.8 million in asset impairments and contract termination charges related to under-utilized distribution centers and office space in the United Kingdom primarily related to the banana segment;
• $2.6 million in asset impairments and severance charges related to the closure of a fresh-cut prepared salad facility in the United Kingdom in other fresh produce segment;
• $(1.7) million net gain on the sale of previously impaired melon assets in Guatemala related to the other fresh produce segment;
• $(1.4) million in insurance proceeds related to floods which occurred in 2010 in our Guatemala operations related to the banana segment;
• $0.7 million in net charges as a result of floods in our Costa Rica operations, comprised of $1.3 million in asset impairments less $(0.6) million of insurance proceeds related to the banana segment;
• $0.5 million in other costs related to our previous closure of Hawaii operations related to the other fresh produce segment; and
• $(0.2) million credit for the reversal of over-accrued costs in our previous closure of Costa Rica melon operation related to the other fresh produce segment.
Operating Income (Loss)
Operating loss in 2013 was $(28.1) million compared with an operating income of $161.4 million in 2012, a decrease of $(189.5) million. The decrease in operating income is attributable to lower gross profit, higher selling general and administrative expenses, a loss on disposal of property, plant and equipment and higher asset impairments and other charges, net.
Interest Expense
Interest expense was $2.9 million in 2013 as compared with $3.0 million in 2012, a decrease of $(0.1) million. The lower interest expense in 2013 was due principally to lower interest rates, partially offset by higher average debt balances.
Other Expense (Income), Net
Other expense (income), net was income of $(13.6) million in 2013 compared with an expense of $1.9 million in 2012. During 2013, we recorded a gain of $16.6 million related to a favorable judgment awarded in litigation and lower foreign exchange losses, partially offset by $1.6 million in financial charges as a result of an unfavorable court ruling related to value added tax reporting in South America. Included in other expense (income), net during 2012 was $2.6 million of foreign exchange losses, which resulted from converting Argentine pesos to U.S. dollars.
Provision for Income Taxes
Provision for income taxes was $17.2 million in 2013 compared with $12.2 million in 2012, an increase of $5.0 million. The increase in the provision for income taxes for 2013 is primarily due to $9.7 million in tax credits recorded in 2012 as compared with $0.3 million in net tax credits recorded during 2013. The 2012 tax credits were primarily for the reversals of uncertain tax positions due to a lapse in the statute of limitations and settlement of tax audits and litigation and changes in tax rates in certain foreign jurisdictions. Partially offsetting the higher levels of tax credits during 2012 was lower taxable income in certain jurisdictions in 2013.

38
Liquidity and Capital Resources
Net cash provided by operating activities was $230.7 million for 2014 compared with $108.7 million for 2013, an increase of $122.0 million. The increase in cash provided by operating activities was principally due to higher net income and lower levels of fresh produce and prepared food inventory combined with other changes in operating assets and liabilities. Fresh produce and prepared food inventories decreased principally due to higher net sales and the change to third-party distributors for prepared food in Germany and France. Also contributing to the increase in net cash provided by operating activities were improved collections of trade accounts receivable in the Middle East.
Net cash provided by operating activities was $108.7 million for 2013 compared with $172.6 million for 2012, a decrease of $63.9 million. The decrease in cash provided by operating activities was principally due to lower net income and higher levels of accounts receivables principally as a result of higher net sales in North America and the Middle East, partially offset by higher accounts payable and accrued expenses principally as a result of higher net sales.
Working capital was $631.5 million at December 26, 2014 compared with $633.0 million at December 27, 2013, a decrease of $1.5 million. This decrease in working capital is principally due to lower inventory and higher accounts payable and accrued expenses, partially offset by higher accounts receivable and pre-paid expenses and other current assets. The increase in accounts receivable, and accounts payable and accrued expenses was principally due to higher net sales. The increase in pre-paid expenses and other current assets were principally the result of favorable foreign currency hedges.
Net cash used in investing activities was $160.2 million for 2014, $161.9 million for 2013 and $72.4 million for 2012. Net cash used in investing activities for 2014 consisted of $149.1 million in capital expenditures and $12.7 million in purchase of businesses, partially offset by $1.6 million in proceeds from sales of property, plant and equipment. Our capital expenditures totaled $149.1 million in 2014. Approximately $75.8 million of our capital expenditures was related to the other fresh produce segment consisting principally for expansion of our tomato operations in the United States, a new fresh-cut fruit plant in Japan, and expansion and improvements to production facilities in Costa Rica, Chile, the Philippines and the Middle East. Approximately $48.2 million of our 2014 capital expenditures was related to the banana segment, consisting primarily of expansion of our production operations in the Philippines, improvements and expansion of our production operations in Central America, and distribution centers in North America and Europe. Approximately $21.1 million of our capital expenditures in 2014 was related to the prepared food segment, consisting principally of expansion and improvements to production facilities in Kenya, Costa Rica, Jordan and Greece. Also included in our capital expenditures in 2014 was approximately $4.0 million for information technology systems. The purchase of business of $12.8 million consisted of two pineapple farms in Costa Rica.
Net cash used in investing activities for 2013 consisted of $159.5 million in capital expenditures and $20.6 million in
purchase of businesses, partially offset by $10.4 million in proceeds from sales of property, plant and equipment and $7.8 million in proceeds from sale of securities available for sale. Our capital expenditures totaled $159.5 million in 2013, consisting primarily of approximately $49.6 million for expansion and improvements to production facilities in Costa Rica, Guatemala, the Philippines and Chile related to the banana and other fresh produce segments; $39.3 million for expansion of our tomato and vegetable assets in North America related to the other fresh produce segment; $16.8 million principally for improvements and expansion of production facilities in Kenya, Greece and Jordan related to the prepared food segment; $32.7 million principally for new distributions centers in Canada and France and improvements and expansion to distribution centers in the United States and the Middle East principally related to the banana and other fresh produce segment and $8.3 million for expansion of our fresh-cut production facilities primarily in North America related to the other fresh produce segment. During 2013, capital expenditures also included approximately $9.7 million for the acquisition of two refrigerated vessels and related shipping equipment and $3.1 million for information technology systems. The purchase of businesses of $20.6 million consisted of the purchase of a pineapple farm in Costa Rica and a banana farm in the Philippines.
Net cash used for investing activities for 2012 consisted primarily of capital expenditures of $79.7 million, purchase of securities available for sale of $11.0 million, partially offset by proceeds from sales of property, plant and equipment of $9.8 million and proceeds from sale of securities available for sale of $8.5 million. Our capital expenditures totaled $79.7 million in 2012, consisting primarily of approximately $16.6 million for expansion and improvements of production facilities in Saudi Arabia, Kenya and Greece related to the prepared food segment and $ 37.6 million for expansion and improvements to production facilities in Costa Rica, Guatemala, the Philippines, Chile and Brazil related to the banana and other fresh produce segments. In addition, during 2012 we also made capital expenditures of $11.7 million for the acquisition of refrigerated vessels and $10.1 million principally for improvements to our distribution facilities in North America related to the banana segment and $3.7 million for information technology systems.
Net cash (used in) provided by financing activities was $(88.7) million for 2014, $51.2 million for 2013 and $(103.5) million for 2012. Net cash (used in) financing activities for 2014 of $(88.7) million consisted of $131.1 million in repurchase of

39
ordinary shares and $27.9 million in dividends paid, partially offset by $16.3 million of net borrowings on long-term debt, $48.9 million in proceeds from stock options exercised, $5.0 million in contributions from noncontrolling interest and $0.1 million in excess tax benefit from stock-based compensation. Repurchases of ordinary shares of $131.1 million were made under our 2013 three-year stock repurchase program and included approximately $81.6 million related to our modified dutch auction tender offer which expired on December 2, 2014.
Net cash provided by financing activities for 2013 of $51.2 million consisted of net borrowing on long-term debt of
$127.3 million, contributions from noncontrolling interests of $3.6 million and proceeds from stock options exercised of $44.0 million, partially offset by repurchase of ordinary shares of $95.5 million and dividends paid of $28.2 million.
Net cash (used in) financing activities for 2012 of $(103.5) million consisted of net repayment of long-term debt of $88.0 million, dividends paid of $23.2 million and repurchase of our ordinary shares of $12.9 million, partially offset by proceeds from stock options exercised of $10.1 million, contributions from noncontrolling interest of $7.0 million and excess tax benefit from stock-based compensation of $3.6 million.
We finance our working capital and other liquidity requirements primarily through cash from operations and borrowings under our $500 million syndicated senior unsecured revolving credit facility maturing October 23, 2017 (the "Credit Facility") with Bank of America, NA as administrative agent. Borrowings under the Credit Facility bear interest at a spread over the London Interbank Offer Rate ("LIBOR") that varies with our leverage ratio. The Credit Facility also includes a swing line facility and a letter of credit facility. We intend to use the Credit Facility from time to time for our working capital needs, capital expenditues, possible funding of acquisitions, possible share repurchases and satisfaction of other obligations.
At December 26, 2014, we had borrowings of $262.5 million outstanding under the Credit Facility bearing interest at a per annum rate of 1.52%. In addition, we pay a fee on unused commitments.
The Credit Facility is unsecured as long as we meet a certain leverage ratio and also requires us to comply with certain financial and other covenants, including limitations on capital expenditures, the amount of dividends that can be paid in the future, the amount and types of liens and indebtedness, material asset sales and mergers. As of December 26, 2014, we were in compliance with all of the financial and other covenants contained in the Credit Facility.
At December 26, 2014, we had $236.1 million of borrowing availability under committed working capital facilities, primarily under the Credit Facility. At December 26, 2014, we applied $15.4 million to the letter of credit facility, comprised primarily of certain contingent obligations and other governmental agencies and purchases of equipment guarantees. We also had $11.3 million in other letters of credit and bank guarantees not included in the letter of credit facility.
As of December 26, 2014, we had $266.9 million of long-term debt and capital lease obligations, including the current portion, consisting of $262.5 million outstanding under the Credit Facility, $1.0 million of capital lease obligations and $3.4 million of other long-term debt and notes payable.
Based on our operating plan, combined with our borrowing limit under our Credit Facility, we believe we will have sufficient resources to meet our cash obligations in the foreseeable future. As of December 26, 2014, we had cash and cash equivalents of $34.1 million. We paid approximately $5.6 million in severance payments and contractual obligations during 2014, primarily as a result of the closure of distribution centers in the United Kingdom and Germany and restructuring of our fresh-cut facilities in the United Kingdom. We expect to make additional payments of approximately $2.6 million principally related to the previously announced closure of certain under-utilized banana distribution facilities in the United Kingdom and Germany as well as restructuring in France. These cash outlays were or will be funded from operating cash flows and available borrowings under our credit facilities.
The principal capital expenditures planned for 2015 consist primarily of the expansion and improvement of production
facilities in Costa Rica, the Philippines, Kenya, Nicaragua, Mexico and Chile. In addition, we also plan capital expenditures for expansion and improvements of our distribution and fresh-cut facilities in North America, the Middle East and Asia and production facilities in the UAE. We expect to fund our capital expenditures in 2015 through operating cash flows and borrowings under our Credit Facility. We generated cash from operations of $230.7 million in 2014 and had $222.1 million of borrowing capacity available under our Credit Facility as of December 26, 2014.
The fair value of our derivatives changed from a net liability of $(3.3) million as of December 27, 2013 to a net asset of $25.6 million as of December 26, 2014, related to our foreign currency cash flow hedges. For foreign currency hedges, these fluctuations are primarily driven by the strengthening or weakening of the U.S. dollar compared to currencies being hedged relative

40
to the contracted exchange rates and the settling of a number of contracts throughout 2014. During 2014, we predominately entered into derivative contracts to hedge the British pound, Euro, Japanese yen, and Polish zloty relative to our sales. We also entered into contracts to hedge the Costa Rican colon, Korean won, Philippine peso, and Chilean peso, in order to hedge our production and procurement costs. The change in 2014 was primarily related to the stronger U.S. dollar relative to the euro and yen when compared to contracted exchange rates.
We enter into derivative instruments with counterparties that are highly rated and do not expect a deterioration of our counterparty’s credit ratings; however, the deterioration of our counterparty’s credit ratings would affect the Consolidated Financial Statements in the recognition of the fair value of the hedges that would be transferred to earnings as the contracts settle. We expect that $22.5 million and $3.1 million of the net fair value of hedges recognized as a net gain in accumulated other comprehensive income ("AOCI") will be transferred to earnings during the next 12 months and in 2016, respectively, along with the effect of the related forecasted transaction.
Other
We are involved in several legal and environmental matters that, if not resolved in our favor, could require significant cash outlays and could have a material adverse effect on our results of operations, financial condition and liquidity. See Item 1. Business Overview under “Environmental Matters” and Item 3. Legal Proceedings and Note 17, “Litigation” to the Consolidated Financial Statements included in Item 8. Financial Statements and Supplementary Data.
Critical Accounting Policies
We believe the following accounting polices used in the preparation of our Consolidated Financial Statements may involve a high degree of judgment and complexity and could have a material effect on our Consolidated Financial Statements.
Growing Crops
Expenditures on pineapple, melon, tomatoes and non-tropical fruit, including grapes, growing crops are valued at the lower of cost or market and are deferred and charged to cost of products sold when the related crop is harvested and sold. The deferred growing costs consist primarily of land preparation, cultivation, irrigation and fertilization costs. The deferred growing crop calculation is dependent on an estimate of harvest yields and future crop expenditures. If there is an unexpected decrease in estimated harvest yields, a write-down of deferred growing costs may be required.
Stock-Based Compensation
Our share-based payments are composed entirely of compensation expense related to stock options and all stock option awards are granted to employees and members of our Board of Directors, each of whom meets the definition of an employee under the provisions of the Accounting Standards Codification ™ (the “Codification” or “ASC”) guidance on “Compensation-Stock Compensation”. We use the Black-Scholes option pricing model to estimate the fair value of stock options granted.
Stock-based compensation expense related to stock options, restricted stock awards and restricted stock units, for the year ended December 26, 2014, included in the determination of income before provision for income taxes and net income, totaled $12.4 million on the straight-line, single award basis, and is included in the accompanying Consolidated Statements of Income for the year ended December 26, 2014 in selling, general and administrative expenses.
We realized an excess share-based payment deduction resulting from stock options exercised through a reduction in taxes currently payable and related effect on cash flows of less than $0.1 million for the year ended December 26, 2014. The amount of cash received from the exercise of stock options was $48.9 million for the year ended December 26, 2014. As of December 26, 2014, the total remaining unrecognized compensation costs related to non-vested stock options and restricted stock units amounted to $6.5 million and $10.7 million, respectively, which will be amortized over the weighted-average remaining requisite service period of 1.9 and 2.1 years, respectively.
Goodwill and Indefinite-Lived Intangible Assets
We assess goodwill for impairment on an annual basis on the first day of the fourth quarter of each year, or sooner if events indicate such a review is necessary. As part of the 2004 Del Monte Foods acquisition, we also acquired perpetual, royalty-free licenses to use the DEL MONTE® brand for processed and/or canned food in more than 100 countries throughout Europe, Africa, the Middle East and countries formerly part of the Soviet Union. This indefinite-lived intangible asset is not being amortized but is reviewed for impairment consistent with the Codification guidance on “Intangibles – Goodwill and Other” and includes

41
$44.6 million other non-current assets at December 26, 2014 related to these licenses and is fair valued based on the annual impairment assessment performed during the fourth quarter.
Based on this valuation that is performed during the fourth quarter, we have determined that there was no impairment of goodwill in 2014. Potential impairment exists if the fair value of a reporting unit to which goodwill has been allocated is less than the carrying value of the reporting unit. The amount of the impairment to recognize, if any, is calculated as the amount by which the carrying value of goodwill exceeds its implied fair value. Future changes in the estimates used to conduct the impairment review, including revenue projection, market values and changes in the discount rate used, could cause the analysis to indicate that our goodwill is impaired in subsequent periods and result in a write-down of a portion or all of our goodwill. The discount rate used is based on independently calculated risks, our capital mix and an estimated market risk premium. As of December 26, 2014, we are not aware of any items or events that would cause an adjustment to the carrying value of Goodwill and Indefinite-Lived Intangible Assets.
As a result of our annual impairment test performed in 2013 and failure of the prepared food business to meet our expectations due to under-performance in Europe and a recent cyclical downturn in industrial products, we recorded $99.6 million of asset impairment charges, which includes impairments of $75.7 million of goodwill and $23.9 million of trademark related to the 2004 acquisition of the Prepared Food business in Europe, Africa, the Middle East and the countries formerly part of the Soviet Union.
The fair value of the prepared food unit’s trademarks are highly sensitive to differences between estimated and actual cash flows and changes in the related discount rate used to evaluate the fair value of these assets.
If we are unable to recover from current challenging economic conditions in Europe, the prepared food reporting unit trademarks may be at risk for impairment in the future.
The following table highlights the sensitivities of the goodwill and indefinite-lived intangibles at risk as of December 26, 2014 (U.S. dollars in millions):
RemainingDEL MONTE®
Trade Names and Trademarks
Carrying value of indefinite-livedintangible assets $ 44.6
Approximate percentage by whichthe fair value exceeds the carryingvalue based on annual impairmenttest as of 1st day of fourth quarter 5.5%
Amount that a one percentage point increase in the discount rate and a 5% decrease in cash flows would cause the carrying value to exceed the fair value and trigger a fair valuation $ 3.3

42
Impairment of Long-Lived Assets
We account for the impairment of long-lived assets in accordance with the the Codification guidance related to “Property, Plant and Equipment”. The Codification guidance requires write-downs to be recorded on long-lived assets used in operations when indicators of impairment are present and the undiscounted cash flows estimated to be generated by those assets are less than the assets’ carrying amount. We recorded charges related to impairment of long-lived assets in 2014, 2013 and 2012 of $2.2 million, $22.1 million and $2.2 million, respectively. Such charges are included in asset impairment and other charges, net in the accompanying Consolidated Statements of Income for the years ended December 26, 2014, December 27, 2013 and December 28, 2012.
In assessing potential impairment, we consider the operating performance and projected undiscounted cash flows of the relevant assets. If the projected cash flows are estimated to be less than the assets’ carrying value, we may have to record additional impairment charges. The fair value of the assets is determined based on discounted future cash flows or independent appraisals from third parties.
Income Taxes
Deferred income taxes are recognized for the tax consequences in future years of differences between the tax basis of assets and liabilities and their financial reporting amounts at each year end, based on enacted tax laws and statutory tax rates applicable to the year in which the differences are expected to affect taxable income. Valuation allowances are established when it is deemed more likely than not that some portion or all of the deferred tax assets will not be realized. Our judgments regarding future profitability may change due to future market conditions and other factors. These changes, if any, may require adjustments to our deferred tax assets.
Contingencies
Estimated losses from contingencies are expensed if it is probable that an asset has been impaired or a liability has been incurred at the date of the financial statements and the amount of the loss can be reasonably estimated. Gain contingencies are not reflected in the financial statements until realized. We use judgment in assessing whether a loss contingency is probable and estimable. Actual results could differ from these estimates.
Environmental Remediation Liabilities
Estimated expenses associated with environmental remediation obligations are accrued when such expenses are probable and can be reasonably estimated. We have recorded provisions for the Kunia Well Site related to the expected environmental remediation. The related liability is based on the Record of Decision, which was issued by the EPA on September 25, 2003. Certain portions of the EPA’s estimates have been discounted using a 3% interest rate. In 2004, we commenced certain remediation and further testing activities. At December 26, 2014 and December 27, 2013, the total liability for the Kunia Well Site was $14.6 million and $16.4 million, respectively. During 2014, as a result of a meeting held with the EPA which resulted in changes to the remediation work being performed, we reduced the liability related to the Kunia well site clean-up by $1.4 million to $14.6 million. Going forward, we expect to expend approximately $0.8 million in 2015, and $4.7 million for 2016 through 2019 on this matter. The ultimate amount of the cost for the expected environmental remediation of the Kunia Well Site is dependent on the actual cost. Actual remediation costs could significantly differ from our estimates.
Derivative Financial Instruments
We account for derivative financial instruments in accordance with the ASC guidance on “Derivatives and Hedging”. The ASC on “Derivatives and Hedging” requires us to recognize the value of derivative instruments as either assets or liabilities in the statement of financial position at fair value. The accounting for changes in the fair value (i.e., gains or losses) of a derivative instrument depends on whether it has been designated as a hedge and qualifies as part of a hedging relationship. The accounting also depends on the type of hedging relationship, whether a cash flow hedge, a fair value hedge, or hedge of a net investment in a foreign operation. A fair value hedge requires that the effective portion of the change in the fair value of a derivative financial instrument be offset against the change in the fair value of the underlying asset, liability, or firm commitment being hedged through earnings. A cash flow hedge requires that the effective portion of the change in the fair value of a derivative instrument be recognized in other comprehensive income, a component of shareholders’ equity, and reclassified into earnings in the same period or periods during which the hedged transaction affects earnings. The ineffective portion of the change in fair value of a derivative instrument is to be recognized in earnings. The ineffective portion of the change in fair value is immaterial for the years ended December 26, 2014 and December 27, 2013.

43
We use derivative financial instruments primarily to reduce our exposure to adverse fluctuations in foreign exchange rates. When entered into, we formally designate and document the financial instrument as a hedge of a specific underlying exposure, as well as the risk management objectives and strategies for undertaking the hedge transaction. The fair values of derivatives used to hedge or modify our risks fluctuate over time. These fair value amounts should not be viewed in isolation, but rather in relation to the cash flows or fair value of the underlying hedged transactions or assets and other exposures and to the overall reduction in our risk relating to adverse fluctuations in foreign exchange rates and fuel prices.
We account for the fair value of our derivative financial instruments as either an asset in other current assets or noncurrent assets or a liability in accrued expenses or other noncurrent liabilities. We use an income approach to value our outstanding foreign currency. An income approach consists of a discounted cash flow model that takes into account the present value of future cash flows under the terms of the contracts using current market information as of the measurement date such as foreign currency spot and forward rates. An element of default risk based on observable inputs is also built into the fair value calculation.
Fair Value Measurements
We measure fair value for financial instruments, such as derivatives on an ongoing basis. We measure fair value for non-financial assets, when a valuation is necessary, such as for impairment of long-lived and indefinite-lived assets when indicators of impairment exist. Fair value is measured in accordance with the ASC on “Fair Value Measurements and Disclosures”. The ASC on “Fair Value Measurements and Disclosures” defines fair value, establishes a framework for measuring fair value and enhances disclosures about fair value measures required under other accounting pronouncements, but does not change existing guidance as to whether or not an instrument is carried at fair value. The ASC also requires us to classify fair value measurements based on the weight of observable and unobservable valuation inputs as follows: Level 1: inputs are derived from quoted prices in active markets for identical assets; Level 2: inputs are derived from significant other observable inputs and Level 3: inputs utilized are not observable.
During 2014, we recognized an additional charge of $1.7 million for a total contract termination obligation of $3.1 million related to lease payments that will continue to be incurred throughout the lease term or upon termination of the lease contract beyond our cease-use date for under-utilized distribution facilities in the United Kingdom in the banana segment. We estimated the fair value of this obligation using an income based approach, whereby our cash flow was adjusted for a market premium risk. The fair value of the contract termination obligation is classified as Level 3 of the fair value hierarchy due to the mix of unobservable inputs utilized.
During 2014, we recognized $0.5 million in asset impairment charges related to certain under-performing banana ripening assets in Germany. We estimated the fair value of these assets of $0.2 million using the market approach. The fair value of these assets are classified as Level 3 of the fair value hierarchy due to the mix of unobservable inputs utilized.
During 2013, we recognized $11.4 million in asset impairment and other charges a result of our decision to discontinue exporting bananas from Brazil and close six farms. The asset impairment consisted of a write-down of $1.0 million related to land that will be utilized for the production of other products with a carrying value of $8.8 million. The land was written down to a value of $7.8 million We estimated the fair value of these assets using the market approach. The fair valuation of the assets and contract termination obligation of $7.8 million are classified as Level 3 of the fair value hierarchy due to the mix of unobservable inputs utilized.
During 2013, we recognized $2.6 million in asset impairment charges and other charges, net related to an under-performing distribution center in Germany in the banana segment. Included in asset impairment and other charges, net, is a contract termination obligation of $0.6 million related to lease payments that will continue to be incurred throughout the lease term beyond our cease-use date. We estimated the fair value of this obligation using an income based approach, whereby our cash flows were adjusted for a market premium risk. The fair value of the contract termination obligation is classified as Level 3 of the fair value hierarchy due to the mix of unobservable inputs utilized.
New Accounting Pronouncements
In August 2014, the Financial Accounting Standards Board ("FASB") issued an Accounting Standards Update ("ASU") related to how a reporting entity must report its going-concern uncertainties in their financial statements. The new standard requires that management perform interim and annual assessments of its ability to continue as a going concern within one year of the date of issuance of its financial statements. We would be required to provide certain disclosure if there is "substantial doubt about our ability to continue as a going concern." According to the FASB, this update is meant to enhance the timeliness, clarity, and consistency of related disclosure and improve convergence with International Financial Reporting Standards, which emphasize management's responsibility for performing the going concern assessment. The amendment in this ASU will be effective for us

44
for year end 2016 and interim periods thereafter. Early adoption is permitted. We are evaluating the impact of adoption of this ASU on our financial disclosures, but don't expect this ASU to have a significant effect.
In June 2014, the FASB issued an ASU related to stock compensation. The new standard requires that a performance target that affects vesting, and that could be achieved after the requisite service period, be treated as a performance condition. As such, the performance target should not be reflected in estimating the grant date fair value of the award. The update further clarifies that compensation cost should be recognized in the period in which it becomes probable that the performance target will be achieved and should represent the compensation cost attributable to the periods for which the requisite service has already been rendered. The amendments in this ASU will be effective for us beginning the first interim period of our 2016 fiscal year and can be applied either prospectively or retrospectively to all awards outstanding as of the beginning of the earliest annual period presented as an adjustment to opening retained earnings. Early adoption is permitted. We are evaluating the impact of adoption of this ASU on our financial condition, result of operations and cash flows.
In May 2014, the FASB issued an ASU in the form of a comprehensive new revenue recognition standard that will supersede existing revenue guidance. The ASU's core principle is that a company will recognize revenue when it transfers promised goods or services to customers in an amount that reflects the consideration to which the company expects to be entitled in exchange for those goods or services. The standard outlines a five step model, whereby revenue is recognized as performance obligations within a contract are satisfied. The standard also requires new, expanded disclosures regarding revenue recognition. The amendments in this ASU will be effective for us beginning the first day of our 2017 fiscal year. Early adoption is not permitted. The standard permits the use of either the retrospective or cumulative effect transition method. We have not yet selected a transition method. We are evaluating the impact of adoption of this ASU on our financial condition, results of operations and cash flows.
Trend Information
Our net sales are affected by numerous factors, including mainly the balance between the supply of and demand for our produce and competition from other fresh produce companies. Our net sales are also dependent on our ability to supply a consistent volume and quality of fresh produce to the markets we serve. For example, seasonal variations in demand for bananas as a result of increased supply and competition from other fruit are reflected in the seasonal fluctuations in banana prices, with the first six months of each year generally exhibiting stronger demand and higher prices, except in those years where an excess supply exists. In 2014, our overall banana sales volume increased by 5% and our average per unit sales prices increased by 2%. Our net sales of other fresh produce were positively impacted by higher sales volumes of avocados, pineapples and tomatoes combined with higher sales volume of our fresh-cut products in the Middle East and Asia. In our processed foods business, we generally realize the largest portion of our net sales and gross profit in the third and fourth quarters of the year. During 2014, our prepared food net sales increased principally as a result of higher production in our poultry operations in Jordan combined with improved pricing and production volume of our industrial products.
Our strategy is a combination of maximizing revenues from our existing infrastructure, entering new markets and strict cost control initiatives. We plan to continue to capitalize on the growing global demand for fresh produce and expand our reach into existing and new markets. We expect sales growth of our fresh produce products in key markets by increasing sales volume and per unit sales prices as permitted by market conditions. Our strategy includes increasing volumes from existing production and distribution facilities in order to improve operating efficiencies and reduce per unit costs. We plan additional investments in production facilities to expand our product offering in established markets and continue with our recent expansion in growth markets, such as the Middle East, Africa and countries formerly part of the Soviet Union. We also plan additional investments in our North America distribution and fresh-cut fruit facilities and production operations to support our planned growth in this market.
In the pineapple and non-tropical fruit markets, we believe that the high degree of capital investment and cultivation expertise required, as well as the longer length of the growing cycle, makes it relatively difficult to enter the market. In addition, our profitability has depended significantly on our gross profit on the sale of our Del Monte Gold ® Extra Sweet pineapples. In 2014, our overall pineapple sales volume increased by 14% and our average per unit sales prices decreased by 1%. Increased competition in the production and sale of Del Monte Gold ® Extra Sweet pineapples could adversely affect our results. We expect these competitive pressures to continue in 2015.
In the banana market, we continue to face competition from a limited number of large multinational companies. At times, particularly when demand is greater than supply, we also face competition from a large number of relatively small banana producers. Unlike the pineapple and non-tropical fruit markets, there are few barriers to entry into the banana market. Supplies of bananas can be increased relatively quickly due to bananas relatively short growing cycle and the limited capital investment required for banana growing. As a result of changes in supply and demand, as well as seasonal factors, banana prices fluctuate significantly.

45
For example, banana import regulations have in prior years restricted our access to the EU banana market and increased the cost of doing business in the EU. In December 2009, the EU entered into an agreement with certain Latin America banana exporting countries to settle the long running dispute over banana import tariffs. This agreement was ratified during the first half of 2010. In addition, the EU will gradually reduce import tariffs on bananas from Latin America on an annual basis from €117 per ton in 2014 to €110 per ton in 2015. Also, the EU has entered into Free Trade Agreements with Colombia, Peru and five Central American countries. Under these bilateral trade agreements, duties on bananas will fall progressively to €75 per ton by 2020. We cannot predict the impact of further changes to the banana import tariffs or new quotas on the EU banana market.
Our costs are determined in large part by the prices of fuel and packaging materials, including containerboard, plastic,
resin and tin plate. We may be adversely affected if sufficient quantities of these materials are not available to us. Any significant increase in the cost of these items could also materially and adversely affect our operating results. Other than the cost of our products (including packaging), sea and inland transportation costs represent the largest component of cost of products sold. During 2013, cost of fuel decreased 7%, containerboard increased 4% and fertilizer decreased 13% as compared with 2012. During 2014, cost of fuel decreased 5%, containerboard increased 1% and fertilizer decreased 8%. In addition, we are subject to the volatility of the charter vessel market because six of our refrigerated vessels are chartered. These charters are principally for periods of two to 10 years. Charter rates have generally remained stable over the past three years. As a result, significant increases in fuel, packaging material, fertilizer and charter rates would materially and adversely affect our results.
In our U.S. fresh-cut products and tomato production operations, we require a consistent supply of available labor to operate manufacturing facilities and to harvest growing crop. During 2014, we experienced labor shortages which resulted in reduced production and adversely affected our results. In order to obtain sufficient labor supplies in the United States, during 2015, our labor cost may increase.
Tabular Disclosure of Contractual Obligations
The following details information with respect to our contractual obligations as of December 26, 2014.
(U.S. dollars in millions)
Contractual obligations by period TotalLess than
1 year 1 - 3 years 3 - 5 years
Morethan
5 yearsFruit purchase agreements $ 2,023.6 $ 419.0 $ 609.7 $ 587.7 $ 407.2Purchase obligations 285.8 214.4 30.1 20.0 21.3Operating leases and charter agreements 255.1 54.9 92.8 74.5 32.9Capital lease obligations 1.0 0.3 0.5 0.2 —Long-term debt 265.9 1.9 264.0 — —Interest on long-term debt and capital leaseobligations (1) 23.6 5.3 18.3 — —Retirement benefits 101.2 10.3 20.4 21.1 49.4Uncertain tax positions 3.3 0.4 1.0 0.9 1.0
Totals $ 2,959.5 $ 706.5 $ 1,036.8 $ 704.4 $ 511.8
We have agreements to purchase the entire or partial production of certain products of our independent growers in Costa Rica, Guatemala, Ecuador, Cameroon, Colombia, Chile, the United States and the Philippines that meet our quality standards. Total purchases under these agreements amounted to $811.3 million, $744.3 million and $650 million for 2014, 2013 and 2012, respectively.
(1) We utilize a variable interest rate on our long-term debt, and for presentation purposes we have used an assumed rate of 2%.

46
Item 7A. Quantitative and Qualitative Disclosures About Market Risk
We are exposed to market risk from changes in currency exchange rates and interest rates, which may adversely affect our results of operations and financial condition. We seek to minimize the risks from these currency exchange rate and interest rate fluctuations through our regular operating and financing activities and, when considered appropriate, through the use of derivative financial instruments. Our policy is to not use financial instruments for trading or other speculative purposes and not to be a party to any leveraged financial instruments.
We manage our currency exchange rate risk by hedging a portion of our overall exposure using derivative financial instruments. We also have procedures to monitor the impact of market risk on the fair value of long-term debt, short-term debt instruments and other financial instruments, considering reasonably possible changes in currency exchange and interest rates.
Exchange Rate Risk
Because we conduct our operations in many areas of the world involving transactions denominated in a variety of currencies, our results of operations as expressed in U.S. dollars may be significantly affected by fluctuations in rates of exchange between currencies. These fluctuations could be significant. Approximately 41% of our net sales and a significant portion of our costs and expenses in 2014 were denominated in currencies other than the dollar. We generally are unable to adjust our non-dollar local currency sales prices to reflect changes in exchange rates between the dollar and the relevant local currency. As a result, changes in exchange rates between the euro, Japanese yen, British pound or other currencies in which we receive sale proceeds and the dollar have a direct impact on our operating results. There is normally a time lag between our sales and collection of the related sales proceeds, exposing us to additional currency exchange rate risk.
To reduce currency exchange rate risk, we generally exchange local currencies for dollars promptly upon receipt. We periodically enter into currency forward contracts as a hedge against a portion of our currency exchange rate exposures; however, we may decide not to enter into these contracts during any particular period. As of December 26, 2014, we had several foreign currency cash flow hedges outstanding. The fair value of these hedges as of that date was a net liability of 25.6 million.
The results of a hypothetical 10% strengthening in the average value of the dollar during 2014 relative to the other currencies in which a significant portion of our net sales are denominated would have resulted in a decrease in net sales of approximately $160.7 million for the year ended December 26, 2014. This calculation assumes that each exchange rate would change in the same direction relative to the dollar. Our sensitivity analysis of the effects of changes in currency exchange rates does not factor in a potential change in sales levels or any offsetting gains on currency forward contracts.
Interest Rate Risk
As described in Note 11, “Long-Term Debt and Capital Lease Obligations” to the Consolidated Financial Statements, our indebtedness is both variable and fixed rate.
At December 26, 2014, our variable rate total debt had a carrying value of $265.9 million. The fair value of the debt approximates the carrying value because the variable rates approximate market rates. A 10% increase in the interest rate for 2014 would have resulted in a negative impact of approximately $0.3 million on our results of operations for the year ended December 26, 2014.
The above discussion of our procedures to monitor market risk and the estimated changes in fair value resulting from our sensitivity analysis are forward-looking statements of market risk assuming certain adverse market conditions occur.
Actual results in the future may differ materially from these estimated results due to actual developments in the global financial markets. The analysis methods we used to assess and mitigate risk discussed above should not be considered projections of future events or losses.

47
Item 8. Financial Statements and Supplementary Data
Our Consolidated Financial Statements and Schedule set forth in the accompanying Index are filed as part of this Report.
Index to Consolidated Financial Statements
PageInternal Control over Financial Reporting
Management’s Annual Report on Internal Control Over Financial Reporting
Report of Independent Registered Certified Public Accounting Firm on Internal Control Over Financial Reporting
Consolidated Financial Statements
Report of Independent Registered Certified Public Accounting Firm
Consolidated Balance Sheets at December 26, 2014 and December 27, 2013
Consolidated Statements of Income for the years ended December 26, 2014, December 27, 2013 and December 28, 2012
Consolidated Statements of Comprehensive Income for the years ended December 26, 2014, December 27, 2013, December 28, 2012
Consolidated Statements of Cash Flows for the years ended December 26, 2014, December 27, 2013 and December 28, 2012
Consolidated Statements of Shareholders’ Equity for the years ended December 26, 2014, December 27, 2013 and December 28, 2012
Notes to Consolidated Financial Statements
Supplemental Financial Statement Schedule
Schedule II - Valuation and Qualifying Accounts
48
49
50
51
52
53
54
55
56
111

48
Management’s Annual Report on Internal Control Over Financial Reporting Our management is responsible for establishing and maintaining adequate internal control over financial reporting, as defined in Rules 13a-15(f) and 15d-15(f) under the Securities Exchange Act of 1934. The Company’s internal control over financial reporting is designed under the supervision of our Chairman and Chief Executive Officer and Senior Vice President and Chief Financial Officer to provide reasonable assurance regarding the reliability of financial reporting and the preparation of financial statements for external purposes in accordance with generally accepted accounting principles. Our internal control over financial reporting includes those policies and procedures that: (i). Pertain to the maintenance of records that, in reasonable detail, accurately and fairly reflect the transactions and dispositions
of our assets;
(ii). Provide reasonable assurance that transactions are recorded as necessary to permit preparation of financial statements in accordance with generally accepted accounting principles, and that receipts and expenditures are being made only in accordance with authorizations of our management and directors; and
(iii). Provide reasonable assurance regarding prevention or timely detection of unauthorized acquisition, use or disposition of our assets that could have a material effect on the financial statements.
Under the supervision and with the participation of our management, including our Chairman and Chief Executive Officer and Senior Vice President and Chief Financial Officer, we conducted an evaluation of the effectiveness of our internal control over financial reporting, based on criteria established in Internal Control-Integrated Framework issued in 2013 by the Committee of Sponsoring Organizations of the Treadway Commission ("COSO"). Because of its inherent limitations, internal control over financial reporting may not prevent or detect misstatements. Also, projections of any evaluation of effectiveness to future periods are subject to the risk that controls may become inadequate because of changes in conditions, or that the degree of compliance with the policies or procedures may deteriorate. Based on our evaluation under the COSO criteria, our management concluded that our internal control over financial reporting was effective as of December 26, 2014. The effectiveness of our internal control over financial reporting as of December 26, 2014 has been audited by Ernst & Young LLP, an independent registered public accounting firm, as stated in their report that is included elsewhere herein. That report expresses an unqualified opinion on the effectiveness of our internal control over financial reporting. Fresh Del Monte Produce Inc.

49
Report of Independent Registered Certified Public Accounting Firm
The Board of Directors and Shareholders of Fresh Del Monte Produce Inc.
We have audited Fresh Del Monte Produce Inc. and subsidiaries’ internal control over financial reporting as of December 26, 2014, based on criteria established in Internal Control - Integrated Framework issued by the Committee of Sponsoring Organizations of the Treadway Commission (2013 framework) (the COSO criteria). Fresh Del Monte Produce Inc. and subsidiaries’ management is responsible for maintaining effective internal control over financial reporting, and for its assessment of the effectiveness of internal control over financial reporting included in the accompanying Management’s Annual Report on Internal Control Over Financial Reporting. Our responsibility is to express an opinion on the company’s internal control over financial reporting based on our audit.
We conducted our audit in accordance with the standards of the Public Company Accounting Oversight Board (United States). Those standards require that we plan and perform the audit to obtain reasonable assurance about whether effective internal control over financial reporting was maintained in all material respects. Our audit included obtaining an understanding of internal control over financial reporting, assessing the risk that a material weakness exists, testing and evaluating the design and operating effectiveness of internal control based on the assessed risk, and performing such other procedures as we considered necessary in the circumstances. We believe that our audit provides a reasonable basis for our opinion.
A company’s internal control over financial reporting is a process designed to provide reasonable assurance regarding the reliability of financial reporting and the preparation of financial statements for external purposes in accordance with generally accepted accounting principles. A company’s internal control over financial reporting includes those policies and procedures that (1) pertain to the maintenance of records that, in reasonable detail, accurately and fairly reflect the transactions and dispositions of the assets of the company; (2) provide reasonable assurance that transactions are recorded as necessary to permit preparation of financial statements in accordance with generally accepted accounting principles, and that receipts and expenditures of the company are being made only in accordance with authorizations of management and directors of the company; and (3) provide reasonable assurance regarding prevention or timely detection of unauthorized acquisition, use, or disposition of the company’s assets that could have a material effect on the financial statements.
Because of its inherent limitations, internal control over financial reporting may not prevent or detect misstatements. Also, projections of any evaluation of effectiveness to future periods are subject to the risk that controls may become inadequate because of changes in conditions, or that the degree of compliance with the policies or procedures may deteriorate.
In our opinion, Fresh Del Monte Produce Inc. maintained, in all material respects, effective internal control over financial reporting as of December 26, 2014, based on the COSO criteria.
We also have audited, in accordance with the standards of the Public Company Accounting Oversight Board (United States), the consolidated balance sheets of Fresh Del Monte Produce Inc. as of December 26, 2014 and December 27, 2013, and the related consolidated statements of income, comprehensive income, shareholders’ equity, and cash flows for each of the three years in the period ended December 26, 2014 of Fresh Del Monte Produce Inc. and our report dated February 18, 2015 expressed an unqualified opinion thereon.
/s/ Ernst & Young LLP
Miami, Florida
February 18, 2015

50
Report of Independent Registered Certified Public Accounting Firm
The Board of Directors and Shareholders of Fresh Del Monte Produce Inc.
We have audited the accompanying consolidated balance sheets of Fresh Del Monte Produce Inc. and subsidiaries as of December 26, 2014 and December 27, 2013, and the related consolidated statements of income, comprehensive income, shareholders’ equity, and cash flows for each of the three years in the period ended December 26, 2014. Our audits also included the financial statement schedule listed in the Index at Item 15. These financial statements and schedule are the responsibility of the Company's management. Our responsibility is to express an opinion on these financial statements and schedule based on our audits.
We conducted our audits in accordance with the standards of the Public Company Accounting Oversight Board (United States). Those standards require that we plan and perform the audit to obtain reasonable assurance about whether the financial statements are free of material misstatement. An audit includes examining, on a test basis, evidence supporting the amounts and disclosures in the financial statements. An audit also includes assessing the accounting principles used and significant estimates made by management, as well as evaluating the overall financial statement presentation. We believe that our audits provide a reasonable basis for our opinion.
In our opinion, the financial statements referred to above present fairly, in all material respects, the consolidated financial position of Fresh Del Monte Produce Inc. and subsidiaries at December 26, 2014 and December 27, 2013, and the consolidated results of their operations and their cash flows for each of the three years in the period ended December 26, 2014, in conformity with U.S. generally accepted accounting principles. Also, in our opinion, the related financial statement schedule, when considered in relation to the basic financial statements taken as a whole, presents fairly in all material respects the information set forth therein.
We also have audited, in accordance with the standards of the Public Company Accounting Oversight Board (United States), Fresh Del Monte Produce Inc.’s internal control over financial reporting as of December 26, 2014, based on criteria established in Internal Control-Integrated Framework issued by the Committee of Sponsoring Organizations of the Treadway Commission (2013 framework) and our report dated February 18, 2015 expressed an unqualified opinion thereon.
/s/ Ernst & Young LLP
Miami, Florida
February 18, 2015
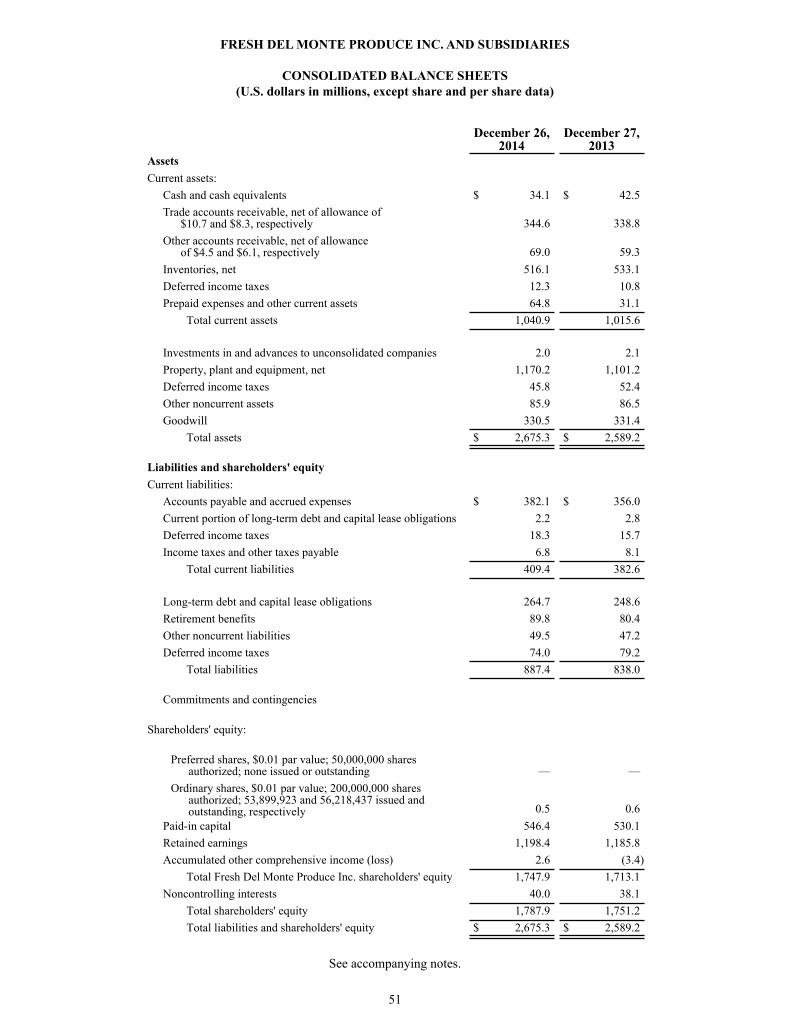
51
FRESH DEL MONTE PRODUCE INC. AND SUBSIDIARIES
CONSOLIDATED BALANCE SHEETS(U.S. dollars in millions, except share and per share data)
December 26,2014
December 27,2013
Assets Current assets:
Cash and cash equivalents $ 34.1 $ 42.5Trade accounts receivable, net of allowance of
$10.7 and $8.3, respectively 344.6 338.8Other accounts receivable, net of allowance
of $4.5 and $6.1, respectively 69.0 59.3Inventories, net 516.1 533.1Deferred income taxes 12.3 10.8Prepaid expenses and other current assets 64.8 31.1
Total current assets 1,040.9 1,015.6
Investments in and advances to unconsolidated companies 2.0 2.1Property, plant and equipment, net 1,170.2 1,101.2Deferred income taxes 45.8 52.4Other noncurrent assets 85.9 86.5Goodwill 330.5 331.4
Total assets $ 2,675.3 $ 2,589.2
Liabilities and shareholders' equity Current liabilities:
Accounts payable and accrued expenses $ 382.1 $ 356.0Current portion of long-term debt and capital lease obligations 2.2 2.8Deferred income taxes 18.3 15.7Income taxes and other taxes payable 6.8 8.1
Total current liabilities 409.4 382.6
Long-term debt and capital lease obligations 264.7 248.6Retirement benefits 89.8 80.4Other noncurrent liabilities 49.5 47.2Deferred income taxes 74.0 79.2
Total liabilities 887.4 838.0
Commitments and contingencies
Shareholders' equity:
Preferred shares, $0.01 par value; 50,000,000 shares authorized; none issued or outstanding — —
Ordinary shares, $0.01 par value; 200,000,000 shares authorized; 53,899,923 and 56,218,437 issued and outstanding, respectively 0.5 0.6
Paid-in capital 546.4 530.1Retained earnings 1,198.4 1,185.8Accumulated other comprehensive income (loss) 2.6 (3.4)
Total Fresh Del Monte Produce Inc. shareholders' equity 1,747.9 1,713.1Noncontrolling interests 40.0 38.1
Total shareholders' equity 1,787.9 1,751.2Total liabilities and shareholders' equity $ 2,675.3 $ 2,589.2
See accompanying notes.

52
FRESH DEL MONTE PRODUCE INC. AND SUBSIDIARIES
CONSOLIDATED STATEMENTS OF INCOME(U.S. dollars in millions, except share and per share data)
Year endedDecember 26,
2014December 27,
2013December 28,
2012Net sales $ 3,927.5 $ 3,683.7 $ 3,421.2Cost of products sold 3,562.7 3,393.3 3,079.5
Gross profit 364.8 290.4 341.7
Selling, general and administrative expenses 175.8 176.9 177.2
Loss (gain) on disposal of property, plant and equipment 4.3 4.9 (0.2)Goodwill and trademark impairment charges — 99.6 —Asset impairment and other charges, net 11.2 37.1 3.3
Operating income (loss) 173.5 (28.1) 161.4
Interest expense 3.2 2.9 3.0Interest income 0.6 0.7 0.7Other expense (income), net 12.0 (13.6) 1.9
Income (loss) before income taxes 158.9 (16.7) 157.2
Provision for income taxes 14.3 17.2 12.2Net income (loss) $ 144.6 $ (33.9) $ 145.0
Less: Net income attributable to noncontrolling interests 2.2 0.5 1.8
Net income (loss) attributable toFresh Del Monte Produce Inc. $ 142.4 $ (34.4) $ 143.2
Net income (loss) per ordinary share attributable toFresh Del Monte Produce Inc. - Basic $ 2.54 $ (0.61) $ 2.47
Net income (loss) per ordinary share attributable toFresh Del Monte Produce Inc. - Diluted $ 2.53 $ (0.61) $ 2.46
Dividends declared per ordinary share $ 0.50 $ 0.50 $ 0.40
Weighted average number of ordinary shares: Basic 55,966,531 56,426,294 57,937,245Diluted 56,347,092 56,426,294 58,121,501
See accompanying notes.

53
FRESH DEL MONTE PRODUCE INC. AND SUBSIDIARIES
CONSOLIDATED STATEMENTS OF COMPREHENSIVE INCOME(U.S. dollars in millions)
Year endedDecember 26,
2014December 27,
2013December 28,
2012Net income (loss) $ 144.6 $ (33.9) $ 145.0
Other comprehensive income (loss):Net unrealized gain (loss) on derivatives 28.3 10.3 (21.1)Net unrealized foreign currency translation (loss) gain (12.8) (0.3) 9.1Net unrealized (loss) gain on available-for-saleinvestments — (2.7) 2.7Net change in retirement benefit adjustment, net of tax (9.7) 12.5 (12.5)
Comprehensive income (loss) 150.4 (14.1) 123.2Less: comprehensive income (loss) attributableto noncontrolling interests 2.0 (1.2) 3.3
Comprehensive income (loss) attributable to Fresh DelMonte Produce Inc. $ 148.4 $ (12.9) $ 119.9
See accompanying notes.

54
FRESH DEL MONTE PRODUCE INC. AND SUBSIDIARIES
CONSOLIDATED STATEMENTS OF CASH FLOWS(U.S. dollars in millions)
Year endedDecember 26,
2014December 27,
2013December 28,
2012Operating activities:
Net income (loss) $ 144.6 $ (33.9) $ 145.0Adjustments to reconcile net income (loss) to net cash
provided by operating activities: Depreciation and amortization 73.3 69.9 70.0Amortization of debt issuance costs 0.4 0.4 1.2Stock-based compensation expense 12.4 9.9 10.3Goodwill and trademark impairment charges — 99.6 —Asset impairment charges, net 2.2 22.1 2.2Change in uncertain tax positions 0.2 3.3 (7.0)Gain on sale of securities — (2.3) (3.0)Loss (gain) on disposal of property, plant and equipment 4.3 4.9 (0.2)Equity (income) of unconsolidated companies — (0.1) (0.7)Deferred income taxes 4.7 4.5 0.5Excess tax benefit from stock-based compensation (0.1) — (3.6)Foreign currency translation adjustment (4.4) (2.4) 3.6Changes in operating assets and liabilities, net ofacquisitions:
Receivables (20.2) (45.1) 1.7Inventories 8.2 (50.6) (50.6)Prepaid expenses and other current assets (11.9) (4.5) 3.1Accounts payable and accrued expenses 17.5 27.4 (6.2)Other noncurrent assets and liabilities (0.5) 5.6 6.3
Net cash provided by operating activities 230.7 108.7 172.6
Investing activities:Capital expenditures (149.1) (159.5) (79.7)Purchase of securities available for sale — — (11.0)Proceeds from sales of property, plant and equipment 1.6 10.4 9.8Proceeds from sale of securities available for sale — 7.8 8.5Purchase of businesses (12.7) (20.6) —
Net cash used in investing activities (160.2) (161.9) (72.4)
Financing activities:Borrowings from long-term debt 628.8 694.5 505.3Payments on long-term debt (612.5) (567.2) (593.4)Contributions from noncontrolling interests 5.0 3.6 7.0Proceeds from stock options exercised 48.9 44.0 10.1Excess tax benefit from stock-based compensation 0.1 — 3.6Repurchase and retirement of ordinary shares (131.1) (95.5) (12.9)Dividends paid (27.9) (28.2) (23.2)
Net cash (used in) provided by financing activities (88.7) 51.2 (103.5)
Effect of exchange rate changes on cash 9.8 4.6 (3.7)Net (decrease) increase in cash and cash equivalents (8.4) 2.6 (7.0)Cash and cash equivalents, beginning 42.5 39.9 46.9Cash and cash equivalents, ending $ 34.1 $ 42.5 $ 39.9
Supplemental cash flow information:Cash paid for interest $ 2.9 $ 2.0 $ 1.6Cash paid for income taxes $ 9.3 $ 18.2 $ 8.7
Non-cash financing and investing activities:Purchase of businesses $ 0.2 $ 4.1 $ —Sale of unconsolidated subsidiary $ — $ — $ 0.8Retirement of ordinary shares $ 146.5 $ 94.0 $ 14.4Purchases of assets under capital lease obligations $ 0.8 $ 0.6 $ 0.1Dividends on restricted share units $ (0.1) — —
See accompanying notes.

55
FRESH DEL MONTE PRODUCE INC. AND SUBSIDIARIES
CONSOLIDATED STATEMENTS OF SHAREHOLDERS’ EQUITY(U.S. dollars in millions, except share data)
OrdinaryShares
OutstandingOrdinary
SharesPaid-inCapital
RetainedEarnings
AccumulatedOther
ComprehensiveIncome (Loss)
Fresh DelMonte
Produce Inc.Shareholders'
Equity
Non-Controlling
InterestsTotal
Equity
Balance at December 30, 2011 57,764,454 $ 0.6 $ 483.6 $ 1,206.8 $ (1.6) $ 1,689.4 $ 25.7 $ 1,715.1
Exercises of stock options 475,918 — 10.1 — — 10.1 — 10.1Issuance of restricted stock awards 27,573 — — — — — — —Share-based payment expense — — 10.3 — — 10.3 — 10.3Excess tax benefit from stock-basedcompensation — — 3.6 — — 3.6 — 3.6Capital contribution from non-controllinginterest — — — — — — 6.7 6.7
Repurchase and retirement of ordinary shares (560,560) — (3.9) (10.5) — (14.4) — (14.4)
Dividend declared — — — (23.2) — (23.2) — (23.2)Comprehensive income: —
Net income — — — 143.2 — 143.2 1.8 145.0
Unrealized gain on derivatives — — — — (21.1) (21.1) — (21.1)
Net unrealized loss of available-for-sale-investments — — — — 2.7 2.7 — 2.7
Net foreign currency translation adjustment — — — — 7.5 7.5 1.6 9.1
Change in retirement benefit adjustment — — — — (12.4) (12.4) (0.1) (12.5)
Comprehensive income 119.9 3.3 123.2
Balance at December 28, 2012 57,707,385 $ 0.6 $ 503.7 $ 1,316.3 $ (24.9) $ 1,795.7 $ 35.7 $ 1,831.4
Exercises of stock options 1,975,339 — 44.0 — — 44.0 — 44.0
Issuance of restricted stock awards 26,201 — — — — — — —
Share-based payment expense — — 9.9 — — 9.9 — 9.9Excess tax benefit from stock-basedcompensation — — (1.4) — — (1.4) — (1.4)
Capital distribution to non-controlling interest — — — — — — 3.6 3.6
Repurchase and retirement of ordinary shares (3,490,488) — (26.1) (67.9) — (94.0) — (94.0)
Dividend declared — — — (28.2) — (28.2) — (28.2)Comprehensive income: —
Net income — — — (34.4) — (34.4) 0.5 (33.9)
Unrealized gain on derivatives — — — — 10.3 10.3 — 10.3Net unrealized gain of available-for-sale-investments — — — — (2.7) (2.7) — (2.7)
Net foreign currency translation adjustment — — — — 1.4 1.4 (1.7) (0.3)
Change in retirement benefit adjustment — — — — 12.5 12.5 — 12.5
Comprehensive income (12.9) (1.2) (14.1)
Balance at December 27, 2013 56,218,437 $ 0.6 $ 530.1 $ 1,185.8 $ (3.4) $ 1,713.1 $ 38.1 $ 1,751.2
Exercises of stock options 1,945,939 — 48.9 — — 48.9 — 48.9
Issuance of restricted stock awards 26,117 — — — — — — —
Issuance of restricted stock units 287,202 — — — — — — —
Share-based payment expense — — 12.4 — — 12.4 — 12.4Tax deficiency from stock-basedcompensation — — (0.5) — — (0.5) — (0.5)Capital contribution from non-controllinginterest — — — — — — (0.1) (0.1)
Repurchase and retirement of ordinary shares (4,577,772) (0.1) (44.5) (101.9) — (146.5) — (146.5)
Dividend declared — — — (27.9) — (27.9) — (27.9)Comprehensive income: —
Net income — — — 142.4 — 142.4 2.2 144.6
Unrealized gain on derivatives — — — — 28.3 28.3 — 28.3Net unrealized loss of available-for-sale-investments — — — — — — — —
Net foreign currency translation adjustment — — — — (12.8) (12.8) — (12.8)
Change in retirement benefit adjustment — — — — (9.5) (9.5) (0.2) (9.7)
Comprehensive income 148.4 2.0 150.4
Balance at December 26, 2014 53,899,923 $ 0.5 $ 546.4 $ 1,198.4 $ 2.6 $ 1,747.9 $ 40.0 $ 1,787.9
See accompanying notes.

FRESH DEL MONTE PRODUCE INC. AND SUBSIDIARIES
NOTES TO CONSOLIDATED FINANCIAL STATEMENTS
56
1. General Reference in this Report to "Fresh Del Monte", “we”, “our” and “us” and the “Company” refer to Fresh Del Monte Produce Inc. and its subsidiaries, unless the context indicates otherwise. We were incorporated under the laws of the Cayman Islands in 1996 and are engaged primarily in the worldwide production, transportation and marketing of fresh produce. We source our products, which include bananas, pineapples, melons and non-tropical fruit (including grapes, apples, pears, peaches, plums, nectarines, avocados, citrus and kiwis) and tomatoes, primarily from Central America, South America, Africa and the Philippines. We also source products from North America, Europe and the Middle East and distribute our products in North America, Europe, Middle East, Asia, South America and Africa. Products are sourced from our company-owned farms, through joint venture arrangements and through supply contracts with independent growers. We have the exclusive right to use the DEL MONTE® brand for fresh fruit, fresh vegetables and other fresh and fresh-cut produce and certain other specified products on a royalty-free basis under a worldwide, perpetual license from Del Monte Corporation, an unaffiliated company that owns the DEL MONTE® trademark. We are also a producer, marketer and distributor of prepared fruit and vegetables, juices and snacks and we hold a perpetual, royalty-free license to use the DEL MONTE® brand for prepared foods throughout Europe, Africa, the Middle East and countries formerly part of the Soviet Union. Del Monte Corporation and several other unaffiliated companies manufacture, distribute and sell under the DEL MONTE® brand canned or processed fruit, vegetables and other produce, as well as dried fruit, snacks and other products in certain geographic regions. We are required to evaluate events occurring after December 26, 2014, our fiscal year end, for recognition and disclosure in the Consolidated Financial Statements for the year ended December 26, 2014. Events are evaluated based on whether they represent information existing as of December 26, 2014, which require recognition in the Consolidated Financial Statements, or new events occurring after December 26, 2014, which do not require recognition but require disclosure if the event is significant to the Consolidated Financial Statements. We evaluated events occurring subsequent to December 26, 2014 through the date of issuance of these Consolidated Financial Statements.
2. Summary of Significant Accounting Policies Principles of Consolidation Our Consolidated Financial Statements include the accounts of our majority owned subsidiaries, which we control, and a consolidated variable interest entity (“VIE”). Our fiscal year end is the last Friday of the calendar year or the first Friday subsequent to the end of the calendar year, whichever is closest to the end of the calendar year. All significant intercompany accounts and transactions have been eliminated in consolidation.
Use of Estimates The preparation of our Consolidated Financial Statements in accordance with U.S. generally accepted accounting principles requires us to make estimates and assumptions that affect the amounts reported in our Consolidated Financial Statements and accompanying notes. Actual results could differ from these estimates. Cash and Cash Equivalents We classify as cash equivalents all highly liquid investments with a maturity of three months or less at the time of purchase. Also included in cash and cash equivalents are certificates of deposits for which the aggregate amount are foreign deposits.

FRESH DEL MONTE PRODUCE INC. AND SUBSIDIARIES
NOTES TO CONSOLIDATED FINANCIAL STATEMENTS (continued)
57
2. Summary of Significant Accounting Policies (continued)
Trade Receivables and Concentrations of Credit Risk Trade receivables less allowances are recognized on our accompanying Consolidated Balance Sheets at net realizable value, which approximates fair value. We perform ongoing credit evaluations of our customers and adjust credit limits based upon payment history and customers’ credit worthiness, as determined by our review of their current credit information. We continuously monitor collections and payments from our customers and maintain a provision for estimated credit losses based upon our historical experience, specific customer collection issues that we have identified and reviews of the aging of trade receivables based on contractual terms. We generally do not require collateral on trade accounts receivable. Write-off of accounts receivable is done only when all collection efforts have been exhausted without success. No single customer’s receivable balance is considered to be large enough to pose a significant credit risk to us, except trade accounts receivable from one customer, which represents approximately 10% of trade accounts receivable, net of allowance. This customer is current with its payments. Other Accounts Receivable
Other accounts receivable less allowances are recognized on our accompanying Consolidated Balance Sheets at net realizable value, which approximates fair value. Other accounts receivable includes value-added taxes (“VAT”) receivables, seasonal advances to growers and suppliers, which are usually short-term in nature, and other financing receivables.
VAT are primarily related to purchases by production units and will be refunded by the taxing authorities. As of December 26, 2014 and December 27, 2013, $28.8 million and $22.6 million net of allowance of $0.6 million and $0.9 million, respectively, of these amounts were classified as current in other accounts receivable and $10.8 million and $10.1 million, net of allowance of $12.1 million and $10.2 million, respectively, were classified as noncurrent in other noncurrent assets on our Consolidated Balance Sheets.
Advances to growers and suppliers are generally repaid to us as produce is harvested and sold. We require property liens and pledges of the current season’s produce as collateral to support the advances. Occasionally, we agree to a payment plan or take steps to recover advances through the liens or pledges. Refer to Note 8, “Financing Receivables” for further discussion on advances to growers and suppliers.
Allowances against VAT and advances to growers and suppliers are established based on our knowledge of the financial condition of the paying party and historical loss experience. Allowances are recorded and charged to expense when an account is deemed to be uncollectible. Recoveries of VAT and advances to growers and suppliers previously reserved in the allowance are credited to operating income.
Inventories Inventories are valued at the lower of cost or market. Cost is computed using the weighted average cost or first-in first-out methods for finished goods, which includes fresh produce and prepared food and the first-in first-out, actual cost or average cost methods for raw materials and packaging supplies. Raw materials and packaging supplies inventory consists primarily of agricultural supplies, containerboard, packaging materials and spare parts. Inventories consisted of the following (U.S. dollars in millions):
December 26,2014
December 27,2013
Finished goods $ 198.7 $ 215.7Raw materials and packaging supplies 152.6 156.5Growing crops 164.8 160.9
Total inventories $ 516.1 $ 533.1

FRESH DEL MONTE PRODUCE INC. AND SUBSIDIARIES
NOTES TO CONSOLIDATED FINANCIAL STATEMENTS (continued)
58
2. Summary of Significant Accounting Policies (continued)
Growing Crops Expenditures on pineapple, melon, tomato and non-tropical fruit growing crops are valued at the lower of cost or market and are deferred and charged to cost of products sold when the related crop is harvested and sold. The deferred growing costs included in inventories in our Consolidated Balance Sheets consist primarily of land preparation, cultivation, irrigation and fertilization costs. Expenditures related to banana crops are expensed in the year incurred due to the continuous nature of the crop. Accounting for Planned Major Maintenance Activities We account for planned major maintenance activities, such as vessel dry-dock activities, consistent with the Financial Accounting Standards Board's ("FASB") Accounting Standards Codification ™ (the “Codification” or “ASC”) guidance related to “Other Assets and Deferred Costs”. We utilize the deferral method of accounting for vessel dry-dock activities whereby actual costs incurred are deferred and amortized on a straight-line basis over the period until the next scheduled dry-dock activity.
Investments in Unconsolidated Companies Investments in unconsolidated companies are accounted for under the equity method of accounting for investments of 20% or more in companies over which we do not have control, except for one VIE. See Note 4, “Investments in Unconsolidated Companies” and Note 5, “Variable Interest Entities”. Property, Plant and Equipment and Other Definite-Lived or Long-Lived Assets Property, plant and equipment are stated at cost. Depreciation is calculated using the straight-line method over the estimated useful lives of the assets, which range from 10 to 40 years for buildings, five to 20 years for ships and containers, three to 20 years for machinery and equipment, three to seven years for furniture, fixtures and office equipment and five to 10 years for automotive equipment. Leasehold improvements are amortized over the term of the lease, or the estimated useful life of the related asset, whichever is shorter. Definite-lived intangibles are amortized over their useful lives with a weighted average amortization period of 21.5 years. Amortization expense related to definite-lived intangible assets totaled $0.8 million, $0.8 million, and $0.7 million for 2014, 2013 and 2012, respectively, and is included in cost of products sold.
When assets are retired or disposed of, the costs and accumulated depreciation or amortization are removed from the respective accounts and any related gain or loss is recognized. Maintenance and repairs are charged to expense as incurred. Significant expenditures, which extend the useful lives of assets, are capitalized. Interest is capitalized as part of the cost of construction. We review long-lived assets for impairment whenever events or changes in circumstances indicate that the carrying amount of an asset may not be recoverable. If the carrying amount of an asset exceeds the asset’s fair value, we measure and record an impairment loss for the excess. The fair value of an asset is measured by either determining the expected future undiscounted cash flow of the asset or by independent appraisal. For long-lived assets held for sale, we record impairment losses when the carrying amount is greater than the fair value less the cost to sell. We discontinue depreciation of long-lived assets when these assets are classified as held for sale and include the net book value of these assets in prepaid expenses and other current assets. Our long-lived assets are primarily composed of property, plant and equipment and definite-lived intangible assets. See Note 6, “Property, Plant and Equipment” and Note 7, “Goodwill and Other Intangible Assets”. We recorded charges related to impairment of long-lived assets in 2014, 2013 and 2012 of $2.2 million, $22.1 million and $2.2 million, respectively. Such charges are included in asset impairment and other charges, net in the accompanying Consolidated Statements of Income for the years ended December 26, 2014, December 27, 2013 and December 28, 2012 and as described further in Note 3, “Asset Impairment and Other Charges, Net”.
There are numerous uncertainties and inherent risks in conducting business, such as but not limited to general economic conditions, actions of competitors, ability to manage growth, actions of regulatory authorities, natural disasters such as earthquakes, crop disease, severe weather such as floods, pending investigations and/or litigation, customer demand and risk relating to international operations. Adverse effects from these risks may result in adjustments to the carrying value of our assets and liabilities in the future, including, but not necessarily limited to, long-lived assets.

FRESH DEL MONTE PRODUCE INC. AND SUBSIDIARIES
NOTES TO CONSOLIDATED FINANCIAL STATEMENTS (continued)
59
2. Summary of Significant Accounting Policies (continued)
Goodwill and Indefinite-Lived Intangible Assets Our goodwill represents the excess of the purchase price of business combinations over the fair value of the net assets acquired. We assess goodwill and indefinite-lived intangible assets for impairment on an annual basis as of the first day of our fourth quarter, or sooner if events indicate such a review is necessary. Potential impairment exists if the fair value of a reporting unit to which goodwill has been allocated, or the fair value of indefinite-lived intangible assets, is less than their respective carrying values. The amount of the impairment to recognize, if any, is calculated as the amount by which the carrying value of goodwill exceeds its implied value or the amount of the carrying value of the intangible asset exceeds its fair value. Future changes in the estimates used to conduct the impairment review, including revenue projections, market values and changes in the discount rate used could cause the analysis to indicate that our goodwill or indefinite-lived intangible assets are impaired in subsequent periods and result in a write-down of a portion or all of goodwill. The discount rate used is based on independently calculated risks, our capital mix and an estimated market premium.
As a result of our annual impairment test performed during the first day of the fourth quarter during 2013 and due to the failure of the prepared food business to meet our expectations, we recorded $99.6 million of asset impairment charges, of which $75.7 million was related to the impairment of the unit's goodwill and $23.9 million was related to the impairment of the perpetual, royalty-free licenses to use the DEL MONTE® brand trademarks. This goodwill and trademark was related to the 2004 Prepared Food acquisition in Europe, Africa, the Middle East and the countries formerly part of the Soviet Union. We had no additional impairment to record during our 2014 impairment testing.
See Note 7, "Goodwill and Other Intangible Assets” for further discussion on the goodwill impairment charges. Revenue Recognition Revenue is recognized on sales of products when the customer agrees to the terms of the sale and receives title to the goods, generally upon delivery and when collectability is reasonably assured. We follow the guidance of the ASC on “Revenue Recognition” with regards to recording revenue gross as a principal versus net as an agent, in its presentation of net sales. This guidance requires us to assess whether we act as a principal in the transaction. Where we are the principal in the transaction and have the risks and rewards of ownership, the transactions are recorded gross in the Consolidated Statements of Income. If we do not act as a principal in the transaction, the transactions are recorded on a net basis in the Consolidated Statements of Income. Cost of Products Sold Cost of products sold includes the cost of produce, packaging materials, labor, depreciation, overhead, transportation and other distribution costs, including handling costs incurred to deliver fresh produce or prepared products to customers.
During 2014, we recorded a $0.5 million inventory write-down due to restructuring of the Chilean plastic business.
During 2013, we recorded a $1.4 million deferred growing crop inventory write-down as a result of adverse weather conditions in our Chilean non-tropical fruit growing operations.
During 2012, we recorded $0.4 million in inventory and clean-up costs related to flood damages to our Costa Rica banana farms partially offset by $0.2 million in insurance proceeds in cost of products sold. We also recorded $0.7 million in inventory write-offs related to exit activities in Brazil in the other fresh produce segment in cost of products sold.
Advertising and Promotional Costs We expense advertising and promotional costs as incurred. Advertising and promotional costs, which are included in selling, general and administrative expenses, were $18.3 million for 2014, $20.1 million for 2013, and $19.7 million for 2012.

FRESH DEL MONTE PRODUCE INC. AND SUBSIDIARIES
NOTES TO CONSOLIDATED FINANCIAL STATEMENTS (continued)
60
2. Summary of Significant Accounting Policies (continued)
Debt Issuance Costs Debt issuance costs relating to long-term debt are amortized over the term of the related debt instrument because the costs are primarily related to our revolving credit facility and are included in other noncurrent assets. Debt issuance cost amortization, which is included in interest expense, was $0.4 million, $0.4 million and $1.2 million for 2014, 2013 and 2012, respectively. See Note 11, “Long-Term Debt and Capital Lease Obligations” for further disclosure on our credit facility.
Income Taxes Deferred income taxes are recognized for the tax consequences in future years of differences between the tax basis of assets and liabilities and their financial reporting amounts at each year end, based on enacted tax laws and statutory tax rates applicable to the year in which the differences are expected to affect taxable income. Valuation allowances are established when it is deemed more likely than not that some portion or all of the deferred tax assets will not be realized. We account for income tax uncertainties consistent with the ASC guidance included in “Income Taxes”, which clarifies the accounting for uncertainty in income taxes recognized in a company’s financial statements and prescribes a recognition threshold and measurement attribute for the financial statement recognition and measurement of a tax position taken or expected to be taken in a tax return. The ASC also provides guidance on derecognition, classification, interest and penalties, accounting in interim periods, disclosure and transition. See Note 10, “Income Taxes”. Environmental Remediation Liabilities Losses associated with environmental remediation obligations are accrued when such losses are probable and can be reasonably estimated. See Note 17, “Litigation”. Currency Translation For our operations in countries where the functional currency is other than the U.S. dollar, balance sheet amounts are translated using the exchange rate in effect at the balance sheet date. Income statement amounts are translated monthly using the average exchange rate for the respective month. The gains and losses resulting from the changes in exchange rates from year-to-year and the effect of exchange rate changes on intercompany transactions of long-term investment nature are recorded as a component of accumulated other comprehensive income or loss as currency translation adjustments. For our operations where the functional currency is the U.S. dollar, non-monetary balance sheet amounts are translated at historical exchange rates. Other balance sheet amounts are translated at the exchange rates in effect at the balance sheet date. Income statement accounts, excluding those items of income and expenses that relate to non-monetary assets and liabilities, are translated at the average exchange rate for the month. These remeasurement adjustments are included in the determination of net income and are included in other income (expense), net.
Other expense, net, in the accompanying Consolidated Statements of Income includes a net foreign exchange loss of $10.8 million, $2.6 million, and $4.4 million for 2014, 2013 and 2012, respectively. These amounts include the effect of foreign currency remeasurement and realized foreign currency transaction gains and losses.

FRESH DEL MONTE PRODUCE INC. AND SUBSIDIARIES
NOTES TO CONSOLIDATED FINANCIAL STATEMENTS (continued)
61
2. Summary of Significant Accounting Policies (continued) Other (Income) Expense, Net In addition to foreign currency gains and losses described above, other (income) expense, net, also consists of equity losses (gains) of unconsolidated companies, and other items of non-operating income and expenses.
During 2013, we recorded a gain of $16.6 million related to the favorable judgment awarded in litigation and $1.6 million in financial charges as a result of an unfavorable court ruling related to value added tax reporting in South America.
Leases
We lease property, plant and equipment for use in our operations. We evaluate the accounting for leases consistent with the provisions of the ASC on “Leases”. We evaluate our leases at inception or at any subsequent modification and classify them as either a capital lease or an operating lease based on lease terms. For operating leases that contain rent escalations, rent holidays or rent concessions, rent expense is recognized on a straight-line basis over the life of the lease.
See Note 16, “Commitments and Contingencies” for more information.
Fair Value Measurements
Fair value is measured in accordance with the ASC on “Fair Value Measurements and Disclosures” that defines fair value, establishes a framework for measuring fair value and enhances disclosures about fair value measures required under other accounting pronouncements, but does not change existing guidance as to whether or not an instrument is carried at fair value. We measure fair value for financial instruments, such as derivatives on an ongoing basis. We measure fair value for non-financial assets, when a valuation is necessary, such as for impairment of long-lived and indefinite-lived assets when indicators of impairment exist. See Note 19, “Fair Value Measurements” for more information.
Stock-Based Compensation We account for stock-based compensation expense consistent with ASC guidance on “Compensation – Stock Compensation”. Our share-based payments are composed entirely of stock-based compensation expense as all equity awards granted to employees and members of our Board of Directors, each of whom meets the definition of an employee under the provisions of the ASC, are stock options, restricted stock awards and restricted stock units. We use the Black-Scholes option pricing model to estimate the fair value of stock options granted. See Note 15, “Stock-Based Compensation” for more information. Derivative Financial Instruments We account for derivative financial instruments in accordance with the ASC guidance on “Derivatives and Hedging”. The ASC on “Derivatives and Hedging” requires us to recognize the value of derivative instruments as either assets or liabilities in the statement of financial position at fair value. The accounting for changes in the fair value (i.e., gains or losses) of a derivative instrument depends on whether it has been designated as a hedge and qualifies as part of a hedging relationship. The accounting also depends on the type of hedging relationship, whether a cash flow hedge, a fair value hedge, or hedge of a net investment in a foreign operation. A fair value hedge requires that the effective portion of the change in the fair value of a derivative financial instrument be offset against the change in the fair value of the underlying asset, liability, or firm commitment being hedged through earnings. A cash flow hedge requires that the effective portion of the change in the fair value of a derivative instrument be recognized in other comprehensive income, a component of shareholders’ equity, and reclassified into earnings in the same period or periods during which the hedged transaction affects earnings. The ineffective portion of the change in fair value of a derivative instrument is recognized in earnings.

FRESH DEL MONTE PRODUCE INC. AND SUBSIDIARIES
NOTES TO CONSOLIDATED FINANCIAL STATEMENTS (continued)
62
2. Summary of Significant Accounting Policies (continued)
We use derivative financial instruments primarily to reduce our exposure to adverse fluctuations in foreign exchange rates. On entry into a derivative instrument, we formally designate and document the financial instrument as a hedge of a specific underlying exposure, as well as the risk management objectives and strategies for undertaking the hedge transaction. Derivatives are recorded in the Consolidated Balance Sheets at fair value in prepaid expenses and other current assets, other noncurrent assets, accounts payable and accrued expenses or other noncurrent liabilities, depending on whether the amount is an asset or liability and is of a short-term or long-term nature. In addition, the earnings impact resulting from our derivative instruments is recorded in the same line item within the Consolidated Statements of Income as the underlying exposure being held. The fair values of derivatives used to hedge or modify our risks fluctuate over time.
These fair value amounts should not be viewed in isolation, but rather in relation to the cash flows or fair value of the underlying hedged transactions or assets and other exposures and to the overall reduction in our risk relating to adverse fluctuations in foreign exchange rates. See Note 18, “Derivative Financial Instruments” for more information. Treasury Stock
When stock is retired or purchased for constructive retirement, the purchase price is initially recorded as a reduction to the par value of the shares repurchased, with any excess purchase price over par value recorded as a reduction to additional paid-in capital and retained earnings.
Retirement and Other Employee Benefits Using appropriate actuarial methods and assumptions, we account for defined benefit pension plans in accordance with ASC guidance on “Compensation – Retirement Benefits”. We provide disclosures about our plan assets, including investment strategies, major categories of plan assets, concentrations of risk within plan assets, and valuation techniques used to measure the fair value of plan assets consistent with the fair value hierarchy model described in the ASC on “ Fair Value Measurements and Disclosures”, as described in Note 19, “Fair Value Measurements”.
See Note 14, “Retirement and Other Employee Benefits” for more information. New Accounting Pronouncements
In August 2014, the FASB issued an Accounting Standards Update ("ASU") related to how a reporting entity must report its going-concern uncertainties in their financial statements. The new standard requires that management perform interim and annual assessments of its ability to continue as a going concern within one year of the date of issuance of its financial statements. We would be required to provide certain disclosure if there is "substantial doubt about our ability to continue as a going concern." According to the FASB, this update is meant to enhance the timeliness, clarity, and consistency of related disclosure and improve convergence with International Financial Reporting Standards, which emphasize management's responsibility for performing the going concern assessment. The amendment in this ASU will be effective for us for year end 2016 and interim periods thereafter. Early adoption is permitted. We are evaluating the impact of adoption of this ASU on our financial disclosures, but don't expect this ASU to have a significant effect.
In June 2014, the FASB issued an ASU related to stock compensation. The new standard requires that a performance target that affects vesting, and that could be achieved after the requisite service period, be treated as a performance condition. As such, the performance target should not be reflected in estimating the grant date fair value of the award. The update further clarifies that compensation cost should be recognized in the period in which it becomes probable that the performance target will be achieved and should represent the compensation cost attributable to the periods for which the requisite service has already been rendered. The amendments in this ASU will be effective for us beginning the first interim period of our 2016 fiscal year and can be applied either prospectively or retrospectively to all awards outstanding as of the beginning of the earliest annual period presented as an adjustment to opening retained earnings. Early adoption is permitted. We are evaluating the impact of adoption of this ASU on our financial condition, result of operations and cash flows.

FRESH DEL MONTE PRODUCE INC. AND SUBSIDIARIES
NOTES TO CONSOLIDATED FINANCIAL STATEMENTS (continued)
63
2. Summary of Significant Accounting Policies (continued)
In May 2014, the FASB issued an ASU in the form of a comprehensive new revenue recognition standard that will supersede existing revenue guidance. The ASU's core principle is that a company will recognize revenue when it transfers promised goods or services to customers in an amount that reflects the consideration to which the company expects to be entitled in exchange for those goods or services. The standard outlines a five step model, whereby revenue is recognized as performance obligations within a contract are satisfied. The standard also requires new, expanded disclosures regarding revenue recognition. The amendments in this ASU will be effective for us beginning the first day of our 2017 fiscal year. Early adoption is not permitted. The standard permits the use of either the retrospective or cumulative effect transition method. We have not yet selected a transition method. We are evaluating the impact of adoption of this ASU on our financial condition, results of operations and cash flows.
3. Asset Impairment and Other Charges, Net We recorded asset impairment and other charges, net totaling $11.2 million, $37.1 million and $3.3 million for the years 2014, 2013 and 2012, respectively, which were the result of exit activities, asset impairments and other charges. The following represents the detail of asset impairment and exit activity and other charges, net for the year ended December 26, 2014 by reportable segment (U.S. dollars in millions):
Long-livedand other
assetimpairment
Exit activity
and othercharges(credits) Total
Banana segment: Charges related to infringement of European Unioncompetition rules by a former indirect subsidiary $ — $ 8.8 $ 8.8Brazil termination of employee benefits due to decision todiscontinue banana exports — 1.4 1.4United Kingdom contract termination on leased facilities — 1.7 1.7Germany impairment of under-performing bananaripening assets 0.5 — 0.5
Other fresh produce segment: Chile farm asset impairment due to adverse weatherconditions 1.3 — 1.3Chile termination of employee benefits and assetimpairment due to restructuring of plastic business 0.1 0.5 0.6Hawaii favorable settlement of litigation — (2.9) (2.9)Intangible asset write-off 0.3 — 0.3United Kingdom termination of employee benefits due torestructuring — 0.1 0.1Reversal of previously accrued environmental liability inHawaii, net of other charges — (1.3) (1.3)
Prepared food segment:Termination of employee benefits due to restructuring inGermany and France — 0.7 0.7
Total asset impairment and other charges, net $ 2.2 $ 9.0 $ 11.2
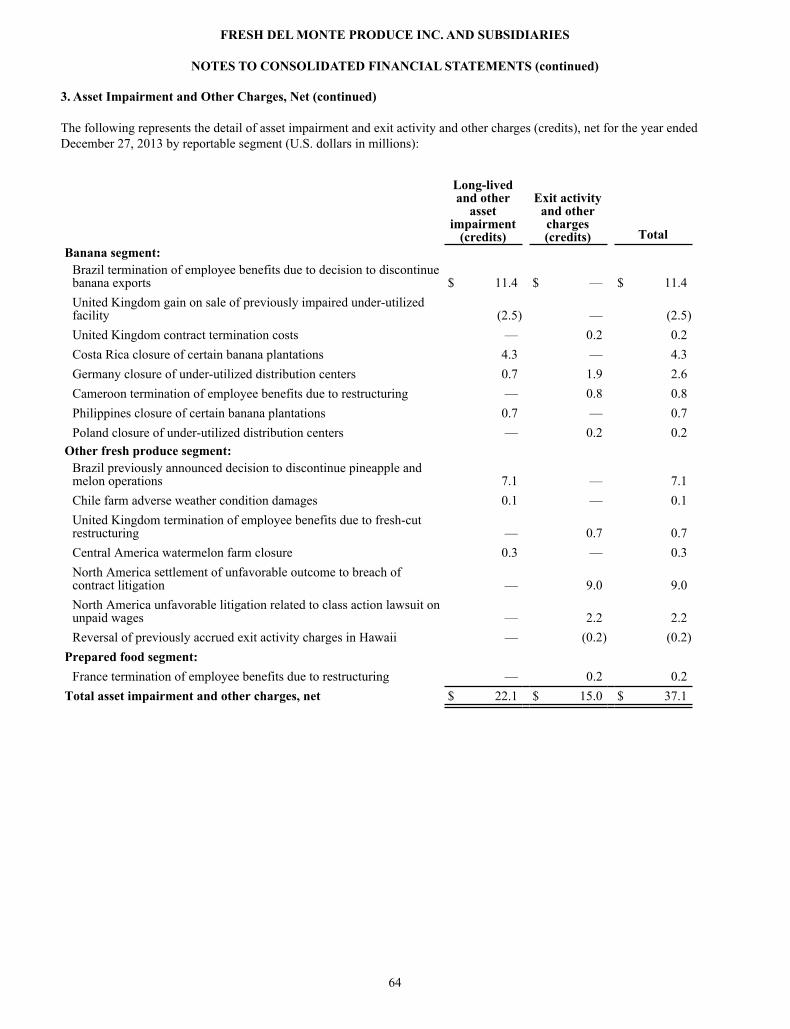
FRESH DEL MONTE PRODUCE INC. AND SUBSIDIARIES
NOTES TO CONSOLIDATED FINANCIAL STATEMENTS (continued)
64
3. Asset Impairment and Other Charges, Net (continued)
The following represents the detail of asset impairment and exit activity and other charges (credits), net for the year ended December 27, 2013 by reportable segment (U.S. dollars in millions):
Long-livedand other
assetimpairment
(credits)
Exit activity
and othercharges(credits) Total
Banana segment:Brazil termination of employee benefits due to decision to discontinuebanana exports $ 11.4 $ — $ 11.4United Kingdom gain on sale of previously impaired under-utilizedfacility (2.5) — (2.5)United Kingdom contract termination costs — 0.2 0.2Costa Rica closure of certain banana plantations 4.3 — 4.3Germany closure of under-utilized distribution centers 0.7 1.9 2.6Cameroon termination of employee benefits due to restructuring — 0.8 0.8Philippines closure of certain banana plantations 0.7 — 0.7Poland closure of under-utilized distribution centers — 0.2 0.2
Other fresh produce segment:Brazil previously announced decision to discontinue pineapple andmelon operations 7.1 — 7.1Chile farm adverse weather condition damages 0.1 — 0.1United Kingdom termination of employee benefits due to fresh-cutrestructuring — 0.7 0.7Central America watermelon farm closure 0.3 — 0.3North America settlement of unfavorable outcome to breach ofcontract litigation — 9.0 9.0North America unfavorable litigation related to class action lawsuit onunpaid wages — 2.2 2.2Reversal of previously accrued exit activity charges in Hawaii — (0.2) (0.2)
Prepared food segment:France termination of employee benefits due to restructuring — 0.2 0.2
Total asset impairment and other charges, net $ 22.1 $ 15.0 $ 37.1

FRESH DEL MONTE PRODUCE INC. AND SUBSIDIARIES
NOTES TO CONSOLIDATED FINANCIAL STATEMENTS (continued)
65
3. Asset Impairment and Other Charges, Net (continued)
The following represents the detail of asset impairment and exit activity charges (credits), net for the year ended December 28, 2012 by reportable segment (U.S. dollars in millions):
Long-livedand other
assetimpairment
(credits)
Exit activity
and othercharges(credits) Total
Banana segment: United Kingdom under-utilized distribution center $ 1.8 $ 1.0 $ 2.8Costa Rica farm flood damages 1.3 (0.6) 0.7Guatemala 2010 flood damage insurance reimbursement — (1.4) (1.4)
Other fresh produce segment: United Kingdom under-utilized fresh cut facility 1.0 1.6 2.6Sale of assets previously impaired as a result of the melon programrationalization in Central America (1.9) — (1.9)Other charges and legal costs related to the Kunia well site in Hawaii — 0.5 0.5
Total asset impairment and other charges (credits), net $ 2.2 $ 1.1 $ 3.3
The following represents the roll forward of exit activity and other reserves for the year ended December 26, 2014 (U.S. dollars in millions):
Exit activity andother reserve
balance atDecember 28,
2013Impact toEarnings Cash Paid
ForeignExchange
Impact
Exit activity andother reserve
balance atDecember 26,
2014 Termination benefits $ 1.0 $ 2.7 $ (3.6) $ — $ 0.1
Contract termination and other exit activity charges 2.8 1.7 (2.0) — 2.5
$ 3.8 $ 4.4 $ (5.6) $ — $ 2.6
Included in the exit activity and other reserve balance at December 26, 2014 are contract termination costs related to the underutilized facilities of $2.3 million in the United Kingdom and $0.2 million in Germany, both in the banana segment; $0.1 million in termination benefits in France in the prepared food segment. We do not expect additional charges related to the exit and other activities mentioned above that would significantly impact our results of operations or financial condition.
Exit activity and other reserves are recorded in the Consolidated Balance Sheets in accounts payable and accrued expenses, for the current portion and other noncurrent liabilities for the noncurrent portion.

FRESH DEL MONTE PRODUCE INC. AND SUBSIDIARIES
NOTES TO CONSOLIDATED FINANCIAL STATEMENTS (continued)
66
4. Investments in Unconsolidated Companies
Investments in unconsolidated companies accounted for under the equity method amounted to $1.6 million at December 26, 2014 and December 27, 2013, are included in other noncurrent assets, and consisted of the following:
Company Business Ownership
InterestAccounting
MethodMelones De Costa Rica, S.A. Land lessor 50% EquityHacienda Filadelfia, S.A. Land lessor 50% Equity
During 2012, we sold our 50% investment in B.A.D.M. Agroindustrial, S.A. for $1.0 million. There were no purchases from unconsolidated companies in 2014 and 2013. Our portion of income (losses) in unconsolidated companies were not significant and are included in other income (expense), net. There were no dividends received from unconsolidated subsidiaries in 2014, 2013 and 2012.
5. Variable Interest Entities Consolidation of a VIE which is based on which enterprise has both (1) the power to direct the economically significant activities of the entity and (2) the obligation to absorb losses of, or the right to receive benefits from, the entity that could potentially be significant to the VIE. The determination whether an enterprise should consolidate a VIE is required to be evaluated continuously as changes to existing relationships or future transactions could result in a consolidation or deconsolidation of VIEs. One of our Del Monte Gold® Extra Sweet pineapple producers meets the definition of a VIE pursuant to the ASC guidance on “Consolidation” and is consolidated. Our variable interest in this entity includes an equity investment and certain debt guarantees. All of this entity’s pineapple production is sold to us. Based on the criteria of this ASC, as amended, we are the primary beneficiary of this entity’s expected residual returns or losses in excess of our ownership interest. Although we are the primary beneficiary, the VIE’s creditors do not have recourse against our general credit. At December 26, 2014, the VIE had total assets of $40.9 million and total liabilities of $9.5 million. The VIE had long-term debt of $3.4 million, which is collateralized by its property, plant and equipment and further guaranteed by a $2.2 million standby letter of credit issued by us. As of December 26, 2014, the VIE is current on the guaranteed long-term debt. There are no other restrictions on the assets of the VIE. We have provided funding for capital investments in the VIE in proportion to our voting interest. We may from time to time in the future provide additional funding for capital investments in the VIE.

FRESH DEL MONTE PRODUCE INC. AND SUBSIDIARIES
NOTES TO CONSOLIDATED FINANCIAL STATEMENTS (continued)
67
6. Property, Plant and Equipment, Net Property, plant and equipment consisted of the following (U.S. dollars in millions):
December 26,2014
December 27,2013
Land and land improvements $ 612.6 $ 566.8Buildings and leasehold improvements 469.7 440.6Machinery and equipment 483.8 458.1Maritime equipment (including containers) 177.2 184.3Furniture, fixtures and office equipment 79.0 77.7Automotive equipment 57.0 54.8Construction-in-progress 67.8 64.7
1,947.1 1,847.0Less: accumulated depreciation and amortization (776.9) (745.8)
Property, plant and equipment, net $ 1,170.2 $ 1,101.2
Depreciation and amortization expense on property, plant and equipment, including assets under capital leases, was $72.5 million, $68.7 million and $69.2 million for 2014, 2013 and 2012, respectively. Shipping containers, machinery and equipment and automotive equipment under capital leases totaled $1.9 million and $2.4 million at December 26, 2014 and December 27, 2013, respectively. Accumulated amortization for assets under capital leases was $1.0 million and $1.3 million at December 26, 2014 and December 27, 2013, respectively. For the years 2014, 2013 and 2012, the loss (gain) on sales of property, plant and equipment included a loss of $4.3 million, and gains of $4.9 million and a loss of $0.2 million, respectively. In 2014 and 2013, the loss of $4.3 million and $4.9 million primarily related to the disposal of low-yielding banana plants in Central America in order to replant and improve productivity, partially offset by a gain on the disposal of a refrigerated vessel and other surplus equipment.
Acquisitions and Asset Purchase
During December 2014, we completed the acquisitions of two pineapple plantations in Costa Rica of approximately 1,370 total acres consisting of agricultural production land, packing houses and farm equipment. The purchase price for these business combinations was $12.8 million, of which $12.6 million was paid using operating cash flows and available borrowings under the Credit Facility (as defined in Note 11); the remaining will be paid during 2015. Goodwill represents the excess purchase price above the fair market value of the net assets acquired, which was not significant.
During March 2014, we acquired approximately 2,600 total acres of agricultural production land in Florida to be used for the production of tomatoes. The assets were acquired using operating cash flows and available borrowings under the Credit Facility (as defined in Note 11), for a purchase price of approximately $16.0 million and was accounted for as an asset purchase.
During October 2013, we acquired approximately 7,200 total acres of tomato agricultural production land, packing houses and farm equipment located in Florida and Virginia. The assets were acquired using operating cash flows and available borrowings under the Credit Facility (as defined in Note 11), for a purchase price of approximately $36.8 million and was accounted for as an asset purchase.
During the fourth quarter of 2013, we completed the acquisition of a pineapple plantation in Costa Rica of approximately 1,850 total acres consisting of agricultural production land, packing houses and farm equipment. The purchase price for this business combination was $19.4 million, of which $18.5 million was paid using operating cash flows and available borrowings under the Credit Facility (as defined in Note 11); the remaining will be paid during 2015. Goodwill represents the excess purchase price above the fair market value of the net assets acquired.

FRESH DEL MONTE PRODUCE INC. AND SUBSIDIARIES
NOTES TO CONSOLIDATED FINANCIAL STATEMENTS (continued)
68
6. Property, Plant and Equipment, Net (continued)
During the fourth quarter of 2013, we completed the acquisition of a banana plantation in the Philippines for a purchase price of $5.3 million. There was no goodwill resulting from this business combination.
The acquisitions of the pineapple farms in Costa Rica and the banana farm in the Philippines were accounted for under the acquisition method as described in the ASC on "Business Combinations".
See Note 7 , "Goodwill and Other Intangible Assets" and Note 11, "Long-Term Debt and Capital Lease Obligations" for further information.
7. Goodwill and Other Intangible Assets The following table reflects our indefinite-lived intangible assets, including goodwill and our definite-lived intangible assets along with related accumulated amortization by major category (U.S. dollars in millions):
December 26,2014
December 27,2013
Goodwill $ 330.5 $ 331.4Indefinite-lived intangible assets:
Trademarks 44.6 44.8Definite-lived intangible assets:
Definite-lived intangible assets 9.7 9.7Accumulated amortization (5.8) (5.0)Definite-lived intangible assets, net 3.9 4.7
Goodwill and other intangible assets, net $ 379.0 $ 380.9
Indefinite-lived and definite-lived intangible assets are included in other noncurrent assets in the Consolidated Balance Sheets.

FRESH DEL MONTE PRODUCE INC. AND SUBSIDIARIES
NOTES TO CONSOLIDATED FINANCIAL STATEMENTS (continued)
69
7. Goodwill and Other Intangible Assets (continued)
The following table reflects the changes in the carrying amount of goodwill by business segment (U.S. dollars in millions):
BananasOther fresh
producePrepared
food Totals Goodwill $ 65.1 $ 285.1 $ 77.4 $ 427.6 Accumulated impairment losses — (22.0) — (22.0)Balance at December 28, 2012 $ 65.1 $ 263.1 $ 77.4 $ 405.6
Acquisitions — 0.3 (1) — 0.32004 Prepared Food acquisition goodwill impairment — — (75.7) (75.7)Foreign exchange and other 0.1 0.2 0.9 1.2
Goodwill $ 65.2 $ 285.6 $ 78.3 $ 429.1 Accumulated impairment losses — (22.0) (75.7) (97.7)Balance at December 27, 2013 $ 65.2 $ 263.6 $ 2.6 $ 331.4
Acquisitions — $ 0.2 (1) $ — 0.2Foreign exchange and other (0.6) $ (0.5) $ — (1.1)
Goodwill $ 64.6 $ 285.3 $ 78.3 $ 428.2 Accumulated impairment losses — (22.0) (75.7) (97.7)Balance at December 26, 2014 $ 64.6 $ 263.3 $ 2.6 $ 330.5
(1) See Note 6, "Property, Plant and Equipment, Net" for further discussion on acquisitions.
Results of Impairment Tests
In accordance with the ASC guidance on “Goodwill and Other Intangible Assets”, we review goodwill for impairment on an annual basis or earlier if indicators of impairment arise. Based on the valuation of goodwill performed as of the first day of our fourth quarter in 2014, the fair value of goodwill exceeded its carrying value and thus there was no impairment recorded. As of December 26, 2014, we are not aware of any items or events that would cause a further adjustment to the carrying value of goodwill.
As a result of our annual impairment test performed during the 2013 and due to the failure of the prepared food business to meet our expectations, we recorded $99.6 million of asset impairment charges, of which $75.7 million and $23.9 million related to the impairment of this unit's goodwill and the perpetual, royalty-free licenses to use the DEL MONTE® brand trademarks, respectively, related to our 2004 acquisition of Prepared Foods in Europe, Africa, the Middle East and the countries formerly part of the Soviet Union. The remaining goodwill in the prepared foods reporting unit of $2.6 million relates to our Poultry business.

FRESH DEL MONTE PRODUCE INC. AND SUBSIDIARIES
NOTES TO CONSOLIDATED FINANCIAL STATEMENTS (continued)
70
7. Goodwill and Other Intangible Assets (continued)
The fair value of the prepared food unit’s remaining trademarks are highly sensitive to differences between estimated and actual cash flows and changes in the related discount rate used to evaluate the fair value of these assets. The following table highlights the sensitivities of the goodwill and indefinite-lived intangibles at risk as of December 26, 2014 (U.S. dollars in millions):
RemainingDEL
MONTE®
Trade Names and
TrademarksCarrying value of indefinite-livedintangible assets $ 44.6
Approximate percentage by whichthe fair value exceeds the carryingvalue based on annual impairmenttest as of 1st day of fourth quarter 5.5%
Amount that a one percentage point increase in the discount rate and a 5% decrease in cash flows would cause the carrying value to exceed the fair value and trigger a fair valuation $ 3.3
See Note 3, “Asset Impairment and Other Charges, Net” and Note 19, "Fair Value Measurements" for further discussion related to impairments of intangible assets occurring during 2013.
The estimated amortization expense related to definite-lived intangible assets for the five succeeding years is as follows (U.S. dollars in millions):
2015 $ 0.82016 0.82017 0.82018 0.42019 —
8. Financing Receivables
Financing receivables are defined as a contractual right to receive money, on demand or on fixed or determinable dates and is recognized as an asset in the creditor’s balance sheet.
Other accounts receivable less allowances are recognized on our accompanying Consolidated Balance Sheets at net realizable value, which approximates fair value. Other accounts receivable includes value-added taxes receivable, seasonal advances to growers and suppliers, which are usually short-term in nature, and other financing receivables.
We source our products from various independent growers primarily in Central and South America, Africa and the Philippines. We also source products from North America and Europe. A significant portion of the fresh produce we sell is acquired through supply contracts with independent growers. In order to ensure the consistent high quality of our products and packaging, we make advances to independent growers and suppliers. These growers and suppliers typically sell all of their production to us and make payments on their advances as a deduction to the agreed upon selling price of the fruit or packaging material. The majority of the advances to growers and suppliers are for terms less than one year and typically span a growing season. In certain cases, there may be longer term advances with terms of up to 10 years.

FRESH DEL MONTE PRODUCE INC. AND SUBSIDIARIES
NOTES TO CONSOLIDATED FINANCIAL STATEMENTS (continued)
71
8. Financing Receivables (continued)
These advances are collateralized by property liens and pledges of the season’s produce; however certain factors such as the impact of weather, crop disease and financial stability could impact the ability for these growers to repay their advance. Occasionally, we agree to a payment plan or take steps to recover the advance via established collateral. Reserves for uncollectible advances are determined on a case by case basis depending on the production for the season and other contributing factors.
The following table details the advances to growers along with the related allowance for doubtful accounts (U.S. dollars in millions):
December 26,2014
December 27,2013
Current Noncurrent Current NoncurrentGross advances to growers $ 33.5 $ 0.6 $ 28.9 $ 3.4Allowance for advances to growers (2.4) — (3.3) —
Net advances to growers $ 31.1 $ 0.6 $ 25.6 $ 3.4
The current and noncurrent portions of the financing receivables included above are classified in the Consolidated Balance Sheets in other accounts receivable and other noncurrent assets, respectively.
The following table details the credit risk profile of the above listed financing receivables (U.S. dollars in millions):
CurrentStatus
FullyReserved Total
Gross advances to growers: December 26, 2014 $ 31.7 $ 2.4 $ 34.1December 27, 2013 29.0 3.3 32.3
The allowance for doubtful accounts and the related financing receivables for the years ended December 26, 2014 and December 27, 2013 were as follows (U.S. dollars in millions):
December 26,2014
December 27,2013
Allowance for advances to growers:Balance, beginning of period $ 3.3 $ 3.4Provision for uncollectible amounts 0.5 0.5Deductions to allowance includingrecoveries (1.4) (0.6)Balance, end of period $ 2.4 $ 3.3

FRESH DEL MONTE PRODUCE INC. AND SUBSIDIARIES
NOTES TO CONSOLIDATED FINANCIAL STATEMENTS (continued)
72
9. Accounts Payable and Accrued Expenses Accounts payable and accrued expenses consisted of the following (U.S. dollars in millions):
December 26,2014
December 27,2013
Trade payables $ 167.1 $ 156.3Accrued fruit purchases 14.1 14.0Vessel and port operating expenses 19.6 28.6Warehouse and distribution costs 31.0 24.1Payroll and employee benefits 64.3 51.0Accrued promotions 16.6 14.0Other accrued expenses 69.4 68.0
Accounts payable and accrued expenses $ 382.1 $ 356.0
Other accrued expenses are primarily composed of accruals for purchases received but not invoiced and other accruals, none of which individually exceed 5% of current liabilities.
10. Income Taxes The provision for (benefit from) income taxes consisted of the following (U.S. dollars in millions):
Year endedDecember 26,
2014December 27,
2013December 28,
2012Current:
U.S. federal income tax $ 3.1 $ 4.6 $ 10.1State 0.9 1.0 1.2Non-U.S. 5.6 8.9 0.1
9.6 14.5 11.4Deferred:
U.S. federal income tax 3.1 0.8 3.0State 0.4 0.1 0.3Non-U.S. 1.2 1.8 (2.5)
4.7 2.7 0.8 $ 14.3 $ 17.2 $ 12.2
Income before income taxes consisted of the following (U.S. dollars in millions):
Year endedDecember 26,
2014December 27,
2013December 28,
2012U.S. $ 19.9 $ 21.4 $ 36.5Non-U.S. 139.0 (38.1) 120.7
$ 158.9 $ (16.7) $ 157.2

FRESH DEL MONTE PRODUCE INC. AND SUBSIDIARIES
NOTES TO CONSOLIDATED FINANCIAL STATEMENTS (continued)
73
10. Income Taxes (continued)
The differences between the reported provision for (benefit from) income taxes and income taxes computed at the U.S. statutory federal income tax rate are explained in the following reconciliation (U.S. dollars in millions):
Year endedDecember 26,
2014December 27,
2013December 28,
2012Income tax provision (benefit) computed at the U.S.statutory federal rate $ 55.6 $ (5.9) $ 55.0Effect of tax rates on non-U.S. operations (50.8) (33.5) (77.5)Provision for (reversal of) uncertain tax positions 0.2 3.3 (7.0)Non-deductible interest (0.1) 23.6 22.4Foreign exchange (5.6) (6.6) (5.3)Non-deductible intercompany charges 0.4 0.2 3.4Non-deductible differences 2.1 0.9 1.8Non-taxable income/loss (2.4) (1.0) 0.3Non-deductible expenses — 0.5 4.3Non-deductible goodwill impairment — 16.3 —Adjustment to deferred balances (0.2) 2.5 —Other (1.2) 0.1 1.0Other taxes in lieu of income — 2.3 3.1Change in deferred rate (0.8) 1.4 (2.6)Tax credits (0.3) (2.0) —Increase/(decrease) in valuation allowance (1) 17.4 15.1 13.3
Provision for income taxes $ 14.3 $ 17.2 $ 12.2 _____________(1) The (decrease)/increase in valuation allowance includes effects of foreign exchange and adjustments to deferred tax balances which were fully offset by valuation allowance.

FRESH DEL MONTE PRODUCE INC. AND SUBSIDIARIES
NOTES TO CONSOLIDATED FINANCIAL STATEMENTS (continued)
74
10. Income Taxes (continued)
Deferred income tax assets and liabilities consisted of the following (U.S. dollars in millions):
December 26, December 27,Deferred tax liabilities: 2014 2013Current: Allowances and other accrued liabilities $ (2.7) $ (1.3) Inventories (15.6) (14.4) Total current deferred tax liabilities (18.3) (15.7)
Noncurrent: Property, plant and equipment (64.7) (68.1) Equity in earnings of unconsolidated companies (0.2) (0.2) Pension (2.8) (3.6) Other noncurrent deferred tax liabilities (6.3) (7.3)
Total noncurrent deferred tax liabilities (74.0) (79.2)Total current and noncurrent deferred tax liabilities $ (92.3) $ (94.9)
Deferred tax assets: Current: Net operating loss carryforwards $ 6.4 $ 3.1 Allowances and other accrued assets 13.2 13.0 Inventories 4.8 3.7 Total current deferred tax assets 24.4 19.8 Valuation allowance (12.1) (9.0)Total net current deferred tax assets 12.3 10.8
Noncurrent: Pension liability 22.1 20.2 Property, plant and equipment 2.4 4.0 Post-retirement benefits other than pension 0.3 0.5 Net operating loss carryforwards 158.8 162.9 Capital loss carryover 3.5 3.1 Other noncurrent assets 26.1 33.1 Total noncurrent deferred tax assets 213.2 223.8 Valuation allowance (167.4) (171.4)Total net noncurrent deferred tax assets 45.8 52.4
Total deferred tax assets, net $ 58.1 $ 63.2
Net deferred tax liabilities $ (34.2) $ (31.7)
During 2014 and 2013, the valuation allowance decreased by $0.9 million and decreased by $0.2 million, respectively. The decrease in 2014 relates primarily to valuation allowance on reductions in net operating loss carryforwards offset by the effect of a change in judgment about our ability to realize deferred tax assets in future years, due to our current and foreseeable operations . The decrease in 2013 includes the effect of a change in judgment about our ability to realize deferred tax assets in future years, due to our current and foreseeable operations.
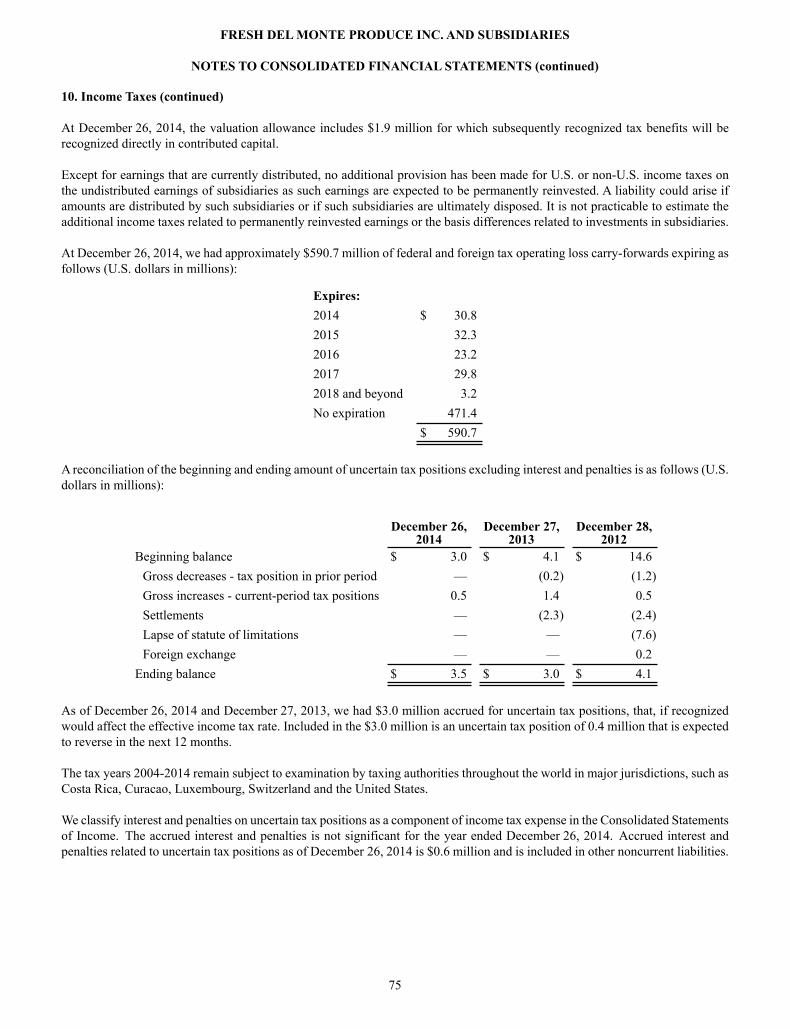
FRESH DEL MONTE PRODUCE INC. AND SUBSIDIARIES
NOTES TO CONSOLIDATED FINANCIAL STATEMENTS (continued)
75
10. Income Taxes (continued)
At December 26, 2014, the valuation allowance includes $1.9 million for which subsequently recognized tax benefits will be recognized directly in contributed capital.
Except for earnings that are currently distributed, no additional provision has been made for U.S. or non-U.S. income taxes on the undistributed earnings of subsidiaries as such earnings are expected to be permanently reinvested. A liability could arise if amounts are distributed by such subsidiaries or if such subsidiaries are ultimately disposed. It is not practicable to estimate the additional income taxes related to permanently reinvested earnings or the basis differences related to investments in subsidiaries. At December 26, 2014, we had approximately $590.7 million of federal and foreign tax operating loss carry-forwards expiring as follows (U.S. dollars in millions):
Expires:2014 $ 30.82015 32.32016 23.22017 29.82018 and beyond 3.2No expiration 471.4
$ 590.7 A reconciliation of the beginning and ending amount of uncertain tax positions excluding interest and penalties is as follows (U.S. dollars in millions):
December 26,2014
December 27,2013
December 28,2012
Beginning balance $ 3.0 $ 4.1 $ 14.6Gross decreases - tax position in prior period — (0.2) (1.2)Gross increases - current-period tax positions 0.5 1.4 0.5Settlements — (2.3) (2.4)Lapse of statute of limitations — — (7.6)Foreign exchange — — 0.2
Ending balance $ 3.5 $ 3.0 $ 4.1
As of December 26, 2014 and December 27, 2013, we had $3.0 million accrued for uncertain tax positions, that, if recognized would affect the effective income tax rate. Included in the $3.0 million is an uncertain tax position of 0.4 million that is expected to reverse in the next 12 months. The tax years 2004-2014 remain subject to examination by taxing authorities throughout the world in major jurisdictions, such as Costa Rica, Curacao, Luxembourg, Switzerland and the United States.
We classify interest and penalties on uncertain tax positions as a component of income tax expense in the Consolidated Statements of Income. The accrued interest and penalties is not significant for the year ended December 26, 2014. Accrued interest and penalties related to uncertain tax positions as of December 26, 2014 is $0.6 million and is included in other noncurrent liabilities.

FRESH DEL MONTE PRODUCE INC. AND SUBSIDIARIES
NOTES TO CONSOLIDATED FINANCIAL STATEMENTS (continued)
76
11. Long-Term Debt and Capital Lease Obligations The following is a summary of long term-debt and capital lease obligations (U.S. dollars in millions):
December 26,2014
December 27,2013
Senior unsecured revolving credit facility (see Credit Facilitybelow) $ 262.5 $ 247.7Various other notes payable 3.4 3.0Capital lease obligations 1.0 0.7Total long-term debt and capital lease obligations 266.9 251.4
Less: Current portion (2.2) (2.8)Long-term debt and capital lease obligations $ 264.7 $ 248.6
Credit Facility On October 23, 2012, we entered into a five-year $500 million syndicated senior unsecured revolving credit facility maturing on October 23, 2017 (the "Credit Facility") with Bank of America, N.A. as administrative agent. The Credit Facility also includes a swing line facility and a letter of credit facility. We capitalized $0.9 million of debt issuance costs, which are included in other noncurrent assets on our Consolidated Balance Sheets.
The following is a summary of the material terms of the Credit Facility and other working capital facilities (U.S. dollars in millions):
TermMaturity
Date
Interest Rate atDecember 26,
2014Borrowing
Limit
AvailableBorrowings at December 26,
2014
Credit Facility 5.0 yearsOctober 23,
2017 1.52% $ 500.0 $ 222.1Other working capital facilities Varies Varies Varies 19.8 14.0 $ 519.8 $ 236.1
The Credit Facility bears interest at a rate of LIBOR plus a spread that varies with the our leverage ratio. The current margin for LIBOR advances is 1.25%. We intend to use funds borrowed under the Credit Facility from time to time for general corporate purposes, which may include the repayment, redemption or refinancing of our existing indebtedness, working capital needs, capital expenditures, funding of possible acquisitions, possible share repurchases and satisfaction of other obligations.
The Credit Facility requires us to comply with financial and other covenants, including limitations on capital expenditures, the amount of dividends that can be paid in the future, the amount and types of liens and indebtedness, material asset sales and mergers. As of December 26, 2014, we were in compliance with all of the covenants contained in the Credit Facility. The Credit Facility is unsecured as long as we maintain a certain leverage ratio and is guaranteed by certain of the our subsidiaries. The Credit Facility permits borrowings under the revolving commitment with an interest rate determined based on our leverage ratio and spread over LIBOR. In addition, we pay a fee on unused commitments. At December 26, 2014, we applied $15.4 million to the letter of credit facility, comprised primarily of certain contingent obligations and other governmental agency guarantees combined with guarantees for purchases of raw materials and equipment. The letter of credit facility includes $2.2 million relating to a debt guarantee for a VIE. We also had $11.3 million in other letters of credit and bank guarantees not included in the letter of credit facility. Refer to Note 5, “Variable Interest Entities”, for further discussion of VIEs.

FRESH DEL MONTE PRODUCE INC. AND SUBSIDIARIES
NOTES TO CONSOLIDATED FINANCIAL STATEMENTS (continued)
77
11. Long-Term Debt and Capital Lease Obligations (continued)
Maturities of long-term debt and capital lease obligations during the next four years are (U.S. dollars in millions):
Long-Term
DebtCapitalLeases Totals
2015 $ 2.2 $ 0.4 $ 2.62016 1.2 0.4 1.62017 285.8 0.3 286.12018 — 0.2 0.2
289.2 1.3 290.5Less: Amounts representing interest (1) (23.3) (0.3) (23.6) 265.9 1.0 266.9Less: Current portion $ (1.9) $ (0.3) $ (2.2)
Totals, net of current portion of long-term debtand capital lease obligations $ 264.0 $ 0.7 $ 264.7
(1) We utilize a variable interest rate on our long-term debt, and for presentation purposes we have used an assumed rate of 2%.
Cash payments of interest on long-term debt, net of amounts capitalized, were $2.9 million, $2.0 million and $1.6 million for 2014, 2013 and 2012, respectively. Capitalized interest expense was $0.8 million for 2014, $0.5 million for 2013 and $0.9 million for 2012.

FRESH DEL MONTE PRODUCE INC. AND SUBSIDIARIES
NOTES TO CONSOLIDATED FINANCIAL STATEMENTS (continued)
78
12. Net Income Per Ordinary Share Basic net income per share is computed using the weighted average number of common shares outstanding for the period.Basic and diluted net income per ordinary share is calculated as follows (U.S. dollars in millions, except share and per share data):
Year endedDecember 26,
2014December 27,
2013December 28,
2012Numerator:
Net income (loss) attributable to Fresh Del MonteProduce Inc. $ 142.4 $ (34.4) $ 143.2
Denominator: Weighted average number of ordinary shares - Basic 55,966,531 56,426,294 57,937,245Effect of dilutive securities - employee stock options 380,561 — 184,256Weighted average number of ordinary shares - Diluted 56,347,092 56,426,294 58,121,501
Antidilutive Options and Awards (1) 696,075 4,066,160 2,693,188
Net income per ordinary share attributable to Fresh Del Monte Produce Inc.:
Basic $ 2.54 $ (0.61) $ 2.47Diluted $ 2.53 $ (0.61) $ 2.46
(1) Options to purchase shares of common stock and unvested RSU's and PSU's not included in the calculation of Net income per ordinary share because the effect would have been anti-dilutive.

FRESH DEL MONTE PRODUCE INC. AND SUBSIDIARIES
NOTES TO CONSOLIDATED FINANCIAL STATEMENTS (continued)
79
13. Accumulated Other Comprehensive Income (Loss)
The following table includes the changes in accumulated other comprehensive income (loss) by component under the ASC on “Comprehensive Income” for the years ended December 26, 2014 and December 27, 2013 (U.S. dollars in millions):
Changes in Accumulated Other Comprehensive Income by Component (1)
Changes in FairValue of Effective
Cash FlowHedges
ForeignCurrency
TranslationAdjustment
RetirementBenefit
Adjustment
Changes inFair Value ofAvailable for
SaleSecurities Total
Balance at December 28, 2012 $ (13.4) $ 10.6 $ (24.8) $ 2.7 $(24.9)Other comprehensive income (loss)before reclassifications 9.9 1.4 (2) 10.5 (0.4) 21.4Amounts reclassified from accumulatedother comprehensive income (loss) 0.4 — 2.0 (2.3) 0.1Net current period other comprehensiveincome (loss) 10.3 1.4 12.5 (2.7) 21.5Balance at December 27, 2013 $ (3.1) $ 12.0 $ (12.3) $ — $ (3.4)Other comprehensive income (loss)before reclassifications 32.9 (12.8) (2) (10.7) — 9.4Amounts reclassified from accumulatedother comprehensive income (loss) (4.6) — 1.2 — (3.4)Net current period other comprehensiveincome (loss) 28.3 (12.8) (9.5) — 6.0Balance at December 26, 2014 $ 25.2 $ (0.8) $ (21.8) $ — $ 2.6
(1) All amounts are net of tax and noncontrolling interests.(2) Include losses of $(3.5) million and $(4.1) million on intra-entity foreign currency transactions that are of a long-term-investment nature which also includes $(0.2) million and $(1.7) million of noncontrolling interests for years ended December 26, 2014 and December 27, 2013.

FRESH DEL MONTE PRODUCE INC. AND SUBSIDIARIES
NOTES TO CONSOLIDATED FINANCIAL STATEMENTS (continued)
80
13. Accumulated Other Comprehensive Income (Loss)
The following table includes details about amounts reclassified from accumulated other comprehensive income (loss) by component for the years ended December 26, 2014 and December 27, 2013 (U.S. dollars in millions):
December 26, 2014 December 27, 2013
Details about accumulated other comprehensiveincome (loss) components
Amount reclassifiedfrom accumulated
othercomprehensiveincome (loss)
Amount reclassifiedfrom accumulated
othercomprehensiveincome (loss)
Affected line itemin the statement
where net income ispresented
Changes in fair value of effective cash flow hedges:Foreign currency cash flow hedges $ (4.6) $ 6.0 SalesForeign currency cash flow hedges — (5.6) Cost of sales
Total $ (4.6) $ 0.4
Amortization of retirement benefits:
Actuarial losses $ 0.2 $ 0.4
Selling, general andadministrativeexpenses
Actuarial losses 1.0 1.6 Cost of salesTotal $ 1.2 $ 2.0
Changes in fair value of available for sale securities:
Gain on available for sale securities $ — $ (2.3)Other (income)expense, net
Total $ — $ (2.3)

FRESH DEL MONTE PRODUCE INC. AND SUBSIDIARIES
NOTES TO CONSOLIDATED FINANCIAL STATEMENTS (continued)
81
14. Retirement and Other Employee Benefits We sponsor a number of defined benefit pension plans and post-retirement plans. The most significant of these plans cover employees in the United States, United Kingdom, Costa Rica and Guatemala. These plans are accounted for consistent with the ASC guidance related to “Compensation – Retirement Benefits”.
The benefit obligation is the projected benefit obligation for defined benefit pension plans and the accumulated post-retirement benefit obligation for post-retirement benefit plans other than pensions.
U.S.-Based Defined Benefit Pension Plans We sponsor a defined benefit pension plan, which covers a portion of our U.S.-based employees under a collective bargaining agreement. As a result of the accelerated closing of our Hawaii facility announced in 2006, the ILWU Local 42 collective bargaining agreement was not re-negotiated and expired in 2009 and as such the U.S.-based defined benefit pension plan has ceased accruing benefits. Our funding policy for this plan is to contribute amounts sufficient to meet the minimum funding requirements of the Employee Retirement Income Security Act of 1974, as amended, or such additional amounts as determined appropriate to assure that the assets of the plan would be adequate to provide benefits. Substantially all of the plan’s assets are invested in mutual funds.
United Kingdom Defined Benefit Pension Plan We sponsor a defined benefit pension plan, which covers a portion of our employees in the United Kingdom (the “UK plan”). The UK plan provides benefits based on the employees’ years of service and qualifying compensation and has ceased accruing benefits. Benefit payments are based on a final pay calculation as of November 30, 2005 and are adjusted for inflation annually. Our funding policy for the UK plan is to contribute amounts into the plan in accordance with a recovery plan agreed by the Trustees and the Company in order to meet the statutory funding objectives of occupational trust-based arrangements of the United Kingdom or such additional amounts as determined appropriate to assure that assets of the UK plan are adequate to provide benefits. Substantially all of the UK plan’s assets are primarily invested in fixed income and equity funds.
Central American Plans
We provide retirement benefits to a portion of our employees of certain Costa Rican and Guatemalan subsidiaries (“Central American plans”). Generally, benefits under these programs are based on an employee’s length of service and level of compensation. These programs are commonly referred to as termination indemnities, which provide retirement benefits in accordance with regulations mandated by the respective governments. Funding generally occurs when employees cease active service.

FRESH DEL MONTE PRODUCE INC. AND SUBSIDIARIES
NOTES TO CONSOLIDATED FINANCIAL STATEMENTS (continued)
82
14. Retirement and Other Employee Benefits (continued)
The following table sets forth a reconciliation of benefit obligations, plan assets and funded status for our defined benefit pension plans and post-retirement plans as of December 26, 2014 and December 27, 2013, which are also their measurement dates (U.S. dollars in millions):
Pension plans (1) Post-retirement plans
December 26,
2014December 27,
2013December
26, 2014December
27, 2013
U.S. U.K. U.S. U.K.CentralAmerica
CentralAmerica
Change in Benefit Obligation: Beginning benefit obligation $ 17.4 $ 62.4 $ 19.1 $ 59.7 $ 50.9 $ 52.0Service cost — — — — 5.2 5.5Interest cost 0.7 2.7 0.7 2.3 3.6 3.3Actuarial loss (gain) 2.6 4.7 (0.9) 1.1 4.1 (5.1)Benefits paid (1.4) (2.3) (1.5) (1.9) (5.7) (5.5)Exchange rate changes (2) — (3.8) — 1.2 — 0.7Ending benefit obligation 19.3 63.7 17.4 62.4 58.1 50.9
Change in Plan Assets: Beginning fair value 14.2 54.9 13.5 45.6 — —Actual return on plan assets 0.8 3.8 2.0 7.7 — —Company contributions 0.5 2.3 0.1 2.2 5.7 5.5Benefits paid (1.4) (2.3) (1.4) (1.9) (5.7) (5.5)Exchange rate changes (2) — (3.3) — 1.3 — —Ending fair value 14.1 55.4 14.2 54.9 — —
Amounts recognized in theConsolidated Balance Sheets: Accounts payable and accruedexpenses (current liability) — — — — 6.2 6.0Retirement benefits liability(noncurrent liability) 5.2 8.4 3.2 7.5 51.9 44.9Net amount recognized in the Consolidated Balance Sheets $ 5.2 $ 8.4 $ 3.2 $ 7.5 $ 58.1 $ 50.9
Amounts recognized in Accumulated other comprehensive income (loss)(3): Net actuarial (loss) gain (9.7) 2.5 (7.2) 7.2 (16.9) (14.0)Net amount recognized in
Accumulated othercomprehensive (loss) income $ (9.7) $ 2.5 $ (7.2) $ 7.2 $ (16.9) $ (14.0)
(1) The accumulated benefit obligation is the same as the projected benefit obligation.(2) The exchange rate difference included in the reconciliation of the change in benefit obligation and the change in plan
assets above results from currency fluctuations of the U.S. dollar relative to the British pound for the U.K. plan and the U.S. dollar versus Central American currencies such as the Costa Rican colon and Guatemalan quetzal for the Central American plans as of December 26, 2014 and December 27, 2013, when compared to the previous year.
(3) As of December 26, 2014 and December 27, 2013, we had accumulated other comprehensive income of $5.1 million and $3.3 million, respectively, related to tax effect of unamortized pension gains.

FRESH DEL MONTE PRODUCE INC. AND SUBSIDIARIES
NOTES TO CONSOLIDATED FINANCIAL STATEMENTS (continued)
83
14. Retirement and Other Employee Benefits (continued)
The following table provides a roll forward of the accumulated other comprehensive income ("AOCI") balances (U.S. dollars in millions):
Pension plans Post-retirement plans Year ended Year ended
December 26,
2014December 27,
2013December26, 2014
December27, 2013
Reconciliation of AOCI U.S. U.K. U.S. U.K.CentralAmerica
CentralAmerica
AOCI (loss) gain at beginning of plan year $ (7.2) $ 7.2 $ (9.7) $ 2.8 $ (14.0) $ (20.4)Amortization of net losses recognized duringthe year 0.3 (0.1) 0.4 — 0.9 1.6Net (losses) gains occurring during the year (2.8) (4.5) 2.1 4.4 (4.1) 5.1Currency exchange rate changes — (0.1) — — 0.3 (0.3)
AOCI (loss) gain at end of plan year $ (9.7) $ 2.5 $ (7.2) $ 7.2 $ (16.9) $ (14.0)
The amounts in AOCI expected to be amortized as a component of net period cost in the upcoming year are (U.S. dollars in millions):
Pension plansPost-retirement
plans
U.S. U.K.CentralAmerica
2015 Amortization of net losses $ 0.4 $ — $ 1.1
The following table sets forth the net periodic pension cost of our defined benefit pension and post-retirement benefit plans (U.S. dollars in millions):
Pension plans Post-retirement plansYear ended Year ended
December 26,2014
December 27,2013
December 28,2012
December26, 2014
December27, 2013
December28, 2012
U.S. U.K. U.S. U.K. U.S. U.K.CentralAmerica
CentralAmerica
CentralAmerica
Service cost $ — $ — $ — $ — $ — $ — $ 5.2 $ 5.5 $ 4.2
Interest cost 0.7 2.7 0.7 2.3 0.8 2.4 3.6 3.3 3.0Expected return onassets (0.9) (3.5) (1.0) (2.4) (1.0) (2.5) — — —
Net amortization 0.3 (0.1) 0.4 — 0.3 — 0.9 1.6 1.1Net periodic cost(income) $ 0.1 $ (0.9) $ 0.1 $ (0.1) $ 0.1 $ (0.1) $ 9.7 $ 10.4 $ 8.3
There are no amounts of plan assets expected to be returned to us over the next 12 months.

FRESH DEL MONTE PRODUCE INC. AND SUBSIDIARIES
NOTES TO CONSOLIDATED FINANCIAL STATEMENTS (continued)
84
14. Retirement and Other Employee Benefits (continued)
Actuarial Assumptions
The assumptions used in the calculation of the benefit obligations of our U.S. and U.K defined benefit pension plans and Central American plans consisted of the following:
December 26, 2014 December 27, 2013 December 28, 2012
Pension plans
Post-retirement
plans Pension plans
Post-retirement
plans Pension plans
Post-retirement
plans
U.S. U.K.CentralAmerica U.S. U.K.
CentralAmerica U.S. U.K.
CentralAmerica
Weighted averagediscount rate 3.70% 3.60% 6.85% (1) 4.45% 4.50% 7.56% (1) 3.85% 4.10% 6.65%Rate of increasein compensationlevels —% 2.20% 5.20% —% 2.50% 5.39% —% 2.70% 5.37%
The assumptions used in the calculation of the net periodic pension costs for our U.S. and U.K. defined benefit pension plans and Central American plans consisted of the following:
December 26, 2014 December 27, 2013 December 28, 2012
Pension plans
Post-retirement
plans Pension plans
Post-retirement
plans Pension plans
Post-retirement
plans
U.S. U.K.CentralAmerica U.S. U.K.
CentralAmerica U.S. U.K.
CentralAmerica
Weighted averagediscount rate 4.45% 4.50% 7.56% (1) 3.85% 4.10% 6.65% (1) 4.50% 4.70% 7.73%
Rate of increase incompensation levels —% 2.50% 5.39% —% 2.70% 5.37% —% 2.90% 5.04%
Expected long-termrate of return onassets 7.50% 6.41% —% 7.50% 6.41% —% 7.50% 5.91% —%
(1) The increase or decrease in the weighted average discount rate assumption for the benefit obligation and net periodic pension costs increased due to an increase or decrease in inflation assumptions and country-specific investments.
Effective December 26, 2014, we utilized updated mortality tables for our U.S. Plan. The change related to updated mortality tables has caused an increase of our projected benefit obligation for this plan by $0.9 million and is included in accumulated other comprehensive income in our Consolidated Balance Sheets. The change in method of calculating the discount rate is treated as a change in assumption, which affects the net actuarial (loss) gain and is amortized over the remaining service period of the plan participants. The annual amortization will impact net periodic cost in 2015.
Effective December 30, 2011 we changed the method of calculating the discount rate and rate of increase in compensation levels for the UK Plan. The change related to using the Consumer Prices Index rather than the Retail Prices Index as the inflation measure for pension plans in order to align the expected return on investments with the expected benefit payment stream. The impact to the beginning benefit obligation for 2012 as a result of this change was $6.3 million, which resulted in a decrease in the retirement benefits liability and an increase in the amounts recognized in accumulated other comprehensive income in our Consolidated Balance Sheets. The change in method of calculating the discount rate is treated as a change in assumption, which affects the net actuarial (loss) gain and is amortized over the remaining service period of the plan participants. The annual amortization impacted net periodic cost in 2012.

FRESH DEL MONTE PRODUCE INC. AND SUBSIDIARIES
NOTES TO CONSOLIDATED FINANCIAL STATEMENTS (continued)
85
14. Retirement and Other Employee Benefits (continued)
Cash Flows
Pension plansPost-retirement
plans
U.S. U.K.CentralAmerica
Expected benefit payments for: 2015 $ 1.4 $ 2.0 $ 6.22016 1.4 2.0 6.32017 1.4 2.1 5.62018 1.4 2.3 5.82019 1.3 2.3 6.4Next 5 years 6.1 13.4 27.0
Expected benefit payments over next 10 years $ 13.0 $ 24.1 $ 57.3
Expected contributions for the U.S. and U.K pension plans, for 2015 are $0.8 million and $2.2 million, respectively. Contributions for the U.S. and U.K. pension plans are actuarially determined based on funding regulations. U.S.-Based Defined Benefit Pension Plans
Plan Assets Our overall investment strategy is to achieve a mix of between 50%-70% equity securities for long-term growth and 30%-50% fixed income securities for near-term benefit payments. Asset allocation targets promote optimal expected return and volatility characteristics given the long-term time horizon for fulfilling the obligations of the pension plans. Selection of the targeted asset allocation for U.S. plan assets was based upon a review of the expected return and risk characteristics of each asset class, as well as the correlation of returns among asset classes.
The fair values of our U.S. plan assets by asset category are as follows:
Fair Value Measurements atDecember 26, 2014 (U.S. dollars in millions)
Quoted Pricesin
Active Marketsfor
Identical Assets
SignificantObservable
Inputs
SignificantUnobservable
InputsAsset Category Total (Level 1) (Level 2) (Level 3)Mutual Funds:
Fixed income securities $ 2.7 $ 2.7 $ — $ —Bond securities 2.3 2.3 — —Value securities 5.1 5.1 — —Growth securities 4.0 4.0 — —
Total $ 14.1 $ 14.1 $ — $ —

FRESH DEL MONTE PRODUCE INC. AND SUBSIDIARIES
NOTES TO CONSOLIDATED FINANCIAL STATEMENTS (continued)
86
14. Retirement and Other Employee Benefits (continued)
The fair values of our U.S. plan assets by asset category are as follows:
Fair Value Measurements atDecember 27, 2013 (U.S. dollars in millions)
Quoted Pricesin
Active Marketsfor
Identical Assets
SignificantObservable
Inputs
SignificantUnobservable
InputsAsset Category Total (Level 1) (Level 2) (Level 3)Mutual Funds:
Fixed income securities $ 3.5 $ 3.5 $ — $ —Bond securities 1.0 1.0 — —Value securities 5.6 5.6 — —Growth securities 4.1 4.1 — —
Total $ 14.2 $ 14.2 $ — $ —
Mutual Funds – This category includes investments in mutual funds that encompass both equity and fixed income securities that are designed to provide a diverse portfolio. The plan’s mutual funds are designed to track exchange indices, and invest in diverse industries. Some mutual funds are classified as regulated investment companies. Investment managers have the ability to shift investments from value to growth strategies, from small to large capitalization funds, and from U.S. to international investments. These investments are valued at the closing price reported on the active market on which the individual securities are traded. These investments are classified within Level 1 of the fair value hierarchy.
Investment managers agree to operate the plan's investments within certain criteria that determine eligible and ineligible securities, diversification requirements and credit quality standards, where applicable. Unless exceptions have been approved, investment managers are prohibited from buying or selling commodities, futures or option contracts, as well as from short selling of securities. Furthermore, investment managers agree to obtain written approval for deviations from stated investment style or guidelines. We considered historical returns and the future expectations for returns for each asset class as well as the target asset allocation of plan assets to develop the expected long-term rate of return on assets assumption. The expected long-term rate of return assumption for U.S. plan assets is based upon the target asset allocation and is determined using forward-looking assumptions in the context of historical returns and volatilities for each asset class, as well as correlations among asset classes. We evaluate the rate of return assumption on an annual basis.

FRESH DEL MONTE PRODUCE INC. AND SUBSIDIARIES
NOTES TO CONSOLIDATED FINANCIAL STATEMENTS (continued)
87
14. Retirement and Other Employee Benefits (continued)
United Kingdom Defined Benefit Pension Plan Plan Assets
The fair values of our U.K. plan assets by asset category are as follows:
Fair Value Measurements atDecember 26, 2014 (U.S. dollars in millions)
Asset Category
Total FairValue at
December 26,2014
Quoted Pricesin Active
Markets forIdentical Assets
(Level 1)
SignificantObservable
Inputs(Level 2)
SignificantUnobservable
Inputs(Level 3)
Cash $ 0.1 $ 0.1 $ — $ —Equity securities:
United Kingdom companies 23.1 23.1 — —Other international companies 20.5 20.5 — —
Fixed income securities: United Kingdom government bonds 5.0 5.0 — —United Kingdom corporate bonds 6.7 6.7 — —
Total $ 55.4 $ 55.4 $ — $ —
Fair Value Measurements atDecember 27, 2013 (U.S. dollars in millions)
Asset Category
Total FairValue at
December 27,2013
Quoted Pricesin Active
Markets forIdentical Assets
(Level 1)
SignificantObservable
Inputs(Level 2)
SignificantUnobservable
Inputs(Level 3)
Cash $ 0.7 $ 0.7 $ — $ —Equity securities:
United Kingdom companies 23.1 23.1 — —United States companies 7.6 7.6 — —Other international companies 12.5 12.5 — —
Fixed income securities: United Kingdom government bonds 4.8 4.8 — —United Kingdom corporate bonds 6.2 6.2 — —
Total $ 54.9 $ 54.9 $ — $ —
Equity securities – This category includes stocks in various U.S., U.K. and other international companies over diverse industries. The portfolio of stocks is invested in diverse industries and includes a concentration of 24% in financial institutions, 10% in oil and gas, 6% in basic materials, 14% in consumer goods, 11% in industrial, 10% in health care and the remaining 25% in various other industries. The expected return on equities is determined by the yield on U.K. government bonds based on the Financial Times Stock Exchange (“FTSE”) U.K. 20-year index plus an allowance for an equity risk premium.

FRESH DEL MONTE PRODUCE INC. AND SUBSIDIARIES
NOTES TO CONSOLIDATED FINANCIAL STATEMENTS (continued)
88
14. Retirement and Other Employee Benefits (continued)
These investments are valued at the closing price reported on the active market on which the individual securities are traded. These investments are classified in Level 1 of the fair value hierarchy.
Fixed income securities –This category includes investment in U.K. government bonds and U.K. corporate bonds. These investments are valued at the closing price reported on the active market on which the individual securities are traded. These investments are classified in Level 1 of the fair value hierarchy. The expected return on U.K. government bonds is as measured by the FTSE U.K. 20-year index. The expected return on U.K. corporate bonds is measured by the yield on the iBoxx over 15 year AA Corporate Index. According to the plan’s investment policy, approximately 42% of the U.K. plan’s assets are invested in equity securities of companies of the United Kingdom and 37% are invested in other international equities. Approximately 12% of the U.K. plan’s assets are invested in high-grade, fixed-income securities or corporate bonds with maturities of up to 15 years. Fund managers have no discretion to make asset allocation decisions, but the trustees try to rebalance any discrepancies through selective allocations of future contributions. Performance benchmarks for each asset class are based on various FTSE indices. Investment performance is reviewed quarterly.
Other Employee Benefits
We also sponsor a defined contribution plan established pursuant to Section 401(k) of the Internal Revenue Code. Subject to certain dollar limits, employees may contribute a percentage of their salaries to the plan, and we will match a portion of each employee’s contribution. This plan is in effect for U.S.-based employees only. The expense pertaining to this plan was $1.1 million for 2014, $1.1 million for 2013 and $1.1 million for 2012. On August 31, 1997, one of our subsidiaries ceased accruing benefits under its salary continuation plan covering certain of our Central American management personnel. At December 26, 2014 we had $6.1 million accrued for this plan including $0.8 million in accumulated other comprehensive income (loss) related to unamortized pension gains. At December 27, 2013 we had $6.7 million accrued for this plan including and $0.9 million in accumulated other comprehensive income (loss) related to unamortized pension gains. Net periodic pension costs were, $0.3 million for each of the years ended December 26, 2014, December 27, 2013 and December 28, 2012. We expect to contribute approximately $0.8 million to the salary continuation plan in 2015 through 2019. Benefit payments under the plan from 2020 to 2024 are expected to total $2.9 million.
We sponsor a service gratuity plan covering certain of our Kenyan personnel. At December 26, 2014 we had $5.7 million accrued for this plan including $1.8 million in accumulated other comprehensive income (loss) related to unamortized pension losses. At December 27, 2013, we had and $6.0 million accrued for this plan including $2.1 million in accumulated other comprehensive income (loss) related to unamortized pension losses. Net periodic pension costs were $1.1 million for the year ended December 24, 2014, $1.3 million for the year ended December 27, 2013 and $0.7 million for the year ended December 28, 2012. We expect to contribute approximately $1.0 million to the salary continuation plan in 2015 through 2019. Benefit payments under the plan from 2020 to 2024 are expected to total $5.0 million.
We provide retirement benefits to certain employees who are not U.S.-based. Generally, benefits under these programs are based on an employee’s length of service and level of compensation. These programs are immaterial to our consolidated financial statements. The unamortized pension losses related to other non-U.S.-based plans included in accumulated other comprehensive income (loss), a component of shareholders’ equity was $1.6 million and $1.2 million for the years ending December 26, 2014 and December 27, 2013, respectively.

FRESH DEL MONTE PRODUCE INC. AND SUBSIDIARIES
NOTES TO CONSOLIDATED FINANCIAL STATEMENTS (continued)
89
15. Stock-Based Compensation We maintain various compensation plans for officers, other employees, and non-employee members of our Board of Directors. Stock-based compensation expense included in selling, general and administrative expenses related to stock options on a straight-line, single award basis, restricted stock awards ("RSAs"), restricted stock units ("RSUs") and performance stock units ("PSUs") is included in the accompanying Consolidated Statements of Income was as follows (U.S. dollars in millions):
Year ended
Types of AwardsDecember 26,
2014December 27,
2013December 28,
2012Stock options $ 5.2 $ 6.8 $ 8.4RSUs/PSUs $ 6.5 $ 2.4 $ 1.2RSAs $ 0.7 $ 0.7 $ 0.7Total $ 12.4 $ 9.9 $ 10.3
We realized an excess share-based payment deduction resulting from stock options exercised through a reduction in taxes currently payable and related effect on cash flows of $0.1 million for the year ended December 26, 2014 and $3.6 million for the year ended December 28, 2012. There were no excess tax benefits for the year ended December 27, 2013. Proceeds received from the exercise of stock options was $48.9 million for the year ended December 26, 2014, $44.0 million for the year ended December 27, 2013, and $10.1 million for the year ended December 28, 2012.
On April 30, 2014, our shareholders approved and ratified the 2014 Omnibus Share Incentive Plan (the “2014 Plan”). The 2014 Plan allows the Company to grant equity-based compensation awards, including stock options, restricted stock awards, restricted stock units and performance stock units. Under the 2014 Plan, the Board of Directors is authorized to award up to 3,000,000 ordinary shares. The 2014 Plan replaces and supersedes the 2011 Omnibus Share Incentive Plan (the "2011 Plan"), the 2010 Non-Employee Directors Equity Plan, and the Amended and Restated 1999 Share Incentive Plan (the "1999 Plan"), collectively referred to as Prior Plans.
The 2011 Plan allowed the Company to grant equity-based compensation awards, including stock options, restricted stock awards and restricted stock units. The 2010 Non-Employee Directors Equity Plan allowed the Company to award RSAs to members of the Board of Directors on January 1st of each calendar year beginning in 2011 with initial award in 2010. The 1999 Plan allowed the Company to grant options to purchase Ordinary Shares. As of December 26, 2014, there were no options and awards available for grant under the Prior Plans.
Stock Option Awards
Under the 2014 Plan and Prior Plans, 20% of the options usually vest immediately, and the remaining options vest in equal installments over the next four years. Options under the 2014 Plan and Prior Plans may be exercised over a period not in excess of 10 years from the date of the grant. Prior Plan provisions are still applicable to outstanding options and awards under those plans.

FRESH DEL MONTE PRODUCE INC. AND SUBSIDIARIES
NOTES TO CONSOLIDATED FINANCIAL STATEMENTS (continued)
90
15. Stock-Based Compensation (continued)
The following table lists the various stock option grants from our 2014 Plan and Prior Plans for the years ended December 26, 2014 and December 27, 2013:
Stock Option Grant
Number ofOptionsGranted
ExercisePrice
FairValue
April 30, 2014 - Chairman and Chief Executive Officer 161,000 $ 28.89 $ 6.26 (1)
February 20, 2013 - Chairman and Chief Executive Officer 161,000 26.52 8.38 (2)
July 31, 2013 - Employees 149,000 28.01 6.79 (3)
July 31, 2013 - Employees 446,000 28.09 8.46 (2)
(1) Options granted under the 2014 Plan based on daily closing stock prices. (2) Option granted under the 2011 Plan based on daily closing stock prices. (3) Option granted under the 1999 Plan based on daily average of high and low stock prices.
The fair value for stock options was estimated at the date of grant using the Black-Scholes option pricing model, which requires us to make certain assumptions. Volatility is estimated based on the historical volatility of our stock over the past five years. The risk-free interest rate is based on U.S. Treasury zero-coupon issues with a remaining term equal to the expected term of grant. The dividend yield is estimated over the expected life based on our dividend policy, historical cash dividends and expected future cash dividends. The expected term of grant was based on the contractual term of the stock option and expected employee exercise and post-vesting employment termination trends. Forfeitures are estimated based on historical experience.
The following table summarizes stock option activity for the years ended December 26, 2014, December 27, 2013 and December 28, 2012:
Number of
Shares
WeightedAverageExercise
Price
WeightedAverage
FairValue
Options outstanding at December 30, 2011 4,737,052 $ 23.90 $ 8.74Granted 986,000 23.99 8.40Exercised (475,918) 21.29 7.86Cancelled (52,000) 27.13 10.07
Options outstanding at December 28, 2012 5,195,134 24.12 8.77Granted 756,000 27.74 8.11Exercised (1,975,339) 22.26 8.22Cancelled (3,000) 24.29 8.44
Options outstanding at December 27, 2013 3,972,795 25.74 8.37Granted 161,000 28.89 6.26Exercised (1,945,939) 25.14 8.96Cancelled (72,250) 29.44 9.79
Options outstanding at December 26, 2014 2,115,606 $ 26.41 $ 8.65
Exercisable at December 28, 2012 3,460,134 $ 24.43 $ 8.96
Exercisable at December 27, 2013 2,349,795 $ 26.00 $ 9.32
Exercisable at December 26, 2014 994,606 $ 26.82 $ 9.29

FRESH DEL MONTE PRODUCE INC. AND SUBSIDIARIES
NOTES TO CONSOLIDATED FINANCIAL STATEMENTS (continued)
91
15. Stock-Based Compensation (continued)
The following are the weighted average assumptions used in the Black-Scholes option pricing model for the periods indicated:
Year endedDecember 26,
2014December 27,
2013December 28,
2012Volatility 26.96% 37.98% 46.18%Risk-free rate 1.69% 1.27% 0.67%Dividend yield 1.73% 1.80% 1.64%Expected term of grant 5.0 years 5.0 years 5.0 years
Information about stock options outstanding at December 26, 2014 was as follows:
ExercisePrice
RemainingContractual
Life Outstanding
OutstandingIntrinsic
Value Exercisable
ExercisableIntrinsic
Value$ 14.77 4.3 years 30,000 $ 0.6 30,000 $ 0.6$ 15.78 1.6 years 14,000 0.2 14,000 0.2$ 17.35 2.2 years 6,250 0.1 6,250 0.1$ 18.31 1.3 years 6,000 0.1 6,000 0.1$ 19.76 1.2 years 6,250 0.1 6,250 0.1$ 19.83 4.2 years 12,500 0.2 12,500 0.2$ 20.13 5.2 years — — — —$ 21.72 4.6 years 105,005 1.3 105,005 1.3$ 22.25 3.6 years 78,682 0.9 78,682 0.9$ 22.46 7.2 years 64,400 0.7 — —$ 23.76 6.6 years 268,219 2.6 108,219 1.1$ 24.29 7.6 years 398,810 3.7 98,810 0.9$ 26.52 8.2 years 108,816 0.8 12,216 0.1$ 26.67 6.2 years 32,200 0.2 — —$ 28.01 8.6 years 116,200 0.7 29,800 0.2$ 28.09 8.6 years 303,784 1.7 51,184 0.3$ 28.89 9.4 years 161,000 0.8 32,200 0.2$ 29.84 0.3 years 186,240 0.7 186,240 0.7$ 30.59 2.9 years — — — —$ 32.28 0.1 years 25,000 — 25,000 —$ 33.97 3.2 years 161,000 — 161,000 —$ 33.97 3.2 years 31,250 — 31,250 —
2,115,606 $ 15.4 994,606 $ 7.0
The total intrinsic value of options exercised during the years ended December 26, 2014 and December 27, 2013 was $12 million and $11.8 million, respectively. The total fair value of options granted for years ended December 26, 2014 and December 27, 2013 was $1.0 million and $6.1 million, respectively. The total fair value of options vesting during the years ended December 26, 2014 and December 27, 2013 was $5.4 million and $7.1 million, respectively, with a weighted-average fair value of $8.26 and $8.26 per option, respectively. As of December 26, 2014, the total remaining unrecognized compensation cost related to non-vested stock options amounted to $6.5 million, which will be amortized over the weighted-average remaining requisite service period of 1.9 years.

FRESH DEL MONTE PRODUCE INC. AND SUBSIDIARIES
NOTES TO CONSOLIDATED FINANCIAL STATEMENTS (continued)
92
15. Stock-Based Compensation (continued)
Restricted Stock Awards
A share of “restricted stock” is one of our ordinary shares that has restrictions on transferability until certain vesting conditions are met. No RSAs have been issued under the 2014 Plan.
RSAs under Prior Plans, 50% of each award of our restricted stock vested on the date it was granted. The remaining 50% of each award vests upon the six-month anniversary of the date on which the recipient ceases to serve as a member of our Board of Directors. RSAs awarded during the years ended December 26, 2014 and December 27, 2013 allows directors to retain all of their awards once they cease to serve as a member of our Board of Directors and is considered a nonsubstantive service condition in accordance with the guidance provided by the ASC on “Compensation – Stock Compensation”. Accordingly, it is appropriate to recognize compensation cost immediately for restricted stock awards granted to non-management members of the Board of Directors.
The following table lists the various RSAs and related compensation expense under the 2010 Non-Employee Director's Equity Plan for the years ended December 26, 2014 and December 27, 2013 (U.S. dollars in millions except share and per share data):
Date of Award
Shares ofRestricted
StockAwarded
Price PerShare
January 2, 2014 26,117 $ 28.15January 2, 2013 26,201 26.72
Restricted Stock Units / Performance Stock Units
Each RSU/PSU represents a contingent right to receive one of our ordinary shares. The PSUs are subject to meeting minimum performance criteria set by our Compensation Committee of our Board of Directors. The actual number of shares the recipient receives is determined based on the results achieved versus performance goals. Those performance goals are based on exceeding a measure of our earnings. Depending on the results achieved, the actual number of shares that an award recipient receives at the end of the period may range from 0% to 100% of the award units granted. Provided such criteria are met, the PSU will vest in three equal annual installments on each of the next three anniversary dates provided that the recipient remains employed with us.
RSUs/PSUs do not have the voting rights of ordinary shares, and the shares underlying the RSUs/PSUs are not considered issued and outstanding. However, shares underlying RSUs/PSUs are included in the calculation of diluted earnings per share to the extent the performance criteria are met.

FRESH DEL MONTE PRODUCE INC. AND SUBSIDIARIES
NOTES TO CONSOLIDATED FINANCIAL STATEMENTS (continued)
93
15. Stock-Based Compensation (continued)
The fair market value for RSUs/PSUs is based on the closing price of our stock on the award date. Forfeitures are estimated based on population of employees and historical experience.
The following table lists the various RSUs/PSUs awarded under the 2014 Plan and Prior Plans for the year ended December 26, 2014 (U.S. dollars in millions except share and per share data):
Date of AwardType ofAward
UnitsAwarded
Price PerShare
July 30, 2014 RSU 311,000 $ 29.99February 19, 2014 PSU 165,000 25.52February 20, 2013 PSU 175,000 26.52
RSUs are eligible to earn Dividends Equivalent Units ("DEUs") equal to the cash dividend paid to ordinary shareholders. DEUs are subject to the same performance and/or service conditions as the underlying RSUs/PSUs and are forfeitable.

FRESH DEL MONTE PRODUCE INC. AND SUBSIDIARIES
NOTES TO CONSOLIDATED FINANCIAL STATEMENTS (continued)
94
15. Stock-Based Compensation (continued)
The following table summarizes RSUs/PSUs activity for the years ended December 26, 2014, December 27, 2013 and Dec 28, 2012:
Number of
Shares
WeightedAverage
Grant DateFair
ValueRSUs/PSUs outstanding at December 30,2011 155,000 $ 24.68
Granted — —Converted — —Cancelled (5,000) 24.68
RSUs/PSUs outstanding at December 28,2012 150,000 24.68
Granted 175,000 26.52Converted — —Cancelled — —
RSUs/PSUs outstanding at December 27,2013 325,000 25.67
Granted 476,000 28.44Converted (140,466) 27.44Cancelled — —
RSUs/PSUs outstanding at December 26,2014 660,534 27.29
Vested at December 28, 2012 — $ —
Vested at December 27, 2013 100,000 $ 24.68
Vested at December 26, 2014 131,667 $ 25.12
Information about RSUs/PSUs outstanding at December 26, 2014 was as follows:
ExercisePrice Outstanding
OutstandingIntrinsic
Value Vested
VestedIntrinsic
Value$ 25.52 165,000 $ 1.3 — $ —$ 29.99 247,200 0.9 — —$ 26.52 148,334 1.1 31,667 0.2$ 24.68 100,000 0.9 100,000 0.9
660,534 $ 4.2 131,667 $ 1.1

FRESH DEL MONTE PRODUCE INC. AND SUBSIDIARIES
NOTES TO CONSOLIDATED FINANCIAL STATEMENTS (continued)
95
15. Stock-Based Compensation (continued)
As of December 26, 2014, the total remaining unrecognized compensation cost related to non-vested RSUs/PSUs amounted to $10.7 million, which will be amortized over the weighted-average remaining requisite service period of 2.1 years.
We expense the fair market value of RSUs/PSUs, as determined on the date of grant, ratably over the vesting period provided the performance condition, if any, is probable of attaining.
16. Commitments and Contingencies We lease agricultural land and certain property, plant and equipment, including office facilities and refrigerated containers, under operating leases. We also enter into vessel charter agreements for the transport of our fresh produce to markets worldwide using 6 chartered refrigerated vessels. Terms for vessel charter agreements range between 2 to 10 years. The aggregate minimum payments under all operating leases and vessel charter agreements with initial terms of one year or more at December 26, 2014 are as follows (U.S. dollars in millions):
2015 $ 54.92016 53.22017 39.62018 38.42019 36.1Thereafter 32.9 $ 255.1
Total expense for all operating leases and vessel charter agreements, including leases with initial terms of less than one year, amounted to $106.2 million for 2014, $114.6 million for 2013 and $93.4 million for 2012. We also have agreements to purchase the entire or partial production of certain products of our independent growers primarily in Costa Rica, Guatemala, Ecuador, Cameroon, Colombia, Chile, and the Philippines that meet our quality standards. Total purchases under these agreements amounted to $811.3 million for 2014, $744.3 million for 2013 and $650 million for 2012.
17. Litigation Beginning in December 1993, certain of our U.S. subsidiaries were named among the defendants in a number of actions in courts in Texas, Louisiana, Hawaii, California and the Philippines involving claims by numerous non-U.S. plaintiffs alleging that they were injured as a result of exposure to a nematocide containing the chemical dibromochloropropane (“DBCP”) during the period 1965 to 1990. As a result of a settlement entered into in December 1998, the remaining unresolved DBCP claims against our U.S. subsidiaries are pending or subject to appeal in Hawaii, Louisiana, California, Delaware and the Philippines. On October 14, 2004, two of our subsidiaries were served with a complaint in an action styled Angel Abarca, et al. v. Dole Food Co., et al. filed in the Superior Court of the State of California for the County of Los Angeles on behalf of more than 2,600 Costa Rican banana workers who claim injury from exposure to DBCP. On January 2, 2009, three of our subsidiaries were served with multiple complaints in related actions styled Jorge Acosta Cortes, et al. v. Dole Food Company, et al. filed in the Superior Court of the State of California for the County of Los Angeles on behalf of 461 Costa Rican residents. An initial review of the plaintiffs in the Abarca and Cortes actions found that a substantial number of the plaintiffs were claimants in prior DBCP actions in Texas and may have participated in the settlement of those actions. On June 27, 2008, the court dismissed the claims of 1,329 plaintiffs who were parties to prior DBCP actions. On June 30, 2008, our subsidiaries moved to dismiss the claims of the remaining Abarca plaintiffs on grounds of forum non conveniens in favor of the courts of Costa Rica. On September 22, 2009, the court granted the motion to dismiss and on November 16, 2009 entered an order conditionally dismissing the claims of those remaining plaintiffs who allege employment on farms in Costa Rica exclusively affiliated with our subsidiaries. Those dismissed plaintiffs re-filed their claim in Costa Rica on May 17, 2012. On January 18, 2013, all remaining plaintiffs in California filed Requests for Dismissal effecting the dismissal of their claims without prejudice. On September 25, 2013, our subsidiaries filed an answer to the claim re-filed with the courts of Costa Rica.

FRESH DEL MONTE PRODUCE INC. AND SUBSIDIARIES
NOTES TO CONSOLIDATED FINANCIAL STATEMENTS (continued)
96
17. Litigation (continued)
In February 2011, a group of former banana cooperative workers from the Philippines filed a complaint in the Philippines against two of our subsidiaries claiming injury from exposure to DBCP. The trial court dismissed the complaint against our subsidiaries on October 3, 2011. Plaintiffs have appealed the dismissal to the Court of Appeals, which appeal is pending. On May 31 and June 1, 2012, eight actions were filed against one of our subsidiaries in the United States District Court for the District of Delaware on behalf of approximately 3,000 plaintiffs alleging exposure to DBCP on or near banana farms in Costa Rica, Ecuador, Panama, and Guatemala. We and our subsidiaries have never owned, managed or otherwise been involved with any banana growing operations in Panama and were not involved with any banana growing operations in Ecuador during the period when DBCP was in use. The plaintiffs include claimants who had cases pending in the United States District Court for the Eastern District of Louisiana which were dismissed on September 17, 2012. On August 30, 2012, our subsidiary joined a motion to dismiss the claims of those plaintiffs on the grounds that they have first-filed claims pending in the United States District Court for the Eastern District of Louisiana. The motion was granted on March 29, 2013. On September 21, 2012, our subsidiary filed an answer with respect to the claims of those plaintiffs who had not already filed in Louisiana. On May 27, 2014, the court granted a motion made by a co-defendant and entered summary judgment against all plaintiffs based on the September 19, 2013 affirmance by the United States Court of Appeals for the Fifth Circuit of the dismissal of related cases by the United States District Court for the Eastern District of Louisiana. On July 7, 2014, our subsidiary joined in a motion for summary judgment as to all plaintiffs on the basis of the court’s May 27, 2014 ruling. Plaintiffs agreed that judgment be entered in favor of all defendants for the claims still pending in the United States District Court for the District of Delaware on the basis of the summary judgment granted on May 27, 2014 and the district court entered judgment dismissing all plaintiffs’ claims on September 22, 2014. On October 21, 2014, a notice of appeal was filed with the United States Court of Appeals for the Third Circuit, but the notice expressly limited the appeal to the claims of 57 (out of the more than 2,400) plaintiffs.
In Hawaii, plaintiffs filed a petition for certiorari to the Hawaii Supreme Court based upon the Hawaii Court of Appeals affirmance in March 2014 of a summary judgment ruling in defendants’ favor at the trial court level. The Hawaii Supreme Court accepted the petition and oral argument was held on September 18, 2014 with respect to whether the claims of the six named plaintiffs were properly dismissed on statute of limitations grounds. The decision of the Hawaii Supreme Court remains pending.
European Union Antitrust Investigation On June 2, 2005, one of our German subsidiaries was visited by the European Commission, the antitrust authority of the European Union (“EU”) as part of its investigation of certain of our overseas subsidiaries as well as other produce companies for possible violations of the EU’s competition laws. Our subsidiaries cooperated with the investigation. On October 17, 2008, the European Commission concluded its investigation without finding any infringement of EU competition rules by, or imposing any fines on, our subsidiaries.
The European Commission did, however, find that Internationale Fruchtimport Gesellschaft Weichert & Co KG (“Weichert”), an entity in which one of our subsidiaries formerly held an indirect 80% noncontrolling interest, infringed EU competition rules and imposed upon it a €14.7 million ($17.9 million using exchange rates as of December 26, 2014) fine. The European Commission has asserted that we controlled Weichert during the period by virtue of our subsidiary’s former, indirect noncontrolling interest and has therefore held that we are jointly and severally liable for Weichert’s payment of the fine.

FRESH DEL MONTE PRODUCE INC. AND SUBSIDIARIES
NOTES TO CONSOLIDATED FINANCIAL STATEMENTS (continued)
97
17. Litigation (continued)
On December 31, 2008, we filed an appeal of this determination on grounds, among others, that Weichert did not violate EU competition rules and that, in any event, we cannot be held jointly and severally liable for Weichert’s acts under applicable EU law. On April 14, 2010, Weichert filed a statement of intervention in support of our appeal seeking annulment of the European Commission’s determination. A hearing was held on February 1, 2012 for oral argument on the appeal. On March 14, 2013, the ruling on the appeal was issued reducing the fine from €14.7 million to €8.8 million ($10.7 million using exchange rates as of December 26, 2014) but upholding the European Commission's decision holding us jointly and severally liable for Weichert's payment of the fine.
On May 24, 2013, we filed an appeal with the Court of Justice of the European Union against this decision re-asserting that we cannot be held jointly and severally liable for Weichert's acts under EU law. On June 4, 2013, the European Commission filed an appeal challenging only an approximate €1.0 million (€1.2 million using exchange rates as of December 26, 2014) portion of the lower court's fine reduction and thereby seeking that the fine be set at €9.8 million ($11.9 million using exchange rates as of December 26, 2014) rather than €8.8 million. In its appeal, the European Commission also disputed the grounds upon which we based our appeal. We filed our response to the European Commission's appeal on July 1, 2013. The European Commission filed its response to our appeal on August 5, 2013. Weichert filed responses to our appeal and the European Commission’s appeal as well as a cross-appeal on August 8, 2013. We filed a reply to the European Commission’s response to our appeal on October 17, 2013. A hearing was held on October 9, 2014 for oral argument on the appeal. On December 11, 2014, the Advocate General of the Court of Justice issued an advisory opinion to the court agreeing with the European Commission’s position on appeal, disagreeing with our and Weichert’s positions on appeal and recommending that the fine be set at €9.8 million. The decision of the Court of Justice on the appeal remains pending. During December 2014, as a result of the advisory opinion issued by the Advocate General of the Court of Justice, we accrued $8.8 million in non-current liabilities on our Consolidated Balance Sheets related to the European Union antitrust investigation.
Kunia Well Site In 1980, elevated levels of certain chemicals were detected in the soil and ground-water at a plantation leased by one of our U.S. subsidiaries in Honolulu, Hawaii (the “Kunia Well Site”). Shortly thereafter, our subsidiary discontinued the use of the Kunia Well Site and provided an alternate water source to area well users and the subsidiary commenced its own voluntary cleanup operation.
In 1993, the Environmental Protection Agency (“EPA”) identified the Kunia Well Site for potential listing on the National Priorities List (“NPL”) under the Comprehensive Environmental Response, Compensation and Liability Act of 1980, as amended. On December 16, 1994, the EPA issued a final rule adding the Kunia Well Site to the NPL.
On September 28, 1995, our subsidiary entered into an order (the “Order”) with the EPA to conduct the remedial investigation and the feasibility study of the Kunia Well Site. Under the terms of the Order, our subsidiary submitted a remedial investigation report in November 1998 and a final draft feasibility study in December 1999 (which was updated from time to time) for review by the EPA. The EPA approved the remedial investigation report in February 1999 and the feasibility study on April 22, 2003. As a result of communications with the EPA in 2001, we recorded a charge of $15.0 million in the third quarter of 2001 to increase the recorded liability to the estimated expected future cleanup cost for the Kunia Well Site to $19.1 million. Based on conversations with the EPA in the third quarter of 2002 and consultation with our legal counsel and other experts, we recorded a charge of $7.0 million during the third quarter of 2002 to increase the accrual for the expected future clean-up costs for the Kunia Well Site to $26.1 million.
On September 25, 2003, the EPA issued the Record of Decision (“ROD”). The EPA estimates in the ROD that the remediation costs associated with the cleanup of the Kunia Well Site will range from $12.9 million to $25.4 million and will last approximately 10 years. It remains to be determined how long the remediation will actually last.

FRESH DEL MONTE PRODUCE INC. AND SUBSIDIARIES
NOTES TO CONSOLIDATED FINANCIAL STATEMENTS (continued)
98
17. Litigation (continued)
During 2014, as a result of a meeting held with the EPA which resulted in changes to the remediation work being performed, we reduced the liability related to the Kunia well site clean-up by $1.4 million. The undiscounted estimates are between $14.8 million and $28.7 million. The undiscounted estimate on which our accrual is based totals $14.8 million and is discounted using a 3.0% rate. As of December 26, 2014, there is $13.8 million included in other noncurrent liabilities and $0.8 million included in accounts payable and accrued expenses in the Consolidated Balance Sheets for the Kunia Well Site clean-up, which we expect to expend in the next 12 months. We expect to make payments of approximately $0.5 million in 2016, $1.7 million per year in 2017 and 2018, and $0.8 million in 2019. Certain portions of the EPA’s estimates have been discounted using a 3.0% interest rate.
On January 13, 2004, the EPA deleted a portion of the Kunia Well Site (Northeast section) from the NPL. On May 2, 2005, our subsidiary signed a Consent Decree with the EPA for the performance of the clean-up work for the Kunia Well Site. On September 27, 2005, the U.S. District Court for Hawaii approved and entered the Consent Decree. Based on findings from remedial investigations at the Kunia Well Site, our subsidiary continues to evaluate with the EPA the clean-up work currently in progress in accordance with the Consent Decree.
Additional Information In addition to the foregoing, we are involved from time to time in various claims and legal actions incident to our operations, both as plaintiff and defendant. In the opinion of management, after consulting with legal counsel, none of these other claims are currently expected to have a material adverse effect on the results of operations, financial position or our cash flows.
We intend to vigorously defend ourselves in all of the above matters, other than the unpaid wages class action litigation which is concluded.

FRESH DEL MONTE PRODUCE INC. AND SUBSIDIARIES
NOTES TO CONSOLIDATED FINANCIAL STATEMENTS (continued)
99
18. Derivative Financial Instruments Our derivative financial instruments reduce our exposure to fluctuations in foreign exchange rates and bunker fuel prices. We predominantly designate our derivative financial instruments as cash flow hedges. Counterparties expose us to credit loss in the event of non-performance on hedges. We monitor our exposure to counterparty non-performance risk both at inception of the hedge and at least quarterly thereafter. However, because the contracts are entered into with highly rated financial institutions, we do not anticipate non-performance by any of these counterparties. The exposure is usually the amount of the unrealized gains, if any, in such contracts.
Because of the high degree of effectiveness between the hedging instrument and the underlying exposure being hedged, fluctuations in the value of the derivative instruments are generally offset by changes in the cash flows or fair value of the underlying exposures being hedged. In addition, we perform an assessment of hedge effectiveness, both at inception and at least quarterly thereafter, to determine whether the financial instruments that are used in hedging transactions are effective at offsetting changes in the cash flows or fair value of the related underlying exposures. Any ineffective portion of a financial instrument’s change in fair value is immediately recognized in earnings. Certain of our derivative instruments contain provisions that require the current credit relationship between us and our counterparty to be maintained throughout the term of the derivative instruments. If that credit relationship changes, certain provisions could be triggered, and the counterparty could request immediate collateralization of derivative instruments in net liability position above a certain threshold. The aggregate fair value of all derivative instruments with a credit-risk-related contingent feature that are in a liability position on December 26, 2014 is $0.2 million. As of December 26, 2014, no triggering event has occurred and thus we are not required to post collateral. If the credit-risk-related contingent features underlying these agreements were triggered on December 26, 2014, we would not be required to post collateral to its counterparty because the collateralization threshold has not been met.
Foreign Currency Hedges We are exposed to fluctuations in currency exchange rates against the U.S. dollar on our results of operations and financial condition and we mitigate that exposure by entering into foreign currency forward contracts. Certain of our subsidiaries periodically enter into foreign currency forward contracts in order to hedge portions of forecasted sales or cost of sales denominated in foreign currencies with forward contracts and options, which generally expire within 1 year. At December 26, 2014, our foreign currency forward contracts will hedge a portion of our 2015 and 2016 foreign currency exposure. We designate our foreign currency forward contracts as single-purpose cash flow hedges of forecasted cash flows. Based on our formal assessment of hedge effectiveness of our foreign currency forward contracts, we determined that the impact of hedge ineffectiveness was de minimis for the years ended December 26, 2014, December 27, 2013 and December 28, 2012.
Bunker Fuel Hedges We are exposed to fluctuations in bunker fuel prices on our results of operations and financial condition and mitigate that exposure by entering into bunker fuel swap agreements, which permit us to lock in bunker fuel purchase prices. We designated our bunker fuel swap agreements as cash flow hedges. Our bunker fuel contracts settled during 2013 and we have none outstanding at the end of 2013 and 2014, respectively.
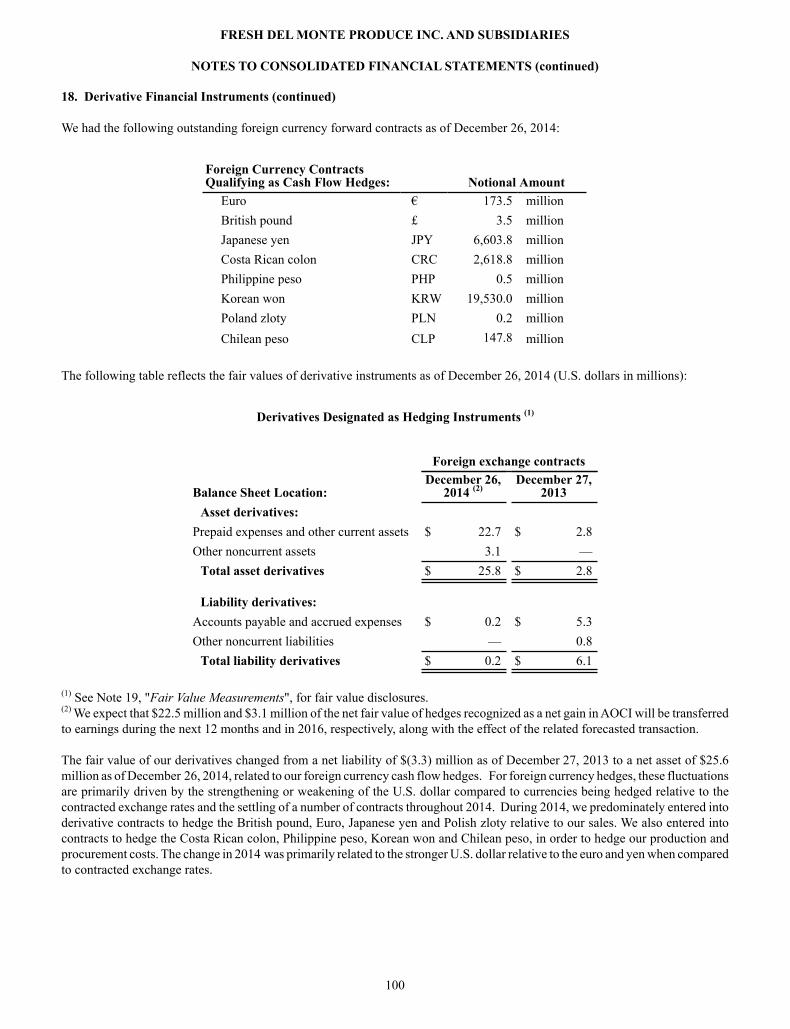
FRESH DEL MONTE PRODUCE INC. AND SUBSIDIARIES
NOTES TO CONSOLIDATED FINANCIAL STATEMENTS (continued)
100
18. Derivative Financial Instruments (continued)
We had the following outstanding foreign currency forward contracts as of December 26, 2014:
Foreign Currency ContractsQualifying as Cash Flow Hedges: Notional Amount
Euro € 173.5 millionBritish pound £ 3.5 millionJapanese yen JPY 6,603.8 millionCosta Rican colon CRC 2,618.8 millionPhilippine peso PHP 0.5 millionKorean won KRW 19,530.0 millionPoland zloty PLN 0.2 millionChilean peso CLP 147.8 million
The following table reflects the fair values of derivative instruments as of December 26, 2014 (U.S. dollars in millions):
Derivatives Designated as Hedging Instruments (1)
Foreign exchange contracts
Balance Sheet Location:December 26,
2014 (2)December 27,
2013Asset derivatives:
Prepaid expenses and other current assets $ 22.7 $ 2.8Other noncurrent assets 3.1 —
Total asset derivatives $ 25.8 $ 2.8
Liability derivatives: Accounts payable and accrued expenses $ 0.2 $ 5.3Other noncurrent liabilities — 0.8
Total liability derivatives $ 0.2 $ 6.1
(1) See Note 19, "Fair Value Measurements", for fair value disclosures.(2) We expect that $22.5 million and $3.1 million of the net fair value of hedges recognized as a net gain in AOCI will be transferred to earnings during the next 12 months and in 2016, respectively, along with the effect of the related forecasted transaction. The fair value of our derivatives changed from a net liability of $(3.3) million as of December 27, 2013 to a net asset of $25.6 million as of December 26, 2014, related to our foreign currency cash flow hedges. For foreign currency hedges, these fluctuations are primarily driven by the strengthening or weakening of the U.S. dollar compared to currencies being hedged relative to the contracted exchange rates and the settling of a number of contracts throughout 2014. During 2014, we predominately entered into derivative contracts to hedge the British pound, Euro, Japanese yen and Polish zloty relative to our sales. We also entered into contracts to hedge the Costa Rican colon, Philippine peso, Korean won and Chilean peso, in order to hedge our production and procurement costs. The change in 2014 was primarily related to the stronger U.S. dollar relative to the euro and yen when compared to contracted exchange rates.
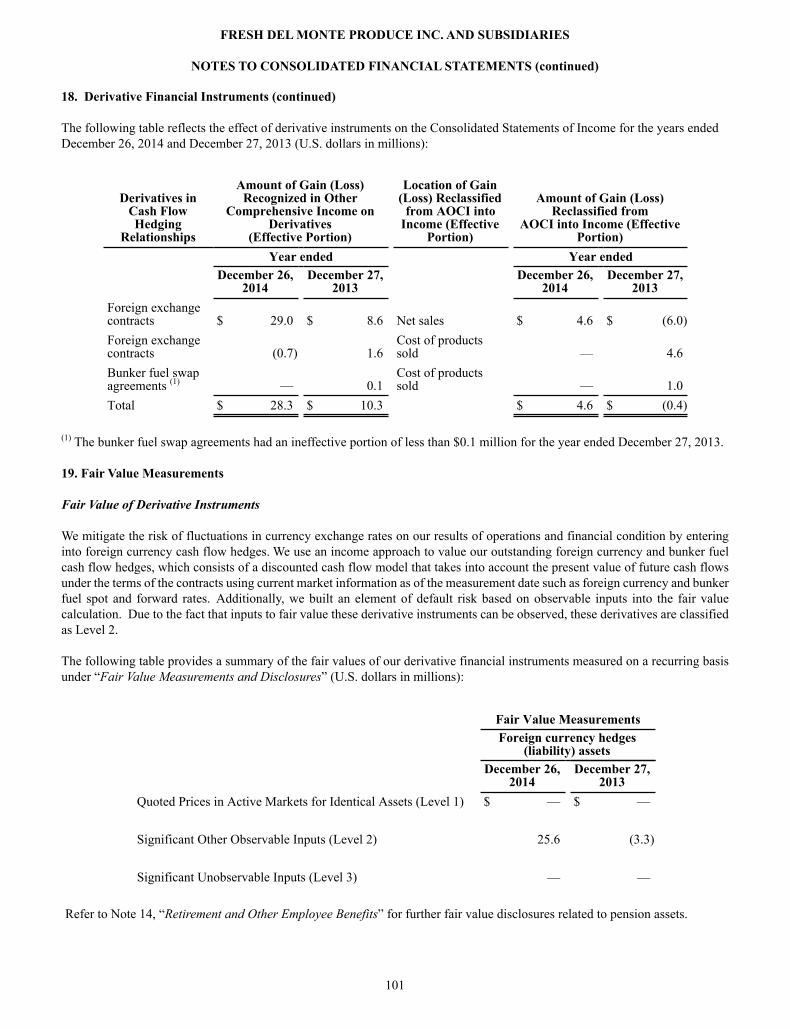
FRESH DEL MONTE PRODUCE INC. AND SUBSIDIARIES
NOTES TO CONSOLIDATED FINANCIAL STATEMENTS (continued)
101
18. Derivative Financial Instruments (continued)
The following table reflects the effect of derivative instruments on the Consolidated Statements of Income for the years ended December 26, 2014 and December 27, 2013 (U.S. dollars in millions):
Derivatives inCash FlowHedging
Relationships
Amount of Gain (Loss)Recognized in Other
Comprehensive Income onDerivatives
(Effective Portion)
Location of Gain(Loss) Reclassified
from AOCI intoIncome (Effective
Portion)
Amount of Gain (Loss)Reclassified from
AOCI into Income (EffectivePortion)
Year ended Year ended
December 26,
2014December 27,
2013 December 26,
2014December 27,
2013Foreign exchangecontracts $ 29.0 $ 8.6 Net sales $ 4.6 $ (6.0)Foreign exchangecontracts (0.7) 1.6
Cost of productssold — 4.6
Bunker fuel swap agreements (1) — 0.1
Cost of productssold — 1.0
Total $ 28.3 $ 10.3 $ 4.6 $ (0.4)
(1) The bunker fuel swap agreements had an ineffective portion of less than $0.1 million for the year ended December 27, 2013.
19. Fair Value Measurements Fair Value of Derivative Instruments We mitigate the risk of fluctuations in currency exchange rates on our results of operations and financial condition by entering into foreign currency cash flow hedges. We use an income approach to value our outstanding foreign currency and bunker fuel cash flow hedges, which consists of a discounted cash flow model that takes into account the present value of future cash flows under the terms of the contracts using current market information as of the measurement date such as foreign currency and bunker fuel spot and forward rates. Additionally, we built an element of default risk based on observable inputs into the fair value calculation. Due to the fact that inputs to fair value these derivative instruments can be observed, these derivatives are classified as Level 2.
The following table provides a summary of the fair values of our derivative financial instruments measured on a recurring basis under “Fair Value Measurements and Disclosures” (U.S. dollars in millions):
Fair Value MeasurementsForeign currency hedges
(liability) assets
December 26,
2014December 27,
2013Quoted Prices in Active Markets for Identical Assets (Level 1) $ — $ —
Significant Other Observable Inputs (Level 2) 25.6 (3.3)
Significant Unobservable Inputs (Level 3) — —
Refer to Note 14, “Retirement and Other Employee Benefits” for further fair value disclosures related to pension assets.

FRESH DEL MONTE PRODUCE INC. AND SUBSIDIARIES
NOTES TO CONSOLIDATED FINANCIAL STATEMENTS (continued)
102
19. Fair Value Measurements (continued)
In estimating our fair value disclosures for financial instruments, we use the following methods and assumptions: Cash and cash equivalents: The carrying amount of these items approximates fair value due to their liquid nature. Trade accounts receivable and other accounts receivable, net: The carrying value reported in the Consolidated Balance Sheets for these items is net of allowances for doubtful accounts, which includes a degree of counterparty non-performance risk. Accounts payable and other current liabilities: The carrying value reported in the Consolidated Balance Sheets for these items approximates their fair value, which is the likely amount for which the liability with short settlement periods would be transferred to a market participant with a similar credit standing as ours. Capital lease obligations: The carrying value of our capital lease obligations reported in the Consolidated Balance Sheets approximates their fair value based on current interest rates, which contain an element of default risk. The fair value of our capital lease obligations is estimated using Level 2 inputs based on quoted prices for those or similar instruments.Refer to Note 11, “Long-Term Debt and Capital Lease Obligations”. Long-term debt: The carrying value of our long-term debt reported in the Consolidated Balance Sheets approximates their fair value since they bear interest at variable rates or fixed rates which contain an element of default risk. The fair value of our long-term debt is estimated using Level 2 inputs based on quoted prices for those or similar instruments.Refer to Note 11, “Long-Term Debt and Capital Lease Obligations”. Fair Value of Non-Financial Assets
The following is a tabular presentation of the non-recurring fair value measurement along with the level within the fair value hierarchy in which the fair value measurement in its entirety falls (U.S. dollars in millions):
Fair Value Measurements for the year ended
December 26, 2014
Total
Quoted Pricesin
Active Marketsfor
Identical Assets(Level 1)
SignificantOther
ObservableInputs
(Level 2)
SignificantUnobservable
Inputs(Level 3)
United Kingdom contracttermination on leased facilities $ 3.1 $ — $ — $ 3.1
Germany Banana Ripening Assets 0.2 — — 0.2
$ 3.3 $ — $ — $ 3.3
During 2014, we recognized an additional charge of $1.7 million for a total contract termination obligation of $3.1 million related to lease payments that will continue to be incurred throughout the lease term or upon termination of the lease contract beyond our cease-use date for under-utilized distribution facilities in the United Kingdom in the banana segment. We estimated the fair value of this obligation using an income based approach, whereby our cash flow was adjusted for a market premium risk. The fair value of the contract termination obligation is classified as Level 3 of the fair value hierarchy due to the mix of unobservable inputs utilized.
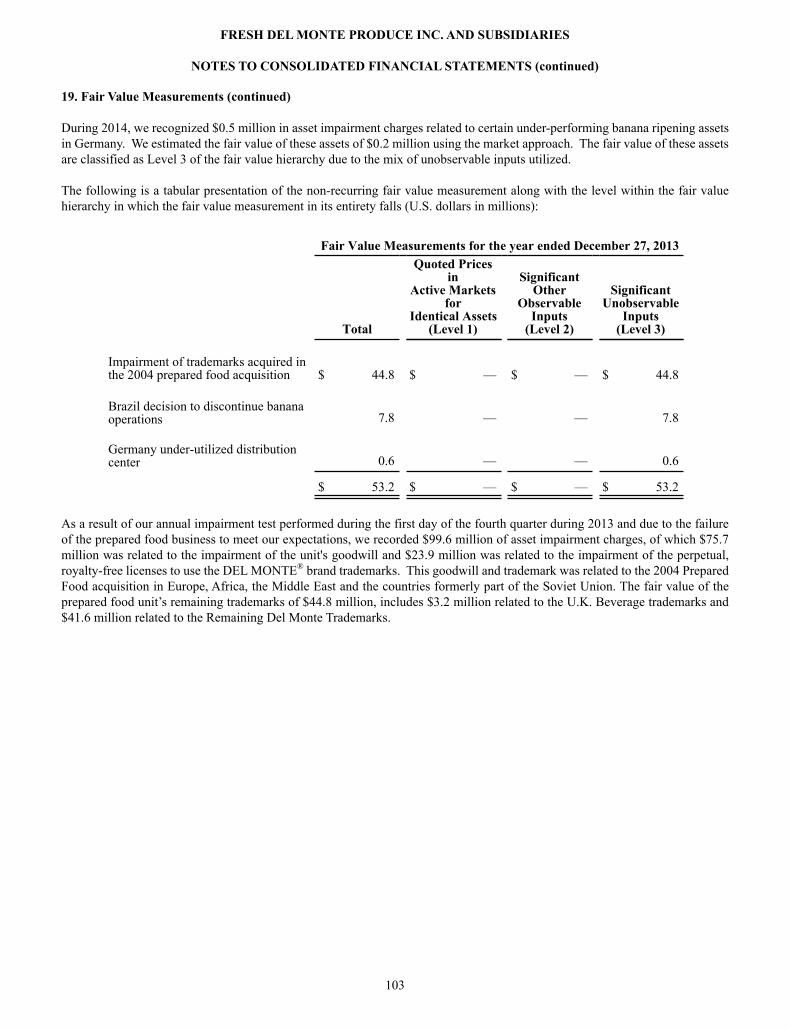
FRESH DEL MONTE PRODUCE INC. AND SUBSIDIARIES
NOTES TO CONSOLIDATED FINANCIAL STATEMENTS (continued)
103
19. Fair Value Measurements (continued)
During 2014, we recognized $0.5 million in asset impairment charges related to certain under-performing banana ripening assets in Germany. We estimated the fair value of these assets of $0.2 million using the market approach. The fair value of these assets are classified as Level 3 of the fair value hierarchy due to the mix of unobservable inputs utilized.
The following is a tabular presentation of the non-recurring fair value measurement along with the level within the fair value hierarchy in which the fair value measurement in its entirety falls (U.S. dollars in millions):
Fair Value Measurements for the year ended December 27, 2013
Total
Quoted Pricesin
Active Marketsfor
Identical Assets(Level 1)
SignificantOther
ObservableInputs
(Level 2)
SignificantUnobservable
Inputs(Level 3)
Impairment of trademarks acquired inthe 2004 prepared food acquisition $ 44.8 $ — $ — $ 44.8
Brazil decision to discontinue bananaoperations 7.8 — — 7.8
Germany under-utilized distributioncenter 0.6 — — 0.6
$ 53.2 $ — $ — $ 53.2
As a result of our annual impairment test performed during the first day of the fourth quarter during 2013 and due to the failure of the prepared food business to meet our expectations, we recorded $99.6 million of asset impairment charges, of which $75.7 million was related to the impairment of the unit's goodwill and $23.9 million was related to the impairment of the perpetual, royalty-free licenses to use the DEL MONTE® brand trademarks. This goodwill and trademark was related to the 2004 Prepared Food acquisition in Europe, Africa, the Middle East and the countries formerly part of the Soviet Union. The fair value of the prepared food unit’s remaining trademarks of $44.8 million, includes $3.2 million related to the U.K. Beverage trademarks and $41.6 million related to the Remaining Del Monte Trademarks.

FRESH DEL MONTE PRODUCE INC. AND SUBSIDIARIES
NOTES TO CONSOLIDATED FINANCIAL STATEMENTS (continued)
104
19. Fair Value Measurements (continued)
We utilized a discounted cash flow model, or the income approach, under the royalty savings method to determine the fair value of the U.K. Beverage and Remaining Del Monte trademarks. The royalty savings method assumes that if we did not own the intangible asset, we would be willing to pay a royalty for its use. We convert the anticipated economic benefits that we assume will be realized from a given asset into value. Under this approach,value is measured as the present worth of anticipated future net cash flows generated by an asset. We corroborate other inputs used in the royalty savings method with market participant assumptions such as the royalty rates and discount rates utilized, however due to the mix of unobservable inputs utilized, the fair value of the trademarks are classified as Level 3 of the fair value hierarchy.
During 2013, we recognized $11.4 million in asset impairment and other charges a result of our decision to discontinue exporting bananas from Brazil and close six farms. The asset impairment consisted of a write-down of $1.0 million related to land that will be utilized for the production of other products with a carrying value of $8.8 million. The land was written down to a value of $7.8 million. We estimated the fair value of these assets using the market approach. The fair valuation of the assets and contract termination obligation of $7.8 million are classified as Level 3 of the fair value hierarchy due to the mix of unobservable inputs utilized.
During 2013, we recognized $2.6 million in asset impairment charges and other charges, net related to an under-performing distribution center in Germany in the banana segment. Included in asset impairment and other charges, net, is a contract termination obligation of $0.6 million related to lease payments that will continue to be incurred throughout the lease term beyond our cease-use date. We estimated the fair value of this obligation using an income based approach, whereby our cash flows were adjusted for a market premium risk. The fair value of the contract termination obligation is classified as Level 3 of the fair value hierarchy due to the mix of unobservable inputs utilized.
Refer to Note 3, “Asset Impairment and Other Charges, Net” for further discussion related to asset impairment charges.

FRESH DEL MONTE PRODUCE INC. AND SUBSIDIARIES
NOTES TO CONSOLIDATED FINANCIAL STATEMENTS (continued)
105
20. Related Party Transactions We purchase goods and services from unconsolidated subsidiaries in the ordinary course of business. See Note 4, “Investments in Unconsolidated Companies. ” There were no receivables from related parties at December 26, 2014 and at December 27, 2013. There were cash receipts from noncontrolling interests of $5.0 million for 2014, $3.6 million for 2013 and $7.0 million for 2012. We have reflected the cash in contributions from noncontrolling interests under financing activities in the Consolidated Statements of Cash Flows. We have $24.7 million and $19.7 million in other noncurrent liabilities in our Consolidated Balance Sheets related to one of our noncontrolling interests as of December 26, 2014 and December 27, 2013, respectively. We incurred expenses of approximately $2.7 million for 2014, $2.4 million for 2013 and $2.3 million for 2012 for air transportation services for chartering an aircraft that is indirectly owned by our Chairman and Chief Executive Officer.

FRESH DEL MONTE PRODUCE INC. AND SUBSIDIARIES
NOTES TO CONSOLIDATED FINANCIAL STATEMENTS (continued)
106
21. Unaudited Quarterly Financial Information Our fiscal quarter-ends correspond to the last Friday of the 13-week period, beginning the day following our fiscal year end. The following summarizes certain quarterly operating data (U.S. dollars in millions, except per share data):
Quarter ended
March 28,2014
June 27,2014
September 26,2014
December 26, 2014(2)
Net sales $ 982.3 $ 1,131.3 $ 884.6 $ 929.3Gross profit 106.7 121.5 73.9 62.7Net income (loss) 58.9 65.4 20.7 (0.4)Net income (loss) attributable to Fresh Del Monte Produce Inc. 58.6 64.3 19.9 (0.4)Net income (loss) per ordinary share attributable to Fresh Del Monte Produce Inc. – basic (1) $ 1.04 $ 1.15 $ 0.36 $ (0.01)Net income (loss) per ordinary share attributable to Fresh Del Monte Produce Inc. – diluted (1) $ 1.04 $ 1.15 $ 0.35 $ (0.01)Dividends declared per ordinary share $ 0.125 $ 0.125 $ 0.125 $ 0.125
March 29,
2013June 28,
2013September 27,
2013December 27,
2013 (3), (4)
Net sales $ 918.8 $ 1,023.9 $ 861.1 $ 879.9Gross profit 98.6 105.9 53.0 32.9Net income (loss) 41.8 62.0 5.4 (143.1)Net income (loss) attributable to Fresh Del Monte Produce Inc. 41.1 62.0 6.4 (143.9)Net income (loss) per ordinary share attributable to Fresh Del Monte Produce Inc. – basic (1) $ 0.71 $ 1.10 $ 0.11 $ (2.56)Net income (loss) per ordinary share attributable to Fresh Del Monte Produce Inc. – diluted (1) $ 0.71 $ 1.10 $ 0.11 $ (2.56)Dividends declared per ordinary share $ 0.125 $ 0.125 $ 0.125 $ 0.125
(1) Basic and diluted earnings per share for each of the quarters presented above is based on the respective weighted average number of shares for the quarters. The sum of the quarters may not necessarily be equal to the full year basic and diluted earnings per share amounts due to rounding.
(2) Diluted earnings per share for the quarter ended December 26, 2014 excludes the impact of antidilutive share-based payment awards for 399,568 ordinary shares, as they were antidilutive.
(3) Diluted earnings per share for the quarter ended December 27, 2013 excludes the impact of share-based payment awards for 308,293 ordinary shares, as they were antidilutive.
(4) The quarter ended December 27, 2013, includes charges related to goodwill and trademark impairment of $75.7 million and $23.9 million, respectively, related to the 2004 Prepared Food acquisition, exit activities in our Brazil operations of $11.4 million, unfavorable litigation of $10.2 million and other charges of $3.4 million primarily relating to restructuring activities in Europe. See Note 3, "Asset Impairment and Other Charges, Net" and Note 7 , "Goodwill and Other Intangible Assets" for further discussion on these charges.

FRESH DEL MONTE PRODUCE INC. AND SUBSIDIARIES
NOTES TO CONSOLIDATED FINANCIAL STATEMENTS (continued)
107
22. Business Segment Data We are principally engaged in one major line of business, the production, distribution and marketing of bananas, other fresh produce and prepared food. Our products are sold in markets throughout the world, with our major producing operations located in North, Central and South America, Europe, Asia and Africa. Our operations are aggregated into business segments on the basis of our products: bananas, other fresh produce and prepared food. Other fresh produce includes pineapples, melons, non-tropical fruit (including grapes, apples, pears, peaches, plums, nectarines, avocados, citrus and kiwis), fresh-cut products, other fruit and vegetables, a third-party ocean freight business, a plastic product and box manufacturing business. Prepared food includes prepared fruit and vegetables, juices, beverages, snacks, poultry and meat products.
We evaluate performance based on several factors, of which net sales and gross profit by product are the primary financial measures (U.S. dollars in millions):
Year ended December 26, 2014 December 27, 2013 December 28, 2012
Net SalesGrossProfit Net Sales
GrossProfit Net Sales
GrossProfit
Banana $ 1,804.7 $ 109.1 $ 1,692.2 $ 62.1 $ 1,544.6 $ 89.7Other fresh produce 1,744.7 210.4 1,638.5 192.8 1,544.8 205.8Prepared food 378.1 45.3 353.0 35.5 331.8 46.2
Totals $ 3,927.5 $ 364.8 $ 3,683.7 $ 290.4 $ 3,421.2 $ 341.7
Year ended
Net sales by geographic region:December 26,
2014December 27,
2013December 28,
2012North America $ 2,113.4 $ 1,968.3 $ 1,821.1Europe 736.1 713.4 704.3Middle East 554.3 524.3 387.4Asia 434.5 425.6 422.2Other 89.2 52.1 86.2
Total net sales $ 3,927.5 $ 3,683.7 $ 3,421.2

FRESH DEL MONTE PRODUCE INC. AND SUBSIDIARIES
NOTES TO CONSOLIDATED FINANCIAL STATEMENTS (continued)
108
22. Business Segment Data (continued)
Property, plant and equipment, net:December 26,
2014December 27,
2013North America $ 154.8 $ 123.3Europe 48.3 54.8Middle East 156.8 163.0Africa 42.1 40.7Asia 72.6 38.4Central America 583.1 566.3South America 71.6 70.8Maritime equipment (including containers) 26.9 31.4Corporate 14.0 12.5
Total property, plant and equipment, net $ 1,170.2 $ 1,101.2
Identifiable assets:December 26,
2014December 27,
2013North America $ 469.3 $ 403.7Europe 346.2 333.7Middle East 325.7 368.1Africa 142.7 142.7Asia 188.1 166.8Central America 923.9 908.9South America 154.1 136.6Maritime equipment (including containers) 47.1 46.4Corporate 78.2 82.3
Total identifiable assets $ 2,675.3 $ 2,589.2
North America accounted for approximately 54%, 54% and 53% of our net sales for the years ended 2014, 2013 and 2012, respectively. Our earnings are heavily dependent on operations located worldwide; however, our net sales are not dependent on any particular country other than the United States, with no other country accounting for greater than 10% of our net sales for 2014, 2013 and 2012. These operations are a significant factor in the economies of some of the countries in which we operate and are subject to the risks that are inherent in operating in such countries, including government regulations, currency and ownership restrictions and risk of expropriation. Management reviews assets on the basis of geographic region and not by reportable segment, which more closely aligns our capital investment with demand for our products. Costa Rica is our most significant sourcing location, representing approximately 40% of our property, plant and equipment as of December 26, 2014. No foreign country other than Costa Rica accounts for greater than 10% of our property, plant and equipment.
One customer accounted for approximately 11% of net sales in 2014, and 12% of net sales in 2013 and 2012. These sales are reported in the banana and other fresh produce segments. No other customer accounted for 10% or more of our net sales. In 2014 and 2013; our top 10 customers accounted for approximately 29% of net sales as compared with 28% during 2012. Identifiable assets by geographic area represent those assets used in the operations of each geographic area. Corporate assets consist of goodwill, building, leasehold improvements and furniture and fixtures.

FRESH DEL MONTE PRODUCE INC. AND SUBSIDIARIES
NOTES TO CONSOLIDATED FINANCIAL STATEMENTS (continued)
109
23. Shareholders’ Equity Our shareholders have authorized 50,000,000 preferred shares at $0.01 par value, of which none are issued or outstanding. Our shareholders have authorized 200,000,000 ordinary shares of common stock at $0.01 par value, of which 53,899,923 are issued and outstanding at December 26, 2014. The ordinary share activity for the years ended December 26, 2014 and December 27, 2013 is summarized as follows:
Year EndedDecember 26,
2014December 27,
2013Ordinary shares issued/(retired) as a result of:Stock option exercises 1,945,939 1,975,339Restricted stock awards 26,117 26,201Restricted and performance stock units 287,202 —Ordinary share repurchase and retirement (4,577,772) (3,490,488)
May 5, 2010, our Board of Directors approved an additional three-year stock repurchase program of up to $150 million of our ordinary shares, which expired on May 5, 2013. On May 1, 2013, our Board of Directors approved a three-year stock repurchase program of up to $300.0 million of our ordinary shares. We have repurchased $412.1 million of our ordinary shares, or 15,843,157 ordinary shares, under the aforementioned repurchase programs and retired all the repurchased shares. We purchased 2,363,996 ordinary shares at a purchase price of $34.50 in a modified Dutch auction tender offer completed on December 8, 2014. The modified Dutch auction tender offer was conducted as part of the stock repurchase program. We have a maximum dollar amount value of $112.1 million of shares that may yet be purchased under the May 1, 2013 stock repurchase program.
The following represents a summary of repurchase activity during the years ended December 26, 2014 and December 27, 2013 (U.S. dollars in millions, except share and per share data):
Year EndedDecember 26, 2014 December 27, 2013
Shares USDAverage price
per share Shares USDAverage price
per shareQuarter ended: 3,048,596 $ 103.6 $ 33.99 27,982 $ 0.7 $ 26.43
Year ended: 4,577,772 145.9 31.90 3,490,488 94.0 26.9 Subsequent to the year ended December 26, 2014, we repurchased 1,997,504 ordinary shares for $67.6 million with an average price per share of $33.83.
The following is a summary of the dividends declared per share for the years ended December 26, 2014 and December 27, 2013:
Year EndedDecember 26, 2014 December 27, 2013
Dividend DeclaredDate
Cash DividendDeclared, per
Ordinary ShareDividend
Declared Date
Cash DividendDeclared, per
Ordinary ShareDecember 5, 2014 $ 0.125 December 6, 2013 $ 0.125September 5, 2014 $ 0.125 September 6, 2013 $ 0.125May 30, 2014 $ 0.125 May 31, 2013 $ 0.125March 28, 2014 $ 0.125 March 29, 2013 $ 0.125

FRESH DEL MONTE PRODUCE INC. AND SUBSIDIARIES
NOTES TO CONSOLIDATED FINANCIAL STATEMENTS (continued)
110
23. Shareholders’ Equity (continued)
We paid $27.9 million and $28.2 million in dividends during the years ended December 26, 2014 and December 27, 2013, respectively.

111
Schedule II - Valuation and Qualifying AccountsFresh Del Monte Produce Inc. and Subsidiaries
(U.S. dollars in millions)Col. A Col. B Col. C Col. D Col. E
Additions
Description
Balance atBeginningof Period
Charged toCosts andExpenses
Charged toOther
Accounts Deductions
Balance atEnd ofPeriod
Year ended December 26, 2014
Deducted from asset accounts:Valuation accounts:Trade accounts receivable $ 8.3 $ 9.1 $ — $ (6.7) $ 10.7Advances to growers and other receivables 6.1 1.9 — (3.5) 4.5Deferred tax asset valuation allowance 180.4 18.5 1.8 (21.2) 179.5
Accrued liabilities:Provision for Kunia Well Site 16.4 0.4 (1.4) (0.8) 14.6
Total $ 211.2 $ 29.9 $ 0.4 $ (32.2) $ 209.3
Year ended December 27, 2013:
Deducted from asset accounts:Valuation accounts:Trade accounts receivable $ 6.8 $ 10.6 $ — $ (9.1) $ 8.3Advances to growers and other receivables 7.6 2.4 — (3.9) 6.1Deferred tax asset valuation allowance 180.6 10.7 0.1 (11.0) 180.4
Accrued liabilities: Provision for Kunia Well Site 16.8 0.4 — (0.8) 16.4
Total $ 211.8 $ 24.1 $ 0.1 $ (24.8) $ 211.2
Year ended December 28, 2012:
Deducted from asset accounts: Valuation accounts: Trade accounts receivable $ 7.4 $ 0.1 $ — $ (0.7) $ 6.8Advances to growers and other receivables 9.8 3.3 — (5.5) 7.6Deferred tax asset valuation allowance 174.3 26.4 2.2 (22.3) 180.6
Accrued liabilities: Provision for Kunia Well Site 17.7 0.4 — (1.3) 16.8
Total $ 209.2 $ 30.2 $ 2.2 $ (29.8) $ 211.8

112
Item 9. Changes in and Disagreements with Accountants on Accounting and Financial Disclosure
None.
Item 9A. Controls and Procedures
We carried out an evaluation, under the supervision and with the participation of management, including the Chief Executive Officer and Chief Financial Officer, of the effectiveness of the design and operation of our disclosure controls and procedures as of December 26, 2014. Based upon this evaluation, our Chief Executive Officer and Chief Financial Officer concluded that our disclosure controls and procedures were effective as of such date to ensure that information required to be disclosed in the reports the Company files or submits under the Securities Exchange Act of 1934 is recorded, processed, summarized and reported within the time periods specified in the Securities and Exchange Commission rules and forms. Such officers also confirm that there was no change in our internal control over financial reporting during the year ended December 26, 2014 that has materially affected, or is reasonably likely to materially affect, our internal control over financial reporting.
See Management’s Annual Report on Internal Control Over Financial Reporting included in Item 8. Financial Statements and Supplementary Data. Item 9B. Other Information
None.

113
PART III Item 10. Directors, Executive Officers and Corporate Governance
Information required by Item 10 of Part III of this Annual Report on Form 10-K will be included in our definitive Proxy Statement relating to our 2015 Annual General Meeting of Shareholders with respect to directors, executive officers, audit committee financial experts of the Company and Section 16(a) beneficial ownership reporting compliance, is incorporated herein by reference in response to this item.
Code of Ethics
We have adopted a Code of Conduct and Business Ethics Policy (“Code of Conduct”) that applies to our principal executive officer, principal financial officer and principal accounting officer as well as all our directors, other officers and employees. Our Code of Conduct can be found on our Web site at www.freshdelmonte.com. We have not waived the requirements of the Code of Conduct for any directors or executive officers and there were no amendments in 2014. We intend to disclose any amendment or waiver of the Code of Conduct promptly on our Web site. Item 11. Executive Compensation
Information required by Item 11 of Part III of this Annual Report on Form 10-K will be included in our definitive Proxy Statement relating to our 2015 Annual General Meeting of Shareholders with respect to executive compensation, is incorporated herein by reference in response to this item.
Item 12. Security Ownership of Certain Beneficial Owners and Management and Related Stockholder Matters
Information required by Item 12 of Part III of this Annual Report on Form 10-K will be included in our definitive Proxy Statement relating to our 2015 Annual General Meeting of Shareholders with respect to security ownership of certain beneficial owners and management and securities authorized for issuance under equity compensation plans, is incorporated herein by reference in response to this item. Item 13. Certain Relationships and Related Transactions
Information required by Item 13 of Part III of this Annual Report on Form 10-K will be included in our definitive Proxy Statement relating to our 2015 Annual General Meeting of Shareholders with respect to certain relationships and related transactions and director independence, is incorporated herein by reference in response to this item. Item 14. Principal Accountant Fees and Services
Information required by Item 14 of Part III of this Annual Report on Form 10-K will be included in our definitive Proxy Statement relating to our 2015 Annual General Meeting of Shareholders with respect to principal accountant fees and services, is incorporated by reference in response to this item.

114
PART IV Item 15. Exhibits and Financial Statement Schedules
Consolidated Statements and Other Financial Information
The following financial statements and supplemental schedule of Fresh Del Monte Produce Inc. and its subsidiaries are included in Item 8. Financial Statements and Supplementary Data of this Report:
Consolidated Financial Statements
Report of Independent Registered Public Accounting Firm on Consolidated Financial Statements
Consolidated Balance Sheets at December 26, 2014 and December 27, 2013
Consolidated Statements of Income for the years ended December 26, 2014, December 27, 2013 and December 28, 2012
Consolidated Statements of Comprehensive Income for the years ended December 26, 2014, December 27, 2013 andDecember 28, 2012
Consolidated Statements of Cash Flows for the years ended December 26, 2014, December 27, 2013, December 28, 2012
Consolidated Statements of Shareholders’ Equity for the years ended December 26, 2014, December 27, 2013, December28, 2012
Notes to Consolidated Financial Statements
Supplemental Financial Statement Schedule
Schedule II - Valuation and Qualifying Accounts Exhibits
The exhibits listed below are incorporated in this Report by reference, except for those indicated by “*” which are filed herewith (see accompanying Exhibit Index)
Exhibit No. Description3.1 Amended and Restated Memorandum of Association of Fresh Del Monte Produce Inc. (incorporated by
reference to Exhibit 3.6 to our Registration Statement on Form F-1 (File No. 333-7708)). 3.2 Amended and Restated Articles of Association of Fresh Del Monte Produce Inc. (incorporated by
reference to Exhibit 3.7 to our Registration Statement on Form F-1 (File No. 333-7708)). 4.1 Specimen Certificate of Ordinary Shares of Fresh Del Monte Produce Inc. (incorporated by reference to
Exhibit 4.1 to our Registration Statement on Form F-1 (File No. 333-7708)).
10.1License Agreement, dated as of December 5, 1989, between Del Monte Corporation and Wafer Limited(the “DMC-Wafer License”) (incorporated by reference to Exhibit 10.3 to our Registration Statement onForm F-1 (File No. 333-7708)).

115
Exhibit No. Description
10.2License Agreement, dated as of December 5, 1989, between Del Monte Corporation and Del MonteTropical Fruit Company, North America (the “NAJ License”) (incorporated by reference to Exhibit 10.4to our Registration Statement on Form F-1 (File No. 333-7708)).
10.3License Agreement, dated as of December 5, 1989, between Del Monte Corporation and Del Monte FreshFruit International, Inc. (incorporated by reference to Exhibit 10.5 to our Registration Statement on FormF-1 (File No. 333-7708)).
10.4Amendment No. 1 to DMC-Wafer License, dated as of October 12, 1992, between Del MonteCorporation and Wafer Limited (incorporated by reference to Exhibit 10.6 to our Registration Statementon Form F-1 (File No. 333-7708)).
10.5Amendment No. 1 to NAJ License, dated as of October 12, 1992, between Del Monte Corporation andDel Monte Fresh Produce N.A., Inc. (incorporated by reference to Exhibit 10.7 to our RegistrationStatement on Form F-1 (File No. 333-7708)).
10.6Amendment No. 1 to Direct DMC-DMFFI License, dated as of October 12, 1992, between Del MonteCorporation and Del Monte Fresh Produce International, Inc. (incorporated by reference to Exhibit 10.8to our Registration Statement on Form F-1 (File No. 333-7708)).
10.7Registration Rights Agreement, dated as of October 15, 1997, by and between Fresh Del Monte and FGHoldings Limited (incorporated by reference to Exhibit 10.9 to our Registration Statement on Form F-1(File No. 333-7708)).
10.8Strategic Alliance Agreement, dated as of August 29, 1997, by and between the Registrant and IAT GroupInc. (incorporated by reference to Exhibit 10.10 to our Registration Statement on Form F-1 (File No.333-7708)).
10.9** Fresh Del Monte Produce Inc. 1997 Share Incentive Plan (incorporated by reference to Exhibit 4.1 to theCompany’s Registration Statement on Form S-8 (File No. 333-7870)).
10.10**Amended and Restated Fresh Del Monte Produce Inc. 1999 Share Incentive Plan, effective as of April 30,2008 (reflects Amendment No. 1, dated May 1, 2002, Amendments No. 2 through 5 dated April 27, 2005and Amendment No. 6 dated April 30, 2008) (incorporated by reference to Exhibit 10.1 to our SecondQuarter 2008 Report on Form 10-Q).
10.11** Fresh Del Monte Produce Inc. Long-Term Incentive Plan (incorporated by reference to Exhibit 10.1 toour First Quarter 2008 Report on Form 10-Q).
10.12** 2003 Performance Incentive Plan for Chairman & CEO (incorporated by reference to Exhibit 10.2 to ourFirst Quarter 2008 Report on Form 10-Q).
10.13** 2004 Performance Incentive Plan for Senior Executives (incorporated by reference to Exhibit 10.3 to ourFirst Quarter 2008 Report on Form 10-Q).
10.14* 2011 Performance Incentive Plan for the Chief Executive Officer ((incorporated by reference to Exhibit10.1 to our First Quarter 2011 Report on Form 10-Q)
10.15** Executive Retention and Severance Agreement (Chairman & CEO) (incorporated by reference to Exhibit10.4 to our First Quarter 2008 Report on Form 10-Q).
10.16** Executive Retention and Severance Agreement (President & COO) (incorporated by reference to Exhibit10.5 to our First Quarter 2008 Report on Form 10-Q).

116
Exhibit No. Description
10.17** Employment Agreement for President & COO (incorporated by reference to Exhibit 10.6 to our FirstQuarter 2008 Report on Form 10-Q).
10.18** Fresh Del Monte Produce Inc. 2010 Non-Employee Directors Equity Plan, effective as of May 5, 2010(incorporated by reference to Exhibit 10.1 to our Second Quarter 2010 Report on Form 10-Q).
10.19**Amended and Restated Fresh Del Monte Produce Inc. Performance Incentive Plan for Senior Executives,effective May 5, 2010 (incorporated by reference to Exhibit 10.2 to our Second Quarter 2010 Report onForm 10-Q).
10.20** Fresh Del Monte Produce Inc. Long-Term Incentive Plan, effective January 1, 2008 (as Amended May 5,2010) (incorporated by reference to Exhibit 10.3 to our Second Quarter 2010 Report on Form 10-Q).
10.21**2011 Omnibus Share Incentive Plan (incorporated by reference to Exhibit A in the Company's DefinitiveProxy Statement on Schedule 14A filed with the Securities and Exchange Commission on March 24,2011)
10.222014 Omnibus Share Incentive Plan (incorporated by reference to Exhibit A in the Company's DefinitiveProxy Statement on Schedule 14A files with the the Securities and Exchange Commission on March 31,2014)
10.23Standard Fruit and Vegetable Co., Inc. Stock Purchase Agreement, dated as of January 27, 2003, betweenDel Monte Fresh Produce N.A., Inc and Standard Fruit and Vegetable Co., Inc. et al. (incorporated byreference to Exhibit 4.13 to our 2002 Annual Report on Form 20-F).
10.24Stock purchase agreement, dated as of June 6, 2008, among Northsound Corporation, Red CrownDevelopment Inc. and JAS Investments Corp., as Sellers and Del Monte (Pinabana) Corp. as Purchaser(incorporated herein by reference to Exhibit 10.1 to the Company’s Current Report on Form 8-K filed onJune 9, 2008).
10.25Credit Agreement, dated as of October 23, 2012, (incorporated by reference to Exhibit 10.1 of ourCurrent Report on Form 8-K filed on October 29, 2012) by and among Fresh Del Monte Produce Inc.,and certain subsidiaries named therein and the lenders and agents named therein.
21.1* List of Subsidiaries. 23.1* Consent of Independent Registered Public Accounting Firm. 31.1* Certification of Chief Executive Officer filed pursuant to 17 CFR 240.13a-14(a). 31.2* Certification of Chief Financial Officer filed pursuant to 17 CFR 240.13a-14(a).
32* Certifications of Chief Executive Officer and Chief Financial Officer furnished pursuant to 17 CFR240.13a-14(b) and 18 U.S.C. Section 1350.
101.INS*,*** XBRL Instance Document.
101.SCH*,*** XBRL Taxonomy Extension Schema Document.
117
Exhibit No. Description
101.CAL*,*** XBRL Taxonomy Extension Calculation Linkbase Document.
101.DEF*,*** XBRL Taxonomy Extension Definition Linkbase Document.
101.LAB*,*** XBRL Taxonomy Extension Label Linkbase Document.
101.PRE*,*** XBRL Taxonomy Extension Presentation Linkbase Document.
* Filed herewith ** Management contract or compensatory plan or arrangement. *** Attached as Exhibit 101 to this report are the following formatted in XBRL (Extensible Business Reporting
Language): (i) Consolidated Balance Sheets as of December 26, 2014 and December 27, 2013, (ii) ConsolidatedStatements of Income for the years ended December 26, 2014, December 27, 2013 and December 28, 2012, (iii)Consolidated Statements of Comprehensive Income for the years ended December 26, 2014, December 27, 2013,and December 28, 2012, (iv) Consolidated Statements of Cash Flows for the years ended December 26, 2014,December 27, 2013 and December 28, 2012 and (v) Notes to Consolidated Financial Statements.

118
Exhibit Index
Exhibit No. Description21.1* List of Subsidiaries. 23.1* Consent of Independent Registered Public Accounting Firm. 31.1* Certification of Chief Executive Officer filed pursuant to 17 CFR 240.13a-14(a). 31.2* Certification of Chief Financial Officer filed pursuant to 17 CFR 240.13a-14(a). 32* Certifications of Chief Executive Officer and Chief Financial Officer furnished pursuant to 17 CFR
240.13a-14(b) and 18 U.S.C. Section 1350. 101.INS XBRL Instance Document. 101.SCH XBRL Taxonomy Extension Schema Document. 101.CAL XBRL Taxonomy Extension Calculation Linkbase Document. 101.DEF XBRL Taxonomy Extension Definition Linkbase Document. 101.LAB XBRL Taxonomy Extension Label Linkbase Document. 101.PRE XBRL Taxonomy Extension Presentation Linkbase Document.

119
SIGNATURES Pursuant to the requirements of Section 13 or 15(d) of the Securities Exchange Act of 1934, the registrant has duly caused this report to be signed on its behalf by the undersigned, thereunto duly authorized.
FRESH DEL MONTE PRODUCE INC.
Date: February 18, 2015 By: /s/ Hani El-Naffy Hani El-Naffy
President & Chief Operating Officer
Date: February 18, 2015 By: /s/ Richard Contreras Richard Contreras
Senior Vice President & Chief Financial Officer

120
Pursuant to the requirements of the Securities Exchange Act of 1934, this report has been signed below by the following persons on behalf of the registrant and in the capacities indicated below on the 18th day of February, 2015:
/s/ Mohammad Abu-GhazalehBy Mohammad Abu-Ghazaleh Chairman & Chief Executive Officer
(Principal Executive Officer) /s/ Hani El-NaffyBy Hani El-Naffy President & Chief Operating Officer /s/ Richard ContrerasBy Richard Contreras Senior Vice President & Chief Financial
Officer (Principal Financial & AccountingOfficer)
/s/ Salvatore H. AlfieroBy Salvatore H. Alfiero Director /s/ Michael J. BerthelotBy Michael J. Berthelot Director /s/ Edward L. BoykinBy Edward L. Boykin Director /s/ Madeleine ChampionBy Madeleine Champion Director /s/ John H. DaltonBy John H. Dalton Director /s/ Robert S. BucklinBy Robert S. Bucklin Director /s/ Amir Abu-GhazalehBy Amir Abu-Ghazaleh Director

COMPANY INFORMATION Fresh Del Monte Produce Inc.U.S. Executive Offices, c/o Del Monte Fresh Produce Company241 Sevilla AvenueCoral Gables, Florida 33134Web site: www.freshdelmonte.comWeb site: www.fruits.com
STOCK INFORMATION Fresh Del Monte Produce Inc.'s Ordinary Shares are listed on the New York Stock Exchange under the symbol FDP.
ANNUAL GENERAL MEETING OF SHAREHOLDERSApril 29, 2015, at 11:30 a.m., Eastern TimeBiltmore Hotel 1200 Anastasia Avenue Coral Gables, Florida 33134
SHARES OUTSTANDINGAs of March 10, 2015 there were 52,127,281 Ordinary Shares outstanding.
FORWARD-LOOKING INFORMATIONOur Annual Report contains statements about our expectations, plans and prospects, which constitute forward-looking statements for purposes of the safe harbor provisions of the Private Securities Litigation Reform Act. These statements are based on current Company expectations and are subject to risks and uncertainties that could cause actual results to differ materially. The Company undertakes no obligation to update any such statements. Such risks and uncertainties include those identified in the Company's Annual Report on Form 10-K for the year ended December 26, 2014 and other reports the Company files with the Securities and Exchange Commission (“SEC”).
CORPORATE AND SHAREHOLDER INFORMATIONCorporate and shareholder information and a copy of the Company's Annual Report on Form 10-K (which includes the officer certifications required by Sections 302 and 906 of the Sarbanes-Oxley Act of 2002), as filed with the SEC, may be obtained free of charge by contacting Investor Relations at Fresh Del Monte Produce Inc., U.S. Executive Offices, c/o Del Monte Fresh Produce Company, 241 Sevilla Avenue, Coral Gables, Florida 33134, 305-520-8400 or by visiting the Company's Web site at www.freshdelmonte.com.
TRANSFER AGENT AND REGISTRARComputershare Investor ServicesP.O. Box 30170College Station, Texas 77842 Customer Service Toll Free: 866-245-9962TDD for Hearing Impaired: 800-231-5469Foreign Shareholders: 201-680-6578TDD Foreign Shareholders: 201-680-6610Web site: www.computershare.com/investor
INDEPENDENT REGISTERED CERTIFIED PUBLIC ACCOUNTING FIRMErnst & Young LLP201 South Biscayne BoulevardSuite 3000Miami, Florida 33131
EXECUTIVE OFFICERSMohammad Abu-GhazalehChairman and Chief Executive Officer
Hani El-NaffyPresident, Director and Chief Operating Officer
Richard ContrerasSenior Vice President and Chief Financial Officer
Bruce A. JordanSenior Vice President, General Counsel and Secretary
Jean-Pierre BartoliSenior Vice President, Europe and Africa
Emanuel LazopoulosSenior Vice President, North America Sales, Marketing and Product Management
EXECUTIVE OFFICERS (Continued)Paul RiceSenior Vice President, North America Operations
José Antonio YockSenior Vice President, Colombia, Ecuador, Central America and Brazil, (CECAB)
Marissa R. TenazasSenior Vice President, Human Resources
Sergio MancillaVice President, South America
Joseph ColeVice President, Asia Pacific
Youssef ZakhariaVice President, Middle East and North Africa, (MENA)
DIRECTORSMohammad Abu-GhazalehChairman and Chief Executive OfficerFresh Del Monte Produce Inc.
Hani El-NaffyPresident and Chief Operating OfficerFresh Del Monte Produce Inc.
Amir Abu-GhazalehGeneral Manager and PartnerAbu-Ghazaleh & Sons Co. Ltd.
Salvatore H. Alfiero (2)(3)(4)
Founder, Chairman and Chief Executive OfficerP I Ventures, LLCAlso serves on the Board of Directors of Southwire Company
Michael J. Berthelot, C.P.A. (1)(2)(5)
Chief Executive Officer Mission Manager Inc., its parent Vigilys Inc. and Cito Capital CorporationAlso serves as the Managing Principal and Founder of Corporate Governance Advisors Inc.
Edward L. Boykin, C.P.A., (Retired) (1)(3)(6)(7)
Consultant and Former PartnerDeloitte & Touche LLP
Robert S. Bucklin (1)(3)
Business AdvisorRetired Vice Chairman of Rabobank International's North America Wholesale Banking Also serves on the Board of Directors of OSI Group, LLC, Agrivida, Inc. and Bay State Milling Company
Madeleine L. Champion (2)(3)
Chief Executive OfficerChampion Global Advisors, LLCAlso serves on the Board of Directors of Citizens Republic Bancorp
John H. Dalton (1)(2)
President Housing Policy Council of the Financial Services RoundtableAlso serves on the Board of Directors of WashingtonFirst Bancshares, Inc. and BGC Partners, Inc.
(1) Member of the Audit Committee(2) Member of the Compensation Committee(3) Member of the Governance Committee(4) Governance Committee Chairman(5) Compensation Committee Chairman(6) Audit Committee Chairman(7) Lead Independent Director