Freeze Foaming: A Novel Process for the Synthesis of Foam ...
96
FREEZE FOAMING: A NOVEL PROCESS FOR THE SYNTHESIS OF FOAM CERAMICS by Nathaniel Peyton Johnson A thesis submitted in partial fulfillment of the requirements for the degree of Master of Science in Mechanical Engineering MONTANA STATE UNIVERSITY Bozeman, Montana April 2018
Transcript of Freeze Foaming: A Novel Process for the Synthesis of Foam ...

FREEZE FOAMING: A NOVEL PROCESS FOR THE SYNTHESIS OF
FOAM CERAMICS
by
Nathaniel Peyton Johnson
A thesis submitted in partial fulfillment
of the requirements for the degree
of
Master of Science
in
Mechanical Engineering
MONTANA STATE UNIVERSITY
Bozeman, Montana
April 2018

©COPYRIGHT
by
Nathaniel Peyton Johnson
2018
All Rights Reserved

ii
ACKNOWLEDGEMENTS
Without the help of my professors and lab mates this thesis would never have
happened. Dr. Sofie has been a tremendous help and this thesis would never have been
completed without the help and guidance that you have given me. I would like to thank
you for giving me an opportunity to work in lab and everything that you have done for
me. I would like to thank my committee members Dr. Gannon and Dr. Ryan for
reviewing my thesis and giving back helpful feedback. Also, I would like to thank
everyone in the lab that has helped me out and answered all of the questions that I have
including Dr. David Driscoll, Dr. Clay Hunt, Julie Muretta, Marley Zachariasen, Stephen
Heywood, and John Kent. My family and friends deserve a special thanks for helping me
throughout my academic career especially my mother Bonnie Barnhart, my girlfriend
Jackie Bastine, my sister Megan Miranda, and my uncle Bruce Barnhart. Lastly, I would
like to thank anyone who has helped me along the path to success.

iii
TABLE OF CONTENTS
1. INTRODUCTION ...........................................................................................................1
2. BACKGROUND .............................................................................................................3
Ceramics ..........................................................................................................................3
Ceramic Bonds .............................................................................................................6
Mechanical and Thermal Properties of Ceramics ......................................................10
Physics of Bubbles .........................................................................................................12
Sintering .........................................................................................................................14
Ceramic Foams ..............................................................................................................18
Manufacturing Techniques ........................................................................................19
Direct Foaming ......................................................................................................21
Replica Templating ................................................................................................24
Sacrificial Templating ............................................................................................26
Novel Techniques ..................................................................................................27
Constitutive Properties of Foams ...............................................................................28
3. RESEARCH OBJECTIVE ............................................................................................32
4. EXPERIMENTAL PROCEDURE ................................................................................34
Materials ........................................................................................................................34
Freeze Foaming ..............................................................................................................35
Slurry Preparation ......................................................................................................35
Ball Milling ................................................................................................................36
Bubble Formation and Simultaneous Freezing ..........................................................36
Sintering .....................................................................................................................38
Parameter Identification .................................................................................................39
Solids Loading ...........................................................................................................39
Binder Concentration .................................................................................................40
Foam Volume Expansion Ratio .................................................................................41
Pressure ......................................................................................................................42
Density Measurement ................................................................................................43
Microstructure ................................................................................................................43
Compression Testing .....................................................................................................44
5. RESULTS & DISCUSSION..........................................................................................47
Casting Parameters.........................................................................................................47
Physical and Structural Properties .................................................................................54
Mechanical Properties ....................................................................................................62

iv
TABLE OF CONTENTS CONTINUED
Sintering Characteristics ................................................................................................73
Demonstration of Freeze Foaming with Other Materials ..............................................75
Yttria Stabilized Zirconia ...........................................................................................75
Metals .........................................................................................................................77
6. CONCLUSIONS............................................................................................................80
Future Work ...................................................................................................................81
REFERENCES CITED ......................................................................................................82

v
LIST OF TABLES
Table Page
1. Material Properties .............................................................................................11
2. Aluminum Oxide Properties ..............................................................................12
3. Solid Loading Study Samples ............................................................................40
4. Binder Concentration Study Samples ................................................................41
5. Foam Volume Expansion Ratio Study Samples ................................................42
6. Comparison of Foaming Techniques .................................................................61

vi
LIST OF FIGURES
Figure Page
1. Tiny “Snowman” .................................................................................................2
2. Uses of Ceramics .................................................................................................4
3. Types of Ceramics ...............................................................................................5
4. Covalent Bond .....................................................................................................7
5. Ionic Bond ............................................................................................................8
6. Directionality of Ionic Bonds.............................................................................10
7. Densification of alumina ....................................................................................15
8. Sintering Mechanisms ........................................................................................16
9. Structure of Ceramic Foam ................................................................................16
10. Pyrolysis Treatment ...........................................................................................17
11. Types of Foam Cells ..........................................................................................19
12. Foam Extruder ...................................................................................................20
13. Direct Foaming ..................................................................................................21
14. Surfactant Stabilization .....................................................................................23
15. Particle Stabilization ..........................................................................................24
16. Replica Templating ...........................................................................................25
17. Sacrificial Templating .......................................................................................27
18. Repeatable Cellular Structure ............................................................................29
19. Brittle Crushing .................................................................................................31
20. Research Objective Tree ...................................................................................33

vii
LIST OF FIGURES CONTINUED
Figure Page
21. Ball Milling .......................................................................................................36
22. Vacuum Freeze Dryer System ...........................................................................37
23. Thermal Treatment ............................................................................................39
24. Light Microscope System ..................................................................................44
25. Compression Testing System ............................................................................45
26. Compression Testing Sample Holder ................................................................46
27. Solids Loading Study Results............................................................................48
28. Binder Concentration Study Results (5% and 20% SL) ....................................49
29. Binder Concentration Study Results (30% SL) .................................................50
30. Foam Volume Expansion Ratio Study Results .................................................51
31. Bubble Formation and Freezing ........................................................................52
32. Cross Section of Ceramic Samples ...................................................................54
33. Porosity vs. Binder Concentration .....................................................................56
34. Pore Size vs. Binder Concentration ...................................................................57
35. Porosity vs. Solids Loading ...............................................................................58
36. Pore Size vs. Solids Loading .............................................................................59
37. Porosity vs. Foam Volume Expansion Ratio .....................................................59
38. Pore Size vs. Foam Volume Expansion Ratio ...................................................60
39. Difference in Porosity Measurements ...............................................................61
40. Compression Testing Results ............................................................................62
viii
LIST OF FIGURES CONTINUED
Figure Page
41. Progressive Failure in Ceramic Foam ...............................................................63
42. Different Sections of Compression Testing ......................................................64
43. Acoustic Emissions during Compression Testing .............................................65
44. Modulus vs Relative Density ............................................................................66
45. Modulus vs Relative Density with Estimated Curve .........................................67
46. Modulus vs Relative Density with Adjusted Curve ..........................................68
47. Compressive Strength vs Relative Density with Adjusted Curve .....................65
48. Comparison of Foam Structure .........................................................................70
49. Relative Young’s Modulus vs Relative Density ...............................................71
50. Relative Compressive Strength vs Relative Density .........................................73
51. Microstructure of Various Foams ......................................................................75
52. YSZ Foam .........................................................................................................76
53. Aluminum Foam ................................................................................................78
54. Copper Foam .....................................................................................................79

ix
NOMENCLATURE
To keep track of different types of foams a short hand was developed. The naming
scheme follows the structure, XX/XX – XX. The first number is the solids loading of the
foam by volume. The second number is the binder concentration, which is the ratio of the
weight of binder and powder. The third number is the foam volume expansion ratio,
which is the ratio of the original slurry volume to the volume of the expanded foam. For
example a foam sample by the name of 30/0.7 – 10 has a solids loading of 30%, a binder
concentration of 0.7, and a foam volume expansion ratio of 10.

x
ABSTRACT
Foam is a class of materials that was developed only after World War II and
ceramic foams are still in development. Many of the processes for synthesizing ceramic
foam require the burning out of a polymer scaffold or the use of chemical reactions to
generate pores. This thesis investigates the development of a novel synthesis approach
called freeze foaming. In the freeze foaming process, pores are made by putting an
aqueous solution under vacuum. The reduced pressure causes the air within the slurry to
expand and form bubbles. Then once the foam is formed, it is frozen into place. Then the
water is removed from the system through sublimation. Finally, the foam is densified by
traditional sintering. After successfully creating ceramic foam samples, the parameters in
the freeze foaming process were identified and investigated. Foam samples were
characterized by taking density measurements, examining the macrostructure and
microstructure with light microscopy, and determining mechanical properties through
compression testing. In the end, highly porous foam samples with adjustable properties
were synthesized using a novel manufacturing process.

1
INTRODUCTION
Ceramic foam is a unique class of materials that possess unique characteristics
that have seen limited development due to limitations in manufacturing ceramics.
Ceramic foams are perhaps most notable as lightweight thermal insulators that can be
used in high temperature environments. There are three common synthesis techniques
that are used to create ceramic foams including: direct foaming, replica templating, and
sacrificial templating. Direct foaming incorporates pores by injecting air into a ceramic
slurry. Replica templating is a process where a ceramic slurry is soaked up into a sponge
to create a porous material, while polymeric beads are used in sacrificial templating to
create ceramic foam.
Investigations into freeze-tape casting of ceramic materials for fuel cell
application provided the impetus to study the fabrication of foams. The freeze casting
process creates aligned pores in ceramic materials by freezing the liquid of a ceramic
loaded slurry and removing it through sublimation. It was observed during freeze casting
experimentation that slurry bubble droplets that hit the freezing bed produced a
“snowman” structure, and hence the idea of freeze foaming was developed. During the
down time of freeze tape casting, little “snowmen” were made by placing a bubble of
aluminum oxide slurry onto a freezing aluminum bed in which, Figure 1 shows one
“snowmen” that was made using the freeze tape caster. Compounding this serendipitous
finding, during the traditional de-airing of a ceramic slurry, for freeze tape casting, the
slurry and existing bubble content froze during the de-airing process from having the
vacuum freeze dryer set at too low of a temperature. The subsequent foam structures that

2
were observed in the ceramic materials gave rise to the concept of freeze foaming as a
novel technique to form ceramic foam.
The focus of this thesis is to investigate a novel process to make ceramic foam.
Within that research there were two different aspects. First, to develop the freeze foaming
process and to determine the parameters that affect the foam synthesis. Second, to
characterize the foam and to determine the effects of the processing parameters.
Figure 1. The formation of a “snowman" structure made of aluminum oxide slurry
was produced by placing bubbles of an aqueous slurry on top of each other and
allowing them to freeze.

3
BACKGROUND
Ceramics
Ceramics are a class of materials that have a deep history and were first developed
from natural materials, such as clay and other alumino-silicates. Humans have been using
ceramics for thousands of years for a variety of utensils as well as artwork. It has been
found that ceramics were used prior to 5000 BC (1). Ceramics are most famous for their
use as toilets, bathroom sinks, and pottery however due to advancements in technology
ceramics are used throughout industry in technical applications that require extreme
hardness and temperature stability (1). Due to their unique material properties related to
bonding, ceramics are used in numerous applications, in which Figure 2 shows some of
the uses of ceramics. Ceramic materials are used in environments of extreme heat and
some components of jet engines are made from ceramic materials, such as super-alloy
blade coatings (10). Thermal insulation is perhaps the most notable usage aspect of
ceramic materials in which the NASA space shuttles demonstrate their resilience in
which the bottom surface of the space shuttle was lined with highly porous ceramic tiles
to withstand the immense heat felt during the re-entry process. In addition to thermal
insulation, ceramics are often used as electrical insulators. On high voltage electrical
transmission lines, which are not coated with an insulating plastic, ceramics are used to
keep electrical loses down therefore improving efficiency. Ceramic insulators are placed
on overhead power lines where the electrical lines are supported and prevent electricity
from flowing into the transmission towers. In more technical applications, ceramic

4
materials are used where other materials would simply not survive due to operational
conditions of wear including dental implants, resistant coatings for various parts
including cutting tools, and even ceramic coated as well as full ceramic ball bearings (1-
8,10). Additionally, many common construction materials are a form of ceramic
including; tile, cement/concrete, and brick. Ceramic materials have been a part of human
society for a long time and they are used throughout industry in numerous applications
with growing technical applications.
There are two different branches of ceramics which include traditional ceramics
and advanced ceramics Traditional ceramics are composed of clay minerals such as
porcelain, but include material likes cement and glass (8). Although traditional ceramics
are important, this thesis will focus on advanced ceramics used in wear and insulation
Figure 2. Examples of ceramic uses. Ceramic artwork from Montana artist Frances
Sneska is shown in the upper left image (2). In the upper right image the silica fiber
tiles on the space shuttle can be seen, black underside (4). The lower left image shows
an electrical insulator used for transmission line, typically porcelain (5). Zirconia
dental implants are depicted in the lower right image (3).
5
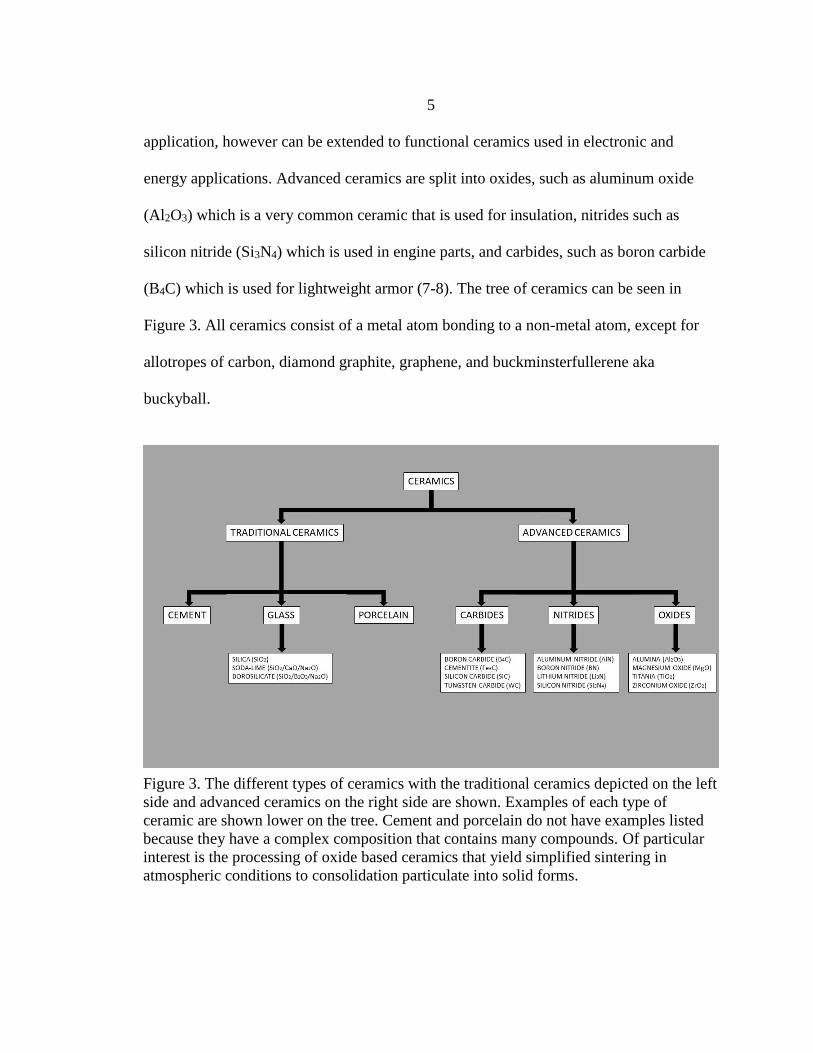
application, however can be extended to functional ceramics used in electronic and
energy applications. Advanced ceramics are split into oxides, such as aluminum oxide
(Al2O3) which is a very common ceramic that is used for insulation, nitrides such as
silicon nitride (Si3N4) which is used in engine parts, and carbides, such as boron carbide
(B4C) which is used for lightweight armor (7-8). The tree of ceramics can be seen in
Figure 3. All ceramics consist of a metal atom bonding to a non-metal atom, except for
allotropes of carbon, diamond graphite, graphene, and buckminsterfullerene aka
buckyball.
Figure 3. The different types of ceramics with the traditional ceramics depicted on the left
side and advanced ceramics on the right side are shown. Examples of each type of
ceramic are shown lower on the tree. Cement and porcelain do not have examples listed
because they have a complex composition that contains many compounds. Of particular
interest is the processing of oxide based ceramics that yield simplified sintering in
atmospheric conditions to consolidation particulate into solid forms.

6
Ceramic Bonds
Ceramic materials are characterized by their covalent and ionic bonding which
yields a departure from ductile metallic behavior due to inability to displace atoms/ions
without breaking bonds. Ceramics are typically described as covalently bonded or
ionically bonded, however it is more likely a mixture of covalent and ionic bonds.
Covalent bonds are formed when electrons are “shared” by ions. In reality covalent bonds
are formed when two ions have orbital overlap, this is the foundation of valence bond
theory in which the electron wave functions of adjacent atoms interact to create a new
wave function that facilitates coulombic cohesion. This orbital overlap attracts two ions
to each other. There are two different components to covalent bonding, Sigma (σ)
bonding and Pi (π) bonding. Sigma bonding is orbital overlap where electrons get shared,
while pi bonding is where orbital alignment takes place, a form of van der Waals
interaction. Sigma bonds are stronger than pi bonds due to the fact that actual overlap is
occurring forming the classic covalent interaction. Covalent materials can be single,
double, or triple bonded, however, the terminology does adequately describe the bonding
nature of the material. When a covalent material has a single bond it is based upon the
formation of a sigma bond. However, double bonded materials usually contain a sigma
bond and a pi bond, as depicted in Figure 4. Furthermore, triple bonded covalent
materials have one sigma bond and two pi bonds. Ethylene (C2H4) is a great example of a
double bonded covalent material that contains both a sigma and pi bond. In this example
the sp2 bonded carbon has a double covalent bond. Between the two adjacent carbon

7
atoms there is orbital overlap or a sigma bond. While the other two orbitals of the carbon
atoms extend to bond to hydrogen, one orbital of the carbon extends up and down. The
carbon orbitals are aligned forming a pi bond. It should be noted that the hydrogen and
carbon atoms form a sigma bond where orbitals and within the ethylene compound there
is a total of six bonds, five sigma and one pi. The bonding configuration of ethylene can
be seen in Figure 4 where the sigma and pi bonds are highlighted. Due to the orbital
overlap, covalent bonds are short and stiff which is quite beneficial, but they are highly
directional which limits ductility as atom are not able to be strained plastically without
breaking the covalent orbital overlap of the sigma bond.
Figure 4. The covalent bonds of Ethylene are highlighted. The bonds of interest are the
carbon-carbon bonds. In this material the carbons are double bonded together with one
sp2 orbital overlapping causing a sigma bond and the p orbitals of the carbon are aligned.

8
Ionic bonding in ceramic occurs when electrons are transferred between atoms to
create cations, positively charged ions, and anions, negatively charged ions. This charge
difference between ions forces the ions to attract to each other and forms a bond that has
an overall neutral charge. One very common example of this bond is sodium chloride
(NaCl) or more commonly known as table salt. In this material sodium, an anion,
transfers an electron to chlorine, a cation. The transfer of an electron causes the two ions
to attract to one another and the entire system has a neutral charge. Figure 5 shows the
formation of an ionic bond in sodium chloride. Ionic bonds are not as short or stiff as
Figure 5.The formation of sodium chloride is depicted. An electron is transferred from
sodium to chlorine to form a cation of sodium and an anion of chlorine. Overall a charge
neutral sodium chloride compound is formed with an ionic bond.

9
covalent bonds but they are shorter and stiffer than metallic bonds as evidenced in the
hardness of materials which correlates with strength. While ionic bonds are not direction
sensitive, like covalent bonds, in a bulk material they are position sensitive yielding
brittle behavior common across all ceramics. If ionically bonded materials are pushed
into the wrong position, ions with like charges will be pushed into close proximity in
which the bonds will break as the ions repulse each other due to equal charge values, a
depiction of this position sensitivity can be seen in Figure 6. Materials can share electrons
equally and transfer electrons, but generally most chemical compounds do not behave in
this manner. Electron sharing varies from almost equal sharing, mainly covalent, to the
electron being mostly held by one ion, mainly ionic (9, 11).

10
Mechanical and Thermal Properties of Ceramics
The unique material properties of ceramics; high melting temperature, low
thermal expansion, high elastic modulus, low density, low thermal and electrical
conductivity, and low fracture toughness are all derived from the bond type of ceramic
materials. Looking at the first few properties listed; high melting temperature, low
thermal expansion, and high elastic modulus, these properties can be explained due to the
shorter, stiffer bonds associated with covalent and ionic character. The stiff bonds make it
so that large amounts of energy are needed to move atoms apart from each other. Low
Figure 6. Depiction of direction sensitivity for ionic bonds is shown. Outside forces drive
ions to shift into different positions, where repulsive forces are shown as yellow arrow
and the ions push each other apart.

11
thermal and electrical conductivity are explained by the fact that covalent and ionic bonds
more or less lock the electrons of the atoms into well-defined and discrete electron
energies. Electrons in this manner that lack a band structure are not allowed to freely
travel through the material, because of this electrical conduction through the bulk of a
ceramic material is limited. The bond directionality and position sensitivity of ceramic
materials, whether by covalent or ionic bonding explains the brittle behavior of ceramics
and hence the low fracture toughness. As atoms/ions are displaced well beyond their
equilibrium bond radius, directionality yields failure of the bond or atoms will actually
start to repulse each other due to equal charge values. Table 1 shows the material
properties of certain ceramics, metals, and polymers for a comparison of ceramic
materials to other materials. Often regarded as the steel of the ceramics industry, the main
Table 1. The material properties of a few ceramics, metals, and polymers have been
selected. The polymer melting temperatures provided are actually glass transition
temperatures (7).

12
material used for this research was aluminum oxide, in which Table 2 provides more
material properties for aluminum oxide.
Physics of Bubbles
The physics of bubbles is well understood (19,31), however modeling the
evolution of bubbles in foam is very difficult due to the fact that the principal physics
spans a large scale of time and space. There are two different regions in clusters of
bubbles or foam. First, there is the lamellae or bubble wall. Second, there is the region
where different bubbles touch or the plateau border. Liquid foams are not stable and there
are always three different dynamical movements occurring. The first dynamical
movement is drainage. Drainage is the act of fluid flowing downward. The rate of
drainage, or thinning of bubble walls is related to the viscosity of the fluid, 𝜇, the density
Table 2. The material properties of aluminum oxides are provided. The range of material
properties comes from different purities and sized alumina (7).

13
of the fluid, 𝜌, the gravity acting tangential to the bubble wall, 𝑔𝑠, and the surface
tension, σ. Saye and Sethian (19) have developed a fourth order partial differential
equation that implements these components and needs two boundary conditions to be
solved. This relationship can be seen in Equation 1. In addition, disjoining pressures and
van der Walls interactions can be implemented into the model, which is necessary when
looking at longer time scales. The second dynamical movement is coarsening.
Coarsening follows the same principle as Ostwald’s ripening where small bubbles
converge together to form larger and larger bubbles over time. The last dynamical
movement is collapse. Collapse is where the faces of exposed bubbles rupture. This is a
direct result of drainage and outside forces acting on the face of a bubble. Drainage
continues until the bubble walls are too thin and the bubble ruptures displacing any
leftover liquid into the surrounding bubbles (19, 31). Drainage, coarsening, and collapse
can be slowed by the addition of surfactants or by particle modification. These additives
have been shown to even stabilize foams for days.
Equation 1
ƞ𝑡 +1
3𝜇∇𝑠 ∙ (𝜎ƞ3∇𝑠((𝑘1
2 + 𝑘22)ƞ + ∆𝑠ƞ) + 𝜌𝑔𝑠ƞ3) = 0
Where: ƞ is the half thickness of the bubble wall
∇𝑠 is the surface gradient
∇𝑠 ∙ is the surface divergence
∆𝑠 is the Laplacian on the curved surface of the lamella
𝑘1 + 𝑘2 are the principal curvatures of the Laplacian

14
Based off of the research on bubbles, while synthesizing foam the three
dynamical movements will need to be mitigated. Additionally, knowing how drainage,
coarsening, and collapse effects bubbles will improve understanding on what processing
parameters will have an effect on the synthesis of foam, such as viscosity.
Sintering
Sintering is the act of molecules, ions, or atoms diffusing through a solid. This
process is most notably used in ceramics processing as a method to consolidate a green
ceramic material comprised of particulate into a dense and strong structure. This process
is driven thermodynamically the reduction of surface free energy as particles neck and
grow to achieve a consolidated structure by atom transport in the solid state. While
driven thermodynamically, atoms typically need sufficient thermal energy to allow
sufficiently fast rates such that sintering is often performed at 2/3-3/4 of the melting
temperature. With ceramics, green bodies are typically fabricated by processing means to
consolidate particles into structures with 45 – 65% theoretical density. The high sintering
temperatures provide a mechanism for the porosity to be diminished and the ceramic to
achieve greater than 99% density under sufficient processing conditions. In this manner,
densification has been achieved and is accompanied by increased mechanical properties
of the ceramic. There are however, multiple mechanisms by which sintering occurs, but
only two mechanisms are noted to drive densification; volume diffusion and grain-
boundary. Volume diffusion is defined as atoms moving from the bulk of a particle to a
new necking surface which grows between two adjacent particles. Grain-boundary

15
diffusion is a different pathway where atoms move along the grain boundary of a particle
and move to a necking surface. The effects of sintering on the structure of alumina can be
seen in Figure 7 (33). Figure 8 shows these two sintering pathways where the first
pathway is volume diffusion and the second pathway is particle diffusion. For sintering to
take place one hump needs to be overcome to allow particle movement. The activation
energy, or the thermal energy required for atom transport, must be met to achieve
sintering (1,32).
Sintering of foams presents a different perspective with regard to densification.
In preparing the ceramic foams, some porosity is intended to be retained, however, the
regions that define the foam cell walls needs to density to facilitate rigidity of the
structure. This relationship is illustrated in Figure 9. With insufficient cell wall integrity,
the ceramic foam may not offer sufficient strength to support even thermal transport
applications. Additionally, another key concern arises when sintering is performed on
ceramic foams related to the manufacturing process. The sacrificial material (organic
compound) that is used to form many ceramic foams requires pyrolysis. To perform
Figure 7. The densification of alumina through sintering are shown. Alumina was
sintered at 1600 C (33).

16
pyrolysis, the foam is heated to approximately 200°C and 600°C and held at that
temperature to achieve sufficient burnout (24). During the pyrolysis step of sintering, the
process cannot be performed too quickly as the structure can be damaged. If the material
Figure 8. The two sintering mechanisms that contribute to densification are I, volume
diffusion, and II, grain-boundary diffusion. Surface diffusion III and
evaporation/condensation IV are noted to only coarsen the ceramic particles (32).
Figure 9. The structure of a ceramic foam has both rigid walls/struts and porosity.
30/0.3 - 10

17
is completely encapsulated in the strut of the foam, the internal pressures within the strut
can build up too quickly and rupture the strut. In other situations, cracks can be
introduced into the foam structure if the additives are volatilized too quickly. It has been
observed that the burnout rate, for thin ceramic plates must be limited to 20 mg/min (34).
Figure 10, shows a pyrolysis run needed to safely remove the organic template used in
the synthesis of ceramic foam by sacrificial templating. This long time needed to achieve
pyrolysis is a negative for the most traditional manufacturing techniques of ceramic
foam.
Figure 10. The two stage pyrolysis treatment of a sacrificial organic material, starch, used
to synthesis alumina foam is depicted (34).

18
Ceramic Foams
There are several different kinds of foam whether comprised of polymer, metal or
ceramic including closed cells, open cells, partially open cells, and mixed cells (23). The
first type of foam, closed cell, is defined as foams that have material distributed on the
struts of the bubbles as well as faces. This kind of foam has distinct cells that are
encapsulated. Bubble wrap is a good representation of closed cell foam in which the
bubbles entrain a fluid or gas. The second type, open cell foams, are a system of
connecting struts that does not have material connecting between them. Due to the
openness of the structure gasses and fluids can easily flow through this type of foam. The
third type of foam, partially open cells, is similar to closed cell foam, but within the faces
of the bubbles there are holes. The last type of foam, mixed cell, is a foam that contains
both open and closed cell foam. Figure 11 shows the different types of foams.
Ceramic foams have numerous applications due to their low densities, high melting
points, low thermal conductivity, and high corrosion resistance. Closed cell foams are
great for thermal insulation. Ceramic foams with closed cells are used for high
temperature insulation, including the insulation for furnaces. Open cell ceramics foams
have been studied for the use as the scaffolds of batteries, electrodes, and solid oxide fuel
cells (18,21,23,24). In addition, ceramic foams have been studied and used in
applications including filtration of molten metals, the filtration of hot gases like exhausts
gases, and even bone repair (18,24-26).

19
Manufacturing Techniques
Foam from a general perspective is a relatively new class of engineered material,
polymer foam was developed after World War II. By the 1960s mass production of
polyurethane foam had begun, but humans have utilized for thousands of years (18).
Wood, cork, and coral are all natural foams that humans have utilized for tools from
building homes to keeping wine secure. Bones are even a foam structure found as a
natural composite which has allowed them to be relatively light while retaining strength
(10). Polymeric foams have been extensively developed and the most traditional
manufacturing technique is foam extrusion. In foam extrusion a liquid polymer has gas
incorporated into it. The gas, and porosity, are incorporated by stirring a bath causing
Figure 11. The different types of foams are shown. Each type of foam has different
properties and is suitable for different types of applications (23).
20
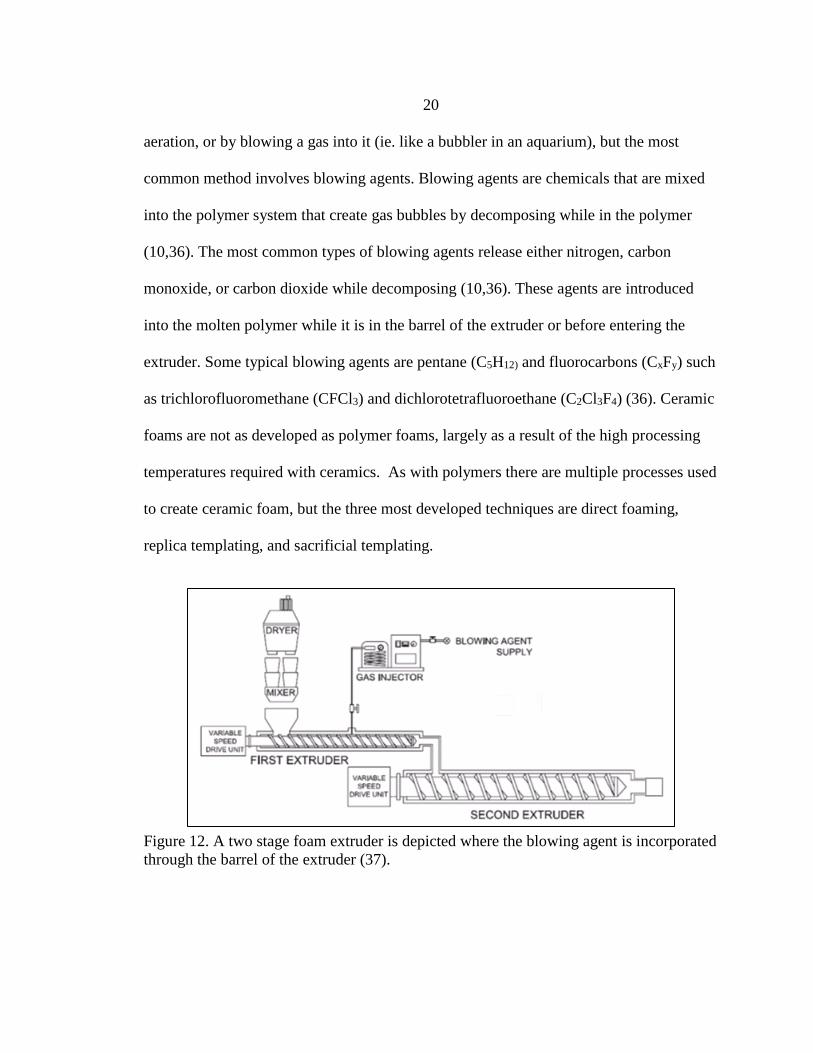
aeration, or by blowing a gas into it (ie. like a bubbler in an aquarium), but the most
common method involves blowing agents. Blowing agents are chemicals that are mixed
into the polymer system that create gas bubbles by decomposing while in the polymer
(10,36). The most common types of blowing agents release either nitrogen, carbon
monoxide, or carbon dioxide while decomposing (10,36). These agents are introduced
into the molten polymer while it is in the barrel of the extruder or before entering the
extruder. Some typical blowing agents are pentane (C5H12) and fluorocarbons (CxFy) such
as trichlorofluoromethane (CFCl3) and dichlorotetrafluoroethane (C2Cl3F4) (36). Ceramic
foams are not as developed as polymer foams, largely as a result of the high processing
temperatures required with ceramics. As with polymers there are multiple processes used
to create ceramic foam, but the three most developed techniques are direct foaming,
replica templating, and sacrificial templating.
Figure 12. A two stage foam extruder is depicted where the blowing agent is incorporated
through the barrel of the extruder (37).

21
Direct Foaming. Direct foaming is a process that is very similar to how polymeric
foams are made. In this process gas is added to a slurry to form bubbles which becomes
the pores in the foam. Gas can be introduced by mixing the slurry or by adding blowing
agents. Blowing agents are just chemical compounds that when combined with another
chemical release a gas. Two examples of blowing agents are sodium bicarbonate, more
commonly known as baking soda, (28) and hydrogen peroxide (27). When baking soda
decomposes carbon dioxide gas is released within the slurry which creates pores.
Similarly when hydrogen peroxide decomposes oxygen gas is evolved. The gas
introduced to the slurry forms bubbles which leads to pores within the foam. Once the
bubbles are formed in the liquid slurry, the slurry has to be set so that the structure is
permanent. Setting can be done by multiple types of additives or techniques. The most
common method is using polymeric additives and inducing cross-linking (13,15-
17,23,24,27). After the foam is set, it is dried and sintered. This leads to a pure ceramic
foam. Figure 13, depicts the process of direct foaming (24).
The most challenging part of the direct foaming process is keeping the bubbles
intact during setting. During the setting process coarsening and drainage must be
Figure 13. The basic steps of direct foaming are shown. (24)

22
prevented or limited. To overcome Ostwald ripening, different additives are implemented
into the ceramic foam slurry. There are two different stabilizing techniques that are used,
surfactant stabilization and particle stabilization. Surfactants or, “SURFace ACTive
AgeNT” have many definitions, but surfactants are any additives that help particles in a
slurry act differently than they normally would. Surfactants can be used to alter surface
energy, surface tension, surface charge, help disperse particles, or stabilize particles.
Surfactants molecules are amphiphilic. They have two different regions, where one
portion is polar and the other portion is non-polar. The slurry needs to be aqueous based
in order for the surfactant to work. Surfactants stabilize foam by lowering the interfacial
energy of the air and water boundary. The surfactant adsorbs to the surface and slows
coalescence of bubbles in the foam. Using surfactants makes it so that different sized
pores can be incorporated into the foam, ranging from 35 μm to 1.2 mm (24). Figure 14,
shows how a surfactant interacts with the aqueous based foam while it is setting.
The other method to stabilize foams, via the direct foaming process, is using
particles. Particles are altered so that they behave in the same way as the surfactants. The
particles bunch at the interface between the air and water. This lessens the effects of
Ostwald’s ripening and slows bubbles from combining. Figure 12, shows silica particles
clustering at the air-water interface (35). The particles were altered using short chain
amphipathic molecules. These molecules cause the particles to have a hydrophobic and
hydrophilic side, thus causing bunching at the air-water interface within the foam.
Particle stabilization is dependent on having a certain concentration of amphipathic
molecules, but once the threshold is met the foam, becomes ultra-stable and it has been

23
shown that the coarsening of the bubbles can be deterred for as long as four days. This
high stability makes it so that the foam does not need to be set by gelation and can be
dried once the foam has been formed. Particle stabilized foam can have pores that range
from 10 to 300 µm. In addition, foams made using this process have been able to achieve
porosity levels of 93% (15,17,24).
Figure 14. Surfactant stabilizing an air bubble in water is shown. Where the surfactant
molecules form a "ring" which creates stable air bubbles.
24
Replica Templating. Replica templating is a manufacturing technique for ceramic
foams. This process can be seen in Figure 16. Replica Templating is the oldest
manufacturing technique used to make macroporous ceramic foams, dating back to the
1960s. At first, the technique was done using polymeric sponges with high porosity (24).
Today, replica templating is the most used manufacturing technique for ceramic foams
where the templates are generally made of open cell polyurethane. Replica templating is a
simple technique that can be used with almost any material system with little
modification. These reasons are why the technique is so heavily used in industry, but the
fact that the template must be removed increases the time required to synthesis parts and
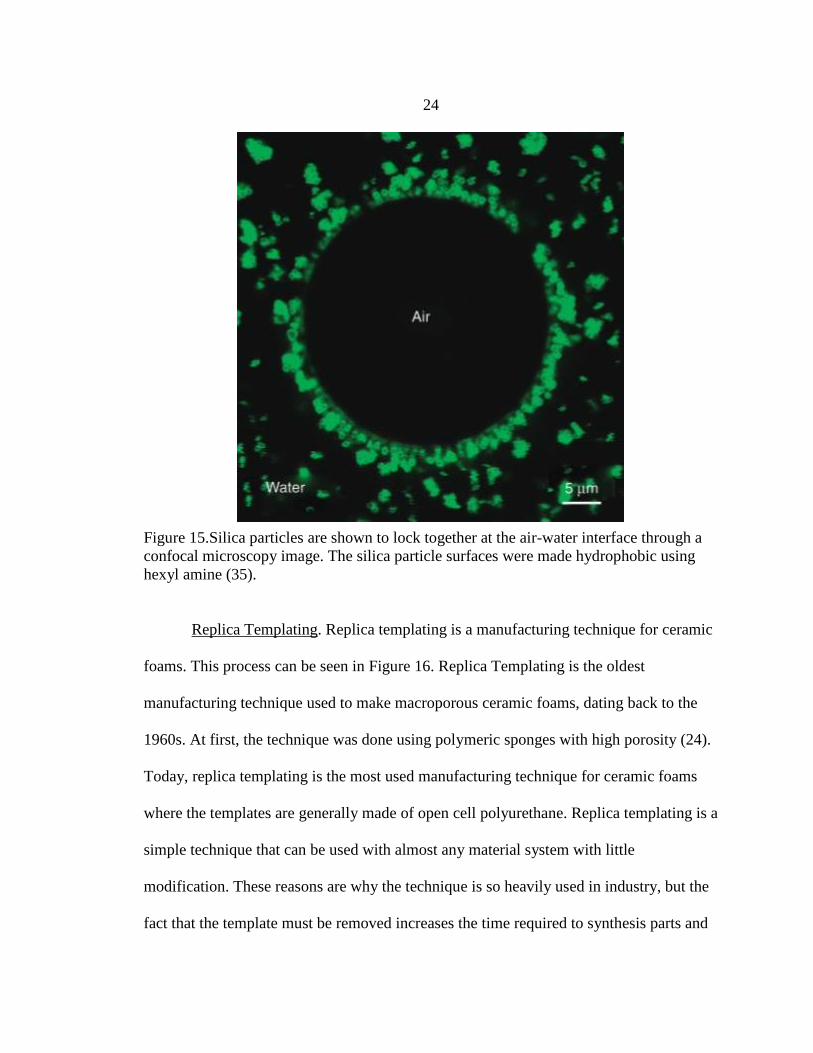
Figure 15.Silica particles are shown to lock together at the air-water interface through a
confocal microscopy image. The silica particle surfaces were made hydrophobic using
hexyl amine (35).

25
a lot of sacrificial material is used that needs to be burned out of the foam and releases
gases like carbon dioxide (23,24).
In the replica templating technique, a polymeric sponge is placed into a
suspension of ceramic particles until the sponge is fully saturated. Then, excess material
is removed from the sponge by squishing the sponge using rollers. Once the correct
amount of suspension is in the template, the foam is dried and the template is removed
through pyrolysis. During this step the foam is heated very slowly until the template is
completely removed and only the ceramic particles remain. Heating is done at rates less
than 1°C/min. Pyrolysis occurs by heating the ceramic infused template up to 800°C (24).
The template must slowly be removed so that during pyrolysis the struts in the foam
structure do not collapse due to too quick of polymer migration or too high of pressure
build up within the struts. Lastly, the ceramic particles are fully densified by sintering the
foam at the appropriate temperature. As mentioned previously the template is generally
made of polyurethane, but this process has also been shown to work with natural
templates like coral and wood. Using this process foams can be made with pore sizes
varying from 200µm to 3mm. The foam is limited to pores larger than 200µm due to the
Figure 16. The steps of replica templating are shown (24).

26
fact that it is difficult to create polymeric templates with openings smaller than 200µm.
Porosity levels ranging from 40% to 95% have been achieved using replica templating
(16,23,24).
Sacrificial Templating. Sacrificial templating is a process where ceramic particles
and some type of sacrificial material are combined into a homogeneous mixture. Then the
sacrificial material is removed allowing the ceramic particles to be sintered. The material
that is extracted from the foam leaves behind pores. Figure 17, shows the sacrificial
templating method. This process is robust and has been shown to work with many
different material systems.
There are a variety of materials used as the sacrificial material including
polymers, salt, metals, and liquids including water (14,16,23,24). The sacrificial
templating manufacturing technique differs substantially based on the type of sacrificial
material chosen. These sacrificial materials are combined with the ceramic particles by
various means. The ceramic particles and sacrificial material can be combined into a
suspension where the mixture is then casted. Or, more commonly dry powder forms of
the ceramic and sacrificial material are combined and pressed into a mold. Then,
depending on the type of sacrificial material used the material is removed by various
means. For sacrificial material such as polymers, the material is removed by thermal
treatment. The foam is heated up to 600°C where pyrolysis takes place (24). The sample
must be held at this temperature for a long time and slow heating rates must be used to
not damage the foam structure. Another removal process is the use chemicals. This
process is done for sacrificial material such as salts and metals. In the case of salt,

27
multiple washings using water has been shown to remove the salt, while metals generally
need to be removed using acid. Lastly, sacrificial material like water or other liquids can
be removed through evaporation or sublimation. After the sacrificial material has been
removed, the ceramic foam is strengthened through traditional sintering methods. Using
sacrificial materials, porosity levels ranging from 20% to 90% can be achieved with pore
sizes ranging from 1-700um (16,23,24).
Novel Techniques. There are multiple groups researching novel foam synthesis
techniques (43,45). Jayasinghe and Edirisinghe developed a technique where
polyurethane foam was electrosprayed with a slurry of alumina. With this technique they
obtained an open cell foam with a porosity of roughly 96% that replicated the
polyurethane template with extreme accuracy (43). Li, et. al., synthesized silver sulfide
(Ag2S) porous foam by placing a suspension of silver sulfide and hexane on top of
diethylene glycol. When the system was exposed to air the hexane evaporated and left
behind a porous structure of silver sulfide (45). Other groups are researching synthesis
techniques that are not foams but results in similar porous structures (14,44). Nishihara,
et. al., created a honeycomb structure of silica using ice templating, where a hydrogel was
Figure 17. The steps of sacrificial templating are shown (24).

28
utilized to form a silica framework and then the structure was frozen by dipping the
structure into a cold bath set to -30°C (14). Hong, et. al., created interconnected pore
channels in a zirconia structure by utilizing camphene slurries of zirconia and freezing
them at 5°C. This technique successfully created samples that had porosities ranging
from 67% to 82% (44).
Constitutive Properties of Foams
Ceramic foams have many of the same properties that are seen in fully densified
ceramics such as high melting temperature, low electrical and thermal conductivity, and
low thermal expansion. The properties of foam are heavily tied to how much gas is
incorporated into the foam, Ashby and Mehl (38) were the first to show the relationship
between the relative density and mechanical properties of cellular solids in 1983.
Equation 2 shows the relationship of relative density, 𝑅𝜌, where 𝜌 is the density of
Equation 2
𝑅𝜌 =𝜌
𝜌𝑠
the foam and 𝜌𝑠 is the density of a fully densified solid of the same material. The
relationship of relative density can also be determined by examining the structure of the
foam. Equations 3 and 4 show the relationship between the thickness of the struts of the
foam, 𝑡, and the length of the struts, 𝑙. Figure 18 shows where the strut thickness and
length can be found on a foam sample. Equation 3 is valid for foams that are open cell,

29
Equation 3
𝜌
𝜌𝑠= (
𝑡
𝑙)
2 (Valid for Open Cell Foams)
Equation 4 𝜌
𝜌𝑠= (
𝑡
𝑙) (Valid for Closed Cell Foams)
while Equation 4 is valid for foams with closed cells. Then, to relate the relative density
to porosity Equation 4 is used, where P is porosity. It was found that for a cellular solid
Equation 5 𝑃 = 1 − 𝑅𝜌
Figure 18. The cellular unit used in the Ashby and Mehl model, where the thickness and
length used for relative density are shown (38).

30
that the ratio of elastic modulus is proportional to the squared value of relative density for
open cell structures and by the cubed value of relative density for closed cell structures.
Equations 6 and 7 show the relationships of elastic modulus, where 𝐸𝑆 is the elastic
Equation 6 𝐸 = 𝐸𝑆 (
𝜌
𝜌𝑠)
2 (Valid for Open Cell Foams)
Equation 7 𝐸 = 𝐸𝑆 (
𝜌
𝜌𝑠)
3 (Valid for Closed Cell Foams)
modulus of the solid material. Also it should be noted that the 𝐸𝑆 term has been moved
from the left side of the equation to the right side as presented. Ashby and Mehl also
looked at how brittle materials like ceramics and certain plastics fail. They determined a
relationship for brittle crushing, which is the mechanism by which ceramic foams fail due
to compressive forces. Figure 19, shows the brittle crushing mechanism where cracks
propagate through certain struts of the foam, while other struts stay intact. They
determined that the relative density relates to the ratio of crushing strength by a factor of
3/2 for open cells and a factor of two for closed cells with a factor of 0.65. Equations 8
and 9 show the relationship for the crushing strength where 𝜎𝑓∗ is the crushing or
compressive strength of the foam and 𝜎𝑓 is the compressive strength of the fully densified
solid. Again, 𝜎𝑓 has been moved to the right side of the equation.

31
Equation 8
𝜎𝑓∗ = 0.65𝜎𝑓 (
𝜌
𝜌𝑠)
3∕2 (Valid for Open Cell Foams)
Equation 9 𝜎𝑓
∗ = 0.65𝜎𝑓 (𝜌
𝜌𝑠)
2 (Valid for Closed Cell Foams)
Figure 19. The mechanism of failure for brittle solid cellular structures, brittle crushing
(38).

32
RESEARCH OBJECTIVE
The objective of this thesis is to develop a novel approach to making ceramic
foam through a route of freezing and sublimation. Within that objective there are three
discrete goals that need to be met so that the overall objective is accomplished. First,
ceramic foam needs to be successfully synthesized and sintered into a solid structure that
retains sufficient strength for physical and mechanical properties characterization. To
meet this goal the process of freeze foaming needs to be developed including the detail of
the processing parameters and organic additives. Then it needs to be demonstrated that
ceramic foam can be synthesized using the freeze foaming process.
Second, the foam needs to be characterized and tested to determine the properties
and how those properties scale with the currently accepted behavior of cellular materials.
Once the parameters of the freeze foaming process have been established, multiple
samples with the same properties can be made for characterization in which the
properties of the foam can be ascertained. To reach this goal, three different properties
will be investigated; physical properties, structural properties, and mechanical properties.
The physical properties examined will be the density of the foam and the relative density
of the foam. Next, to investigate the structural properties the pore size and porosity will
be evaluated. Finally, the mechanical properties will be investigated by calculating the
theoretical elastic modulus and compressive strength which will be contrasted with the
empirical elastic modulus and compressive strength.
Third, all of the parameters within the freeze foaming process needs to be
identified and examined. Once the parameters of the freeze foaming process have been
33
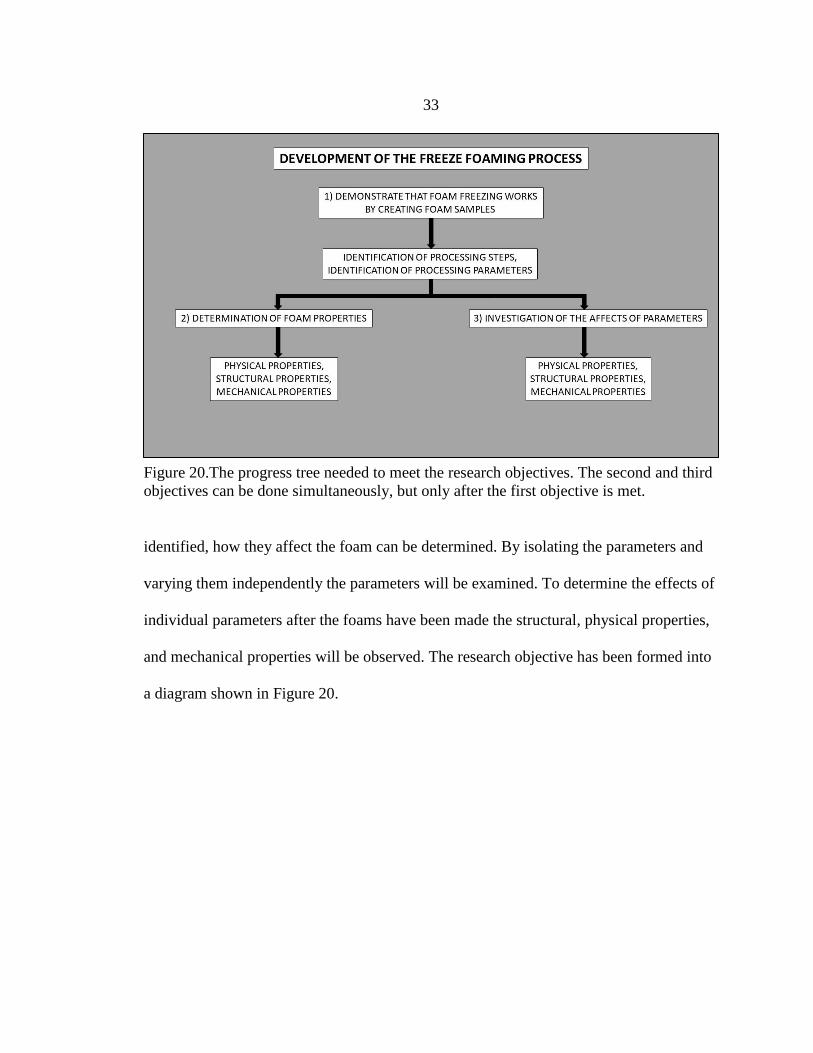
identified, how they affect the foam can be determined. By isolating the parameters and
varying them independently the parameters will be examined. To determine the effects of
individual parameters after the foams have been made the structural, physical properties,
and mechanical properties will be observed. The research objective has been formed into
a diagram shown in Figure 20.
Figure 20.The progress tree needed to meet the research objectives. The second and third
objectives can be done simultaneously, but only after the first objective is met.

34
EXPERIMENTAL PROCEDURE
Materials
For this study, Alcoa A-16 aluminum oxide powder was used. Alumina (Almatis,
Leetsdale, Pa) was chosen because the sintering characteristics have been well observed
and alumina is heavily used in industry. Furthermore, the application of alumina foams in
thermal insulation and catalyst supports is a strong driver for the selection. The
properties of alumina are provided in Table 2, but those values are given as ranges. For
the entirety of the research a density of 3.95 g/cc was used for aluminum oxide. Also, an
elastic modulus of 367 GPa and compressive strength of 690 MPa were utilized as
baseline bulk values, however, these can be scaled depending upon actual test values as
needed.
Aqueous slurries comprised of only four total ingredients; aluminum oxide,
deionized water, ceramic dispersant, and a ceramic binder. Deionized water was
implemented to ensure consistency and to make sure that the ions in tap water did not
impair the aqueous slurries. Darvan C-N (R.T. Vanderbilt Co., Norwalk, CT) was used as
a ceramic dispersant. It is a mixture of 25 weight percent ammonium polymethacrylate
dispersed into water (39). The ceramic binder used was Rhoplex HA-12 (Rohm & Hass,
Spring House, Pa). Rhoplex HA-12 is an aqueous acrylic emulsion that has a solids
loading of roughly 45%. The specifics of HA-12 are trade secrets held by Rhoplex. The
performance of Rhoplex HA-12 decreases when high shear is applied to it. Therefore, it
can only be stirred into a mixture and should not be ball milled as is done with particle
35
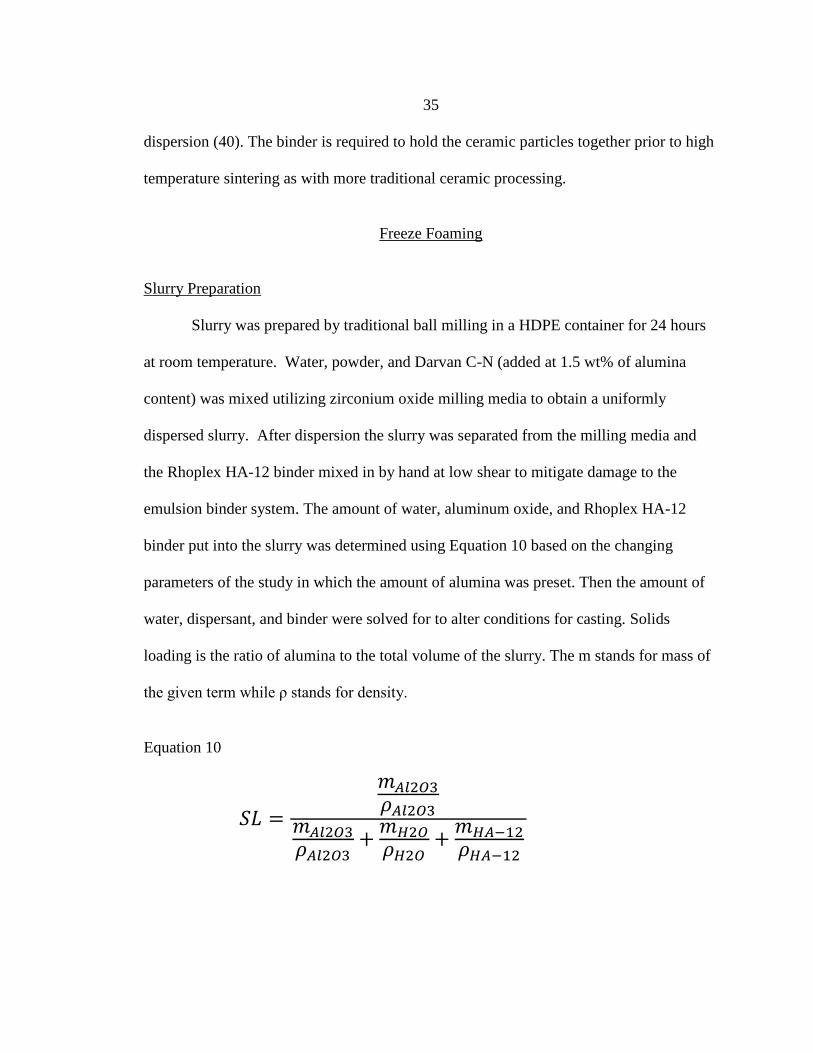
dispersion (40). The binder is required to hold the ceramic particles together prior to high
temperature sintering as with more traditional ceramic processing.
Freeze Foaming
Slurry Preparation
Slurry was prepared by traditional ball milling in a HDPE container for 24 hours
at room temperature. Water, powder, and Darvan C-N (added at 1.5 wt% of alumina
content) was mixed utilizing zirconium oxide milling media to obtain a uniformly
dispersed slurry. After dispersion the slurry was separated from the milling media and
the Rhoplex HA-12 binder mixed in by hand at low shear to mitigate damage to the
emulsion binder system. The amount of water, aluminum oxide, and Rhoplex HA-12
binder put into the slurry was determined using Equation 10 based on the changing
parameters of the study in which the amount of alumina was preset. Then the amount of
water, dispersant, and binder were solved for to alter conditions for casting. Solids
loading is the ratio of alumina to the total volume of the slurry. The m stands for mass of
the given term while ρ stands for density.
Equation 10
𝑆𝐿 =
𝑚𝐴𝑙2𝑂3𝜌𝐴𝑙2𝑂3
𝑚𝐴𝑙2𝑂3𝜌𝐴𝑙2𝑂3
+𝑚𝐻2𝑂𝜌𝐻2𝑂
+𝑚𝐻𝐴−12𝜌𝐻𝐴−12

36
Ball Milling
Ball milling was performed to create a homogeneous slurry. The process involved
mixing the aqueous based slurry with milling media and rotating the mixture. The ball
milling media consisted of varying sizes of cylinders, spheres, and egg shaped “marbles”
made of fully densified aluminum oxide. The speed of rotation for ball millings was set
such that the media fell from the top of the container, and smashed the mixture on each
rotation. Figure 21 shows the ball milling process. Ball milling was performed for 24
hours to ensure a complete mixture.
Bubble Formation and Simultaneous Freezing
Bubble formation and simultaneous freezing is the heart of freeze foaming. In this
step the pores of the foam were made and then set into place using one piece of
equipment, a vacuum freeze dryer. The slurry was placed into a mold, which was placed
into the vacuum freeze dryer, and the pressure in the freeze dryer was reduced using a
traditional rotary vane vacuum pump. The pressure difference of the air within in the
slurry and surrounding environment caused the air to expand, forming bubbles. The
Figure 21. The process of ball milling is depicted, where the milling media reaches the
top of the container and then falls to the bottom due momentum and gravity.

37
bubbles filled the mold and eventually reached a state of equilibrium where expansion
stopped. The sample plate holder was set to -30°C which froze the samples.
Once the foam was frozen, and still under vacuum, the temperature of the plate in
the vacuum freeze dryer was increased to 30°C to more rapidly drive sublimation.
Sublimation, the process of transforming from solid phase to gas phase while bypassing
the liquid phase, was done to remove the water in the foam. The sublimation process was
performed for 18 hours to ensure that all of the water was removed from the system.
Once sublimated, the only components left in the foam were the ceramic binder and the
aluminum oxide. The Virtis EL-85 vacuum freeze dryer system (Virtis, Gardiner, NY) is
depicted in Figure 22.
Figure 22. The shelf type vacuum freeze dryer system (Virtis EL-85) is shown. In the
bottom left the vacuum pump can be seen.

38
Sintering
The foam samples were sintered using electrical resistance box furnaces. Due to
limitations in the furnaces available the foam had to be heat treated twice in two separate
furnaces. In the first heat treatment the binder and organic additives were removed
through thermal decomposition. While in the second sintering, the aluminum oxide was
fully densified at significantly higher temperature. In the first thermal treatment the cast
foam was heated to 150°C at a rate of 5°C/min. Then the heating rate was decreased to
2°C/min until the temperature was 400°C. At 400°C, the temperature was held constant
for 1 hour. The slow heating rate and dwell at 400°C allowed for the binder in the foam
to be thermally decomposed out of the foam without damaging it. Then the samples were
heated to 1100°C at a heating rate of 5°C/min. The samples were held at 1100°C for one
hour. Allowing the foams to densify slightly and increase their strength so that they could
be transported from the low temperature furnace to the high temperature furnace. After
slightly densifying, the foam was cooled at a rate of 10°C/min back to room temperature.
In the high temperature furnace run the aluminum oxide foams were heated at a rate of
5°C/min to 1500°C, where it dwelled for 2 hours. This allowed for the aluminum oxide
particles to densify. Then the foam was cooled back to room temperature at a rate of
10°C. Figure 23, shows a graph of the sintering profile.

39
Parameter Identification
There are multiple parameters that could affect the structure and material
properties of the foam produced by freeze foaming. Many of the parameters involve
changes to the composition of the slurry.
Solids Loading
The first parameter investigated was the solids loading, related to the amount of
ceramic in the slurry on a volumetric basis. Based off of Equation 10, the solids loading
was altered over a large range from 60% solids loading to 2.5% solids loading with
slurries prepared every 10%, with the exception of 5% and 2.5%. For this study, shown in
Table 3, the binder concentration was held at the same value and the same material was
Figure 23. The sintering profile used for all of the foam samples is shown. The sintering
profile could be shortened significantly with the use of a two stage furnace capable of
high enough temperatures, while being able to stay at low temperatures for an extended
period of time.

40
used for the study, aluminum oxide. The foam volume expansion ratio was held at the
same value, but at the lower solids loading it was slightly decreased. The foam volume
expansion ratio was determined by finding the ratio of the volume of the ceramic slurry
and the volume of the foam after foaming
Binder Concentration
The effect of binder concentration was examined related to the amount of binder
on a weight percent basis to the ceramic powder content. Binder concentration is the ratio
of binder weight to aluminum oxide weight. There were three different solids loading
levels selected to evaluate how the binder concentration affects the freeze foaming
process; 5%, 20% and 30%. The foam volume expansion ratio was held at a constant
value of roughly 10. These solids loading concentrations were chosen because the
varying level in binder would not have a large effect on the viscosity, due to the high
amount of water. Also, it was observed that the foaming process did not form stable foam
Table 3. The sample parameters for the solids loading study. Where the value in
parenthesis is the apparent solids loading after the expansion of the foam had taken place.

41
below 30% solids loading so it was valuable to see if increased concentrations of binder
concentration could extend the potential range of solids loading percentage. Table 4
displays all of the different binder concentrations that were tested.
Foam Volume Expansion Ratio
The foam volume expansion ratio is an important term used in the direct foaming
process and was incorporated in the freeze foaming process to provide a validation for the
technique. The foam volume expansion ratio is the ratio of the original slurry volume to
Table 4. The sample parameters for the binder concentration study.

42
the volume of the expanded foam in the green state. The effects of this parameter were
isolated by keeping a constant solids loading of 30% and binder concentration of 30%,
while the foam volume expansion ratio was altered from 2 to 20. The different foam
volume expansion ratios that were evaluated is presented in Table 5.
Pressure
The pressure that the foaming process took place at was applied in the same each
time. The pressure in the vacuum freeze dryer was controlled by opening and closing
manually actuated valves. Therefore, the pressure was not directly controlled, but the rate
of change in pressure was controlled. The process of changing the pressure within the
vacuum freeze dryer was done the same way for each sample. In this manner the liquid
slurry was forced to foam to the given volume of the mold as quickly as possible without
Table 5. The sample parameters for the foam volume expansion ratio study.

43
exceeding the given volume, by closing the valve slightly. Then the valve was held at a
constant position until the foam froze.
Density Measurements
One very important property for foam is the density and as shown earlier the
mechanical properties can be estimated using the relative density of foam. To evaluate
the density measurements, the volume dimensions were measured using digital calipers
(General Ultratech, Secaucus, NJ) with a resolution of 0.01mm. Samples were cut out of
bulk foam, into cylinders. The samples had a consistent diameter of 19mm and varying
heights. The tops and bottoms were flattened by cutting them using a razor blade. The
mass was measured using a Sartorius CPA225D digital scale (Sartorius, Gottingen,
Germany) with a resolution of 0.00001g. After all the necessary measurements were
taken density and relative density were determined using Equation 11 and Equation 2. In
Equation 1, ρ stands for density, while m stands for mass, and V stands for volume.
Equation 11
𝜌 =𝑚
𝑉
Microstructure
To characterize both the macrostructure and microstructure of the foam samples
imaging using light microscopy was utilized given the macro scale of the cell sizes. The
structure was analyzed using an Olympus BX41 light microscope (Olympus, Center
Valley, PA). The microscope can be seen in Figure 24. Dark field microscopy was

44
performed and samples were examined at different magnifications from 50x to 1000x.
Before imaging the samples were filled with fast curing mounting epoxy (Ted Pella,
Redding, CA) and cut into 4.5 mm thick sections to expose the cross section of the foam.
After cutting, the samples were sanded with 1200 grit sand paper and then polished with
a felt pad. After getting images, Equation 3 was utilized to determine the relative density.
Compression Testing
The mechanical properties of the foam were analyzed by performing compression
testing. While there is a standard testing procedure for honeycomb structures, but there is
no standard for compression testing of brittle foams (12, 20). To alleviate stress
concentration on the ceramic foam samples one end of the sample was capped with epoxy
and had a compliant layer of silicon pressing on the other end. This method has been
shown to create much cleaner test results (12) in low density foams. To ensure
consistency between samples, samples were cut from bulk foam to cylinders of 19 mm
diameters and roughly 17 mm heights. Then fast curing mounting epoxy (Ted Pella,
Figure 24. The Olympus BX41 light microscope utilized, with capability to 1000x.

45
Redding, CA) was applied to the bottom of each sample to create smooth a surface. After
the epoxy had cured the upper surface of the sample was flattened using a razor blade so
that the upper and bottom surfaces were parallel. The testing was done using an Instron
5543 (Instron, Norwood, MA) at a rate of 1mm/min. The sample holders were machined
from aluminum and had a diameter of 25.4 mm. Figure 25, shows the system used for
compression with a sample loaded into it. The sample holders were machined so that they
self-aligned. The sample holder was machined so that even if the sample was not flat the
loading fixture would tilt and apply the load evenly over the surface. Figure 25, illustrates
this feature while showing the compliant silicon layer and bottom epoxy layer.
Figure 25. Compression testing was done on a table top Instron. The maximum load that
can be applied for this Instron is 1kN.

46
Figure 26.The compression test set up is shown. The metallic ball aligns the loading
plate. The compliant silicon layer can be seen in orange, while the lower epoxy layer can
be seen touching the support plate.

47
RESULTS AND DISSCUSSION
Casting Parameters
Freeze foaming has a fairly large variability in formula parameters that will result
in a foam providing excellent tailor-ability of the process. Trials from the solids loading
study identified, that with a binder concentration at 0.3 and a foam volume expansion
ratio around 10, with a solids loading from 30% to 50% allowed for the formation of a
solid foam. Above the 50% solids loading, the solution was excessively viscous to ball
mill, for the given binder content. At 20% solids loading a foam was shown to form,
however during freezing the bubbles collapsed. Both the binder concentration and
viscosity were too low and right when the bubbles were forming the effects of drainage
became active and the bubbles collapsed due to thinning of the bubble walls. Below a
solids loading of 20% bubbles were not stable and would collapse upon formation. The
results of the solids loading study can be seen below in Figure 27.
Foam samples of 5%, 20%, and 30% solids loading were synthesized at different
binder concentrations to evaluate the effects the binder has on the foaming process. It
should be noted that the acrylic emulsion binder is not water soluble so the general
behavior of water is not being modified as would a soluble binder such as PVA, PEG, or
PPG. It was found that for a solids loading of 30% that the binder concentration ranging
from 0.3 to the maximum possible concentration of 1.13, above 1.13 the solids loading
would increase as well, allowed for the formation of stable foam. For foam samples with
a solids loading of 20% it was found that the binder concentration could range from 0.75

48
to 1.25 but below 0.75 a stable foam could not be formed. Lastly, a binder concentration
at or above 2.0 was able to form a stable foam with a solids loading of only 5%. However
upon sintering the foam structure collapse. The results of the binder concentration study
can be seen in Figure 28 and Figure 29.
The last parameter explored was the foam volume expansion ratio. It was found
that the expansion ratio can vary from 2 to 15 while forming a stable foam that could be
sintered. While a green state foam with an expansion ratio of 20 could be made, it did
collapse upon sintering. It was found that as the foam volume expansion ratio increased
the variation in pore size increased. The results of the foam volume expansion ratio study
can be seen in Figure 30.
Figure 27. Results of the solids loading study, where the sample numbers correlate
with Table 3. All of the samples are shown in the green state prior to high temperature
sintering.

49
The results from the parameter variation studies leads to some important insights
about the freeze foaming process and suitable processing formulations for freeze
foaming. First, for the bubbles to form the use of a binder is necessary. During regular
de-airing of ceramic slurries, without binder, the air escapes and causes the slurry to
appear as if it boiling. If there is a ceramic binder in the slurry the de-airing process is
very different. As seen in the standard de-airing process, and freeze foaming process, as
the pressure drops in the vacuum freeze dryer the pressure difference of the air within in
the slurry and surrounding environment causes the air to expand, forming bubbles, but
HA-12 adds some plasticity to the bubbles, causing them to be able to stretch and
withstand variations in pressure. Then the bubbles fill the mold and eventually reach a
Figure 28. Results of the binder concentration study for 5% and 20% solids loading,
where the sample numbers correlate with Table 4. All of the samples are in the green
state prior to high temperature sintering.

50
state of equilibrium where expansion stops. In addition, the use of an acrylic emulsion is
very important. Due to the fact that the acrylic emulsion is non-water soluble, by
definition, it does not interfere with the freezing properties of water. This process is
shown in Figure 31. Second, the ceramic slurry must have a high enough concentration of
binder. The interaction between the acrylic particles in the slurry allows for bubbles to
from, but to ensure that bubbles will form during the freeze foaming process a minimum
threshold must be met. Then bubbles will form at any concentration above this point. The
binder concentration must be high enough that the binder has an interconnected network
Figure 29. Results of the binder concentration study for 30% solids loading, where the
sample numbers correlate with Table 4. All of the samples are in the green state prior to
high temperature sintering.

51
throughout the ceramic slurry or the binder will not be able to allow for bubbles to begin
growing. Third, the ceramic slurry needs to have a high enough viscosity. The viscosity
of the slurry must be high enough to ensure that the walls and plateau borders in the
bubbles do not get too thin. When the bubbles grew too thin they collapsed, because the
liquid on the walls of the bubble stretch to the point that any interactions between
different particles cannot take place. Even though the bubbles in the freeze foaming
process are only liquid for a short time before they become frozen, the effects of drainage
must be limited. Surfactants help limit drainage by adsorbing at the air-water interfaces in
the foam limiting the mobility of liquid, but higher viscosity fluid does too this can be
seen in Equation 1, where the viscosity term is in the denominator of the PDE. Although
the viscosity levels were not measure directly it is known that the viscosity increases with
Figure 30. Results of the foam volume expansion ratio study for 30% solids loading with
30% binder concentration, where the sample numbers correlate with Table 5. All of the
samples are in the green state.

52
solids loading and higher binder concentrations. If the bubbles thin out too much during
the foaming process they would burst while freezing. Lastly, the ceramic particles cannot
get spread too far apart during the foaming or freezing step. If those three criteria are met
the Freeze foaming process will yield green foam structure as the process in Figure 30
shows. This can happen in two different ways first the slurry can begin with too few
particles in the slurry by having too low of a solids loading. The other way is during the
foaming process the foam can be too spread apart. Due to too high of foam volume
expansion ratio. In either situation even if a foam can make it through the sublimation
Figure 31. The bubble formation and freezing step are shown. Image 1 shows the slurry
and mold in the vacuum freeze dryer when expansion starts to take place. Image 2 shows
the formed bubbles and liquid slurry before freezing takes place. Image 3 shows the foam
part way through the freezing process. Image 4 shows the formed frozen foam.

53
process, particles will not be able to sinter together because the particles are too far apart
and unable to overcome the activation energy necessary to start sintering.
There is one parameter that was not altered due to system limitations, but it was
identified and the effects of it can be estimated. The effect of cooling rate was not
investigated. During the foaming and freezing process, the freeze bed in the vacuum
freeze dryer was set to the same value. This parameter was not investigated, because the
system would not be able to impact the structure of the ice. The freeze bed can reach to a
temperature of roughly -90°C, but to cause amorphous ice it would need to able to
achieve a temperature around -130°C (31). By decreasing the temperature of the vacuum
freeze dryer the effects of drainage could be limited, because the amount of time that the
foam is a liquid would decrease. Second, the effects of mold shape and design were not
examined.

54
Physical and Structural Properties
Examining the results from the processing variation changes in the
physical properties of various foam samples it was determined that freeze foaming
Figure 32. The different processing parameters yielded different types of foam ranging
from extremely porous open cell foam to a mixed cell foam.

55
yielded consistently high levels of porosity with large pores. In addition, binder
concentration, solids loading, and foam volume expansion ratio all affect porosity, pore
size and even foam type.
Looking at the cross sections of various foam samples it can be seen that the
structure varies drastically with alterations to the different processing parameters. In fact,
the foam transitions from an extremely porous open cell foam to a mixed cell foam.
Figure 32 shows the different types of foam synthesized using freeze foaming.
As the binder concentration increases the porosity level decreases. For a foam
with a solids loading of 30%, a binder concentration of 0.3, and a foam volume expansion
ratio of 10 a porosity of 93.9% was achieved. With the binder concentration increased to
0.5 the porosity dropped to 90.7% and the porosity decreased to 90.2% when the binder
concentration was raised to 0.7. In addition with an increase in binder concentration the
pore size also decreases. There is an increase in the number of small pores while large
pores are still formed. This suggests that higher binder concentrations reduces the effects
of coarsening. The average pore diameter achieved was 1487 µm, 1359 µm, and 1142 µm
for binder concentration of 0.3, 0.5, and 0.7. Figure 33 and Figure 34 show the changes in
porosity and pore size with changes in binder concentration.
Similarly for solids loading the same relationship is seen, but the affect is more
impactful. The porosity of the foam decreases from 93.9% to 91.1% and then 58.8% as
the solids loading increases from 30% to 40% and up to 50%. Also, the pore size
deceases with increased solids loading. At solids loadings of 30%, 40% and 50% the pore

56
sizes are 1487 µm, 1112 um, and 578 µm respectively. There results can be seen in
Figure 35 and Figure 36 that show the impact in variation of the solids loading.
Additionally, it was observed that as the foam volume expansion ratio increases a
peak porosity value is reached and where it plateaus. Foam with a foam volume
expansion ratio of 8 was observed to have a porosity of 85.3%. The porosity peaked at a
value of 93.9% with a foam volume expansion ratio of 10. Then the porosity decreased to
89.8% when the foam volume expansion ratio increased to 15. The same pore size
followed the same pattern where the average pore size was to be 1005 µm, 1487 µm, and
1118 µm for foam volume expansion ratios of 8, 10, and 15. Figure 37 and Figure 38
show the relationships of pore size and porosity versus foam volume expansion ratio.
Figure 33. Porosity as a function of binder concentration. All of the samples had a solids
loading of 30% and a foam volume expansion ratio of 10. The average porosity decreases
from 93.9% to 90.7% and 90.2% while binder concentration increases from 0.3 to 0.5
and 0.7.

57
Two different techniques were used to determine the porosity of three different
foam types. Digital calipers and light microscopy were used to measure the porosity of
foam types 30/0.7 – 10, 40/0.3 – 10, and 50/0.1 - 10. These two techniques, although
determining two different values for porosity, determined quite similar values of porosity
only having a maximum of 7% porosity difference. For all of the foams the caliper
method estimated higher porosity than the microscopy method. Figure 39 shows the
comparison of the two methods used to determine porosity.
The data from the physical and structural properties shows that to achieve the
highest porosity the binder concentration and solids loading should be minimized while a
foam volume expansion ratio of 10 should be used. In addition, the data shows that
different formulas can lead to different structures. The high range in porosity observed in
Figure 34. Pore size as a function of binder concentration. The pore size decreases from
1487 µm to 1359 µm and 1142 µm as the binder concentration increases from 0.3 to 0.5
and 0.7. All of the samples had a solids loading of 30% and a foam volume expansion
ratio of 10.

58
different foam types suggests that by altering casting parameters the foam can be tailored
easily. This highly advantageous capability means that by altering the solids loading,
binder concentration, and foam expansion volume ratio that the structure of the foam can
be altered. By altering the structural properties other properties, like mechanical
properties, can also be manipulated as well. The average pore size of the foams, made
through freeze foaming, ranges from 578 µm to 1487 µm, while the smallest pore size
achieved was 140 µm and the maximum pore size achieved was 2126 µm. The porosity
levels achieved ranged from 59% to 94%.
By comparing the porosity ranges and pore sizes achieved by freeze foaming to
the traditional processes it is seen that freeze foaming is comparable. Freeze foaming is
shown to even achieve porosity levels higher than that seen in direct foaming and replica
Figure 35. Porosity as a function of solids loading. The porosity decreased from 93.9%
to 91.1% with an increase in solids loading from 30% to 40%. Then the porosity dropped
to 58.8% to 50% solids loading. The binder concentration and foam volume expansion
ratio were held constant at 0.3 and 10.
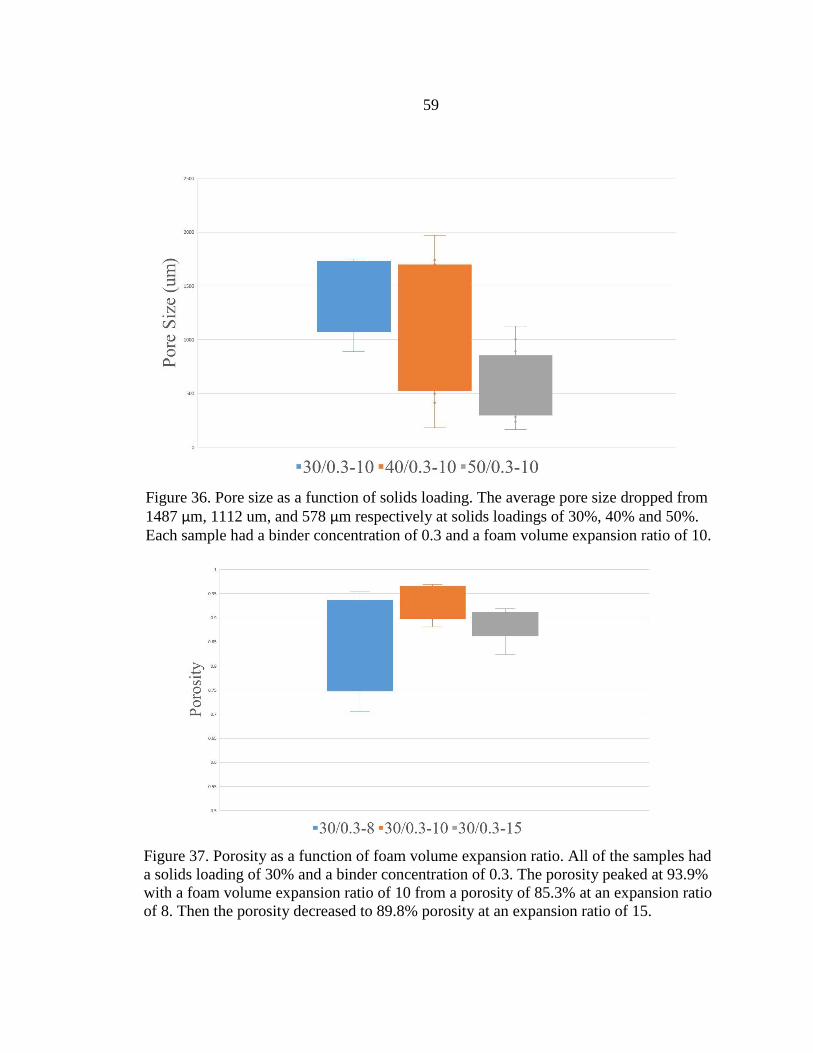
59
Figure 36. Pore size as a function of solids loading. The average pore size dropped from
1487 µm, 1112 um, and 578 µm respectively at solids loadings of 30%, 40% and 50%.
Each sample had a binder concentration of 0.3 and a foam volume expansion ratio of 10.
Figure 37. Porosity as a function of foam volume expansion ratio. All of the samples had
a solids loading of 30% and a binder concentration of 0.3. The porosity peaked at 93.9%
with a foam volume expansion ratio of 10 from a porosity of 85.3% at an expansion ratio
of 8. Then the porosity decreased to 89.8% porosity at an expansion ratio of 15.

60
templating. In addition the achievable pore sizes for freeze foaming is lower than replica
templating and higher than both direct foaming and sacrificial templating. The
comparison of freeze foaming to traditional techniques is shown in Table 6.
Figure 38. Pore size as a foam volume expansion ratio. The average pore size goes from
1005 µm to 1487 µm, and 1118 µm respectively at expansion ratios of 8, 10, and 15.
Each sample had a binder concentration of 0.3 and a solids loading of 30%.

61
Figure 39. The difference in porosity measurements for microscopy measurements and
caliper measurements. The largest difference between the two methods was at 30% solids
loading. There was a 7% difference.
Table 6. The porosity and pore size ranges of freeze foaming are compared to the
traditional synthesizing technique (24).

62
Mechanical Properties
Compression testing allowed for the mechanical properties of various foam
samples to be tested. Figure 40 shows the typical testing results for compression testing.
The foam samples that had a solids loading of 50% had two distinct test results. Half of
the samples had very low strength and moduli, while the other half had drastically higher
mechanical properties.
The compression test can be broken down into four different sections. The first
section is where the compliant layer compressed. The second section is where the actual
foam began compressing before it failed. In this section the elastic modulus was
Figure 40. Typical test results for the different foam sample types tested through
compression testing. The 50/0.1 – 10 foam had two distinct types of test results. Half of
the samples had very high strength while half had very low strength. They also had
substantially different relative densities.

63
determined by taking the slope of line right before the maximum local peak. Also, the
compressive strength was found by taking the local maximum peak value. In section
three progressive failure occurred, as is common with ceramics in compression (38).
Cracks would propagate through the struts of the foam causing chipping. Figure 41 shows
how progressive failure occurred in the foam samples and provides validation of the
progressive mode of failure observed in the stress-strain plots. The numerous ceramic
foam flakes shown in the figure accumulated on the Instron during just one compression
test. In addition, in the compression test results where large drops occurred
Figure 41. The effects of progressive failure resulted in ceramic foam chips flying off of
samples during compression testing.

64
instantaneously there was an audible cracking sound and ceramic chip directly observed
during the test. This progressive fracture continued all the way through the sample until
only the bottom epoxy infiltrated aluminum oxide foam remained intact. In section four,
the foam had already chipped all the way down to the epoxy cap and the epoxy-
aluminum oxide composite does not compress very much so a very steep peak occurs.
These four sections are highlighted in Figure 42.
Progressive failure has been observed in other brittle ceramic material systems.
Zhu and Tang (42) looked at the amount of acoustic emissions during compression
testing of rock. The results of the compression testing for rock had large drops in stress,
just like as observed in the foam samples, and associated with those drops there was
spikes in the counts of acoustic emissions. These increased acoustic emissions are
Figure 42. The four sections of the compression test are highlighted. Section one is
where the compliant silicon layer is compressing, section two is where compression of
the foam begins until the first failure begins, section three is where progressive failure
occurs, and section is where the epoxy-aluminum oxide composite begins being
compressed.
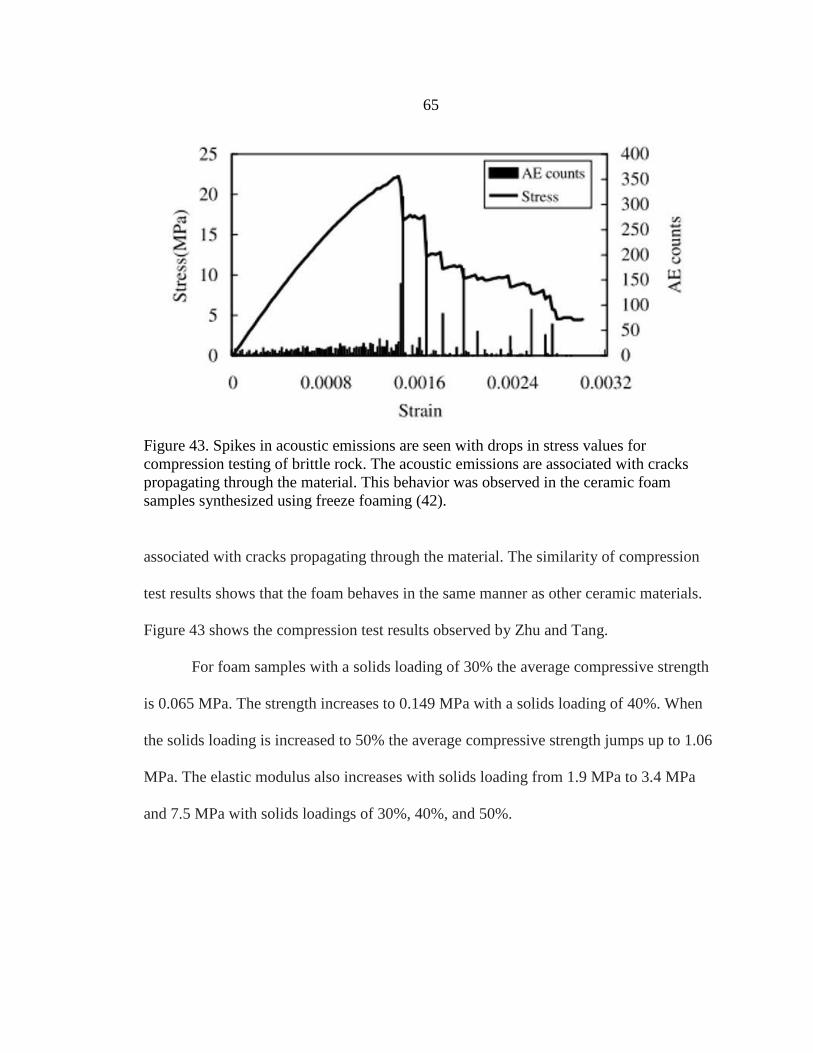
65
associated with cracks propagating through the material. The similarity of compression
test results shows that the foam behaves in the same manner as other ceramic materials.
Figure 43 shows the compression test results observed by Zhu and Tang.
For foam samples with a solids loading of 30% the average compressive strength
is 0.065 MPa. The strength increases to 0.149 MPa with a solids loading of 40%. When
the solids loading is increased to 50% the average compressive strength jumps up to 1.06
MPa. The elastic modulus also increases with solids loading from 1.9 MPa to 3.4 MPa
and 7.5 MPa with solids loadings of 30%, 40%, and 50%.
Figure 43. Spikes in acoustic emissions are seen with drops in stress values for
compression testing of brittle rock. The acoustic emissions are associated with cracks
propagating through the material. This behavior was observed in the ceramic foam
samples synthesized using freeze foaming (42).
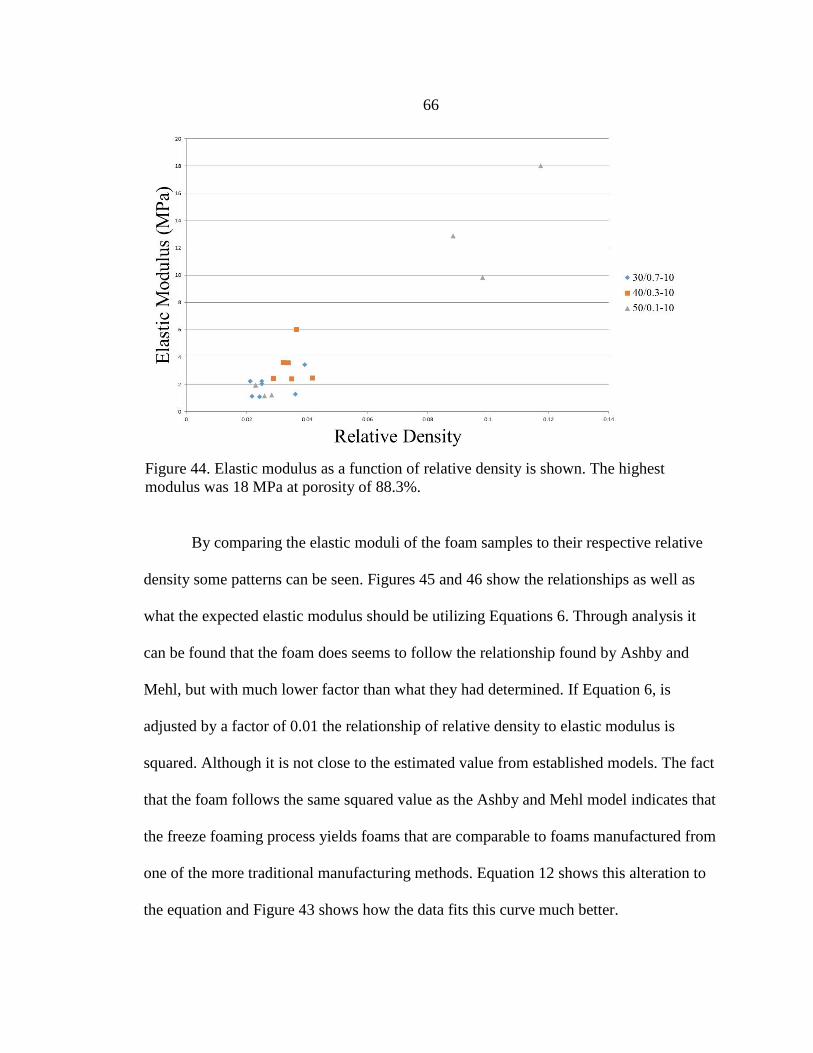
66
By comparing the elastic moduli of the foam samples to their respective relative
density some patterns can be seen. Figures 45 and 46 show the relationships as well as
what the expected elastic modulus should be utilizing Equations 6. Through analysis it
can be found that the foam does seems to follow the relationship found by Ashby and
Mehl, but with much lower factor than what they had determined. If Equation 6, is
adjusted by a factor of 0.01 the relationship of relative density to elastic modulus is
squared. Although it is not close to the estimated value from established models. The fact
that the foam follows the same squared value as the Ashby and Mehl model indicates that
the freeze foaming process yields foams that are comparable to foams manufactured from
one of the more traditional manufacturing methods. Equation 12 shows this alteration to
the equation and Figure 43 shows how the data fits this curve much better.
Figure 44. Elastic modulus as a function of relative density is shown. The highest
modulus was 18 MPa at porosity of 88.3%.

67
Equation 12
𝐸 = 0.01𝐸𝑆 (𝜌
𝜌𝑠)
2
This same relationship is observed with regards to compression strength. Where
the factor found by Ashby and Mehl, is drastically too high for the results observed. If the
factor in Equation 8 is adjusted from 0.65 to 0.065 the samples follow the same power
factor of 3/2 that they determined. This necessary adjustment can be seen in Equation 13,
while the relationship between compression strength and Equation 13 can be seen in
Figure 45. Elastic modulus as a funtion of relative density is shown with what the
expected modulus should be based off of the Ashby and Mehl model.

68
Figure 47. In addition, other research groups have found compressive strength of
aluminum oxide foam that is much lower than the Ashby and Mehl model and
comparable to values of foams made using freeze foaming. Luyten, et al. reported a
strength of 8 MPa with a porosity of 75% for aluminum oxide foam made by direct
foaming (16). Schumann and San-Miguel found a strength of 6 MPa with a porosity of
83% for aluminum oxide foam synthesized using direct foaming (41). These values are
seen in Figure 47, and show that the ceramic foam made through freeze foaming has
comparable strength to foams made using direct foaming.
As the structural and physical property analysis suggested the mechanical
properties of foam made through freeze foaming are adjustable. By increasing the solids
loading of the foam both the elastic modulus and compression strength can be improved.
Figure 46. Equation 12 shows a much better fit for elastic modulus as a function of
relative density.

69
In addition, although the factor did need to be adjusted the foam made through freeze
foaming did follow the model for ceramic foams that can be seen in the literature. Also,
progressive failure was observed through compression testing. This is known to be the
mechanism for compressive failure in brittle cellular solids. There is one aspect of the
compression data that is abnormal. Looking at the samples of 50/0.1 – 10 foam there is a
substantial difference in relative density between samples even though the samples went
through the same processing parameters.
Equation 13
𝜎𝑓∗ = 0.065𝜎𝑓 (
𝜌
𝜌𝑠)
3∕2
Figure 47. The relationship between compressive strength and relative density shows a
comparable trend to the Ashby and Mehl model with a reduction of a factor of ten,
Equation 13 (16,41).

70
Looking at how the Ashby and Mehl model was developed helps provide insight
into why the foam samples tested did not have mechanical properties equivalent to what
the Ashby and Mehl model predicts. First, all of the relationships developed, including
elastic modulus and compressive strength, were developed using the relationship of
relative density (Equation 2). Ashby and Mehl assumed that cellular solids have a
repeating structure that is a cube, while the structure observed in the foam consisted of a
network of struts in circular, oval, pentagonal, and hexagonal orientation in a spherical
configuration. The difference of foam structure between the Ashby and Mehl model and
observed structure are shown in Figure 48. The thickness and length of the foam structure
used to determine relative density are highlighted. This difference in structure would
result in different levels of porosity measurements which impact the estimated
mechanical properties.
Second, in the development of both the elastic modulus and compressive strength
data was collected from numerous sources. Then Ashby and Mehl plotted the data in a
Figure 48. The differences in the Ashby and Mehl model and observed structure of an
open cell foam are shown, which impact the relative density and mechanical properties
(38).

71
log-log domain with relative density on the x-axis and relative modulus or relative
compressive strength on the y-axis. Then the data was fit for a relationship. Looking at
the data that Ashby and Mehl used for their analysis of both elastic modulus and
compressive strength, shown in Figure 49 and Figure 50, there are some apparent
Figure 49. The data used for the Ashby and Mehl model is depicted with the line of fit
that was used to develop the relationship between relative modulus and relative density,
Equation 6 (38).

72
incongruities in the data leading to errors in their models. There is a lot of data that was
used to develop the relationship of elastic modulus and relative density, but as the relative
density drops below 0.1 and approaches 0.01 the data begins to spread apart and a linear
fit is not as clear as it is seen in higher relative densities. This is the same region where
the majority of the foam samples used for compression testing fell. The data used to
develop the model for elastic modulus is not precise when the relative density approaches
0.01. For the compressive strength data, the amount of data used to develop the model for
compressive strength is very limited and spans a limited relative density range. In,
addition the fit of the data does not appear to work well. There is two distinct regions in
the data and Ashby and Mehl fit the data with one equation as opposed to a split function
that would apply to two distinct domains. These discrepancies with the Ashby and Mehl
model help understand why the data collected does not fit the models already in the
literature. Moving forward with the development of ceramic foams improvments on the
Ashby and Mehl model needs to be made to link the experimental data to the theoretical
models.

73
Sintering Characteristics
Through observations using light microscopy the ability of the foam to sinter into
a microporous structure was explored. The majority of green state foams were able to
sinter in the struts while being able to maintain the macropourous structure. The only
Figure 50. The data used for the Ashby and Mehl model is depicted with the line of fit
that was used to develop the relationship between relative compressive strength and
relative density, Equation 8 (38).

74
foams that were not able to sinter properly had a solids loading of 5% with high binder
concentration of 2.0 and 3.0. The HA-12 decomposed during the pyrolysis process and
the ceramic particles were too spread apart and the structures collapsed from their own
weight. Similarly, with the foam sample with a high foam volume expansion ratio the
structure collapsed after pyrolysis. Again, once the HA-12 were removed from the
structure the ceramic particles were not sintered enough and the structure collapsed from
its own weight. The majority of green state foam were able to sinter properly.
Looking at the microstructure of various types of foam it was determined that
increased solids loading resulted in higher densification of the grains. In Figure 42 this
can be seen as a more uniform, flatter surface. As the solids loading decreases it is seen
that the grains of aluminum oxide are easier to spot and less necking has occurred
between particles. Interestingly, in the foam type 30/0.7 – 10 pores can be seen running
through the struts suggesting that as the foam froze ice crystals excluded the ceramic
particles and formed columns in the struts of the foam. These “large” gaps would be
impossible for the aluminum oxide particles to jump across, making it impossible for full
densification to be possible.
From the microstructure images, Figure 51, the foams that sintered the best were
the ones with higher solids loading. This makes sense from a sintering perspective,
because the particles would be closer together and diffusion between adjacent particles
would take less time to achieve and less energy input to overcome the activation energy.

75
Demonstration of Freeze Foaming with other Material Systems
The majority of the research was performed using aluminum oxide as a model
ceramic, but to show that this manufacturing process is applicable to other material
systems the freeze foaming process was utilized to synthesize yittria stabilized zirconia
(YSZ) foam, copper foam, and aluminum foam.
Yittria Stabilized Zirconia
There were no necessary changes necessary to create Yittria Stabilized Zirconia
(YSZ) foam. The powder used to create the foam was 8mol% Yittria Stabilized Zirconia
(Tosoh, Kaisei-Cho, Japan). The same dispersant Darvan C-N was utilized at 1.5 wt% (of
YSZ) and Rhoplex HA-12 binder was added to ensure proper foaming and stabilization
Figure 51. The microstructure of various types of foam shows how well each type of
foam densified. The higher solids loading foam samples have more necking and better
sintering in the microstructure. Foam type 30/0.7 – 10 has columns within the struts of
the foam where ice exclusion has made it impossible for struts to fully densify.
30/0.3 - 8 30/0.5 - 10 30/0.7 - 10
40/0.3 - 10 50/0.3 - 10 50/0.1 - 10

76
during the freezing process. Figure 52, shows the microstructure, macrostructure, and full
cross section of a sample of YSZ foam made using freeze foaming. It can be seen that the
foam has a very similar structure to the aluminum oxide foam. It is shown that freeze
foaming was able to make an open cell foam with large macroscopic pores and thin
struts. In addition, the foam was fully densified through a normal sintering profile like the
Figure 52. Successfully synthesized YSZ foam done by freeze foaming.
77
one used for the aluminum oxide foam, but it only went to a temperature of 1400°C.
There was one additional ingredient used for the YSZ foam. Xanthan gum, a natural
thickener, was added to the slurry. The YSZ foam had a solids volume ratio of 25%, a
binder concentration of 0.2, and 0.75wt% (of water) xanthan gum.
Metals
To demonstrate that freeze foaming is a robust process it was shown that the
process could be used to synthesis metallic foam as well as ceramic foam. Two different
types of metals were chosen; aluminum and copper.
To synthesize aluminum foam only one change was necessary. The dispersant
used was changed from Darvan-CN to Surfynol CT-234 (Air Products and Chemical,
Allentown, PA). The aluminum foam sample can be seen in Figure 43. To synthesize the
aluminum foam, 325 mesh aluminum powder (Alfa Aesar, Ward Hill, Ma) was mixed
into an aqueous solution at a solids loading of 30% and a binder concentration of 0.3 was
utilized. It can be seen that the aluminum foam has the large pores that has been observed
with alumina samples, Figure 53. It should be noted that for the sintering process, that the
aluminum sample was sintered in air. This caused some oxidation at the surface.
In the case of synthesizing copper foam three changes to the formula were done;
the dispersant was changed to Surfynol CT-324, a small amount of Xanthan gum was
added, and the binder was changed to Q-PAC 40. Q-PAC 40 (Empower Materials, New
Castle, DE) is a binder that is used in ceramic, metallic, and glass material systems that
contains polypropylene carbonate. It come in multiple forms, but the form used was an

78
aqueous emulsion. Copper foam was synthesized by using a 20% solids loading of 325
mesh copper powder (Alfa Aesar, Ward Hill, Pa), a xanthan gum at 1wt% (of water), and
0.5 binder concentration. During the sintering process, the copper foam was being
sintered in a reducing environment but air contamination occurred causing the sample to
oxidize. Interestingly enough the copper sample became covered in multiple oxidation
states instead of just one. The copper foam did form a similar structure to that seen in the
aluminum oxide foam, which can be seen in Figure 54.
Figure 53. Aluminum foam made using the freeze foaming process.
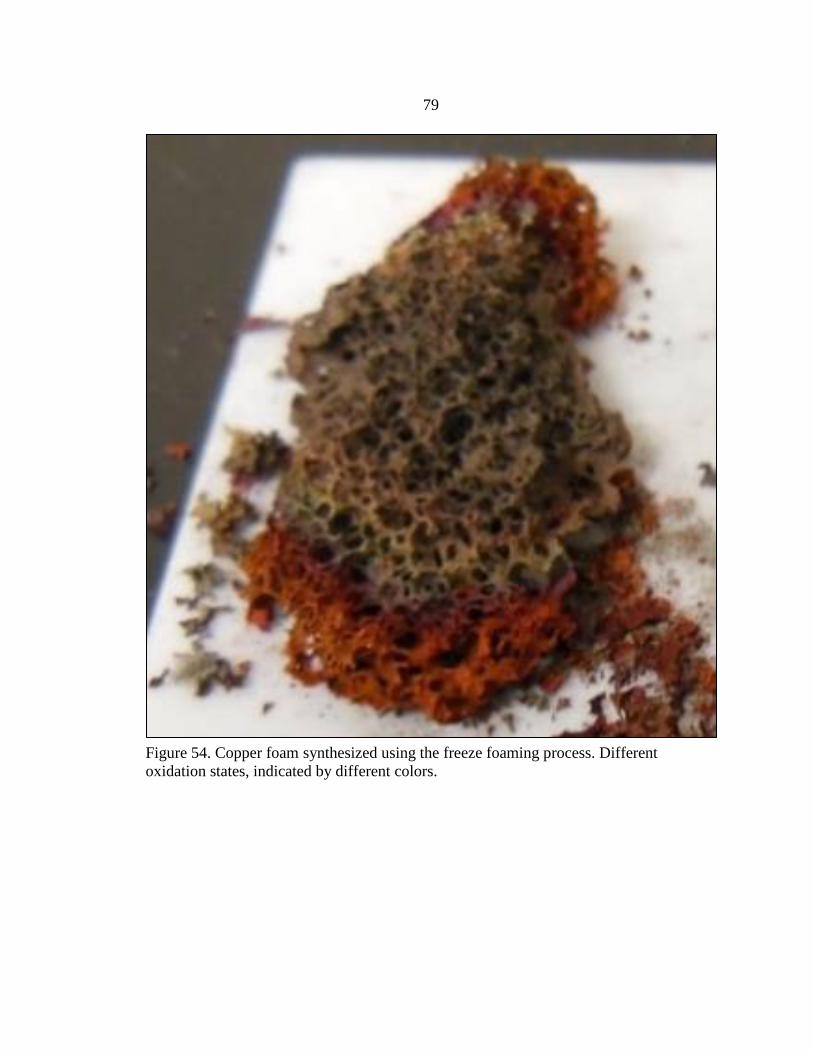
79
Figure 54. Copper foam synthesized using the freeze foaming process. Different
oxidation states, indicated by different colors.

80
CONCLUSIONS
The results of density measurements, compression testing, and light microscopy
show the potential of freeze foaming for the manufacturing of high porosity open cell
foams from 59 – 94% porosity. The results suggest freeze foaming to be a materials
flexible process that can be used to further develop the process for manufacturing non-
oxide ceramic and metallic foams.
It was shown that without increasing the viscosity, with additives, of the aqueous
slurry that foams could be made with a range of solids loading from 30% to 50%. Also,
with an increase in binder concentration the solids loading can be dropped down to 20%.
Foam structures were obtained as low as 5% solids loading, but upon sintering the
structures collapsed. It was determined that the slurry can be expanded to 15 times its
original volume while having the ability to be sintered. Through visual observations, the
pore size of lower expanded foams is more consistent, but the relative density of the foam
decreases with higher expansion ratios until it reaches a plateau at an expansion ratio of
10. It was also observed that both the elastic modulus and compressive strength increased
as a function of relative density.
Due to better sintering properties and mechanical properties while still having a
high degree of porosity ceramic slurries comprising of high solids loading and low binder
concentrations should be utilized moving forward in the development of freeze foaming.
The 50% solids loading foams only saw a decrease in porosity by 4% compared to the
30% solids loading foams, but had significantly high compressive strengths almost a
factor of 8 higher compared to foams with a solids loading of 40%. Additionally, the

81
elastic modulus increased by a factor of 2. The higher mechanical properties were a
result of better sintering of the alumina particles within the struts of the foam.
The freeze foaming process has the potential to impact the synthesis of ceramic
and metallic foams. Due to the near-net shaped, environmentally friendly, and
inexpensiveness of freeze foaming, this process could revolutionize ceramic and metallic
foams and see them being used in applications where they were unfeasible previously.
Future Work
For the continued development of freeze foaming there are two different studies
that would be beneficial to get more fundamental knowledge about the freeze foaming
process. This additional knowledge could help make freeze foaming be a wide spread
manufacturing technique for open cell ceramic and metallic foams. First, a rheology
study would be useful. Studying the effects of viscosity would help answer some
fundamental questions. It would help illustrate the effects of drainage during the foaming
process. A rheology study would help with understanding the fundamentals of bubble
formation in freeze foaming. In addition, how the ice is forming in the foam. Second,
how pressure influences the freeze foaming process would be beneficial. This study
would also be able to show insights into the fundamentals of bubble formation in freeze
foaming as well as drainage within the foam. A study into the effects of pressure would
also be able to help get freeze foaming being used in industry as this would need to be
used in machinery to ensure high quality and consistency in the manufacturing process.

82
REFERENCES CITED
(1) Huggins, Robert A. "Principles of Ceramics Processing, 2nd Edition: By James S.
Reed. John Wiley & Sons, Inc., New York, 1995, Pp. 658, Price $ 69.95."
Materials Research Bulletin 30.9 (1995): 1179-182. Web.
(2) “Montana Museum of Art & Culture.” Montana Museum of Art & Culture -
University Of Montana,
www.umt.edu/montanamuseum/exeventsschedule/pastexhibitions/2005-2006.php.
(3) “Zirconium Implants - Dr. Alison Kerns.” Sophia Health Institute, 26 Feb. 2017,
www.sophiahi.com/zirconium-implants/.
(4) Loff, Sarah. “April 29, 1990, Discovery Lands Following Hubble Deployment
Mission.” NASA, NASA, 29 Apr. 2015, www.nasa.gov/image-feature/april-29-
1990-shuttle-discovery-lands-following-hubble-deployment-mission.
(5) Orient-Electrical insulators, www.suspensioninsulator.com/technic/Electrical-
insulators.html.
(6) Mistler, Richard E., and Eric R. Twiname. Tape Casting: Theory and Practice.
Westerville, OH: American Ceramic Society, 2000. Print.
(7) Ashby, Michael, et al. Materials Engineering, Science, Processing and Design. 3rd
ed., Elsevier, 2014.
(8) Material Science and Engineering an Introduction 8th Edition, Callister/Rethwisch
(9) Sofie, Stephen. MTSI 501: Advanced Materials Science I. Fall 2017, Bozeman, MT,
Montana State University.
(10) Ashby Michael F, and Jones David R.H. Ceramics. In Engineering Materials 2 - An
Introduction to Microstructures and Processing, 2. 4th ed. Elsevier, 2013
(11) Kotz, John, et al. Chemistry & Chemical Reactivity. 8th ed., Brooks/Cole, Cengage
Learning, 2012.
(12) Mehr, Mehrad, et al. “Epoxy interface method enables enhanced compressive testing
of highly porous and brittle materials.” Ceramics International, vol. 42, no. 1,
2016, pp. 1150–1159. doi:10.1016/j.ceramint.2015.09.045.
(13) Kim, Lee, Han, and Park. "Control of Pore Size in Ceramic Foams: Influence of
Surfactant Concentration." Materials Chemistry and Physics 113.1 (2009): 441-
44. Web.
(14) Nishihara, Mukai, Yamashita, and Tamon. "Ordered Macroporous Silica by Ice
Templating." Chemistry of Materials 17.3 (2005): 683-89. Web.

83
(15) Gonzenbach, Urs T., André R. Studart, Elena Tervoort, and Ludwig J. Gauckler.
"Macroporous Ceramics from Particle‐Stabilized Wet Foams." Journal of the
American Ceramic Society 90.1 (2007): 16-22. Web.
(16) Luyten, Mullens, Cooymans, De Wilde, Thijs, and Kemps. "Different Methods to
Synthesize Ceramic Foams." Journal of the European Ceramic Society 29.5
(2009): 829-32. Web..
(17) Ahmad, Ha, and Song. "Particle-stabilized Ultra-low Density Zirconia Toughened
Alumina Foams." Journal of the European Ceramic Society 33.13-14 (2013):
2559-564. Web.
(18) Bienvenu, Yves. "Application and Future of Solid Foams." Comptes Rendus -
Physique 15.8-9 (2014): 719-30. Web.
(19) Saye, Robert I, and James A Sethian. "Multiscale Modeling of Membrane
Rearrangement, Drainage, and Rupture in Evolving Foams." Science (New York,
N.Y.) 340.6133 (2013): 720-4. Web.
(20) C28.04 Advanced Ceramics. "Standard Test Method for Flexural Strength of
Advanced Ceramics with Engineered Porosity (Honeycomb Cellular Channels) at
Ambient Temperatures." (2011). Web.
(21) Liu, Xiaoxing, Christrophe L. Martin, Didier Bouvard, Stéphane Di Iorio, Jérome
Laurencin, and Gérard Delette. "Strength of Highly Porous Ceramic Electrodes."
Journal of the American Ceramic Society 94.10 (2011): 3500-508. Web.
(22) Wucherer, Laurel, Juan C. Nino, Francesco Basoli, and Enrico Traversa. "Synthesis
and Characterization of BaTiO 3 ‐Based Foams with a Controlled
Microstructure." International Journal of Applied Ceramic Technology 6.6
(2009): 651-60. Web.
(23) Salvo, Martin, Suard, Marmottant, Dendievel, and Blandin. "Processing and
Structures of Solids Foams." Comptes Rendus - Physique 15.8-9 (2014): 662-73.
Web.
(24) Studart, André R., Urs T. Gonzenbach, Elena Tervoort, and Ludwig J. Gauckler.
"Processing Routes to Macroporous Ceramics: A Review." Journal of the
American Ceramic Society 89.6 (2006): 1771-789. Web.
(25) Hing, Karin A. "Bioceramic Bone Graft Substitutes: Influence of Porosity and
Chemistry." International Journal of Applied Ceramic Technology 2.3 (2005):
184-99. Web.

84
(26) Sepulveda, Pilar, F. S. Ortega, Murilo D. M. Innocentini, and Victor C. Pandolfelli.
"Properties of Highly Porous Hydroxyapatite Obtained by the Gelcasting of
Foams." Journal of the American Ceramic Society 83.12 (2000): 3021-024. Web.
(27) G. T. Chandrappa, Nathalie Steunou, and Jacques Livage. "Materials Chemistry:
Macroporous Crystalline Vanadium Oxide Foam." Nature 416.6882 (2002): 702-
702. Web.
(28) Bin LI, Yong Ya Wang, and Wen Qin Luo. "Preparation and Characterization of
Fe2O3-CaO-SiO2 Porous Glass Ceramics for Bacteria Immobilization."
Medžiagotyra 23.4 (2017): 356-61. Web.
(29) Seuba, Jordi, Sylvain Deville, Christian Guizard, and Adam J Stevenson.
"Mechanical Properties and Failure Behavior of Unidirectional Porous Ceramics."
Scientific Reports 6.1 (2016): 24326. Web.
(30) Young, F. Ronald., and Project Muse. Fizzics: The Science of Bubbles, Droplets,
and Foams. Baltimore, Md.: Johns Hopkins UP, 2011. Book Collections on
Project MUSE. Web.
(31) Chen, Jing-Yin, and Yoo, Choong-Shik. "High Density Amorphous Ice at Room
Temperature." Proceedings of the National Academy of Sciences of the United
States 108.19 (2011): 7685-7688. Web.
(32) Hunt, Clay. “Sintering in Ceramics and Solid Oxide Fuel Cells.” Montana State
University, 2017. Print.
(33) Szafran, Mikolaj, Agnieszka Szudarska, and Paulina Bednarek. "New Low Toxic
Water-Soluble Monomers for Gelcasting of Ceramic Powders." Advances in
Science and Technology 62 (2010): 163-68. Web.
(34) Lyckfeldt, and Ferreira. "Processing of Porous Ceramics by ‘starch Consolidation’."
Journal of the European Ceramic Society 18.2 (1998): 131-40. Web.
(35) Gonzenbach, Urs T., Andre R. Studart, Elena Tervoort, and Ludwig J. Gauckler.
“Ultrastable Particle-Stabilzed Foams.” Anglewandte Chemie International
Edition 45.21 (2006): 3526-530. Web.
(36) Han, Chang Dae. Polymer Processing (2007). Web.
(37) "Pilot Scale 2.5"-3.5" Tandem Extrusion System." Pilot Scale Tandem Extrusion.
N.p., n.d. Web.
(38) Ashby, M. F., and R. F. Mehl Medalist. "The Mechanical Properties of Cellular
Solids."Metallurgical Transactions A 14.9 (1983): 1755-769. Web.
85
(39) Darvan C-N; MSDS No. 13710; Vanderbilt Minerals, LLC: Norwalk, CT.
https://www.vanderbiltminerals.com/publicDocuments/SDS/13710_DARVAN-
CN_US_EN_VC-VM.pdf.
(40) Rhoplex HA-12; Rohm and Haas: Spring House, PA.
https://www.dow.com/assets/attachments/business/pbm/rhoplex_ha/rhoplex_ha_1
2/tds/rhoplex_ha-12.pdf.
(41) Schumann, M., and L. San-Miguel. "Fiber-Free Ceramic Insulation Foam for
Highest Temperatures - a New Generation of HSE-friendly Refractory Products
with Multiple Application Possibilities." Refractories WORLDFORUM (2017):
1-6. Web.
(42) Zhu, W. C., and C. A. Tang. "Micromechanical Model for Simulating the Fracture
Process of Rock." Rock Mechanics and Rock Engineering 37.1 (2004): 25-56.
Web.
(43) Jayasinghe, S.N., and M.J. Edirisinghe. "A Novel Method of Forming Open Cell
Ceramic Foam." Journal of Porous Materials 9.4 (2002): 265-73. Web.
(44) Hong, Changqing, Zhang, Xinghong, Han, Jiecai, Du, Jiancong, and Han, Wenbo.
"Ultra-high-porosity Zirconia Ceramics Fabricated by Novel Room-temperature
Freeze-casting." Scripta Materialia 60.7 (2009): 563-66. Web.
(45) Li, Peixu, Zhen Li, Luhui Zhang, Enzheng Shi, Yuanyuan Shang, Anyuan Cao,
Hongbian Li, Yi Jia, Jinquan Wei, Kunlin Wang, Hongwei Zhu, and Dehai Wu.
"Bubble-promoted Assembly of Hierarchical, Porous Ag2S Nanoparticle
Membranes." Journal of Materials Chemistry 22.47 (2012): 24721. Web.