FRCC System Disturbance and Underfrequency Load Shedding ...
54
1 FRCC System Disturbance and Underfrequency Load Shedding Event Report February 26 th , 2008 at 1:09 pm Final Report Issued by: FRCC Event Analysis Team October 30, 2008 Reviewed by: Operating Reliability Subcommittee October 31, 2008 Approved by: FRCC Operating Committee November 06, 2008
Transcript of FRCC System Disturbance and Underfrequency Load Shedding ...

1
FRCC System Disturbance
and
Underfrequency Load Shedding Event
Report
February 26th, 2008 at 1:09 pm
Final Report Issued by: FRCC Event Analysis Team October 30, 2008
Reviewed by: Operating Reliability Subcommittee October 31, 2008
Approved by: FRCC Operating Committee
November 06, 2008
2
Table of Contents
Section ................................................................................................................................... Page No.
Executive Summary I. Introduction ....................................................................................................................... 7
II. Conditions Prior to the Disturbance .................................................................................. 9 III. Disturbance Analysis ...................................................................................................... 11
1…Disturbance Report Task Force (FEAT) 11 2…Detailed Description of the Disturbance and Subsequent Event 16 3…Root Cause of the Disturbance and Initiation of the Event 19 4…Restoration Response Analysis 27 5…Additional Analysis 28
IV. Conclusions .................................................................................................................... 29 V. Summary of Observations and Recommendations ........................................................ 36 VI. Exhibits ......................................................................................................................... 50
A. FRCC Event Analysis Team (FEAT) Roster 51 B. FRCC Event Analysis Team (FEAT) – FRCC Regional Entity 54
Compliance Interface Guidelines
3
Executive Summary
FRCC System Disturbance and Underfrequency Load Shedding Event February 26th, 2008 at 1:09 pm
On Tuesday, February 26, 2008, the FRCC Bulk Electric System experienced a system disturbance that was initiated by delayed clearing of a three-phase transmission system fault that developed on a 138 kV switch located at one of FPL’s Miami area substations. Isolation of the fault led to the following event:
- The opening of 22 transmission lines 6 - 230 kV lines 15 - 138 kV lines 1 - 69 kV line
- The disconnection of approximately 1350 MW of customer load in the vicinity of the fault - The loss of approximately 2500 MW of generation near the fault location - The additional loss of approximately 2300 MW of distribution-level customers dispersed
across the southern part of Florida by the region’s automatic underfrequency load shedding program
- The loss of an additional 1800 MW of generation across the Region
The FRCC Operating Committee (OC), through its Operating Reliability Subcommittee (ORS), quickly convened a task force to analyze the event and ensure a thorough understanding of the causes and effects of the disturbance, and to ensure that any corrective actions, potential lessons learned or opportunities for improving future performance were incorporated into the FRCC Regional processes. The task force called the FRCC Event Analysis Team (FEAT) included industry subject matter and event analysis experts from several areas within the FRCC as well as from outside the Region. The FEAT also included observers from several regulatory bodies. The FEAT analysis consisted of seven parallel investigations of the different aspects of the disturbance and the subsequent event. The seven groups referred to as FEAT sub-teams and their analyses were used as the basis to produce this report. The observations and recommendations developed by these teams of experts are summarized in section IV of this report and make up the core of the corrective actions developed as a result of this study. The sub-team reports were also used to communicate preliminary results to the FRCC ORS and to support the FRCC’s role as a NERC Regional Entity and Compliance Monitor. The FEAT submits this report to the FRCC ORS and OC as a detailed description of the disturbance and subsequent event and to summarize the analysis efforts that took place. This report includes detailed conclusions, observations and twenty four (24) recommendations to prevent recurrence as well as enhance the future performance of the FRCC and other industry operating entities.
4
Analysis The disturbance was initiated by a transmission fault on a 138 kV switch at a substation in the Miami area. The 1350 MW of disconnected load concentrated in the area west of Miami was a result of remote clearing by the transmission lines connected to the substation where the fault occurred. Remote clearing of the fault was delayed resulting in the fault remaining on the system for 1.7 seconds. The long duration of the fault resulted in severely depressed voltages in the area leading to as-designed protective equipment trips of two nuclear generating units and one of the fossil units near the fault location. The long duration fault also resulted in an electromechanical power imbalance on the generators in south Florida resulting in large swings in frequency, power, and voltages across the Region. An initial upswing in frequency was followed by a downswing resulting in underfrequency load-shedding (UFLS) relay operations and distribution-feeder-level customer outages in areas from south Florida up to the central part of the State. The amplitude of the frequency swings and voltage perturbations were highest in southeast Florida and diminished at locations further north. The underfrequency load shedding occurred on the first step or set-point of the nine step FRCC UFLS program. The FRCC Bulk Electric System did not experience any system islanding and remained connected to the Eastern Interconnection throughout the disturbance. Except for the transmission line outages required to remotely clear the initial fault, some additional single-end operations in the vicinity of the fault and the opening of a radial line feeding the southern keys of Florida, the transmission system within the FRCC remained intact and did not experience any additional transmission line outages or overloads. Although the initial frequency and voltage swings damped within 10 seconds they still resulted in the loss of additional generation across the Region. All significant impacts related to the event were contained within the FRCC Region, although high resolution data collection (Phasor Measurement Unit (PMU) data) across the Eastern Interconnection provided data correlation on the inter-area oscillations that occurred as a result of the disturbance. The primary root cause of the frequency and voltage swings was the delayed (1.7 seconds) clearing of a transmission system fault that developed on a switch. The root cause of the delayed clearing for the fault was that an FPL field relay engineer manually removed from service the local primary protection and local back-up breaker failure protection on an energized piece of equipment. This action was taken while troubleshooting and diagnosing a malfunction on that equipment. Although it is noted that this was in conflict with existing documented maintenance practices related to this type of protection, it was also determined that there were insufficient procedures or policies in place for approval of these actions by either the direct supervision of the relay personnel or the system operations side of the organization. Two major contributing factors of the event were the component failure related to the 138kV switch contact mechanism that failed internally in a mode that made detection difficult and a failed
5
semaphore mechanism that was providing false information to the field engineer. Both of these items significantly contributed to the overall pre-event decision making process ultimately leading to the removal from service of the protection during the troubleshooting activities An in depth evaluation and assessment of the relay protection which resulted in the delayed clearing of the fault determined this equipment to be appropriate based on current industry practices. All protection systems on lines that contributed to the isolation of the fault operated as designed. The substation where the equipment was located is designed for local backup. This protection that allows for more rapid fault clearing thus limiting the number of customers affected, does not limit loading and is less susceptible to tripping for stable power swings; however this protection was removed from service. Although, it is far more important that procedures be instituted to prevent such manual actions as were taken, specific recommendations for protection system enhancements to prevent recurrence of this scenario were developed and a recommendation that an industry initiative be started to review additional backup relaying and possible design enhancements to limit the scope of extreme events on systems was made. Dynamic simulations and modeling of the transient response of the bulk system to the long duration fault and fault clearing process confirmed that the fault caused an electromechanical power imbalance on generators in south Florida and was the primary cause of the large swings in frequency, power, and voltage. The approximately 2273 MW of underfrequency load shedding that occurred was a direct result of this fault. The loss of transmission lines and customer load in the fault clearing process and the tripping of generating units affected the overall grid response, but their influence on the frequency swings was secondary to the effect of the fault. Transmission voltages were depressed throughout the southeast Florida area during the fault. These depressed voltages are instantaneously reflected in a reduction in the electrical MW output of the nearby generators. Because the turbine mechanical power changes slowly, the generator rotors are accelerated by the excess of mechanical input power over electrical output. This increase in generator rotor speed is also seen as an increase in local electrical frequency. With the fault isolated, the generator rotors were decelerated by the synchronizing strength of the transmission grid. For a stable response to an electrical fault, the synchronous generator rotor will have an increase in speed followed by a decrease in speed and perhaps several more swings as the generator achieves equilibrium. The electrical fault causes a perturbation in the grid’s electromechanical energy balance that is analogous to a spring suspended weight that is pulled and released. It was also determined that the underfrequency load shedding had a beneficial effect on the grid’s transient response and appears to have prevented the disturbance from developing into a more widespread event. During the disturbance and ensuing event, the loss of generation included seventeen (17) individual generators that made up eleven (11) different units including two (2) nuclear units and one (1) fossil unit near the fault location. The two (2) nuclear units tripped as designed for nuclear safety related
6
protection. One (1) combustion turbine had a pre-existing fuel valve problem. One (1) small 25 MW steam unit tripped due to a relay misoperation. Of the remaining thirteen (13) turbines that tripped, the analysis concluded that the trips were due to the plants’ response to either the low voltage transient or the frequency swing. Although four (4) of the turbines would not have been expected to remain online given the conditions experienced, eight (8) of the turbine trips were unexpected and due to either the generator auxiliary bus voltage protection or the rate of change in system frequency which can lead to a burner lean blowout phenomenon. The FRCC as well as NERC operating entities have been alerted to these potential machine behaviors in response to system transients since there are no specific performance guidelines or criteria currently in place for these areas. There were no other generation trips attributable to the disturbance outside the FRCC Region. A majority of the load shed on underfrequency was restored within one hour of the initiating event with all affected customers restored within approximately three hours of the initiating event. Although this was a very complex event that was not part of a normally postulated restoration scenario, restoration efforts by the FRCC Reliability Coordinator (RC) and the entities within its jurisdiction, were coordinated to ensure an orderly and stable restoration process without subjecting the FRCC Bulk Electric System or the Eastern Interconnection to any additional perturbations or reliability risks. The FEAT analysis does provide recommendations to improve the Regional response to potential future disturbances by re-affirming current procedures, improving the Regional response procedures and developing an additional monitoring tool for the FRCC RC. As discussed above, the overall system disturbance and ensuing event was initiated during troubleshooting activities. The nature of this event and the protective systems involved clearly rule out any cyber security breach as there was an on-site witness to the event. Furthermore most of the relays involved are electromechanical design without programming or communications capability that could be interfered with remotely or locally in any way. The event was explained by expected operations, given the status of the protection when the event started. The 24 recommendations that were developed addressed the specific causes of the event and offer general lessons-learned recommendations, three of which have already been shared with the industry through the NERC Reliability Advisory process.
7
I. Introduction On Tuesday, February 26th, 2008, the FRCC Bulk Electric System experienced a system disturbance that was initiated by an FPL transmission system element fault in the south Florida area. The disturbance resulted in an event that included:
- The opening of 22 transmission lines - The disconnection of approximately 1350 MW of customer load in the vicinity of the fault - The loss of approximately 2500 MW of generation in the vicinity of the fault - The additional loss of approximately 2300 MW of distribution level, underfrequency
customer load shedding scattered across the southern peninsular part of Florida - The loss of an additional 1800 MW of generation across the Region
The disturbance affected customers and generation across multiple FRCC companies and garnered widespread media coverage. The initial frequency and voltage perturbations damped within 10 seconds without any system islanding or separation of the FRCC from the rest of the Eastern Interconnection. All of the significant reliability impacts associated with the event occurred within the first minute of the disturbance and were contained within the FRCC Region. Restoration efforts were coordinated to ensure an orderly and stable restoration process without subjecting the Bulk Electric System to any additional perturbations or risks to reliability. A majority of the load shed on underfrequency was restored within one hour, with full restoration completed within three hours of initiation of the disturbance. Except for the transmission line outages required to remotely clear the initial fault, some additional single-end operations in the vicinity of the fault and the opening of a radial line feeding the southern keys of Florida, the transmission system within the FRCC remained intact and did not experience any additional transmission line outages or overloads. The FRCC Operating Committee, through its Operating Reliability Subcommittee (ORS), quickly convened a task force to analyze the event and ensure a thorough understanding of the causes and effects of the disturbance, and to ensure that any corrective actions, potential lessons learned or opportunities for improving future performance were incorporated into the FRCC Regional processes. The task force led by FRCC Regional staff, known as the FRCC Event Analysis Team (FEAT), included subject matter experts from various areas of the industry as well as event analysis experts and observers from several regulatory bodies. The core of the FEAT analysis consisted of seven parallel analyses of the different aspects of the disturbance and the subsequent event. The seven groups referred to as FEAT sub-teams and their analyses and reports were used as the basis to produce the overall analysis of the FRCC System Disturbance and Underfrequency Load Shedding Event Report and were also used to communicate

8
preliminary FEAT analysis results to the FRCC ORS and the FRCC Regional Entity Compliance department. The industry subject matter experts that made up the sub-teams developed the recommendations proposed by this analysis and ensured that a comprehensive and complete list of technically appropriate recommendations was developed, debated and proposed to the full FEAT membership. The FEAT is submitting this report to the FRCC Operating Committee as a detailed description of the disturbance and subsequent event and to summarize the analysis efforts that took place. The report also includes detailed conclusions, observations and recommendations to prevent recurrence as well as enhance the future performance of FRCC and other industry operating entities.
9
II. Conditions Prior to the Disturbance
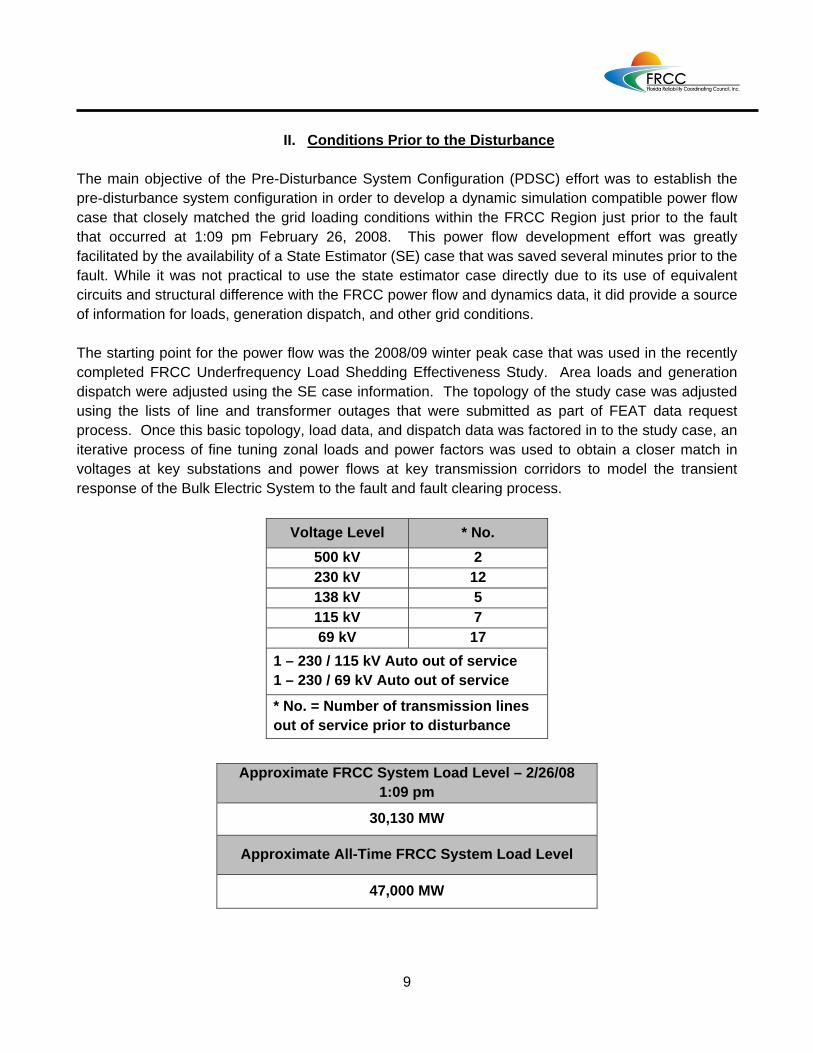
The main objective of the Pre-Disturbance System Configuration (PDSC) effort was to establish the pre-disturbance system configuration in order to develop a dynamic simulation compatible power flow case that closely matched the grid loading conditions within the FRCC Region just prior to the fault that occurred at 1:09 pm February 26, 2008. This power flow development effort was greatly facilitated by the availability of a State Estimator (SE) case that was saved several minutes prior to the fault. While it was not practical to use the state estimator case directly due to its use of equivalent circuits and structural difference with the FRCC power flow and dynamics data, it did provide a source of information for loads, generation dispatch, and other grid conditions. The starting point for the power flow was the 2008/09 winter peak case that was used in the recently completed FRCC Underfrequency Load Shedding Effectiveness Study. Area loads and generation dispatch were adjusted using the SE case information. The topology of the study case was adjusted using the lists of line and transformer outages that were submitted as part of FEAT data request process. Once this basic topology, load data, and dispatch data was factored in to the study case, an iterative process of fine tuning zonal loads and power factors was used to obtain a closer match in voltages at key substations and power flows at key transmission corridors to model the transient response of the Bulk Electric System to the fault and fault clearing process.
Voltage Level * No. 500 kV 2 230 kV 12 138 kV 5 115 kV 7 69 kV 17
1 – 230 / 115 kV Auto out of service 1 – 230 / 69 kV Auto out of service
* No. = Number of transmission lines out of service prior to disturbance
Approximate FRCC System Load Level – 2/26/08
1:09 pm
30,130 MW
Approximate All-Time FRCC System Load Level
47,000 MW

10
Comparison of the pre-contingency study model with recorded flows and voltages at key transmission interfaces yielded a close correlation between the study power flow and actual data for the major lines and transmission corridors compared. FRCC net import levels were matched to the SE solution in the model and were approximately 2814 MW. Comparison also demonstrated that the load distribution within the FRCC Region was adequately modeled. Consistent with the off peak conditions expected for the day, a number of generating units and transmission circuits were out of service for scheduled maintenance. Approximately 90 generating units were online at the time of the disturbance. The PDSC modeling analysis work served as the basis for the FRCC System Response Team (FSRT) analysis. There were no abnormal system conditions or significant contingency issues identified by the FRCC Reliability Coordinator (RC) or the FRCC next-day Operations Planning Coordinator (OPC) that could not be mitigated adequately.
11
III. Disturbance Analysis
1. Disturbance Report Task Force FRCC Event Analysis Team (FEAT) In accordance with the FRCC Disturbance Report Procedure and under a recommendation from the FRCC, the Chairman of the FRCC Operating Committee (OC) established that the disturbance warranted the preparation of a “Detailed System Disturbance Report”. The Chairman of the FRCC Operating Reliability Subcommittee (ORS) requested the formation of an Ad Hoc Task Force to review the disturbance and subsequent UFLS event and prepare a detailed report of the event. ORS requested that FRCC Regional staff lead the task force. Within 7 hours of the event, the FRCC ORS convened a special conference call to review the disturbance and establish the specific system parameters prior to the disturbance. The call also summarized system impacts due to the disturbance and identified potential causes. Within 12 hours of the event, FRCC staff initiated formal preliminary disturbance data collection and the FRCC operating entities began the event analysis process. Within 24 hours the Ad Hoc Task Force was formed by Regional staff. The FRCC Event Analysis Team (FEAT) was made up of appropriate FRCC committee, subcommittee and working-group leadership positions as well as event analysis subject matter experts. Subsequently, external subject matter experts from NERC Event Analysis as well as the neighboring SERC Region were included on the FEAT. Participants and observers from various other regulatory bodies were also included on the FEAT to provide the direct channels of communications without compromising the collection of sensitive data or the progress of the analysis. The roster of FEAT members, participants and observers is included as Exhibit A to this report. FRCC Regional Entity – Compliance Liaison Although the primary purpose of the FEAT and ensuing analysis was to ensure that the technical parameters, causes and effects of the disturbance were clearly understood so as to prevent recurrence in the future, the FEAT also provided a mechanism to support the FRCC’s role as a Regional Entity and compliance monitor. The FEAT established a process whereby the FEAT members and subject matter experts would support the FRCC compliance monitoring responsibility by providing analysis updates to a specific FRCC Compliance liaison regarding the progress of the analysis as well as the identification of any potential NERC Reliability Standards violations. The FEAT data collection process was extremely transparent to all members of the FEAT and a clear and open accounting of all entity responses was maintained. All requests for data issued by the FEAT received complete and appropriate responses by FRCC as well as other external operating entities. All data request responses
12
were conveniently available for inspection by all members of the FEAT as well as Regulatory observers through the use of the FRCC website. The FEAT participants were also specifically requested to provide any potential NERC Reliability Standards violations to the FEAT lead. The process was such that the FEAT lead was to provide any potential violations to the FRCC Compliance liaison to allow the confidential FRCC Compliance process to begin at any time during the analysis and run in parallel using the synergies of the FEAT process. There were no potential NERC Reliability Standards violations identified by the FEAT members or subject matter experts that resulted from this analysis. The FRCC Event Analysis Team (FEAT) – FRCC Regional Entity Compliance Interface Guidelines are included as Exhibit B to this report. FEAT Process and sub-teams Within three days of the disturbance, Florida Power and Light (FPL) publically disclosed preliminary indications on the cause of the event. Although a baseline understanding of the causes of the event were established, the FRCC FEAT proceeded with the technical analysis of the event in order to fully understand the response of the FRCC system to the initiating event, investigate some unexpected responses, confirm FRCC system models and identify any potential lessons learned from the disturbance.
Within five days of the disturbance, the FEAT had their initial formation conference call on Monday, March 3, 2008. This was an open meeting for FRCC operating entities to explain the FEAT process going forward. The initial face-to-face meeting of the FEAT was held on Monday, March 10, 2008, and was limited to the FEAT members who had signed appropriate confidentiality agreements regarding the potentially sensitive data being collected for analyzing the event. In order to expedite the analysis, the FEAT proposed a Regional Analysis Plan to address the discrete areas of analysis involved in this complex disturbance. The plan provided for parallel analysis of the various equipment involved and potential causes and impacts that occurred during the disturbance. The plan established specific teams of subject matter experts to perform the discrete areas of analysis. As described earlier, these teams, referred to as FEAT sub-teams, were provided specific scopes of analysis. Members of the FEAT as well as additional subject matter experts were recruited to populate the sub-teams that looked at individual areas of the event and provided an analysis back to the full FEAT membership. The sub-team analyses were used as the basis to produce the overall analysis of the FRCC System Disturbance and Underfrequency Load Shedding Event Report and were used to communicate preliminary FEAT analysis results to the FRCC ORS and the FRCC Regional Entity Compliance department.
13
The subject matter experts that made up the area sub-teams developed the recommendations being proposed by this analysis. The sub-teams were the initial vetting process to ensure that a comprehensive and complete list of technically appropriate recommendations was developed, debated and proposed to the full FEAT membership, based on the analysis that was performed. The core of the FEAT analysis revolved around seven parallel analyses of different aspects of the disturbance and subsequent event. The seven FEAT sub-teams were:
Pre-Disturbance System Configuration (PDSC) team Field Personnel Action Review Team (FPART) Protection Performance Evaluation Team (PPET) FRCC System Response Team (FSRT) Generator Response Team (GRT) Underfrequency Load Shedding Response Team (URT) Restoration Response Team (RRT)
The scope of each sub-team’s analysis is summarized below:
• Field Personnel Actions Review Team (FPART) The scope of the FPART analysis included the review of all field personnel actions and communications that led to the delayed clearing of the transmission system fault and subsequent initiation of the event.
• Protection Performance Evaluation Team (PPET)
The objective of the PPET was to evaluate the fault data and protection design and protection settings of the protection systems that led to the delayed clearing of the transmission fault that initiated the event. The PPET review included an evaluation of the appropriateness of protection, an evaluation of all relay mis-operations and an assessment of cyber security implications.
• FRCC System Response Team (FSRT) The main objective of the FSRT was to set baseline conditions based on pre-disturbance system parameters in order to establish an approximate model of the FRCC Bulk Electric System and subsequently model, reproduce, and analyze the transient response of the system to the initiating events of the disturbance. The scope of the response was primarily focused on analyzing the most severe portion of the frequency swings that occurred (within four seconds of the fault inception) to when the swings were effectively damped out (within the first ten seconds).
14
• Generator Response Team (GRT)
The objective of the GRT was to develop a comprehensive analysis on the generators that tripped as a result of the event and characterize the trips by cause. Additionally, the GRT was to make recommendations for changes to procedures, technical specifications, or further analytic work as they deemed appropriate.
• Underfrequency Load Shedding Response Team (URT) The main objective of the URT was to evaluate the Regional response of FRCC UFLS-connected load to the event to determine appropriateness of the response to the measured system transients. The URT was also charged to make recommendations for changes to procedures or further analytic work that may improve the effectiveness of the overall UFLS program.
• Restoration Response Team (RRT)
This main objective of the RRT was to analyze the Regional restoration activities that occurred after the event. The overall task analysis performed was used to evaluate communication, critique performance, identify deficiencies or areas for improvement, highlight positive observation, identify lessons learned, and recommend corrective actions to prevent or avoid recurrence of deficiencies in restoration in the future.
FEAT Interim Recommendations Report By mid-May, the FEAT had established some preliminary lessons learned, as well as identified some generation coordination anomalies that occurred coincident to the event. In light of the upcoming summer 2008 operating season and the start of the hurricane season, the FEAT decided to provide the FRCC community with a FEAT Interim Recommendations Report so that the FRCC Operating Committee (OC) could be proactive in addressing some of the potential lessons learned and potential areas for improvement identified by that time. The goal was to convey valuable information while continuing the analysis of the event. The FEAT Interim Recommendations Report was issued on May 29th, 2008. The Report provided six (6) recommendations to the FRCC OC and its associated operating entities. The recommendations identified potential areas for improvement, lessons learned and ways to improve future responses to system disturbances. The six recommendations contained in the interim report were endorsed by the FRCC OC and submitted to all FRCC operating entities in order to ensure that appropriate actions were taken regarding the recommendations. The FRCC OC also directed its subordinate groups to take actions in response to the recommendations. By June 26th, 2008, three of the recommendations were adopted by NERC and were propagated out to the full industry as three “Industry Advisories” via the NERC Alerts information dissemination process. The three recommendations are cross referenced to the recommendations being provided in this report.
15
FEAT Final Report The FEAT sub-teams completed the analyses of the event through the summer and began drafting the sub-team reports that analyzed the specific areas of the event. As the sub-teams completed their reports the FEAT began synthesizing the reports together and ensuring that the analysis was adequate and complete. The FEAT analysis culminated with the completion of seven sub-team reports that were approved by the FEAT and used as the basis for this report. Based on the sensitive technical and confidential content of the sub-team reports, release of the sub-team reports has been limited to specific groups based on the protections afforded by Critical Energy Infrastructure Information (CEII).

16
2. Detailed Description of the Disturbance and Subsequent Event On Tuesday February 26th, 2008, the FRCC Bulk Electric System experienced a system disturbance that was initiated by delayed clearing of a three-phase transmission system fault that developed on a 138 kV switch located at one of FPL’s Miami area substations. Isolation of the fault led to the following event:
- The opening of 22 transmission lines
6 - 230 kV lines 15 - 138 kV lines 1 - 69 kV line
- The disconnection of approximately 1350 MW of customer load in the vicinity of the fault - The loss of approximately 2500 MW of generation in the vicinity of the fault - The additional loss of approximately 2300 MW of distribution level, underfrequency
customer load shedding scattered across the southern peninsular part of Florida - The loss of an additional 1800 MW of generation across the Region
The 1350 MW of disconnected load concentrated in the area west of Miami was a result of the need to isolate the fault by relying on remote clearing by the transmission lines connected to the substation. The loss of generation was attributable to seventeen (17) individual generators that made up eleven (11) different units including the two (2) nuclear units and one (1) fossil unit at the Turkey Point plant site, the closest generating site to the fault location. Distribution feeder level customer outages initiated by FRCC’s underfrequency load shedding (UFLS) program relays were scattered across the peninsular part of Florida and affected geographic areas generally south of Jacksonville, Gainesville and Ft. White.
Remote clearing of the fault led to delayed clearing which resulted in the fault remaining on the system for 1.7 seconds. The long duration of the fault resulted in severely depressed voltages in the vicinity of the Turkey Point generating site which led to as designed protective equipment trips of the two nuclear generating units and one of the fossil units at that site. The fault also caused an electromechanical power imbalance on the generators in the South Florida area that resulted in large swings in frequency, power, and voltages that radiated northward through the Region. The peninsular nature of the Florida system coupled with the delayed clearing of the fault resulted in a damped, frequency swing, with initial amplitude of approximately +/- 0.6 Hz in Southeast Florida and +/- 0.3 Hz in Northeast Florida. The frequency swing (initiated by the acceleration of generation responding to the fault), along with the resulting voltage perturbations, radiated northward in the Region and resulted in additional fossil generation tripping off-line, primarily due to over-frequency impacts on combustion turbine fuel systems or low voltage impacts on generator auxiliary equipment.

17
Isolation of the fault allowed the influence of Eastern Interconnection frequency on the FRCC generation to re-strengthen and led to the rapid damping of the initial upswing in frequency. Damping resulted in a down swing in local system frequencies in the southern part of the Region which dipped into local underfrequency conditions. The amplitude of the frequency swing was highest in southeast Florida and diminished at locations further north as illustrated in Figure 1. The resultant damping of the frequency swings caused local system frequencies in the peninsular area of the FRCC to decrease below the FRCC underfrequency load shedding program step A and A’ set points which led to the subsequent actuation of underfrequency load shedding that affected several load serving entities across the southern parts of the Region.
Figure 1 - Measured frequency perturbation across the Region The initial frequency and voltage perturbations were damped within 10 seconds without separation of the FRCC Bulk Electric System from the rest of the Eastern Interconnection. All significant impacts related to the event contained within the FRCC Region, although high resolution data collection (Phasor Measurement Unit (PMU) data) across the Eastern
18
Interconnection provided data correlation on the inter-area oscillations that occurred as a result of the disturbance. The Region did not experience any system islanding and remained connected to the Eastern Interconnection throughout the disturbance. Except for the transmission line outages required to remotely clear the initial fault, some additional single-end operations in the vicinity of the fault and the opening of a radial line feeding the southern keys of Florida, the transmission system within the FRCC remained intact and did not experience any additional transmission line outages or overloads.
Although this was a very complex event that was not part of a normally postulated restoration scenario, restoration efforts were coordinated to ensure an orderly and stable restoration process without subjecting the FRCC Bulk Electric System or the Eastern Interconnection to any additional perturbations or reliability risks. A majority of the load shed on underfrequency was restored within one hour of the initiating event with all affected customers restored within three hours of the initiating event.
19
3. Root Cause of the Disturbance and Initiation of the Event The disturbance in this case was the delayed clearing of a 138 kV transmission system fault. This disturbance initiated all other actions that made up the event. The disturbance was directly attributable to the removal of all local primary protection and local back-up breaker failure protection on energized equipment while troubleshooting a 138 kV switch malfunction. In an attempt to time the opening of the switch and diagnose the malfunction, all local relay protection was manually removed and the energized switch was operated. During the opening operation of the switch an electrical arc developed across one of the disconnecting and stationary contact pairs on a single phase of the switch. The arc migrated to an adjacent piece of energized equipment causing a phase-to-phase electrical fault which subsequently migrated to ground and eventually to the third phase causing a full three-phase fault on the system. Because of the manual disabling of all local relay protection, the fault had to be isolated by relying on the remote clearing by the protection on transmission lines feeding the station. The root cause of the delayed clearing of the transmission system fault was that a field relay engineer manually removed from service, the local primary protection and local back-up breaker failure protection for an energized piece of equipment, while troubleshooting and diagnosing a malfunction on that equipment.
Although it is noted that this is in conflict with existing documented maintenance practices related to this type of protection, it is also noted that there were insufficient procedures or policies in place for oversight and/or approval of these actions by either the direct supervision of the relay personnel or the systems operations side of the organization. There is not a practical method available that can provide complete monitoring of trip circuits that include test switches. There must always be processes, procedures and controls in place to prevent removal of protection on energized equipment. Two major contributing factors to the event were the component failure related to the 138-kV switch contact mechanism which failed internally in a mode which made detection of the condition difficult as well as the failed semaphore mechanism that failed to actuate on loss of gas pressure therefore providing false information. Both of these items adversely contributed to the overall pre-event decision making process, which ultimately led to the removal of the protection from service during the troubleshooting activities. Post event analysis of the failed switch components found that a failed internal interrupting contact mechanism had caused one of the switch interrupters to fail in the closed position.
A “semaphore” in the context of this report is a red cylindrical indicator that protrudes on the side of the interrupter “bottle”. [The red cylinder is mechanically actuated to be visible externally and indicates if gas pressure within the interrupter is too low for normal interrupting action.]

20
There was also a coincidental failure of an internal pressure indicator (gas semaphore) identified. The failed semaphore had failed to actuate on loss of insulating gas pressure within the interrupter which if actuated would have likely halted all troubleshooting activities.
Figure 2 – Pre-Fault - Interrupter contact mechanism failed closed – disconnecting contact in closed position
Cause of Delayed Clearing Removal of all local protection resulted in remote clearing of the fault which took approximately 1.7 seconds to isolate. Although there was delayed clearing of the fault that developed on the system, all protection systems on lines that contributed to the fault operated as designed. Nine remote terminals cleared by using Zone 2 protection settings. Three remote terminals did not trip and required relaying behind these terminals (terminals further away from the fault) to operate and clear the fault. Although it would have been desirable to have these three terminals trip in clearing the fault faster, continuing changes in the line flows from the delayed and sequential clearing by other relay protection schemes in the area prevented the schemes for these three lines from operating. The Flagami substation is designed for local backup protection. Remote back-up protection settings become very complicated for transmission stations that have several lines and therefore inherently more sources for fault current. The local backup protection allows for
21
more rapid fault clearing, greatly limits the number of customers affected, does not limit loading and is less susceptible to tripping for stable power swings. Cause of the Event The long duration fault was the cause of the severely depressed voltages in the vicinity of the Turkey Point generating site. The Turkey Point Nuclear Units 3 and 4 appropriately tripped off-line by the Reactor Protection System (RPS) safety related bus under-voltage relays. The depressed voltages also caused the loss of an additional four (4) large frame combustion turbines trips that were initiated by plant protective devices on the plant auxiliary distribution bus that was determined to be set and operating “as designed”. A detailed review determined that due to the severity and duration of the voltage transient in south Florida, the affected Turkey Point combustion turbines would not have been expected to stay online regardless of aux bus protection settings. The total loss of generation at Turkey Point was approximately 2500 MW. The Initial Ten Seconds The fault had a large impact on the interconnected grid due to its location and long duration. It also caused large frequency, voltage and power swing transients on the power system. The most severe portion of these swings occurred within four seconds of the fault inception, with the swings damping out within the first ten seconds. The severe swings caused by the fault resulted in approximately 2273 MW of underfrequency load shedding (UFLS) and the additional loss of approximately 1800 MW of generating resources scattered across peninsular Florida.
Frequency Swing – Primary cause The primary cause of the underfrequency and over-frequency conditions experienced across the FRCC Region was the long duration fault. The loss of transmission lines and customer load in the fault clearing process and the tripping of generating units affected the overall grid response, but their influence on the frequency swings is secondary to the effect of the fault. Transmission voltages were depressed throughout the Southeast Florida area during the fault. These depressed voltages are instantaneously reflected in a reduction in the electrical MW output of the nearby generators. Because the turbine mechanical power changes slowly, the generator rotors are accelerated by the excess of mechanical input power over electrical output. This increase in generator rotor speed is also seen as an increase in local electrical frequency. With the fault isolated, the generator rotors were decelerated by the synchronizing strength of the transmission grid. For a stable response to an electrical fault, the synchronous generator rotor will have an increase in speed followed by a decrease in speed and perhaps several more swings as the generator reaches equilibrium. The electrical fault causes a perturbation in the grid’s electromechanical energy balance that is analogous to a spring suspended weight that is pulled and released.
22
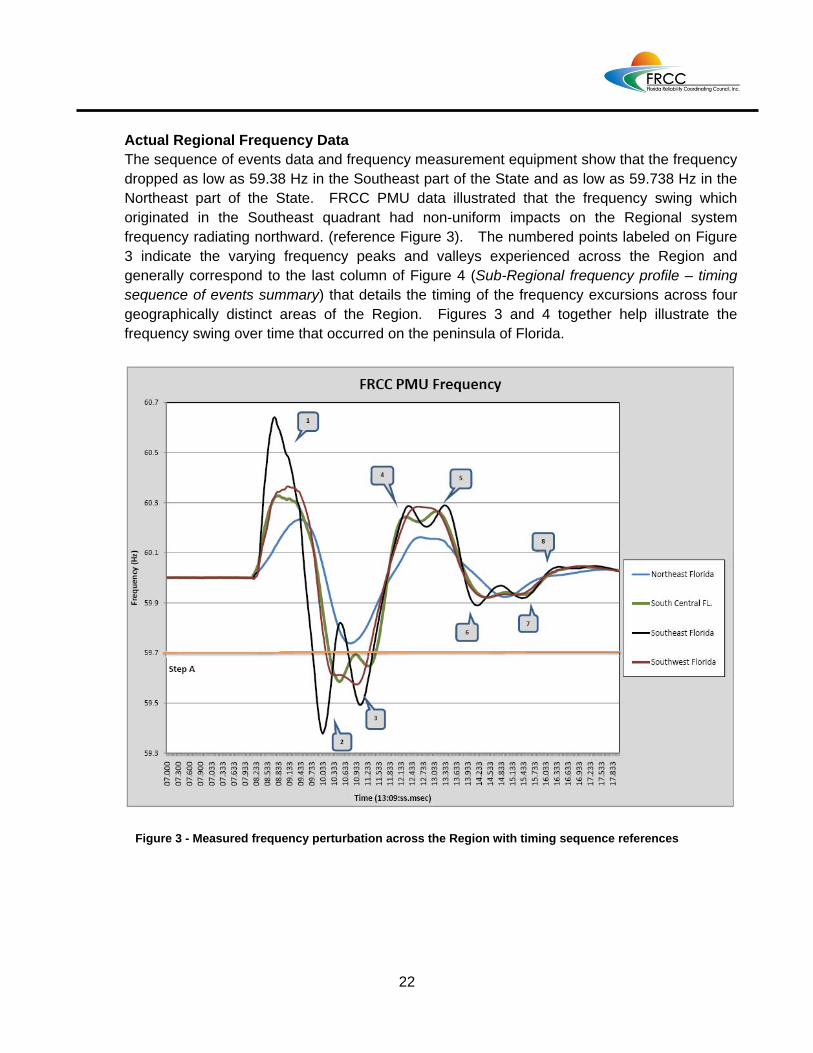
Actual Regional Frequency Data The sequence of events data and frequency measurement equipment show that the frequency dropped as low as 59.38 Hz in the Southeast part of the State and as low as 59.738 Hz in the Northeast part of the State. FRCC PMU data illustrated that the frequency swing which originated in the Southeast quadrant had non-uniform impacts on the Regional system frequency radiating northward. (reference Figure 3). The numbered points labeled on Figure 3 indicate the varying frequency peaks and valleys experienced across the Region and generally correspond to the last column of Figure 4 (Sub-Regional frequency profile – timing sequence of events summary) that details the timing of the frequency excursions across four geographically distinct areas of the Region. Figures 3 and 4 together help illustrate the frequency swing over time that occurred on the peninsula of Florida.
Figure 3 - Measured frequency perturbation across the Region with timing sequence references
23
Time 1:xx:xx.ms
Southeast Florida (Hz)
South- Central Florida (Hz)
Southwest Florida (Hz)
Northeast Florida (Hz)
Point
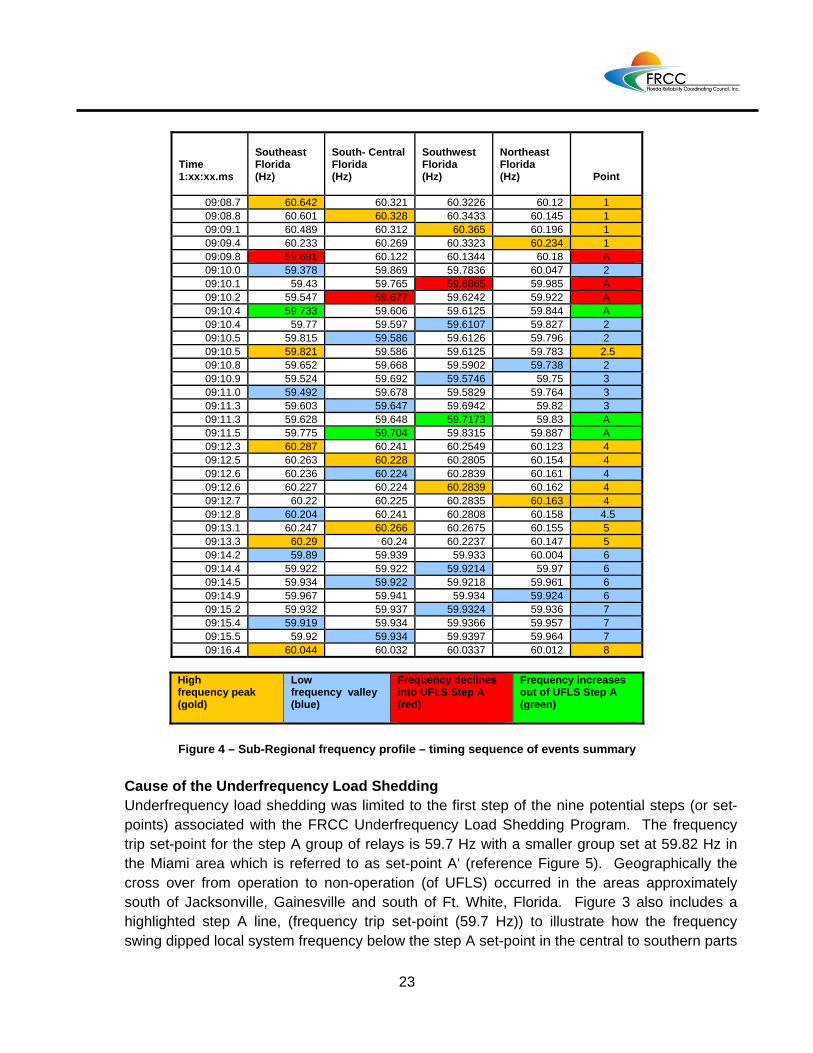
09:08.7 60.642 60.321 60.3226 60.12 1 09:08.8 60.601 60.328 60.3433 60.145 1 09:09.1 60.489 60.312 60.365 60.196 1 09:09.4 60.233 60.269 60.3323 60.234 1 09:09.8 59.691 60.122 60.1344 60.18 A 09:10.0 59.378 59.869 59.7836 60.047 2 09:10.1 59.43 59.765 59.6865 59.985 A 09:10.2 59.547 59.677 59.6242 59.922 A 09:10.4 59.733 59.606 59.6125 59.844 A 09:10.4 59.77 59.597 59.6107 59.827 2 09:10.5 59.815 59.586 59.6126 59.796 2 09:10.5 59.821 59.586 59.6125 59.783 2.5 09:10.8 59.652 59.668 59.5902 59.738 2 09:10.9 59.524 59.692 59.5746 59.75 3 09:11.0 59.492 59.678 59.5829 59.764 3 09:11.3 59.603 59.647 59.6942 59.82 3 09:11.3 59.628 59.648 59.7173 59.83 A 09:11.5 59.775 59.704 59.8315 59.887 A 09:12.3 60.287 60.241 60.2549 60.123 4 09:12.5 60.263 60.228 60.2805 60.154 4 09:12.6 60.236 60.224 60.2839 60.161 4 09:12.6 60.227 60.224 60.2839 60.162 4 09:12.7 60.22 60.225 60.2835 60.163 4 09:12.8 60.204 60.241 60.2808 60.158 4.5 09:13.1 60.247 60.266 60.2675 60.155 5 09:13.3 60.29 60.24 60.2237 60.147 5 09:14.2 59.89 59.939 59.933 60.004 6 09:14.4 59.922 59.922 59.9214 59.97 6 09:14.5 59.934 59.922 59.9218 59.961 6 09:14.9 59.967 59.941 59.934 59.924 6 09:15.2 59.932 59.937 59.9324 59.936 7 09:15.4 59.919 59.934 59.9366 59.957 7 09:15.5 59.92 59.934 59.9397 59.964 7 09:16.4 60.044 60.032 60.0337 60.012 8
Figure 4 – Sub-Regional frequency profile – timing sequence of events summary
Cause of the Underfrequency Load Shedding Underfrequency load shedding was limited to the first step of the nine potential steps (or set-points) associated with the FRCC Underfrequency Load Shedding Program. The frequency trip set-point for the step A group of relays is 59.7 Hz with a smaller group set at 59.82 Hz in the Miami area which is referred to as set-point A' (reference Figure 5). Geographically the cross over from operation to non-operation (of UFLS) occurred in the areas approximately south of Jacksonville, Gainesville and south of Ft. White, Florida. Figure 3 also includes a highlighted step A line, (frequency trip set-point (59.7 Hz)) to illustrate how the frequency swing dipped local system frequency below the step A set-point in the central to southern parts
High frequency peak (gold)
Low frequency valley (blue)
Frequency declines into UFLS Step A (red)
Frequency increases out of UFLS Step A (green)
24
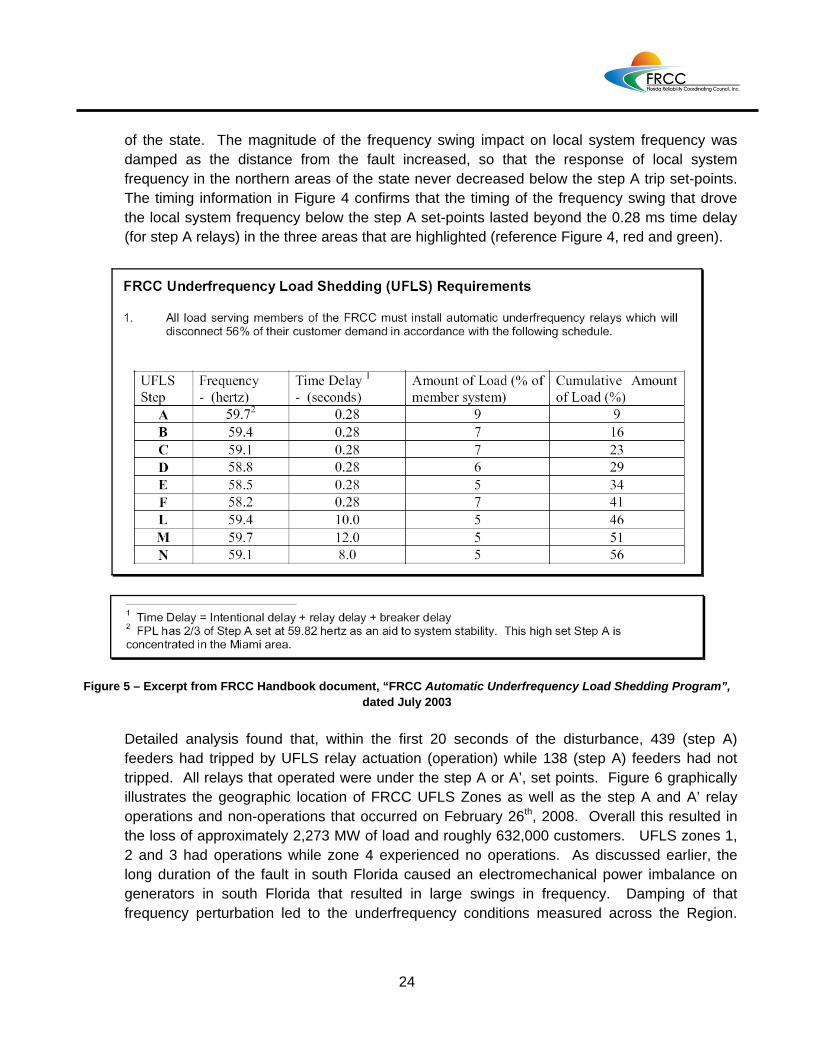
of the state. The magnitude of the frequency swing impact on local system frequency was damped as the distance from the fault increased, so that the response of local system frequency in the northern areas of the state never decreased below the step A trip set-points. The timing information in Figure 4 confirms that the timing of the frequency swing that drove the local system frequency below the step A set-points lasted beyond the 0.28 ms time delay (for step A relays) in the three areas that are highlighted (reference Figure 4, red and green).
Figure 5 – Excerpt from FRCC Handbook document, “FRCC Automatic Underfrequency Load Shedding Program”, dated July 2003
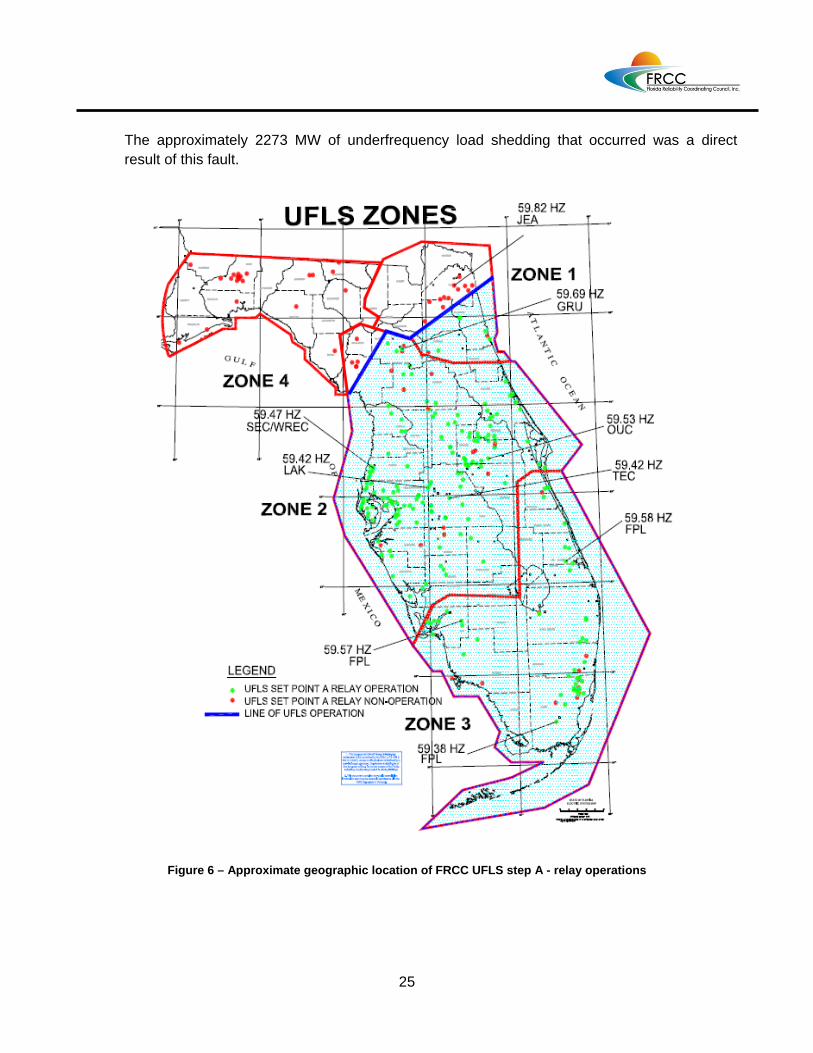
Detailed analysis found that, within the first 20 seconds of the disturbance, 439 (step A) feeders had tripped by UFLS relay actuation (operation) while 138 (step A) feeders had not tripped. All relays that operated were under the step A or A’, set points. Figure 6 graphically illustrates the geographic location of FRCC UFLS Zones as well as the step A and A’ relay operations and non-operations that occurred on February 26th, 2008. Overall this resulted in the loss of approximately 2,273 MW of load and roughly 632,000 customers. UFLS zones 1, 2 and 3 had operations while zone 4 experienced no operations. As discussed earlier, the long duration of the fault in south Florida caused an electromechanical power imbalance on generators in south Florida that resulted in large swings in frequency. Damping of that frequency perturbation led to the underfrequency conditions measured across the Region.
25
The approximately 2273 MW of underfrequency load shedding that occurred was a direct result of this fault.
Figure 6 – Approximate geographic location of FRCC UFLS step A - relay operations
26
Cause of the Generation Impacts The analysis included a review of the expected and unexpected generator responses to the disturbance across the FRCC Region. All generator trips within the Region that were initiated within one (1) minute of the disturbance were analyzed. Analysis was omitted for one (1) generator which was rated at less than 20 MW, and the steam turbines in combined cycle configurations which tripped due to their combustion turbines tripping, as these were deemed immaterial to the Event. There were no other generator trips within the rest of the Eastern Interconnection coincident or that resulted from the disturbance. The analysis reviewed seventeen (17) individual generators that tripped offline. The seventeen generators involved eleven (11) units. With the exception of the two (2) Turkey Point Nuclear units (steam turbines), one (1) combined cycle steam turbine in the Northeast and one (1) 25 MW steam unit in the southeast, all of the remaining thirteen (13) generators that tripped were combustion turbine based.
As noted earlier, the (2) Nuclear units tripped as designed for nuclear safety related voltage protection. One (1) of the combustion turbines tripped 30 seconds into the disturbance for a pre-existing fuel valve problem. One (1) 25 MW steam unit tripped due to a relay tap settings issue on a generator step-up transformer differential relay. Of the remaining thirteen (13) turbines that tripped ((12) combustion turbines and (1) steam unit), the analysis concluded that the trips were from the plants’ response to either the low voltage transients or the frequency perturbation. Although the Nuclear units tripped in response to the sustained low voltages in the vicinity of the fault, the trips were initiated by the Reactor Protection System and were therefore analyzed separately.
Auxiliary Bus Under-voltage Settings Five (5) large frame combustion turbines and one (1) combined cycle steam turbine trips were initiated by plant protective devices on the auxiliary (aux) bus or a plant distribution bus that was determined to be set and operating “as designed”. Aux bus protection schemes are focused on auxiliary equipment protection, and may not take into account the need for the plant to maintain synchronism during grid disturbances. Hence, aux equipment protection (specifically under-voltage relaying) may supersede generator protection during a system voltage perturbation. A review of the under-voltage settings on all the units (within the FRCC) reviewed revealed considerable differences in these aux bus under-voltage settings and a lack of specification of generator coordination objectives. The FEAT issued a specific recommendation on these findings.
Frequency Related Combustion Turbine Lean Blowout Six (6) large frame combustion turbines tripped during the disturbance when the system frequency went high (maximum 60.64 Hz as measured in the southeast area of the State and
27
60.23 Hz as measured in the Northeast area of the State). Preliminary analysis indicates that the trips were due to “lean blowout” of one or more combustors. In cases involving NOx control, the combustors normally run very lean. High compressor speeds combined with governor-commanded reduced fuel flow during the high frequency transient resulted in these “blowouts”. It is important to note that the frequency rate of change (df/dt) experienced during the Event was critical in turbine-generator response. Currently, existing guidelines for generator coordination address magnitude and duration of frequency excursions, but they do not address rate of change. As a result of the analysis in this area as well as the potential for this phenomenon to exist in other areas of the Interconnections, The FEAT issued a specific recommendation on these findings as well.
The remaining combustion turbine (1) tripped because the turbine control’s logic rate-of-change limiter for machine speed and output exceeded the set point in response to system frequency.
4. Restoration Response Analysis
Within twenty (20) seconds the FRCC Reliability Coordinator (RC) and the operating entities within its reliability area had encountered:
- A severe voltage excursion - The opening of 22 transmission lines - A over and under frequency perturbation - The disconnection of approximately 1350 MW of customer load in the vicinity of the fault - The loss of approximately 2500 MW of generation in the vicinity of the fault - The coincident actuation of approximately 2300 MW of distribution level, underfrequency
customer load shedding, scattered across the southern peninsular part of Florida - The loss of an additional 1800 MW of generation across the Region
These events were quickly recognized by the FRCC RC and the entities under its reliability authority. The FRCC RC and entities responded by replacing the lost generation resources, analyzing cause and effect of the disturbance through open communication via the FRCC Hotline and subsequently restoring transmission lines and underfrequency load that was tripped. Analysis of the restoration activities found that a majority of the affected load was restored within 1 to 2 hours of the disturbance. A post event task analysis of the restoration activities revealed that there was an undesirable condition (the near simultaneous occurrence of multiple system events) that significantly increased normal task demands and changed normal working environments for the FRCC Reliability Coordinator (RC) and entities under its reliability authority.
28
Considering the complexity of the Event and the number and variety of the events that occurred simultaneously, the FRCC RC and the operating entities under its reliability authority, responded well during the initial assessment and FRCC Bulk Electric System restoration activities. Restoration efforts were coordinated to ensure an orderly and stable restoration process without subjecting the Bulk Electric System to any additional perturbations or risks to reliability. The transmission system within the FRCC remained intact throughout the restoration process and did not experience any overloads. Data Analyzed Review of applicable Energy Management System (EMS) Alarms, Review of FRCC RC, Hotline communication voice recordings, and Review of other FRCC Event Analysis Team, sub-team data. After the data analysis the restoration response was critiqued using existing FRCC procedures and restoration documents as benchmarks. As a result of the FEAT analysis, and corresponding to the specific lessons learned, seven (7) recommendations were developed to improve future responses to disturbances of this type.
5. Additional Analysis
As discussed above, the overall system disturbance and ensuing event was initiated during troubleshooting activities. Removal of all local protection positioned the transmission system well beyond reasonable design parameters as well as beyond its expected operating contingencies. Although this led to a very severe disturbance and complex event, the cause was quickly identified, isolated and determined to be unrelated to external causes or attacks including cyber security. The nature of this event and the protective systems involved clearly rule out any cyber security breach as there was an on-site witness to the event. Furthermore most of the relays involved are electromechanical design without programming or communications capability that could be interfered with remotely or locally in any way. The event is explained by expected operations, given the status of the protection when the event started.
29
IV. Conclusions Substation Actions The primary root cause of the frequency and voltage perturbation that resulted in the February 26th, 2008 FRCC System Disturbance - Underfrequency Load Shedding Event was the delayed (1.7 seconds) clearing of a transmission system fault that developed on a 138 kV switch. The root cause of the delayed clearing for the fault was that an FPL field relay engineer manually removed from service, the local primary protection and local back-up breaker failure protection on an energized piece of equipment. This was done while troubleshooting and diagnosing a malfunction on that equipment. Although it is noted that this was in conflict with existing documented maintenance practices related to this type of protection, it was also determined that there were insufficient procedures or policies in place for oversight and/or approval of these actions by either the direct supervision of the relay personnel or the systems operations side of the organization. Upon notification of FPL’s public disclosure of the potential cause of the event being the disabling of relay protection back in March of 2008, the FRCC Operating Reliability Subcommittee immediately re-affirmed the FRCC policy regarding relay protection, requested companies to review internal relay maintenance practices and quickly propagated FPL’s public disclosure in order to prevent recurrence in other systems within the FRCC. The FEAT also provided a specific recommendation within the FEAT Interim Recommendations Report issued in May of 2008 that requested specific formal training regarding the FRCC policy document on relay protection, Relay Outage Coordination Procedure be performed within the Region. It was of critical importance to ensure that FRCC system operators and relay field personnel understand the intent and importance of the procedure when performing maintenance on FRCC Bulk Electric System elements. To date in excess of 500 individuals within the FRCC have been formally trained and tested on the policy. The individuals from 20 FRCC operating entities range from NERC certified system operators to utility relay field personnel. The FEAT has finalized several recommendations related to this root cause that address detailed corrective actions in order to prevent recurrence. Two major contributing factors to the event were the component failure related to the 138-kV switch contact mechanism which failed internally in a mode which made detection difficult as well as the failed semaphore mechanism which provided false information to the field engineer. Both these items significantly contributed to the overall pre-event decision making process, which ultimately led to the removal of the protection from service, during the troubleshooting activities. The FEAT has provided recommendations to propagate this information to the industry.
Appropriateness of Protection An in depth review of the relay protection which yielded delayed clearing of the fault was reviewed and assessed based on current industry practices. All protection systems on lines that contributed to the fault operated as designed. Nine remote terminals cleared by using Zone 2 protection settings.
30
Three remote terminals did not trip and required relaying behind these terminals (terminals further away from the fault) to operate and clear the fault. It would have been desirable to have these three terminals trip in clearing the fault faster. In the cases for the three lines, the three protection schemes almost operated, but continuing changes in the line flows from the delayed and sequential clearing by other relay protection schemes in the area prevented the schemes for these three lines from operating. The substation where the equipment was located is designed for local backup protection. Remote back-up protection settings become very complicated for transmission stations that have several lines and therefore inherently more sources for fault current. The local backup protection allows for more rapid fault clearing, it greatly limits the number of customers affected, does not limit loading and is less susceptible to tripping for stable power swings.
Having determined the appropriateness of the protection systems for the bus and shunt inductor at the substation, the event did provide insight that additional protection could be added to improve fault isolation, should there be the unlikely reoccurrence of a similar event. These specific protection system enhancements as well as a recommendation that an industry initiative be started to look at backup relaying and potential design enhancements to limit the scope of extreme events on systems, are included as recommendations. However, as noted in the section above, it is far more important that procedures be instituted to prevent such manual actions as were taken to disable the two levels of protection without sufficient review and approval by the System Operators and field supervision.
Other Relay Actions There were six other relay operations that occurred during or near the fault clearing process. These operations were evaluated for completeness; they did not adversely contribute to the isolation of the fault, contribute to additional load loss nor impacted restoration. One mis-operation was a result of an internal relay abnormality that would not have been detected under normal relay test procedures. The relay was replaced. The other five (5) operations were either; beyond practical study and were tolerable operations under the conditions caused by this fault or operated as expected and no further action was required. The Resulting Regional Disturbance The peninsular nature of the Florida system coupled with the delayed clearing of the fault resulted in a damped, frequency swing, with initial amplitude of approximately +/- 0.6 Hz in southeast Florida and +/- 0.3 Hz in northeast Florida (as measured on high resolution Phasor Measurement Units (PMUs) diversely located across the Region). The frequency swing, along with the resulting voltage perturbations, radiated up the Region and resulted in additional fossil generation tripping off-line. The initial frequency and voltage perturbations were damped within 10 seconds without separation of the FRCC Bulk Electric System from the rest of the Eastern Interconnection. All significant impacts related to the event were contained within the FRCC Region, although PMU data collection across the Eastern Interconnection provided data correlation on the inter-area oscillations that occurred as a result of the disturbance.
31
Dynamic simulations and modeling of the transient response of the Bulk Electric System to the transmission fault and fault clearing process were used to gain a better understanding of the frequency swings that resulted in the voltage and frequency perturbations that were measured across the Region. Simulation results confirmed that the primary cause of the underfrequency and over-frequency conditions experienced across the Region was the long duration fault. The loss of transmission lines and customer load in the fault clearing process and the tripping of generating units affected the overall grid response, but their influence on the frequency swings is secondary to the effect of the fault. Transmission voltages were depressed throughout the Southeast Florida area during the fault. These depressed voltages are instantaneously reflected in a reduction in the electrical MW output of the nearby generators. Because the turbine mechanical power changes slowly, the generator rotors are accelerated by the excess of mechanical input power over electrical output. This increase in generator rotor speed is also seen as an increase in local electrical frequency. With the fault isolated, the generator rotors were decelerated by the synchronizing strength of the transmission grid. For a stable response to an electrical fault, the synchronous generator rotor will have an increase in speed followed by a decrease in speed and perhaps several more swings as the generator reaches equilibrium. The electrical fault causes a perturbation in the grid’s electromechanical energy balance that is analogous to a spring suspended weight that is pulled and released. Analysis computer simulations of the event have led to several conclusions regarding performance of the transmission grid and modeling practices used for reliability studies: The simulation confirmed that the long duration of the fault (1.7 seconds) caused an electromechanical power imbalance on generators in South Florida which resulted in large swings in frequency, power, and voltage. The approximately 2273 MW of underfrequency load shedding that occurred was a direct result of this fault. The underfrequency load shedding had a beneficial effect on the grid’s transient response and appears to have prevented the disturbance from developing into a more widespread event. The dynamic load model developed in this analysis yielded a closer match to grid response than the static load model that is most frequently used in FRCC stability studies. Regional Generation Impacts The analysis reviewed seventeen (17) generators that tripped which involved ten (10) units. With the exception of the two (2) Turkey Point Nuclear units (steam turbines), one (1) combined cycle steam turbine in the Northeast and one (1) 25 MW steam unit in the southeast, all of the remaining thirteen (13) generators that tripped were combustion turbine based.
The (2) Nuclear units tripped as designed for nuclear safety related voltage protection and therefore no corrective actions are required. The one (1) combustion turbine that tripped 29 seconds into the

32
disturbance for a pre-existing fuel valve problem has been repaired and returned to service. The relay tap setting issue on the one (1) 25 MW steam unit that tripped has been corrected. Of the remaining thirteen (13) turbines that tripped, the analysis concluded that the trips were from the plants’ response to either the low voltage transient or the frequency perturbation. Although the Nuclear units tripped in response to the sustained low voltages in the vicinity of the fault, the trips were initiated by the Reactor Protection System and were therefore analyzed separately..
Auxiliary Bus Under-voltage Settings Five (5) large frame combustion turbines and one (1) combined cycle steam turbine trips were initiated by plant protective devices on the aux bus or a plant distribution bus that was determined to be set and operating “as designed”. A detailed review determined that due to the severity and duration of the voltage transient in south Florida, the four (4) affected combustion turbines in the vicinity of the fault would not have been expected to stay online regardless of aux bus protection settings. Aux bus protection schemes are focused on auxiliary equipment protection, but may not take into account the need for the plant to maintain synchronism during grid disturbances. The vast majority of motors can accommodate voltages of +/- 10%, handle starting voltages which dip to 70-80%, and operate at 75% of rated voltage for up to 60 seconds (EPRI EL-5036 Volume 8, “Station Protection”, page 8-70). A review of the under-voltage settings on all the units (within the FRCC) revealed considerable differences in these aux bus under-voltage settings and a lack of specification of generator coordination objectives. With respect to the FRCC Region, an N-1 event may result in transmission voltages (69kV and above) dipping to 90-95% (utility dependent). As a minimum, aux bus protection schemes should be coordinated with a region’s voltage criteria for an N-1 event. As a result of the findings in this area, the following recommendation was made:
FRCC Operating Committee issue an alert to all FRCC GOs/GOPs who own or operate large frame combustion turbines and request that the GOs/GOPs undertake a review of the design and settings for auxiliary and plant distribution under-voltage protection to ensure these settings appropriately coordinate with both: (1) the generator protection settings as described in the FRCC Handbook document, FRCC Generator Coordination Requirements, dated November 2001; and (2) the specific equipment’s protection requirements.
Frequency Related Combustion Turbine Lean Blowout Six (6) large frame combustion turbines tripped during the disturbance when the system frequency went high (maximum 60.64 Hz as measured in the southeast part of the State and 60.23 Hz as measured in the Northeast part of the State). As described in the analysis section, these trips were due to “lean blowout” of one or more combustors whereby high compressor speeds combined with governor-commanded reduced fuel flow during the high
33
frequency transient resulted in these “blowouts”. Although there are no existing guidelines for frequency rate of change (df/dt) for performance for generator coordination during frequency excursions, the event demonstrated that this is an important aspect of generator and system interaction that needs further evaluation. As a result of the findings in this area, the following recommendation was made:
FRCC Operating Committee issues an alert to all FRCC GOs/GOPs who own or operate large frame combustion turbines, to be aware of potential turbine combustor lean blowout under certain frequency excursions. We recommend that individual GOs/GOPs consult with appropriate combustion turbine manufacturers to understand their vulnerabilities with regard to lean blowout from a system frequency disturbance. In the absence of a frequency rate of change response criteria in the FRCC Generator Coordination Requirements document (dated November 2001 - FRCC Handbook), the GRT also recommends that the FRCC OC investigate the need for establishing a criteria.
For the single combustion turbine (1) that tripped because of the turbine control’s logic rate-of-change limiter for machine speed and output which was exceeded in response to system frequency, the owner has coordinated corrective actions and logic changes with the manufacturer. Although these generator impacts were undesirable during the disturbance, it is concluded that sixteen (16) of the seventeen (17) generators tripped appropriately or “as designed” although in a potentially unexpected manner. What is lacking, are specific design criteria to ensure that generator performance coordination occurs at all levels of generator manufacture, planning and installation. A frequency and voltage disturbance of this magnitude highlighted the need to continue efforts at understanding and accurately modeling interactions between generators and system conditions and ensuring that those interactions are as coordinated as possible. Where coordination is not possible for postulated system conditions, the system planning models should be updated to reflect the anticipated generator response. The FEAT has been proactive in addressing these issues by alerting the Region to these findings through two recommendations (detailed above) that were contained in the previously issued FEAT Interim Recommendation Report issued in May of 2008. This has also enabled NERC to propagate these findings to the industry as a whole as NERC Reliability Advisories. Regional Underfrequency Load Shedding The long duration fault resulted in an initial upswing in frequency that was followed by a down swing that resulted in step A underfrequency load shedding relay operations in areas from south Florida up to the central part of the state. The amplitude of the frequency swing was highest in southeast Florida and diminished at locations further north as illustrated in Figure 1. Initially there was some concern as to why the UFLS outages did not affect all FRCC Balancing Authorities uniformly. The partial actuation of UFLS was due to the frequency swing causing non-
34
uniform magnitude changes to local system frequencies damped as the swing radiated up the Region from south Florida. As discussed above and illustrated in Figures 3 and 4, the magnitude of the frequency valley never exceeded the step A trip set-point in the northeast quadrant of the state which corroborates that the partial non-actuation (or non-operation) of underfrequency load shedding across the Region was appropriate, particularly in the northern areas of the State. The data reviewed and the non-uniform frequency impact measured across the Region during the disturbance confirms that the actuation or operation (zones 1, 2 and 3) and non-operation (zone 4) of Regional UFLS relays was appropriate and consistent with the FRCC Automatic Underfrequency Load Shedding Program requirements. Of the 138 (step A) feeders that did not trip, at least 32 non-operations within zones 1, 2 and 3 appeared to be anomalous, which accounted for approximately (5.6 % of the target relay population). Based on the non-uniformity of the frequency swing as well as the diversity of the equipment and owners involved, there were no generic concerns with the overall effectiveness of the Regional UFLS response. In order to ensure a thorough and complete understanding of these exceptions, a recommendation is included that these anomalies be reviewed further by the appropriate FRCC group to determine if any other actions are necessary. The data along with the additional simulations performed of the event affirms that the frequency swing across the state would be expected for such a prolonged three-phase fault and that the UFLS program in place by the FRCC utilities performed as expected. The underfrequency load shedding had a beneficial effect on the grid’s transient response and appears to have prevented the disturbance from developing into a more widespread event and may have helped to contain the loss of additional load.

35
Simulation of Transmission Line Clearing and Generation Loss – Without a System Fault. To differentiate between the effects of the fault and the loss of generation on frequency, a simulation was run with the same sequence of transmission line and generator tripping except with no fault applied at the Flagami. The frequency response of this sensitivity simulation resulted in a much less severe impact on frequency. The load and generator loss modeled without a fault yielded a frequency swing from 60.13 to 59.73 hertz in the southeast area. Simulation with UFLS Relay Models Disabled – In order to assess the effect of the UFLS load shedding that occurred in response to the frequency swing, disabling of UFLS relay models was simulated. This lack of UFLS load shedding in response to the frequency swing greatly aggravates the power and voltage swings at the FRCC/SERC transmission interface. The power and voltage swings exceed the trigger levels for the FRCC’s controlled islanding special protection scheme (SPS) and lead to intended separation of the FRCC from the Eastern Interconnection. Frequency response for the shows frequency dips to 59.1 hertz in Northeast Florida at the time of separation. Following separation, the average Florida frequency dips to just below 59.4 hertz and recovers to approximately 59.8 hertz after 2265 MW of load is shed by UFLS relay models. These UFLS models are mostly Step B (59.4 hertz set-point) and some of the Step A models (59.7 hertz set-point).
These additional sensitivity scenario simulations confirmed that the underfrequency load shedding that occurred was primarily due to the delayed clearing of the transmission fault. The simulations also indicate that the FRCC UFLS program had a beneficial effect on the grid’s transient response to the fault and appears to have prevented the disturbance from developing into a more widespread event.
Restoration Restoration efforts were coordinated to ensure an orderly and stable restoration process without subjecting the FRCC Bulk Electric System or the Eastern Interconnection to any additional risk or perturbations. Considering the complexity of the disturbance and resulting event as well as the short window of time in which the events occurred, the FRCC Reliability Coordinator and the operating entities under its reliability authority, responded well during the initial assessment and FRCC Bulk Electric System restoration activities. The post event analysis did yield several lessons learned and resulting recommendations to improve restoration processes in the future.
36
V. Summary of Observations and Recommendations
37
Summary of Observations and Recommendations
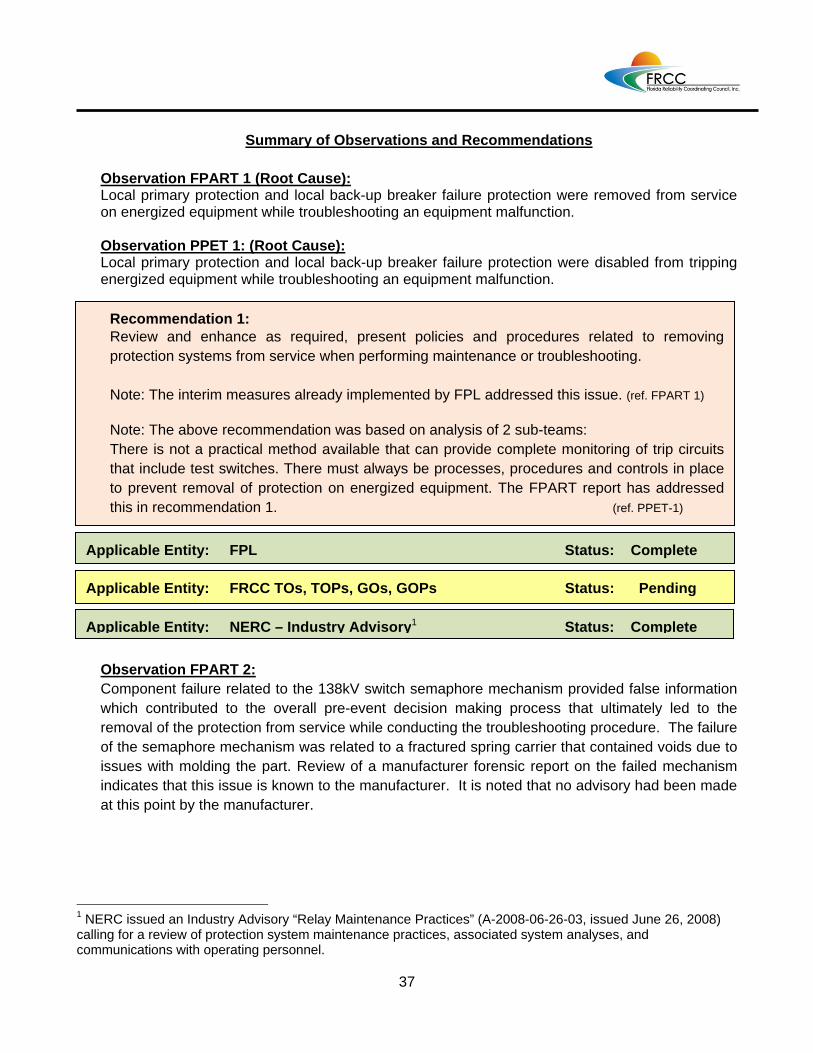
Observation FPART 1 (Root Cause): Local primary protection and local back-up breaker failure protection were removed from service on energized equipment while troubleshooting an equipment malfunction. Observation PPET 1: (Root Cause): Local primary protection and local back-up breaker failure protection were disabled from tripping energized equipment while troubleshooting an equipment malfunction.
1 Observation FPART 2: Component failure related to the 138kV switch semaphore mechanism provided false information which contributed to the overall pre-event decision making process that ultimately led to the removal of the protection from service while conducting the troubleshooting procedure. The failure of the semaphore mechanism was related to a fractured spring carrier that contained voids due to issues with molding the part. Review of a manufacturer forensic report on the failed mechanism indicates that this issue is known to the manufacturer. It is noted that no advisory had been made at this point by the manufacturer.
1 NERC issued an Industry Advisory “Relay Maintenance Practices” (A-2008-06-26-03, issued June 26, 2008) calling for a review of protection system maintenance practices, associated system analyses, and communications with operating personnel.
Recommendation 1: Review and enhance as required, present policies and procedures related to removing protection systems from service when performing maintenance or troubleshooting. Note: The interim measures already implemented by FPL addressed this issue. (ref. FPART 1) Note: The above recommendation was based on analysis of 2 sub-teams: There is not a practical method available that can provide complete monitoring of trip circuits that include test switches. There must always be processes, procedures and controls in place to prevent removal of protection on energized equipment. The FPART report has addressed this in recommendation 1. (ref. PPET-1)
Applicable Entity: FPL Status: Complete
Applicable Entity: FRCC TOs, TOPs, GOs, GOPs Status: Pending
Applicable Entity: NERC – Industry Advisory1 Status: Complete
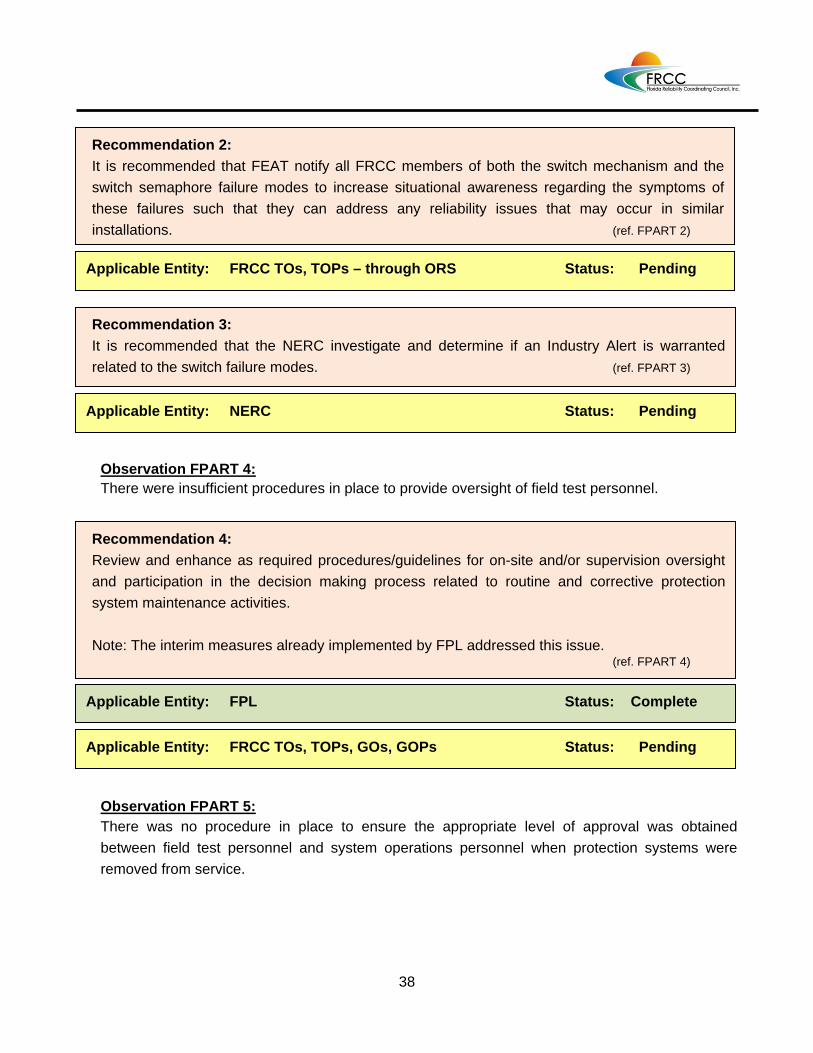
38
Observation FPART 4: There were insufficient procedures in place to provide oversight of field test personnel.
Observation FPART 5: There was no procedure in place to ensure the appropriate level of approval was obtained between field test personnel and system operations personnel when protection systems were removed from service.
Recommendation 2: It is recommended that FEAT notify all FRCC members of both the switch mechanism and the switch semaphore failure modes to increase situational awareness regarding the symptoms of these failures such that they can address any reliability issues that may occur in similar installations. (ref. FPART 2)
Recommendation 3: It is recommended that the NERC investigate and determine if an Industry Alert is warranted related to the switch failure modes. (ref. FPART 3)
Recommendation 4: Review and enhance as required procedures/guidelines for on-site and/or supervision oversight and participation in the decision making process related to routine and corrective protection system maintenance activities. Note: The interim measures already implemented by FPL addressed this issue. (ref. FPART 4)
Applicable Entity: FRCC TOs, TOPs – through ORS Status: Pending
Applicable Entity: NERC Status: Pending
Applicable Entity: FPL Status: Complete
Applicable Entity: FRCC TOs, TOPs, GOs, GOPs Status: Pending
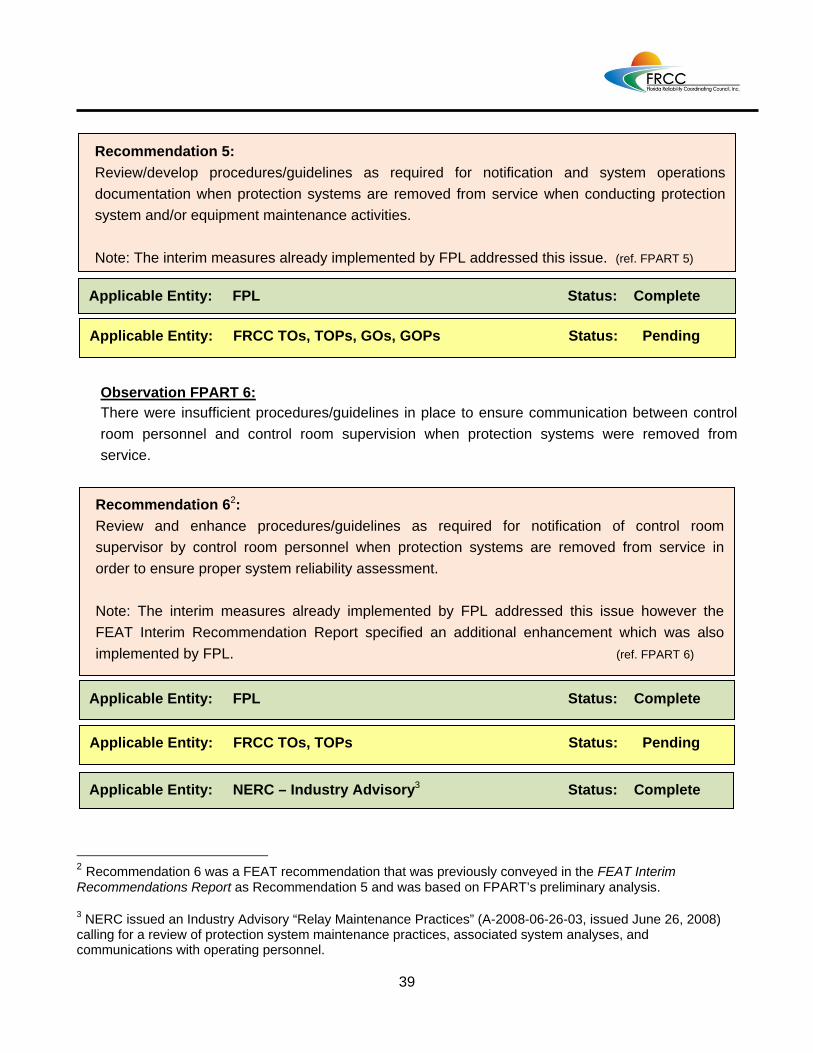
39
Observation FPART 6:
There were insufficient procedures/guidelines in place to ensure communication between control room personnel and control room supervision when protection systems were removed from service.
Recommendation 62
3
2 Recommendation 6 was a FEAT recommendation that was previously conveyed in the FEAT Interim Recommendations Report as Recommendation 5 and was based on FPART’s preliminary analysis. 3 NERC issued an Industry Advisory “Relay Maintenance Practices” (A-2008-06-26-03, issued June 26, 2008) calling for a review of protection system maintenance practices, associated system analyses, and communications with operating personnel.
Recommendation 5: Review/develop procedures/guidelines as required for notification and system operations documentation when protection systems are removed from service when conducting protection system and/or equipment maintenance activities. Note: The interim measures already implemented by FPL addressed this issue. (ref. FPART 5)
Recommendation 62: Review and enhance procedures/guidelines as required for notification of control room supervisor by control room personnel when protection systems are removed from service in order to ensure proper system reliability assessment. Note: The interim measures already implemented by FPL addressed this issue however the FEAT Interim Recommendation Report specified an additional enhancement which was also implemented by FPL. (ref. FPART 6)
Applicable Entity: FPL Status: Complete
Applicable Entity: FPL Status: Complete
Applicable Entity: FRCC TOs, TOPs, GOs, GOPs Status: Pending
Applicable Entity: FRCC TOs, TOPs Status: Pending
Applicable Entity: NERC – Industry Advisory3 Status: Complete
40
Observation FPART 7: A 25 MW unit was tripped during the disturbance due to a differential relay that had been left in a ‘testing configuration’ after routine protective system maintenance. This equipment was not restored to the original operating configuration.
Observation PPET 2: The Turkey Point – Flagami – Galloway 230kV three-terminal line uses direct transfer trip for breaker failure and pilot schemes for line protection yet there is no transfer trip of all terminals for operation of backup protection. The Turkey Point terminal operated at 0.93 seconds, while the Galloway terminal and the Flagami terminal did not operate.
Observation PPET 3: The electromechanical relaying at Miami on the 230kV lines to Flagami have inherent limitations and could not clear this fault ahead of the Miami – Miami Beach 69kV line. FPL has plans to replace protection systems on both Flagami lines.
Recommendation 8: The opening of the Turkey Point – Flagami – Galloway 230kV line at 0.93 seconds when the Turkey Point terminal operated would have benefited the isolation of the fault. FPL should study implementing transfer trip for operation of line backup relaying on all terminals of this three-terminal line. (ref PPET-2)
Recommendation 9: The relaying at Miami on the 230kV lines to Flagami should be replaced with relaying that can more effectively coordinate with backup relaying for faults at Flagami. FPL should follow through with these plans to replace the panels. (ref PPET-3)
Recommendation 7: All parties should review protective system maintenance procedures to ensure they include a step to “Return relay configuration to in-service operating configuration”. (ref. FPART 7)
Applicable Entity: FRCC TOs, TOPs, GOs, GOPs Status: Pending
Applicable Entity: FPL Status: Pending
Applicable Entity: FPL Status: Pending
41
Observation PPET 4: Extreme events like this uncover areas where enhancements of the Protection System could potentially minimize the extent of wide spread outages. This disturbance was initiated on the 138kV side of the Flagami Substation, yet four 230kV remote line terminals tripped and three 230kV remote terminals did not trip. If the 230kV fault current contribution had been removed earlier in this event (as would have occurred with local protection in service) the extent of the outage could have been reduced. The relaying at Miami on the Flagami 230kV line did not trip because the fault detectors did not stay picked up long enough as lines sequentially tripped and the line current was sequentially redistributed. Relaying “behind” the 230kV lines operated to isolate the fault. Recommendation PPET 2 will allow the Flagami to Turkey Point/Galloway terminal to trip for backup relay operation. Recommendation PPET 3 will allow the Miami to Flagami 230kV lines to trip for faults at Flagami faster than relays “behind” Miami. The PPET recommends direct equipment enhancements to prevent recurrence in recommendations PPET2 and PPET3. The 230kV/138kV autotransformers at Flagami do not utilize phase overcurrent or impedance backup relaying. Although there are no current industry requirements for this type of protection, the autotransformers offer a position to install additional local relaying that could be used to isolate the 230kV system from faults on the 138kV system. It is not practical to study the sequences leading up to all extreme events, and there are no current industry standards that require system backup protection on autotransformers. However, the locations of autotransformers provide an opportunity to limit the expansion of extreme events between voltage levels. Furthermore the cost and long lead times associated with autotransformers provide strong incentive to protect these valuable assets. Backup protection on autotransformers has been an issue in at least three major disturbances in Florida since 2004.
Recommendation 10: NERC should issue an industry advisory to make owners of large autotransformers aware that relaying for these high value assets should be reviewed and additional backup protection considered to potentially limit the impacts of extreme events. (ref PPET-4a)
Recommendation 11: NERC should assign the System Protection and Control Task Force to produce a technical paper describing the issue and application of backup protection of autotransformers. (ref PPET-4b)
(Cont’d)
Applicable Entity: NERC Status: Pending
42
Observation PPET 5: On the Village Green to Flagami 138kV line, the digital relay directional element dropped out momentarily during the fault resulting in the Zone 5 phase distance element timer resetting. The directional element dropped out when the fault evolved from a phase to phase fault to a three phase fault. The settings of the relay were implemented using individual timers for each sensing application and prevented a continuous operation for evolving faults. FPL has changed their setting philosophy and now uses a common zone timer as recommended by the manufacturer. Observation PPET 6: There were a number of relays that operated and provided targets for this extreme event. A few of the targets reported were from previous events and were not related to this event. This did not impact the performance of the relaying or hamper the isolation of this fault but did provide some confusion during the initial event analysis. Observation PPET 7: The Levee terminal of the Turkey Point 230kV line Zone 2 relay operated 1.22 seconds into the fault. The Zone 2 A-B mho circle of the impedance relay showed an abnormality in the 3rd quadrant of the R-X diagram when tested following the Event. This abnormal mho element characteristic caused the relay to operate when the impedance loci entered the relay from the
Recommendation 12: To prevent the digital relay directional element from dropping out during evolving faults a common timer is available as an option and should be used. Common zone timing will suspend a timer for 1 cycle if it drops out and will provide ride-through timing for evolving faults. (ref PPET-5)
Recommendation 13: The owners of relay systems should record and reset relay targets in a timely manner. Electromechanical relay targets would require site visits and procedures should be in place to insure the targets are reset. Programming targets on microprocessor based relaying should consider the reset feature and be programmed according to company procedures. (ref PPET-6)
(Cont’d) Applicable Entity: NERC Status: Pending
Applicable Entity: FRCC TOs, TOPs, GOs, GOPs Status: Pending
Applicable Entity: FRCC TOs, TOPs, GOs, GOPs Status: Pending
43
reverse direction. Common industry testing practices of electromechanical distance relays includes test points in the first and second quadrants but rarely involves testing in the 3rd or 4th quadrants.
Observation PPET 8: The relaying at Turkey Point on the Turkey Point to Davis#2 230kV line tripped on Zone 1 during a power swing 0.89 seconds into this extreme event. There were 15 other line relaying operations prior to this event and the operation of this line did not adversely impact the stability of the Power Plant or the loss of additional substations. The swing that occurred for the Turkey Point to Davis #2 230 kV line was more severe than swings in response to category D delayed clearing faults in the vicinity of Turkey Point that FPL had previously studied. This action was a tolerable operation under the conditions caused by this fault. It is not practical to study the sequences leading up to all extreme events, however, owners should take precautions when necessary to reduce the effects of power swings. No further action is recommended. Observation PPET 9: A relay at Venetian on the 69 kV line to Roney operated 6.9 seconds after the fault (5.2 seconds after the fault was cleared) by Switch On to Fault application. The relay operated when the voltage and current dropped below the settings which are not adjustable. This action was a tolerable operation under the conditions caused by this event. This relay is set in accordance with NERC Standard PRC-023. It is not practical to study the sequences leading up to all extreme events, however, owners should take precautions when necessary to reduce the effects of Switch On to Fault applications and the relay settings should conform to NERC Standard PRC-023. No further action is recommended. Observation PPET 10: Alternate switching configurations in a transmission system can result in long transmission lines with multiple terminals and high apparent impedances for the protective relay to accommodate. The Lauderdale to Gratigny 138 kV line has an alternate switching configuration which allows for closing of the normal open at Country Club to protect for breaker failure at Garden and promote tripping at Lauderdale for a 3-phase fault on the Garden to Lauderdale 138 kV line. This requires the relay to be set with unusually long reach characteristics to ensure the transmission line is fully
Recommendation 14: Owners should consider enhanced R-X quadrant testing for electromechanical distance relays and their apparent failure modes when investigating mis-operations. (ref PPET-7)
Applicable Entity: FRCC TOs, TOPs, GOs, GOPs Status: Pending
44
protected under all possible switching configurations. These long reach settings may detect faults far outside the immediate area and time delays are used to prevent tripping for normally cleared faults. However extreme events with excessive fault clearing times can result in undesirable operation of these relays, but the consequence of leaving a line unprotected far outweighs the risk of an operation for an extreme event. These relay actions did not cause the loss of additional load nor delay restoration. Therefore, no further action is recommended. Observation GRT 1: A review of the under-voltage settings on all the generating units reviewed by the GRT revealed considerable differences in the aux bus under-voltage settings and a lack of specification of generator coordination objectives.
Recommendation 154
5 Observation GRT 2: Preliminary analysis of some large frame combustion turbines that tripped during the Event when the system frequency increased indicates that the trips were due to “lean blowout” of one or more combustors. It is important to note that the frequency rate of change (df/dt) experienced during the Event was critical in turbine-generator response. Currently, existing guidelines for generator coordination address magnitude and duration of frequency excursions, but they do not address rate of change.
4 Recommendation 15 was a FEAT recommendation that was previously conveyed in the FEAT Interim Recommendations Report as Recommendation 3 and was based on GRT’s preliminary analysis. 5 NERC issued an Industry Advisory “Unexpected Loss of Generation due to Low Voltage on the System” (A-2008-06-26-01 issued June 26, 2008) based on Recommendations 15.
Recommendation 154: FRCC Operating Committee issue an alert to all FRCC GOs/GOPs who own or operate large frame combustion turbines and request that the GOs/GOPs undertake a review of the design and settings for auxiliary and plant distribution under-voltage protection to ensure these settings appropriately coordinate with both: (1) the generator protection settings as described in the FRCC Handbook document, FRCC Generator Coordination Requirements, dated November 2001; and (2) the specific equipment’s protection requirements. (ref. GRT-1)
Applicable Entity: FRCC GOs, GOPs Status: Complete
Applicable Entity: NERC – Industry Advisory5 Status: Complete
45
Recommendation 166
7 Observation RRT A: Unusual communication or infrequently received EMS alarms may rely on knowledgebase analysis to determine meaning and may delay or hinder operator response to events.
6 Recommendation 16 was a FEAT recommendation that was previously conveyed in the FEAT Interim Recommendations Report as Recommendation 4 and was based on GRT’s preliminary analysis. 7 NERC issued an Industry Advisory “Turbine Combustor Lean Blowout” (A-2008-06-26-02 issued June 26, 2008) based on Recommendations 16.
Recommendation 166: FRCC Operating Committee issue an alert to all FRCC GOs/GOPs who own or operate large frame combustion turbines to be aware of potential turbine combustor lean blowout under certain frequency excursions. It is recommended that individual GOs/GOPs consult with appropriate combustion turbine manufacturers to understand their vulnerabilities with regard to lean blowout resulting from a system frequency disturbance. In the absence of a frequency rate of change response criteria in the FRCC Generator Coordination Requirements document (dated November 2001 - FRCC Handbook), the GRT also recommends that the FRCC OC investigate the need for establishing a criteria. (ref. GRT-2)
Recommendation 17: FRCC RC and operating entities under its Reliability Authority to develop a glossary that provides definitions of EMS alarms either received via SCADA or ICCP. This glossary should include definitions for unusual or infrequently received EMS alarms if the definitions of these alarms are not readily apparent from the alarm description field (as received in the EMS alarm log). This alarm glossary should be readily available to system operators and should be reviewed at least annually through formal or informal training activities. (ref. RRT-1)
Applicable Entity: FRCC GOs, GOPs Status: Complete
Applicable Entity: FRCC OC (establishing a criteria) Status: Pending
Applicable Entity: FRCC RC, BAs, TOPs Status: Pending (other entities EMS as appropriate)
Applicable Entity: NERC – Industry Advisory7 Status: Complete

46
Observation RRT B: Communication that took place between the FRCC RC and the entities under its reliability authority using the FRCC Hotline, did not consistently utilize three-way communications and did not consistently identify themselves and entities they represent during restoration activities. This led to minor confusion during the restoration process.
Recommendation 188 Recommendation 19 9
Observation RRT C: Current FRCC Handbook documents that address types of system restoration activities do not currently provide specific guidance as to what entity is responsible for initiating a request to restore load that was tripped by underfrequency conditions.
8 Recommendation 18 was previously discussed and conveyed under the FEAT Interim Recommendations Report, as part of Recommendation 1. 9 Recommendation 19 was previously discussed and conveyed under the FEAT Interim Recommendations Report as Recommendation 2.
Recommendation 188: FRCC companies should re-affirm the Regional Voice Communications Procedure contained in the FRCC Handbook document with all FRCC control room personnel involved in the day-to-day operation of the FRCC transmission system. (ref. RRT-2)
Recommendation 199: FRCC to review the communication protocol detailed in the FRCC Regional Voice Communication Procedure to be followed when communicating via the FRCC voice communication channels. It is recommended that the FRCC OC direct that the FRCC SOS develop an independent learning activity on the Regional Voice Communications Procedure and administer the resultant learning activity to all FRCC Control Room operators within two months of development. (ref. RRT-3)
Recommendation 20: Review and update FRCC Handbook documents related to load restoration. Clearly describe roles and responsibilities as well as the actions and communications expectations when initiating restoration activities (by both the RC and any impacted operating entities) (ref. RRT-4).
Applicable Entity: FRCC RC, BAs, TOPs Status: Complete
Applicable Entity: FRCC RC, BAs, TOPs Status: Complete
Applicable Entity: FRCC OC / ORS Status: Pending
47
10
Observation RRT D: The type and extent of the partial underfrequency load shed (within the FRCC footprint) was not readily identified or communicated when restoration activities began.
Observation RRT E: FRCC RC does not receive underfrequency load shed alarms via the ICCP from entities under its reliability authority. This reduced the FRCC RC situational awareness of the extent UFLS load shed in the Region.
10 Recommendation 21 was previously discussed and conveyed under the FEAT Interim Recommendations Report, as Recommendation 6.
Recommendation 2110: FRCC to expedite a review and update of the following FRCC handbook documents: 1) FRCC Restoration Plan (Blackout and Blackstart) 2) Underfrequency Actions Due to Whole or Partial Islanding of the Florida Transmission
System 3) Generation Deficiency with Separation 4) Restoration (ref. RRT-5)
Recommendation 22: FRCC to require annual training on the revised restoration procedures. Training should detail expectations, roles, responsibilities and priorities following an FRCC Regional UFLS event including both uniform and non-uniform actuation of UFLS, type events. (ref. RRT-6)
Recommendation 23: FRCC to develop and implement an alternative UFLS indication tool that combines all of the FRCC Balancing Authorities (BAs) and Transmission Operators (TOPs) underfrequency load shed status and presents that information on a high-level summary to the FRCC RC. (ref. RRT-7)
Applicable Entity: FRCC OC / ORS Status: Pending
Applicable Entity: FRCC OC / SOS Status: Pending
Applicable Entity: FRCC OC / ORS Status: Pending

48
Observation URT 1: The above data along with the additional simulations performed of the event affirms that the frequency deviation across the State was not abnormal for such a prolonged 3 phase fault and the UFLS plan in place by the utilities in the FRCC region performed as expected and helped to contain the loss of additional load.
Recommendation 24: It appears that at least 32 relays set to trip for set point A and A' did not trip in accordance with the prevailing system conditions. The URT recommends that the FRCC Operating Committee (OC) direct the FRCC System Protection and Control Subcommittee (SPCS) to perform a detailed evaluation of all relays that may have mis-operated coincident with the Event. The SPCS should work with the affected owner/operator and report their findings to the OC. (ref. URT-1)
Applicable Entity: FRCC OC / SPCS Status: Pending
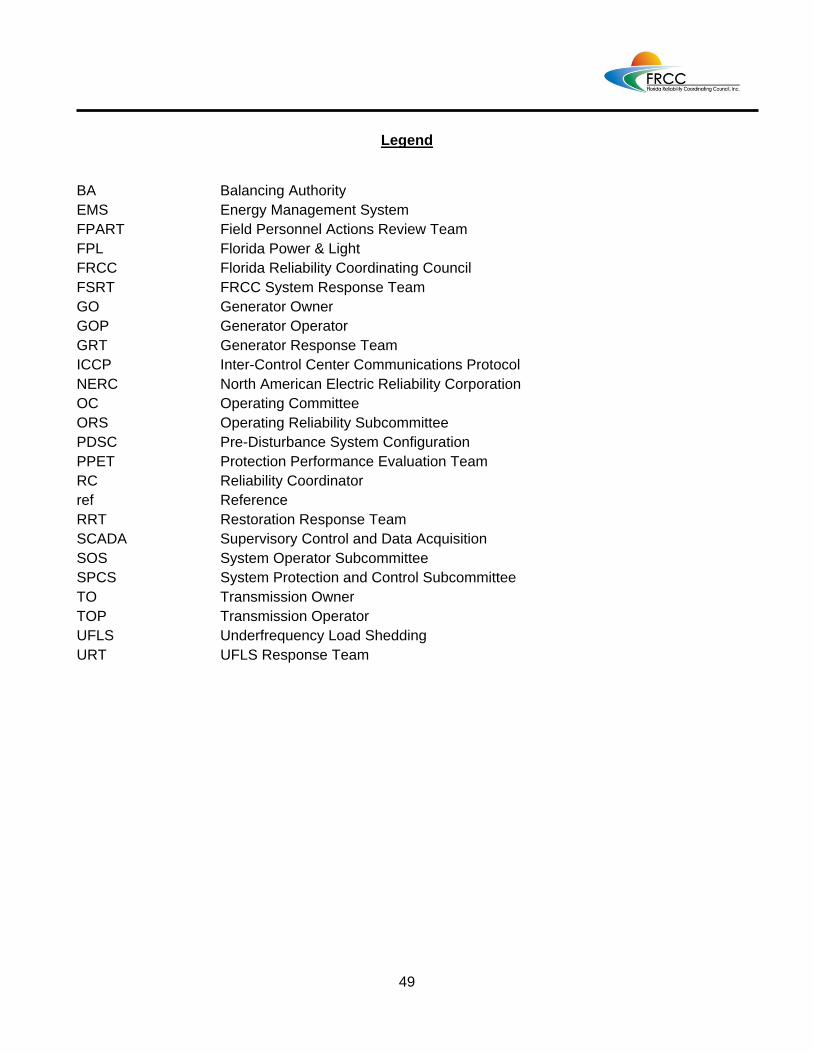
49
Legend
BA Balancing Authority EMS Energy Management System FPART Field Personnel Actions Review Team FPL Florida Power & Light FRCC Florida Reliability Coordinating Council FSRT FRCC System Response Team GO Generator Owner GOP Generator Operator GRT Generator Response Team ICCP Inter-Control Center Communications Protocol NERC North American Electric Reliability Corporation OC Operating Committee ORS Operating Reliability Subcommittee PDSC Pre-Disturbance System Configuration PPET Protection Performance Evaluation Team RC Reliability Coordinator ref Reference RRT Restoration Response Team SCADA Supervisory Control and Data Acquisition SOS System Operator Subcommittee SPCS System Protection and Control Subcommittee TO Transmission Owner TOP Transmission Operator UFLS Underfrequency Load Shedding URT UFLS Response Team
50
VI. Exhibits
A. ........ FRCC Event Analysis Team (FEAT) Roster
B. ........ The FRCC Event Analysis Team (FEAT) – FRCC Regional Entity Compliance Interface
Guidelines
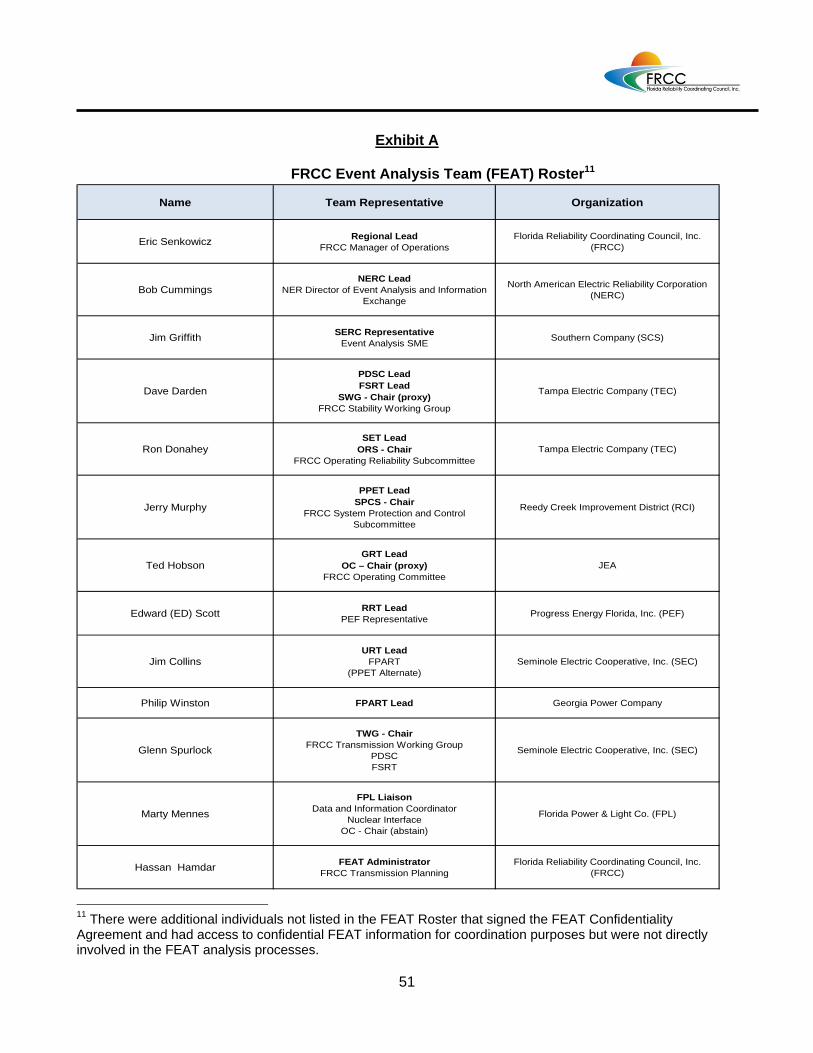
51
Exhibit A
FRCC Event Analysis Team (FEAT) Roster11
Name Team Representative Organization
Eric Senkowicz Regional Lead FRCC Manager of Operations
Florida Reliability Coordinating Council, Inc. (FRCC)
Bob CummingsNERC Lead
NER Director of Event Analysis and Information Exchange
North American Electric Reliability Corporation (NERC)
Jim Griffith SERC RepresentativeEvent Analysis SME Southern Company (SCS)
Dave Darden
PDSC LeadFSRT Lead
SWG - Chair (proxy) FRCC Stability Working Group
Tampa Electric Company (TEC)
Ron DonaheySET Lead
ORS - ChairFRCC Operating Reliability Subcommittee
Tampa Electric Company (TEC)
Jerry Murphy
PPET LeadSPCS - Chair
FRCC System Protection and Control Subcommittee
Reedy Creek Improvement District (RCI)
Ted HobsonGRT Lead
OC – Chair (proxy) FRCC Operating Committee
JEA
Edward (ED) Scott RRT LeadPEF Representative Progress Energy Florida, Inc. (PEF)
Jim CollinsURT Lead
FPART(PPET Alternate)
Seminole Electric Cooperative, Inc. (SEC)
Philip Winston FPART Lead Georgia Power Company
Glenn Spurlock
TWG - ChairFRCC Transmission Working Group
PDSCFSRT
Seminole Electric Cooperative, Inc. (SEC)
Marty Mennes
FPL LiaisonData and Information Coordinator
Nuclear InterfaceOC - Chair (abstain)
Florida Power & Light Co. (FPL)
Hassan Hamdar FEAT AdministratorFRCC Transmission Planning
Florida Reliability Coordinating Council, Inc. (FRCC)
11 There were additional individuals not listed in the FEAT Roster that signed the FEAT Confidentiality Agreement and had access to confidential FEAT information for coordination purposes but were not directly involved in the FEAT analysis processes.
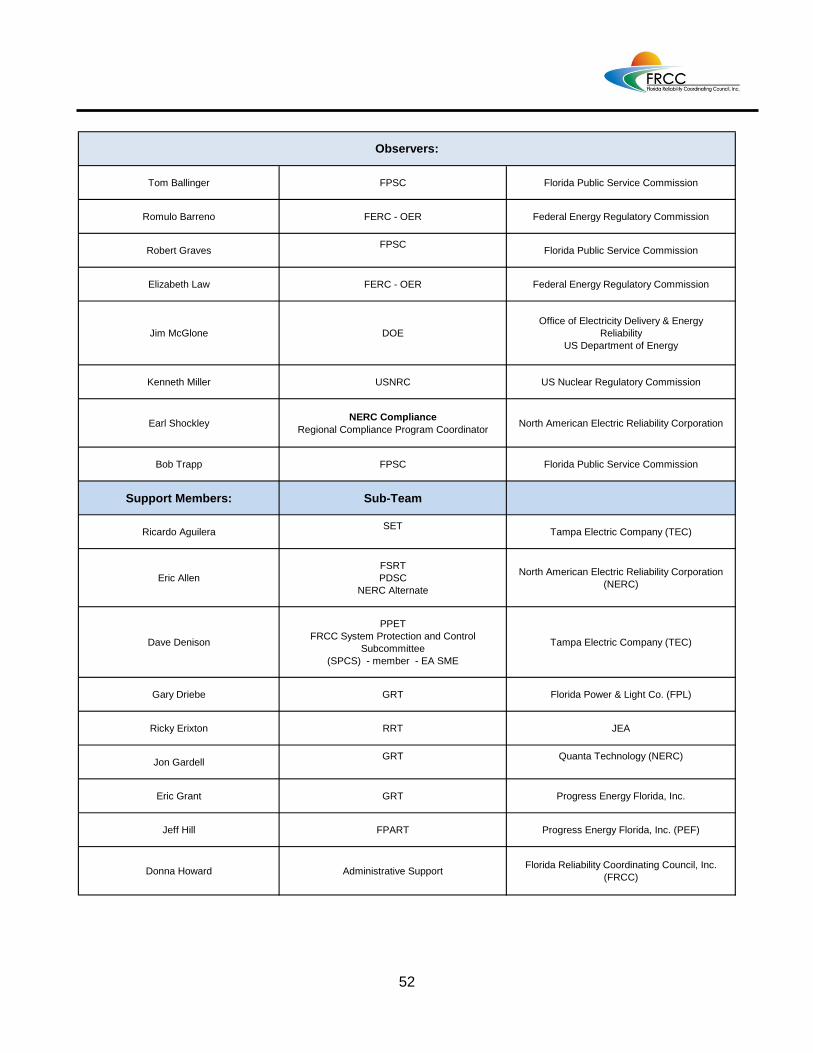
52
Tom Ballinger FPSC Florida Public Service Commission
Romulo Barreno FERC - OER Federal Energy Regulatory Commission
Robert Graves FPSC Florida Public Service Commission
Elizabeth Law FERC - OER Federal Energy Regulatory Commission
Jim McGlone DOEOffice of Electricity Delivery & Energy
ReliabilityUS Department of Energy
Kenneth Miller USNRC US Nuclear Regulatory Commission
Earl Shockley NERC ComplianceRegional Compliance Program Coordinator North American Electric Reliability Corporation
Bob Trapp FPSC Florida Public Service Commission
Support Members: Sub-Team
Ricardo Aguilera SET Tampa Electric Company (TEC)
Eric AllenFSRTPDSC
NERC Alternate
North American Electric Reliability Corporation (NERC)
Dave Denison
PPETFRCC System Protection and Control
Subcommittee(SPCS) - member - EA SME
Tampa Electric Company (TEC)
Gary Driebe GRT Florida Power & Light Co. (FPL)
Ricky Erixton RRT JEA
Jon Gardell GRT Quanta Technology (NERC)
Eric Grant GRT Progress Energy Florida, Inc.
Jeff Hill FPART Progress Energy Florida, Inc. (PEF)
Donna Howard Administrative Support Florida Reliability Coordinating Council, Inc. (FRCC)
Observers:

53
Support Members: Sub-Team
Bob Hurd GRT Tampa Electric Company (TEC)
Charles Jensen PPET JEA
Mike Johnson FPART Information Support Florida Power & Light Co. (FPL)
Michael Kotch SET Tampa Electric Company (TEC)
Maria Elena Lacedonia PPET Information Support Florida Power & Light Co. (FPL)
Fred McNeillFSRTPDSC
TWG, SWG Modeling Support & Analysis - SME
Florida Reliability Coordinating Council, Inc. (FRCC)
John Mulhausen PPET Information Support Florida Power & Light Co. (FPL)
Paul Plotkin GRT (Alternate) Florida Power & Light Co. (FPL)
Bill Royse PPET Progress Energy Florida, Inc. (PEF)
Tom SandersFPL Liaison - alternate
Data and Information CoordinatorNuclear Interface
Florida Power & Light Co. (FPL)
John Shaffer FRCC Stability Working Group(SWG) - Chair (abstain) – EA SME Florida Power & Light Co. (FPL)
Kristopher Stryker GRT Tampa Electric Company (TEC)
Harianto Suryo PPET Lakeland Electric (LAK)
Jon Sykes PPET SRP
Quang Chi Tang PPETURT Seminole Electric Cooperative, Inc. (SEC)
Gene WayFSRT, PDSC
FRCC Stability Working Group(SWG) – past member - EA SME
Orlando Utilities Commission (OUC)
John White FPART Orlando Utilities Commission (OUC)
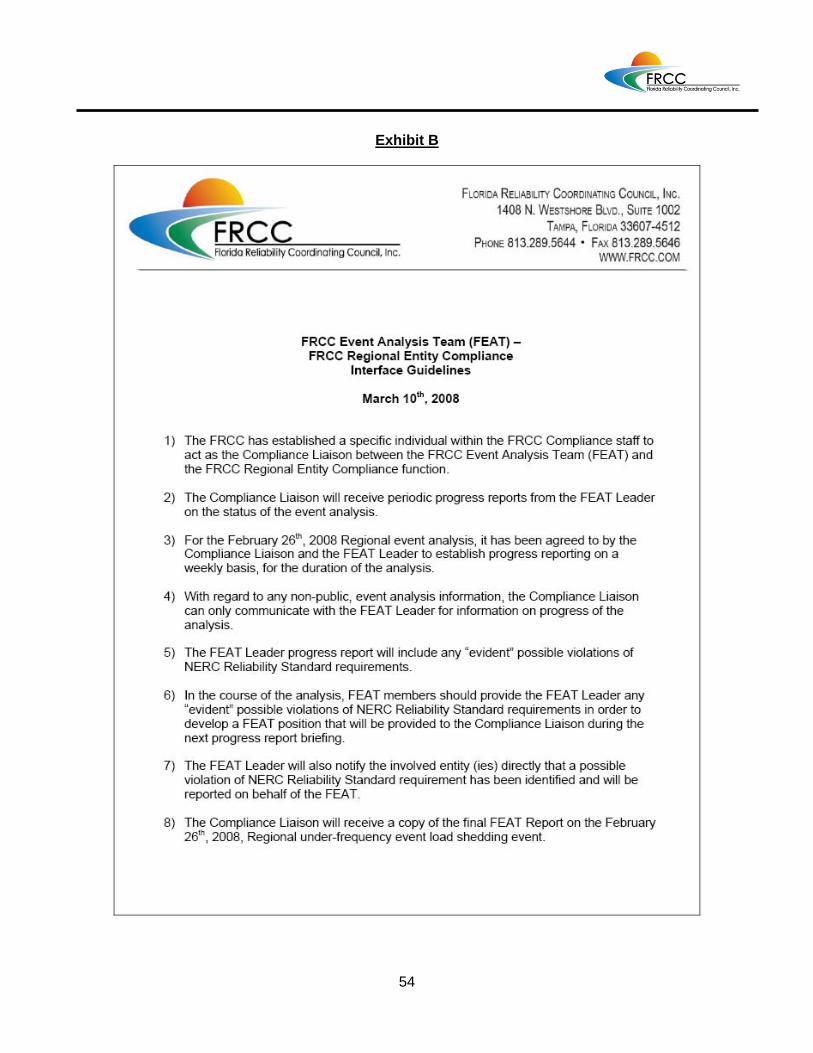
54
Exhibit B