FRCA Examinations 2015 Annual Statistical Report · Ain Shams University 2 6 25.00% 8.99% Kasturba...
16
FRCA Examinations 2014-2015 Annual Statistical Report
Transcript of FRCA Examinations 2015 Annual Statistical Report · Ain Shams University 2 6 25.00% 8.99% Kasturba...

FRCA Examinations 2014-2015 Annual Statistical Report

2
CONTENTS
Summary .......................................................................................................................................................................................... 3
Component Breakdowns .............................................................................................................................................................. 4
Histograms .................................................................................................................................................................................. 4
Boxplots ...................................................................................................................................................................................... 5
Education &Training ..................................................................................................................................................................... 7
UK Graduates ............................................................................................................................................................................ 7
Non-UK Graduates .................................................................................................................................................................. 8
Primary/Exempting Qualifications ........................................................................................................................................ 8
Deaneries .................................................................................................................................................................................... 9
Performance by Area of Primary Medical Qualification ................................................................................................... 10
Medical Grades ........................................................................................................................................................................ 11
Number of Attempts ................................................................................................................................................................... 12
Equal Opportunities .................................................................................................................................................................... 13
Ethnicity .................................................................................................................................................................................... 13
Religion or Belief ..................................................................................................................................................................... 14
Sexual orientation .................................................................................................................................................................... 14
Age ............................................................................................................................................................................................. 15
Language ................................................................................................................................................................................... 15
Reliability ....................................................................................................................................................................................... 16
3
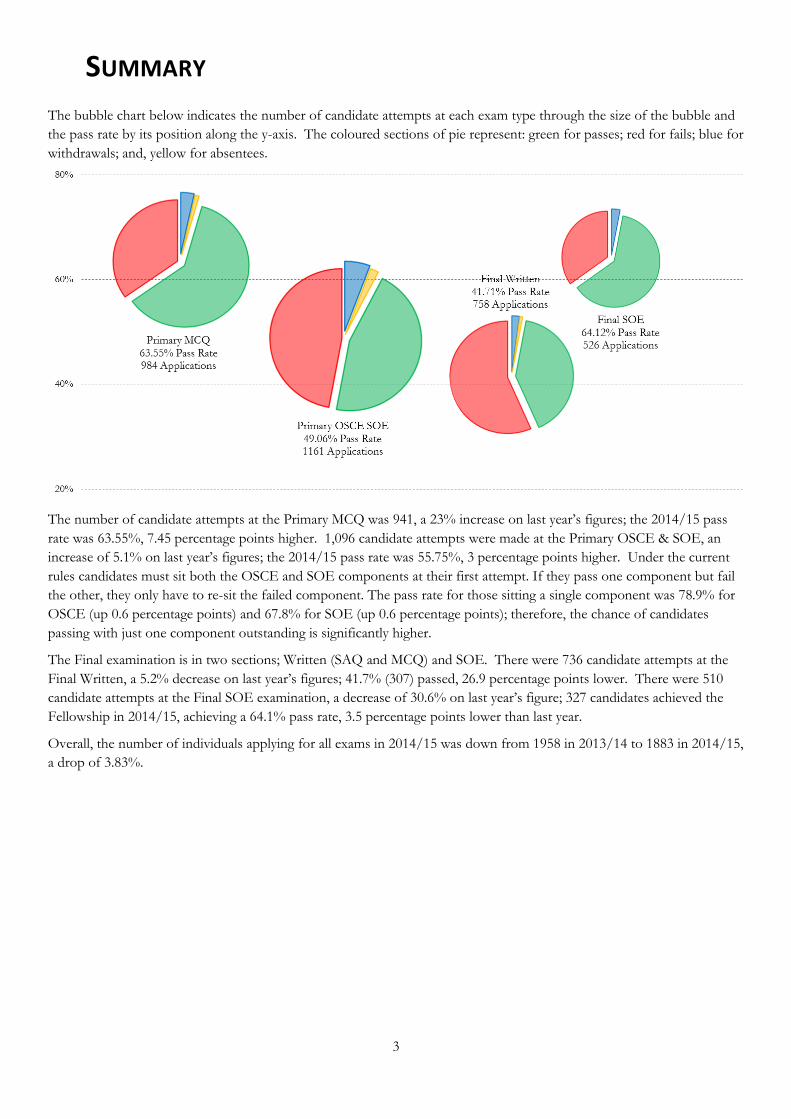
SUMMARY
The bubble chart below indicates the number of candidate attempts at each exam type through the size of the bubble and
the pass rate by its position along the y-axis. The coloured sections of pie represent: green for passes; red for fails; blue for
withdrawals; and, yellow for absentees.
The number of candidate attempts at the Primary MCQ was 941, a 23% increase on last year’s figures; the 2014/15 pass
rate was 63.55%, 7.45 percentage points higher. 1,096 candidate attempts were made at the Primary OSCE & SOE, an
increase of 5.1% on last year’s figures; the 2014/15 pass rate was 55.75%, 3 percentage points higher. Under the current
rules candidates must sit both the OSCE and SOE components at their first attempt. If they pass one component but fail
the other, they only have to re-sit the failed component. The pass rate for those sitting a single component was 78.9% for
OSCE (up 0.6 percentage points) and 67.8% for SOE (up 0.6 percentage points); therefore, the chance of candidates
passing with just one component outstanding is significantly higher.
The Final examination is in two sections; Written (SAQ and MCQ) and SOE. There were 736 candidate attempts at the
Final Written, a 5.2% decrease on last year’s figures; 41.7% (307) passed, 26.9 percentage points lower. There were 510
candidate attempts at the Final SOE examination, a decrease of 30.6% on last year’s figure; 327 candidates achieved the
Fellowship in 2014/15, achieving a 64.1% pass rate, 3.5 percentage points lower than last year.
Overall, the number of individuals applying for all exams in 2014/15 was down from 1958 in 2013/14 to 1883 in 2014/15,
a drop of 3.83%.

4
COMPONENT BREAKDOWNS
Histograms
The histograms indicate that scores from each exam component are not normally distributed in any case, particularly the
SOE exams which are strongly negatively skewed; however, they attract the broadest range of scores. The Histograms are
based on percentage scores at each exam. The Final MCQ and SAQ are separate components of the Final Written
examination, but are shown separately to reflect the different examination format.
0 9
18
26
35
44
53
61
70
79
88
96
Score (%)
Primary MCQ
0 8
16
24
32
40
48
56
64
71
79
87
95
Score (%)
Primary OSCE
0
11
23
34
46
57
69
80
92
Score (%)
Primary SOE
0
11
22
34
45
56
67
78
90
Score (%)
Final MCQ
0
11
21
32
43
53
64
74
85
96
Score (%)
Final SAQ
0 9
18
26
35
44
53
61
70
79
88
96
Score (%)
Final SOE
5
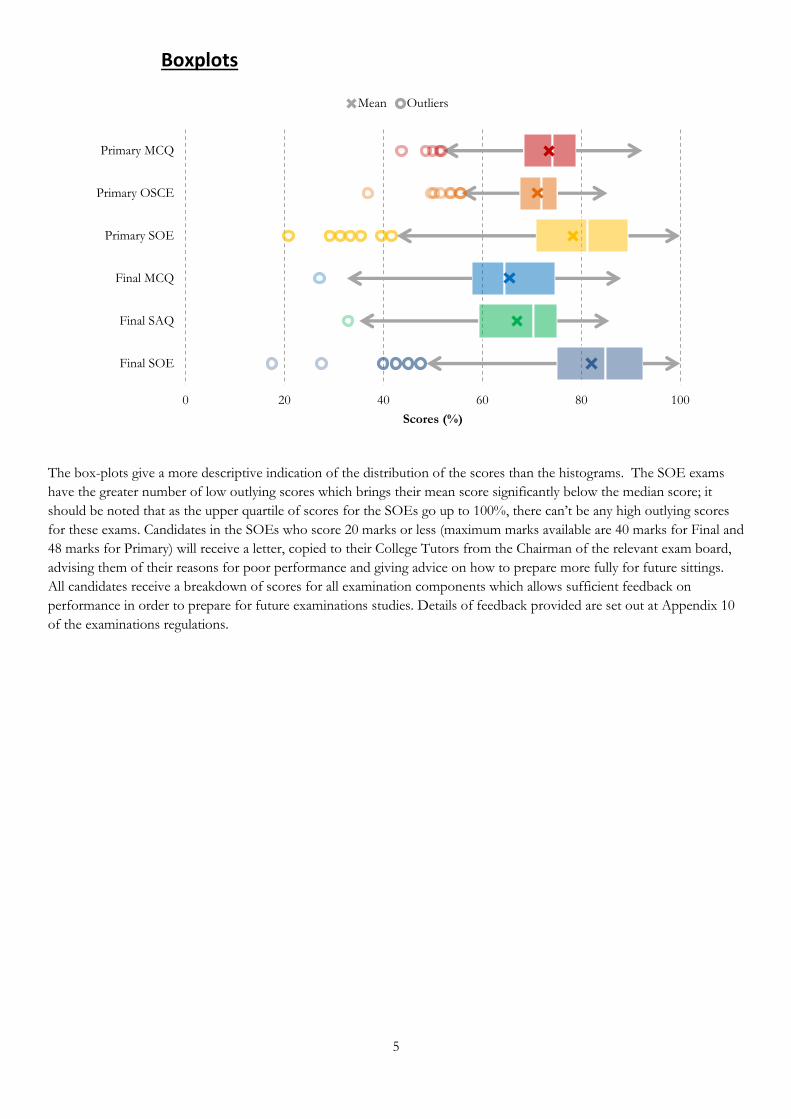
Boxplots
The box-plots give a more descriptive indication of the distribution of the scores than the histograms. The SOE exams
have the greater number of low outlying scores which brings their mean score significantly below the median score; it
should be noted that as the upper quartile of scores for the SOEs go up to 100%, there can’t be any high outlying scores
for these exams. Candidates in the SOEs who score 20 marks or less (maximum marks available are 40 marks for Final and
48 marks for Primary) will receive a letter, copied to their College Tutors from the Chairman of the relevant exam board,
advising them of their reasons for poor performance and giving advice on how to prepare more fully for future sittings.
All candidates receive a breakdown of scores for all examination components which allows sufficient feedback on
performance in order to prepare for future examinations studies. Details of feedback provided are set out at Appendix 10
of the examinations regulations.
0 20 40 60 80 100
Final SOE
Final SAQ
Final MCQ
Primary SOE
Primary OSCE
Primary MCQ
Scores (%)
Mean Outliers
6
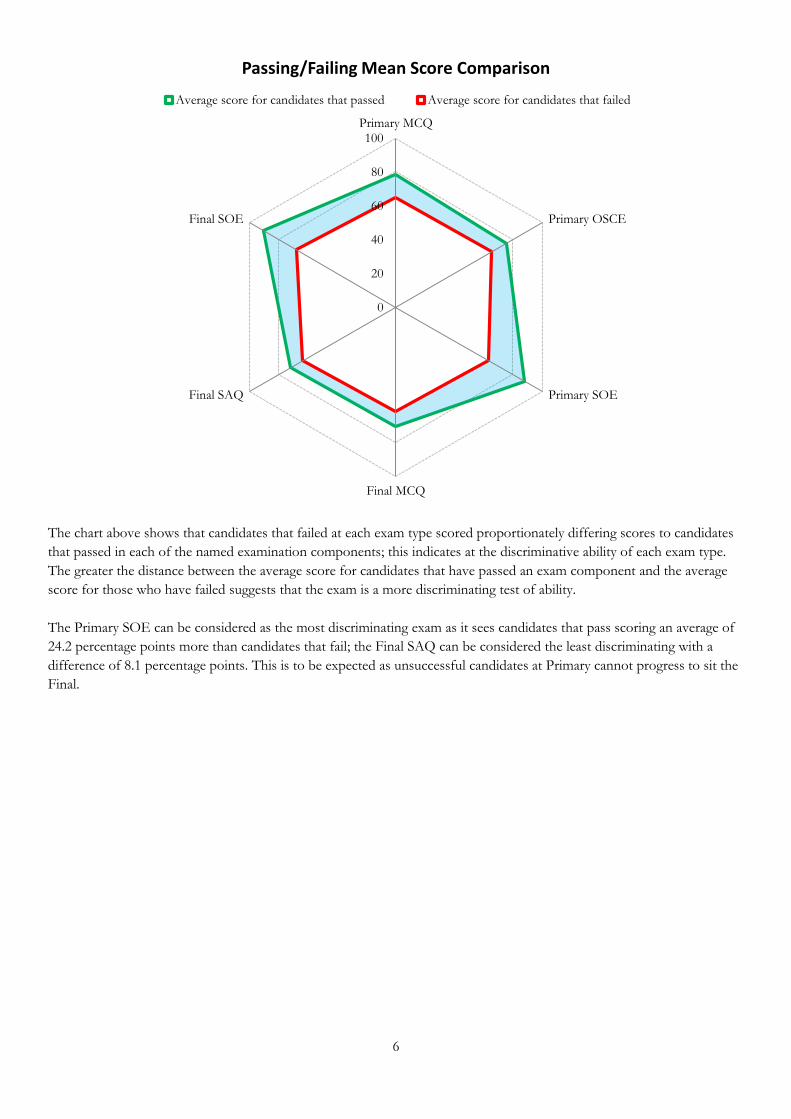
The chart above shows that candidates that failed at each exam type scored proportionately differing scores to candidates
that passed in each of the named examination components; this indicates at the discriminative ability of each exam type.
The greater the distance between the average score for candidates that have passed an exam component and the average
score for those who have failed suggests that the exam is a more discriminating test of ability.
The Primary SOE can be considered as the most discriminating exam as it sees candidates that pass scoring an average of
24.2 percentage points more than candidates that fail; the Final SAQ can be considered the least discriminating with a
difference of 8.1 percentage points. This is to be expected as unsuccessful candidates at Primary cannot progress to sit the
Final.
0
20
40
60
80
100Primary MCQ
Primary OSCE
Primary SOE
Final MCQ
Final SAQ
Final SOE
Passing/Failing Mean Score Comparison
Average score for candidates that passed Average score for candidates that failed
7
EDUCATION &TRAINING
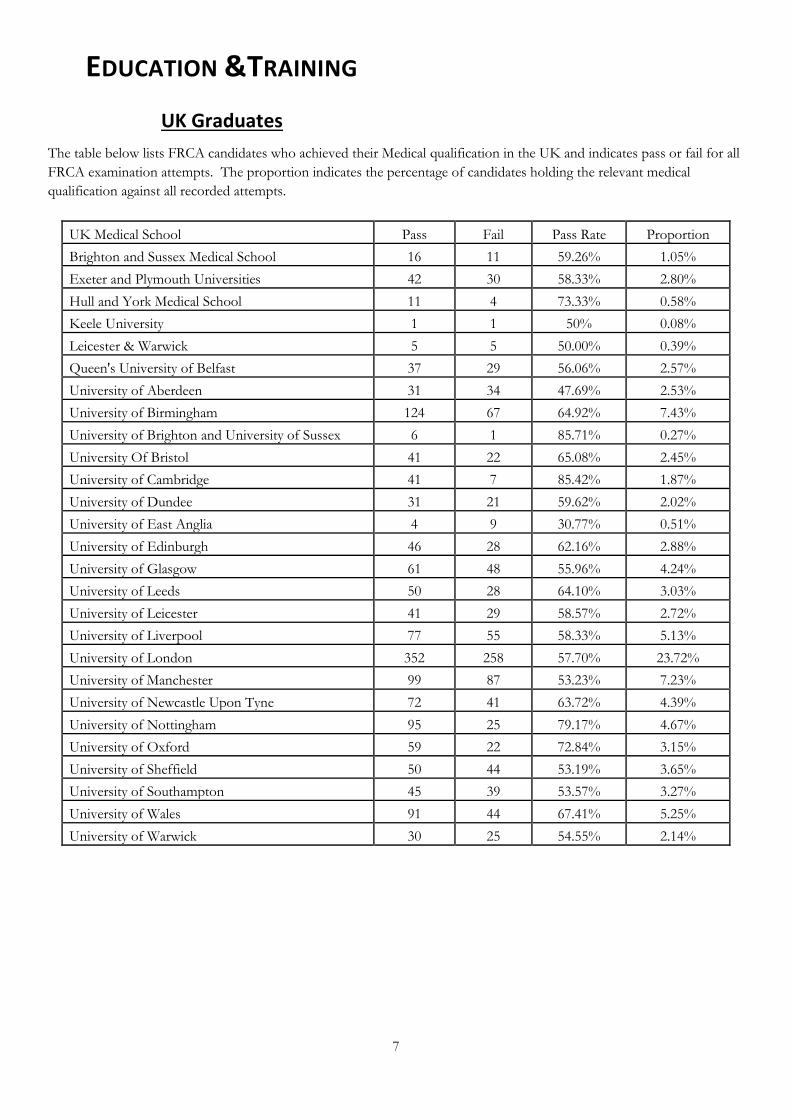
UK Graduates
The table below lists FRCA candidates who achieved their Medical qualification in the UK and indicates pass or fail for all
FRCA examination attempts. The proportion indicates the percentage of candidates holding the relevant medical
qualification against all recorded attempts.
UK Medical School Pass Fail Pass Rate Proportion
Brighton and Sussex Medical School 16 11 59.26% 1.05%
Exeter and Plymouth Universities 42 30 58.33% 2.80%
Hull and York Medical School 11 4 73.33% 0.58%
Keele University 1 1 50% 0.08%
Leicester & Warwick 5 5 50.00% 0.39%
Queen's University of Belfast 37 29 56.06% 2.57%
University of Aberdeen 31 34 47.69% 2.53%
University of Birmingham 124 67 64.92% 7.43%
University of Brighton and University of Sussex 6 1 85.71% 0.27%
University Of Bristol 41 22 65.08% 2.45%
University of Cambridge 41 7 85.42% 1.87%
University of Dundee 31 21 59.62% 2.02%
University of East Anglia 4 9 30.77% 0.51%
University of Edinburgh 46 28 62.16% 2.88%
University of Glasgow 61 48 55.96% 4.24%
University of Leeds 50 28 64.10% 3.03%
University of Leicester 41 29 58.57% 2.72%
University of Liverpool 77 55 58.33% 5.13%
University of London 352 258 57.70% 23.72%
University of Manchester 99 87 53.23% 7.23%
University of Newcastle Upon Tyne 72 41 63.72% 4.39%
University of Nottingham 95 25 79.17% 4.67%
University of Oxford 59 22 72.84% 3.15%
University of Sheffield 50 44 53.19% 3.65%
University of Southampton 45 39 53.57% 3.27%
University of Wales 91 44 67.41% 5.25%
University of Warwick 30 25 54.55% 2.14%
8
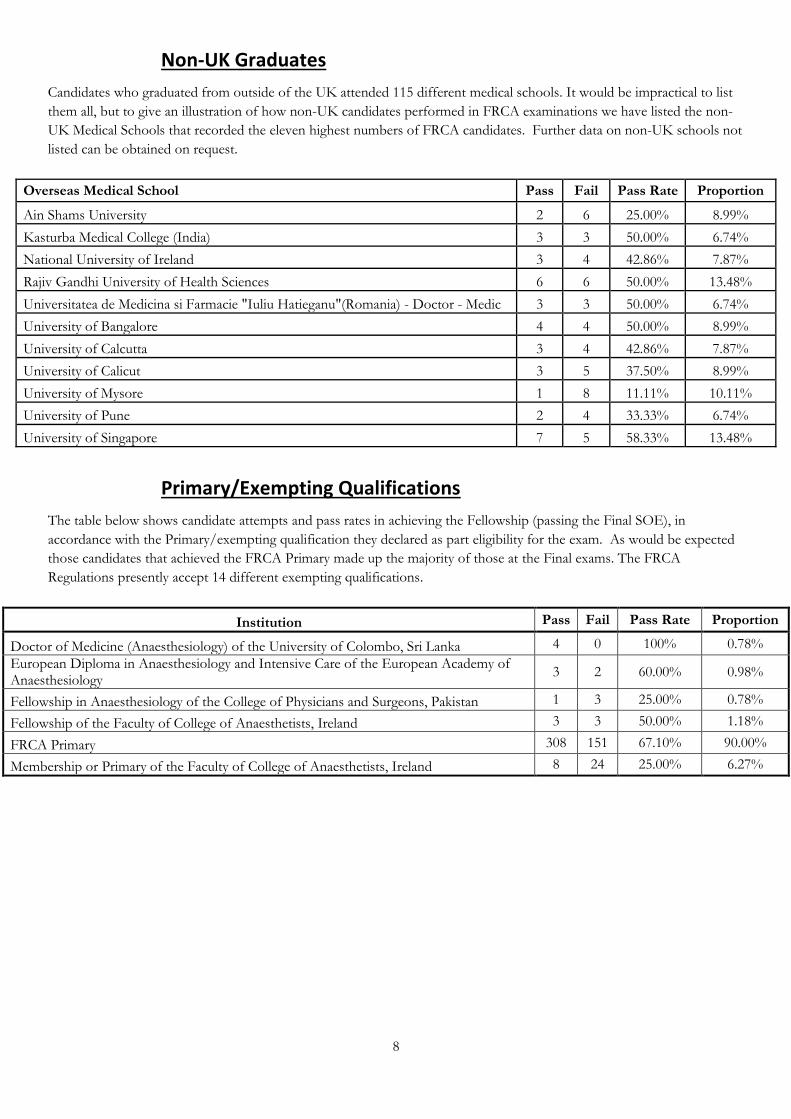
Non-UK Graduates
Candidates who graduated from outside of the UK attended 115 different medical schools. It would be impractical to list
them all, but to give an illustration of how non-UK candidates performed in FRCA examinations we have listed the non-
UK Medical Schools that recorded the eleven highest numbers of FRCA candidates. Further data on non-UK schools not
listed can be obtained on request.
Overseas Medical School Pass Fail Pass Rate Proportion
Ain Shams University 2 6 25.00% 8.99%
Kasturba Medical College (India) 3 3 50.00% 6.74%
National University of Ireland 3 4 42.86% 7.87%
Rajiv Gandhi University of Health Sciences 6 6 50.00% 13.48%
Universitatea de Medicina si Farmacie "Iuliu Hatieganu"(Romania) - Doctor - Medic 3 3 50.00% 6.74%
University of Bangalore 4 4 50.00% 8.99%
University of Calcutta 3 4 42.86% 7.87%
University of Calicut 3 5 37.50% 8.99%
University of Mysore 1 8 11.11% 10.11%
University of Pune 2 4 33.33% 6.74%
University of Singapore 7 5 58.33% 13.48%
Primary/Exempting Qualifications
The table below shows candidate attempts and pass rates in achieving the Fellowship (passing the Final SOE), in
accordance with the Primary/exempting qualification they declared as part eligibility for the exam. As would be expected
those candidates that achieved the FRCA Primary made up the majority of those at the Final exams. The FRCA
Regulations presently accept 14 different exempting qualifications.
Institution Pass Fail Pass Rate Proportion
Doctor of Medicine (Anaesthesiology) of the University of Colombo, Sri Lanka 4 0 100% 0.78%
European Diploma in Anaesthesiology and Intensive Care of the European Academy of Anaesthesiology
3 2 60.00% 0.98%
Fellowship in Anaesthesiology of the College of Physicians and Surgeons, Pakistan 1 3 25.00% 0.78%
Fellowship of the Faculty of College of Anaesthetists, Ireland 3 3 50.00% 1.18%
FRCA Primary 308 151 67.10% 90.00%
Membership or Primary of the Faculty of College of Anaesthetists, Ireland 8 24 25.00% 6.27%

9
Deaneries
The table below shows the number of UK graduate attempts, both passing and failing all FRCA examinations, and the pass rates for
their deanery. The most successful deanery was Defence (Tri Services) achieving a 72.73% overall pass rate.
Deanery School Pass Fail Pass Rate
Proportion Primary MCQ
Primary OSCE & SOE
Final Written
Final SOE
Defence (Tri Services)
Anglia 1 0 100% 0.06% 100%
South East Scotland 0 1 0.00% 0.06% 0.00%
South West 1 1 50.00% 0.13% 50.00%
Tri-Services 5 1 83.33% 0.39% 100% 100% 0.00% 100%
Wessex 1 0 100% 0.06% 100%
sub-total 8 3 72.73% 0.71% 75.00% 100% 100% 0.00%
East Midlands Healthcare Workforce
Leicester & East Midlands
33 34 49.25% 4.30% 50.00% 44.00% 38.46% 85.71%
Nottingham & East Midlands
32 19 62.75% 3.27% 61.90% 50.00% 60.00% 87.50%
sub-total 65 53 55.08% 7.57% 55.81% 45.95% 52.17% 13.33%
East of England Anglia 77 51 60.16% 8.22% 65.91% 54.10% 55.56% 71.43%
Kent, Surrey & Sussex Kent, Surrey & Sussex 106 68 60.92% 11.17% 66.07% 69.84% 38.24% 57.14%
London
Barts & The London 53 44 54.64% 6.23% 88.46% 53.33% 22.22% 57.14%
Central London 85 51 62.50% 8.73% 86.96% 80.00% 45.45% 60.61%
Imperial 62 49 55.86% 7.12% 69.23% 64.71% 29.73% 78.57%
South Eastern 55 18 75.34% 4.69% 73.91% 95.24% 60.00% 64.29%
St. George's 37 20 64.91% 3.66% 75.00% 92.31% 37.50% 58.33%
sub-total 292 182 61.60% 30.42% 78.95% 73.17% 62.00% 36.78%
Mersey Mersey 71 41 63.39% 7.19% 70.27% 59.46% 72.22% 50.00%
NHS West Midlands Workforce
Birmingham 64 31 67.37% 6.10% 80.95% 62.07% 53.85% 78.95%
Stoke on Trent 36 37 49.32% 4.69% 51.85% 44.44% 50.00% 55.56%
Warwickshire 25 31 44.64% 3.59% 47.06% 40.91% 25.00% 66.67%
sub-total 125 99 55.80% 14.38% 60.00% 49.37% 52.27% 29.73%
North Western North West 98 74 56.98% 11.04% 72.34% 55.77% 36.96% 66.67%
Northern Northern 64 37 63.37% 6.48% 68.57% 70.59% 47.62% 54.55%
Northern Ireland Medical & Dental Training Agency
Northern Ireland 32 37 46.38% 4.43% 36.36% 52.38% 40.00% 63.64%
Oxford Oxford 53 38 58.24% 5.84% 68.42% 50.00% 55.56% 63.16%
Scotland (East) Tayside 20 12 62.50% 2.05% 66.67% 80.00% 53.85% 62.50%
Scotland (North) North & North East Scotland
12 12 50.00% 1.54% 55.56% 41.67% 50.00% 100%
Scotland (South East) South East Scotland 43 20 68.25% 4.04% 84.62% 66.67% 47.06% 83.33%
Scotland (West) West of Scotland 67 64 51.15% 8.41% 56.41% 45.00% 42.86% 62.50%
Severn Bristol 52 21 71.23% 4.69% 82.35% 70.00% 72.22% 61.11%
South West Peninsula South West 84 48 63.64% 8.47% 71.43% 57.14% 59.26% 71.43%
Wales Welsh 98 62 61.25% 10.27% 70.00% 59.68% 50.00% 60.00%
Wessex Wessex 75 37 66.96% 7.19% 65.71% 60.98% 68.75% 80.00%
Yorkshire & The Humber Postgraduate Deanery
Hull,York & East Coast
20 11 64.52% 1.99% 63.64% 75.00% 50.00% 50.00%
Leeds & Bradford 49 19 72.06% 4.36% 93.75% 62.50% 53.33% 84.62%
Sheffield & South Yorkshire
44 22 66.67% 4.24% 75.00% 52.00% 75.00% 76.47%
South Yorkshire 1 0 100% 0.06% 100%
sub-total 114 52 68.67% 10.65% 80.00% 60.66% 38.71% 23.53%
10
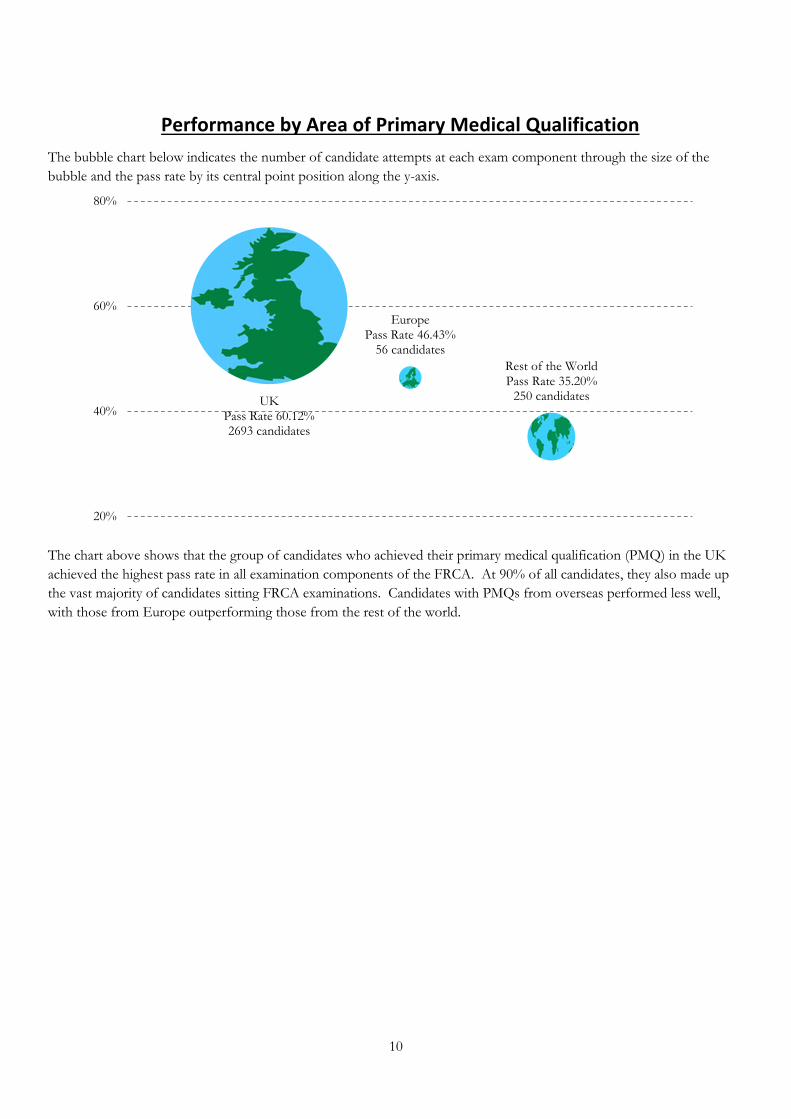
Performance by Area of Primary Medical Qualification
The bubble chart below indicates the number of candidate attempts at each exam component through the size of the
bubble and the pass rate by its central point position along the y-axis.
The chart above shows that the group of candidates who achieved their primary medical qualification (PMQ) in the UK
achieved the highest pass rate in all examination components of the FRCA. At 90% of all candidates, they also made up
the vast majority of candidates sitting FRCA examinations. Candidates with PMQs from overseas performed less well,
with those from Europe outperforming those from the rest of the world.
UK Pass Rate 60.12% 2693 candidates
Europe Pass Rate 46.43%
56 candidates
Rest of the World Pass Rate 35.20%
250 candidates
20%
40%
60%
80%

11
Medical Grades
The bubble chart below indicates the number of candidates in the medical grades given below in each exam component
through the size of the bubble. The pass rate for each medical grade is indicated by the position of the central point of the
bubble along the y-axis. The exam component colour key is: Red is Primary MCQ; Orange is Primary OSCE/SOE; Green
is Final Written and Blue is Final SOE.
The FRCA forms part of CCT for Anaesthetic Trainees and therefore, trainees make up the majority of candidate
attempts, accounting for 87% of candidate attempts. Trainees also performed better than non-trainees.
12
NUMBER OF ATTEMPTS
The bubble chart below indicates the number of candidate attempts at each exam type through the size of the bubble and
the pass rate by its central point position along the y-axis. Within the individual pie charts: Red= Primary MCQ; Orange=
Primary OSCE/SOE; Green= Final Written and Blue= Final SOE.
The majority of candidates at all exam components were on their first attempt, with the number of candidates decreasing
as the number of attempts increased. The pass rates for candidates on their first attempt is higher than those on multiple
attempts (all multiple attempt figures are aggregated) in each exam component except for the Primary OSCE & SOE; the
difference in pass rates here is 5 percentage points in favour of those on multiple attempts. The exam with the biggest
difference between the two groups is the Final Written (20 percentage points), in favour of those on their first attempt.
1st Attempt 2nd Attempt 3rd Attempt 4th Attempt
5th Attempt
6th Attempt
0%
20%
40%
60%
80%

13
EQUAL OPPORTUNITIES
Ethnicity
The majority of candidates at all exam types considered themselves to be White British (44%). The next most
populous group was Asian/Asian British Indian (14%). Those who did not declare or preferred not to say which ethnic
group they belonged to comprised 9% of candidates across all exams.
14
Religion or Belief
The majority of candidates at all exam types considered themselves to be Christian (34%). The next most populous group
were those who considered themselves to have no religion or belief (28%). Those who did not declare a religion or belief
comprised 12% of the candidates.
Sexual orientation
The majority of candidates at all exam types considered themselves to be heterosexual (81%). Those who did not declare
or preferred not to say comprised 17% of the candidates.
Any other religion or belief
Buddhist
Christian
Hindu
Jewish Muslim
No religion or belief
Prefer not to say
Unknown
Other
Gay man
Heterosexual / straight
Other
Bisexual
Prefer not to say
Unknown
Other
15
Age
The highest proportion of candidates (53%) where in the
age bracket 35-44. Only 4% of candidates were in the
age bracket 45-54.
Language
Those candidates who considered English to be their
first language (yes) comprised the highest proportion
(80%) of the candidates for the academic year 2014/15.
All FRCA examinations are conducted in English.
Where a candidate’s first language is not English, other
communication and written skills in English should be
equivalent to a level which a doctor could successfully
pass the PLAB test or at a level of approximately 7.5/9
across all bands of the IELTS.
25-34
35 - 44
45 - 54
Yes
No
Don't know

16
RELIABILITY
Reliability for OSCE and SOE exam types has not been reported by the College due to issues with small cohorts at each
sitting. The College has investigated a Generalisability theory model for the OSCE exam and the Rasch modelling has
evidenced reliability in respect of the SOE components.
For written exams we have been able to calculate Cronbach’s alpha and Kuder-Richardson 20 coefficients; these scores
have been recorded since 2007 and have been plotted below. We can see that, in its current composition (i.e. including
both MTFs and SBAs), the Primary MCQ has achieved very high coefficients that have remained reasonably stable. The
Final MCQ, in its current composition, appears to be improving dramatically, according to the calculated (linear) trendline.
The SAQ, however, appears to be falling, according to its trendline; this could well have been affected by a drop in
reliability at the September 2013 sitting. The exam board are currently reviewing the SAQ component and considering a
change to constructed response question format which it is hoped would result in an increase in reliability for this part of
the exam.
0.600
0.650
0.700
0.750
0.800
0.850
0.900
0.950
1.000
Written Exam Reliability
MTF only Primary MCQ MTF only Final MCQ Final SAQ
MTF & SBA Primary MCQ MTF & SBA Final MCQ