
frb_091996
182
VOLUME 82 • NUMBER 9 • SEPTEMBER 1 9 9 6 FEDERAL RESERVE BULLETIN BOARD OF GOVERNORS OF THE FEDERAL RESERVE SYSTEM, WASHINGTON, D.C. PUBLICATIONS COMMITTEE Joseph R. Coyne, Chairman • S. David Frost • Griffith L. Garwood • Donald L. Kohn • J. Virgil Mattingly, Jr. • Michael J. Prell • Richard Spillenkothen • Edwin M. Truman The Federal Reserve Bulletin is issued monthly under the direction of the staff publications committee. This committee is responsible for opinions expressed except in official statements and signed articles. It is assisted by the Economic Editing Section headed by S. Ellen Dykes, the Graphics Center under the direction of Peter G. Thomas, and Publications Services supervised by Linda C. Kyles. Digitized for FRASER http://fraser.stlouisfed.org/ Federal Reserve Bank of St. Louis
Transcript of frb_091996

VOLUME 8 2 • NUMBER 9 • SEPTEMBER 1 9 9 6
FEDERAL RESERVE
BULLETIN
BOARD OF GOVERNORS OF THE FEDERAL RESERVE SYSTEM, WASHINGTON, D . C .
PUBLICATIONS COMMITTEE
Joseph R. Coyne, Chairman • S. David Frost • Griffith L. Garwood • Donald L. Kohn • J. Virgil Mattingly, Jr. • Michael J. Prell • Richard Spillenkothen • Edwin M. Truman
The Federal Reserve Bulletin is issued monthly under the direction of the staff publications committee. This committee is responsible for opinions expressed except in official statements and signed articles. It is assisted by the Economic Editing Section headed by S. Ellen Dykes, the Graphics Center under the direction of Peter G. Thomas, and Publications Services supervised by Linda C. Kyles.
Digitized for FRASER http://fraser.stlouisfed.org/ Federal Reserve Bank of St. Louis

Table of Contents
791 DERIVATIVES DISCLOSURES BY MAJOR U.S. BANKS, 1995
This review of the 1995 annual reports of ten major U.S. commercial banks shows that public disclosure about derivatives activities continues to improve. Compared with reports for earlier years, banks are providing more types of infor-mation in greater depth and in ways that make the information more easily understood by read-ers of public financial statements. These large banks, in response to standards and recommen-dations promulgated by various groups as well as by shareholder concerns, have made signifi-cant strides in increasing the transparency of their derivatives activities.
8 0 2 TREASURY AND FEDERAL RESERVE FOREIGN EXCHANGE OPERATIONS
Over the second quarter of 1996, the dollar appreciated 3.2 percent against the German mark, 2.2 percent against the Japanese yen, and 1.6 percent on a trade-weighted basis against the other Group of Ten currencies. The U.S. mone-tary authorities did not undertake any interven-tion operations in the foreign exchange market during the quarter.
8 0 6 INDUSTRIAL PRODUCTION AND CAPACITY UTILIZATION FOR JULY 1996
Industrial production edged up 0.1 percent in July, to 126.2 percent of its 1987 average, after an upward revised gain of 0.6 percent in June. Industrial capacity utilization decreased 0.2 per-centage point, to 83.2 percent.
8 0 9 STATEMENTS TO THE CONGRESS
Herbert A. Biern, Deputy Associate Director, Division of Banking Supervision and Regula-tion, discusses actions that the Federal Reserve has taken over the past several years to address the problem of "prime bank" financial instru-ments and says that the Board believes that continuing successful prosecution of cases involving fraudsters selling these instruments is crucial and that new statutory authority enhanc-
ing law enforcement's ability to prosecute wrongdoers may prove useful, before the Senate Committee on Banking, Housing, and Urban Affairs, July 17, 1996.
811 Alan Greenspan, Chairman, Board of Gover-nors, discusses the performance of the U.S. economy in the first half of 1996 and the con-duct of monetary policy and says that even though the U.S. economy is using its productive resources intensively, inflation has remained qui-escent and that looking forward, there are a number of reasons to expect demands to moder-ate and economic activity to settle back toward a more sustainable pace in the months ahead, before the Senate Committee on Banking, Hous-ing, and Urban Affairs, July 18, 1996. [Chair-man Greenspan presented identical testimony before the Subcommittee on Domestic and Inter-national Monetary Policy of the House Commit-tee on Banking and Financial Services on July 23, 1996.]
815 Janet L. Yellen, member, Board of Governors, discusses trends in consumer lending and the Federal Reserve Board's view of how recent developments in this sector are affecting U.S. commercial banks and says that although the recently emerging trend of higher delinquencies and personal bankruptcies has prompted the Federal Reserve to devote more attention to the monitoring of consumer loan exposures, both on and off balance sheets, and to the evaluation of risk-management practices, the industry's condi-tion is strong in terms of its profitability, capital ratios, loss reserves, and overall asset quality, before the Subcommittee on Financial Institu-tions and Regulatory Relief of the Senate Com-mittee on Banking, Housing, and Urban Affairs, July 24, 1996.
819 Chairman Greenspan addresses certain recent reports on the Federal Reserve's operations, in particular some issues raised by the General Accounting Office (GAO) with respect to the management of the Federal Reserve System, and says that in summary, although the Board believes that much of the GAO's analysis and
Digitized for FRASER http://fraser.stlouisfed.org/ Federal Reserve Bank of St. Louis

recommendations have merit, the Board takes exception to the broad implication of the GAO report that the Federal Reserve has not exercised appropriate budget constraint and that it has not adequately addressed the changing technologi-cal and financial environment in which it oper-ates; Chairman Greenspan says that in his experience the Federal Reserve is as well run an organization as any with which he has been associated, private or public, before the Senate Committee on Banking, Housing, and Urban Affairs, July 26, 1996.
8 2 4 ANNOUNCEMENTS
Nominations sought for appointments to the Consumer Advisory Council.
Final rule amending Regulation K.
Extension of comment period on proposal to amend Regulation E; proposal to modify the conditions under which section 20 subsidiaries of bank holding companies may underwrite and deal in securities.
Availability of the revised lists of over-the-counter stocks and of foreign stocks that are subject to margin regulations.
826 MINUTES OF THE FEDERAL OPEN MARKET COMMITTEE MEETING HELD ON MAY 21, 1996
At its meeting on May 21, 1996, the Committee adopted a directive that called for maintaining the existing degree of pressure on reserve posi-tions and that did not include a presumption about the likely direction of any adjustments to policy during the intermeeting period.
833 LEGAL DEVELOPMENTS
Various bank holding company, bank service corporation, and bank merger orders; and pend-ing cases.
A1 FINANCIAL AND BUSINESS STATISTICS
These tables reflect data available as of July 29, 1996.
A 3 GUIDE TO TABULAR PRESENTATION
A4 Domestic Financial Statistics A42 Domestic Nonfinancial Statistics A50 International Statistics
A 6 3 GUIDE TO STATISTICAL RELEASES AND SPECIAL TABLES
A 7 6 INDEX TO STATISTICAL TABLES
A 7 8 BOARD OF GOVERNORS AND STAFF
A 8 0 FEDERAL OPEN MARKET COMMITTEE AND STAFF; ADVISORY COUNCILS
A 8 2 FEDERAL RESERVE BOARD PUBLICATIONS
A 8 4 MAPS OF THE FEDERAL RESERVE SYSTEM
A 8 6 FEDERAL RESERVE BANKS, BRANCHES, AND OFFICES
Digitized for FRASER http://fraser.stlouisfed.org/ Federal Reserve Bank of St. Louis

Derivatives Disclosures by Major US. Banks, 1995
Gerald A. Edwards, Jr., and Gregory E. Eller, of the Board's Division of Banking Supervision and Regula-tion, prepared this article. Terrill Garrison provided research assistance.
The use of derivative contracts has grown rapidly during the 1990s. These off-balance-sheet instru-ments, whose market value (and cash flow) changes with that of an underlying variable (such as an inter-est rate, a foreign currency exchange rate, an equity price, or a commodity price), are a powerful tool for companies in managing their exposure to risk.1
The increasing importance of derivatives to finan-cial institutions (including banks that are dealers of these instruments), as well as to other enterprises, has heightened the need to understand them better.
Public awareness of these instruments has also grown, a consequence of highly publicized losses by some large businesses and municipalities that had entered into derivative contracts. In a few instances, the losses were blamed on derivatives even though they had in fact resulted from the trading of tradi-tional financial instruments. Nevertheless, these events illustrate the need for firms entering into contracts, shareholders of these firms, policymakers, and the public to understand derivative instruments more fully.
The risks associated with derivatives are no differ-ent from the risks that firms have always had to recognize and control (see box "Risks Associated with Derivatives"). All financial contracts carry some degree of risk. Nonderivative contracts, in fact, can be riskier and more complex than derivatives. For example, a junk-rated bond that is tied to a foreign interest rate and is convertible into the issuer's com-mon stock carries credit and market risk that would be difficult to quantify. In contrast, the risks of some derivatives, such as futures contracts, can be easily assessed because prices are observable from trading on exchanges and cash changes hands daily to main-tain collateral, mitigating credit risk. Nonetheless, derivatives can be highly complex in their design,
1. See box "Classes of Derivatives" for an explanation of the different types of derivatives and the ways they are used.
and their pricing can be opaque, making their risks difficult to understand, measure, and manage.
One approach to increasing public understanding of derivatives has been the implementation of more comprehensive accounting practices and disclosure requirements. In particular, these two tools are help-ful in characterizing more accurately the effects of these instruments on firms' financial performance and in explaining those effects through public finan-cial reporting. The benefits of these tools are not limited to derivatives, however. They should also lead to better understanding of how firms manage risks arising from nonderivative financial contracts as well as from other sources. The goals are to demys-tify derivatives, to facilitate the assessment of firms' derivatives activities by readers of financial state-ments, and thereby to help improve the allocation of capital by financial markets.
Many groups have been involved in bringing about changes in derivatives accounting and reporting: authorities that set accounting standards, regulators and bank supervisors, and industry associations. These groups have set various regulatory require-ments and have made numerous recommendations (see box "Requirements and Recommendations for Public Disclosure"). As a result, the nature of the information publicly disclosed by firms has been evolving in several ways, including the amount and type of information disclosed and the way informa-tion is presented.
The published annual reports to shareholders and other public financial reports of banks and other com-panies play an important role in disseminating infor-mation to investors, creditors, and other stakeholders in the enterprises. The information they convey about derivatives has improved significantly in the past few years. A survey of the annual reports of the top ten U.S. banks that deal in derivatives showed that their 1994 reports were substantially more "transparent" than their 1993 reports, with more discussion and analysis of, and more quantitative information about, their use of these instruments.2
2. Gerald A. Edwards, Jr., and Gregory E. Eller, "Overview of Derivatives Disclosures by Major U.S. Banks," Federal Reserve Bulletin, vol. 81 (September 1995), pp. 817-31.
Digitized for FRASER http://fraser.stlouisfed.org/ Federal Reserve Bank of St. Louis

792 Federal Reserve Bulletin • September 1996
Classes of Derivatives
Derivatives are contracts that derive their market values by reference to a physical commodity, another contract (such as a debt or equity instrument), or an interest rate or equity index (collectively referred to as "goods"). Some deriva-tive contracts may be settled either by delivery of the contracted-for good or by the payment of cash, while others are settled only in cash. Derivative contracts make reference to a notional amount. The amount is "notional" because it is only an artifice for calculating the amount of cash due periodically. There are two basic classes of derivatives, forwards and options. Both types of instruments are used as a means of transferring, between the parties to the contract, risk associated with possible changes in prices.
Forward Contracts
A forward contract is a bilateral agreement in which one party, the buyer, is obligated to purchase the contracted-for good and the second party, the seller, is obligated to sell the good to the buyer. At the inception of the forward contract, the quantity and grade of the good, the price to be paid, and the date and location of delivery are fixed. The price to be paid in the future under a new forward contract will be closely related to the good's current market price (its spot price), with adjustments to cover the costs of carrying an inventory of the good during the interim period, such as the costs of storage, insurance, and interest.
Futures. A futures contract is a type of forward that has standard commodity-unit and delivery terms and is traded on an organized exchange. A clearinghouse nor-mally serves as counterparty to both the buyer and the seller. This arrangement reduces credit risk because the parties look to the clearinghouse for performance. Clearing-houses typically reduce their credit risk by requiring that the counterparties put up collateral and by marking to market frequently. Futures are available for agricultural products and other commodities, bonds and other interest-bearing instruments, equity interests, and foreign exchange.
Forward Rate Agreements (FRAs). An FRA is a forward contract between two parties seeking to fix a future interest rate. The parties agree on an interest rate for a specified period associated with a specified notional principal amount (though no commitment to lend or borrow that amount is made). The contract is settled in cash; the payment amount is equal to the product of the notional principal amount and the difference between a spot market rate and the contractual forward rate. If the spot rate on the maturity date is higher than the contracted rate, the seller pays the difference; if the spot rate is lower, the buyer pays the difference.
Swap Contracts. An interest rate swap can be viewed as a contract that bundles a series of forward rate agreements into a single instrument, with one FRA for each swap payment through maturity of the swap contract. In a simple interest rate swap, one party agrees to make fixed cash payments (equivalent to a fixed rate of interest based on a notional principal amount) and the other party agrees to make variable cash payments (equivalent to a floating-rate index such as the London Interbank Offered Rate, LIBOR). Besides interest rates, the structure of exchanging a fixed payment for a floating payment has been applied to such goods as foreign exchange, precious metals, and bulk commodities.
Option Contracts
An option contract is a unilateral agreement in which one party, the option writer, is obligated to perform under the contract if the option holder exercises his or her option. The option holder pays a fee, or "premium," to the writer for this privilege. The option holder is under no obligation, however, and will exercise the option only when the exer-cise price is favorable relative to current market prices. If, on the one hand, prices move unfavorably for the option holder, the holder loses only the premium. If, on the other hand, prices move favorably for the option holder, the holder gains (a theoretically unlimited amount) at the expense of the option writer. In an option contract, the exer-cise (or "strike") price, the delivery date, and the quantity and quality of the commodity are fixed.
Options can be either calls or puts. A call option grants the holder of the contract the right to purchase a good from the option writer, while a put option grants the holder the right to sell the underlying good to the option writer.
Interest rate caps and floors can be viewed as a series of call options packaged into a single financial instrument in which the underlying good is an interest rate index. For example, a borrower arranges to borrow at a variable rate reset quarterly at LIBOR. He also purchases a 6.5 percent rate cap. If LIBOR rises to 9 percent, the borrower pays his creditor 9 percent and receives from the cap writer 2.5 per-cent (9 percent minus the 6.5 percent option exercise price). The borrower has effectively limited his interest expense to a maximum of 6.5 percent plus the premium paid for the interest rate cap.
Under a floor contract, the borrower writes an option in which he agrees to pay the difference between the strike price and the interest rate index specified in the contract. The premium received offsets a portion of the overall inter-est expense of the obligation; however, the debtor retains exposure to higher interest rates and forgoes the benefit of lower interest rates on his floating-rate obligation.
Digitized for FRASER http://fraser.stlouisfed.org/ Federal Reserve Bank of St. Louis

Derivatives Disclosures by Major U.S. Banks, 1995 793
Risks Associated with Derivatives
The risks associated with derivative contracts are no differ-ent from those associated with other bank financial instru-ments. The major categories of risk are described here.
Credit risk is the possibility of loss from the failure of a counterparty to fully carry out its contractual obligations. The types of information about credit risk associated with derivatives that institutions might disclose include the following:
• Gross positive market value—the gross replacement cost of a contract, excluding the effects of any netting arrangements
• Current credit exposure—the fair value on a given date of contracts that are favorable to the holder (that is, are assets)
• Potential credit exposure—a statistical measure of the possible future value of contracts held today if prices or rates move favorably for the holder before the contracts mature
• Credit risk concentrations—indicators of diversifica-tion by geographic area or industry group
• Collateral and other credit enhancements that may reduce credit risk
• Counterparty credit quality, nonperforming contracts, and actual credit losses.
Market risk is the possibility that the value of a financial contract (or of a real asset, for that matter) will adversely change before the contract can be liquidated or offset with
other positions. The value of these contracts may change because of changes in interest rates (interest rate risk), foreign exchange rates (foreign exchange rate risk), or commodity prices or other indexes.
For some larger institutions, disclosure of information about internal value-at-risk measures and methodology can help financial statement readers understand the institution's exposure to market risk. Using value-at-risk methods involves the assessment of potential losses in portfolio value resulting from adverse movements in market risk factors for a specified statistical confidence level over a defined holding period.
Liquidity risk has two broad types: market liquidity risk and funding risk. Market liquidity risk arises from the possibility that a position cannot be eliminated quickly either by liquidating it or by establishing offsetting posi-tions. Funding risk arises from the possibility that a firm will be unable to meet the cash requirements of its contracts.
Operational risk is the possibility that losses may occur because of inadequate systems and controls, human error, or mismanagement.
Legal risk is the possibility of loss that arises when a contract cannot be enforced because of, for example, poor documentation, insufficient capacity or authority of the counterparty, or uncertain enforceability of the contract in a bankruptcy or insolvency proceeding.
This article follows up on the previous survey by reviewing the 1995 annual reports of the top ten banks that deal in derivatives. Although disclosure requirements did not change during the intervening period, banks nonetheless improved their reporting of derivatives activities in 1995 compared with 1994. In particular, they expanded their discussions of deriva-tives activities and provided more quantitative infor-mation. The vastly greater amount of information presented in the 1995 reports is especially evident when they are compared with the financial statements issued for 1992, in which banks typically disclosed little more than the total value of their trading assets and liabilities, their total trading profits, their overall net credit exposure across all counterparties, and the notional amounts of their derivative contracts.3 Regu-lators and industry groups that have advocated fuller disclosure have clearly had significant influence in
3. The notional amount is the face amount of a contract to which an interest rate, a price, or a rate of exchange is applied to determine the contractual cash payments or receipts. In general, the notional amount is not exchanged and does not reflect the risk of a transaction.
improving the overall quality of reporting about derivatives activities.
REVIEW OF 1995 ANNUAL REPORTS
The institutions whose annual reports were surveyed for this article were the ten U.S. commercial banks having the greatest credit risk exposure from deriva-tives on December 31, 1995 (taking into account the effects of netting agreements) (table l).4 Nine of the
4. In this article, "bank" refers to a banking organization, compris-ing bank holding companies, their banking affiliates, and other subsid-iaries that are consolidated for purposes of public financial reporting.
Credit risk exposure as of a particular date (current credit exposure) is a measure of the potential loss resulting from a hypothetical default by a counterparty. It is the fair value on the date of measurement of those contracts that are favorable to the bank (that is, those that are assets). If a legally enforceable bilateral netting agreement is in place, credit risk exposure is the net fair value of all contracts subject to the agreement. For example, if a bank has two contracts with a counter-party, one worth $10 and the other worth - $ 6 , the bank's credit risk exposure is $10. If, however, the bank and its counterparty have agreed to net their contracts, the bank's credit risk exposure is $4
Digitized for FRASER http://fraser.stlouisfed.org/ Federal Reserve Bank of St. Louis

794 Federal Reserve Bulletin • September 1996
Ten U.S. commercial banks with the greatest exposure to credit risk from derivatives on December 31, 1995 Billions of dollars
Institution Credit risk exposure1
Total notional amount of derivatives outstanding
J.P. Morgan & Company Chase Manhattan Corporation2
33.6 3,403 28.0 4,728 19.4 2,301 12.1 1,742 8.3 1,515
7.3 801 3.3 1,006 3.0 268
.6 58
.6 56
Bankers Trust New York Corporation .. BankAmerica Corporation
First Chicago NBD Corporation NationsBank Corporation Republic New York Corporation State Street Boston Corporation Bank of New York
33.6 3,403 28.0 4,728 19.4 2,301 12.1 1,742 8.3 1,515
7.3 801 3.3 1,006 3.0 268
.6 58
.6 56
1. Exposure taking into account the effects of legally enforceable bilateral netting agreements.
2. Pro forma combination for Chemical Banking Corporation and Chase Manhattan Corporation.
SOURCE. Publicly available regulatory reports filed by bank holding com-panies with the Federal Reserve.
ten banks were also included in the survey of 1994 annual reports. Two of the 1994 banks, Chemical Banking Corporation and Chase Manhattan Corpora-tion, merged in 1996 and published a combined annual report for year-end 1995. Moving into the group for 1995 was State Street Boston Corporation.5
These ten banks dominate the banking industry's share of the derivatives market: Collectively, they accounted for more than 95 percent of the derivatives held or issued by all U.S. banks at year-end 1995 in terms of notional amounts; they accounted for a similar share of the industry's trading portfolios in terms of fair value (table 2). Of the derivatives they held or had issued as of year-end, approximately two-thirds were interest rate contracts and one-third were foreign exchange contracts, with a small amount of equity and commodity exposures. The ten banks also accounted for nearly 90 percent of the profits from trading that were earned by all U.S. banks in 1995.
In their annual reports, banks disclose information about derivative instruments on a consolidated basis (that is, combining all legal entities that make up the enterprise). The information is usually presented in two main sections of the report:
($10 - $6). Note that the current credit exposure of the ten banks on December 31, 1995, was approximately 1 percent of the total notional amount of their outstanding derivative contracts (see table 1).
5. Also included in the tables in this article, to provide a baseline for assessing the extent of change, are data on disclosures in the 1993 annual reports of the top ten banks. The group of banks for that year was essentially the same as in 1994. Continental Bancorp, which was ranked in the top ten in 1993, was acquired by BankAmerica Corpora-tion in 1994. It was replaced in the 1994 survey by Bank of New York, which had been eleventh in 1993.
• Management's discussion and analysis provides, in narrative form supported by tabular or graphical data, an analysis of the bank's financial condition and performance. As part of its analysis, management typically describes the bank's exposures to risk and its techniques for managing risk. This section is not usually audited by independent accountants.
• The annual financial statement presents state-ments of financial position, income, changes in stockholders' equity, and cash flow. The financial statement and any accompanying footnotes are typi-cally audited by independent accountants.
This survey considered disclosures in both sections of the annual reports. The analysis was "binary," with coverage judged to be either present or not present, and the decision about whether or not a particular disclosure was present was in many instances subjective. Information on derivatives used for trading purposes was analyzed separately from information on derivatives intended for risk manage-ment or other end-user purposes. Because groups that set disclosure standards also recommend that firms report on their trading of nonderivative finan-cial instruments and nonfinancial items (such as precious metals or other physical commodities), we
2. Derivatives positions and trading activity of the top ten banks and all U.S. banks, 1995 Billions of dollars
Item
TYPE OF DERIVATIVE INSTRUMENT
Interest rate contracts Foreign exchange contracts Equity, commodity, or other contracts
Total
POSITIONS IN TRADING PORTFOLIO
Trading assets Derivatives
Trading liabilities Derivatives
Total trading positions (absolute value) Derivatives
TYPE OF RISK ASSUMED TO EARN PROFIT
Interest rate Foreign exchange Equity, commodity, or other
Total
Top ten banks All banks
Notional amount of derivatives outstanding
as of year-end
10,231 10,800 5,286 5,366
361 361 15,878 16,527
Fair value as of year-end
255 275 95 100
159 169 97 102
414 444 191 202
Trading profit from all sources for year
2.9 2.0
.8 5.7
3.3 2.4
6.5
SOURCE. Publicly available regulatory reports filed by bank holding com-panies with the Federal Reserve.
Digitized for FRASER http://fraser.stlouisfed.org/ Federal Reserve Bank of St. Louis

Derivatives Disclosures by Major U.S. Banks, 1995 795
also reviewed the reports for disclosures about those instruments. A look at the trading books of the ten banks gives some perspective on the extent of the use of derivatives as a trading vehicle: Derivatives accounted for less than half of the fair value of their trading assets and liabilities on December 31 (table 2). In this article, information for all trading account items is presented to give a more complete picture of trading.
QUALITATIVE INFORMATION
Managers give qualitative information in the narra-tive portions of their annual reports in which they identify the risks presented by their business activi-ties and their methods for measuring and controlling those risks. The depth of these narratives on risk has increased substantially over the past few years. The banks' 1993 reports typically had only limited dis-cussions about trading and perfunctory information about derivatives. The 1994 reports had much richer disclosure on these topics. The overriding characteris-tics of the 1995 annual reports were refinement of methods of disclosure first used in 1994 and further diffusion of these methods among the top ten banks; for example, whereas a 1994 report might have dis-cussed overall value at risk, the 1995 report broke down value at risk into its elements and discussed exposure to different kinds of risk.6
Discussion of Specific Risks
Although nearly all of the banks described credit and market risk in 1994, the 1995 reports contained fuller, more coherent explanations of exposures to those risks (table 3). The 1995 reports as a rule broadened the approaches used in 1994 to frame discussions and analyses of other products (such as bonds) and other lines of business (such as selling foreign currency to customers or trading for the firm's own account as opposed to marketmaking). Also, the reports gener-ally integrated discussions of derivatives into clearer discussions of identical risks inherent in traditional banking books; in contrast, disclosures about market and credit risk in some of the 1994 reports focused solely on derivatives. In 1995, as in earlier years, the
6. Value at risk is a method of measuring risk by estimating potential losses in portfolio value that could result from adverse movements in market prices and other risk factors. The method is based on statistics in which a confidence level and a portfolio holding period are specified.
3. Number of top ten banks discussing their management objectives and the risks of derivatives in their annual reports, 1993-95
Type of qualitative disclosure Number of banks disclosing
Type of qualitative disclosure 1 9 9 3 1 9 9 4 1 9 9 5
DISCUSSION OF MANAGEMENT OBJECTIVES AND STRATEGIES
For trading activities For nontrading activities
DISCUSSION OF RISKS AND MANAGEMENT TECHNIQUES
Placed in context with balance sheet
4 9 10 4 1 0 1 0
7 1 0 1 0
6 9 10 6 9 10 4 6 9 1 3 3
Credit risk Market risk Liquidity risk Operating and legal risks
4 9 10 4 1 0 1 0
7 1 0 1 0
6 9 10 6 9 10 4 6 9 1 3 3
depth of discussion was roughly commensurate with the importance of trading profits to the institution's overall income. For example, some banks earned more on deposit account service charges than they did from trading, and the limited level of disclosure about trading may have reflected that priority.
Similarly, banks' discussions of funding liquidity risk at their institutions and their means of controlling it were generally more informative in 1995. Banks summarized their processes for identifying their fund-ing requirements, their procedures for predicting cash needs, and contingency plans for unexpected cash demands. None of the banks, however, discussed the market liquidity of their financial instrument port-folios.
Disclosures of operating and legal risks were somewhat more detailed in 1995, but discussions of management techniques for controlling these risks remained rather shallow. This shallowness may reflect the difficulty of reliably quantifying these risks. However, it is noteworthy that the roots of some of the more notorious trading debacles in recent years can be traced to operating or legal problems; therefore, more discussion of these risks might have been appropriate.
Most of the ten banks described their processes for controlling the risks arising from trading and other business activities by identifying the management group responsible for setting trading policies and by describing the managerial functions responsible for ensuring compliance with those policies. The typical report gave an overview of risk management that sketched the bank's business objectives and its management philosophies (for example, by describ-ing the extent to which its management responsi-bilities are centralized or diffuse). Most banks also briefly described the information systems and
Digitized for FRASER http://fraser.stlouisfed.org/ Federal Reserve Bank of St. Louis

796 Federal Reserve Bulletin • September 1996
Requirements and Recommendations for Public Disclosure
Although authorities that set accounting standards, regula-tors, and industry groups have long recognized that there are deficiencies in accounting practices for and disclosure of financial instruments in general, the growing use of derivatives has brought these deficiencies into sharp focus. The Financial Accounting Standards Board (FASB), the organization that sets accounting standards, in 1986 created a task force on financial instruments to address these defi-ciencies. After some study, the FASB decided that the accounting issues surrounding derivatives would be best addressed by first establishing minimum disclosure require-ments and then devising consistent accounting methods. The FASB has so far published three statements of account-ing standards (SFAS) affecting disclosures about deriva-tives and other financial instruments. Financial statements that conform to generally accepted accounting principles necessarily follow these standards.
SFAS 105, Disclosure of Information about Financial Instruments with Off-Balance-Sheet Risk and Financial Instruments with Concentrations of Credit Risk, became effective with 1990 annual reports. It requires the disclosure of the basic contractual terms of certain derivative contracts and discussion of their market and credit risks. It also requires the disclosure of large concentrations in credit risk and, for certain derivative instruments, the disclosure of the loss the firm could incur if counterparties were to default on their obligations.
SFAS 107, Disclosure about Fair Value of Financial Instruments, requires the disclosure of the fair value of derivatives (as well as that of most traditional banking instruments). The standard first applied to 1992 annual reports; it was amended by SFAS 119 for the purpose of making fair value disclosures better organized and more understandable to readers of financial statements.
SFAS 119, Disclosure about Derivative Financial Instru-ments and Fair Value of Financial Instruments, became effective for 1994 annual reports. It requires firms to differ-entiate in their disclosures between derivatives used for trading purposes and those used for risk management or other "end-user" purposes.
• Trading activities. For derivatives used for trading, firms must report the fair value of their derivatives posi-tions (both as of year-end and as an annual average) and must report their profits from the trading of derivatives separately; these trading profits may be reported as a total or may be broken down by, for example, line of business (such as sales of foreign currency) or exposure to market risk (such as interest rate or foreign exchange risk).
• End-user activities. Firms must explain their objectives in using derivatives for hedging or other risk-management purposes and must discuss their strategies for achieving those objectives. They must also indicate where in then-financial statements end-user derivatives are presented and give certain details about derivatives used to hedge
anticipated transactions (such as the amount of gains or losses that were deferred). The fair values of end-user derivatives must be disclosed separately from the fair values of items hedged by the derivatives. Encouraged but not required is the disclosure of quantitative information that managers use as a basis for controlling risk exposure.
Proposed Requirements
Disclosures in the 1995 annual reports were influenced by requirements formally proposed in December 1995 by the Securities and Exchange Commission (SEC), the agency responsible for administering federal securities laws and for regulating accounting and disclosure by publicly traded companies. The SEC has delegated much of its authority for setting accounting standards for publicly traded compa-nies to the Financial Accounting Standards Board, but it also occasionally issues supplemental guidance. The pro-posed amendments to current requirements focus on the disclosure of market risk. If adopted, they would become effective for 1996 annual reports.
The SEC proposal requires more detailed disclosure of quantitative and qualitative information about the market risks associated with derivatives. Quantitative information could be disclosed by means of (1) a table showing con-tract terms and other information, including fair value, expected cash flows, and effective rates and prices; (2) a sensitivity analysis of a hypothetical loss of earnings, fair values, or cash flows resulting from an arbitrary change in current interest rates, foreign exchange rates, or commod-ity or other prices; or (3) a statement of value at risk expressing the companywide (that is, in trading as well as in other lines of business) loss of fair values, earnings, or cash flows of market-risk-sensitive instruments that might arise from price movements of a given likelihood of occur-rence over some time interval, with a separate estimate of value at risk for each type of market risk to which the firm is exposed. Also required would be the disclosure of limita-tions that might cause the quantitative information about market risk to not fully reflect the overall market risk to the company.
The SEC proposal also requires that companies disclose more detail than currently required by the FASB about their procedures for accounting for derivatives, including information about the accounting methods used, the types of derivatives to which each method was applied, and the criteria for choosing which method to apply.
Recommendations
In the past two years, several industry groups and regula-tors, either individually or in association with other agen-cies, have called for additional disclosure of derivatives activities. These groups have generally stressed the advi-sory nature of their recommendations, in an effort to encour-
Digitized for FRASER http://fraser.stlouisfed.org/ Federal Reserve Bank of St. Louis

Derivatives Disclosures by Major U.S. Banks, 1995 797
Requirements and Recommendations for Public Disclosure—Continued
age firms to develop better ways of informing readers of financial statements and of enhancing market discipline. Their recommendations, though nonbinding, appear to have influenced disclosures in the 1994 and 1995 annual reports.
Euro-currency Standing Committee
In 1994, a working group of the Euro-currency Standing Committee of the Group of Ten central banks (ECSC) recommended that firms disclose quantitative information about their market and credit risk exposures and their suc-cess at managing those risks, to provide a framework for their qualitative discussions. At a minimum, quantitative information about the market risk of the trading portfolio should be disclosed; also desirable is similar disclosure about the consolidated portfolio (that is, about derivatives and financial instruments relating to traditional banking activities as well as to trading). The information should reveal the portfolio's riskiness by indicating the volatility of its market value.
The ECSC also recommended that firms increase the transparency of their disclosures about credit risk. Sugges-tions include the reporting of current and potential credit exposure and the quantification of the variability of credit exposure over time. Reporting of actual credit losses, arrangements for collateral, and other credit enhancements were suggested to give an indication of the quality of the firm's risk-management practices.
Basle Supervisors Committee and International Organisation of Securities Commissions
In November 1995, the Basle Supervisors Committee (BSC) and the International Organisation of Securities Commis-
sions (IOSCO), international associations of national regu-lators, made several recommendations for the disclosure of more qualitative and quantitative information about trading and derivatives activities and their effect on credit risk and earnings. The groups agreed on using a common set of data provided by regulated enterprises to assess the use of derivatives by these enterprises. The recommendations were issued in connection with a survey of disclosures in the 1994 annual reports of seventy-nine large international banks and securities firms in the Group of Ten (G-10) countries. The 1994 and 1995 annual reports described in this article provided virtually all the data recommended by these groups.
Other Information about Derivatives Available to the Public
Regulators have long required that banking organizations report notional amounts and fair values of the derivative instruments they hold or have issued. Since 1995, the Federal Reserve and the other federal banking agencies, under the auspices of the Federal Financial Institutions Examination Council (FFIEC), have required that notional amounts and fair values be reported by risk exposure and management objective. Information about trading revenues and the effects of end-user derivatives on accrual-basis income has also been required since 1995, as has the past-due status of derivative contracts and actual credit losses. This information is available to the public. The information required in these regulatory reports appears to have influenced the disclosures made by the larger of the top ten banks in their 1995 annual reports.
management tools used to assess the results of their efforts to control risk.
Explanation of the Financial Presentation of Derivatives
Under generally accepted accounting principles, firms have long been required to describe their accounting policies in general terms. More recently they have had to disclose their means of determining the fair value (sometimes called the fair market value) of many financial instruments they hold or issue. For derivatives, firms must describe not only the way they determine fair value but also the accounting methods under which they recognize income and expense and the legal techniques that underlie their presentation of net credit exposure in financial reports. In meeting these requirements, all ten banks
discussed their reasons for using derivatives, identi-fied where in the financial statement information about derivatives was presented, and explained how derivatives were accounted for (that is, by fair value or on an accrual basis; see box "Accounting for Derivative Contracts"). In general, their 1995 descriptions were better organized and more specific than those in earlier reports. The 1995 reports also provided much more detailed and more useful descriptions of the methods and assumptions used in valuing financial instruments that did not have observable market prices.
QUANTITATIVE INFORMATION
Quantitative information illuminates management's discussion of the firm's financial performance. With respect to derivatives and trading, these data give
Digitized for FRASER http://fraser.stlouisfed.org/ Federal Reserve Bank of St. Louis

798 Federal Reserve Bulletin • September 1996
Accounting for Derivative Contracts
Derivative instruments, like some other financial instru-ments such as traditional loan commitments, are executory contracts. That is, the two parties to the contract have made mutual promises but have not carried out all the obligations specified in the contract. Under generally accepted account-ing principles, an executory contract is reported in a finan-cial statement only after some economic performance (in what may be a series of requirements) has taken place— under a firm commitment to lend, for example, when funds are drawn. The commitment is "off balance sheet" until some performance occurs. When the cash disbursement is reported as a loan, the financial contract can be said to be "on balance sheet."
In keeping with this accounting principle for executory contracts, the accounting treatment of derivative instru-ments may reflect only the next required contractual perfor-mance during the period covered by the financial statement (such as the accrual of a cash receipt or disbursement characterized as income or expense). Under this procedure, an example of accrual accounting, even though a party to a derivative contract—an interest rate swap, for example— could be obligated to make a series of cash payments over a number of years if interest rates change adversely, these potential future obligations are not reflected on the balance sheet. Hence, the derivative contract is "off balance sheet," and its potential risks and rewards are obscure. Also, when derivative contracts are used as hedges, losses or gains on them may be deferred to match revenue from loans or interest expenses on deposits or other items being hedged.
Future benefits or obligations associated with off-balance-sheet contracts, then, are not well captured in financial statements and therefore lack transparency.
Although executory contracts may not be recognized for accounting purposes, they nonetheless have economic value. For example, an interest rate swap entitling a firm to receive a fixed rate of 8 percent is more valuable than one entitling the firm to receive 7 percent, even though the comparative benefit does not appear on the balance sheet. In some financial reporting situations (such as in reporting trading activities), using economic value is more relevant than using accrual accounting conventions to represent derivatives. The accounting practice of estimating eco-nomic value, called marking to market, involves deter-mining the fair value of the contract (by market quote, if available; otherwise through estimation techniques), record-ing that value on the balance sheet, and recognizing the change in value as a gain or a loss. When derivative contracts are marked to market, their fair value is reflected in accounting statements at a point in time (the balance sheet date) and their volatility is demonstrated through the change in fair value reported in earnings.
Accountants may disagree about which procedure— marking to market or accruing cash flows—more faithfully represents a particular transaction. However, they do agree that more thorough disclosure of the contractual terms of derivative contracts and discussion by management of their hedging programs and the results of those efforts improve the transparency of off-balance-sheet instruments.
readers of financial statements an indication of the levels of market and credit risk assumed by the bank and finer detail on the profit the organization earned by taking those risks.
Basic Information on Derivatives Positions
The top ten banks continued in 1995 to disclose the general contractual terms of their derivative contracts (table 4). All ten reported the notional amounts of such contracts, in all cases distinguishing derivatives used in trading from those intended for other (so called end-user) purposes. Most of the ten provided details on their annual average and year-end trading positions, giving the dollar values of assets and liabilities in their trading portfolios disaggregated among the different classes of derivatives and other items therein. Some types of information published in 1994 appeared less frequently in 1995: gross posi-tive and negative fair values of derivatives positions
and, for interest rate contracts held for trading pur-poses at year-end, detailed schedules of interest rates and maturities.
Disclosures about Traded Derivatives
Most of the ten banks gave more detail about their trading positions and trading revenues in 1995 than had been done in 1994. This enhancement follows a significant change in the 1994 reports: For that year, generally accepted accounting principles for the first time required that firms separate the fair values of derivative contracts in a gain position (assets) from those in a loss position (liabilities), under much more stringent rules for netting for accounting purposes.7
These details were supplemented in 1995 with more information on the types of instruments, both deriva-
7. As a result of this accounting change, the assets and liabilities of one of the ten banks increased $14 billion. The change had no effect on income, however.
Digitized for FRASER http://fraser.stlouisfed.org/ Federal Reserve Bank of St. Louis

Derivatives Disclosures by Major U.S. Banks, 1995 799
4. Number of top ten banks disclosing the general terms of their derivative contracts in their annual reports, 1993-95
Type of quantitative disclosure Number of banks disclosing
Type of quantitative disclosure 1 9 9 3 1 9 9 4 1 9 9 5
NOTIONAL AMOUNTS
Dealer (trading account) positions . . . 5 9 1 0 End-user (nontrading account)
positions 1 0 1 0 1 0 Derivatives traded over the counter
separated torn those traded on an exchange 3 4
Maturity schedule Dealer (trading account) positions . . . 1 6 2 End-user (nontrading account)
positions 7 1 0 8 Combined 2 1 3
Contract rates Receive or pay rates 3 1 0 4 Receive or pay notional amounts 2 1 0 4
FAIR VALUE DATA
Gross positive fair value 7 7 4 Gross negative fair value 0 6 4
Trading account Trading assets separated from
trading liabilities 0 1 0 1 0 Nonderivative instrument detail
End-of-period fair value 0 8 1 0 Average-for-period fair value 0 6 7
Derivative instrument detail End-of-period fair value 0 9 1 0 Average-for-period fair value 0 7 7
End-user positions Overall fair value 9 9 1 0 By related asset or liability being
hedged 6 9 6 By type of derivative contract 2 6 4
tive and nonderivative, that made up the year-end fair value (and annual average fair value) of the trading portfolio.
Credit risk
The state of disclosure about credit risk in 1995 compared with 1994 was mixed (table 5). As in 1994, all ten banks reported their current credit exposure taking into account the effects of bilateral netting agreements. However, additional information about credit risk exposure was generally lacking. Six banks showed how much their gross credit risk exposure on December 31 had been reduced through bilateral netting agreements. Of these six, three also quantified the potential credit exposure of their positions.8 None of the banks gave a quantitative measure of the
8. Potential credit exposure is a measure of the probable loss to the bank if the contracts held on a certain date were to become more valuable before they mature because of favorable market price changes and then counterparties were to default.
volatility during the year of their credit exposures resulting from their trading activities.
Reflecting a general shortcoming of annual finan-cial statements—one that is not limited to the report-ing of derivatives—the ten banks furnished only limited data on the credit quality of the financial instruments they held or their portfolios as a whole. Five banks disaggregated credit exposures for their derivatives portfolios according to whether or not the counterparty was investment grade (as rated by an outside agency or internally), but banks generally did not publish this information for loan or investment portfolios. Disclosure about geographic concentra-tion was less common in 1995 than in 1994. The extent of disclosure of nonperforming contracts was unchanged: Six banks either quantified their actual credit losses and their derivative contracts for which payments were past due or explicitly stated that the amounts were immaterial. In most instances, losses were reported in the context of a discussion of losses incurred from traditional banking activities.
As a supplement to their disclosures of credit risk and capital adequacy, seven banks reported the risk-based-capital credit-equivalent amount of their off-balance-sheet contracts in describing their risk-weighted assets and risk-based capital ratios.9
9. The risk-based-capital credit-equivalent amount is a measure resulting from the conversion of off-balance-sheet contracts into an equivalent balance sheet asset. Regulatory calculations of risk-based-capital amounts and ratios are used by supervisors to assess capital adequacy.
5. Number of top ten banks disclosing in their annual reports data on credit risk relating to derivatives they trade, 1993-95
Number of banks disclosing Type of quantitative disclosure
1993 1994 1995
10 10 10
7 7 6 1 2 3 0 0 0
4 4 1
0 1 5
4 4 1
4 6 5
0 2 1 4 6 6 1 6 6
4 7 7
Current credit exposure (net) Reduction of exposure attributed to
bilateral netting agreements .. Potential credit exposure Volatility of credit exposure
Counterparty credit quality By counterparty type (for
example, bank, other corporation, government)
By internal or external credit rating of counterparty
Concentration Exposure by geographic area Exposure by industry group or
government entity
Collateral and other credit enhancements
Actual credit losses Nonperforming contracts Risk-based-capital credit equivalent
for derivatives
Digitized for FRASER http://fraser.stlouisfed.org/ Federal Reserve Bank of St. Louis

800 Federal Reserve Bulletin • September 1996
Market risk
Most of the ten banks reported details of their measurements of market risk in their 1995 annual reports. Seven reported using value at risk as a means of assessing market risk and gave daily, monthly, or quarterly data. These seven gave varying amounts of detail on the assumed holding period, the high, low, and average value at risk, and portfolio performance versus management's intended limits on losses that could result from market risk exposure (table 6). One bank gave portfolio performance figures without giving details of management's limits on losses. Four reported both management's limits and actual trading profits and losses. The disclosure of numerical details on value at risk was a significant innovation in the 1994 reports and became more widespread in the 1995 reports. Indeed, inclusion of these details is the single most remarkable development in annual report disclosures over the past two years. In their 1993 reports, several institutions indicated that they relied on a value-at-risk method but did not disclose value-at-risk data, and in their 1992 reports they were largely silent about how they managed market risk and gave little or no measure of their market risk exposure.
Several banks included in their 1995 reports addi-tional data on value at risk that reflected a recent proposal by the Securities and Exchange Commis-sion regarding market risk disclosures (see box
6. Number of top ten banks disclosing in their annual reports data on the management of market risk relating to derivatives, 1993-95
Type of quantitative disclosure Number of banks disclosing
Type of quantitative disclosure 1993 1994 1995
TRADING ACTIVITIES
Value-at-risk information High and low value at risk for the
Average daily value at risk Daily change in value of portfolio . . . Average daily change in value
of portfolio Frequency of changes in
portfolio value exceeding value-at-risk limit
Confidence interval used in value-at-risk analysis
Aggregation across risk factors
END-USER ACTIVITIES
Effect of derivatives on duration1 . . . Effect of derivatives on gap positions . Scenario analysis—Impact of rate
shock Value at risk for nontrading
portfolio
0 5 6 0 7 5 0 4 7
0 3 4
0 4 5
0 6 7 0 0 4
1 2 0 8 8 8
3 5 6
0 3 1
1. Duration is a method of measuring interest sensitivity that is based on financial instrument cash flows weighted by the time to receipt or payment.
"Requirements and Recommendations"). These banks not only described the market risks of their trading portfolios in terms of value at risk but also published data on their exposure to specific kinds of market risk (for example, interest rate and foreign exchange) as well as a measure of how these risks interacted or correlated to reduce overall market exposure through diversification.
The larger dealers among the ten banks wove these quantitative details into their discussions of risk-management policies, giving some flavor of the dynamics of their risk-taking during the year by disclosing their actual trading portfolio results rela-tive to their risk measurements and their risk-control objectives. Several banks used graphics to more fully convey information about their trading portfolios in general, about daily value at risk, and about daily changes in portfolio value.
Liquidity risk
Quantitative information about liquidity risk was lim-ited in the 1995 annual reports, as it was in the 1994 reports. The topic generally was addressed through discussion of overall institutional liquidity require-ments and policies.
Disclosures about End-User Derivatives
The most common disclosure about end-user der-ivatives was general information about positions: notional amounts, maturities, and fair values (table 4). The most prevalent means of conveying information about how derivatives were used to man-age a bank's interest rate risk continued to be a gap position schedule (table 6).10 All banks publishing a gap schedule cautioned that it represented only a point in time and did not capture option and other dynamic characteristics of the balance sheet. In sev-eral reports the gap schedule was supplemented either by a discussion of the effect of a hypothetical rate shock on capital or earnings or by a discussion of earnings-at-risk methods applied to nontrading port-folios. Publishing these alternatives to gap analysis was new in the 1994 reports and became more widespread in 1995. Most banks, in varying detail,
10. Gap analysis is a method used to estimate interest rate risk in which financial instruments are categorized by maturity in a series of time bands. Liabilities are subtracted from assets in each time interval, and the magnitude of the difference gives an indication of interest sensitivity. Banks can use derivatives to adjust their sensitivity to interest rate risk.
Digitized for FRASER http://fraser.stlouisfed.org/ Federal Reserve Bank of St. Louis

Derivatives Disclosures by Major U.S. Banks, 1995 801
described whether the derivatives were linked to spe-cific components of the balance sheet or were used to manage overall, or macro, exposures. Reflecting the expansion of value-at-risk methods to activities not related to trading, one bank furnished quantitative information on the value at risk related to its nontrad-ing portfolios.
As a result of minor changes in generally accepted accounting principles, the 1994 annual reports con-tained clearer, more understandable information about the fair value of the financial instruments in the firms' portfolios. Firms were required to disclose the fair value of financial assets and liabilities carried at historical cost separately from the fair value of derivatives used to hedge these instruments. This approach makes it much more obvious whether an instrument was favorable (that is, an asset from which the bank could expect to receive cash) or unfavorable (a liability on which the bank probably would pay cash), given year-end prices or interest rates. The 1995 reports showed little change in how this infor-mation was presented.
Disclosures about Earnings
For 1995, all ten banks disaggregated their trading revenues: Nine reported their results according to line of business or risk exposure with little differen-tiation between derivative and other instruments, and one reported about derivatives only (table 7). These numbers compare favorably with the 1994 reports,
in which most banks gave only the minimum required information (that is, they reported only about derivatives). As a result, the 1995 reports gave a more complete picture of profits and risks from trading both derivative and nonderivative financial instruments.
In contrast, fewer banks gave details about the effects of end-user derivatives on accrual-basis accounting income and expense. Only four banks reported the effect on operating income of derivatives accounted for on an accrual basis, compared with eight in 1994. And only three banks disclosed gains or losses from end-user derivatives that had been deferred and provided details on when the deferrals would be reflected in future earnings, down from five in 1994. The absence of these details makes it some-what more difficult to assess the accounting conse-quences of a bank's hedging activities (for example, whether income will decrease in future years when losses that had been deferred are recognized.)
CONCLUSION
The detail and clarity of information about deriva-tives and trading published by the top ten U.S. dealer banks continues to improve. The banks that had the more innovative annual reports in 1994 also led the group in 1995, reporting more quantitative details on value at risk and the results of their trading activities. Also as was the case in 1994, the disclosures of those banks whose trading revenues make up a larger share of their income tended to be more informative about derivatives and trading. Institutions with larger tradi-tional banking segments devoted more attention to those lines of business than to trading.
The experimentation in better approaches to disclo-sure that has been encouraged by standards setters and others is evident in the variety of methods used to present information about derivatives activities— and also in the discarding of some information that was provided in 1994. None of the reports can be singled out as the best; most of the banks had a novel approach to reporting on some aspect of their deriva-tives activities that was not used by the others. Dis-closures about market risk have been greatly improved, but it appears to us that credit risk dis-closures are lagging and need more depth. Further experimentation should be encouraged, as these pri-vate efforts have made significant strides in increas-ing the transparency of derivatives activities. •
7. Number of top ten banks disclosing data on income relating to derivatives in their annual reports, 1993-95
Type of quantitative disclosure Number of banks disclosing
Type of quantitative disclosure 1993 1994 1995
INCOME FROM TRADING ACTIVITIES
Disaggregation of income By risk exposure or line of business . By specific instrument (for
example, interest rate swaps) .. By derivative versus nonderivative
instruments
INCOME RELATED TO END-USER ACTIVITIES
Effect of derivatives on income from operations
Amount of deferred gains or losses .. Amortization period for deferred
gains or losses Unrealized gains or losses on
derivatives
2 5 9
8 7 1
5 6 4
4 8 4
6 5 3
2 5 3
7 10 10
Digitized for FRASER http://fraser.stlouisfed.org/ Federal Reserve Bank of St. Louis

802
Treasury and Federal Reserve Foreign Exchange Operations
This quarterly report describes Treasury and System foreign exchange operations for the period from April through June 1996. It was presented by Peter R. Fisher, Executive Vice President, Federal Reserve Bank of New York, and Manager for Foreign Opera-tions, System Open Market Account. Daniel Katzive was primarily responsible for preparation of the report.1
During the second quarter of 1996, the dollar traded in a relatively narrow range against the Japanese yen, fluctuating between ¥104 and ¥110. Against the
1. The charts for the report are available on request from Publica-tions Services, Mail Stop 127, Board of Governors of the Federal Reserve System, Washington, DC 20551.
NOTE. Figures may not sum to totals because of rounding. 1. Purchases and sales include foreign currency sales and purchases related to
official activity, swap drawings and repayments, and warehousing. 2. Calculated using marked-to-market exchange rates; represents the differ-
ence between the sale exchange rate and the most recent revaluation exchange rate. Realized profits and losses on sales of foreign currencies, computed as the difference between the historic cost-of-acquisition exchange rate and the sale exchange rate, are shown in table 2.
3. Foreign currency balances are marked to market monthly at month-end exchange rates.
4. See table 4 for a breakdown of Mexican swap activities. Note that the investment income on Mexican swaps is sold back to the Bank of Mexico.
mark, the dollar appreciated early in April, then pro-ceeded to trade between DM 1.51 and DM 1.55 for the duration of the quarter. Throughout the period the dollar was supported by expectations of an increase in U.S. interest rates by the end of 1996. Meanwhile, evolving market views of the likely course of German and Japanese monetary policy contributed to fluctua-tions within the trading range. Over the quarter, the dollar appreciated 3.2 percent against the German mark, 2.2 percent against the Japanese yen, and 1.6 percent on a trade-weighted basis against other Group of Ten (G-10) currencies.2 The U.S. monetary
2. The dollar's movements on a trade-weighted basis against ten major currencies are measured using an index developed by staff of the Board of Governors of the Federal Reserve System.
5. Valuation adjustments on peso balances do not affect profit and loss because the effect is offset by the unwinding of the forward contract at the repayment date. Note that the ESF does not mark to market its peso holdings, but the Federal Reserve System does.
6. Interest receivables for the ESF are revalued at month-end exchange rates. Interest receivables for the Federal Reserve System are carried at cost and are not marked to market until interest is paid.
7. Cash flow differences from payment and collection of funds between quarters.
1. Foreign exchange holdings of U.S. monetary authorities, based on current exchange rates Millions of dollars
Item Balance, Mar. 31, 1996
Quarterly changes in balances by source Balance,
June 30, 1996 Item Balance, Mar. 31, 1996 Net purchases
and sales' Impact of
sales2 Investment
income Currency valuation
adjustments3
Balance, June 30, 1996
FEDERAL RESERVE
Deutsche marks 13,266.0 0 0 103.4 -387.3 12,982.1 Japanese yen 6,636.6 0 0 4.0 -143.3 6,497.3
Interest receivables6 75.7 . 74.0 Other cash flow from investments7 7.1 .5
Total 19,985.4 19,553.9
U.S . TREASURY EXCHANGE STABILIZATION F U N D
Deutsche marks 6,715.5 0 0 51.7 -196.0 6,571.2 Japanese yen 9,730.5 0 0 6.1 -213.3 9,523.3 Mexican pesos4 — ,3 , 10,500.0 -235.3 0 235.3 05 10,500.0
Interest receivables6 272.7 277.3 Other cash flow from investments7 7.5 4.4
Total 27,226.2 26,876.2
Digitized for FRASER http://fraser.stlouisfed.org/ Federal Reserve Bank of St. Louis

803
authorities did not undertake any intervention opera-tions in the foreign exchange market during the quarter.
In June, the dollar became increasingly entrenched in tight ranges, pinned between DM 1.51 and DM 1.54 and between ¥107.60 and ¥110. After the first week of June, the dollar's Friday closing levels against the mark and yen never varied more than 1 percent from the preceding week's close. In this environment, implied volatility on dollar-mark and dollar-yen one-month options declined to levels seldom seen. The probability distribution of future exchange rates implied by one-month currency option prices became notably tighter during the second quarter, reflecting expectations of lower exchange rate volatility and market participants' greater will-ingness to bear the risks of selling options.
SUPPORT FOR THE DOLLAR FROM EXPECTATIONS OF A HIKE IN U.S. RATES
Throughout the quarter U.S. economic data releases led many market participants to anticipate a near-term Federal Reserve tightening. Most notably, non-farm payroll reports for March and April provided evidence that the U.S. labor market remained strong. Initial reports (although later revised down) that first-quarter gross domestic product (GDP) had grown at a 2.8 percent year-on-year rate reinforced the percep-tion of strength in the economy. Expectations of monetary tightening were reflected in forward rates, with three-month rates on December Eurodollar futures rising nearly 60 basis points from April 1 to mid-June.
The perception of underlying economic strength in the United States prompted dollar buying during epi-sodes of dollar weakness, providing support for the dollar at the bottom of its trading range. In the last week of the second quarter, expectations of an immi-nent Federal Reserve tightening were sharply scaled back after several press and market research reports suggested that a change in policy in the near term was unlikely. The dollar had little reaction to these late developments, with foreign exchange market participants focusing instead on developments in Germany and Japan.
Shifting expectations about U.S. monetary policy caused sporadic disturbances in U.S. asset markets. Declines in U.S. stock and bond prices, which had weighed on the dollar in previous periods, did not significantly weaken the dollar during this quarter.
THE DOLLAR BENEFITS AGAINST THE MARK IN APRIL AND MAY FROM EXPECTATIONS OF GERMAN MONETARY EASING
Early in the period, expectations of a further easing of money market rates by the German Bundesbank were supported by official policy actions. On April 18, the Bundesbank announced that it would cut its discount and Lombard rates, effectively lower-ing the range within which German money market rates fluctuate. Although the key repurchase rate remained fixed at 3.3 percent, the change in official rates spurred expectations that cuts in the repurchase rate would follow in subsequent weeks.
These perceptions were bolstered by weak eco-nomic data and by downward revisions of projections for 1996 growth made by several German economic institutes. Consumer price index data released in late April for western Germany confirmed that inflation-ary pressures remained subdued; together with Bundesbank officials' hints that scope for easing existed, this development appeared to reinforce the prospects of an ease.
In this environment the dollar broke above the trading range in which it had been contained for much of March. After decisively breaking DM 1.50 on April 11, the U.S. currency continued to appreci-ate, closing on May 28 at a high for the quarter of DM 1.5470.
RETREAT OF THE DOLLAR IN JUNE FROM ITS HIGHS AGAINST THE MARK
The Bundesbank did not, in fact, reduce money mar-ket rates during the second quarter, and the repur-chase rate remained fixed at 3.3 percent. Anticipation of additional Bundesbank easing during the cycle had begun to fade by late May as indicators of improved business sentiment were released. Stronger-than-expected industrial orders and continued growth of M3—well above the 7 percent ceiling of the Bundes-bank's target range in April and May—further damp-ened expectations. By mid-June, prices in German credit markets began to reflect an expectation of Bundesbank rate hikes by the autumn of 1996, and forward rate agreement (FRA) rates for three-month Euromark deposits three months out moved sharply higher than cash rates, after having traded in a range roughly equal to or lower than that of cash rates for most of the quarter.
Dissipating expectations of German monetary eas-ing weighed on the dollar-mark exchange rate. The dollar's continued failure to break through DM 1.55
Digitized for FRASER http://fraser.stlouisfed.org/ Federal Reserve Bank of St. Louis

804 Federal Reserve Bulletin • September 1996
policies of the 1980s and the ensuing "bubble economy."
At the peak of these concerns and with December Euroyen futures contracts reflecting three-month rates nearly 90 basis points above cash rates, at the end of April the dollar traded to the bottom of its range for the quarter. The dollar briefly traded below ¥104, and dollar-yen one-month implied options volatility spiked to a high of 11.25 percent for the quarter. The dollar was supported at these levels by a market perception that the Japanese monetary authorities would not tolerate a weaker dollar because this might jeopardize Japan's economic recovery.
RECOVERY OF THE DOLLAR AGAINST THE YEN
prompted market participants to scale back long dol-lar positions, and the U.S. currency retreated from its highs in May to close at a low for June of DM 1.5122 on June 18. Apparently capped at DM 1.55 but well supported above DM 1.51, the dollar proceeded to trade in a narrow corridor, and implied volatility on one-month dollar-mark options approached record lows. At the same time, although the dispersion of the probability distribution of the future dollar-mark exchange rate implied by currency options declined, it became increasingly skewed toward a weaker dollar.
EXPECTATIONS OF A HIKE IN JAPANESE INTEREST RATES WEIGH ON THE DOLLAR-YEN EXCHANGE RATE
Early in the second quarter, the dollar fell against the yen as sentiment grew that the Bank of Japan's accommodative monetary policy stance could end as early as the later part of the quarter. This percep-tion was supported by data released in April that suggested recovery in the retail, manufacturing, and housing sectors of the economy. Official comments also fueled interest rate anxieties. Market participants were particularly wary of April comments from Gov-ernor Matsushita, of the Bank of Japan, suggesting that rising rates were "natural" in a recovering econ-omy and noting the link between Japan's easy money
2. Net profits or losses (-) on U.S. Treasury and Federal Reserve foreign exchange operations, based on historical cost-of-acquisition exchange rates Millions of dollars
Period and item Federal Reserve
U.S. Treasury Exchange
Stabilization Fund
Valuation profits and losses on outstanding assets and liabilities, Mar. 31, 1996 Deutsche marks 2,505.9 859.5 Japanese yen 1,487.9 2,188.9
Total 3,993.8 3,048.3
Realized profits and losses from foreign currency sales, Mar. 31, 1996-June 30, 1996 Deutsche marks .0 .0 Japanese yen .0 .0
Total .0 .0
Valuation profits and losses on outstanding assets and liabilities, June 30, 1996> Deutsche marks 2,118.7 663.5 Japanese yen 1,337.5 1,968.3
Total 3,456.1 2,631.7
NOTE. Figures may not sum to totals because of rounding. 1. Valuation profits or losses are not affected by peso holdings, which are
canceled by forward contracts.
By early June, anticipation of an imminent Japanese rate hike began to ebb. Analysts concluded that ongo-ing problems in Japan's financial sector and the absence of compelling evidence that Japan's eco-nomic recovery could sustain itself without fiscal stimulus precluded such a step. That perception became more prevalent on May 15 after Governor Matsushita said that Japan's recovery was not "self-sustaining." The Bank of Japan's Tanken survey, released on June 7, was somewhat stronger than expected but still too weak to alter these expectations. Forward rates declined in this environment, and the dollar recovered against the yen, appreciating from its early-May lows to trade above ¥109 in early June.
The June 18 announcement that Japan's annualized first-quarter GDP growth rate was 12.7 percent briefly revived speculation that a Bank of Japan tight-ening might be imminent, and the dollar traded off its highs to below ¥108 in tandem with a sell-off in Japanese credit markets. The dollar and Japanese bonds recovered, however, as market participants ultimately concluded that the strong GDP figure would not in itself prompt a rate hike.
In the final week of the quarter, remaining anticipa-tion of a Bank of Japan tightening by summer's end subsided with the release of weaker-than-expected industrial production figures and reports that in May, unemployment had surged to a record high of 3.5 per-cent. December Euro-yen contracts ended the quarter reflecting three-month rates only 53 basis points above cash rates, and the dollar rose to close the quarter at a twenty-nine-month high of ¥109.65.
As in preceding quarters, Japan reported declining trade surpluses and sharp contractions of its trade surplus with the United States. These data releases provided support for the dollar throughout the period, although immediate reaction to individual data
Digitized for FRASER http://fraser.stlouisfed.org/ Federal Reserve Bank of St. Louis

Treasury and Federal Reserve Foreign Exchange Operations 805
releases was muted. Data for March, April, and May indicated that, in each month the bilateral surplus had declined more than 30 percent from the previous year's level.
WEAKENING OF THE MEXICAN PESO AMID CONCERNS ABOUT A POSSIBLE U.S. RATE HIKE
Through April and May, the Mexican peso traded against the dollar in a steady range between NP 7.40 and NP 7.55 despite a backup in U.S. bond yields. In June, growing concerns about a possible U.S. mone-tary tightening sparked a correction, pushing the peso out of its recent range to trade above NP 7.60 against the dollar.
Toward the end of the period, markets reacted positively to the Mexican authorities' announcement that in August they intended to repay a substantial portion of the $10.5 billion outstanding under the U.S. Treasury's Exchange Stabilization Fund (ESF) medium-term swap facility. This announcement came
3. Currency arrangements Millions of dollars
Amount of Outstanding, facility June 30, 1996
FEDERAL RESERVE RECIPROCAL CURRENCY
ARRANGEMENTS
Austrian National Bank 2 5 0 0 National Bank of Belgium 1.000 Bank of Canada 2 , 0 0 0 National Bank of Denmark 2 5 0 Bank of England 3 , 0 0 0 Bank of France 2 , 0 0 0 Deutsche Bundesbank 6 , 0 0 0 Bank of Italy 3 , 0 0 0 Bank of Japan 5 , 0 0 0 Bank of Mexico1 3 , 0 0 0 Netherlands Bank 5 0 0 Bank of Norway 2 5 0 Bank of Sweden 3 0 0 Swiss National Bank 4 , 0 0 0
Bank for International Settlements Dollars against Swiss francs 6 0 0 Dollars against other authorized
European currencies 1 , 2 5 0
Total 32,400 t^MPllli^l 0
U . S . TREASURY EXCHANGE STABILIZATION F U N D
CURRENCY ARRANGEMENTS
Deutsche Bundesbank 1 , 0 0 0 0 Bank of Mexico1
Regular swaps 3 , 0 0 0 0 United Mexican States' OH) i
Medium-term swaps 1 0 , 5 0 0
Total1 10,500
1. Facilities available to Mexico comprise short-term swaps between the Bank of Mexico and both the Federal Reserve and the ESF, as well as medium-term swaps and government guarantees between the government of Mexico and the ESF. The total amount available from both medium-term swaps and govern-ment guarantees is $20 billion, less any outstanding drawings on the short-term facilities.
amid continued positive news on the Mexican econ-omy. Waning expectations of an imminent Federal Reserve tightening in the final week of the quarter also benefited the peso, and the currency partially recovered, closing the quarter at NP 7.58.
TREASURY AND FEDERAL RESERVE FOREIGN EXCHANGE RESERVES
The U.S. monetary authorities did not undertake any intervention operations this quarter. At the end of the quarter, the foreign currency reserve holdings of the Federal Reserve System and the ESF were valued at $19.5 billion and $16.1 billion, respectively, and con-sisted of German marks and Japanese yen.
The U.S. monetary authorities invest all their for-eign currency balances in a variety of instruments that yield market-related rates of return and have a high degree of liquidity and credit quality. A signifi-cant portion of these balances is invested in German and Japanese government securities that are held directly or under repurchase agreement. As of June 30, outright holdings of government securities by U.S. monetary authorities totaled $4.6 billion and included investments in Japanese treasury bills and German government bonds.
Japanese and German government securities held under repurchase agreement are arranged either through transactions executed directly in the market or through agreements with official institutions. Gov-ernment securities held under repurchase agreements by the U.S. monetary authorities totaled $12.3 billion at the end of the second quarter. Foreign currency reserves are also invested in deposits at the Bank for International Settlements and in facilities at other official institutions.
In addition, the ESF held $10.5 billion equivalent in nonmarketable Mexican government securities in connection with the ESF's medium-term swap arrangement. •
4. Drawings/rollovers and repayments (-) by Mexican monetary authorities Millions of dollars
Item Out-
standing, Mar. 31,
19% Apr. May June
Out-standing, June 30,
1996
Currency arrangements with the US. Treasury Exchange Stabilization Fund Bank of Mexico
Regular 0 0 0 0 0 Medium-term 10,500 0 0 0 10,500
NOTE. Data are on a value-date basis.
Digitized for FRASER http://fraser.stlouisfed.org/ Federal Reserve Bank of St. Louis

806
Industrial Production and Capacity Utilization for July 1996
Released for publication August 15
Industrial production edged up 0.1 percent in July after an upward revised gain of 0.6 percent in June. A 4.3 percent gain in the output of motor vehicles and parts was mostly offset by a 1.8 percent decrease in the output of utilities in July; output in other categories was unchanged, on balance. The gain in the production of motor vehicles and parts was led by an increase in car and truck assemblies to a
Industrial production indexes Twelve-month percent change
Capacity and industrial production Ratio scale, 1987 production = 100
— Total industry Capacity 140
- - ^ 120
^ Production - 100
1 1 1 1 1 1 1
80
Percent of capacity
Total industry 90 Utilization 90
80
1 1 1 1 1 1 1 1 1 1 1 1 1 1
70
seasonally adjusted annual rate of 13.4 million units; the decrease at utilities reflected cooler-than-normal weather on the East Coast. At 126.2 percent of its 1987 average, total industrial production in July was 3.8 percent higher than it was in July 1995. Industrial capacity utilization decreased 0.2 percentage point, to 83.2 percent.
When analyzed by market group, the data show that the production of consumer goods increased 0.3 percent because of the strength in the output of
Twelve-month percent change
Ratio scale, 1987 production = 100
1982 1984 1986 1988 1990 1992 1994 1996 1982 1984 1986 1988 1990 1992 1994 1996 All series are seasonally adjusted. Latest series, July. Capacity is an index of potential industrial production.
Digitized for FRASER http://fraser.stlouisfed.org/ Federal Reserve Bank of St. Louis

807
Industrial product ion and capaci ty util ization, July 1996
Industrial production, index, 1987= 100
Category 1996
Apr.' Mayr Juner Julyp
Percentage change
19961
Apr.r Mayr Juner July f
July 1995 to
July 1996
Total
Previous estimate
Major market groups Products, total2
Consumer goods Business equipment Construction supplies
Materials
Major industry groups Manufacturing
Durable Nondurable
Mining Utilities
1 2 4 . 5 1 2 5 . 2 1 2 6 . 0 1 2 6 . 2 . 8 . 5 . 6 . 1 3 . 8
124.5 125.1 125.7 .7 .5 .5
120.8 121.2 121.8 122.0 .6 .3 .5 .2 3.3 115.9 116.1 116.1 116.5 .5 .2 .0 .3 1.6 166.3 166.2 168.5 169.3 2.2 -.1 1.4 .5 8.7 109.2 110.4 112.8 112.8 -2.1 1.1 2.2 .0 5.2 130.3 131.4 132.5 132.6 .9 .8 .8 .1 4.5
126.5 127.2 128.1 128.6 1.1 .5 .7 .3 4.3 138.3 139.2 141.2 142.0 2.0 .6 1.4 .6 8.0 113.5 114.0 113.8 113.8 -.1 .4 - .2 -.1 - .4 100.4 100.2 101.9 101.6 -.7 - .2 1.7 - .3 .8 126.4 127.9 125.9 123.6 -1.3 1.2 -1.5 -1.8 .8
Total
Previous estimate
Manufacturing Advanced processing Primary processing .
Mining Utilities
Capacity utilization, percent MEMO Capacity,
per-centage change,
July 1995 to
July 1996
Average, 1967-95
Low, 1982
High, 1988-89
1995 1996
MEMO Capacity,
per-centage change,
July 1995 to
July 1996
Average, 1967-95
Low, 1982
High, 1988-89
July Apr/ May Juner JulyP
MEMO Capacity,
per-centage change,
July 1995 to
July 1996
8 2 . 1 7 1 . 8 8 4 . 9 8 3 . 3 8 3 . 0 8 3 . 2 8 3 . 4 8 3 . 2 3 . 9
82.9 83.1 83.2
81.4 70.0 85.2 82.4 81.9 82.0 82.3 82.3 4.4 80.7 71.4 83.5 80.6 80.4 80.3 80.6 80.7 5.1 82.6 66.8 89.0 86.7 85.5 86.0 86.5 86.2 2.5 87.4 80.6 86.5 90.0 89.7 89.6 91.1 90.9 -.1 86.9 76.2 92.6 90.8 92.7 93.7 92.2 90.3 1.3
NOTE. Data seasonally adjusted or calculated from seasonally adjusted monthly data.
1. Change from preceding month.
automotive products. Production of other durable consumer goods edged down 0.1 percent, and output of nondurable consumer goods decreased 0.3 percent. Apart from a drop in the residential use of electricity, output of nondurables was little changed: Production gains in chemical and paper products were offset by declines in foods, tobacco, and fuels.
The output of business equipment increased 0.5 percent. The gain in motor vehicle assemblies boosted the output of transit equipment, but the pro-duction of other types of transit equipment was little changed. The output of industrial equipment declined 0.2 percent, its fifth consecutive monthly decrease. This string of declines is the most pronounced cumu-lative drop in this grouping since 1991. Despite a 1.7 percent rise in the production of computers and office equipment, the output of information process-ing equipment edged up only 0.2 percent; the produc-tion of some types of communications equipment and instruments fell. The output of construction supplies held steady after increasing substantially in the pre-ceding two months; the production of goods in this
2. Contains components in addition to those shown, r Revised, p Preliminary.
grouping has risen 5.2 percent during the past twelve months.
The output of industrial materials edged up despite the drop in electricity generation. The output of dura-ble goods materials advanced 0.4 percent, reflecting gains in computer parts and semiconductors. A rebound in paper and paperboard production helped the output of nondurable goods materials post a 0.2 percent increase.
When analyzed by industry group, the data show that manufacturing production increased 0.3 percent; excluding motor vehicles and parts, the gain was 0.1 percent. Although the output of durable goods advanced 0.6 percent, the gain was concentrated in electrical machinery and in office and computing equipment in addition to motor vehicles and parts. The production indexes for lumber, furniture, pri-mary metals, instruments, miscellaneous manufac-tures, and stone, clay, and glass products declined xh percent or more. The output of nondurable goods edged down 0.1 percent. Among nondurable goods, only the paper and products industry posted more
Digitized for FRASER http://fraser.stlouisfed.org/ Federal Reserve Bank of St. Louis

808 Federal Reserve Bulletin • September 1996
than negligible gains; the output of food, tobacco, apparel, petroleum products, and leather and products fell V2 percent or more. Mining output decreased 0.3 percent.
The factory capacity utilization rate held steady at 82.3 percent. The operating rate for the advanced-processing grouping edged up 0.1 percentage point, to 80.7 percent, but the rate for the primary-processing grouping fell 0.3 percentage point, to 86.2 percent. Capacity utilization in manufacturing is little changed from its level a year ago. As was the case a year ago, the rate for advanced-processing industries stood at its 1967-95 average in July. The rate for primary-processing industries has slipped 0.5 percentage point since July 1995, but it remains 3.6 percentage points above its long-run average. The operating rate for mining decreased 0.2 percentage point in July, and the rate for utilities fell 1.9 percent-age points; rates for both of these sectors remain more than 3 percentage points above their 1967-95 averages.
This release and the history for all series pub-lished here are available on the Internet at http://www.bog.frb.fed.us, the Board of Governors' World Wide Web site.
1996 ANNUAL REVISION
During the fourth quarter, the Federal Reserve will publish revisions of its measures of industrial produc-tion (IP), capacity, capacity utilization, and industrial use of electric power; the current target month for the release is November. The revisions of IP, capacity, and capacity utilization will incorporate updated source data for recent years and will feature a change in the method of aggregating the indexes. From 1977 onward, the value-added proportions used to weight individual series will be updated annually rather than quinquennially. In addition, the IP indexes and the capacity measures will be rebased so that 1992 actual output equals 100. Capacity utilization, the ratio of IP to capacity, will be recomputed on the basis of revised IP and capacity measures.
The aggregate IP indexes will be constructed with a superlative index formula similar to that introduced by the Bureau of Economic Analysis as the featured measure of real output in its January 1996 compre-hensive revision of the National Income and Product Accounts. At present, the aggregate IP indexes are computed as linked Laspeyres indexes, with the weights updated every five years. Because of the rapid fall in the relative price of computers and peripheral equipment, that periodic updating of
weights is too infrequent to provide reliable estimates of current changes in output, capacity, and capacity utilization. With the publication of the revision, value-added proportions will be updated annually, and the new index number formula will be applied to all aggregates of IP, capacity, and gross value of product. For the most part, relative price movements among the 260 individual components of the IP index are likely to have little visible effect on total IP. However, the more frequent updating of the rela-tive price of the output of the computer industry could lower overall IP growth in some years by as much as xh percentage point; in other years, the updating of weights will have virtually no effect. Because the new index number formula will slow capacity growth as well as IP growth, the effect of the reaggregation on overall capacity utilization should be small.
The regular updating of source data for IP will include the introduction of annual data from the 1994 Annual Survey of Manufactures and selected 1995 Current Industrial Reports of the Bureau of the Cen-sus. Available annual data on mining for 1994 and 1995 from the Department of the Interior will also be introduced. Revisions to the monthly indicators for each industry (physical product data, production worker hour, or electric power usage) and revised seasonal factors will be incorporated back to 1992.
The statistics on the industrial use of electric power will be revised back to 1972. These revisions stem from three basic sources. First, the new figures incor-porate more complete reports received from utilities for the past few years. Second, an updated panel of reporters on cogeneration will be fully integrated into our survey of electric power use. Third, the levels of the monthly electric power series for manufacturing industries will be benchmarked to indexes derived from data published in the Census Bureau's annual surveys and censuses of manufactures. These indexes will also be revised so that 1992 electric power usage equals 100.
More detail on the plans for this revision is avail-able on the Internet at http://www.bog.frb.fed.us. Once the revision is published, the revised data will be available at that site and on diskettes from the Board of Governors of the Federal Reserve System, Publications Services, 202-452-3245. The revised data will also be available through the Economic Bulletin Board of the Department of Commerce, 202-482-1986. In addition to the data currently pro-vided, the time series of implicit prices necessary for a user to aggregate IP and capacity under the new methodology will be provided by the Industrial Out-put Section, 202-452-3151. •
Digitized for FRASER http://fraser.stlouisfed.org/ Federal Reserve Bank of St. Louis

809
Statements to the Congress
Statement by Herbert A. Biern, Deputy Associate Director, Division of Banking Supervision and Regu-lation, before the Committee on Banking, Housing, and Urban Affairs, U.S. Senate, July 17, 1996
I am pleased to appear before the Committee on Banking, Housing, and Urban Affairs to discuss actions that the Federal Reserve has taken over the past several years to address the problem of "prime bank" financial instruments and related illegal finan-cial schemes. The Federal Reserve has taken an active role in alerting the banking industry and the public about the illicit activities of individuals trying to peddle nonexistent financial instruments here in the United States and abroad, and we have worked closely with the law enforcement community to assist their efforts to investigate and prosecute these wrongdoers.
"PRIME BANK" SCHEMES AND ADVISORIES
In late 1993, Federal Reserve staff members were alerted by domestic and foreign banking organiza-tions that their names were being used for apparently unlawful purposes in connection with the attempted sale of questionable financial instruments. We were also contacted by individuals who had been approached to purchase questionable, highly complex investment-type instruments.
The transactions that were brought to our attention involved notes, guarantees, letters of credit, deben-tures, or other seemingly legitimate types of financial instruments being issued by an unidentified "prime bank" or by a domestic or foreign banking organiza-tion that was said to be keeping the issuance of the instruments secret. The various proposals that involved "prime bank"-related financial instruments had similar characteristics:
1. The investor could realize extremely high rates of return on an instrument described as risk free.
2. The investor was buying a part of a large tranche of securities or financial instruments that was almost fully subscribed by other investors or was part of a "roll program" that automatically put the inves-tor into an investor group of some sort.
3. The financial instrument that was being pur-chased was traded on a worldwide secret exchange.
4. The documentation related to a "prime bank" investment was extremely complex and difficult to comprehend.
5. A secure escrow account maintained at a "prime bank" or by an attorney would be used to hold the investors' funds, and payments into this account would be made by some sort of "key tested telex" message.
6. The financial instruments being issued were in formats purportedly approved by the International Chamber of Commerce or fully sanctioned by the Federal Reserve, the World Bank, or some other known international organization.
Some "prime bank" schemes appeared to be tar-geted to individuals and companies who needed loans. These potential borrowers were advised that their loans would be funded by a "prime bank" provided they paid a large, up-front fee to secure the funding. Board staff members believed that the proposed payment of unrealistic rates of return was indicative of a fraudulent scheme and contacted several banks to make sure that legitimate banking organizations were not referring to themselves as "prime banks" or using financial instruments that in any manner referred to "prime banks." Once assured that there was no legitimate use of the term "prime bank" or lawful use of a "prime bank" instrument, we drafted an interagency advisory on "prime bank" schemes and began to work through the Department of Justice's Interagency Bank Fraud Working Group to issue the pronouncement. Coordination efforts to address the problem were also initiated with some of the other twelve agencies participating in the Work-ing Group, including the Securities and Exchange Commission (SEC), as well as with international law enforcement authorities, including Britain's Scotland Yard and Department of Trade and Industry.
On October 21, 1993, the Federal Reserve and the other federal banking agencies issued the first inter-agency advisory entitled "Warning Concerning 'Prime Bank' Notes, Guarantees, and Letters of Credit and Similar Financial Instruments." The advi-sory, which is attached to my prepared statement, informed banking organizations and the public that the Federal Reserve and the other regulators know of
Digitized for FRASER http://fraser.stlouisfed.org/ Federal Reserve Bank of St. Louis

810 Federal Reserve Bulletin • September 1996
no legitimate use of any "prime bank"-related finan-cial instrument.1 The advisory also asked the public to contact agency representatives if approached to invest in a "prime bank" instrument or pay an advance fee to secure a loan funded by a "prime bank" note, letter of credit, or other type of question-able financial instrument. The banking agencies com-mitted to refer cases of potential illegal conduct asso-ciated with supposed "prime bank" documents to a senior official in the Washington, D.C., office of the SEC and to the local offices of the Federal Bureau of Investigation because almost all "prime bank" schemes appeared to involve fraud, including securi-ties fraud.
The advisory prompted numerous calls and letters about "prime bank" matters. Between late 1993 and mid-1995, hundreds of inquiries were received from individuals who had been solicited to purchase "prime bank" financial instruments, from investment advisers considering potential investments on behalf of clients, and from banking organizations that had received faxed solicitations. Calls and letters came from as far away as South Africa, Germany, Australia, France, and Singapore. The correspondents were highly suspicious of the proposed schemes, and many indicated they wanted to check with the gov-ernment "to be sure" that their suspicions were justi-fied. During this period, Board staff members assisted federal prosecutors in New Jersey, Oklahoma, Virginia, and in other districts to investigate and eventually convict individuals for "prime bank"-associated federal criminal law violations.
Calls and letters to the Federal Reserve regarding "prime bank" scams began to slow in late 1995 and early 1996 but, unfortunately, began again in recent months. The new inquiries have focused on the role of the Federal Reserve itself, with callers asking whether the Federal Reserve registers agents in cer-tain European countries, licenses traders on secret "prime bank" exchanges, clears the transfers of "prime bank" securities, or oversees investment plans comprising "prime bank" instruments.
The Federal Reserve responded with a new advi-sory, released on June 11, 1996, to dispel any miscon-
1. The attachment to this statement is available from Publications Services, Mail Stop 127, Board of Governors of the Federal Reserve System, Washington, DC 20551.
ceptions that the Federal Reserve plays a role in "prime bank"-related investments. The recent advi-sory is also included with my statement.
THE EFFECT OF "PRIME BANK" SCHEMES
The Federal Reserve is not aware that banking organizations supervised by the Board or any other federal banking agency have engaged, or otherwise knowingly participated, in any illegal "prime bank"-related conduct. We know of no domestic bank that has suffered losses from "investments" in "prime bank" financial instruments or from any other enter-prise involving such instruments. Most "prime bank" scams entail multimillion dollar investments, and as such we are not aware of losses to individual, as opposed to institutional, investors. Some well-known organizations, however, have suffered large losses because of their investments in phony "prime bank" financial instruments.
In criminal matters involving "prime bank" schemes, U.S. Attorney's Offices have prosecuted and won cases under existing criminal statutes, and the SEC has been able to freeze accounts of wrong-doers and obtain other injunctive relief.
LEGISLATION
The committee has asked the Federal Reserve to comment on the need for additional legislation addressing misconduct by fraudsters selling these instruments. The Board generally defers to the law enforcement community and to the securities regula-tors regarding legislative proposals such as S.1009, the "Financial Instruments Anti-Fraud Act of 1995" proposed by Senator D'Amato. It is our view, how-ever, that continuing successful prosecution of these cases is crucial in sending a message to potential "prime bank" fraudsters. Thus, new statutory author-ity enhancing law enforcement's ability to prosecute wrongdoers may prove useful.
I am happy to address any questions you may have about the Federal Reserve's efforts to address the problems associated with these illegal financial schemes.
Digitized for FRASER http://fraser.stlouisfed.org/ Federal Reserve Bank of St. Louis

Statements to the Congress 811
Statement by Alan Greenspan, Chairman, Board of Governors of the Federal Reserve System, before the Committee on Banking, Housing, and Urban Affairs, U.S. Senate, July 18, 1996
Before I take this opportunity to discuss the per-formance of the U.S economy and the conduct of monetary policy, I would first like to thank the chair-man and the other members of this committee for their support during my confirmation process.1 I am grateful for the opportunity to serve the nation in this capacity for another term.
REVIEW OF THE FIRST HALF OF 1996
Nineteen ninety-six has been a good year for the American economy. By all indications, spending and production were robust in the first half of this year. Gross domestic product increased at a 2XA percent annual rate in the first quarter. Partial data suggest a significantly stronger increase in the second quarter, as the economy, as expected, accelerated out of its soft patch around the turn of the year. During the second quarter, industrial production rose at an annual rate of 5V2 percent, and manufacturers are currently running their plant and equipment at utilization rates that are a touch above their postwar averages. About 1.4 million workers have been added to nonfarm payrolls in the first six months of the year, and the unemployment rate fell to 5.3 percent in June.
Even though the U.S. economy is using its produc-tive resources intensively, inflation has remained qui-escent. The core inflation rate, measured by the con-sumer price index less food and energy prices, at a 2.8 percent annual rate over the first six months of the year, is about V2 percentage point slower than the same period one year ago. While increases in energy prices have boosted the overall CPI inflation rate to 3.5 percent thus far in 1996, a partial reversal of the jump in petroleum product prices observed in the first half appears to be in train. I shall be discussing in greater detail later some possible reasons for this favorable inflation experience and offering some thoughts about how long it might last.
Economic activity thus far this year has turned out to be better than many analysts expected. An impor-tant supporting factor, as I pointed out in February, was favorable conditions in financial markets in the latter part of 1995 and early 1996. Intermediate- and
1. See "Monetary Policy Report to the Congress," in the August 1996 issue of the Bulletin, pp. 701-16.
longer-term interest rates were low. Among the influ-ences accounting for this were optimism about pro-spective budget-deficit reduction, small easings of the stance of monetary policy in the second half of 1995 and early 1996, and the possibility of a further moderation in credit demands owing to a potentially soft economy. Credit remained readily available, with banks and other lenders in financial markets gener-ally pursuing credit opportunities aggressively. And a rising stock market reduced the cost of capital to businesses and bolstered household balance sheets.
Looking forward, there are a number of reasons to expect demands to moderate and economic activity to settle back toward a more sustainable pace in the months ahead.
First, the bond markets have taken a turn toward restraint this year as they have responded to incoming data depicting an economy that was stronger than had been anticipated. Intermediate- and longer-term inter-est rates have risen from 1 percentage point to 1 lA percentage points since January.
Second, the value of the dollar on foreign exchange markets has appreciated significantly on a trade-weighted basis against the currencies of other indus-trial countries over the past year or so. This apprecia-tion importantly reflects the market perception that the U.S. economy has been performing better than those of many of our major trading partners. The rise in the dollar helps to keep down price pressures, but it also tends to divert domestic demand toward imported goods and damp exports some.
Third, the support to economic growth provided by expenditures on durable goods, both for household consumption and business fixed investment, is likely to wane in coming quarters. Consumer spending in the past few years has been boosted as households have made up for the purchases of big-ticket items that they had deferred during the recession and the early, weaker phase of the recovery. Five years after the business cycle trough, however, we should expect that this pent-up demand has been largely exhausted. Moreover, many households have built up sizable debt burdens in recent years, and coping with debt repayments could hold down their spending. The business sector has been adding considerably to capacity; opportunities to invest profitably in new capital should be increasing less rapidly as final demand slows some.
While these are all good reasons to anticipate that economic growth will moderate some, the timing and extent of that downshift are uncertain. We have not, as yet, seen much effect of the rise in interest rates on, for example, the housing market. In many other aspects, financial market conditions remain quite sup-
Digitized for FRASER http://fraser.stlouisfed.org/ Federal Reserve Bank of St. Louis

812 Federal Reserve Bulletin • September 1996
portive to domestic spending, and the economies of many foreign countries are showing signs of achiev-ing more solid growth, which should help support our export sales. Moreover, and perhaps of most rel-evance, a desire to build inventories could add sig-nificantly to production in the near term. Data avail-able for 1996 through May show that inventories were reduced relative to sales and are now fairly lean in many important industries. Although the use of just-in-time inventory and production systems encourages purchasing managers to keep stocks lean, any evidence that deliveries of previously ordered goods are being delayed for extended periods would quickly alert companies to the need for higher safety stocks. Indeed, indications of some mounting deliv-ery delays in June do raise warning flags in this regard. The reversal of earlier draw-downs in inven-tories, of course, could potentially impart an impor-tant boost to incomes and production as we enter the second half of the year. The economy is already producing at a high level—and some early signs of pressures on resources are emerging, especially in the labor market.
THE RECENT BEHAVIOR OF INFLATION
There are, to be sure, legitimate questions about how much margin in resource utilization currently exists. Historically, current levels of slack, measured in terms of either the unemployment rate or capacity utilization, have often been associated with a gradual strengthening of price and wage pressures. Yet, the recent evidence of such pressures is scant. I have already noted the lack of a distinct trend in the growth rate of the so-called core CPI. Increases in more comprehensive, and perhaps more representa-tive, chain-weighted measures of consumer prices, based on the national income and product accounts, actually have continued to edge lower. The same is true of a still broader measure of price change, the chain-weighted price index for gross domestic pur-chases, which covers both consumers and businesses. Although nominal wage rates have accelerated recently, the rate of increase has been lagging signifi-cantly behind that predicted on the basis of historical relationships with unemployment and past inflation. And domestic profit margins have held up far later into this economic expansion than is the norm.
Have we moved into a new environment where inflation imbalances no longer threaten the stability and growth of our economy in ways they once did? The simple answer, in our judgment, is no. But the issue is not a simple one.
As we have discussed before, powerful forces have evolved in the past few years to help contain infla-tionary tendencies. An ever-increasing share of our nation's work force uses the tools of new technolo-gies. Microchips embodied in physical capital make it work more efficiently, and sophisticated software adds to intellectual capital. The consequent waves of improvements in production techniques have quickly altered the economic viability of individual firms and sometimes even entire industries, as well as the market value of workers' skills. With such fast and changeable currents, it is not surprising that workers may be less willing to test the waters of job change. Indeed, voluntary job leaving to seek other employ-ment appears to be quite subdued despite evidence of a tight labor market. Because workers are more wor-ried about their own job security and their marketabil-ity if forced to change jobs, they are apparently accepting smaller increases in their compensation at any given level of labor market tightness. Moreover, a growing share of all output competes in an increas-ingly global marketplace, allowing fixed costs to be spread over ever-broader markets, promoting greater specialization and efficiency and enhancing price competition.
As I indicated in February, these forces, to the extent that they are operative, exert a transitory, not permanent, effect in reducing wage and price infla-tion. These trends leave the level of both wages and prices lower than historical relationships would pre-dict. But, at some point, greater job security will no longer be worth the further sacrifice of gains in real wages. The growth of wages will then again be more responsive to tightness of labor markets, potentially putting pressure on profit margins and ultimately prices. Moreover, the reductions in unit costs that are a consequence of the ever-expanding global reach of many companies must ultimately be bound by the limits of geography. To be sure, production and sales will continue to be diversified across geographic areas, but the world can only figuratively shrink so far. At some point, possibly well into the future, increasing returns from ever-greater globalization must also ebb.
Perhaps reflecting these unusual influences, we have yet to see early signs in prices themselves of intensifying pressures, despite anecdotal and statisti-cal evidence that the amount of operating slack in our economy has been at low levels by historical stan-dards for some time. Among the encouraging indica-tors, industrial commodity prices have remained roughly flat, and the list of reported shortages of materials has been exceptionally small. This pattern is consistent with the view that American businesses,
Digitized for FRASER http://fraser.stlouisfed.org/ Federal Reserve Bank of St. Louis

Statements to the Congress 813
by and large, have felt comfortable that inflation has been subdued, and it offers little evidence of the advance buying and expanded commitments that would come if businesses were expecting significant price pressures in the reasonably near future.
Nonetheless, there are early indications that this episode of favorable inflation developments, espe-cially with regard to labor markets, may be drawing to a close. The surprising strength in the employment cost index for wages and salaries in the first quarter raises the possibility that workers' willingness to surrender wage gains for job security may be lessen-ing. Wage data since March have been somewhat difficult to read. Average hourly earnings clearly accelerated in the second quarter. However, in look-ing at those figures, one must be mindful that they can reflect not only changes in wage rates but also shifts in the composition of employment. And in recent months, a significant part, although not all of the pickup, has been accounted for by a tendency for employment to shift to relatively high-pay industries, such as durable goods manufacturing. Whether such shifts also imply a correspondingly higher level of output per worker will determine whether unit labor costs also accelerated to impart upward pressures to price inflation. Increases in pay, of course, are not inflationary so long as they are matched by gains in productivity. Without question, we would applaud such trends, which increase standards of living. How-ever, wage gains that increase unit costs and are eaten up by inflation help no one and ultimately place economic growth in jeopardy.
Clearly, in this environment, the Federal Reserve has had to become especially vigilant to incipient inflation pressures that could ultimately threaten the health of the expansion. The relatively good inflation performance of the past few years, as best we can judge, owes, in part, to transitional forces that are only temporarily damping the wage-price inflation process. We cannot be confident that we can ascertain when that process will come to an end. This makes policy responses more difficult than usual because, as always, the impact of policy will be felt with a significant lag. Of course, if the economy grows so strongly as to strain available resources, transitional forces notwithstanding, history persuasively indicates that imbalances will develop that will bring the expansion to a halt.
THE FOMC's OUTLOOK FOR THE REMAINDER OF 1996 AND 1997
The forecasts of the governors of the Federal Reserve Board and presidents of the Federal Reserve Banks
for economic performance over the remainder of this year and the next reflect the view that sustainable economic growth is likely in store. The growth rate of real GDP is most commonly seen as between 2V2 percent and 23/4 percent over the four quarters of 1996 and 13A percent to 2lA percent in 1997. Given the strong performance of real GDP in the last two quarters, this outcome implies slower growth in the second half of this year. Nonetheless, for the remain-der of this year and the next in these projections, the unemployment rate remains in the range of the past 1V2 years. Inflation, as measured by the four-quarter percentage change in the consumer price index, is expected to be 3 percent to 3lA percent in 1996. The governors and bank presidents, however, view the prospects for inflation to be more favorable going forward. The expected reversal of some of the recent run-up in energy prices would contribute to that result, but policymakers' forecasts also reflect their determination to hold the line on inflation. The cen-tral tendency of their inflation forecasts for 1997 is 23/4 to 3 percent, returning to the range from 1991 to 1995.
THE PURSUIT OF PRICE STABILITY
We at the Federal Reserve would welcome faster economic growth, provided that it were sustainable. As I emphasized last February, we do not have firm judgments on the specific level or growth rate of output that would engender economic strains. Instead, we respond to evidence that those strains themselves are developing. Whatever the long-run potential for sustainable growth, we believe that a necessary con-dition for achieving it is low inflation. As a conse-quence, the Federal Reserve remains committed to preventing a sustained pickup in inflation and ulti-mately achieving and preserving price stability.
Price stability is an appropriate and desirable goal for policy, not only because it allows financial mar-kets and the economy to work most efficiently but also because it most likely raises productivity and living standards in the long run. Specifically, in an inflationary environment, business managers are dis-tracted from their basic function of building profits through prudent investment and cost control. My own observation of business practices over the years suggests that the inability to pass cost increases through to higher prices provides a powerful incen-tive to firms to increase profit margins through innovation and greater efficiency, which boosts pro-ductivity and ultimately standards of living over time. Holding the line on inflation, thus, does not impose a
Digitized for FRASER http://fraser.stlouisfed.org/ Federal Reserve Bank of St. Louis

814 Federal Reserve Bulletin • September 1996
speed limit on economic growth. On the contrary, it induces the private sector to focus more on efforts that yield faster long-term economic growth.
In this context, we can readily understand why financial markets welcome sustained low inflation. Uncertainty about future inflation raises the risks associated with investing for that future. Lowering that uncertainty by keeping inflation down dimin-ishes those risks, so that all commitments concerning future income become more valuable. During periods of low inflation, stock and bond prices tend to reflect the higher valuation that comes from harnessing our physical plant more efficiently to provide improved opportunities in the future, including higher wages and profits. What investors fear, what all Americans should fear, are inflationary instabilities. They dimin-ish our ability to provide the wherewithal for the standards of living of the next generation and the retirement incomes of our current work force. The interests of investors as expressed in bond and stock markets do not conflict with those of average Americans—they coincide.
In order to realize the benefits of low and declining inflation, Federal Reserve policy has, for some time now, been designed to act preemptively—as I indi-cated earlier—to look beyond current data readings and base action on its assessment of where the econ-omy is headed. Policy restraint initiated in February 1994 followed from the judgment that unchanged policy would encourage subsequent inflationary imbalances that would ultimately cut short the eco-nomic expansion. The three easing steps in the past year were instituted when we anticipated that infla-tionary imbalances would be less threatening and that lower rates would be compatible with promoting sustainable economic expansion. Similarly, I am con-fident that the Federal Open Market Committee would move to tighten reserve market conditions should the weight of incoming evidence persuasively suggest an oncoming intensification of inflation pres-sures that would jeopardize the durability of the economic expansion.
THE RANGES FOR THE DEBT AND MONETARY AGGREGATES
The Committee selected provisional ranges for the monetary aggregates in 1997 that once again encom-pass the growth rates associated with conditions of approximate price stability, provided that these aggre-gates act in accord with their historical relationships with nominal income and interest rates. These ranges are identical to those endorsed for 1996—1 percent to
5 percent for M2 and 2 percent to 6 percent for M3. The Committee reaffirmed its range of 3 percent to 7 percent for the debt of the domestic nonfinancial sectors for this year and chose the same range provi-sionally for next year. The Committee's expectations for inflation and nominal GDP expansion in 1996 and 1997 suggest growth of the monetary aggregates at the upper ends of their benchmark ranges as a distinct possibility this year and next, though debt should be in the middle portion of its range.
The experience of the first part of the 1990s— when money growth diverged from historical rela-tionships with income and interest rates—severely set back most analysts' confidence in the usefulness of M2. Recently, there have been tentative signs that the historical relationship linking the velocity of M2—or the ratio of nominal GDP to the money stock—to the cost of holding M2 assets has reas-serted itself. For now, though, the Committee is satisfied with watching these developments carefully, waiting for more compelling evidence that M2 has some predictive content in forecasting current and prospective spending. Such evidence, however, at best will only accumulate gradually over time.
BUDGETARY POLICY
Monetary policy is, of course, only one factor shap-ing the macroeconomic environment. I thus would be remiss if I did not again emphasize the critical impor-tance to our nation's economic welfare of continuing to reduce our federal budget deficit. We have made significant and welcome progress on this score in recent years. But unless further legislative steps are taken, that progress will be reversed. Inevitably, such changes will require addressing the consequences for entitlement spending of the anticipated shift in the nation's demographics in the first few decades of the next century. Lower budget deficits are the surest and most direct way to increase national saving. Higher national saving would help to lower real interest rates, spurring spending on capital goods so as to put cutting-edge technology in the hands of more Ameri-can workers. With a greater volume of modern equip-ment at their disposal, American workers will be able to produce goods that compete even more effectively on world markets.
The rally in capital markets last year that trimmed as much as 2 percentage points from longer-term Treasury yields was almost surely, in part, a response to the developing positive dialogue on deficit reduc-tion. While the backup in intermediate- and longer-term market interest rates this year has mostly
Digitized for FRASER http://fraser.stlouisfed.org/ Federal Reserve Bank of St. Louis

Statements to the Congress 815
reflected the unexpected vigor of economic activity, market participants must also have been struck by the dying out of serious discussions that might lead to a bipartisan agreement to eliminate the budget deficit over time.
CONCLUSION
Our economy is now in its sixth year of economic expansion. The staying power of the expansion has owed importantly to the initial small size and rapid
correction of emerging imbalances, reflected in part in the persistence of low inflation.
To be sure, the economy is not free of problems. But as we address those problems, policymakers also need to recognize the limitations of our influence and the wellspring of our success. The good performance of the American economy in the most fundamental sense rests on the actions of millions of people, who have been given the scope to express themselves in free and open markets. In this, we are a model for the rest of the world, which has come to appreciate the power of market economies to provide for the pub-lic's long-term welfare.
Chairman Greenspan presented identical testimony before the Subcommittee on Domestic and International Monetary Policy of the Committee on Banking and Financial Services, U.S. House of Representatives,
July 23, 1996.
Statement by Janet L. Yellen, Member, Board of Governors of the Federal Reserve System, before the Subcommittee on Financial Institutions and Regula-tory Relief, Committee on Banking, Housing, and Urban Affairs, U.S. Senate, July 24, 1996
I am pleased to appear before this subcommittee today to discuss trends in consumer lending and the Federal Reserve Board's view of how recent develop-ments in this sector are affecting U.S. commercial banks. As the subcommittee knows, consumer delin-quencies on nonmortgage debt have increased in recent periods and are beginning to affect profit mar-gins at some financial institutions. The Federal Reserve has been monitoring these conditions and discussing their implications with individual banking organizations and industry groups. However, given the generally strong financial condition of the institu-tions most affected by these developments and that of the U.S. banking system, we believe that these adverse trends do not currently present a material threat either to individual banking organizations or to the overall banking system.
In my remarks, I would like to begin with an overview of the economic developments that have caused the Federal Reserve to devote greater attention to consumer lending matters. I shall then turn to the emerging—and still well-contained—consequences that these developments are having on the banking organizations that are most affected and on the indus-try overall. Because current concerns are predomi-nantly centered on revolving credit portfolios, I shall
focus my comments on a discussion of credit card lending activities. Finally, I shall discuss the steps taken by the Federal Reserve throughout the past year to caution its examiners, state member banks, and bank holding companies about the risks inherent in weakening credit standards and to ensure that financial institutions are taking appropriate action to address emerging problems in consumer loan portfolios.
ECONOMIC TRENDS
Economic conditions in the United States have in recent years been favorable to growth in spending and borrowing by the household sector and to strong growth in consumer lending by U.S. banks. Just since early 1992, nonfarm payroll employment has increased nearly IIV2 million, driving the U.S. unemployment rate to 5.3 percent in June of this year, its lowest level in six years. As one consequence, personal income has risen substantially. The dramatic rise in stock and bond prices in recent years has also produced sharp gains in wealth for some households.
During this same time period, rates and fees on consumer financing products have been coming down. Average credit card rates, which stood at about W/4 percent in late 1991, declined to less than 151/2 percent by May of this year. At the same time, annual fees on credit cards were dropped by many institutions. In addition, declining residential mort-gage rates throughout most of this interval contrib-
Digitized for FRASER http://fraser.stlouisfed.org/ Federal Reserve Bank of St. Louis

816 Federal Reserve Bulletin • September 1996
uted to a significant reduction in monthly payments on such debts. While mortgage rates have recently backed up, the relatively low mortgage rates of the early 1990s precipitated a refinancing boom that allowed many consumers to significantly reduce their monthly mortgage obligations.
Combined, these generally favorable developments have given consumers the confidence and financial foundation to incur additional debt to finance major purchases. Nevertheless, some concerns remain about the increase in consumer debt. Aggregate statistics do not address conditions in individual households, an important consideration because the economic expan-sion has not affected all households equally. Further, while for some households the use of credit in mak-ing a purchase is simply a matter of convenience or a means of managing liquidity, for others borrowing may be a means of sustaining consumption through a period of household economic distress.
Nonmortgage consumer debt has grown at double-digit rates over the past two to three years. This rapid pace is not unusual for a period of economic expan-sion. Indeed, as the economy emerged from recession in 1991, growth in nonmortgage consumer debt was much slower than typical, reflecting sluggish spend-ing on durable goods and lingering fears about long-term layoffs and other threats to job security. How-ever, by 1994, consumer confidence had recovered considerably, and demand for autos and other durable goods had strengthened. Nonmortgage consumer debt grew about 15 percent that year and the next, but even this rapid pace remained below that of a decade earlier. Lower inflation in recent years can account for some of the difference.
Recently, revolving credit—primarily credit card debt—has been, by far, the fastest growing compo-nent of consumer debt, averaging annual increases of 20 percent over the past two years. However, that performance—rapid growth during an expansion—is also typical of the past two decades. The cumulative effect has been a dramatic rise in the relative impor-tance of revolving credit. In 1977, when first reported separately to the Federal Reserve, revolving debt of U.S. consumers totaled $30 billion, or 14 percent of all consumer debt. In May of this year, the amount outstanding was $444 billion, or nearly 40 percent of the total. Surveys show that 80 percent of U.S. house-holds now have at least one credit card.
A consequence of the increase in consumer bor-rowing of recent years is that debt-servicing requirements—that is, the amount of scheduled pay-ments of principal and interest—have consumed a bigger share of disposable income. Our staff esti-mates that this ratio, which includes both mortgage
and nonmortgage payments, peaked in late 1989 at about YlVi percent and then declined over the next four years to about \5Vi percent in 1993, as house-holds curtailed their borrowing and average interest rates on their debts fell. Since then, the ratio has risen to about 163/4 percent. This standard measure is based on aggregates that include households without debt and uses estimates of scheduled payments. The Sur-vey of Consumer Finances, conducted periodically by the Federal Reserve, suggests that the median ratio of actual debt payments to pretax income of debt-holders was relatively constant from 1989 to 1995, as was the proportion of the debt-holders that had very high debt repayment to income ratios. What has tended to rise over time is the proportion of low-income households with an unusually high frac-tion of their income absorbed by debt repayments. Unfortunately, the latest data—which are still preliminary—are a year old.
To be sure, some of the increase in consumer debt is merely a reflection of the greater prevalence of convenience use of credit cards as a substitute for cash or check payment, with card balances paid in full each month. This trend has been reinforced in recent years by a variety of incentives, such as the availability of frequent flier miles. But—as our Sur-vey of Consumer Finances suggests—there are also signs that some households have let their debts build up to the point where they may have difficulty servic-ing them: Loan delinquency rates and personal bank-ruptcies are both up.
Generally speaking, delinquency rates on nonmort-gage consumer loans have been trending up for the past year, with some of the increase in delinquency rates merely the result of the "seasoning" of recently underwritten loans, a typical pattern. However, for credit cards, the widely followed statistics of the American Bankers Association show that the delin-quency rate by number of accounts is historically high. The more comprehensive figures from the offi-cial bank Call Reports based on the dollar volumes of loan balances, however, show a much milder upturn in delinquencies—but still one warranting our attention.
CREDIT CARD LENDING BY COMMERCIAL BANKS
These economic and market developments have had clear effects on banks. As a percentage of total bank loans, consumer debt (including mortgages) has been increasing steadily for some time—from 33 percent of total bank loans in 1980 to roughly 40 percent five
Digitized for FRASER http://fraser.stlouisfed.org/ Federal Reserve Bank of St. Louis

Statements to the Congress 817
years ago and about 44 percent today. This shift in asset allocation by banks reflects several factors, not the least of which is a declining market share of the credit extended to commercial customers. In part, it also reflects substantial growth in credit card debt. Since late 1991, credit card debt has risen about twice as fast as total loans. If one adds back estimates of the outstanding securitized credit card debt of banks, such credit has risen almost three times as fast as total loans at banks.
The industry's total increase in credit card loans has come about with the growing popularity of cards, supported by their aggressive marketing by some banks. Marketing campaigns typically involve broad-based, regional, or nationwide solicitations and often include pre-approved lines of credit based on the results of "credit scoring" models that statistically evaluate an individual's creditworthiness. In addi-tion, banks' success in securitizing consumer debt instruments for resale in capital markets has increased both their willingness and their ability to make such loans.
Also encouraging more aggressive competition have been heavy investments in the technological infrastructure needed to evaluate, originate, and manage effectively such credits. Indeed, the major competitors have increasingly used special promo-tions offering reduced fees and rates to obtain market share and maximize the scale economies of their operations. Some have also been more willing to take on greater risk in the interest of increasing loan volumes. Such competitive zeal all too often attracts weak or otherwise marginal borrowers. The resultant adverse selection of credit risks has contributed to a decline in asset quality at some banks.
While these problems have eroded returns at indi-vidual institutions, a critical factor that continues to contribute to the emphasis on such lending has been the significant, overall long-term profitability of the credit card business. This is not irrelevant for a banking system whose largest institutions had been under earnings pressure through much of the 1980s because of their exposures to developing countries, energy sector borrowers, and commercial real estate markets.
One indication of the profitability of credit card lending can be seen in analyzing the so-called credit card banks (defined here to include banks with more than $1 billion in assets and with credit card balances comprising more than 50 percent of total assets). For various legal, tax, and operating reasons, most large banking organizations find it convenient to establish such banks, separate from their other operations, as a vehicle for booking most, if not all, of their credit
card loans. These roughly thirty entities most recently reported an average return on assets of 2 percent, compared with 1.1 percent for all insured commercial banks. They also maintained average equity to asset and loan-loss reserve to total loan ratios well above industry averages.
The strong earnings profiles of the credit card banks, and their associated capital and reserve alloca-tions, are reflections of the risks associated with this form of lending. Higher risk and higher return go hand in hand, and the higher capital and reserves associated with this form of credit are required to balance the risk. Put another way, lenders active in the credit card business are conscious of higher potential loss rates and expect returns that will fully absorb these losses and still provide an adequate profit margin. They are also aware of the necessity to take steps to assure that the variance in returns on these loans does not create significant solvency con-cerns for their organizations.
INCREASED INCIDENCE OF PERSONAL BANKRUPTCY
On several occasions during the past year or so, various industry and professional groups have expressed concern about perceived weakening of credit standards within consumer lending, including the aggressive marketing of credit cards. At these meetings, some of the private sector participants have given anecdotal evidence of practices that they believe to be potentially harmful in the long run, either to financial institutions or to the con-sumer lending market in general. Similar, and still anecdotal, indications of declining standards and increased competition have been provided by various state banking delegations that periodically visit the Federal Reserve and other bank regulatory agencies.
One concern cited with increased frequency is a higher incidence of borrowers with substantial credit card debt declaring bankruptcy, without any previous record of missed or delinquent payments. Bankers often cite borrowers who have tens of thousands of dollars of outstanding loans on a number of credit card accounts with various financial institutions. Such borrowers may not always be readily detected by controls and monitoring procedures and could con-tribute to increased charge-offs at card issuers.
Several factors are said to be contributing to higher rates of personal bankruptcy, including greater social acceptability of the practice, changes in law that have made bankruptcy less onerous for individuals, and increased advertising by bankruptcy attorneys. What-
Digitized for FRASER http://fraser.stlouisfed.org/ Federal Reserve Bank of St. Louis

818 Federal Reserve Bulletin • September 1996
ever the underlying causes, it is a reality that credit card issuers and others must address. Moreover, banks and nonbanks that issue credit cards and other consumer lines of credit should also consider the extent to which the trend is fueled by their willing-ness to lend to individuals whose credit history is dubious. One may not wish to foreclose the possibil-ity of renewed credit access to those who have been forced by uncontrollable circumstances to seek the protection of bankruptcy, but it should be recognized that undue generosity on this score only encourages greater use of the bankruptcy remedy and consequent chargeoffs.
SUPERVISORY RESPONSE
In response to these and other indications that terms of credit and credit standards may have been declin-ing, about a year ago the Federal Reserve issued an advisory letter to its examiners and supervised banking organizations cautioning them about the risk of weakening standards. This advisory also requested Federal Reserve examiners to discuss any question-able easing of standards with bank management, regardless of whether quantitative measures of prob-lem loans had begun to increase.
Since March 1995, the Federal Reserve has also been conducting a quarterly survey of its most senior examiners to track their assessments of conditions in the banking market, including their assessments of any changes in lending terms and conditions for consumer loans. To supplement these surveys, regu-lar discussions are conducted with bankers and super-visory officials at the Reserve Banks to ascertain their opinions on current lending conditions.
The Federal Reserve has also recently undertaken a number of initiatives to focus its examinations more tightly on the activities exposing financial institutions to significant risks and to heighten its emphasis on evaluating management processes to identify, mea-sure, monitor, and control the risk of banking activi-ties. We believe that these enhancements to our supervisory procedures will further improve our abil-ity to detect nascent problems—such as those arising from the increased and more accommodating con-sumer lending of recent years—and will foster appro-priate responses by bank management. Consistent with these initiatives, an inter-District task force of Federal Reserve examiners is currently conducting a comprehensive review of the retail credit and credit-scoring operations of several large bank holding companies.
Earlier this year, we also implemented procedures whereby examiners assign specific ratings to an insti-tution's overall risk-management processes, includ-ing its internal controls. This requirement, we believe, further highlights the importance of sound management practices and should help to provide more specific feedback to senior management of the examined institution. In the context of consumer lending, such assessments generally address a bank-ing organization's operating strategies for increasing market share, its goals, and the controls in place to maintain credit standards, including ongoing review of the credit strength of its loan portfolio. Examiners also typically evaluate the adequacy of the institu-tion's information systems and the appropriateness of the information provided to directors and senior managers.
Recently, our supervisory activities, surveys of examiners, and discussions with bankers all have supported the view that banks are recognizing weak-nesses in the consumer lending market and are actively adjusting their underwriting and monitoring procedures for these loans. Some banks have also increased their levels of reserves for these loans in recent months.
I should also note that in each of the two most recent Federal Reserve Senior Loan Officer Surveys, approximately one-quarter of the respondent banks, on net, had tightened underwriting standards for approving new credit card applications. More broadly, the proportion of respondents less willing to make consumer installment loans slightly exceeded the proportion that was more willing to lend, for the first time since 1991. Such a revisiting of current credit standards and practices seems well considered, given the length of the current period of economic expansion and the signs of weakness in some ele-ments of consumer finances that we have seen.
CONCLUSION
To sum up, the rapid growth in consumer lending by banks, particularly that involving credit card loans, reflects a natural evolution of banking activities toward the household sector and has generally enhanced consumer convenience and produced sig-nificant profits for banks. In recent years, this growth has been caused, in part, by aggressive solicitations of credit card customers by a relatively small number of large bank and nonbank organizations and by an active market for securitized credit card debt.
The recently emerging trend of higher delinquen-cies and personal bankruptcies has certainly increased
Digitized for FRASER http://fraser.stlouisfed.org/ Federal Reserve Bank of St. Louis

Statements to the Congress 819
the costs of making consumer credit card loans and is forcing some institutions to review and modify their marketing strategies and underwriting stan-dards. It has also prompted the Federal Reserve to devote more attention to the monitoring of consumer loan exposures, both on and off bank balance sheets, and to the evaluation of risk-management practices, including internal controls, for these activities. Nev-ertheless, the industry's condition is strong when
measured in terms of its profitability, capital ratios, loss reserves, and overall asset quality. Moreover, banks price and reserve for credit card loans with the expectation of occasional periods of relatively high rates of loss. Therefore, unless future conditions dete-riorate dramatically, we believe that the industry is well positioned to absorb any problems resulting from the competitive consumer underwriting prac-tices of the recent past.
Statement by Alan Greenspan, Chairman, Board of Governors of the Federal Reserve System, before the Committee on Banking, Housing, and Urban Affairs, US. Senate, July 26, 1996
I appreciate this opportunity to appear before the Banking Committee today to address certain recent reports on the Federal Reserve's operations. Of most relevance, the General Accounting Office (GAO) has raised some significant issues with respect to the management of the Federal Reserve System. Both the GAO and the Congress deserve our full response.
We are strongly committed to ensuring that the Federal Reserve System is managed efficiently and effectively. It is most important to us at the Federal Reserve Board and the Reserve Banks not only to run a "tight ship" but to foster the attitudes and pro-cesses that will ensure continuous improvement in the effectiveness of the Federal Reserve's operations. We recognize that spending nonappropriated funds places a special obligation on us to be particularly diligent in the use and application of those funds.
Accordingly, even though we may ultimately dis-agree with some of the specific suggestions of the GAO, we welcome all of them and their insights because they require us to rethink our positions and change them if appropriate. Certain GAO recommen-dations for review of specific aspects of our manage-ment clearly have merit, and reviews of a number of issues highlighted in the GAO's report are currently under way. These reviews may lead to changes in the Federal Reserve's administration that will further enhance our effectiveness.
It is most important for any organization, including the Federal Reserve, periodically to reassess its businesses and how they are carried out. Strategic planning is particularly critical given our rapidly changing environment in which technology is advancing at an extraordinary pace and the financial services industry is becoming ever more complex. It is essential that the Federal Reserve adapt to this
changing environment with some foresight and as effectively as possible. To that end, in 1995 we formalized our strategic focus by establishing a Sys-tem Strategic Planning Coordinating Group to assess how the Federal Reserve can most effectively meet its public policy objectives into the next century.
Our strategic focus is also reflected in recent sig-nificant changes that the Federal Reserve has made in the way it carries out its major responsibilities. For example, we have undertaken a major redesign and upgrade of our computer systems, communica-tions networks, and critical software applications to improve reliability, respond more quickly to chang-ing business requirements, and improve our disaster-recovery capabilities. We have placed an increasing reliance on automation to provide a more flexible approach to bank examinations—an approach that is risk-oriented, cost-effective, and sensitive to the bur-den placed on banks. We have also consolidated certain fiscal agency functions that we provide for the government in order to improve cost-effectiveness and quality, and a Reserve Bank policy committee has been established to coordinate the provision of Federal Reserve financial services.
In addition, the Federal Reserve already had under way several specific initiatives related to recommen-dations made by the GAO. For example, we recently engaged an independent accounting firm to audit and certify the combined financial statements of the Reserve Banks. The firm issued an unqualified opin-ion on the 1995 financial statements, as prepared in accordance with the financial accounting manual for the Reserve Banks. In addition, we are actively reviewing the appropriate infrastructure for providing certain financial services, taking into consideration both cost-efficiency and service quality. One difficult issue that has confronted, and will confront, the Fed-eral Reserve Board in our oversight of the System is the appropriate degree of consolidation of various activities. Certain Systemwide activities do appear to be more cost-effective if consolidated. For example,
Digitized for FRASER http://fraser.stlouisfed.org/ Federal Reserve Bank of St. Louis

820 Federal Reserve Bulletin • September 1996
we anticipate that the consolidation of our critical electronic payment applications will reduce our costs of providing these services. But it is also evident that the element of autonomy that is accorded to the Reserve Banks has created an environment within the Federal Reserve that attracts highly qualified staff who contribute importantly to the effectiveness and efficiency of the Federal Reserve System over the long run. The advantages of this environment must be balanced against the possible savings from consolidation.
FEDERAL RESERVE'S ROLE AS SERVICE PROVIDER
Many of our resources are devoted to providing priced payment services. The Federal Reserve has played an integral role in the nation's payments sys-tem since the System's inception. Indeed, one of the Congress's original goals in establishing the Federal Reserve System was to improve the efficiency of check clearing. Before the passage of the Monetary Control Act (MCA) in 1980, the Federal Reserve provided payment services to its member banks; the banks paid for these services implicitly with non-interest-bearing reserves rather than through explicit fees. The MCA fundamentally changed the manner in which the Federal Reserve provided and received payment for these services.
Because the act expanded reserve requirements to all depository institutions, it also required that the Federal Reserve offer its payment services to all depository institutions. To offset the act's reduction in the level of required reserves, as well as to broaden and level the competitive market for interbank pay-ment services, the Congress required us to price our services at full cost with a rate of return comparable to that of private firms. I believe that the increased competition resulting from the MCA requirements has benefited the payments system.
The GAO has recommended that we review our future role in providing payment services. We are in the process of conducting such a review in the context of our overall strategic plan. In general, we view our role as a payments service provider as crucial in carrying out our overall central bank mission. We believe it is important for the Federal Reserve to foster the integrity, efficiency, and acces-sibility of the U.S. dollar payments system, which in turn is important to maintain financial stability and maximize sustainable economic growth. The provision of services by the Federal Reserve has contributed directly to these goals. In addition, the
knowledge and operational expertise we have gained as a service provider strengthens our efforts in con-taining systemic risks and is crucial in managing potential financial crises.
We regard the wholesale payments services we provide, such as Fedwire and net settlement, as essen-tial central bank services and important in limiting payments system risk. Our role in providing these services probably will not change significantly as the marketplace evolves, although the nature of the ser-vices themselves might.
It is quite possible, if not likely, that as changes occur in the financial services marketplace over time, or owing to other considerations, our role in provid-ing other services, such as check collection, may change as well. In this regard, we must be sensitive to the fact that, as the nation's central bank, we have an unsurpassable credit rating that must not be used to unfairly compete with private-sector providers. We are continually assessing our available means of achieving our payments system goals, including our regulatory authority and our role as a direct partici-pant in the payments system, with our public service role always kept paramount. For example, the Fed-eral Reserve has adopted regulations that have fos-tered competition and efficiency in the provision of check collection services, even though they resulted in a reduction in the Federal Reserve's direct partici-pation in the check system. At the same time, the Federal Reserve has encouraged other efficiencies in the payments system through innovations in its ser-vice offerings. To the extent that we can achieve our payments system goals most effectively through our direct participation, our continued provision of these services will remain appropriate.
FEDERAL RESERVE COST-EFFECTIVENESS
In considering the cost structure of the Federal Reserve, it is necessary to keep in mind the unique combination of responsibilities that have been assigned to this institution. The Federal Reserve is responsible for conducting monetary policy, supervis-ing and regulating certain financial institutions, pro-moting the efficiency and integrity of the payments system, and providing fiscal agency services to the Treasury and other government agencies at their direction.
Different factors affect the cost structure of each of these functions. For example, priced services are subject to the inherent discipline of the marketplace, as the Federal Reserve must control costs in order to meet the statutory directives for cost recovery in the
Digitized for FRASER http://fraser.stlouisfed.org/ Federal Reserve Bank of St. Louis

Statements to the Congress 821
Monetary Control Act. On the other hand, in provid-ing depository and fiscal services to the Treasury, the Federal Reserve must respond to the instructions of the Treasury. We endeavor to carry out the Trea-sury's directives in a cost-effective manner but can-not refuse legitimate requests because of their effect on our costs or because they are inconsistent with other Federal Reserve plans. In the areas of monetary policy and financial institution supervision, there are fewer external constraints on our expenses. Here we must be particularly vigilant.
Given the critical nature of the Federal Reserve's responsibilities, particularly in the areas of monetary policy, financial stability, and financial institution supervision, our major initiatives must be judged not only in terms of cost but also in the context of risk management and the appropriate level of resources to be devoted to each function. For example, the Con-gress, in enacting the Foreign Bank Supervision Enhancement Act in 1991, clearly concluded that the additional costs of expanding the Federal Reserve's supervisory responsibilities for U.S. operations of foreign banks were justified by the greater financial stability and protection that the enhanced supervision would bring.
We focus our banking examination resources based on risk assessments, with the expectation that areas not covered extensively in the examinations will not become serious problems. Had we devoted more resources to Daiwa, and perhaps less elsewhere, would we have uncovered its wrongdoing at an early stage? We can't know for sure, but the odds would have been higher. But if we had had the foresight to divert these resources from other activities, would we have increased our risk exposure elsewhere?
As another example, the Federal Reserve's recent investment in a major upgrade of our computer systems and personnel to adapt our surveillance and payments technologies to the major changes that have occurred in private financial markets was also driven in large part to improve risk manage-ment. While the costs of these improvements were not trivial, they have enhanced our ability to ensure the smooth functioning of the financial markets, even during periods of financial or operational disruptions. To hold the risk of systemic crises to acceptably low levels in both U.S. markets and U.S. dollar markets abroad requires some redundancy of resources. Given the vast scale of the value of payment transactions that flow through our systems— our Fedwire volume alone averages almost $1.5 tril-lion a day—we believe that the benefits of this redundancy far exceed the associated incremental costs.
The risk-management decisions that we make con-cerning the way we provide payment services to depository institutions are tested directly in the mar-ketplace. These services comprise more than one-third of the Federal Reserve Banks' total budget, and the Monetary Control Act requires that, over the long run, we price these services to recover their costs as well as costs that would be borne by private busi-nesses, such as taxes and a return on equity. If we provide these services inefficiently, we price our-selves out of the market.
Over the past decade, our track record has been good. The Reserve Banks have recovered 101 percent of their total cost of providing priced services, includ-ing the targeted return on equity. I should also note that, by recovering not only our actual costs but also the imputed costs that a private firm would incur, the Federal Reserve's priced services have consistently contributed to the amount we have transferred to the Treasury. During the past decade, priced ser-vices revenue has exceeded operating costs by almost $1 billion.
Our fiscal agency services, which comprise another one-sixth of the Reserve Banks' total budget, are provided at the direction of the Treasury and other federal government agencies for whom we provide these services and whose reimbursements to us are made primarily with appropriated funds. Here our difficulty has been in obtaining full reimbursement over the years. We understand that, as part of its funding request for fiscal year 1997, the Treasury sought a permanent indefinite appropriation, similar to that in place for the Bureau of the Public Debt, for services provided to its Financial Management Ser-vice. The Federal Reserve and our fiscal principals continue to work closely to identify and implement initiatives that improve further the efficiency of these operations.
With respect to staff compensation and some other aspects of our infrastructure that are necessary to support our varied responsibilities, only indirect market criteria are available to judge the Federal Reserve's costs. For example, we try to set salary structures that can attract and retain the personnel with skills necessary to run the Federal Reserve Sys-tem in a highly effective manner. To acquire and hold such personnel, we strive to provide salaries and benefits competitive with local private- and public-sector markets, tempered by the willingness of many professionals to accord a nonmonetary premium to Federal Reserve employment. Although the GAO report suggests that the Federal Reserve does not adequately review Federal Reserve employee salary and benefit levels to determine whether they continue
Digitized for FRASER http://fraser.stlouisfed.org/ Federal Reserve Bank of St. Louis

822 Federal Reserve Bulletin • September 1996
to be justified, I can assure the committee that these costs are scrutinized regularly to ensure that they are appropriate.
We believe that the GAO's comparison of growth in Federal Reserve employee benefits with those of the federal government is incorrect. The problem is that although we accrue such benefits according to generally accepted accounting principles, the federal government does not. Were the federal government to use accrual accounting, presumably the compari-sons would be straightforward. The federal govern-ment, however, employs an outmoded cash account-ing system, which makes it difficult for us to reverse our accruals in a manner consistent with it. As best we can judge, when calculated on a comparable basis using federal government accounting principles, the cost of benefits per employee for the Federal Reserve and the federal government increased by approxi-mately the same percentage during the 1988 to 1994 period—64 percent and 62 percent respectively. We believe the GAO significantly overstated the increase in Federal Reserve benefit costs by including the cost of future pension benefits related to Federal Reserve early retirement plans on an accrual basis without considering the associated future savings attributable to those programs. Each of the early retirement pro-grams has a positive net present value, indicating a net cost savings from such plans. Including the present value cost of early retirement plans without considering the present value of cost savings skews any comparison of the increase in total benefits costs for the Federal Reserve and the federal government.
Applying peer analysis more broadly, during the 1988 to 1994 period reviewed by the GAO, the increase in Federal Reserve operating costs was slightly less than the 51 percent increase in federal discretionary nondefense spending, which has been subject to increasing congressional restraint in recent years. The GAO makes this as one of its compari-sons. The Federal Reserve effectively contained its costs despite a significant expansion in its mandated responsibilities and expanded resources required to monitor and contain the financial market turmoil of that period. To also compare, however, as the GAO did in its report, the rate of our expense increases with that of total federal discretionary outlays, which are dominated by the major post-cold war retrench-ment in defense, is clearly inappropriate. Moreover, with the significant expansion of our computer sys-tems now close to completion and our adjustment to our expanded supervisory mandates reaching frui-tion, our costs during the past two years and those projected for the immediate future are definitely on a flattening trajectory.
More generally, we believe that the GAO is mistaken in its notion that the Federal Reserve does not regularly assess certain ongoing programs to determine whether they are reasonable and justified. In particular, we do not use a "current services" approach to develop the Board and Reserve Bank budgets. The significant reallocation of System resources among the various responsibility areas dur-ing recent years clearly demonstrates that this is not the case.
In summary, although the Board believes that much of the GAO's analysis and recommendations have merit, we take exception to the broad implication of the GAO report that the Federal Reserve has not exercised appropriate budget constraint and that it has not adequately addressed the changing techno-logical and financial environment in which it oper-ates. In my experience, the Federal Reserve is as well run an organization as any with which I have been associated, private or public, over the decades. Is there nonetheless room for improvement? Certainly. I am not aware of any complex organization for which this is not the case. In particular, the Board plans to review several specific areas highlighted by the GAO related to management of health care benefits, Reserve Bank procurement and contracting procedures, and Reserve Bank travel reimbursement policies.
THE FEDERAL RESERVE SURPLUS
One area discussed in the GAO report—the elimina-tion or reduction of the Federal Reserve's surplus— has received substantial, and often misleading, media coverage. I agree with the assessment of the Confer-ence Report on the fiscal 1997 budget resolution on this matter. The report concluded that a transfer of the Federal Reserve's surplus to the Treasury would be a "gimmick" that "has no real economic impact on the deficit." While a transfer of Federal Reserve surplus would increase "unified receipts" (because the Fed-eral Reserve, for technical reasons, is not included in the unified budget), it would nonetheless be an intragovernmental transfer that would not change the government's true economic and financial position with respect to the private sector.
The Federal Reserve holds government securities as the asset counterpart to its surplus, interest on which it returns to the Treasury. If the Federal Reserve decreased its surplus, it would do so by selling government securities and transferring the proceeds to the Treasury. Consequently, the Federal Reserve's future payments to the Treasury would
Digitized for FRASER http://fraser.stlouisfed.org/ Federal Reserve Bank of St. Louis

Statements to the Congress 823
decline permanently by the foregone amount of inter-est on the surplus funds transferred, exactly offsetting the Treasury's savings on gross interest payments.
The surplus is part of our capital account. In that context, I believe retention by the Federal Reserve of some level of surplus is desirable, but I acknowledge that the appropriate level of the Federal Reserve's surplus is debatable. We would welcome the opportu-nity to work with the Congress to review this issue.
OTHER RECENT INQUIRIES
I would like to conclude my testimony by comment-ing on several recent inquiries into certain aspects of the Reserve Banks' operations—specifically, the management of our Interdistrict Transportation Sys-tem (ITS) and cash statistical reporting problems experienced by the Los Angeles Branch of the Fed-eral Reserve Bank of San Francisco.
Earlier this year, Representative Henry Gonzalez issued a report on the administration of the Federal Reserve's ITS network. The report asserts that the Federal Reserve may have violated the Monetary Control Act to the extent that it does not fully recover the costs of ITS through revenue attributable to its use. The GAO and the courts reviewed this issue in the mid-1980s and concluded that such cost recovery was not required by the act.
No integrated company in the private sector (such as one that provides check collection services) prices individual segments of its operation to achieve a uniform rate of return. Optimum profitability, that is, minimum consolidated costs, is enhanced through transfer pricing flexibility. Even aside from the impre-cisions associated with allocating fixed costs, it would not make sense for us to separately recover the costs of each input to a service, such as transportation, data processing, or labor, as implied by Representative Gonzalez. Rather, all of the costs the Reserve Banks incur in providing check services to depository insti-tutions, including ITS costs (which represent less than 5 percent of the costs of our check service), are recovered through fees for their various check products.
Representative Gonzalez's report also alleges that certain contracting practices used by the Boston Reserve Bank in managing ITS were improper and wasteful. Administration of ITS requires Federal Reserve management to make numerous, rapid, and complex business decisions every day, constantly
balancing efforts to improve service, reduce float, and control operating costs. In hindsight, are there some decisions that should have been made differently? Almost surely. But from a broad perspective, ITS has been managed effectively in our judgment.
Finally, I would like to put in context the errors made by the Los Angeles Branch of the Federal Reserve Bank of San Francisco in reporting certain statistical cash information to the Federal Reserve Board. Unfortunately, the press coverage of this mat-ter, in our judgment, has significantly overstated the problem.
First, these reports are used for informational pur-poses only. No taxpayer money has been lost. No key decisionmaking has been compromised. The errors have not affected the usefulness of the information derived from the Federal Reserve's financial state-ments, nor have they affected the Federal Reserve's calculation of the money supply, its conduct of mone-tary policy, or the amount of shipments of currency and coin to or from the Branch.
Second, although there were reports of mistakes amounting to $178 million, the errors changed the Branch's reported production volume by less than one-half of 1 percent. If the mistakes had not been discovered, at worst there would have been slight errors in forecasting future currency demand, which could have caused a slight increase to the Federal Reserve's order to the Treasury to print new cur-rency. The cost of this higher currency print order would have been offset, however, by a lower print order in the following year.
Third, the Los Angeles Branch had identified the problems internally and was in the process of resolv-ing them before Representative Gonzalez began his inquiry. The Los Angeles Branch is working dili-gently to ensure that all of the data used to prepare the cash statistical reports transmitted to the Board are accurate.
In closing, let me state that we appreciate the GAO's review in that it assists us in our ongoing evaluation of the Federal Reserve's structure and functions and our efforts to continually improve operations. As I noted, many recommendations are useful, and we are pursuing them. In my opinion, however, the general tenor of the report does not reflect the high level of effectiveness with which the Federal Reserve has fulfilled its mission. While, as is likely the case with any organization, the Federal Reserve has opportunities for further improvement, I believe these opportunities should be put in the con-text of our significant accomplishments. •
Digitized for FRASER http://fraser.stlouisfed.org/ Federal Reserve Bank of St. Louis

824
Announcements
NOMINATIONS SOUGHT FOR APPOINTMENTS TO THE CONSUMER ADVISORY COUNCIL
The Federal Reserve Board announced on July 2, 1996, that it is seeking nominations of qualified indi-viduals for eight appointments to its Consumer Advi-sory Council.
The Consumer Advisory Council consists of thirty representatives of consumer and community interests and of the financial services industry. The council was established by the Congress in 1976, at the suggestion of the Board, to advise the Board on the exercise of its responsibilities under the Consumer Credit Protection Act and on other matters on which the Board seeks its advice. The council by law represents the interests both of consumers and of the financial community. The group meets in Washington, D.C., three times a year.
Eight new members will be selected to serve three-year terms that will begin in January 1997. The Board expects to announce the selection of new mem-bers by year-end 1996.
Nominations must be submitted in writing and should include information about nominees' past and present positions held and about their special knowl-edge, interests, or experience related to community reinvestment, consumer credit, or other consumer financial services.
Nominations must be received by August 31, 1996, and should be addressed to Dolores S. Smith, Associ-ate Director, Division of Consumer and Community Affairs, Board of Governors of the Federal Reserve System, Washington, DC 20551.
REGULATION K: FINAL RULE
The Federal Reserve Board announced on July 23, 1996, a final rule amending Regulation K (Interna-tional Banking Operations) regarding the manage-ment of offshore offices by U.S. branches and agen-cies of foreign banks. The final rule was effective August 28, 1996.
The rule implements a provision of the Riegle-Neal Interstate Banking and Branching Efficiency Act of 1994 that amended the International Banking
Act of 1978 by adding a new provision regarding the management of shell branches of foreign banks by such banks' U.S. offices.
The provision prohibits foreign banks from using their U.S. branches or agencies to manage types of activities through offshore offices that could not be managed by a U.S. bank at its foreign branches or subsidiaries. This prohibition applies with respect to those offshore offices that are "managed or con-trolled" by a foreign bank's U.S. branches or agencies.
PROPOSED ACTIONS
The Federal Reserve Board on July 11, 1996, extended the comment period from August 1 to Sep-tember 6 on its proposal to amend Regulation E (Electronic Fund Transfers).
The Federal Reserve Board on July 31, 1996, requested comment on three proposals to modify the conditions under which section 20 subsidiaries of bank holding companies may underwrite and deal in securities.
The first proposal would increase the amount of revenue that a section 20 subsidiary may derive from underwriting and dealing in securities from 10 per-cent to 25 percent of its total revenue. Comments on this proposal were requested by September 30, 1996.
The second proposal would amend or eliminate three of the prudential limitations, or firewalls, imposed on the operations of the section 20 subsidi-aries as listed below:
• The prohibition on director, officer, and employee interlocks between a section 20 subsidiary and its affiliated banks or thrift institutions (the inter-locks restriction)
• The restriction on a bank or thrift institution acting as an agent for, or engaging in marketing activities on behalf of, an affiliated section 20 subsid-iary (the cross-marketing restriction)
• The restriction on the purchase and sale of finan-cial assets between a section 20 subsidiary and its affiliated bank or thrift institution (the financial assets restriction).
Digitized for FRASER http://fraser.stlouisfed.org/ Federal Reserve Bank of St. Louis

825
The third proposal would clarify, in an accounting change to the revenue limit, that the Board will not consider interest income earned on securities that a member bank could hold for its own account toward a section 20 subsidiary's revenue limit.
Comments on the second and third proposals were requested by September 3, 1996.
AVAILABILITY OF REVISED LISTS OF OVER-THE-COUNTER STOCKS AND OF FOREIGN MARGIN STOCKS
The Federal Reserve Board on July 26, 1996, pub-lished a revised list of over-the-counter stocks that are subject to its margin regulations (OTC list). Also published was a revised list of foreign equity securi-ties (foreign list) that meet the margin criteria in Regulation T (Credit by Brokers and Dealers). The lists became effective August 12, 1996, and super-sede the previous lists that were effective May 13, 1996. The next revision of the lists is scheduled to be effective November 1996. These lists are published for the information of lenders and the general public.
The changes that were made to the revised OTC list, which now contains 4,614 OTC stocks, are as follows:
• Two hundred eighty-two stocks have been included for the first time, 233 under National Market System (NMS) designation.
• Sixty-one stocks previously on the list have been removed for substantially failing to meet the require-ments for continued listing.
• Sixty-seven stocks have been removed for rea-sons such as listing on a national securities exchange or involvement in an acquisition.
The OTC list is composed of OTC stocks that have been determined by the Board to be subject to margin requirements in Regulations G (Securities Credit by Persons Other Than Banks, Brokers, or Dealers), T, and U (Credit by Banks for Purchasing or Carrying Margin Stocks). It includes OTC stocks qualifying under Board criteria and also includes all OTC stocks designated as NMS securities. Additional NMS secu-rities may be added in the interim between quarterly Board publications; these securities are immediately marginable upon designation as NMS securities.
The foreign list specifies those foreign equity secu-rities that are eligible for margin treatment at broker-dealers. The Board recently amended Regulation T, effective July 1, 1996, to provide that foreign stocks may be included on the foreign list either by meeting the existing Regulation T criteria for foreign securi-ties or by being deemed to have a "ready market" for purposes of the net capital rule of the Securities and Exchange Commission (SEC). Since 1993, the SEC has effectively treated all stocks included in the Financial Times/Standard & Poor's Actuaries World Indices as having a "ready market" for capital pur-poses. The Board is therefore adding 1,261 foreign stocks currently included on the World Indices List that were not on the previous foreign list. The revised foreign list now contains 1,961 securities displayed by order of country. •
Digitized for FRASER http://fraser.stlouisfed.org/ Federal Reserve Bank of St. Louis

826
Minutes of the Federal Open Market Committee Meeting Held on May 21, 1996
A meeting of the Federal Open Market Committee was held in the offices of the Board of Governors of the Federal Reserve System in Washington, D.C., on Tuesday, May 21, 1996, at 9:00 a.m.
Present: Mr. Greenspan, Chairman Mr. McDonough, Vice Chairman Mr. Boehne Mr. Jordan Mr. Kelley Mr. Lindsey Mr. McTeer Ms. Phillips Mr. Stern Ms. Yellen
Messrs. Broaddus, Guynn, Moskow, and Parry, Alternate Members of the Federal Open Market Committee
Messrs. Hoenig and Melzer, and Ms. Minehan, Presidents of the Federal Reserve Banks of Kansas City, St. Louis, and Boston respectively
Mr. Kohn, Secretary and Economist Mr. Bernard, Deputy Secretary Mr. Coyne, Assistant Secretary Mr. Gillum, Assistant Secretary Mr. Mattingly, General Counsel Mr. Baxter, Deputy General Counsel Mr. Prell, Economist Mr. Truman, Economist
Messrs. Lang, Lindsey, Mishkin, Promisel, Rolnick, Rosenblum, Siegman, Simpson, and Stockton, Associate Economists
Mr. Fisher, Manager, System Open Market Account
Mr. Ettin, Deputy Director, Division of Research and Statistics, Board of Governors
Mr. Slifman, Associate Director, Division of Research and Statistics, Board of Governors
Mr. Madigan, Associate Director, Division of Monetary Affairs
Ms. Low, Open Market Secretariat Assistant, Division of Monetary Affairs, Board of Governors
Mr. Rives, First Vice President, Federal Reserve Bank of St. Louis
Mr. Beebe, Ms. Browne, Messrs. Davis, Dewald, Eisenbeis, Goodfriend, and Hunter, Senior Vice Presidents, Federal Reserve Banks of San Francisco, Boston, Kansas City, St. Louis, Atlanta, Richmond, and Chicago respectively
Mr. Altig, Mses. Chen and Rosenbaum, Vice Presidents, Federal Reserve Banks of Cleveland, New York, and Atlanta respectively
By unanimous vote, the minutes of the meeting of the Federal Open Market Committee held on March 26, 1996, were approved.
The Manager of the System Open Market Account reported on developments in foreign exchange mar-kets during the period March 26 through May 20, 1996. There were no open market transactions in foreign currencies for System account during this period, and thus no vote was required of the Committee.
The Manager also reported on developments in domestic financial markets and on System open mar-ket transactions in government securities and federal agency obligations during the period March 26 through May 20, 1996. By unanimous vote, the Com-mittee ratified these transactions.
The Committee then turned to a discussion of the economic and financial outlook and the implementa-tion of monetary policy over the intermeeting period ahead. A summary of the economic and financial information available at the time of the meeting and of the Committee's discussion is provided below, followed by the domestic policy directive that was approved by the Committee and issued to the Federal Reserve Bank of New York.
The information reviewed at this meeting sug-gested that economic activity had expanded moder-ately on balance in recent months. Final demand, which had been quite robust early in the year, was showing some signs of slowing in recent data. Con-sumer spending appeared to be growing at a moder-ate pace; business expenditures on durable equipment had registered further large gains, though new orders
Digitized for FRASER http://fraser.stlouisfed.org/ Federal Reserve Bank of St. Louis

827
had flattened out; and housing demand seemed to be holding up well despite the increase in mortgage interest rates this year. Business inventories, most notably in the automotive industry, had been brought into better alignment with sales, and industrial pro-duction and employment had risen appreciably. Upward pressures on food and energy prices accounted for somewhat larger increases in consumer prices.
Nonfarm payroll employment was essentially unchanged in April after rising substantially in the first quarter; part of the slowdown resulted from an unwinding of special factors that had boosted job growth in the first quarter. Payrolls continued to expand in April in retail trade; finance, insurance, and real estate; and the services industries. In contrast, employment in construction fell sharply, reversing much of the large first-quarter gain. In manufactur-ing, employment declined further in April despite the settlement of a major strike in the automotive sector and the return of affected workers to their jobs. The civilian unemployment rate fell to 5.4 percent.
Industrial production rebounded in April from an appreciable decline in March. The changes in indus-trial output over the two-month period largely reflected fluctuations in motor vehicle assemblies associated with a strike and its subsequent settlement. Manufacturing of products other than motor vehicles rose moderately in April on the strength of further large advances in the output of office and computing equipment and of construction supplies. Utilization of total industrial capacity, which had varied in recent months in concert with movements in production, climbed in April to a rate slightly above that of the fourth quarter of 1995.
Retail sales declined somewhat in April after post-ing a strong gain in the first quarter. Sales of durable goods, which had increased substantially in the first quarter, retraced part of that advance in April; the drop more than offset a further rise in sales of non-durable goods. Housing activity was well sustained in April, with the run-up in mortgage rates that began in February having had little perceptible effect to date. Single-family housing starts were up consider-ably in April, and sales of new and existing homes remained brisk in March (latest data available).
Business fixed investment accelerated sharply in the first quarter of 1996 following three quarters of relatively moderate expansion; however, recent data on orders and contracts pointed, on balance, to some deceleration in business spending on both durable equipment and nonresidential structures. Much of the first-quarter pickup reflected stronger spending for durable equipment; purchases of computing equip-
ment remained robust and spending on other durable equipment increased. Nonresidential construction activity also advanced further in the first quarter; however, construction of office buildings continued to lag, and construction of other commercial build-ings slowed after recording strong gains for several years.
Business inventories declined in March after rising appreciably on average over January and February; inventory accumulation over the quarter as a whole was of modest proportions, as firms sought to bring stocks into better balance with sales. In manufactur-ing, inventories changed little in March and the ratio of stocks to sales was not far above historical lows. In the wholesale sector, inventories declined a little further in March, reflecting a reduction in stocks of motor vehicles, and the inventory-sales ratio remained near the middle of its range in recent years. Retail inventories also declined in March, with cuts in stocks of motor vehicles more than accounting for the drop. The inventory-sales ratio for the retail sec-tor was near the low end of its range in recent years.
The nominal deficit on U.S. trade in goods and services in the first quarter was substantially larger than in the fourth quarter of last year. The value of imports increased sharply in the first quarter after declining in the two previous quarters. Moreover, growth in the value of exports slowed considerably in the first quarter from the pace of other recent quar-ters. Available data indicated that the performance of the economies of the major foreign industrial coun-tries was mixed in the first quarter. The recovery in Japan was still under way while economic activity in continental Europe remained generally weak, with the German economy apparently having contracted further and the French economy exhibiting signs of only a modest upturn after a fourth-quarter decline. Moderate further expansion in economic activity evidently was occurring in Canada and the United Kingdom.
Rising crude oil and, to a lesser extent, food prices led to somewhat larger increases in consumer and producer price indexes in March and April. For non-food, non-energy items, however, consumer prices rose only slightly in April after three months of somewhat faster advances; over the twelve months ended in April, this measure of consumer inflation increased a little less than the rise over the compa-rable year-earlier period. At the producer level, prices of finished goods other than food and energy items recorded a third straight small increase in April. Over the twelve months ended in April, this measure of producer prices rose slightly less than over the com-parable year-earlier period. Hourly compensation of
Digitized for FRASER http://fraser.stlouisfed.org/ Federal Reserve Bank of St. Louis

828 Federal Reserve Bulletin • September 1996
private industry workers expanded in the first quarter at the average rate for all of 1995; the growth was associated with a decline in benefit costs and a sharp rise in wages and salaries.
At its meeting on March 26, 1996, the Committee adopted a directive that called for maintaining the existing degree of pressure on reserve positions and that did not include a presumption about the likely direction of any adjustments to policy during the intermeeting period. The directive stated that in the context of the Committee's long-run objectives for price stability and sustainable economic growth, and giving careful consideration to economic, financial, and monetary developments, slightly greater reserve restraint or slightly lesser reserve restraint would be acceptable during the intermeeting period. The reserve conditions associated with this directive were expected to be consistent with moderate growth in M2 and M3 over coming months.
Open market operations were directed toward maintaining the existing degree of pressure on reserve positions throughout the intermeeting period, and the federal funds rate averaged near 5lA percent, the level expected to be associated with that unchanged policy stance. Other short-term market interest rates changed little over the period, and because the Committee's decision had been largely anticipated in financial markets, longer-term rates also were little changed initially. Over the remainder of the period, however, intermediate- and long-term rates came under upward pressure when incoming economic data were seen by market participants as pointing to stronger growth in output and employment and therefore to a somewhat tighter monetary policy stance than previously had been expected. Despite the increase in bond yields, most indexes of stock prices rose on balance over the intermeeting period, apparently reflecting generally favorable first-quarter earnings reports and the improved economic outlook.
In foreign exchange markets, the rise of U.S. inter-est rates contributed to a considerable appreciation of the trade-weighted value of the dollar in terms of the other G-10 currencies. The dollar was particularly strong against the German mark, reflecting incoming data that suggested continued weakness in economic activity in Germany and, accordingly, a greater like-lihood of further monetary policy easing by the Bundesbank. The dollar rose less against the yen, partly owing to information indicating a strengthen-ing of the economic recovery in Japan and height-ened market expectations of a near-term tightening of monetary policy by the Bank of Japan.
Growth of M2 and M3 slowed substantially in April after having recorded sizable increases earlier
in the year. Weakness in demand deposits after unusually rapid first-quarter expansion and sluggish-ness in currency demand were factors in the slow-down. In addition, the rise in market interest rates in recent months, which had increased the opportunity costs of holding retail deposits, likely had a restrain-ing effect on these deposits. For the year through April, both aggregates grew at rates somewhat above the upper bounds of their respective ranges for the year. Expansion in total domestic nonfinancial debt remained moderate on balance over recent months, and this aggregate stayed near the middle of its monitoring range for the year.
The staff forecast prepared for this meeting sug-gested that the economy would remain generally around its estimated potential. Consumer spending was expected to grow in line with disposable income; the favorable effect of higher equity prices on house-hold wealth and the still-ample availability of credit were expected to outweigh persisting consumer con-cerns about job security and the influence of already-high household debt burdens. Homebuilding was projected to decline a little in response to the recent backup in residential mortgage rates but to remain at a relatively high level because of generally support-ive employment and income conditions and the still-favorable cash flow affordability of homeownership. Business spending on equipment and structures was expected to grow less rapidly in light of the projected moderate growth of sales and profits and the lower rate of utilization of production capacity now prevail-ing. The external sector was projected to exert a small restraining influence on economic activity over the projection period, even though an anticipated firming of economic activity abroad would bolster demand for U.S. exports. Little additional fiscal con-traction was anticipated over the projection period. Inflation recently had been lifted by adverse develop-ments in the energy market and was projected to remain above the levels of recent years, given the high level of resource utilization and the effects of tight grain supplies on food prices. Further risks of inflationary pressure were associated with a possible elevation of the federal minimum wage.
In their discussion of current and prospective eco-nomic conditions ̂ members commented that the economy had been stronger this year than they had anticipated and appeared to be growing at a quite robust pace. However, they generally expected the expansion to slow, keeping the economy close to its potential. Views differed to some extent with regard to the risks surrounding such an outlook. Some saw those risks as fairly evenly balanced, given prospec-tive restraint from the rise in bond yields and the
Digitized for FRASER http://fraser.stlouisfed.org/ Federal Reserve Bank of St. Louis

Minutes of the Federal Open Market Committee 829
foreign exchange value of the dollar since early this year. Others expressed concern that economic growth might continue at a pace that could increase pressures on resources, with adverse implications for inflation in an economy already operating in the neighborhood of its estimated long-term potential. Moreover, faster increases in energy and food prices could contribute to higher overall inflation, both directly and by boost-ing inflationary expectations, and the proposed increase in the minimum wage would add to cost pressures if it were enacted into law. Nonetheless, while the chances of a pickup in inflation later had risen to some extent, a number of members empha-sized that no firm evidence had surfaced thus far to signal that labor compensation was increasing at a faster rate or that core inflation was worsening, and even the early signs of increased pressures on costs and prices were mixed. The past few years had wit-nessed significantly lower cost pressures and more subdued inflation than typically would have been experienced in earlier years with similar rates of resource utilization, but whether this favorable out-come would persist was an open question.
Members observed that the stronger-than-expected performance of the economy thus far this year reflected relatively rapid growth in final demand. Favorable financial conditions, notably the relatively low interest rates of the latter part of 1995 and early 1996 and increases in wealth stemming from sizable advances in stock market prices, evidently were undergirding the expansion. Indications of improving or continuing high levels of economic activity were widespread across the nation according to recent anecdotal reports and regional data, though agricul-tural conditions in many areas were cited as a signifi-cant exception. While the economy appeared to have solid and balanced momentum that pointed to sus-tained growth, a number of factors were seen as likely to foster more moderate expansion beginning in the second half of the year. These included the effects of higher intermediate- and long-term interest rates on interest-sensitive sectors of the economy such as housing, consumer durables, and business fixed investment. The appreciation of the dollar over the past year and near-term moderation in federal government spending also were expected to exert some restraint on economic activity over the forecast horizon. Some members also questioned the sustain-ability of the performance of the stock market; a correction in this market would help to restrain aggre-gate demand. Nonetheless, the continued strength in economic activity raised questions about whether these developments would damp demand sufficiently to keep resource utilization at sustainable levels.
In their review of recent developments and the outlook for key sectors of the economy, members noted that consumer spending had strengthened con-siderably this year after a period of sluggish growth in late 1995. The recent data on consumer spending were reinforced by anecdotal reports from various parts of the country. The wealth effects from the further gains that had occurred in stock market prices, along with sustained increases in employment and a ready availability of consumer financing, were seen as playing a positive role in boosting consumer expenditures. Barring changes in these underlying factors, continued growth in consumer spending seemed likely, although members referred to develop-ments that could begin to slow such growth over the months ahead. The latter included the satisfaction of much of the earlier pent-up demand for consumer durables and fairly elevated levels of consumer debt. On balance, moderate expansion in consumer expen-ditures, perhaps in line with the growth in incomes, seemed likely over the projection period.
Business fixed investment was believed likely to remain a source of considerable strength in the expan-sion, though growth in this sector of the economy also was expected to moderate from the elevated pace thus far this year. The desire of many business firms and other users of capital equipment to take advan-tage of new, more effective, and less expensive com-puter and other technologies and more generally to add further to capital in an effort to reduce costs in highly competitive markets would continue to under-pin investment spending. In addition, equity and other financing remained available on relatively attractive terms. On the other hand, the rise in business invest-ment in recent years had brought capital stocks into more acceptable alignment with expected sales, damping the need for further sizable additions.
Business firms appeared to have completed, or nearly completed, their efforts to bring inventories into better balance with sales, including the rebuild-ing of motor vehicle stocks after the strike at a major manufacturer was settled in March. On the basis of recent experience, subdued growth in inventories could be anticipated in the context of the projected expansion of overall economic activity at a pace near the economy's long-run potential. It was suggested, however, that such an expectation implied relatively restrained inventory investment in comparison with past cyclical patterns. Accordingly, much stronger growth in such investment could occur, with con-comitant effects on incomes and the growth of overall spending.
With regard to the outlook for housing, the rise in mortgage rates in the past few months could be
Digitized for FRASER http://fraser.stlouisfed.org/ Federal Reserve Bank of St. Louis

830 Federal Reserve Bulletin • September 1996
expected to retard residential construction activity to some extent. Thus far, however, increased interest costs did not appear to have had any perceptible effects on housing sales or construction. Indeed, the housing sector was continuing to display a good deal of strength in many parts of the country. Some mem-bers observed that the appreciable momentum in housing activity reflected strength in the underlying fundamentals, including continued afifordability, that seemed likely to sustain a high level of housing construction for a considerable period of time despite somewhat higher mortgage rates.
In the area of fiscal policy, legislative agreement had not yet been reached on how to implement the objective of a balanced federal budget over time, but decisions covering the nearer term implied continued budget restraint. On the foreign trade side of the economy, an anticipated firming of economic condi-tions abroad would provide impetus to real net exports. At the same time, however, imports were expected to rise appreciably in response to the expan-sion of domestic economic activity and the apprecia-tion of the dollar, and on balance the external sector probably would not be boosting real GDP.
The outlook for inflation was of key importance to the formulation of monetary policy at this time, but it was clouded by substantial uncertainty. One source of uncertainty was the behavior of food and energy prices. Increases in these prices largely accounted for the more rapid rise in consumer prices thus far this year, and they likely would continue to add to infla-tion in the months ahead. Retail energy prices had risen appreciably, but at least some of that increase was expected to be reversed over the near term. Retail food prices did not yet display any significant effects from the sizable rise in grain prices in recent months, and while some effects on retail prices were likely, their extent and duration were difficult to gauge at this point. Moreover, it was difficult to anticipate how much the higher food and energy prices might affect inflation expectations and wage demands and thereby potentially become embedded more generally in the price structure.
Also of concern to the members were the possible effects on inflation of continued pressures on resources, especially if the current pace of the expan-sion should fail to moderate as much as projected. In recent years, the relationship between resource use and inflation had not followed earlier patterns. In particular, increases in labor compensation had been comparatively subdued over an extended period of what seemed to be relatively full employment high-lighted by anecdotal reports of scarcities of various types of labor in numerous parts of the country. In
part, worker willingness to accept comparatively limited increases in compensation could be attributed to the apparent rise in insecurity about the perma-nence of jobs or the availability of alternative jobs, but the reasons were not fully understood. From the standpoint of the inflation outlook, it therefore was uncertain how long the period of relatively restrained increases in labor compensation would last. Against this background, a number of members indicated that they perceived an appreciable risk of rising labor costs and related inflation, even though there was little evidence to date of such developments; others noted that they could not rule out the possibility that the favorable experience would be extended.
In the Committee's discussion of policy for the intermeeting period ahead, all the members supported a proposal to maintain an unchanged degree of pres-sure in reserve markets. The members agreed that the balance of risks on inflation had shifted substantially since early in the year. At that time, the economy had seemed sluggish and inflation was seen as possibly easing, but more recent developments indicated that the economy was stronger and rising inflation down the road could not be ruled out. Nonetheless, while policy might need to be firmed at some point to head off emerging inflation pressures, financial conditions were not so obviously stimulative as to counsel a need for any immediate tightening of policy. The real federal funds rate probably was not greatly out of line with its appropriate level, and the rise in longer-term interest rates and the exchange rate meant that finan-cial conditions were now exerting more restraint than earlier this year. More information might provide a better sense of how the higher interest rates were affecting aggregate demand and perhaps also help—to a small degree—to shed light on the consid-erable uncertainties surrounding the relationship of output to inflation. In any event, actual inflation data—apart from food and energy prices—and many of the usual early warning signs of mounting price pressures did not yet indicate a pickup in the under-lying trend of prices. Accordingly, the members viewed policy as appropriately positioned under cur-rent circumstances, though ongoing developments would need to be reassessed at the upcoming meeting in early July. Some members noted that the Commit-tee would need to anticipate, and act to preclude, a rise in the core rate of inflation that, if it were to materialize, would be difficult and costly to reverse. In this regard, the view was expressed that a firming in policy sooner rather than later was likely to end up promoting stability in output and prices.
In the Committee's discussion of possible inter-meeting adjustments to policy, all the members indi-
Digitized for FRASER http://fraser.stlouisfed.org/ Federal Reserve Bank of St. Louis

Minutes of the Federal Open Market Committee 831
cated at least some preference for retaining a sym-metric directive. Members commented that the probability of developments during this period that would warrant a change in policy before the next meeting was quite low. Moreover, symmetry did not rule out an intermeeting adjustment, and the Chair-man could call for a Committee consultation should the incoming information raise questions about the stance of monetary policy. Some members felt that it was especially appropriate that a policy action that represented a reversal of the previous move be made with a full discussion at a regular meeting. Some members also commented that an asymmetric direc-tive toward restraint would imply a predisposition on the part of the Committee to tighten policy at some point, possibly at the next meeting. While they would be prepared to take such a step if the evidence war-ranted, their preference was to come into the July meeting without such a presumption.
At the conclusion of the Committee's discussion, all the members indicated a preference for a directive that called for maintaining the existing degree of pressure on reserve positions and that did not include a presumption about the likely direction of any adjustments to policy during the intermeeting period. Accordingly, in the context of the Committee's long-run objectives for price stability and sustainable eco-nomic growth, and giving careful consideration to economic, financial, and monetary developments, the Committee decided that slightly greater or slightly lesser reserve restraint would be acceptable during the intermeeting period. The reserve conditions con-templated at this meeting were expected to be consis-tent with moderate growth in M2 and M3 over com-ing months.
At the conclusion of the meeting, the Federal Reserve Bank of New York was authorized and directed, until instructed otherwise by the Commit-tee, to execute transactions in the System Account in accordance with the following domestic policy directive:
The information reviewed at this meeting suggests that, on balance, economic activity has grown moderately in recent months. Nonfarm payroll employment changed little in April after rising substantially in the first quarter; the civilian unemployment rate fell to 5.4 percent. Industrial production increased sharply in April, largely reflecting a rebound in motor vehicle assemblies after a strike in March. Retail sales declined somewhat in April after post-
ing a strong gain in the first quarter. Single-family housing starts rose considerably in April. Orders and contracts point to some deceleration in spending on business equip-ment and nonresidential structures after a very rapid expan-sion in the first quarter. The nominal deficit on U.S. trade in goods and services widened significantly in the first quarter from its rate in the fourth quarter of last year. Upward pressures on food and energy prices have led to somewhat larger increases in the consumer price index over recent months.
Short-term market interest rates have changed little while long-term rates have risen somewhat further since the Committee meeting on March 26. In foreign exchange markets, the trade-weighted value of the dollar in terms of the other G-10 currencies has appreciated considerably over the intermeeting period.
Growth of M2 and M3 slowed substantially in April after recording sizable increases earlier in the year. For the year through April, both aggregates grew at rates some-what above the upper bounds of their respective ranges for the year. Expansion in total domestic nonfinancial debt remained moderate on balance over recent months.
The Federal Open Market Committee seeks monetary and financial conditions that will foster price stability and promote sustainable growth in output. In furtherance of these objectives, the Committee at its meeting in January established ranges for growth of M2 and M3 of 1 to 5 percent and 2 to 6 percent respectively, measured from the fourth quarter of 1995 to the fourth quarter of 1996. The monitoring range for growth of total domestic nonfi-nancial debt was set at 3 to 7 percent for the year. The behavior of the monetary aggregates will continue to be evaluated in the light of progress toward price level stabil-ity, movements in their velocities, and developments in the economy and financial markets.
In the implementation of policy for the immediate future, the Committee seeks to maintain the existing degree of pressure on reserve positions. In the context of the Com-mittee's long-run objectives for price stability and sustain-able economic growth, and giving careful consideration to economic, financial, and monetary developments, slightly greater reserve restraint or slightly lesser reserve restraint would be acceptable in the intermeeting period. The con-templated reserve conditions are expected to be consistent with moderate growth in M2 and M3 over coming months.
Votes for this action: Messrs. Greenspan, McDonough, Boehne, Jordan, Kelley, Lindsey, McTeer, Ms. Phillips, Mr. Stern, and Ms. Yellen. Votes against this action: None.
It was agreed that the next meeting of the Commit-tee would be held on Tuesday-Wednesday, July 2-3, 1996.
The meeting adjourned at 1:15 p.m.
Donald L. Kohn Secretary
Digitized for FRASER http://fraser.stlouisfed.org/ Federal Reserve Bank of St. Louis

833
Legal Developments
ORDERS ISSUED UNDER BANK HOLDING COMPANY ACT
Orders Issued Under Section 3 of the Bank Holding Company Act
Banco Santander, S.A. Madrid, Spain
Order Approving the Acquisition of a Bank
Banco Santander, S.A., Madrid, Spain ("Santander"), a foreign bank subject to the Bank Holding Company Act ("BHC Act"), has requested the Board's approval under section 3 of the BHC Act (12 U.S.C. § 1842) to acquire 99.2 percent of the voting shares of Banco Central Hispano Puerto Rico, Hato Rey, Puerto Rico ("BCH-PR").
Notice of the proposal, affording interested persons an opportunity to submit comments, has been published (61 Federal Register 19,626 (1996)). The time for filing comments has expired, and the Board has considered the application and all comments received in light of the factors set forth in section 3(c) of the BHC Act.
On the basis of all the facts of record, the application is approved for the reasons set forth in the Board's Statement, which will be released at a later date. The Board also has denied a request for a public hearing or meeting on this proposal. The Board's approval is specifically conditioned on compliance by Santander with all the commitments made in connection with this application. For purposes of this action, the commitments and conditions relied on by the Board in reaching its decision are deemed to be condi-tions imposed in writing by the Board in connection with its findings and decisions and, as such, may be enforced in proceedings under applicable law.
The proposed acquisition shall not be consummated before the fifteenth day following the effective date of this order or later than three months after the effective date of this order, unless such period is extended for good cause by the Board or by the Federal Reserve Bank of New York, acting pursuant to delegated authority.
By order of the Board of Governors, effective July 31, 1996.
Voting for this action: Chairman Greenspan, Vice Chair Rivlin, and Governors Kelley, Lindsey, Phillips, Yellon, and Meyer.
JENNIFER J. JOHNSON Deputy Secretary of the Board
Statement by the Board of Governors of the Federal Reserve System Regarding the Application by Banco Santander, SA., to Acquire Banco Central Hispano Puerto Rico
By Order dated July 31, 1996, the Board approved the application of Banco Santander, S.A., Madrid, Spain ("Santander"), a foreign bank subject to the Bank Holding Company Act ("BHC Act"), under section 3 of the BHC Act (12 U.S.C. § 1842) to acquire 99.2 percent of the vot-ing shares of Banco Central Hispano Puerto Rico, Hato Rey, Puerto Rico ("BCH-PR").1 The Board hereby issues this Statement regarding its approval Order.
Notice of the proposal, affording interested persons an opportunity to submit comments, has been published (61 Federal Register 19,626 (1996)). The time for filing comments has expired, and the Board has considered the application and all comments received in light of the factors set forth in section 3(c) of the BHC Act.
Santander, with total consolidated assets equivalent to approximately $136 billion, is the largest banking organi-zation in Spain.2 Santander is the second largest commer-cial banking organization in Puerto Rico, controlling total deposits of approximately $3.1 billion, representing 14 percent of total deposits in commercial banks in the Commonwealth.
BCH-PR is the fourth largest commercial banking orga-nization in Puerto Rico, controlling deposits of approxi-mately $1.7 billion, representing 7.6 percent of total de-posits in commercial banks in the commonwealth. On consummation of the proposal, Santander would remain the second largest commercial banking organization in Puerto Rico, controlling deposits of approximately $4.8 billion, representing 21.6 percent of total deposits in commercial banks in the commonwealth.
1. Santander's subsidiary bank, Banco Santander Puerto Rico, San Juan, Puerto Rico ("BS-PR"), also proposes to purchase substantially all the assets and assume substantially all the liabilities of BCH-PR in a transaction subject to approval by the Federal Deposit Insurance Corporation ("FDIC") under section 18(c) of the Federal Deposit Insurance Act (12 U.S.C. § 1828(c) ("FDI Act")) (the "Bank Merger Act"). Immediately after this transaction, BCH-PR would be liqui-dated and all minority shareholders of BCH-PR would receive a pro rata distribution of proceeds from the purchase and assumption transaction.
2. Asset data are as of December 31, 1995. Deposit data are as of June 30, 1995.
Digitized for FRASER http://fraser.stlouisfed.org/ Federal Reserve Bank of St. Louis

834 Federal Reserve Bulletin • September 1996
Competitive Considerations
The BHC Act prohibits the Board from approving an application under section 3 of the BHC Act if the proposal would result in a monopoly or if the effect of the proposal may be substantially to lessen competition in any relevant market, unless the Board finds that the anticompetitive effects of the proposal are clearly outweighed in the public interest by the probable effect of the proposal in meeting the convenience and needs of the community to be served.
In evaluating the competitive effect of a proposed trans-action, the Board must determine the appropriate product market and the relevant geographic market.3 Based on all the facts of record, the Board concludes that the appropri-ate geographic markets for analyzing the combination of Santander and BHC-PR are the Aguadilla, Mayaguez, Ponce, and San Juan banking markets as defined in the Appendix.4 In reaching this decision, the Board has, as in previous cases, considered the location of the relevant banks, worker commuting patterns (as indicated by census data), and other indicia of economic integration and the transmission of competitive forces among depository insti-tutions.5
The traditional product market for analyzing the compet-itive effects of a bank acquisition or merger is the cluster of banking products and services approximated by market deposits.6 Using this approach, consummation of this pro-posal would not have a significantly adverse effect on competition in any relevant banking market. In the May-aguez and Ponce banking markets, the proposal would not exceed the threshold levels of market concentration as measured by the Herfindahl-Hirschman Index ("HHI") under the Department of Justice Merger Guidelines.7 The
3. Chemical Banking Corporation, 82 Federal Reserve Bulletin 239, 241 (1996) ("Chemical Order"); See United States v. Philadel-phia National Bank, 374 U.S. 321, 357 (1963). United States v. Phillipsburg National Bank, 399 U.S. 350 (1969).
4. Based on the factors discussed below, which the Board believes are the appropriate delineators of the market, the relevant market is not the entire island of Puerto Rico, as argued by Santander, or small geographic areas, as argued by Inner City Press/Community on the Move ("Protestant").
5. For a detailed discussion of the methodology and commuting data used in defining the banking markets, see David Holdsworth, "Defini-tion of Banking Markets in Puerto Rico," manuscript, Federal Reserve Bank of New York, February 1995. In defining the scope of the Aguadilla banking market, the Board has included the municipality of Rincon. Rincon is located approximately 13 miles from the city of Aguadilla and approximately 30 percent of its residents reported that they commute to the Aguadilla MSA or to the municipalities of Isabela and San Sebastian within the Aguadilla banking market.
6. Chemical Banking Corporation, 82 Federal Reserve Bulletin 239, 241 (1996) ("Chemical Order")-, See United States v. Philadel-phia National Bank, 374 U.S. 321, 357 (1963).
7. The HHI would increase for the Mayaguez banking market by 147 points to 2096 and for the Ponce banking market by 51 points to 2412. Under the revised Department of Justice Merger Guidelines, 49 Federal Register 26,823 (June 29, 1984), a market in which the post-merger HHI is above 1800 is considered to be highly concen-trated. In such markets, the Department of Justice is likely to chal-lenge a merger that increases the HHI by more than 50 points. The Department of Justice has informed the Board that a bank merger or
thresholds would be exceeded in the San Juan and Agua-dilla banking markets.8
The Board notes that HHI thresholds are only guidelines that are used by the Board, the Department of Justice, and the other banking agencies to help identify cases in which a more detailed competitive analysis is appropriate to ensure that the proposal would not have a significantly adverse effect on competition in any relevant banking market. A proposal that fails to pass the HHI market screen may nevertheless be approved because other information may indicate that the proposal would not have a significantly adverse effect on competition. In this case, the Department of Justice has reviewed the proposal and advised the Board that consummation of the proposal would not likely have any significantly adverse competitive effects in the San Juan and Aguadilla banking markets or in any other rele-vant banking markets. The Puerto Rico banking commis-sioner and the FDIC also have not objected to the proposal.
The Board believes that a number of factors mitigate the potential anticompetitive effects of the proposal in the San Juan and Aguadilla banking markets. Sixteen commercial banks and two thrifts (together, "depository institutions") would remain in the San Juan banking market, and six commercial banks would remain in the Aguadilla banking market following consummation of this proposal.
In addition, 55 savings and credit union cooperative societies ("cooperatives") compete in the San Juan bank-ing market and six cooperatives compete in the Aguadilla banking market.9 The Board has previously recognized that cooperatives are significant competitors of commercial banks in Puerto Rico.10 Cooperatives are commonwealth-insured depository institutions that are unique to Puerto Rico. Although cooperatives are membership organiza-tions, few impose membership restrictions, and coopera-tives are authorized to provide a full range of products and
acquisition generally will not be challenged (in the absence of other factors indicating anticompetitive effects) unless the post-merger HHI is at least 1800 and the merger increases the HHI by 200 points. The Department of Justice has stated that the higher than normal HHI thresholds for screening bank mergers for anticompetitive effects implicitly recognize the competitive effect of limited-purpose lenders and other nondepository financial entities.
Market share data are contained in the appendix and are as of June 30, 1995. These data are based on calculations in which the deposits of thrift institutions are included at 50 percent. The Board previously has indicated that thrift institutions have become, or have the potential to become, significant competitors of commercial banks. See Midwest Financial Group, 75 Federal Reserve Bulletin 386 (1989); National City Corporation, 70 Federal Reserve Bulletin 743 (1984).
8. The HHI would increase for the San Juan banking market by 231 points to 1896 and for the Aguadilla banking market by 253 points to 3001.
9. Cooperatives in the Aguadilla banking market control 31.7 per-cent of total deposits in insured depository organizations.
10. For a detailed discussion of the activities of cooperatives, incorporated herein by reference, see BanPonce Corporation, 77 Federal Reserve Bulletin 43, 45 (1991) ("BanPonce Order"). There are 180 cooperatives controlling approximately $2.2 billion in depos-its, representing approximately 8.9 percent of deposits in depository institutions in Puerto Rico. All data for cooperatives are as of Decem-ber 31, 1995.
Digitized for FRASER http://fraser.stlouisfed.org/ Federal Reserve Bank of St. Louis

Legal Developments 835
services to nonmembers.11 Cooperatives provide transac-tion accounts and are authorized to lend to both members and nonmembers for any purpose, including home pur-chases and improvements and business purposes. In addi-tion, the Puerto Rico Inspector of Cooperatives is autho-rized to grant broad lending authority, and cooperatives were recently authorized by statute to make small business loans to individuals.12 If cooperatives are factored into the calculation of the market indexes, the proposal does not exceed the thresholds in the Department of Justice Merger Guidelines in the San Juan or Aguadilla banking markets.13
The Board has considered Protestant's contention that consummation of this proposal would have a significantly adverse effect on competition for small business loans in areas of Puerto Rico. Based on an analysis of the record, the Board concludes that this proposal would not have a significantly adverse effect on small business lending even if that product were analyzed apart from the cluster of banking products and services. Available data indicate that, upon consummation of this transaction, the HHI for small business lending in San Juan would increase by 440 points to 3095. However, the effect of the proposal on small business lending would be significantly mitigated by a number of factors. A large U.S. bank holding company with a substantial branch network in Puerto Rico has recently entered the market for small business lending and has already rapidly increased its share of small business lending. In 1994, several large thrift institutions headquar-tered in Puerto Rico converted to commercial banks and also entered the market for small business loans. In addi-tion, cooperatives are authorized to make small business loans to individuals and provide a meaningful amount of small business credit. Moreover, there are a large number of other commercial banks in the relevant markets with significant capacity, as measured by deposits, that could be used to make small business loans.
11. Deposits in cooperatives are insurd to a maximum of $50,000 per person under the Shares and Deposits Insurance Program, an agency of the commonwealth. See P.R. Stat. Ann. tit. 7, § 1151(b).
12. The record indicates that cooperatives were a significant source of small business credit even before the legislation was enacted because many personal loans were used to purchase or repair equip-ment and provide working capital.
13. Protestant contends that deposits in cooperatives should be weighted at 25 percent, and Santander contends that these deposits should be weighted at 100 percent. The Board has not weighted cooperatives at 100 percent because of their limited ability to make medium- and large-sized commercial loans. Based on the asset com-position of cooperatives, the Board believes that cooperatives are at least as significant as thrift institutions as competitors of commercial banks, and should be weighted at 50 percent. If deposits of coopera-tives are weighted at 50 percent, the HHI would increase for the San Juan banking market by 215 points to 1761, and for the Aguadilla banking market by 167 points to 2212. If deposits of cooperatives are weighted at 25 percent, the HHI would increase for the San Juan banking market by 223 points to 1831, and for the Aguadilla banking market by 203 points to 2429.
Other Factors Under the BHC Act
The BHC Act also requires the Board to consider the financial and managerial resources and future prospects of the companies and banks involved, the convenience and needs of the community to be served, and certain other supervisory factors.
A. Supervisory Factors
The Board previously has determined that Santander is subject to comprehensive supervision or regulation on a consolidated basis by its home country supervisor.14 The Board also has carefully considered the financial and man-agerial resources and future prospects of Santander, BS-PR, BCH-PR, and BCH-PR's parent company, Banco Central Hispanoamericano, S.A., Madrid, Spain ("Banco Central"), as well as other supervisory factors in light of all the facts of record.15 These facts include supervisory reports of examination assessing the financial and manage-rial resources of the organizations and confidential manage-rial and financial information provided by Santander.16
Based on these and all other facts of record, the Board concludes that all the supervisory factors under the BHC Act, including financial and managerial resources, weigh in favor of approving this proposal.17
14. See First Fidelity Bancorporation and Banco Santander; S.A., 79 Federal Reserve Bulletin 622 (1993). The Board has determined that Santander has provided adequate assurances of access to informa-tion necessary to determine compliance with U.S. law.
15. Protestant maintains that Santander has violated the terms of certain passivity commitments made in connection with its acquisition of a minority interest in First Union Corporation, Charlotte, North Carolina ("First Union") by making public statements regarding the value of this investment and implying that its passive investments in other bank holding companies are of greater importance. See Banco Santander, S.A., 81 Federal Reserve Bulletin 1139 (1995) ("Santander Order"). Protestant also argues that Santander, through a representa-tive on the First Union board of directors authorized under the commitments, is exercising a controlling influence over First Union's expansion strategies as evidenced by the board's decision to enter a market favored by the Santander representative. Santander denies any violations of the commitments. Based on all the facts of record, the Board does not believe that Protestant's allegations support the con-clusion that Santander has violated its passivity commitments.
16. The Board has reviewed comments from several minority share-holders of BCH-PR criticizing the performance of bank's manage-ment in a number of areas, including allegations that bank's manage-ment has not provided them enough information on the proposal, has not provided an adequate return on their investment, and has dimin-ished the value of their investment by selling the bank's branches before this proposal. The Board has considered these comments in light of reports of examination assessing the managerial resources of BCH-PR and the fact that the bank's management will be substan-tially replaced by Santander managers after consummation of the proposal. The Board also believes that complaints concerning the value of their investment do not relate to factors specified in the BHC Act and are therefore beyond the jurisdiction of the Board to consider in reviewing applications under section 3 of the BHC Act. See Western Bancshares, Inc. v. Board of Governors, 480 F.2d 749 (10th Cir. 1973).
17. Protestant has provided publicly available information regarding possible violations of securities laws in connection with Santander's
Digitized for FRASER http://fraser.stlouisfed.org/ Federal Reserve Bank of St. Louis

836 Federal Reserve Bulletin • September 1996
B. Convenience and Needs Factor
The Board has long held that consideration of the conve-nience and needs factor includes a review of the records of the relevant depository institutions under the Community Reinvestment Act (12 U.S.C. § 2901 et seq.) ("CRA"). As provided in the CRA, the Board has evaluated this factor in light of examinations by the primary federal supervisor of the CRA performance records of the relevant institutions. The Board also has carefully considered comments from Protestant criticizing Santander's record of performance under the CRA in meeting the credit needs of the delin-eated community of its branch in New York.
An institution's most recent CRA performance evalua-tion is a particularly important consideration in the applica-tions process because it represents a detailed on-site evalu-ation of the institution's overall record of performance under the CRA by its primary federal supervisor.18 In addition, the Board considers an institution's policies and practices for compliance with applicable fair lending laws. The Board also takes into account information on an insti-tution's lending activities that assist in meeting the credit needs of low- and moderate-income neighborhoods, in-cluding programs and activities initiated since its most recent CRA performance examination.
Performance Examinations. BS-PR received an "out-standing" rating for CRA performance from its primary federal supervisor, the Federal Deposit Insurance Corpora-tion ("FDIC"), as of September 18, 1995 ("FDIC Exami-nation"). In addition, the New York branch of BS-PR ("Branch") received a "satisfactory" rating for CRA per-formance from its primary supervisor, the New York State Banking Department ("Department"), as of November 22, 1995 ("Department Examination").19 BCH-PR also re-
purchase of stock in First Fidelity Bancorporation, Lawrenceville, New Jersey, prior to First Fidelity's acquisition by First Union. The Board has carefully reviewed this information in light of all facts of record, including information provided by federal regulatory agencies, and concludes that all supervisory factors relating to Santander are consistent with approval. Protestant also asserts that Santander's rela-tionship with The Royal Bank of Scotland Group pic, Edinburgh, Scotland ("Royal Bank"), is inconsistent with approval of this pro-posal. The Board approved Santander's retention of its minority interest in Royal Bank under section 3 of the BHC Act. See Banco de Santander, S.A., 78 Federal Reserve Bulletin 60 (1992).
18. The Board notes that the Statement of the Federal Financial Supervisory Agencies Regarding the Community Reinvestment Act provides that a CRA examination is an important and often controlling factor in the consideration of an institution's CRA record and that reports of these examinations will be given great weight in the applications process. 54 Federal Register 13,742, 13,745 (1989).
19. Protestant's criticisms of the Department Examination were considered by the Board in the Santander Order, and for the reasons discussed in the Santander Order and incorporated herein by refer-ence, the Board believes that the examination is sufficient. See San-tander Order, 81 Federal Reserve Bulletin at 1141 n. 19 (1995). Protestant also maintains that Branch makes an inadequate amount of loans within its delineated service area. Branch, with total assets of approximately $67 million, has no retail banking operations and meets community credit needs by supporting the community development projects of community-based organizations and financial intermediar-
ceived a "satisfactory" rating for CRA performance from the FDIC, as of August 15, 1994.20
CRA performance record of BS-PR. After consummation of the proposal, Santander will implement its policies and programs in the communities previously served by BCH-PR. The FDIC Examination found that BS-PR en-gaged in extensive efforts to ascertain and serve the credit needs of all segments of its community, including low- and moderate-income areas. For example, BS-PR's Pequenas y Medianas Empresas program ("PYMES"), developed jointly with the University of Puerto Rico and the United Retailers Center, provided small- and medium-sized busi-nesses with free technical, administrative, and financial advice. PYMES used a touring bus and a toll-free tele-phone number to reach additional members of the commu-nity, and met with local government officials in all 78 municipalities in Puerto Rico. During 1994, through PYMES, BS-PR made $65 million of small business loans, provided financial advice to 1,261 small businesses, and developed loan programs to meet specific small business requirements. BS-PR also is a Small Business Administra-tion preferred lender and originated more than $10 million of SB A guaranteed loans between October 1993 and Sep-tember 1994. In addition, BS-PR participated with several commonwealth housing agencies during 1994, and ex-tended 13 residential construction loans for $83.8 million.
The FDIC Examination found that CRA performance was a management priority of BS-PR and noted favorably the close supervision of CRA programs by the bank's board of directors, the bank's extensive fair lending train-ing, monitoring, and compliance auditing programs, and the incorporation of CRA objectives into strategic market-ing decisions. Several forms of mass media and direct advertising were used to promote retail banking products in all areas of the bank's delineated community, including consumer loan products specifically developed for low-and moderate-income borrowers.21 The bank's branches were considered to be readily accessible by all areas of its delineated community, and 27.7 percent of all loans were originated in low- and moderate-income areas. Examiners found no evidence of any practices intended to discourage
ies serving low- and moderate-income neighborhoods, such as Neigh-borhood Housing Services of New York City, Inc., and the National Federation of Community Development Credit Unions. Through its community development contacts, Branch has committed $1 million toward the rehabilitation of a foreclosed property in the Bronx in order to produce approximately 20 new housing units, and maintains a $100,000 certificate of deposit in an institution in Brooklyn that engages in community development activities. In addition, total loans by Branch within its delineated community exceed $12.4 million, including $ 1.2 million in loans to businesses owned by minorities.
20. The New York branch of Banco Central received a "needs to improve" rating in its most recent CRA performance evaluation from the FDIC. The branch is separately owned by BCH-PR's foreign bank parent and would not be acquired in connection with this proposal. Protestant argues that a current management interlock between the branch and BCH-PR would adversely affect Santander's CRA perfor-mance after consummation of the proposal.
21. BS-PR made 30,324 consumer loans totalling $270.6 million in 1994.
Digitized for FRASER http://fraser.stlouisfed.org/ Federal Reserve Bank of St. Louis

Legal Developments 837
or prescreen applicants, and no violations of fair lending laws were noted.
Branch Closings. Santander has identified three branches of BCH-PR located in low- or moderate-income census tracts that would be closed as a result of this proposal. Two of these branches are located less than one-tenth of a mile from BS-PR branches. The third branch is within one-half mile of a BS-PR branch that is also equipped with an automated teller machine. The Board notes that all branch closings resulting from this proposal would be subject to Santander's branch closing policy and the Joint Agency Policy Statement on Branch Closings ("Joint Policy State-ment").22
Santander's branch closing policy at BS-PR has been reviewed by FDIC examiners and found to be satisfactory. Under the policy, the impact of any proposed branch clos-ing on the ability of the bank to serve its community, including low- and moderate-income areas, is assessed. This assessment includes meeting with representatives of affected communities and considering alternatives that minimize the adverse impact of the proposed branch clos-ing. The FDIC Examination found that the two branches closed and seven branches consolidated under this policy during the period covered by the examination did not adversely affect the availability of banking products and services in the communities involved. The Board also notes that any branch closings by BS-PR, particularly in low- and moderate-income neighborhoods, would be as-sessed by examiners as part of the institution's future CRA performance evaluations, and would be reviewed by the Board in future applications to acquire a depository facil-ity.
Conclusion on Convenience and Needs Factor. The Board has carefully considered the entire record in its review of the convenience and needs factor under the BHC Act. Based on all the facts of record, including information
22. Protestant contends that Santander should be required, in con-nection with the proposal, to determine all branches of the resulting institution that would be closed within the next 12 months and submit this list. Santander has not yet determined all the branches of the resulting institution that would be closed. As discussed above, the Board has carefully reviewed the policies that Santander applies in determining whether to close a branch. In addition, under the FDI Act, all insured depository institutions are required to submit a notice of any proposed branch closing to the appropriate federal banking agency no later than 90 days before the date of closure that contains:
(1) The identity of the branch to be closed and the proposed closing date; (2) A detailed statement of the reasons for the decision to close the branch; and (3) Statistical or other information supporting the reasons for clo-sure, consistent with the institution's written policy for branch closings. Movement of branches within the same immediate neighborhood
that do not substantially affect the nature of the business or the customers served are considered consolidations or relocations under the Joint Policy Statement and, as such, do not require prior notice. See section 228 of the Federal Deposit Insurance Corporation Im-provement Act of 1991, which added a new section 42 to the FDI Act (12 U.S.C. § 1831r-l). See also Joint Policy Statement, 58 Federal Register 49,083 (1993).
provided by Santander and CRA performance examina-tions, the Board concludes that the efforts of Santander and BCH-PR to help meet the credit needs of all segments of the communities served, including residents of low- and moderate-income areas, are consistent with approval. In this light, the Board concludes that convenience and needs considerations, including the CRA performance records of Santander, BS-PR, and BCH-PR, are consistent with ap-proval.23
Conclusion
Based on the foregoing and all other facts of record, the Board has determined that the application should be, and hereby is, approved.24 The Board's approval is specifically conditioned on compliance by Santander with all the com-mitments made in connection with this application. For the purpose of this action, the commitments and conditions relied on by the Board in reaching its decision are deemed to be conditions imposed in writing by the Board in con-nection with its findings and decisions and, as such, may be enforced in proceedings under applicable law.
August 1, 1996
JENNIFER J . J O H N S O N Deputy Secretary of the Board
23. Protestant also has requested that the Board hold public hearings or meetings in Puerto Rico and New York to consider public testi-mony concerning the convenience and needs and managerial factors. Section 3(b) of the BHC Act does not require the Board to hold a public hearing or meeting unless the appropriate supervisory authority for the bank to be acquired makes a timely written recommendation of denial of the application. In this case, neither the FDIC nor the Puerto Rico banking commissioner has recommended denial.
Under the Board's rules, the Board may, in its discretion, hold a public hearing or meeting on an application to clarify factual issues related to the application and to provide an opportunity for testimony, if appropriate. 12C.F.R. 262.3(e) and 262.25(d). The Board has carefully considered Protestant's request in light of all the facts of record. In the Board's view, Protestant has had ample opportunity to submit its views and has, in fact, submitted substantial materials that have been considered by the Board in acting on the application. Protestant fails to demonstrate why its written submissions do not adequately present its allegations and what, if any, additional matters would be addressed in a public hearing or meeting. Based on all the facts of record, the Board has determined that public hearings or meetings are not necessary to clarify the factual record or otherwise warranted in this case. Accordingly, Protestant's request for public hearings or meetings on the application is denied.
24. Protestant requests that action on this proposal be delayed pending an on-site investigation of the competitive effects of this proposal, an investigation of Santander's compliance with its passivity commitments, and an on-site investigation of the New York branch of Banco Central (or until the results of a forthcoming FDIC examination of the branch are made available for public comment). The Board is required under applicable law and its processing procedures to act on applications submitted under the BHC Act within specified time periods. Based on all the facts of record, and for the reasons discussed above, the Board concludes that the record is sufficient to act on the proposal at this time and that delay or denial of this proposal on the grounds of informational insufficiency is not warranted.
Digitized for FRASER http://fraser.stlouisfed.org/ Federal Reserve Bank of St. Louis

838 Federal Reserve Bulletin • September 1996
Appendix
Banking Markets in Puerto Rico
Aguadilla Aguadilla Metropolitan Statistical Area and the municipalities of Isabela, Rincon, and San Sebastian.
Santander is the third largest depository institution in the market, controlling deposits of approximately $93.4 mil-lion, representing 16.2 percent of deposits in depository institutions in the market ("market deposits"). BCH-PR is the fourth largest depository institution in the market, controlling deposits of approximately $45.1 million, repre-senting 7.8 percent of market deposits. On consummation of the proposal, Santander would remain the third largest depository institution in the Aguadilla banking market, controlling deposits of approximately $138.5 million, rep-resenting 24 percent of market deposits.
Mayaguez Mayaguez Metropolitan Statistical Area and the municipalities of Lajas, Las Marias, and Maricao.
Santander is the fourth largest depository institution in the market, controlling deposits of approximately $118.9 million, representing 9.9 percent of market depos-its. BCH- PR is the fifth largest depository institution in the market, controlling deposits of approximately $88.7 mil-lion, representing 7.4 percent of market deposits. On con-summation of the proposal, Santander would become the third largest depository institution in the Mayaguez bank-ing market, controlling deposits of approximately $207.8 million, representing 17.3 percent of market deposits.
Ponce Ponce Metropolitan Statistical Area and the mu-nicipalities of Adjuntas, Arroyo, Coamo, Guanica, Guayama, Patillas, Salinas, and Santa Isabel.
Santander is the third largest depository institution in the market, controlling deposits of approximately $176.5 mil-lion, representing 11.4 percent of market deposits. BCH-PR is the ninth largest depository institution in the market, controlling deposits of approximately $35 million, repre-senting 2.3 percent of market deposits. On consummation of the proposal, Santander would remain the third largest depository institution in the Ponce banking market, control-ling deposits of approximately $211.5 million, representing 13.7 percent of market deposits.
San Juan San Juan-Caguas-Arecibo Consolidated Met-ropolitan Statistical Area and the municipalities of Aibo-nito, Barranquitas, Ciales, Jayuya, Lares, Maunabo, Oro-covis, Quebradillas, Utuado, and Vieques.
Santander is the second largest depository institution in the market, controlling deposits of approximately $2.7 billion, representing 14.3 percent of market deposits. BCH-PR is the fourth largest depository institution in the market, controlling deposits of approximately $1.5 billion,
representing 8.1 percent of market deposits. On consumma-tion of the proposal, Santander would remain the second largest depository institution in the San Juan banking mar-ket, controlling deposits of approximately $4.2 billion, representing 22.4 percent of market deposits.
Hibernia Corporation New Orleans, Louisiana
Order Approving the Merger of Bank Holding Companies
Hibernia Corporation, New Orleans ("Hibernia"), a bank holding company within the meaning of the Bank Holding Company Act ("BHC Act"), has requested the Board's approval under section 3 of the BHC Act (12 U.S.C. § 1842) to merge CM Bank Holding Company, Lake Charles ("CM Company") into Hibernia, and thereby indirectly acquire CM's subsidiary bank, Calcasieu Marine National Bank of Lake Charles, Lake Charles ("Calcasieu Bank"), all in Louisiana.1
Notice of the proposal, affording interested persons an opportunity to submit comments, has been published (61 Federal Register 29,101 (1996)). The time for filing comments has expired, and the Board has considered the proposal and all comments received in light of the factors set forth in section 3 of the BHC Act.
Hibernia, with total consolidated assets of approximately $7.5 billion, operates Hibernia Bank in Louisiana.2 Hiber-nia is the second largest commercial banking organization in Louisiana, controlling approximately $6.3 billion in deposits, representing approximately 17 percent of the total deposits in commercial banks in the state ("state depos-its").3 CM Company is the eighth largest commercial banking organization in Louisiana, controlling $624.6 mil-lion in deposits, representing approximately 1.7 percent of state deposits. On consummation of the proposal, Hibernia would become the largest commercial banking organiza-tion in Louisiana, controlling approximately $7.1 billion in deposits, representing approximately 19.3 percent of state deposits.4
Competitive Considerations
Section 3 of the BHC Act prohibits the Board from approv-ing an application if the proposal would result in a monop-oly, or would substantially lessen competition in any rele-vant market unless such anticompetitive effects are clearly
1. Calcasieu Bank would be merged with and into Hibernia Na-tional Bank, New Orleans, Louisiana ("Hibernia Bank") immediately after the merger of the parent holding companies. The Office of the Comptroller of the Currency ("OCC") has approved the merger of the banks under section 18(c) of the Federal Deposit Insurance Act (12 U.S.C. § 1828(c) (the "Bank Merger Act").
2. Total consolidated assets data are as of June 30, 1996. 3. Asset and state deposit data are as of March 31, 1996. 4. These data reflect the pending acquisition of St. Bernard Bank &
Trust Co., Arabi, Louisiana.
Digitized for FRASER http://fraser.stlouisfed.org/ Federal Reserve Bank of St. Louis

Legal Developments 839
outweighed in the public interest by the probable effects of the transaction in meeting the convenience and needs of the community to be served. Hibernia and CM Company do not compete in any banking market. In light of all the facts of record, the Board has concluded that consumma-tion of the proposal would not result in any significantly adverse effect on competition or the concentration of bank-ing resources in any relevant banking market.
Other Factors Under the BHC Act
The BHC Act also requires the Board to consider the financial and managerial resources and future prospects of the companies and banks involved, the convenience and needs of the community to be served, and certain other supervisory factors.
A. Supervisory Factors
The Board has carefully considered the financial and man-agerial resources and future prospects of Hibernia, CM Company, and their respective subsidiaries, as well as other supervisory factors, in light of all the facts of record. These facts include supervisory reports of examination assessing the financial and managerial resources of the organizations and confidential financial information pro-vided by Hibernia. The Board notes that Hibernia would not incur or assume any debt in connection with the pro-posal and would conform the loan and investment portfo-lios of Calcasieu Bank to Hibernia's lending and invest-ment policies. Based on these and all the facts of record, the Board concludes that all the supervisory factors under the BHC Act, including financial and managerial resources, weigh in favor of approving this proposal.
B. Convenience and Needs Factor
The Board has long held that consideration of the conve-nience and needs factor includes a review of the records of the relevant depository institutions under the Community Reinvestment Act (12 U.S.C. § 2901 et seq.) ("CRA"). As provided in the CRA, the Board has evaluated this factor in light of examinations by the primary federal supervisor of the CRA performance records of the relevant institutions.
The Board also has carefully considered the comments from the Plaisance Development Corporation ("Protes-tant") that maintain that Hibernia and its subsidiary bank, Hibernia Bank, have failed to meet the banking needs of all segments of the bank's delineated communities,5 particu-larly communities with predominately African-American
5. Hibernia's delineated communities include Greater New Orleans (Orleans, Jefferson, Lafourche, St. Tammany, St. Bernard, St. Charles, St. John the Baptist, Terrebone and Washington Parishes), South Central Louisiana (East Baton Rouge, Lafayette, Livingston, Ascen-sion, Vermillion, Iberia and St. Mary Parishes), Northeast Louisiana (Avoyelles, East Carroll, Morehouse, Madison, Ouachita, Rapides and West Carroll Parishes), and Northwest Louisiana (Caddo and Bossier Parishes).
residents, and to comply with fair lending laws.6 Protestant also contends that Hibernia Bank's 1992 and 1993 lending data reported under the Home Mortgage Disclosure Act (12 U.S.C. § 2801 et seq.) ("HMDA") indicate disparities in the rates of home-related loan applications from and loan originations to African Americans compared to those for nonminority residents, and contends that these data demonstrate that Hibernia Bank engages in illegal discrim-inatory practices.7
An institution's most recent CRA performance evalua-tion is a particularly important consideration in the applica-tions process because it represents a detailed on-site evalu-ation of the institution's overall record of performance under the CRA by its primary federal supervisor.8 In addi-tion, the Board considers an institution's policies and prac-tices for compliance with applicable fair lending laws. The Board also takes into account information on an institu-tion's lending activities that assist in meeting the credit needs of low- and moderate-income neighborhoods, in-cluding programs and activities initiated since its most recent CRA performance examination.
Performance Examinations. Hibernia Bank received a "satisfactory" rating from its primary federal supervisor, the OCC, at its most recent CRA performance examination as of August 10, 1995 ("1995 Examination"). Calcasieu Bank also received a "satisfactory" rating from the OCC at its most recent CRA performance examination as of January 9, 1995.
The 1995 Examination found no evidence of prohibited discrimination or any practices or procedures that discour-
6. Protestant alleges that Hibernia and Hibernia Bank have failed to: (1) Develop and implement CRA policies that assist African Americans; (2) Provide capital and financing to African-American homeown-ers; (3) Provide funds, grants, and loans to African-American com-munity organizations; (4) Provide capital to businesses owned by African Americans; (5) Participate in community development projects to improve economic opportunities in African-American communities; and (6) Locate branches in African-American communities.
7. Protestant believes that several factors contribute to the alleged failure to comply with fair lending laws, including the following:
(1) Delineation of service areas to exclude the African-American community; (2) Solicitation of real estate agents and developers serving predominately nonminority residential areas; (3) Employment of few African-American loan officers; (4) Use of a compensation program for lending officers that provides incentives to solicit and originate mortgages only on higher-priced homes; (5) Failure to use media and images oriented to the African-American community in advertising its loan products; and (6) Infrequent marketing of its Federal Housing Administration, Veterans Administration, and Small Business Administration loan products in the African-American community.
8. The Board notes that the Statement of the Federal Financial Supervisory Agencies Regarding the Community Reinvestment Act provides that a CRA examination is an important and often controlling factor in the consideration of an institution's CRA record and that these examinations will be given great weight in the applications process. 54 Federal Register 13,742, 13,745 (1989).
Digitized for FRASER http://fraser.stlouisfed.org/ Federal Reserve Bank of St. Louis

840 Federal Reserve Bulletin • September 1996
aged applications for available credit from any segment of Hibernia Bank's delineated communities. As part of the examination, OCC examiners conducted a fair lending review of home improvement loan files and found no evidence of illegal discrimination or other illegal credit practices.9 In addition, examiners noted that Hibernia Bank has in place written policies, audit and review procedures, and regularly scheduled training programs for all employ-ees to ensure compliance with fair lending laws and regula-tions. Hibernia Bank also has a second review process for all housing-related and small commercial loan applications that are recommended for denial to ensure that all relevant information has been considered and that there are no alternative means of extending credit to the applicant. Hibernia Bank recently established a pilot second review program for all consumer loan applications that are recom-mended for denial.
The OCC examiners found that the community delinea-tions of Hibernia Bank were reasonable and did not ex-clude any low- and moderate-income areas. Examiners also reported that the geographic distribution of Hibernia Bank's loan applications, approvals, and denials repre-sented a reasonable penetration of all segments of its delineated communities. The 1995 Examination stated that Hibernia Bank's efforts to ascertain credit needs and to solicit credit applications from all segments of its commu-nity had been effective.10 In addition, Hibernia Bank's branch network, with 25 percent of the bank's branches located in low- and moderate income ares, were considered to be reasonably accessible to all segments of its delineated community.
Lending activities. Examiners noted that Hibernia Bank participated in a variety of housing-related and other lend-ing programs that assist in meeting the credit needs of all its communities, including areas with low- and moderate-income and predominately minority residents. For exam-ple, Hibernia Bank initiated its Affordable Home Program in May 1995 to assist low- and moderate-income families to purchase their first homes in all of its delineated commu-nities by offering flexible underwriting criteria and below market interest rates.11 As of May 31, 1996, the program originated approximately 630 loans totalling approximately $38 million. The bank also made a number of loans through the Federal Housing Administration ("FHA"), Veterans
9. Examiners previously conducted a fair lending examination of Hibernia Bank's residential mortgage loan applications as part of the bank's 1993 CRA performance examination and found no evidence of illegal discrimination.
10. The 1995 Examination noted that Hibernia's marketing efforts included advertising in newspapers and on radio stations that focused on communities with predominately low- and moderate-income and minority residents. Hibernia's advertising campaigns also have used minority models.
11. In connection with the program, Hibernia worked closely with several non-profit housing organizations that offer homebuyer training and education programs for low- to moderate-income residents, in-cluding the New Orleans Neighborhood Development Foundation, Alexandria Budget Management Services, Monroe Homeownership, Inc., and St. Tammany Community Housing Resource Board.
Administration ("VA"), and Farmers Home Administra-tion ("FmHA") loan programs. In 1995, Hibernia origi-nated 599 FHA, VA, and FmHA loans, totalling more than $37 million, including 157 loans totalling $8.5 million to African-American borrowers.
The 1995 Examination also discussed two affordable housing programs in the New Orleans area. In January 1995, Hibernia Bank initiated a Community Lending Pro-gram ("CLP"), which uses flexible underwriting standards in evaluating consumer loan applications from low- and moderate-income applicants, as a pilot lending program in the Greater New Orleans area. As of May 31, 1996, Hiber-nia had originated through the program 2,882 loans total-ling approximately $17.6 million. In addition, Hibernia Bank participated in the East Baton Rouge Mortgage Fi-nance Authority ("EBRMFA"), which provides funding to low- and moderate-income home buyers. Hibernia Bank serves as the master servicer and lead lender in the EBRMFA bond program for low- and moderate-income, first-time home buyers. Hibernia Bank was a participant in a $21 million bond issue for home mortgages through EBRMFA and, as of June 30, 1995, Hibernia Bank funded through this program 71 loans totalling $3.5 million.
Hibernia Bank created the Small Business Banking Divi-sion in 1992 to enhance its services to small businesses, and OCC examiners noted a number of Hibernia Bank's small business lending activities. For example, Hibernia Bank made 68 Small Business Administration ("SBA") loans totalling $8.7 million, in 1994, and in the first two quarters of 1995, Hibernia Bank made 32 SBA loans totalling more than $5 million. Hibernia also participates in the Lafayette Capital Certified Development Company ("LCCDC"), which makes direct loans to businesses un-der the SBA 504 program. Since April 1993, Hibernia has made over $5 million in loans through this program in the Acadiana region of Louisiana. Hibernia also is involved with the Regional Loan Corporation ("RLC"), a non-profit, government-sponsored organization offering small business loans to stimulate the economy and create jobs. Hibernia has made several small business loans through this program under the SBA 504 Loan Program. By May 31, 1996, Hibernia had made 10 loans under the program, totaling $1.4 million. Hibernia has established programs to facilitate lending to small businesses, and has invested in loan pools for economic development corpora-tions and foundations in each of its designated regions. As of June 1996, loans closed through these economic devel-opment corporations and foundations were approximately $8 million.
Hibernia Bank also actively participated in programs that focus on lending to businesses owned by minorities and businesses in low- and moderate-income areas.12 Hi-
12. Hibernia supports a number of organizations that provide train-ing, educational seminars and technical expertise to small businesses, including businesses owned by minorities. Hibernia participates in the Economic Freedom Association, New Orleans Minority Business Development Center, Northwestern State University Small Business
Digitized for FRASER http://fraser.stlouisfed.org/ Federal Reserve Bank of St. Louis

Legal Developments 841
bernia Bank invested $300,000 in the Gulf Coast Business and Industry Development Corporation ("Gulf Coast"), a minority-owned and operated company that provides mez-zanine financing to existing small businesses, including minority-owned businesses. By June 24, 1996, Gulf Coast had funded nine loans for approximately $1.2 million.
OCC examiners also noted that Hibernia Bank supported a variety of community development organizations. Hiber-nia Bank donated more than $100,000 to the New Orleans and Baton Rouge offices of the Local Initiatives Support Corporation ("LISC"), a national non-profit organization that assists in organizing community development compa-nies to redevelop low- and moderate-income neighbor-hoods.13 Hibernia also provided funding and other support to the Holy Cross CDC, Creole Cottage Coalition, and the Highland Area Partnership to finance the renovation of homes located in low- and moderate-income communities, and to the Baton Rouge Mid City Fix-Up and the ShreveCorp, two community organizations that focus on neighborhood clean-up, renovation and beautification projects.
The Board has carefully reviewed HMDA data covering the period 1993 through 1995 in light of Protestant's contentions that Hibernia illegally discriminates on the basis of race. These data show that, as a percentage of total applications, Hibernia's applications from African-American applicants, from minority census tracts, and from low- to moderate-income areas, has increased over the 1993-1995 period. In 1995, Hibernia's percentage of total applications from minority census tracts and from low- to moderate-income tracts approximated that of the aggregate of other lenders. In other respects, however, the data show disparities in the denial rates to minority loan applicants as compared to nonminority applicants.
The Board is concerned when the record of an institution indicates disparities in lending to minority applicants, and believes that all banks are obligated to ensure that their lending practices are based on criteria that assure not only safe and sound lending, but also assure equal access to credit by creditworthy applicants, regardless of race. The Board recognizes, however, that HMDA data alone provide an incomplete measure of an institution's lending in its community because these data cover only a few categories of housing-related lending and provide limited information about the covered loans.14 HMDA data therefore have limitations that make the data an inadequate basis, absent other information, for concluding that an institution has engaged in illegal lending discrimination. Because of the
Development Center, Central Louisiana Business League, and several chambers of commerce.
13. Hibernia has provided funding and other assistance to several of the community development corporations that have received LISC's support. As of June 24, 1996, Hibernia had made ten loans through LISC.
14. For example, these data do not provide a basis for an indepen-dent assessment of whether an applicant who was denied credit was in fact creditworthy. Thus, credit history problems and excessive debt levels relative to income—reasons most frequently cited for credit denial—are not available from the HMDA data.
limitations of HMDA data, the Board has carefully re-viewed other information, particularly examination reports that provide an on-site evaluation of compliance by Hiber-nia with fair lending laws as discussed above.
Conclusion on Convenience and Needs Factor
The Board has carefully reviewed the relevant CRA exam-ination information, the programs implemented by the rele-vant institutions, the policies in place to ensure fair lend-ing, relevant HMDA and other lending data, comments and concerns raised by Protestants, and other facts of record in its consideration of the effect of this transaction on the convenience and needs of the community. Based on this review, and for the reasons discussed above, the Board concludes that convenience and needs considerations, in-cluding Hibernia's record of performance and its plans for operating Calcasieu Bank, are consistent with approval of the application.
Conclusion
Based on the foregoing and all the other facts of record, the Board has determined that the application should be, and hereby is, approved.15 The Board's approval is expressly conditioned on Hibernia's compliance with all the commit-ments made in connection with this application. For pur-poses of this action, these commitments and conditions in this order shall be deemed to be conditions imposed in writing by the Board in connection with its findings and decision, and, as such, may be enforced in proceedings under applicable law.
This transaction shall not be consummated before the fifteenth calendar day following the effective date of this order, or later than three months after the effective date of this order, unless such period is extended for good cause by the Board or by the Federal Reserve Bank of Atlanta, acting pursuant to delegated authority.
15. Protestant believes that Hibernia's record of employing African-American loan officers and originators is insufficient. Because Hiber-nia employs more than 50 people, serves as a depository of govern-ment funds, and acts as agent in selling or redeeming U.S. savings bonds and notes, it is required by Department of Labor regulations to:
(1) File annual reports with the Equal Employment Opportunity Commission ("EEOC"); and (2) Have in place a written affirmative action compliance program which states its efforts and plans to achieve equal opportunity in the employment, hiring, promotion, and separation of personnel. See 41 C.F.R. 60-1.7(a), 60-1.40. The EEOC has jurisdiction to investigate and determine whether
companies are in compliance with federal equal employment laws. The Board has noted that unsubstantiated allegations of improper actions under a statute administered by another federal agency are beyond the scope of the Board's review under the factors specified in the BHC Act. On the other hand, substantiated improper actions may be considered by the Board in light of all the facts of record of an application under the factors in the BHC Act or in the context of the Board's general supervisory authority over bank holding companies. See Norwest Corporation, 82 Federal Reserve Bulletin 580, 582 (1996).
Digitized for FRASER http://fraser.stlouisfed.org/ Federal Reserve Bank of St. Louis

842 Federal Reserve Bulletin • September 1996
By order of the Board of Governors, effective July 31, 1996.
Voting for this action: Chairman Greenspan, Vice Chair Rivlin, and Governors Kelley, Lindsey, Phillips, Yellen, and Meyer.
JENNIFER J . J O H N S O N Deputy Secretary of the Board
Hibernia Corporation New Orleans, Louisiana
Order Approving the Acquisition of a Bank
Hibernia Corporation, New Orleans ("Hibernia"), a bank holding company within the meaning of the Bank Holding Company Act ("BHC Act"), has requested the Board's approval under section 3 of the BHC Act (12 U.S.C. § 1842) to acquire St. Bernard Bank & Trust Co., Arabi ("St. Bernard Bank"), both in Louisiana.1
Notice of this proposal, affording interested persons an opportunity to submit comments, has been published (61 Federal Register 29,101 (1996)). The time for filing comments has expired, and the Board has considered the proposal and all comments received in light of the factors set forth in section 3 of the BHC Act.
Hibernia, with total consolidated assets of approximately $7.5 billion, operates Hibernia Bank in Louisiana.2 Hiber-nia is the second largest commercial banking organization in Louisiana, controlling approximately $6.3 billion in deposits, representing approximately 17 percent of the total deposits in commercial banks in the state ("state depos-its").3 St. Bernard Bank is the 15th largest commercial banking organization in Louisiana, controlling $231.7 mil-lion in deposits, representing less than one percent of state deposits. On consummation of the proposal, Hibernia would become the largest commercial banking organiza-tion in Louisiana, controlling $7.1 billion in deposits, rep-resenting approximately 19.3 percent of state deposits.4
Hibernia Bank and St. Bernard Bank each operate offices in the New Orleans banking market.5 On consummation of this proposal, Hibernia Bank would remain the second largest commercial bank or thrift ("depository institution")
1. Hibernia would merge St. Bernard Bank, a state member bank, with and into a wholly owned interim state chartered bank. Immedi-ately after this merger, St. Bernard Bank would merge with and into Hibernia National Bank, New Orleans, Louisiana ("Hibernia Bank"). The Office of the Comptroller of the Currency ("OCC"), has ap-proved the merger of St. Bernard Bank and Hibernia Bank under section 18(c) of the Federal Deposit Insurance Act (12 U.S.C. § 1828(c)) (the "Bank Merger Act"). In light of all the facts of record, the Board believes that no regulatory purpose would be served by requiring an application under the Bank Merger Act for the interim merger.
2. Total consolidated assets data are as of June 30, 1996. 3. Asset and state deposit data are as of March 31, 1996. 4. These data reflect the pending acquisition of CM Bank Holding
Company, Lake Charles, Louisiana. 5. The New Orleans banking market is comprised of Jefferson,
Orleans, Plaquemines, St. Bernard, St. Charles, St. John the Baptist, and St. Tammany Parishes, all in Louisiana.
in the New Orleans banking market, controlling market deposits of approximately $3.1 billion, representing ap-proximately 24.2 percent of total deposits in depository institutions in the market ("market deposits").6 The market would remain moderately concentrated, as measured by the Herfindahl-Hirschman Index ("HHI"),7 and numerous competitors would remain in this market. Based on all the facts of record, the Board concludes that consummation of this proposal would not result in any significantly adverse effect on competition or concentration of banking re-sources in the New Orleans or any other relevant banking market.
The Board has carefully considered the financial and managerial resources and future prospects of Hibernia and St. Bernard Bank as well as other supervisory factors in light of all the facts of record. These facts include supervi-sory reports of examination assessing the financial and managerial resources of the organizations and confidential financial information provided by Hibernia. The Board notes that Hibernia would not incur or assume any debt in connection with the proposal and would conform the loan and investment portfolios of St. Bernard Bank with Hiber-nia's lending and investment policies. Based on these and all the facts of record, the Board concludes that all the supervisory factors under the BHC Act, including financial and managerial resources, weigh in favor of approving this proposal. The Board also concludes that considerations relating to the convenience and needs of the community to be served, are also consistent with approval.8
6. Market data are as of June 30, 1995. Market share data are based on calculations in which the deposits of thrift institutions are included at 50 percent. The Board previously has indicated that thrift institu-tions have become, or have the potential to become, significant competitors of commercial banks. See Midwest Financial Group, 75 Federal Reserve Bulletin 386 (1989); National City Corporation, 70 Federal Reserve Bulletin 743 (1984). Thus, the Board has regularly included thrift deposits in the calculation of market share on a 50-percent weighted basis. See, e.g., First Hawaiian, Inc., 77 Federal Reserve Bulletin 52 (1991).
7. The HHI would increase by 81 points to 1783. Under the revised Department of Justice Merger Guidelines (49 Federal Register 26,823 (June 29, 1984)), a market in which the post-merger HHI is between 1000 and 1800 is considered to be moderately concentrated. The Justice Department has informed the Board that a bank merger or acquisition generally will not be challenged (in the absence of other factors indicating anti-competitive effects) unless the post-merger HHI is at least 1800 and the merger increases the HHI by 200 points. The Justice Department has stated that the higher than normal HHI thresholds for screening bank mergers for anti-competitive effects implicitly recognize the competitive effects of limited-purpose lenders and other non-depository financial entities.
8. The Board received comments from the Plaisance Development Corporation criticizing Hibernia's record of performance under the Community Reinvestment Act and fair lending laws. These comments are identical to the comments considered by the Board in Hibernia's application to acquire CM Bank Holding Company ("CM Compa-ny"), and thereby indirectly acquire Calcasieu Marine National Bank of Lake Charles, both in Lake Charles, Louisiana. In light of all the facts of record, and for the reasons stated in the Board's order approving the CM Company acquisition dated today, which are incor-porated herein by reference, the Board concludes that all the factors required to be considered under the BHC Act are consistent with approving the St. Bernard Bank acquisition.
Digitized for FRASER http://fraser.stlouisfed.org/ Federal Reserve Bank of St. Louis

Legal Developments 843
Based on the foregoing and all the other facts of record, the Board has determined that the application should be, and hereby is, approved. The Board's approval is expressly conditioned on Hibernia's compliance with all the commit-ments made in connection with this application. For pur-poses of this action, these commitments and the conditions in this order shall be deemed to be conditions imposed in writing by the Board in connection with its findings and decision, and, as such, may be enforced in proceedings under applicable law.
This transaction shall not be consummated before the fifteenth calendar day following the effective date of this order, or later than three months after the effective date of this order, unless such period is extended for good cause by the Board or by the Federal Reserve Bank of Atlanta, acting pursuant to delegated authority.
By order of the Board of Governors, effective July 31, 1996.
Voting for this action: Chairman Greenspan, Vice Chair Rivlin, and Governors Kelley, Lindsey, Phillips, Yellen, and Meyer.
JENNIFER J . J O H N S O N Deputy Secretary of the Board
NVE Bancorp, MHC Englewood, New Jersey
NVE Bancorp, Inc. Englewood, New Jersey
Order Approving the Formation of Bank Holding Companies
NVE Bancorp, MHC ("MHC"), and its wholly owned subsidiary NVE Bancorp, Inc. ("Bancorp") have requested the Board's approval under section 3 of the BHC Act (12 U.S.C. § 1842) to become bank holding companies by acquiring all the voting shares of NVE Savings Bank ("NVE Bank"),1 all of Englewood, New Jersey.
Notice of this proposal, affording interested persons an opportunity to submit comments, has been published (61 Federal Register 17,703 (1996)). The time for filing comments has expired, and the Board has considered the proposal and all comments received in light of the factors set forth in section 3 of the BHC Act.
MHC is a company organized in mutual form, and it would become a bank holding company by acquiring all the voting shares of Bancorp, which in turn would acquire all the voting shares of NVE Bank. NVE Bank is the 54th largest depository institution in New Jersey, controlling approximately $339.2 million in deposits, representing less than 1 percent of all deposits in depository institutions in
1. NVE Bank currently operates as a mutual savings bank, and has applied to the Federal Deposit Insurance Corporation ("FDIC") to convert to a stock savings bank.
the state.2 Based on all the facts of record, the Board concludes that consummation of this proposal would not have a significantly adverse effect on competition or on the concentration of banking resources in any relevant banking market, and that competitive considerations are consistent with approval.
In every application under section 3 of the BHC Act, the Board is required to consider the financial and managerial resources and future prospects of the companies and banks concerned, and the convenience and needs of the communi-ties to be served. The Board previously has noted that ownership of stock in a converted mutual bank by a mutual bank holding company and minority shareholders could raise significant issues under the managerial and conve-nience and needs factors in the BHC Act, if this structure was used to transfer economic value from the mutual holding company to the minority shareholders.3 Although there are no minority shareholders in this proposal and applicants have no current plans to issue additional shares in Bancorp or NVE Bank, stock issuances are contem-plated for the future. Under the proposed structure, there-fore, the potential exists that shares owned by minority shareholders could raise the same concerns as those identi-fied in Northwest.
In order to address those concerns, MHC and Bancorp have made a number of commitments,4 including the fol-lowing:
(1) MHC and Bancorp will obtain prior Board approval for the issuance of securities by Bancorp or NVE Bank to third parties and for the conversion of MHC from mutual to stock form; and (2) In any subsequent transfer or issuance of shares to shareholders other than MHC, the depositors of NVE Bank will be accorded the same share purchase priorities as if MHC were a mutual savings bank converting to stock form.
These constraints would give the Board the opportunity to review any future conversion or issuance of securities in light of the concerns discussed above. Accordingly, based
2. All banking data are as of June 30, 1995. In this context, depository institutions include commercial banks, savings banks, and savings and loan associations.
3. See Northwest Bancorp, MHC, 80 Federal Reserve Bulletin 1131 (1994) {"Northwest"). In Northwest, the Board concluded that a waiver of dividends by the mutual holding company shareholder could have the effect of transferring economic value from the mutual holding company to the minority shareholders and depriving the holding company of resources necessary to serve as a source of strength for the bank. The decision to waive the dividends would be made by the trustees of the mutual holding company, who were also minority shareholders of the bank, and the decision would not be reviewable by the mutual owners of the holding company. The Board, therefore, viewed this potential conflict of interest as raising adverse considerations under the factors in the BHC Act. The Board relied on a number of commitments to address these issues, including commit-ments to ensure that any dividends waived by the mutual holding company would be retained by the bank and would not inure to the benefit of the bank's minority shareholders.
4. The commitments are listed in the Appendix.
Digitized for FRASER http://fraser.stlouisfed.org/ Federal Reserve Bank of St. Louis

844 Federal Reserve Bulletin • September 1996
on all the facts of record, including commitments made by MHC and Bancorp, the Board concludes that the financial and managerial resources and future prospects of MHC, Bancorp, and NVE Bank, and other supervisory factors the Board must consider under section 3 of the BHC Act, are consistent with approval, as are considerations relating to the convenience and needs of the communities to be served.
Based on the foregoing and other facts of record, the Board has determined that the applications should be, and hereby are, approved. The Board's approval of this pro-posal is expressly conditioned on compliance with all the commitments made by Applicants in connection with these applications, and is conditioned on receipt by Applicants and NVE Bank of all necessary approvals from all relevant regulators, and compliance with the requirements imposed by those regulators. For purposes of this action, the com-mitments and conditions relied on by the Board in reaching this decision are deemed to be conditions imposed in writing and, as such, may be enforced in proceedings under applicable law.
This proposal shall not be consummated before the thir-tieth calendar day after the effective date of this order or later than three months after the effective date of this order, unless such period is extended for good cause by the Board or by the Federal Reserve Bank of New York, acting pursuant to delegated authority.
By order of the Board of Governors, effective July 15, 1996.
Voting for this action: Chairman Greenspan, Vice Chair Rivlin, and Governors Kelley, Lindsey, Yellen, and Meyer. Absent and not voting: Governor Phillips.
JENNIFER J. JOHNSON Deputy Secretary of the Board
Appendix
(1) After the reorganization, the NVE Bancorp MHC ("MHC") will not sell, transfer, or otherwise dispose of any of its shares in NVE Bancorp, Inc., ("Bancorp") or NVE Savings Bank ("Bank") (together "Applicant") to any person (including Employee Stock Ownership Plan) and Bancorp will not sell, transfer or otherwise dispose of any of its shares of Bank without the prior approval of the Board of Governors of the Federal Reserve System (the "Board"). If, subsequent to the reorganization, Bancorp or Bank issues equity securities or any securities that would accord the holder the right to acquire equity securities or that would bestow upon the holder an interest in the retained earnings of the issuer to persons other than MHC, MHC and Bancorp will make prior application to the Board for approval for the issuance of the securities. (2) In any conversion of the MHC from mutual to stock form, the holding company will file an application for approval of the conversion with the Board (to the extent the mutual holding company is a bank holding company).
(3) In connection with Commitments 1 and 2, Applicant agrees with the following:
(A) In any sale, transfer or issuance of shares of Bank or Bancorp to any person other than the MHC, the deposi-tors of Bank will be accorded the same stock purchase priorities given to depositors of a mutual savings associ-ation in connection with such association converting to stock form. In making such sale, or transferring or issuing such shares, Applicants and their management will comply with any fiduciary duty they owe. (B) The Board will take into account the extent to which the proposed transactions conform with the provisions and purpose of the regulations of the Office of Thrift Supervision ("OTS") (12 C.F.R. Part 563b and 575) and the Federal Deposit Insurance Corporation ("FDIC") (12 C.F.R. 303.15 and 333.4), as currently in effect at the time the Board reviews the required materials related to the proposed transactions. Any nonconformity with those provisions will be closely scrutinized. Conformity with the OTS and FDIC requirements, however, will not be sufficient for Board regulatory purposes if the Board determines that the proposed transaction would pose a risk to the institution's safety and soundness, violate any law or regulation or present a breach of fiduciary duty.
Perryton Bancshares, Inc. Perryton, Texas
Order Approving Formation of a Bank Holding Company
Perryton Bancshares, Inc., ("Perryton"), has requested the Board's approval under section 3 of the Bank Holding Company Act ("BHC Act") to become a bank holding company by acquiring all the voting shares of Perryton National Bank, both in Perryton, Texas ("Bank").1
Notice of the proposal, affording interested persons an opportunity to submit comments, has been published (61 Federal Register 21,113 (1996)). The time for filing comments has expired, and the Board has considered the application and all comments received in light of the factors set forth in section 3 of the BHC Act.
Perryton is a nonoperating corporation formed for the purpose of acquiring Bank. Bank is the 417th largest commercial banking organization in Texas, controlling de-posits of approximately $41.5 million, representing less than 1 percent of total deposits in commercial banking
1. Perryton proposes to acquire Bank by chartering a wholly owned interim national bank ("Interim Bank") and merging Bank with and into Interim Bank with Interim Bank surviving under the title of Perryton National Bank. On June 12, 1996, the Office of the Comptrol-ler of the Currency ("OCC") approved the merger of Bank and Interim Bank under the provisions of section 18(c) of the Federal Deposit Insurance Act (the "Bank Merger Act", 12 U.S.C. § 1828(c)). On consummation of the merger and conversion of shares, Perryton would own all the voting stock of Interim Bank. Bank shareholders would be entitled to receive cash or to tender their Bank stock in exchange for the number of Perryton shares set forth in the merger agreement. Untendered Bank stock would represent evidence of the shareholder's ownership of Perryton shares.
Digitized for FRASER http://fraser.stlouisfed.org/ Federal Reserve Bank of St. Louis

Legal Developments 845
organizations in the state.2 In this light, the Board concludes that consummation of the proposal would not have a signifi-cantly adverse effect on competition or on the concentration of banking resources in any relevant banking market and that competitive considerations are consistent with approval.
The Board has also considered the other factors set forth in the BHC Act in light of all the facts of record, including the reasonableness of the financial projections for satisfy-ing the debt to be acquired by Perryton, and the reports of examination by Bank's primary federal supervisor, the OCC, that assess the financial and managerial resources of Bank and its record of performance under the Community Reinvestment Act. Based on all these facts, the Board concludes that the financial and managerial resources and future prospects of Perryton and Bank are consistent with approval, as are convenience and needs considerations and other supervisory factors that the Board is required to consider under section 3 of the BHC Act.3
Based on the foregoing and all the other facts of record, the Board has determined that the application should be, and hereby is, approved.4 The Board's approval is ex-
2. All banking data are as of June 30, 1995. 3. The Board has carefully reviewed comments received from a
minority shareholder and director of Bank ("Commenter") maintain-ing that there are no valid reasons for forming a bank holding company and that he should be permitted to retain his Bank stock. Commenter also contends that the proposal would adversely affect his personal finances. Applicant asserts that a bank holding company provides tax advantages to shareholders and operational flexibility to engage in nonbanking activities. Bank's shareholders must approve the formation of the bank holding company and, as noted, the merger transaction approved by the OCC over the objections of Commenter would convert Commenter's Bank stock into a right to receive Perry-ton stock. Commenter may also exercise dissenting shareholder rights under the procedures provided in the National Bank Act if he believes that the consideration offered for his Bank stock (cash or Perryton shares) is unreasonable. See 12 U.S.C. §§ 215 and 215a. The Board, moreover, is limited to considering specific statutory factors in review-ing applications under section 3 of the BHC Act, and courts have determined that the Board does not have the authority to consider share pricing and similar matters unless they directly relate to a factor specified in the BHC Act. See Western Bancshares, Inc. v. Board of Governors, 480 F.2d 749 (10th Cir. 1973). In light of all the facts of record, and for the reasons discussed above, the Board concludes that these factors are consistent with approval.
4. Commenter has requested the opportunity to speak if a public meeting or hearing is held in connection with the application. Sec-tion 3(b) of the BHC Act does not require the Board to hold a public meeting or hearing unless the appropriate supervisory authority for the bank to be acquired makes a timely written recommendation of denial of the application. As noted, the OCC has approved the merger of the national banks involved in the transaction. The Board may also, in its discretion, hold a public meeting or hearing on an application under its Rules of Procedure to clarify factual issues related to the applica-tion and to provide an opportunity for testimony, if appropriate. 12 C.F.R. 262.3(e) and 262.25(d). The Board notes that Commenter has had ample opportunity to submit his views and has, in fact, submitted comments that have been carefully considered by the Board. The record fails to demonstrate why Commenter's written submis-sions do not adequately present his allegations or why a public meeting or hearing is otherwise warranted in this case. After a careful review of all the facts of record, the Board concludes that a public meeting or hearing is not necessary to clarify the factual record in the application and is not otherwise warranted in this case.
pressly conditioned on compliance with all the commit-ments made by Perryton in connection with the proposal. The commitments and conditions relied on by the Board in reaching this decision are deemed to be conditions im-posed in writing by the Board in connection with its findings and decision, and, as such, may be enforced in proceedings under applicable law.
The transaction shall not be consummated before the fifteenth calendar day following the effective date of this order, or later than three months after the effective date of this order, unless such period is extended for good cause by the Board or by the Federal Reserve Bank of Dallas, acting pursuant to delegated authority.
By order of the Board of Governors, effective July 22, 1996.
Voting for this action: Chairman Greenspan, Vice Chair Rivlin, and Governors Lindsey, Yellen, and Meyer. Absent and not voting: Gover-nors Kelley and Phillips.
JENNIFER J. JOHNSON Deputy Secretary of the Board
Texas Financial Bancorporation, Inc. Minneapolis, Minnesota
First Bancorp, Inc. Denton, Texas
First Delaware Bancorp, Inc. Dover, Delaware
Order Approving the Acquisition of a Bank
Texas Financial Bancorporation, Inc., Minneapolis, Minne-sota ("Bancorporation"), and its subsidiaries, First Ban-corp, Inc., Denton, Texas ("Texas Company"), and First Delaware Bancorp Inc., Dover, Delaware ("Delaware Ban-corp") (collectively, "Applicants"), bank holding compa-nies within the meaning of the Bank Holding Company Act ("BHC Act"), have requested the Board's approval under section 3 of the BHC Act (12 U.S.C. § 1842) to acquire all the voting shares of Riverside National Bank, Grand Prairie, Texas ("Riverside Bank").1
Notice of the proposal, affording interested persons an opportunity to submit comments, has been published (61 Federal Register 18,731 (1996)). The time for filing comments has expired, and the Board has considered the
1. Bancorporation owns 87.8 percent of the voting shares of Texas Company which owns all of the voting shares of Delaware Bancorp. Texas Company would acquire all the voting shares of Riverside Bank and then contribute the bank's stock to Delaware Bancorp. After consummation of these transactions, Riverside Bank would merge with and into First State Bank of Denton, Denton, Texas ("Denton Bank"), a wholly owned subsidiary of Applicants. The merger is subject to the approval of the Federal Deposit Insurance Corporation ("FDIC") under section 18(c) of the Federal Deposit Insurance Act (the "Bank Merger Act", 12 U.S.C. § 1828(c)).
Digitized for FRASER http://fraser.stlouisfed.org/ Federal Reserve Bank of St. Louis
846 Federal Reserve Bulletin • September 1996
proposal and all comments received in light of the factors set forth in section 3 of the BHC Act.
Applicants, with total consolidated assets of $1.3 billion, operate subsidiary banks in Illinois and Texas.2 Applicants are the 23d largest commercial banking organization in Texas, controlling approximately $952 million in deposits, representing less than 1 percent of all deposits in commer-cial banking organizations in the state ("state deposits").3
Riverside Bank is the 468th largest commercial banking organization in Texas, controlling approximately $40 mil-lion in deposits. After consummation of the proposal, Ap-plicants would remain the 23d largest commercial banking organization in Texas, controlling approximately $993 mil-lion in deposits, representing less than 1 percent of state deposits.
Considerations under the BHC Act
Applicants and Riverside Bank compete in the Dallas, Texas, banking market ("Dallas banking market").4 On consummation of the proposal, Applicants would operate the 12th largest commercial banking organization in the Dallas banking market, controlling deposits of approxi-mately $644.6 million, representing 2.1 percent of total deposits in depository institutions in the market.5 The market would remain moderately concentrated, as mea-sured by the Herfindahl-Hirschman Index ("HHI"),6 and numerous competitors would remain in the market. Based on all the facts of record, the Board concludes that consum-mation of the proposal would not result in any significantly
2. Asset data are as of March 31, 1996. 3. State deposit data are as of June 30, 1995. Data has been updated
for structural changes in commercial banking organizations that have occurred through May 15, 1996.
4. The Dallas banking market is approximated by McKinney and Piano in Collin County, Denton and Lewisville in Denton County, the northern half of Rockwall County, the communities of Forney and Terrel in Kaufman County, Midlothian, Waxahachie, and Ferris in Ellis County, and Grapevine and Arlington in Tarrant County, all in Texas.
5. Market data are as of June 30, 1995. Market share data are based on calculations in which the deposits of thrift institutions are included at 50 percent. The Board previously has indicated that thrift institu-tions have become, or have the potential to become, significant competitors of commercial banks. See Midwest Financial Group, 75 Federal Reserve Bulletin 386 (1989); National City Corporation, 70 Federal Reserve Bulletin 743 (1984). Thus, the Board has regularly included thrift deposits in the calculation of market share on a 50-percent weighted basis. See, e.g., First Hawaiian, Inc., 77 Federal Reserve Bulletin 52 (1991).
6. On consummation of this proposal, the HHI would remain unchanged at 1330 points. Under the revised Department of Justice Merger Guidelines, 49 Federal Register 26,823 (June 29, 1984), a market in which the post-merger HHI is between 1000 and 1800 is considered moderately concentrated. The Justice Department has in-formed the Board that a bank merger or acquisition generally will not be challenged (in the absence of other factors indicating anticompeti-tive effects) unless the post-merger HHI is at least 1800 and the merger increases the HHI by more than 200 points. The Justice Department has stated that the higher than normal threshold for an increase in the HHI when screening bank mergers and acquisitions for anticompetitive effects implicitly recognizes the competitive effects of limited-purpose lenders and other non-depository financial entities.
adverse effects on competition or concentration of banking resources in the Dallas banking market or any other rele-vant banking market.
The Board has carefully considered the financial and managerial resources and future prospects of Applicants, Riverside Bank, and their respective subsidiaries, and other supervisory factors in light of all the facts of record. These facts include supervisory reports of examination assessing the financial and managerial resources of the organizations. Based on these and all other facts of record, the Board concludes that all the supervisory factors under the BHC Act, including financial and managerial resources and fu-ture prospects of the institutions involved, weigh in favor of approving this proposal.
The Board has long held that consideration of the conve-nience and needs factor includes a review of the records of the relevant depository institutions in assisting to meet the credit needs of all the communities served by an institu-tion, including low- and moderate-income communities, under the Community Reinvestment Act (12 U.S.C. § 2901 et seq.) ("CRA"). As provided in the CRA, the Board has evaluated the convenience and needs factor in light of examinations by the primary federal supervisor of the CRA performance records of the relevant institutions.
The Board also has carefully reviewed this factor in light of comments from the African American Council for Em-powerment ("Protestant") which contends that Riverside Bank has not adequately assisted in meeting the housing-related and small business credit needs of the Dalworth community in Grand Prairie, Texas.7 As noted, Riverside Bank would be merged with and into Denton Bank, Appli-cants' lead subsidiary bank in Texas, and Applicants have committed to implement the CRA-related policies, proce-dures, and programs of Denton Bank in the communities now served by Riverside Bank, including the Dalworth community. The Board has carefully considered Denton Bank's record of performance under the CRA in this light.
An institution's most recent CRA performance evalua-tion is a particularly important consideration in the applica-tions process because it represents a detailed on-site evalu-ation of the institution's overall record of performance under the CRA by its primary federal supervisor.8 Denton Bank, which comprises approximately 40 percent of Ban-corporation's consolidated assets, received an "outstand-ing" rating from the Federal Deposit Insurance Corpora-tion ("FDIC") in its most recent evaluation for CRA performance in 1994 ("Denton Examination").9 The Den-
7. Dalworth is a low- and moderate-income community with a predominately minority population that encompasses parts of Dallas County census tract 161.00 and Tarrant County census tract 1130.02.
8. The Board notes that the Statement of the Federal Financial Supervisory Agencies Regarding the Community Reinvestment Act provides that a CRA examination is an important and often controlling factor in the consideration of an institution's CRA record and that reports of these examinations will be given great weight in the applications process. 54 Federal Register 13,742, 13,745 (1989).
9. Bancorporation's other subsidiary banks all received a CRA performance rating of "satisfactory" or "outstanding" in their most recent examinations by their primary federal supervisor.
Digitized for FRASER http://fraser.stlouisfed.org/ Federal Reserve Bank of St. Louis

Legal Developments 847
ton Examination found that the Bank's delineated commu-nity is reasonable and did not exclude any low- and moderate-income areas. The geographic distribution of Denton Bank's credit extensions, applications, and denials also were found to be reasonable. Examiners noted that senior management of the bank maintained ongoing con-tact with community leaders and government officials and used written surveys to ascertain the credit needs of the community. According to the examination, the bank's strong marketing program which utilized publications that reach all areas of the community, including African-American and low- and moderate-income residents, indi-cated that Denton Bank affirmatively solicits applications from all segments of its community.
A fair lending review conducted in connection with the Denton Examination did not reveal any evidence of dis-criminatory or other illegal credit practices. Denton Bank has developed policies and procedures to prevent illegal discrimination, and examiners noted that Denton Bank had audit and review procedures to ensure compliance with anti-discrimination laws and regulations. The examiners noted that the bank also conducted a second review of all credit denials.
After consummation of the merger with Riverside Bank, Denton Bank will ascertain the credit needs of the bank's new communities with the assistance of the Denton Bank Community Reinvestment Act Advisory Board, and will expand the lending programs currently offered by River-side Bank. For example, Denton Bank will initiate the following lending programs to assist low- and moderate-income borrowers:
(1) Urban Homesteading Program, which offers home improvement loans to eligible low- and moderate-income residents; (2) Federal National Mortgage Association's Commu-nity Homebuyer's Program, which offers alternative un-derwriting standards for eligible applicants; and (3) Homebuyer Assistance Program, which lends money to eligible low- and moderate-income, first-time home buyers who have received municipal government assis-tance to pay the down payment and closing costs to purchase a home.10
Denton Bank also will offer loans sponsored through the Small Business Administration.
Riverside Bank received a "satisfactory" rating in its most recent evaluation from its primary supervisor, the Office of the Comptroller of the Currency, for CRA perfor-
10. As a member of the Federal Home Loan Bank of Dallas, Denton Bank also would be eligible to participate in the Community Invest-ment Program ("CIP") and the Affordable Housing Program ("AHP"). CIP funds help finance affordable housing, small busi-nesses, industrial development, health care facilities, and the revital-ization of downtown business and shopping areas. AHP funds help finance the construction or rehabilitation of low- and moderate-income housing, and finance closing costs, partial down payments, or reduced interest rates for low- and moderate-income individuals. Both of these programs would be available to assist Denton Bank in addressing ascertained credit needs in Riverside Bank's communities.
mance as of 1995 ("Riverside Bank Examination"). Exam-iners found that the bank made reasonable efforts to ascer-tain the credit needs of the community and to market its products and services in newspapers that focus on African-American and Hispanic communities. According to the examination, the geographic distribution of loans within the community reflected a reasonable penetration of all segments within the community. For calendar year 1995, Riverside Bank originated 86 loans in low- and moderate-income areas totalling approximately $6.8 million and 115 small business loans totalling approximately $9.8 million. In addition, Riverside Bank offered loans with flexible underwriting guidelines that allowed consideration of util-ity and rent payment records for customers without formal credit histories. The Riverside Bank Examination noted that the bank solicited credit applications from all seg-ments of its local community, including low- and moderate-income neighborhoods, and that the bank was in compliance with anti-discrimination laws and regula-tions.11
The Board has carefully reviewed all the facts of record in light of the convenience and needs factor, including Protestant's comments, the banks's most recent evalua-tions for CRA performance and other supervisory informa-tion provided by their primary federal supervisors, and the policies and programs of Denton Bank to be implemented after its merger with Riverside Bank. Based on this review, the Board concludes that considerations relating to conve-nience and needs, including the CRA performance records of the relevant institutions, are consistent with approval of the application.
Conclusion
Based on the foregoing and all other facts of record, the Board has determined that the proposal should be, and hereby is, approved. The Board's approval is expressly conditioned on compliance by Applicants with all the commitments made in connection with the proposal. For purposes of this action, the commitments relied on by the Board in reaching this decision are deemed to be condi-tions imposed in writing and, as such, may be enforced in proceedings under applicable law.
11. Protestant alleges that Riverside Bank's management lacks racial diversity which has significantly impaired its ability to serve the credit needs of its communities, particularly the Dalworth community. Based on all the facts of record and for the reasons discussed above, the Board does not believe that Protestant's allegations of poor perfor-mance by Riverside Bank in helping to meet the credit needs of all its communities, including low- and moderate-income areas, are sup-ported by the record. The Board also notes that Riverside Bank would be merged with and into Denton Bank, and Denton Bank is required under regulations of the Department of Labor to file annual reports with the Equal Employment Opportunity Commission and to have in place a written affirmative action compliance program which states the bank's efforts to achieve equal opportunity in the employment, hiring, promotion, and separation of personnel. See 41 C.F.R. 60-1.7(a), 60-1.40.
Digitized for FRASER http://fraser.stlouisfed.org/ Federal Reserve Bank of St. Louis

848 Federal Reserve Bulletin • September 1996
This proposal shall not be consummated before the fif-teenth calendar day following the effective date of this order or later than three months following the effective date of this order, unless such period is extended for good cause by the Board or by the Federal Reserve Bank of Dallas, acting pursuant to delegated authority.
By order of the Board of Governors, effective July 22, 1996.
Voting for this action: Chairman Greenspan, Vice Chair Rivlin, and Governors Lindsey, Yellen, and Meyer. Absent and not voting: Gover-nors Kelley and Phillips.
JENNIFER J . J O H N S O N Deputy Secretary of the Board
Orders Issued Under Section 4 of the Bank Holding Company Act
Banc One Corporation Columbus, Ohio
CoreStates Financial Corp Philadelphia, Pennsylvania
PNC Bank Corp. Pittsburgh, Pennsylvania
KeyCorp Cleveland, Ohio
National City Corporation Cleveland, Ohio
Order Approving a Proposal to Engage in Certain Data Processing Activities
Banc One Corporation, Columbus, Ohio; CoreStates Finan-cial Corp, Philadelphia, Pennsylvania; PNC Bank Corp., Pittsburgh, Pennsylvania; KeyCorp, Cleveland, Ohio; and National City Corporation, Cleveland, Ohio (collectively, "Applicants"), bank holding companies within the mean-ing of the Bank Holding Company Act ("BHC Act"), have requested the Board's approval under section 4(c)(8) of the BHC Act (12 U.S.C. § 1843(c)(8)) and section 225.23(a) of the Board's Regulation Y (12 C.F.R. 225.23(a)) for their joint subsidiary, Electronic Payment Services, Inc., Wil-mington, Delaware ("EPS"), to engage in certain data processing activities pursuant to section 225.25(b)(7) of Regulation Y (12 C.F.R. 225.25(b)(7)).
Applicants, through EPS, would provide data processing and related services to banks and other automated teller machine ("ATM") owners ("ATM Deployers") in connec-tion with the distribution through ATMs of tickets to con-certs and other events, gift certificates, prepaid telephone
cards, and other documents evidencing a prepayment for goods or services.1
Notice of the proposal, affording interested persons an opportunity to submit comments, has been published (61 Federal Register 27,352 (1996)). The time for filing comments has expired, and the Board has considered the proposal and all comments received in light of the factors set forth in section 4(c)(8) of the BHC Act.
Applicants are large commercial banking organizations headquartered in Ohio and Pennsylvania, and engage di-rectly and through subsidiaries in a broad range of banking and permissible nonbanking activities in the United States.2
EPS currently provides data processing and transmission services to banks and retail merchants that are members of its branded ATM and point-of-sale ("POS") networks. EPS also is engaged in developing and providing a variety of electronic payment, benefit transfer, and data inter-change services.3
Proposed Activities
EPS proposes to provide data processing services to ATM Deployers in connection with the distribution through ATMs of tickets, gift certificates, prepaid telephone cards, and other documents evidencing a prepayment for goods or services.4 EPS would provide the software and telecommu-nications channels necessary to transmit cardholder re-quests and card issuer authorizations, and related switching and account reconciliation services.5
1. For purposes of this order, ATM Deployers include depository financial institutions, retail merchants, and independent sales organiza-tions that package and sell ATM services to merchants. In addition, a financial institution means a bank, bank holding company, thrift institution, thrift holding company, and subsidiaries of any of these companies.
2. Asset and deposit information for each of the Applicants is contained in the Appendix.
3. See Banc One Corporation et al., 79 Federal Reserve Bulletin 1158 (1993).
4. The tickets contemplated by this proposal would include public transportation tickets and tickets to entertainment events. Gift certifi-cates and prepaid telephone cards would be issued in fixed denomina-tions for a specific merchant or group of merchants, and would evidence prepayment of the purchase price of merchandise or services to be selected by the bearer at some time in the future. ATM Deploy-ers also would sell products that could be offered for sale directly by a financial institution such as mutual fund shares or insurance policies where permitted by applicable law.
5. Specifically, EPS would provide "terminal driving services" which include:
(1) Establishing and maintaining an electronic link between an ATM and a telecommunications switch to transmit cardholder re-quests and card issuer authorizations; and (2) Operating the feature and function displays on an ATM screen using computer software to permit an ATM to dispense various products in addition to currency. EPS also would provide switching services and transaction pro-
cessing to transmit account debiting, transaction authorization, and settlement between the ATM Deployer, or its bank, and the cardhold-er's bank. In certain cases, some of these services may be provided by third-parties, such as national ATM networks or third-party pro-cessors.
Digitized for FRASER http://fraser.stlouisfed.org/ Federal Reserve Bank of St. Louis

Legal Developments 849
In a typical transaction, an ATM cardholder would select a particular product from a menu offered at an ATM. Electronic commands transmitted by EPS would verify that the deposit account or line of credit designated by the cardholder holds sufficient funds to make the purchase. After the authorization is received, the ATM then would dispense the product and a receipt in accordance with the Board's Regulation E (Electronic Fund Transfers).6 Fi-nally, the card-issuing bank would debit an amount equal to the cost of the purchase from the cardholder's desig-nated account and transfer the funds to the account of the merchant or ATM Deployer, as appropriate, using settle-ment procedures established by the ATM network.
Closely Related to Banking Analysis
Section 4(c)(8) of the BHC Act provides that a bank holding company may, with Board approval, engage in any activity that the Board determines to be "so closely related to banking or managing or controlling banks as to be a proper incident thereto."7 The Board previously has deter-mined by regulation that processing and transmitting finan-cial, banking, or economic data are activities that are closely related to banking and, therefore, permissible for bank holding companies under section 4(c)(8) of the BHC Act.8 The Board also has specifically determined that a bank holding company may provide data processing and related services necessary to permit customers to use an ATM card to debit a deposit account or line of credit at an ATM terminal for cash and credit transactions, and for the purchase of travelers checks, money orders, and postage stamps.9 In addition, the Board has determined that a bank holding company may provide data processing services
6. 12 C.F.R. 205. 7. 12 U.S.C. § 1843(c)(8). See National Courier Association v.
Board of Governors, 516 F.2d 1229, 1237 (D.C. Cir 1975). In addi-tion, the Board may consider any other basis that may demonstrate that the proposed activity has a reasonable or close connection or relationship to banking or managing or controlling banks. See Board Statement Regarding Regulation Y, 49 Federal Register 806 (1984); Securities Industry Association v. Board of Governors, 468 U.S. 207, 210-11, n.5 (1984).
8. See 12 C.F.R. 225.25(b)(7). Regulation Y also requires that the data processing services be provided pursuant to a written agreement and places certain limitations on the facilities and hardware provided with the data processing services. Specifically, the facilities must be designed, marketed, and operated for the processing and transmission of financial, banking, or economic data; hardware must be provided only in conjunction with permissible software; and general purpose hardware must not constitute more than 30 percent of the cost of any packaged offering. EPS has committed that it will provide the pro-posed services pursuant to a written agreement and will provide facilities and hardware within the limitations established by Regula-tion Y.
9. See The Bank of New York Company, et al., 80 Federal Reserve Bulletin 1107, 1109 (1994). EPS currently conducts these activities. See Letters dated February 13, 1996, from the Federal Reserve Bank of Cleveland to Phyllis Dietz, Esq., and from the Federal Reserve Bank of Philadelphia to John F. Stefanowicz, CoreStates Financial Corp.
that support the use of credit cards by consumers in the direct purchase of goods and services from merchants.10
The data processing activity proposed in this case in-volves providing the same type of data processing support as the Board previously has approved for credit card trans-actions and other more traditional types of ATM transac-tions. Based on all the facts of record, the Board has concluded that the activities proposed by EPS in this case are permissible data processing and transmission services encompassed within the Board's data processing regulation and, therefore, the activities are closely related to banking within the meaning of the BHC Act.
Proper Incident to Banking Analysis
In order to approve this proposal, the Board also must determine that the proposed activities are a proper incident to banking; that is, that the proposal "can reasonably be expected to produce benefits to the public, such as greater convenience, increased competition, or gains in efficiency, that outweigh possible adverse effects, such as undue con-centration of resources, decreased or unfair competition, conflicts of interests, or unsound banking practices."11
As part of its review of these factors, the Board has considered the financial and managerial resources of Appli-cants and their respective subsidiaries and the effect the proposal would have on such resources.12 Based on all the facts of record, the Board has concluded that financial and managerial considerations are consistent with approval of this proposal.
The Board expects that the proposed activities would result in benefits to consumers, merchants, and ATM De-ployers. The proposed activities would allow consumers to purchase products at additional locations and during non-business hours, and would facilitate convenient payment for such products. The proposed activities also would enhance the ability of merchants to distribute products through new channels and would provide ATM Deployers with additional sources of transaction volume and resulting fee income. In addition, the proposed activities would increase the level of competition among existing providers of these services.
There is no evidence in the record that consummation of this proposal would result in any significantly adverse effects, such as undue concentration of resources, de-creased or unfair competition, conflicts of interests, or unsound banking practices, that are not outweighed by the public benefits of this proposal. Accordingly, and based on all the facts of record, the Board has concluded that the balance of the public interest factors it is required to consider under the proper incident to banking standard of
10. See Banc One Corporation, 81 Federal Reserve Bulletin 492 (1995); Citicorp, 76 Federal Reserve Bulletin 549 (1990); and Bar-clays Bank PLC, 71 Federal Reserve Bulletin 113 (1985).
11. 12 U.S.C. § 1843(c)(8). 12. See 12 C.F.R. 225.24. See also The Fuji Bank, Limited, 75
Federal Reserve Bulletin 94 (1989); Bayerische Vereinsbank AG, 73 Federal Reserve Bulletin 155 (1987).
Digitized for FRASER http://fraser.stlouisfed.org/ Federal Reserve Bank of St. Louis

850 Federal Reserve Bulletin • September 1996
section 4(c)(8) of the BHC Act is favorable and consistent with approval of this proposal.
Conclusion
Based on the foregoing and all the facts of record, the Board has determined to, and hereby does, approve this proposal subject to all the terms and conditions set forth in this order. The Board's determination also is subject to all the terms and conditions set forth in Regulation Y, includ-ing those in sections 225.7 and 225.23(g) (12 C.F.R. 225.7 and 225.23(g)), and to the Board's authority to require such modification or termination of the activities of a bank holding company or any of its subsidiaries as the Board finds necessary to assure compliance with, and to prevent evasion of, the provisions of the BHC Act and the Board's regulations and orders issued thereunder. The Board's deci-sion is specifically conditioned on compliance with all the commitments made in connection with this proposal. These commitments and conditions shall both be deemed to be conditions imposed in writing by the Board in connection with its findings and decision, and, as such, may be en-forced in proceedings under applicable law.
This transaction shall not be consummated later than three months after the effective date of this order, unless such period is extended for good cause by the Board or by the Federal Reserve Banks of Cleveland or Philadelphia, acting pursuant to delegated authority.
By order of the Board of Governors, effective July 1, 1996.
Voting for this action: Chairman Greenspan, Vice Chair Rivlin, and Governors Kelley, Lindsey, Phillips, Yellen, and Meyer.
JENNIFER J. JOHNSON Deputy Secretary of the Board
Appendix
Asset and Deposit Data as of December 31, 1995.
Banc One Corporation, with $90.2 billion in total consoli-dated assets, is the tenth largest commercial banking orga-nization in the United States, controlling $67.4 billion in deposits. Banc One operates subsidiary banks in Ohio, Kentucky, Indiana, Michigan, Illinois, Wisconsin, Texas, Colorado, Arizona, California, Oklahoma, Utah, and West Virginia.
CoreStates Financial Corp, with $29.7 billion in total consolidated assets, is the 31st largest commercial banking organization in the United States, controlling $21.5 billion in deposits. CoreStates operates subsidiary banks in Penn-sylvania, New Jersey, and Delaware.
PNC Bank Corp., with $73.5 billion in total consolidated assets, is the 12th largest commercial banking organization in the United States, controlling $21.5 billion in deposits. PNC operates subsidiary banks in Pennsylvania, Ohio,
Kentucky, Indiana, New Jersey, Massachusetts, and Dela-ware.
KeyCorp, with $66.3 billion in total consolidated assets, is the 14th largest commercial banking organization in the United States, controlling $47.3 billion in deposits. Key-Corp operates subsidiary banks in Ohio, Indiana, Michi-gan, New York, Washington, Maine, Oregon, Idaho, Utah, Colorado, Wyoming, and Alaska.
National City, with $36.2 billion in total consolidated assets, is the 24th largest commercial banking organization in the United States, controlling $25.2 billion in deposits. National City operates subsidiary banks in Ohio, Indiana, and Kentucky.
Dresdner Bank AG Frankfurt, Germany
Order Approving Notice to Engage in Nonbanking Activities
Dresdner Bank AG, Frankfurt, Germany ("Dresdner"), a foreign banking organization subject to the provisions of the Bank Holding Company Act ("BHC Act"), has re-quested Board approval under section 4(c)(8) of the BHC Act (12 U.S.C. § 1843(c)(8)) and section 225.23 of the Board's Regulation Y (12 C.F.R. 225.23) to retain its own-ership interest in the United States operations of Kleinwort Benson Group pic, London, England,1 and thereby engage in the following activities:
(1) Underwriting and dealing in, to a limited extent, all types of debt and equity securities other than interests in open-end investment companies through Dresdner Kleinwort Benson North America LLC, New York, New York ("Company"); (2) Acting as agent in the private placement of all types of securities, and buying and selling all types of securi-ties on the order of customers as a "riskless principal" through Company; (3) Providing securities brokerage services pursuant to 12 C.F.R. 225.25(b)(15) through Company; (4) Providing investment advisory services pursuant to 12 C.F.R. 225.25(b)(4) through Company and Kleinwort Benson Investment Management ("KBIMA"); Klein-wort Benson (USA), Inc.; and KB-LPL Holdings, Inc., all of New York, New York; (5) Serving as general partner for unregistered limited partnerships now existing or to be established in the future; and (6) Leasing personal or real property or acting as agent, broker, or adviser in leasing such property, pursuant to 12 C.F.R. 225.25(b)(5) through Pare Tec Inc., New York, New York.
1. Dresdner previously received approval under section 4(c)(9) of the BHC Act to retain temporarily the United States operations of Kleinwort Benson. See Letter dated July 13, 1995, from Jennifer J. Johnson, Deputy Secretary of the Board, to David M. Huggin, Esq.
Digitized for FRASER http://fraser.stlouisfed.org/ Federal Reserve Bank of St. Louis

Legal Developments 851
Dresdner would establish Company through the merger of Kleinwort Benson North America Inc. ("KBNAI") and Dresdner Securities (USA), Inc. ("DSI"), both of New York, New York. KBNAI and DSI are, and Company would be, registered as a broker-dealer with the Securities and Exchange Commission ("SEC") under the Securities Exchange Act of 1934 (15 U.S.C. § 78a et seq.).2 Accord-ingly, Company would be subject to the recordkeeping and reporting obligations, fiduciary standards, and other re-quirements of the Securities Exchange Act of 1934 and the SEC.
Notice of this proposal, affording interested persons an opportunity to submit comments, has been published (60 Federal Register 62,093 (1995)). The time for filing comments has expired, and the Board has considered the notice and all comments received in light of the factors set forth in section 4(c)(8) of the BHC Act.
Dresdner, with total consolidated assets of approxi-mately $338 billion, is the second largest banking organiza-tion in Germany.3 In the United States, Dresdner operates branches in New York, New York, and Chicago, Illinois, and an agency in Los Angeles, California.4 Dresdner also controls several subsidiaries that engage in various non-banking activities in the United States. Kleinwort Benson Group pic, with total consolidated assets of $14.2 billion, is a merchant bank based in the United Kingdom that en-gages in a variety of securities-related, advisory and other nonbanking activities worldwide.
Activities Approved by Regulation
The Board previously has determined by regulation that the proposed investment advisory, leasing and securities brokerage activities are closely related to banking for pur-poses of section 4(c)(8) of the BHC Act.5 Dresdner pro-poses to conduct these activities in accordance with the Board's regulations and prior Board decisions relating to these activities.6
2. Dresdner currently operates DSI pursuant to grandfather rights established by section 8(c)(1) of the International Banking Act of 1978 ("IBA"). 12 U.S.C. § 3106(c). Dresdner's grandfather rights with respect to DSI will terminate on the merger of DSI with and into Company.
3. Asset and ranking data are as of December 31, 1995, and use exchange rates then in elfect.
4. Deutsche-Suedamerikanische Bank AG, Hamburg, Germany, a wholly owned subsidiary of Dresdner, also operates an agency in Miami, Florida.
5. See 12 C.F.R. 225.25(b)(4), (5) and (15). 6. Because Company would provide investment advisory and bro-
kerage services with respect to ineligible securities that it may hold as a principal, Dresdner has committed that Company would inform its customers at the commencement of the relationship that, as a general matter, it may be a principal or may be engaged in underwriting with respect to, or may purchase from an affiliate, those securities for which brokerage or advisory services are provided. In addition, Dresdner has committed that the confirmations sent by Company to customers would state whether Company acted as agent or as principal in the transaction. See PNC Financial Corp., 75 Federal Reserve Bulletin 396 (1989); Bankers Trust New York Company, 74 Federal Reserve Bulletin 695 (1988). The Board also notes that Company would be
Underwriting and Dealing in Bank-Ineligible Securities
The Board has determined that, subject to the prudential framework of limitations established in previous decisions to address the potential for conflicts of interests, unsound banking practices, or other adverse effects, the proposed activities of underwriting and dealing in bank-ineligible securities are so closely related to banking as to be a proper incident thereto within the meaning of section 4(c)(8) of the BHC Act.7 Dresdner has committed that Company will conduct the proposed underwriting and dealing activities using the same methods and procedures and subject to the same prudential limitations established by the Board in the Section 20 Orders.
The Board also has determined that the conduct of these securities underwriting and dealing activities is consistent with section 20 of the Glass-Steagall Act (12 U.S.C. § 377), provided that the company engaged in the underwriting and dealing activities derives no more than 10 percent of its total gross revenue from underwrit-ing and dealing in bank-ineligible securities over any two-year period.8 Dresdner has committed that Company will conduct its underwriting and dealing activities in bank-ineligible securities subject to the 10-percent revenue test.9
registered as an investment adviser under the Investment Advisers Act of 1940 (15 U.S.C. § 80b-1 et seq.) ("Advisers Act"). Pursuant to the Advisers Act, if Company provides advice to a customer on the purchase or sale of a security for which Company is acting as principal, Company must disclose to the client that it is acting as a principal in the transaction and obtain the client's written consent before the transaction occurs. See 15 U.S.C. § 80b-6(3); Investment Advisers Act Release No. 40, reprinted in 6 Fed. Sec. L. Rep. (CCH) 56,374 (Jan. 5, 1940).
7. See Canadian Imperial Bank of Commerce, et al., 76 Federal Reserve Bulletin 158 (1990); J.P. Morgan & Co. Incorporated, et al., 75 Federal Reserve Bulletin 192 (1989), aff'd sub nom. Securities Industry Ass'n v. Board of Governors of the Federal Reserve System, 900 F.2d 360 (D.C. Cir. 1990); Citicorp, et al., 73 Federal Reserve Bulletin 473 (1987), aff'd sub nom. Securities Industry Ass'n v. Board of Governors of the Federal Reserve System, 839 F.2d 47 (2d Cir. 1988), cert, denied, 486 U.S. 1059 (1988) (collectively, "Section 20 Orders").
8. See Section 20 Orders. Compliance with the 10-percent revenue limitation shall be calculated in accordance with the method stated in the Section 20 Orders, as modified by the Order Approving Modifica-tions to the Section 20 Orders, 75 Federal Reserve Bulletin 751 (1989); the Order Approving Modifications to the Section 20 Orders, 79 Federal Reserve Bulletin 226 (1993); and the Supplement to Order Approving Modifications to Section 20 Orders, 79 Federal Reserve Bulletin 360 (1993) (collectively, "Modification Orders"). In light of the fact that Dresdner acquired a going concern, the Board believes that allowing Company to calculate compliance with the revenue limitation on an annualized basis during the first year after consumma-tion of the acquisition and thereafter on a rolling quarterly basis would be consistent with the Section 20 Orders. See Dauphin Deposit Corporation, 77 Federal Reserve Bulletin 672 (1991). The Board notes that Dresdner has not adopted the Board's alternative indexed-revenue test to measure compliance with the 10-percent limitation on bank-ineligible securities activities, and, absent such election, will continue to employ the Board's original 10-percent revenue test.
9. As an incident to the proposed underwriting and dealing activi-ties, Company would participate in certain derivative transactions for hedging purposes in accordance with the Board's policy statement on derivative transactions. See 12 C.F.R. 225.142. The Board also notes
Digitized for FRASER http://fraser.stlouisfed.org/ Federal Reserve Bank of St. Louis

852 Federal Reserve Bulletin • September 1996
Private Placement and "Riskless Principal" Activities
Private placement involves the placement of new issues of securities with a limited number of sophisticated purchas-ers in a nonpublic offering. A financial intermediary in a private placement transaction acts solely as an agent of the issuer in soliciting purchasers and does not purchase the securities and attempt to resell them. Securities that are privately placed are not subject to the registration require-ments of the Securities Act of 1933, and are offered only to financially sophisticated institutions and individuals and not to the public. Company will not privately place regis-tered securities and will only place securities with custom-ers that qualify as accredited investors.
"Riskless principal" is the term used in the securities business to refer to a transaction in which a broker-dealer, after receiving an order to buy (or sell) a security for a customer, purchases (or sells) the security for its own account to offset a contemporaneous sale to (or purchase from) the customer.10 Riskless principal transactions are understood in the industry to include only transactions in the secondary market. Thus, Company would not act as a riskless principal in selling bank-ineligible securities at the order of a customer that is the issuer of the securities to be sold, or in any transaction where Company has a contrac-tual agreement to place the securities as agent of the issuer. Company also would not act as a riskless principal in any transaction involving a bank-ineligible security for which it or an affiliate makes a market.
The Board has determined that, subject to the limitations established by the Board in prior orders, the proposed private placement and riskless principal activities are so closely related to banking as to be a proper incident thereto within the meaning of section 4(c)(8) of the BHC Act.11
The Board also has determined that acting as agent in the private placement of securities, and purchasing and selling securities on the order of investors as a riskless principal, do not constitute underwriting and dealing in securities for purposes of section 20 of the Glass-Steagall Act, and that revenue derived from these activities is not subject to the 10-percent revenue limitation on bank-ineligible securities underwriting and dealing.12
that Company may engage in activities that are necessary incidents to the proposed underwriting and dealing activities, provided that they are treated as part of the bank-ineligible securities activities, unless Company has received specific approval under section 4(c)(8) of the BHC Act to conduct the activities independently. Until such approval is obtained, any revenues from the incidental activities must be counted as ineligible revenues subject to the 10-percent revenue limitation.
10. See SEC Rule 10b-10(a)(8)(i) (17 C.F.R. 240.10b-10(a)(8)(i)). The Board notes that Company, as a registered broker-dealer, must conduct its riskless principal activities in accordance with the cus-tomer disclosure and other requirements of the federal securities laws.
11. See J.P. Morgan & Company Incorporated, 76 Federal Reserve Bulletin 26 (1990) ("J.P. Morgan"); Bankers Trust New York Corpo-ration, 75 Federal Reserve Bulletin 829 (1989) ("Bankers Trust").
12. See Bankers Trust.
Dresdner has committed that Company will conduct its private placement activities using the same methods and procedures and subject to the same prudential limitations as those established by the Board in Bankers Trust and J.P. Morgan,13 including the comprehensive framework of re-strictions imposed by the Board in connection with under-writing and dealing in bank-ineligible securities, which were designed to avoid potential conflicts of interests, unsound banking practices, and other adverse effects. Dresdner also has committed that Company will conduct its riskless principal activities subject to the limitations previously established by the Board.14
Other Activities
Dresdner also proposes that Company act as general part-ner of, and maintain an equity interest in, limited partner-ships that now exist or that may be established in the future ("Partnerships").15 Interests in Partnerships would be ex-empt from the registration and prospectus requirements of the Securities Act of 1933 (15 U.S.C. § 77a et seq.) and the Partnerships would be exempt from registration as invest-ment companies under the Investment Company Act of 1940 (15 U.S.C. § 80a-1 et seq.).16
13. Among the prudential limitations discussed more fully in Bank-ers Trust and J.P. Morgan are that Company will not privately place open-end investment company securities or securities of investment companies that are advised by Dresdner or any of its affiliates. In addition, Company will make no general solicitation or general adver-tising for securities it places.
14. See The Bank of New York Company, Inc., 82 Federal Reserve Bulletin 748 (1996). Neither Company nor its affiliates will hold themselves out as making a market in the bank-ineligible securities that Company buys and sells as riskless principal, or enter quotes for specific bank-ineligible securities in any dealer quotation system in connection with Company's riskless principal transactions, except that Company and its affiliates may enter bid or ask quotations, or publish "offering wanted" or "bid wanted" notices on trading systems other than NASDAQ or an exchange, if Company or the affiliate does not enter price quotations on different sides of the market for a particular security for two business days. In other words, Company or its affiliate must wait at least two business days after entering a "bid" quote on a security before entering an "ask" quote on the same security and vice versa. Company will not act as riskless principal for registered invest-ment company securities or for any securities of investment compa-nies that are advised by Dresdner or its affiliates. In addition, because Company proposes to provide riskless principal services in combina-tion with investment advisory services, Company will conduct its riskless principal activities in accordance with the limitations estab-lished by the Board for the full-service brokerage activities of bank holding companies. See 12 C.F.R. 225.25(b)(15)(ii).
15. DSI currently serves as general partner of a single Partnership with 20 limited partners. Dresdner may hold a small equity interest in a Partnership to enable the Partnership to be treated as a partnership for tax purposes.
16. Dresdner also proposes that Company act as investment adviser to the Partnerships and privately place interests in the Partnerships with institutional customers. As discussed above, the Board has ap-proved these activities by regulation or order and Dresdner will conduct the activities in accordance with the limitations previously established by the Board with respect to such activities. See 12 C.F.R. 225.25(b)(4); J. P. Morgan; and Bankers Trust.
Digitized for FRASER http://fraser.stlouisfed.org/ Federal Reserve Bank of St. Louis
Legal Developments 853
The Board previously has determined that Dresdner's proposed Partnership activities are permissible, and Dresd-ner has committed to conduct those activities subject to the limitations established by the Board in its prior decisions.17
For example, the Partnerships, together with Dresdner and its affiliates, will hold not more than 5 percent of any class of voting securities of any issuer and not more than 25 percent of the total equity, including subordinated debt, of any issuer. In addition, Dresdner has committed that no directors, officers, or employees of Dresdner or its affiliates will serve as directors, officers, or employees of any issuer of which the Partnerships, Dresdner and its affiliates hold more than 10 percent of the total equity.18
Financial Factors, Managerial Resources, and Other Considerations
Under the proper incident to banking standard of section 4(c)(8) of the BHC Act, in order to approve this notice, the Board must determine that the performance of the pro-posed activities by Dresdner can reasonably be expected to produce public benefits that would outweigh possible ad-verse effects. As part of the Board's evaluation of these factors, the Board considers the financial and managerial resources of the notificant and its subsidiaries and the effect the transaction would have on such resources.19 The Board notes that Dresdner's capital ratios satisfy applicable risk-based standards under the Basle Accord, and are consid-ered equivalent to the capital levels that would be required of a United States banking organization. The Board also has reviewed the capitalization of Dresdner and Company in accordance with the standards set forth in the Section 20 Orders and finds the capitalization of each to be consistent with approval. The determination of the capitalization of Company is based on all the facts of record, including Dresdner's projections of the volume of Company's under-writing and dealing activities in bank-ineligible securities. The Federal Reserve Bank of New York ("Reserve Bank") has reviewed the operational and managerial infrastructure of Company, including its computer, audit, and accounting systems and internal risk management procedures and con-trols, with respect to the proposed underwriting and deal-
17. See Meridian Bancorp, Inc., 80 Federal Reserve Bulletin 736 (1994). Because Dresdner would indirectly serve as general partner of the Partnerships, Dresdner would be required, for regulatory purposes, to hold capital and present financial information relating to Company and the Partnerships on a consolidated basis. See The Bessemer Group, Incorporated, 82 Federal Reserve Bulletin 569 (1996).
18. The Partnerships will not invest in futures contracts or options on futures contracts on any financial or nonfinancial commodity, or knowingly acquire debt securities that are in default at the time of acquisition, without prior approval from the Federal Reserve System. The Partnerships, however, might invest in futures contracts based on foreign exchange, U.S. Government and agency securities, and money market instruments solely for hedging purposes and in conformance with the Board's policy statement on derivative transactions. See 12 C.F.R. 225.142.
19. See 12 C.F.R. 225.24; see also The Fuji Bank, Limited, 75 Federal Reserve Bulletin 94 (1989); Bayerische Vereinsbank AG, 73 Federal Reserve Bulletin 155 (1987).
ing in debt and equity securities, and has determined that Company has established an adequate operational and man-agerial infrastructure to ensure compliance with the re-quirements of the Section 20 Orders. On the basis of the Reserve Bank's review and all the facts of record, the Board concludes that financial and managerial consider-ations are consistent with approval of this proposal.
In evaluating the public interest factors in this case, the Board considered that Dresdner, through Dresdner-NY In-corporated, New York, New York ("DNY"), engages in bank-ineligible securities activities in the United States pursuant to grandfather rights established by section 8(c)(1) of the IBA.20 Dresdner, however, has committed that DNY and the operations of Dresdner authorized under section 4 of the BHC Act will remain completely separate and will not engage in any business with or on behalf of each other.21
In light of these commitments, and under the framework and conditions established by the Board in the Section 20 Orders and this order, the Board concludes that consumma-tion of this proposal is not likely to result in significantly adverse effects, such as undue concentration of resources, decreased or unfair competition, conflicts of interest, or unsound banking practices, and that Dresdner would not gain an unfair competitive advantage in conducting its grandfathered activities. Moreover, the Board expects that consummation of the proposal would provide added conve-nience to Dresdner's customers and would increase the level of competition among existing providers of these
20. DNY acts as a specialist for certain stocks listed on the New York Stock Exchange ("NYSE"). Although DNY currently operates as a subsidiary of DSI, Dresdner does not propose to merge DNY into Company, and Dresdner would continue to hold DNY as a separate subsidiary pursuant to section 8(c)(1) of the IBA after consummation of the proposal. The IBA authorizes Dresdner to retain its interest in DNY unless the Board, after notice and opportunity for a hearing, finds that the continuation of the activities would give rise to adverse effects, such as undue concentration of resources, decreased or unfair competition, conflicts of interest, or unsound banking practices in the United States.
21. In furtherance of this commitment, and not in limitation thereof, Dresdner also has committed that there will be no director, officer or employee interlocks of any kind between DNY and Dresdner's U.S. subsidiaries authorized under section 4 of the BHC Act; there will be no joint marketing efforts between DNY and Dresdner's subsidiaries authorized under section 4 of the BHC Act; and DNY and Dresdner's subsidiaries authorized under section 4 of the BHC Act will not share fees, profits or customer information with, will not make customer referrals to, and will not engage in cross-marketing with, each other. Dresdner has requested that the Board permit Dresdner's subsidiaries authorized under section 4 of the BHC Act to execute trades through DNY on the NYSE in stocks for which DNY acts as a specialist. The Board notes that DNY is the only specialist on the NYSE for the stocks at issue. Dresdner has committed that all transactions effected by DNY for its affiliates authorized under section 4 will be conducted on an arm's length basis and on terms no more favorable than those offered to unaffiliated third parties. In light of the unique facts of this case and the limited nature of the proposed relationship between DNY and its affiliates authorized under section 4 of the BHC Act, the Board concludes that Dresdner's request is consistent with the public interest factors the Board must consider in this case. The Board expects Dresdner to ensure that DNY and its affiliates authorized under sec-tion 4 are operated entirely separately in all other respects.
Digitized for FRASER http://fraser.stlouisfed.org/ Federal Reserve Bank of St. Louis

854 Federal Reserve Bulletin • September 1996
services. The Board has determined, therefore, that the performance of the proposed activities by Dresdner can reasonably be expected to produce public benefits that outweigh possible adverse effects under the proper incident to banking standard of section 4(c)(8) of the BHC Act.
Accordingly, and for the reasons set forth in this order and in the Section 20 Orders, the Board has concluded that Dresdner's proposal to engage in the proposed activities is consistent with the Glass-Steagall Act, and that the pro-posed activities are so closely related to banking as to be proper incidents thereto within the meaning of section 4(c)(8) of the BHC Act, provided that Dresdner limits Company's activities as specified in this order and the Section 20 Orders, as modified by the Modification Orders.
On the basis of all the facts of record, the Board has determined to, and hereby does, approve this notice subject to all the terms and conditions discussed in this order and in the Section 20 Orders, as modified by the Modification Orders. The Board's approval of this proposal extends only to activities conducted within the limitations of those or-ders and this order, including the Board's reservation of authority to establish additional limitations to ensure that Company's activities are consistent with safety and sound-ness, avoiding conflicts of interests, and other relevant considerations under the BHC Act. Underwriting and deal-ing in any manner other than as approved in this order and the Section 20 Orders, as modified by the Modification Orders, is not authorized for Company.
The Board's determination also is subject to all the terms and conditions set forth in Regulation Y, including those in sections 225.7 and 225.23(g) (12 C.F.R. 225.7 and 225.23(g)), and to the Board's authority to require modifi-cation or termination of the activities of a bank holding company or any of its subsidiaries as the Board finds necessary to assure compliance with and to prevent eva-sion of the provisions of the BHC Act and the Board's regulations and orders issued thereunder. The Board's deci-sion is specifically conditioned on Dresdner's compliance with all the commitments made in connection with this notice, including the commitments discussed in this order and the conditions set forth in the Board regulations and orders noted above. The commitments and conditions shall be deemed to be conditions imposed in writing by the Board in connection with its findings and decisions, and may be enforced in proceedings under applicable law.
This transaction shall not be consummated later than three months after the effective date of this order unless such period is extended for good cause by the Board or the Reserve Bank, acting pursuant to delegated authority.
By order of the Board of Governors, effective July 15, 1996.
Voting for this action: Chairman Greenspan, Vice Chair Rivlin, and Governors Kelley, Lindsey, Yellen, and Meyer. Absent and not voting: Governor Phillips.
JENNIFER J. JOHNSON Deputy Secretary of the Board
First Southern Bancorp, Inc. Stanford, Kentucky
Order Approving the Acquisition of a Savings Association
First Southern Bancorp, Inc., Stanford, Kentucky ("First Southern"), a bank holding company within the meaning of the Bank Holding Company Act ("BHC Act"), has applied for the Board's approval under section 4 of the BHC Act (12 U.S.C. § 1843(c)(8)) and section 225.23 of the Board's Regulation Y (12 C.F.R. 225.23) to acquire Lincoln Financial Bancorp, Inc. ("Lincoln"), and thereby acquire Lincoln Federal Savings Bank ("Lincoln FSB"), also in Stanford, Kentucky.1
Notice of the proposal, affording interested persons an opportunity to submit comments, has been published (61 Federal Register 21 fill (1996)). The time for filing comments has expired, and the Board has considered the notice and all comments received in light of the factors set forth in section 4 of the BHC Act.
The Board has determined that the operation of a savings association by a bank holding company is closely related to banking for purposes of section 4(c)(8) of the BHC Act.2
The Board requires savings associations acquired by bank holding companies to conform their direct and indirect activities to those permissible for bank holding companies under section 4(c)(8) of the BHC Act and Regulation Y. First Southern has committed to conform all activities of Lincoln FSB to those requirements.3
First Southern is the 34th largest commercial bank or thrift institution ("depository institution") in Kentucky, controlling deposits of approximately $172.4 million, rep-resenting less than 1 percent of total deposits in depository
1. First Southern proposes to transfer the main office and one branch of Lincoln FSB, accounting for 84 percent of the thrift's total deposits, to First Southern's subsidiary bank, First Southern National Bank of Lincoln County, Hustonville, Kentucky ("First Southern Bank"). Lincoln FSB would continue to operate at the location of its single remaining branch. The transaction is subject to the approval of the Office of the Comptroller of the Currency ("OCC") under sec-tion 18(c) of the Federal Deposit Insurance Act ("FDI Act") (12 U.S.C. § 1828(c) (the "Bank Merger Act")) and section 5(d)(3) of the FDI Act. Lincoln also has granted First Southern an option to purchase up to 19.9 percent of the voting shares of Lincoln under certain circumstances. The option would be cancelled on consumma-tion of the proposal.
2. See 12 C.F.R. 225.25(b)(9). 3. First Southern has committed that all impermissible real estate
activities will be divested within two years of consummation of the proposal, that no new impermissible projects or investments will be undertaken during this period, and that capital adequacy guidelines for Lincoln FSB will be met excluding impermissible real estate invest-ments. First Southern also has committed that all impermissible insurance activities will be divested or terminated within two years of consummation of the proposal and that no new impermissible insur-ance activities will be undertaken during this period except for the renewal of existing insurance policies. In addition, First Southern has committed that all impermissible securities activities will cease on or before consummation of the proposal.
Digitized for FRASER http://fraser.stlouisfed.org/ Federal Reserve Bank of St. Louis

Legal Developments 855
institutions in the state.4 Lincoln is the 169th largest depos-itory institution in Kentucky, controlling deposits of ap-proximately $40.8 million. On consummation of the pro-posal, First Southern would become the 27th largest depository institution in Kentucky, controlling deposits of approximately $213.2 million, representing less than 1 percent of total deposits in depository institutions in the state.
Competitive Considerations
Under section 4(c)(8) of the BHC Act, the Board is re-quired to consider whether a proposal is likely to result in any significantly adverse effects, such as undue concentra-tion of resources or unfair competition, conflicts of inter-ests, or unsound banking practices. First Southern, through its two subsidiary banks, and Lincoln compete directly in the Danville, Kentucky, banking market ("Danville bank-ing market").5 In addition, the Board has approved First Southern to acquire up to 24.9 percent of the voting shares of Casey County Bancorp, Inc., Liberty, Kentucky ("Casey County"), which also competes in the Danville banking market, as a noncontrolling passive investment.6 The Board has noted previously that one company need not acquire control of another in order substantially to lessen competi-tion between them. It is possible, for example, that the acquisition of a substantial ownership interest in a compet-itor or a potential competitor of the acquiring firm may alter the market behavior of both firms in such a way as to weaken or eliminate independence of action between the organizations and increase the likelihood of cooperative operations.7
When the deposits of Casey County are combined with First Southern, First Southern is the largest depository institution in the market, controlling deposits of approxi-mately $171.7 million, representing 27.8 percent of total deposits in depository institutions in the market ("market deposits").8 Lincoln is the tenth largest depository institu-
tion in the market, controlling deposits of approximately $40.8 million, representing 3.3 percent of market deposits. On consummation of the proposal, First Southern would remain the largest depository institution in the market, controlling deposits of approximately $212.5 million, rep-resenting 33.3 percent of market deposits. Market concen-tration, as measured by the Herfindahl-Hirschman Index ("HHI"), would increase 272 points to 1914.9
The Board notes, however, that HHI levels are only guidelines that are used by the Board, the Department of Justice, and the other banking agencies to help identify cases in which a more detailed competitive analysis is appropriate to assure that the proposal would not have a significantly adverse effect on competition in any relevant market. A proposal that fails to pass the HHI market screen may nonetheless be approved because other information may indicate that the proposal would not have a signifi-cantly adverse effect on competition. The Department of Justice has reviewed the proposal and advised the Board that consummation of the proposal would not likely have any significantly adverse competitive effects in the Dan-ville banking market or any other relevant banking market.
In addition, a number of factors indicate that the market concentration as measured by the HHI tends to overstate the competitive effects of the proposal. After consumma-tion of the proposal, for example, ten competitors would remain in a relatively small banking market.10 Six of these competitors are commercial banking organizations, two of which each control more than 10 percent of market depos-its and three others of which each control more than 5 percent of market deposits. In addition, two of these commercial banking organizations are large regional bank holding companies.
Based on these and all the other facts of record, the Board concludes that consummation of the proposal is not likely to have a significantly adverse effect on competition or the concentration of banking resources in any relevant banking market.
4. Deposit data are as of June 30, 1995. 5. The Danville banking market is approximated by Boyle and
Lincoln Counties, the Lancaster and Bryantsville census divisions of Garrard County, and the northern portion of Casey County, all in Kentucky.
6. See First Southern Bancorp, Inc., 82 Federal Reserve Bulletin 424 (1996). In connection with acquiring the interest in Casey County, First Southern agreed to abide by certain commitments, set forth in the appendix to the Board's order, that previously had been relied on by the Board in cases involving passive minority investments. See, e.g., Mansura Bancshares, Inc., 79 Federal Reserve Bulletin 37 (1993) ("Mansura"). First Southern has acquired approximately 5.3 percent of the voting shares of Casey County.
7. First Banks, Inc., 80 Federal Reserve Bulletin 34 (1994); Man-sura, supra.
8. Market share data are based on calculations in which the deposits of thrift institutions are included at 50 percent. The Board previously has indicated that thrift institutions have become, or have the potential to become, major competitors of commercial banks. See Midwest Financial Group, 75 Federal Reserve Bulletin 386 (1989); National City Corporation, 70 Federal Reserve Bulletin 743 (1984). Thus, the Board has regularly included thrift deposits in the calculation of market share on a 50 percent weighted basis. See, e.g., First Hawai-
ian, Inc., 77 Federal Reserve Bulletin 52 (1991). Because the deposits of Lincoln FSB would be controlled by a commercial banking organi-zation after consummation of the proposal, they have been included at 100 percent in the calculation of the market share of First Southern after consummation of the proposal. See Norwest Corporation, 78 Federal Reserve Bulletin 452 (1992); First Banks, Inc., 76 Federal Reserve Bulletin 669, 670 n.9 (1990).
9. Under the revised Department of Justice Merger Guidelines, 49 Federal Register 26,823 (June 29, 1984), a market in which the post-merger HHI is above 1800 is considered highly concentrated. The Department of Justice has informed the Board that a bank merger or acquisition generally will not be challenged (in the absence of other factors indicating anticompetitive effects) unless the post-merger HHI is at least 1800 and the merger increases the HHI by at least 200 points.
10. The Danville banking market has a population of 56,700 resi-dents and total deposits in depository institutions of approximately $617 million.
Digitized for FRASER http://fraser.stlouisfed.org/ Federal Reserve Bank of St. Louis

856 Federal Reserve Bulletin • September 1996
Other Considerations
The Board also concludes that consummation of the pro-posal would result in a broader financial network through which First Southern could serve its customers and former Lincoln customers. Former Lincoln customers would have increased services, including access to Small Business Administration loans, and, for the majority of depositors whose accounts would be transferred to First Southern Bank, expanded access to automated teller machines in the Danville banking market. The Board also concludes that the financial and managerial resources of First Southern and Lincoln FSB are consistent with approval of the pro-posal. In light of all the facts of record, the Board finds that consummation of the proposal is not likely to result in any significantly adverse effects, such as undue concentration of resources, decreased or unfair competition, conflicts of interest, or unsound banking practices that would outweigh the public benefits of the proposal. Accordingly, the Board has determined that the performance of the proposed activ-ities by First Southern can reasonably be expected to produce public benefits that outweigh possible adverse effects under the proper incident to banking standard of section 4(c)(8) of the BHC Act.
Conclusion
Based on the foregoing and all the facts of record, the Board has determined that this notice should be, and hereby is, approved. The Board's approval is specifically condi-tioned on compliance by First Southern with all commit-ments made in connection with this notice. The Board's determination is also subject to all the conditions in Regu-lation Y, including those in sections 225.7 and 225.23(g) (12 C.F.R. 225.7 and 225.23(g)) and to the Board's author-ity to require such modification or termination of the activities of a holding company or any of its subsidiaries as the Board finds necessary to assure compliance with, or to prevent evasion of, the provisions and purposes of the BHC Act and the Board's regulations and orders issued thereunder. These commitments and conditions relied on by the Board in reaching this decision are deemed to be conditions imposed in writing by the Board in connection with its findings and decision, and, as such, may be en-forced in proceedings under applicable law.
The transaction shall not be consummated later than three months following the effective date of this order, unless such period is extended for good cause by the Federal Reserve Bank of Cleveland, acting pursuant to delegated authority.
By order of the Board of Governors, effective July 22, 1996.
Voting for this action: Chairman Greenspan, Vice Chair Rivlin, and Governors Lindsey, Yellen, and Meyer. Absent and not voting: Gover-nors Kelley and Phillips.
JENNIFER J. JOHNSON Deputy Secretary of the Board
Orders Issued Under Sections 3 and 4 of the Bank Holding Company Act
Bank of Boston Corporation Boston, Massachusetts
Order Approving the Acquisition of a Bank Holding Company
Bank of Boston Corporation, Boston, Massachusetts ("Bank of Boston"), a bank holding company within the meaning of the Bank Holding Company Act ("BHC Act"), has requested the Board's approval under section 3 of the BHC Act (12 U.S.C. § 1842) to acquire BayBanks, Inc. ("BayBanks"), also in Boston, Massachusetts.1 Bank of Boston would indirectly acquire the subsidiary banks of BayBanks, BayBank, N.A., Boston, Massachusetts ("Bay-Bank MA"), and BayBank NH, National Association, Derry, New Hampshire ("BayBank NH").2
Bank of Boston also has requested the Board's approval under section 4(c)(8) of the BHC Act (12 U.S.C. § 1843(c)(8)) and section 225.23(a) of the Board's Regula-tion Y (12 C.F.R. 225.23(a)) to:
(1) Acquire all the voting shares of BayBank FSB, Nashua, New Hampshire ("BayBank FSB"), and thereby engage in the operation of a savings association pursuant to section 225.25(b)(9) of Regulation Y (12 C.F.R. 225.25(b)(9)); and (2) Increase Bank of Boston's ownership interest from 6 percent to 16.53 percent of the voting shares of NYCE Corporation, Hackensack, New Jersey ("NYCE Corpo-ration"), which engages in operating retail electronic funds transfer networks and data processing activities pursuant to section 225.25(b)(7) of Regulation Y (12 C.F.R. 225.25(b)(7)).3
Notice of the proposals, affording interested persons an opportunity to submit comments, has been published (61 Federal Register 14,308 (1996)). The time for filing comments has expired, and the Board has considered the proposals and all comments received in light of the factors set forth in sections 3(c) and 4(c)(8) of the BHC Act.
1. Bank of Boston also has requested the Board's approval to acquire options for up to 19.9 percent of the voting stock of Bay-Banks, and BayBanks has requested the Board's approval to acquire options for up to 19.9 percent of the voting stock of Bank of Boston.
2. Bank of Boston proposes to merge its wholly owned subsidiary Boston Merger Corp., Boston, Massachusetts, into BayBanks with BayBanks to be the surviving company. Bank of Boston would be renamed BankBoston Corporation. After consummation of this pro-posal, Bank of Boston would merge BayBank MA with and into Bank of Boston's lead subsidiary bank, The First National Bank of Boston, Boston, Massachusetts ("FNBB"). The bank merger is subject to the approval of the Office of the Comptroller of the Currency ("OCC") under the Bank Merger Act (12 U.S.C. § 1828(c)).
3. Bank of Boston also has provided notice of its intention to acquire a branch of BayBank MA located in the Cayman Islands, B.W.I., pursuant to the Board's Regulation K (12 C.F.R. 211.3(a)(3)).
Digitized for FRASER http://fraser.stlouisfed.org/ Federal Reserve Bank of St. Louis

Legal Developments 857
Bank of Boston, with total consolidated assets of $47.4 billion, operates subsidiary banks in Massachusetts, Connecticut, Florida, and Rhode Island, and a special purpose bank in Maine that provides cash management services.4 Bank of Boston is the 17th largest commercial banking organization in the United States and the largest commercial banking organization in Massachusetts. Bank of Boston controls deposits of $16.8 billion in Massachu-setts, representing 16.5 percent of all deposits in depository institutions in the state ("state deposits").5 Bank of Boston also engages in a number of permissible nonbanking activ-ities nationwide.
BayBanks, with total consolidated assets of $12.1 bil-lion, operates a subsidiary bank in Massachusetts, and a subsidiary bank and a thrift institution in New Hampshire.6
BayBanks is the 51st largest commercial banking organiza-tion in the United States and the third largest commercial banking organization in Massachusetts. BayBanks controls deposits of $9.2 billion in Massachusetts, representing approximately 9 percent of state deposits.
On consummation of this proposal, Bank of Boston would become the 15th largest commercial banking organi-zation in the United States, with total consolidated assets of $59.5 billion and would control less than 1 percent of the total deposits in banks and savings associations insured by the Federal Deposit Insurance Corporation ("FDIC"). On consummation of this proposal and completion of the pro-posed branch divestitures, Bank of Boston would remain the largest commercial banking organization in Massachu-setts, controlling $25.1 billion in deposits, representing approximately 24.7 percent of state deposits.
Interstate Analysis
Section 3(d) of the BHC Act allows the Board to approve a proposal by a bank holding company to acquire control of a bank located in a state other than the home state of such bank holding company, if certain conditions are met. For purposes of the BHC Act, the home state of Bank of Boston is Massachusetts, and BayBanks operates banks located outside Massachusetts.7 The conditions for an inter-state acquisition under section 3(d) are met in this case.8 In
4. Asset data are as of December 31, 1995. 5. Depository institutions include commercial banks, savings banks,
and savings associations. State deposit data are as of June 30, 1995, adjusted to reflect acquisitions and sales consummated by Bank of Boston through June 30, 1996.
6. BayBank MA operates two branches in Connecticut. 7. 12 U.S.C. § 1842(d). Pub. L. No. 103-328, 108 Stat. 2338 (1994).
A bank holding company's home state is that state in which the operations of the bank holding company's banking subsidiaries were principally conducted on July 1, 1966, or the date on which the company became a bank holding company, whichever is later.
8. 12 U.S.C. §§ 1842(d)(1)(A) and (B) and 1842(d)(2)(A) and (B). Bank of Boston is adequately capitalized and adequately managed. The subsidiary banks of BayBanks have been in existence and contin-uously operated for the minimum periods of time required under applicable state law. In addition, on consummation of this proposal, Bank of Boston and its affiliates would control less than 10 percent of the total amount of deposits of insured depository institutions in the
view of all the facts of record, the Board is permitted to approve this proposal under section 3(d) of the BHC Act.9
Competitive Considerations
The BHC Act prohibits the Board from approving an application under section 3 of the BHC Act if the proposal would result in a monopoly, or if the proposal would substantially lessen competition in any relevant banking market, unless such anticompetitive effects are clearly out-weighed in the public interest by the probable effect of the transaction in meeting the convenience and needs of the community to be served. Bank of Boston and BayBanks compete directly in nine banking markets in New En-gland.10 The Board has carefully considered the effects that consummation of this proposal would have on competition in these banking markets in light of all the facts of record, including characteristics of each market,11 the increase in
United States and less than 30 percent of the total amount of deposits of insured depository institutions in the relevant states. On consumma-tion of this transaction, which includes the divestiture of approxi-mately $860 million in deposits in Massachusetts, Bank of Boston would control less than 25 percent of the total deposits of all state- and federally-chartered banks in Massachusetts. See M.G.L.A. c. 167, § 2 (Supp. 1996). The Board's determination on this proposal is specifi-cally conditioned on Bank of Boston obtaining approval under appli-cable state law.
9. BayBanks has filed several applications with the OCC for permis-sion to merge BayBank FSB into BayBank NH, relocate the main office of BayBank NH a distance of less than 30 miles into Massachu-setts, and merge BayBank NH into BayBank MA, with BayBank MA retaining BayBank NH's New Hampshire branches. The New Hamp-shire Bank Commissioner ("New Hampshire Commissioner") con-tends that these applications would permit BayBank MA illegally to establish interstate branches, and has joined a lawsuit filed in the Federal District Court for the Northern District of Texas to challenge the OCC's approval of these types of relocation and merger transac-tions for national banks. On May 22, 1996, the district court ruled that upon the relocation of the main office of a national bank, the bank is authorized to establish an interstate branch only to the extent autho-rized under state law. Ghiglieri v. Ludwig, No. 3:95-CV-2001-H, 1996 U.S. Dist. LEXIS 8321, at *49 (N.D. Tex. May 22, 1996). The Board notes that the OCC has not approved the BayBanks relocation, branch-ing, and merger applications, and that this matter is solely within the OCC's jurisdiction to consider in light of all applicable legal prece-dent. If the OCC disapproves the applications, or if the OCC's approval of the applications is later overturned by a court, Bank of Boston would nevertheless be permitted to own BayBank NH as a separate New Hampshire bank under section 3(d) of the BHC Act. The Board has forwarded the New Hampshire Commissioner's com-ments to the OCC.
10. The banking markets are described in the Appendix. Market share data are as of June 30, 1995.
11. Based on the particular characteristics of the institutions and markets involved, the Board previously has determined that certain savings associations in New England offer significant competition to commercial banks in the provision of the full range of financial services, and has weighted the deposits of those savings associations at more than 50 percent in calculating market share. See Fleet Finan-cial Group, Inc., 82 Federal Reserve Bulletin 50 (1996); Fleet/Norstar Financial Group, Inc., 77 Federal Reserve Bulletin 750 (1991); Cen-vest, Inc., 74 Federal Reserve Bulletin 807 (1988); and Hartford National Corporation, 73 Federal Reserve Bulletin 720 (1987). The Board has determined to include the deposits of savings associations in Connecticut, Massachusetts, New Hampshire, and Rhode Island
Digitized for FRASER http://fraser.stlouisfed.org/ Federal Reserve Bank of St. Louis

858 Federal Reserve Bulletin • September 1996
the concentration of total deposits in depository institutions in these markets as measured by the Herfindahl-Hirschman Index ("HHI"), and the HHI levels set out in the revised Department of Justice Merger Guidelines ("DOJ Guide-lines").12 As part of this proposal, Bank of Boston would divest a total of 20 branches of the subsidiary banks of Bank of Boston and BayBanks in the Boston metropolitan area. These branches represent deposits of approximately $860 million.13
Consummation of this proposal would not exceed the DOJ Guidelines in any relevant banking market and nu-merous competitors would remain in each market.14 The Department of Justice has reviewed the proposal and ad-vised the Board that, subject to completion of the proposed divestitures, the proposal would not likely have any signif-icantly adverse effects on competition in any banking mar-ket.15 The Office of the Massachusetts Attorney General has reached the same conclusion on the competitive effects of this proposal in the Massachusetts banking markets. In this light, and based on all the facts of record, the Board concludes that consummation of this proposal is not likely
banking markets at up to 100 percent based on a number of factors indicating their commitment to commercial lending, including their ratio of commercial and industrial loans (other than those secured by real estate) to total assets, percentage of small business loans in the market, resources committed to commercial lending, and the legal authority of the association to make commercial loans.
12. Under the DOJ Guidelines, 49 Federal Register 26,823 (June 29, 1984), a market in which the post-merger HHI is less than 1000 is considered unconcentrated and a market in which the post-merger HHI is between 1000 and 1800 is considered moderately concen-trated. A market in which the post-merger HHI is above 1800 is considered to be highly concentrated. In such markets, the Department of Justice is likely to challenge a merger that increases the HHI by more than 50 points. The Department of Justice has informed the Board that a bank acquisition or merger generally will not be chal-lenged (in the absence of other factors indicating anti-competitive effects) unless the post-merger HHI is at least 1800 and the merger or acquisition increases the HHI by at least 200 points. The Department of Justice has stated that the higher than normal threshold for anti-competitive effects implicitly recognizes the competitive effect of limited-purpose lenders and other non-depository financial entities.
13. Bank of Boston has committed to execute a sales agreement to accomplish this divestiture before consummation of this proposal and to complete the divestiture within 180 days of consummation. Bank of Boston also has committed that, if it is unsuccessful in completing the divestiture within 180 days of consummation, it will transfer the unsold branches to an independent trustee that is acceptable to the Board and that will be instructed to sell the assets promptly. In addition, Bank of Boston has committed to submit to the Board, before consummation of the acquisition, an executed trust agreement acceptable to the Board stating the terms of the divestiture.
14. Based on all the facts of record, including the proposed divesti-tures, the HHI increases in the banking markets in which Bank of Boston and BayBanks compete would be as follows: in Massachu-setts, Amherst-Northampton (141 points to 1723); Boston (423 points to 1467); Cape Cod (74 points to 1597); New Bedford (27 points to 2819); Springfield (219 points to 1356); Taunton (156 points to 2558); and Worcester (171 points to 2258); in the Hartford, Connecticut, banking market (7 points to 3011); and in the Providence, Rhode Island, banking market (30 points to 3277). The HHI calculations in the Boston, Massachusetts, banking market include the deposits of BayBank FSB.
15. The OCC also has not objected to the proposal.
to have a significantly adverse effect on competition or concentration of banking resources in any relevant banking market.
Other Factors Under the BHC Act
The BHC Act also requires the Board to consider the financial and managerial resources and future prospects of the companies and banks involved, the convenience and needs of the community to be served, and certain other supervisory factors.
A. Supervisory Factors
The Board has carefully considered the financial and man-agerial resources and future prospects of Bank of Boston and BayBanks and their respective subsidiaries, and other supervisory factors, in light of all the facts of record. These facts include supervisory reports of examination assessing the financial and managerial resources of the organizations, and confidential financial information provided by Bank of Boston. Bank of Boston would incur no additional debt in connection with this proposal and has sufficient financial and managerial resources to accomplish this transaction without impairing these resources. After consummation of this proposal, Bank of Boston's subsidiary banks all would remain well capitalized. Based on these and all the facts of record, the Board concludes that the supervisory factors under the BHC Act, including financial and managerial resources, weigh in favor of approval of this proposal.16
B. Convenience and Needs Factor
The Board has long held that consideration of the conve-nience and needs factor includes a review of the records of the relevant depository institutions under the Community Reinvestment Act (12 U.S.C. § 2901 et seq.) ("CRA"). As provided in the CRA, the Board has evaluated this factor in light of examinations by the primary federal supervisor of the CRA performance records of the relevant institutions.
The Board also has carefully considered all comments submitted on this proposal, including comments from the Rhode Island Community Reinvestment Association ("RICRA") criticizing the CRA performance record of
16. The Board has received comments from an individual contend-ing, without providing any supporting evidence, that mergers of local banking organizations have a number of adverse effects, including decreased competition, increased risk of failure to the banking system, increased collusion to set fees for banking products and services, and higher fees for fewer services to customers, particularly small busi-nesses. The Board considered identical comments made by this com-menter in connection with its evaluation of Bank of Boston's acquisi-tion of The Boston Bancorp and its subsidiary South Boston Savings Bank, both in Boston, Massachusetts. See Bank of Boston Corpora-tion, 82 Federal Reserve Bulletin 733 (1996) ("South Boston Order"). This commenter has presented no new considerations relevant to the BayBanks proposal. The Board has incorporated the analysis and findings discussed in the South Boston Order in its consideration of this transaction.
Digitized for FRASER http://fraser.stlouisfed.org/ Federal Reserve Bank of St. Louis

Legal Developments 859
Bank of Boston's subsidiary bank, Rhode Island Hospital Trust National Bank, Providence, Rhode Island ("Hospital Trust"), in serving the credit needs of low- and moderate-income ("LMI") areas, particularly in Providence. In addi-tion, RICRA maintains that Hospital Trust does not ade-quately support community initiatives through charitable contributions. RICRA and other individual commenters also speculate that branch closings resulting from the pro-posal would have an adverse effect on LMI areas through-out New England.17
An institution's most recent CRA performance evalua-tion is a particularly important consideration in the applica-tions process because it represents a detailed on-site evalu-ation of the institution's overall record of performance under the CRA by its primary federal supervisor.18 In addition, the Board considers an institution's policies and practices for compliance with applicable fair lending laws. The Board also takes into account information on an insti-tution's lending activities that assist in meeting the credit needs of LMI neighborhoods, including programs and ac-tivities initiated since its most recent CRA performance examination.
Performance Examinations. Bank of Boston's subsid-iary banks all received ratings of "outstanding" or "satis-factory" in their most recent examinations for CRA perfor-mance by their primary federal supervisors. Bank of Boston's lead subsidiary bank, FNBB, received an "out-standing" rating from its primary federal supervisor, the OCC, as of December 1994.19 Hospital Trust also received an "outstanding" rating from the OCC, as of December
17. RICRA and other commenters contend that projected job losses resulting from the proposal also would adversely effect LMI areas. The BHC Act specifically enumerates the factors the Board may consider in reviewing a proposal under that Act. As previously noted, these factors relate to the effect of the proposal on competition, the financial and managerial resources of the institutions involved, certain supervisory factors, and the convenience and needs of the communi-ties served by the institutions involved. The effect of the proposed acquisition on employment in a community is not among the factors the Board is required to consider under the BHC Act. The conve-nience and needs factor, moreover, has been consistently interpreted by the federal banking agencies, the courts, and Congress to relate to the effect of a proposal on the availability and quality of banking services in the community. See Wells Fargo & Company, 82 Federal Reserve Bulletin 445, 457 (1996). The Board notes that Bank of Boston has taken several steps to minimize any adverse effects of this proposal on employment or the economy in New England, and has indicated that it will provide support to displaced employees. For example, Bank of Boston and BayBanks initiated a hiring freeze in January 1996 that has reduced the combined workforce of BayBanks and Bank of Boston by 700 employees. Bank of Boston also estab-lished an Enhanced Severance Program, in which certain employees are offered early retirement and other employees whose jobs are eliminated receive enhanced severance and transition assistance.
18. The Board notes that the Statement of the Federal Financial Supervisory Agencies Regarding the Community Reinvestment Act provides that a CRA examination is an important and often controlling factor in the consideration of an institution's CRA record and that reports of these examinations will be given great weight in the applications process. 54 Federal Register 13,742, 13,745 (1989).
19. The Board reviewed in detail FNBB's CRA performance record in the South Boston Order and that review is incorporated herein.
1994 ("Hospital Trust Examination").20 All the subsidiary banks and thrifts of BayBanks received ratings of "out-standing" or "satisfactory" in their most recent examina-tions for CRA performance by their primary federal super-visors, and BayBanks's lead subsidiary bank, BayBank MA, received an "outstanding" rating from the OCC, as of March 1996.21
Record of CRA Performance in Rhode Island. The Hos-pital Trust Examination reflects substantial efforts by the bank to help address the housing, consumer, and small business credit needs of all its communities, including LMI areas. Examiners found that Hospital Trust solicited credit applications from all segments of its community, and that there was no evidence of illegal discriminatory credit prac-tices in the bank's lending activities. The bank also has in place effective policies, procedures, and training to support equal treatment of applicants in lending and credit activi-ties.
The Hospital Trust Examination noted that Hospital Trust had developed credit products specifically designed to address the credit needs of LMI individuals and geogra-phies. The bank developed the "First Step" residential real estate lending products, including a purchase money mort-gage loan offering flexible terms and low down payments for first-time home buyers, and a home improvement loan providing extended loan terms, lower repayment require-ments, and flexible underwriting criteria.22 In addition, Hospital Trust created "First Community Bank" which is a special program with marketing and retail strategies focused on providing credit and banking needs to predomi-nantly LMI communities in Rhode Island.
Examiners also indicated that Hospital Trust actively participated in local-based lending programs designed to address the credit needs of LMI individuals, including those sponsored by the Rhode Island Housing and Mort-
20. Bank of Boston's subsidiary bank in Connecticut, Bank of Boston, Connecticut, Hartford, Connecticut ("BKB CT"), received an "outstanding" rating from its primary federal supervisor, the FDIC, as of June 1994. Bank of Boston, Florida, N.A., a trust-oriented institu-tion received a "satisfactory" rating from the OCC, as of February 1995. Bank of Boston (Maine), N.A., Portland, Maine, a cash dis-bursement bank with no public operations, has not been evaluated for CRA performance. FNBB, Hospital Trust, and BKB CT together account for 99.84 percent of the total assets held by Bank of Boston's subsidiary banks.
21. BayBank NH and BayBank FSB have not been examined for CRA performance since they were acquired by BayBanks. In its most recent examination for CRA performance, however, BayBank NH received a "satisfactory" rating from the FDIC, as of May 1994 (BayBank NH, formerly known as Cornerstone Bank, recently con-verted from a state-chartered bank to a national bank). The two savings associations that merged to become BayBank FSB (NFS Savings Bank, FSB, Nashua, New Hampshire; and Plaistow Coopera-tive Bank, FSB, Plaistow, New Hampshire) received "outstanding" and "satisfactory" ratings from the Office of Thrift Supervision, as of July 1994 and May 1993, respectively. See BayBanks, Inc., 81 Fed-eral Reserve Bulletin 723 (1995).
22. Since 1989, Hospital Trust has approved First Step mortgage loans totalling $58.8 million.
Digitized for FRASER http://fraser.stlouisfed.org/ Federal Reserve Bank of St. Louis
860 Federal Reserve Bulletin • September 1996
gage Finance Corporation ("RIHMFC").23 The Hospital Trust Examination indicated that Hospital Trust also was actively involved in FHA and VA guaranteed mortgage programs through its affiliate mortgage company, BancBos-ton Mortgage Corporation, Boston, Massachusetts.
Hospital Trust offers traditional consumer products such as home equity and auto loans, and a "First Step" personal loan program that provides unsecured loans for LMI bor-rowers. Furthermore, the Hospital Trust Examination indi-cated that the bank offered a wide variety of small business loans throughout its delineated community and has in-creased its involvement with the Small Business Adminis-tration through direct lending programs and through loan pools with other financial intermediaries.24
The Hospital Trust Examination also indicated that Hos-pital Trust designed programs to market its products and services to its entire community, including LMI areas. In addition, Hospital Trust participated in local community development projects to improve LMI areas, including projects that emphasize affordable housing and job cre-ation. Examiners specifically found that Hospital Trust maintained a high level of participation in development and redevelopment programs in the local community, in-cluding projects sponsored by organizations such as The Business Development Corporation of Rhode Island, East Providence Housing Services, Inc., and Local Initiatives Support Corporation.25
Branch Closings. Bank of Boston has stated that it continues to evaluate whether branches in close proximity could be combined in the interest of efficiency without disrupting existing customer relationships or the ability of the combined organization to continue to serve its commu-nities, including LMI communities.26 The Board notes that
23. RICRA's comments primarily focus on data filed under the Home Mortgage Disclosure Act (12 U.S.C. § 2801 et seq.) ("HMDA") for RIHMFC's loan programs. These data were previously considered by the Board in connection with Bank of Boston's acquisition of Bank Vermont Corporation, Burlington, Vermont. See Bank of Boston Corporation, 75 Federal Reserve Bulletin 35 (1989) ("BankVermont Order"). RICRA also has provided updated HMDA data for RIHMFC's loan programs in selected census tracts. The Board notes that since the BankVermont Order, Hospital Trust has become one of RIHMFC's top three mortgage originators. In addition, Hospital Trust was a partner with RIHMFC in 1993 in introducing the "Opening Doors" program for minority first-time home buyers, and allocated $1 million to this program in 1993, 1994, and 1995. The Board also notes that HMDA data for 1993 and 1994 indicate that Hospital Trust compares favorably to its competitors in the percentage of loans originated to borrowers in LMI areas and individuals in its delineated community.
24. Examiners indicated that Hospital Trust's volume of residential mortgage, housing rehabilitation, home improvement, and small busi-ness loan originations or purchases was significant throughout Rhode Island.
25. Bank of Boston indicates that at least 30 percent of grants made by Hospital Trust are to non-profit community development organiza-tions that support local economic development and affordable housing initiatives, banking and credit education programs for consumers and small businesses, and other financing and technical assistance pro-grams.
26. In response to RICRA's concerns about branch closings in Rhode Island, Bank of Boston notes that BayBanks has no branches in
all branch closings resulting from this proposal would be subject to Bank of Boston's branch closing policy and the Joint Agency Policy Statement on Branch Closings ("Joint Policy Statement").27
Bank of Boston's Corporate Branch Closing Policy, particularly at FNBB and Hospital Trust, has been re-viewed by examiners and found to be satisfactory. Before proposing to close a branch, under this policy, Bank of Boston would evaluate whether it or BayBanks had other branches in the community, the plans of either institution to open additional offices (including supermarket branches) in the community, and other relevant factors. Bank of Boston also would consult with community leaders to determine ways to minimize any adverse impact of a branch closure. The Board also notes that any branch closings by Bank of Boston, particularly in LMI neighborhoods, would be as-sessed by examiners as part of the institution's CRA perfor-mance evaluation, and would be reviewed by the Board in future applications to acquire a depository facility.
Conclusion on the Convenience and Needs Factor. The Board has carefully considered the entire record in its review of the convenience and needs factor under the BHC Act. Based on all the facts of record, including information provided by Bank of Boston and the commenters in this case, CRA performance examinations and other informa-tion from the primary federal supervisors of Bank of Bos-ton and BayBanks, and for the reasons discussed above and in the South Boston Order, the Board concludes that the efforts of Bank of Boston and BayBanks to help meet the credit needs of all segments of the communities served, including LMI neighborhoods, are consistent with approv-al.28 In this light, the Board concludes that convenience
Rhode Island and that Hospital Trust has no plans to close any of its branches that serve LMI neighborhoods.
27. See section 228 of the Federal Deposit Insurance Corporation Improvement Act of 1991, which added a new section 42 to the Federal Deposit Insurance Act (12 U.S.C. § 1831r-l). See also Joint Policy Statement, 58 Federal Register 49,083 (1993). Under these provisions, all insured depository institutions are required to submit a notice of any proposed branch closing to the appropriate federal banking agency no later than 90 days before the date of closure that contains:
(1) The identity of the branch to be closed and the proposed closing date, (2) A detailed statement of the reasons for the decision to close the branch, and (3) Statistical or other information supporting the reasons, consis-tent with the institution's written policy for branch closings. Movement of branches within the same immediate neighborhood
that do not substantially affect the nature of the business or the customers served are considered consolidations or relocations under the Joint Policy Statement and, as such, do not require prior notice.
28. RICRA alleges that Hospital Trust charges higher fees for basic banking services than its competitors. Bank of Boston disputes this allegation and states that Hospital Trust has a competitive fee struc-ture that provides consumers, including residents in LMI areas, with various options to meet individual deposit and credit needs. The record indicates that Hospital Trust has an established record of providing a full range of banking services in its delineated communi-ties, including substantial lending services and a full range of retail banking services. Examiners noted, for example, that the bank offered low-cost basic banking services, did not charge for cashing govern-
Digitized for FRASER http://fraser.stlouisfed.org/ Federal Reserve Bank of St. Louis

Legal Developments 861
and needs considerations, including the CRA performance records of the companies and banks involved in this pro-posal, are consistent with approval.29
Other Considerations
Bank of Boston also has requested the Board's approval under section 4(c)(8) of the BHC Act to acquire BayBank FSB and thereby engage in the operation of a savings association pursuant to section 225.25(b)(9) of Regula-tion Y, and to increase its ownership interest in NYCE Corporation, a joint venture with other banking organiza-tions, that operates retail electronic funds transfer networks and engages in other data processing activities. The Board has determined that the operation of a savings association by a bank holding company is closely related to banking for purposes of section 4(c)(8) of the BHC Act.30 The Board also has determined that the activities of NYCE Corporation are closely related to banking within the mean-ing of section 4(c)(8) of the BHC Act.31 Bank of Boston has committed to conduct these activities in accordance with, and subject to the limitations of, the Board's regula-tions and orders approving these activities for bank holding companies.32
ment checks, and processed food stamps. The record also does not support the conclusion that the fees charged by Hospital Trust for checking accounts or other banking services are based in any way on a factor prohibited by law. Based on all the facts of record, RICRA's allegations regarding the bank's fees do not raise adverse consider-ations under the convenience and needs factor.
29. RICRA has requested that the Board hold a public meeting or hearing on the proposal and several of the individual commenters have expressed their interest in attending if such a hearing or meeting were scheduled. The Board notes that a hearing is required under section 3(b) of the BHC Act (12 U.S.C. § 1842(b)) only if the appro-priate supervisory authority for the bank to be acquired makes a timely written recommendation of denial. The subsidiary banks of BayBanks that would be acquired by Bank of Boston are national banks and the OCC has not recommended denial of this proposal. Generally, under the Board's Rules of Procedure, the Board may, in its discretion, hold a public meeting or hearing on an application to clarify factual issues related to the application and to provide an opportunity for testimony, if appropriate. 12 C.F.R. 252.3(e) and 262.25(d). All interested parties have had an opportunity to present their views and several commenters, including RICRA, have submit-ted comments that have been considered by the Board. On the basis of all the facts of record, the Board has determined that a public meeting or hearing is not necessary to clarify the factual record in this proposal or otherwise warranted in this case. Accordingly, RICRA's request for a public meeting or hearing on this matter is denied.
30. See 12 C.F.R. 225.25(b)(9). The Board requires savings associa-tions acquired by bank holding companies to conform their direct and indirect activities to those permissible for bank holding companies under section 4(c)(8) of the BHC Act and Regulation Y. Bank of Boston has committed that all activities of BayBank FSB will con-form to those requirements.
31. See The Bank of New York Company, Inc., et al., 80 Federal Reserve Bulletin 1107 (1994); 12 C.F.R. 225.25(b)(7).
32. Bank of Boston also has requested the Board's approval to acquire three inactive subsidiaries of BayBanks. Bank of Boston has committed that it will not reactivate these subsidiaries without the prior approval of the Federal Reserve System.
In order to approve this proposal, the Board also must determine that the acquisition of the nonbanking subsidiar-ies of BayBanks and the performance of the proposed activities by Bank of Boston "can reasonably be expected to produce benefits to the public . . . that outweigh possible adverse effects, such as undue concentration of resources, decreased or unfair competition, conflicts of interests, or unsound banking practices."33
Bank of Boston and BayBank FSB compete directly in the Boston, Massachusetts, banking market. As noted above, consummation of this proposal would not result in concentration levels in that market that would exceed the threshold standards of market concentration, as measured by the HHI under the DOJ Guidelines. Based on all the facts of record, the Board concludes that the acquisition of BayBank FSB by Bank of Boston would not result in any significantly adverse effects on competition or the concen-tration of banking resources in the Boston, Massachusetts, banking market or any other relevant banking market.
The Board also has further determined that the acquisi-tion of BayBank FSB and the increased investment in NYCE Corporation by Bank of Boston would not result in any significantly adverse effects, such as undue concentra-tion of resources, decreased or unfair competition, conflicts of interests, or unsound banking practices. Bank of Boston indicates that consummation of the proposed transaction would result in benefits to the public. In particular, the proposed transaction would combine the retail strength of BayBanks with the corporate and global banking opera-tions of Bank of Boston. The combined institution would be able to provide a large customer base with a broader range of products and services. In addition, Bank of Boston maintains that the proposal would improve the risk profile of the combined institution and achieve significant cost savings. Accordingly, the Board has determined that the balance of public interest factors it is required to consider under section 4(c)(8) of the BHC Act is favorable and consistent with approval.34
Conclusion
Based on the foregoing, including the commitments made to the Board by Bank of Boston in connection with this proposal, and in light of all the facts of record, the Board has determined that this proposal should be, and hereby is, approved. The Board's approval is specifically conditioned on compliance by Bank of Boston with all commitments made in connection with this proposal as well as the conditions discussed in this order.
The Board's determination on the nonbanking activities to be conducted by Bank of Boston is subject to all the conditions in the Board's Regulation Y, including those in
33. 12 U.S.C. § 1843(c)(8). 34. Bank of Boston also has provided notice of its intention to
establish a branch in the Cayman Islands, B.W.I., at the location of the current branch of BayBank MA under the Board's Regulation K (12 C.F.R. 211.3(a)(3)).
Digitized for FRASER http://fraser.stlouisfed.org/ Federal Reserve Bank of St. Louis

862 Federal Reserve Bulletin • September 1996
sections 225.7 and 225.23(g) (12 C.F.R. 225.7 and 225.23(g)), and to the Board's authority to require such modification or termination of the activities of a bank holding company or any of its subsidiaries as the Board finds necessary to assure compliance with or to prevent evasion of the provisions and purposes of the BHC Act and the Board's regulations and orders issued thereunder. The commitments and conditions relied on by the Board in reaching this decision are deemed to be conditions im-posed in writing by the Board in connection with its findings and decision, and as such may be enforced in proceedings under applicable law.
The acquisition of the subsidiary banks of BayBanks shall not be consummated before the fifteenth calendar day after the effective date of this order, and the banking and nonbanking transactions shall not be consummated later than three months after the effective date of this order, unless such period is extended for good cause by the Board, or by the Federal Reserve Bank of Boston, acting pursuant to delegated authority.
By order of the Board of Governors, effective July 10, 1996.
Connecticut
Hartford Hartford RMA plus the Windham County township of Ashford, the Hartford County township of Hartland, and the Tolland County township of Union
Rhode Island
Providence Providence-Warwick RMA plus the towns of Charlestown and West Green-wich
ORDERS ISSUED UNDER INTERNATIONAL BANKING ACT
CBG Compagnie Bancaire Geneve Geneva, Switzerland
Order Approving Establishment of a Representative Office
Voting for this action: Chairman Greenspan and Governors Kelley, Lindsey, Yellen, and Meyer. Absent and not voting: Vice Chair Rivlin and Governor Phillips.
JENNIFER J. JOHNSON Deputy Secretary of the Board
Appendix
Description of Local Banking Markets in Which Bank of Boston and BayBanks Compete
Massachusetts
Amherst-Northampton
Boston
Cape Cod New Bedford
Springfield
Taunton Worcester
Amherst Ranally Metropolitan Area ("RMA") plus Northampton RMA plus the towns of Chesterfield, Cummington, Deerfield, Goshen, Plainfield, Shutesbury, Westhampton, and Whaley Boston RMA plus the New Hampshire towns of Greenville, Lyndeboro, Mason, and New Ipswich Barnstable County New Bedford RMA plus the town of Wareham Springfield RMA plus the towns of Blandford, Chester, Granville, Hardwick, Otis, Tolland, Ware, Warren, and Worth-ington Taunton RMA Worcester RMA plus the towns of Hub-bardston, New Braintree, Oakham, and West Brookfield
CBG Compagnie Bancaire Geneve ("Bank"), Geneva, Switzerland, a foreign bank within the meaning of the International Banking Act ("IBA"), has applied under sec-tion 10(a) of the IBA (12 U.S.C. § 3107(a)) to establish a representative office in Miami, Florida. The Foreign Bank Supervision Enhancement Act of 1991 ("FBSEA"), which amended the IBA, provides that a foreign bank must obtain the approval of the Board to establish a representative office in the United States. Notice of the application, afford-ing interested persons an opportunity to submit comments, has been published in a newspaper of general circulation in Miami, Florida (The Miami Herald, January 4, 1996). The time for filing comments has expired, and all comments have been considered.
Bank, with total consolidated assets of approximately $288 million,1 provides private banking and related com-mercial banking services from offices in Switzerland. Banque Cantonale de Geneve, Geneva, Switzerland ("Banque Cantonale"), owns 40 percent of the shares of Bank.2 The remaining shares are controlled by two individ-uals who together own directly and indirectly 60 percent of the shares of Bank.3
1. Asset data are as of December 31, 1995. 2. The Canton of Geneva, the City of Geneva and 44 municipalities
located in the Canton of Geneva own all of the registered shares of Banque Cantonale, representing more than 82 percent of the voting rights of Banque Cantonale. The remaining shares of Banque Canto-nale, representing less than 18 percent of voting rights, are held in bearer form.
3. Mr. Rene de Picciotto owns directly 7.6 percent of the shares of Bank, and an additional 34.7 percent through Covest Holding, S.A., Luxembourg ("Covest"), a company wholly owned by Mr. de Pic-ciotto. Mr. Philippe Setton holds directly 3.4 percent of the shares of Bank, and another 14.3 percent through Phos Holding S.A., Luxem-bourg ("Phos"), a company wholly owned by Mr. Setton.
Digitized for FRASER http://fraser.stlouisfed.org/ Federal Reserve Bank of St. Louis

Legal Developments 863
Bank operates two branches and one nonbanking subsid-iary in Switzerland and a representative office in London, England. Bank provides asset management and investment advisory services, primarily to customers who reside out-side Switzerland, and also engages in foreign exchange operations and precious metals trading. Bank's primary purpose for establishing the proposed representative office is to provide enhanced service to its existing customers in South America and the Caribbean and to facilitate the expansion of its private banking business in those markets. The proposed representative office would perform repre-sentational and administrative functions related to Bank's private banking activities at the direction of Bank's head office in Geneva.
In acting on an application to establish a representative office, the IBA and Regulation K provide that the Board shall take into account whether the foreign bank engages directly in the business of banking outside of the United States and has furnished to the Board the information it needs to assess the application adequately. The Board also shall take into account whether the foreign bank and any foreign bank parent is subject to comprehensive supervi-sion or regulation on a consolidated basis by its home country supervisor (12 U.S.C. § 3105(d)(2); 12 C.F.R. 211.24). The Board may also take into account additional standards as set forth in the IBA and Regulation K (12 U.S.C. § 3105(d)(3)-(4); 12 C.F.R. 211.24(c)).
The Board previously has stated that the standards that apply to the establishment of a branch or agency need not in every case apply to the establishment of a representative office, because representative offices do not engage in a banking business and cannot take deposits or make loans.4
In evaluating an application to establish a representative office under the IBA and Regulation K, the Board will take into account the standards that apply to the establishment of branches and agencies, subject generally to the follow-ing considerations. With respect to supervision by home country authorities, a foreign bank that proposes to estab-lish a representative office should be subject to a significant degree of supervision by its home country supervisor.5 A foreign bank's financial and managerial resources will be reviewed to determine whether its financial condition and performance demonstrate that it is capable of complying with applicable laws and has an operating record that would be consistent with the establishment of a representa-tive office in the United States. Finally, all foreign banks, whether operating through branches, agencies or represen-tative offices, will be required to provide adequate assur-ances of access to information on the operations of the bank and its affiliates necessary to determine compliance with U.S. laws.
Mr. de Picciotto and Mr. Setton are parties to an agreement among the shareholders of Bank.
4. See 58 Federal Register 6348, 6351 (1993). 5. See Citizens National Bank, 79 Federal Reserve Bulletin 805
(1993). See also Promstroybank of Russia, 82 Federal Reserve Bulle-tin 599 (1996) (addressing standards applicable to representative offices with limited activities).
In this case, the Board has considered the following information with respect to the issue of supervision by home country authorities. Bank is supervised and regulated by the Swiss Federal Banking Commission ("SFBC"). The SFBC is responsible for the prudential supervision and regulation of credit institutions. The Board previously has determined, in connection with an application involving another Swiss bank, Coutts & Co., AG ("Coutts"), that Coutts was subject to home country supervision on a consolidated basis.6 Based on the information provided by Bank and the SFBC, the Board has determined that Bank is subject to substantially similar supervision by the SFBC. Consequently, based on all the facts of record, the Board has determined that factors relating to the supervision of Bank by its home country supervisor are consistent with approval of the proposed representative office.
The Board also has taken into account the additional standards set forth in section 7 of the IBA (see 12 U.S.C. § 3105(d)(3)-(4); 12 C.F.R. 211.24(c)(2)). The SFBC has
indicated that it has no objection to the establishment of the proposed representative office.
With respect to the financial and managerial resources of Bank, taking into consideration Bank's record of opera-tions in its home country, its overall financial resources, and its standing with its home country supervisors, the Board also has determined that financial and managerial factors are consistent with approval of the proposed repre-sentative office. Bank appears to have the experience and capacity to support the proposed representative office and also has established controls and procedures for the pro-posed representative office to ensure compliance with U.S. law.
Finally, with respect to access to information about Bank's operations, the Board has reviewed the restrictions on disclosure under applicable law, and has communicated with relevant government authorities about access to infor-mation. Bank, Banque Cantonale, Covest and Phos have committed to make available to the Board such informa-tion on the operations of Bank and any affiliate of Bank that the Board deems necessary to determine and enforce compliance with the IBA, the Bank Holding Company Act, as amended, and other applicable federal law. To the extent that the provision of such information may be prohibited by law, Bank, Banque Cantonale, Covest and Phos have committed to cooperate with the Board to obtain any necessary consents or waivers that might be required from third parties for disclosure. In addition, subject to certain conditions, the SFBC may share information on Bank's operations with other supervisors, including the Board. In light of these commitments and other facts of record, and subject to the condition described below, the Board con-cludes that Bank has provided adequate assurances of
6. See Coutts & Co., AG, 79 Federal Reserve Bulletin 636 (1993). See also Union Bank of Switzerland, 82 Federal Reserve Bulletin 370 (1996); Swiss Bank Corporation, 82 Federal Reserve Bulletin 690 (1996).
Digitized for FRASER http://fraser.stlouisfed.org/ Federal Reserve Bank of St. Louis

864 Federal Reserve Bulletin • September 1996
access to any necessary information the Board may re-quest.
On the basis of all the facts of record, and subject to the commitments made by Bank, as well as the terms and conditions set forth in this order, the Board has determined that Bank's application to establish a representative office should be, and hereby is, approved. Should any restrictions on access to information on the operations or activities of Bank and its affiliates subsequently interfere with the Board's ability to obtain information to determine and enforce compliance by Bank or its affiliates with applicable Federal statutes, the Board may require termination of any of the Bank's direct or indirect activities in the United States. Approval of the application is also specifically conditioned on Bank's compliance with the commitments made in connection with the application and with the conditions in this order.7 The commitments and conditions referred to above are conditions imposed in writing by the
Board in connection with its decision, and may be enforced in proceedings under 12 U.S.C. § 1818 or 12 U.S.C. § 1847 against Bank, its offices, and its affiliates.
By order of the Board of Governors, effective July 29, 1996.
Voting for this action: Chairman Greenspan, Vice Chair Rivlin, and Governors Kelley, Lindsey, Phillips, Yellen, and Meyer.
JENNIFER J. JOHNSON Deputy Secretary of the Board
7. The Board's authority to approve the establishment of the pro-posed representative office parallels the continuing authority of the Florida Department of Banking and Finance to license offices of a foreign bank. The Board's approval of the application does not supplant the authority of the State of Florida, and its agent, the Florida Department of Banking and Finance, to license the proposed represen-tative office of Bank in accordance with any terms or conditions that the State of Florida may impose.
APPLICATIONS APPROVED UNDER BANK HOLDING COMPANY ACT
By the Secretary of the Board
Recent applications have been approved by the Secretary of the Board as listed below. Copies are available upon request to the Freedom of Information Office, Office of the Secretary, Board of Governors of the Federal Reserve System, Washington, D.C. 20551.
Section 3
Applicant(s) Bank(s) Effective Date
CU Bancorp, Encino, California
First United Banc shares, Inc. El Dorado, Arkansas
Old National Bancorp, Evansville, Indiana
Home Interstate Bancorp, Signal Hill, California
Home Bank, Signal Hill, California
Carlisle Bancshares, Inc., Little Rock, Arkansas
Citizens Bank and Trust Company, Carolisle, Arkansas
First Bank of Arkansas, Brinkley, Arkansas
Hazen First State Bank, Hazen, Arkansas
Workingmens Capital Holdings, Inc., Bloomington, Indiana
Workingmens Federal Savings Bank, Bloomington, Indiana
July 24, 1996
July 1, 1996
July 12, 1996
Digitized for FRASER http://fraser.stlouisfed.org/ Federal Reserve Bank of St. Louis

Legal Developments 865
By Federal Reserve Banks
Recent applications have been approved by the Federal Reserve Banks as listed below. Copies are available upon request to the Reserve Banks.
Section 3
Applicant(s) Bank(s) Reserve Bank Effective Date
ABC Bancorp, Central Bankshares, Inc., Atlanta July 5, 1996 Moultrie, Georgia Cordele, Georgia
Central Bank & Trust, Cordele, Georgia
ABC Bancorp, First National Financial Corporation, Atlanta July 18, 1996 Moultrie, Georgia Albany, Georgia
First National Bank of South Georgia, Albany, Georgia
Appalachian Bancshares, Inc., Gilmer County Bank, Atlanta July 24, 1996 Ellijay, Georgia Ellijay, Georgia
Arkansas Banking Company, Mercantile Bank of Batesville, N.A., St. Louis July 18, 1996 Jonesboro, Arkansas Batesville, Arkansas
Bancorp of Lucedale, Inc., Bank of Lucedale, Atlanta June 28, 1996 Lucedale, Mississippi Lucedale, Mississippi
Bradford Bancorp, Inc., The Bradford National Bank of St. Louis July 10, 1996 Greenville, Illinois Greenville,
Greenville, Illinois Carroll County Bancorporation, Inc., Nevada Community Bancshares, Inc., Chicago July 12, 1996
Carroll, Iowa Nevada, Iowa Centura Banks, Inc., First Community Bank, Richmond July 19, 1996
Rocky Mount, North Carolina Gastonia, North Carolina Dartmouth Capital Group, Inc., SC Acquisition Corp., San Francisco July 22, 1996
Encinitas, California Huntington Beach, California Dartmouth Capital Group, L.P.,
Encinitas, California Duke Financial Group, Inc., Inland Empire National Bank, Minneapolis June 21, 1996
St. Paul, Minnesota Riiverside, California Farmers State Bancshares, Inc., Farmers State Bank, Chicago July 25, 1996
Mason City, Iowa Northwood, Iowa First Banking Company of FNB Bancshares, Inc., Atlanta July 18, 1996
Southeast Georgia, Springfield, Georgia Statesboro, Georgia
First Fidelity Bancorp, Inc., Comban Shares, Inc., Kansas City July 24, 1996 Oklahoma City, Oklahoma Warr Acres, Oklahoma
First Financial Corporation, Crawford Bancorp, Inc., Chicago June 25, 1996 Terre Haute, Indiana Robinson, Illinois
First La Grange Bancshares, Inc., LGF Bancshares, Inc., Dallas June 21, 1996 La Grange, Texas Dover, Delaware
The First National Bank of La Grange, La Grange, Texas
First National Banc, Inc., First National Bank, Atlanta July 18, 1996 St. Marys, Georgia St. Marys, Georgia
First Savings Bank of Washington Inland Empire Bank, San Francisco June 28, 1996 Bancorp, Inc., Hermiston, Oregon Walla Walla, Washington
FNB Corporation, Southwest Banks, Inc., Cleveland July 12, 1996 Hermitage, Pennsylvania Naples, Florida
Digitized for FRASER http://fraser.stlouisfed.org/ Federal Reserve Bank of St. Louis

866 Federal Reserve Bulletin • September 1996
Section 3—Continued
Applicant(s) Bank(s) Reserve Bank Effective Date
Frontier Financial Corporation, Everett, Washington
The M.B. and I.M. Hampton Family Partnership, Ltd., Mt. Pleasant, Texas
Hills Bancorporation, Hills, Iowa
HNB Corporation, Arkansas City, Kansas
HUB CO, Inc., Mahwah, New Jersey
Inter-Mountain Bancorp, Inc., Bozeman, Montana
Landmark Financial Group, Inc., Belvidere, Illinois
LGF Bancshares, Inc., Dover, Delaware
LNB Financial Corp., Dover, Delaware
Magnolia Midlands Bankshares, Inc., Eastman, Georgia
MainS treet BankGroup Incorporated, Martinsville, Virginia
Mercantile Bancorp, Inc., Hammond, Indiana
Meriwether Bank Shares, Inc., Greenville, Georgia
Nevada Community Bancshares, Inc., Nevada, Iowa
Paris Bancshares, Inc., Paris, Texas
Pembroke Bancshares, Inc., Kansas City, Missouri
Union Bancshares, Inc., Kansas City, Missouri
Peterka Family Partnership, Miller, South Dakota
Platte Valley Banc, Inc., Scottsbluff, Nebraska
SC Acquisition Corp., Huntington Beach, California
Washington Banking Corporation, Oak Harbor, Washington
Morris County Bankshares, Inc., Naples, Texas
Morris County National Bank, Naples, Texas
Hills Bank Kalona, Kalona, Iowa
Home National Bank, Scottsdale, Arizona
Hometown Bancorporation, Inc., Darien, Connecticut
The Bank of Darien, Darien, Connecticut
First Security Bank of Belgrade, Belgrade, Montana
Alpine Bancorporation, Inc., Rockford, Illinois
Alpine Bank of Illinois, Rockford, Illinois
The First National Bank of La Grange, La Grange, Texas
The Liberty National Bank in Paris, Paris, Texas
Bank of Eastman, Eastman, Georgia
The First National Bank of Clifton Forge, Clifton Forge, Virginia
First Lansing Bancorp, Inc., Lansing, Illinois
The Greenville Banking Company, Greenville, Georgia
Community Bank, Nevada, Iowa
LNB Financial Corp., Dover, Delaware
The Liberty National Bank in Paris, Paris, Texas
Missouri Valley Bancshares, Inc., Kansas City, Missouri
M&H Financial Services, Inc., Miller, South Dakota
Platte Valley National Bank, Scottsbluff, Nebraska
Commerce Security Bank, Sacramento, California
SDN Bancorp, Inc., Encinitas, California
San Francisco July 9, 1996
Dallas July 17, 1996
Chicago July 10, 1996
Kansas City July 16, 1996
New York July 19, 1996
Minneapolis July 9, 1996
Chicago July 23, 1996
Dallas June 21, 1996
Dallas July 2, 1996
Atlanta June 25, 1996
Richmond July 19, 1996
Chicago June 21, 1996
Atlanta July 25, 1996
July 12, 1996
Dallas July 2, 1996
July 16, 1996
Minneapolis July 23, 1996
Kansas City July 8, 1996
San Francisco July 22, 1996
Digitized for FRASER http://fraser.stlouisfed.org/ Federal Reserve Bank of St. Louis

Legal Developments 867
Section 3—Continued
Applicant(s) Bank(s) Reserve Bank Effective Date
Texas Financial Bancorporation, Inc., Minneapolis, Minnesota
Thera Holding Partners, Ltd., Houston, Texas
TIB Financial Corp., Key Largo, Florida
UnionBancorp, Inc., Streator, Illinois
Prairie Bancorp, Inc., Princeton, Illinois
Union Bancorp, Inc., Bowling Green, Virginia
United Community Bankshares, Inc., Franklin, Virginia
Vogel Bancshares, Inc., Orange City, Iowa
Community Bank of Arizona, Wickenburg, Arizona
Citizens Bankers, Inc., Baytown, Texas
Citizens Banks of Delaware, Inc., Wilmington, Delaware
Baytown State Bank, Baytown, Texas
Citizens Bank & Trust Company, Baytown, Texas
Pasadena State Bank, Pasadena, Texas
TIB Bank of the Keys, Key Largo, Florida
Country Bancshares, Inc., Hull, Illinois
King George State Bank, Inc., King Georgia, Virginia
The Bank of Franklin, Franklin, Virginia
The Bank of Sussex and Surry, Wakefield, Virginia
Ireton Bancorp, Ireton, Iowa
Security Savings Bank, Ireton, Iowa
Dallas
Dallas
Chicago
June 21, 1996
July 5, 1996
Atlanta June 24, 1996
Chicago June 28, 1996
Richmond July 25, 1996
Richmond July 10, 1996
July 3, 1996
Section 4
Applicant(s) Nonbanking Activity/Company Reserve Bank Effective Date
BancFirst Ohio Corp., Zanesville, Ohio
Bankers Trust New York Corporation, New York, New York
Canadian Imperial Bank of Commerce, Toronto, Ontario, Canada
Canadian Imperial Holdings Inc. New York, New York
Capital Corp of the West, Merced, California
County Savings Bank, Newark, Ohio
Wolfensohn & Co., Inc., New York, New York
Fuji-Wolfensohn International, New York, New York
BT Securities Corporation, New York, New York
CIBC Inc., New York, New York
Town and Country Finance and Thrift Company, Turlock, California
Cleveland
New York
New York
San Francisco
July 12, 1996
July 19, 1996
June 27, 1996
June 28, 1996
Digitized for FRASER http://fraser.stlouisfed.org/ Federal Reserve Bank of St. Louis

868 Federal Reserve Bulletin • September 1996
Section 4—Continued
Applicant(s) Nonbanking Activity/Company Reserve Bank Effective Date
FBOP Corporation, Torrance Bank, S.S.B., Chicago June 26, 1996 Oak Park, Illinois Torrance, California
Regency Savings Bank, F.S.B., Naperville, Illinois
FCFT, Inc., South Oakwood Plaza Limited Richmond July 16, 1996 Princeton, West Virginia Partnership, III,
Princeton, West Virginia First Southern Bancshares, Inc., American Financial Mortgage Corp., Atlanta July 22, 1996
Lithonia, Georgia Decatur, Georgia FSB Mortgage Services, Inc.,
Lithonia, Georgia Friendship Bancorp, Independent Bankers Life Insurance Chicago July 5, 1996
Friendship, Indiana Company of Indiana, Phoenix, Arizona
Gulf West Banks, Inc., Liberty Leasing Corporation, Atlanta July 25, 1996 St. Petersburg, Florida Tampa, Florida
Hinsbrook Bancshares, Inc., Northrn Illinois Financial Services, Chicago July 23, 1996 Willowbrook, Illinois LLC,
Hinsbrook Bank and Trust, Willowbrook, Illinois Willowbrook, Illinois Serve Corps Mortgage Services, LLC,
Downers Grove, Illinois J.P. Morgan & Co., Incorporated, J.P. Morgan Trust Company of Illinois, New York July 1, 1996
New York, New York Chicago, Illinois Libertyville Bancorp, Inc., To engage in making and servicing Chicago July 11, 1996
Lake Forest, Illinois loans Marshall & Ilsley Corporation, EastPoint Technology, Inc., Chicago July 19, 1996
Milwaukee, Wisconsin Bedford, New Hampshire Middle Georgia Bankshares, Inc., Prolmage, Inc., Atlanta July 12, 1996
Unadilla, Georgia Macon, Georgia Macon Bank & Trust,
Macon, Georgia Provesa, Inc.,
Macon, Georgia MidSouth Bancorp, Inc., Financial Services of the South, Inc., Atlanta June 27, 1996
Lafayette, Louisiana Lafayette, Louisiana Nationsbank Corporation Commerce Finance Company, Richmond June 24, 1996
Charlotte, North Carolina Germantown, Tennessee NationsBank Corporation, TAC Bancshares, Inc., Richmond June 27, 1996
Charlotte, North Carolina Miami, Florida NationsCredit Consumer
Corporation, Allentown, Pennsylvania
NB Holdings Corporation, Chase Federal Bank, FSB, Charlotte, North Carolina Miami, Florida
Newnan Holdings, Inc., Newnan Financial Services, Inc., Atlanta June 28, 1996 Newnan, Georgia Newnan, Georgia
Citizens Mortgage Group, Inc., Newnan, Georgia
Norwest Corporation, DUMAE Insurance Agency, Inc., Minneapolis July 9, 1996 Minneapolis, Minnesota Dell Rapids, South Dakota
Digitized for FRASER http://fraser.stlouisfed.org/ Federal Reserve Bank of St. Louis

Legal Developments 869
Section 4—Continued
Applicant(s) Nonbanking Activity/Company Reserve Bank Effective Date
Otto Bremer Foundation, St. Paul, Minnesota
Bremer Financial Corporation, St. Paul, Minnesota
Palos Bancshares, Inc., Palos Heights, Illinois
Palos Bank and Trust Company, Palos Heights, Illinois
Santa Barbara Bancorp, Santa Barbara, California
Societe Generale, Paris, France
Southeast Bancorp of Texas, Inc., Winnie, Texas
Southwest Financial Group of Iowa, Inc., Red Oak, Iowa
Star Banc Corporation, Cincinnati, Ohio
Summit Financial Corporation, Greenville, South Carolina
Summit Financial Corporation, Greenville, South Carolina
Synovus Financial Corp., Columbus, Georgia
TB&C Bancshares, Inc., Columbus, Georgia
B&C Bancshares, Inc., Columbus, Georgia
UnionBancorp, Inc., Streator, Illinois
WesBanco, Inc., Wheeling, West Virginia
West Coast Bancorp, Lake Oswego, Oregon
To engage de novo in making, acquiring, and servicing loans and other extensions of credit; and leasing personal and real property
Northern Illinois Financial Services, LLC, Willowbrook, Illinois
Serve Corps Mortgage Services, LLC, Downers Grove, Illinois
To engage de novo directly in community development activities
To engage de novo in making equity and debt investments in corporations or projects designed primarily to promote community welfare
Bonnet Finance Corporation, Winnie, Texas
To engage de novo in making and servicing loans
DJJ Leasing Ltd., Cincinnati, Ohio
Academy Finance, Inc., Lake City, South Carolina
Berkeley Loans, Inc., Moncks Corner, South Carolina
Canterbury Trust Company, Birmingham, Alabama
LaSalle County Collections, Inc. Ottawa, Illinois
WesBanco Mortgage Company, Wheeling, West Virginia
Universal Mortgage Company, Bridgeport, West Virginia
West Coast Trust Company, Inc. Salem, Oregon
Minneapolis
Chicago
San Francisco
New York
Dallas
Chicago
Cleveland
Richmond
Richmond
Atlanta
Chicago
Cleveland
July 5, 1996
July 23, 1996
June 19, 1996
July 10, 1996
July 12, 1996
June 26, 1996
July 10, 1996
July 17, 1996
June 20, 1996
July 10, 1996
July 16, 1996
July 18, 1996
San Francisco July 10, 1996
Sections 3 and 4
Applicant(s) Nonbanking Activity/Company Reserve Bank Effective Date
Finlayson Bancshares, Inc., Finlayson, Minnesota
Wood Lake Bancorporation, Wood Lake, Minnesota
Minneapolis July 12, 1996
Digitized for FRASER http://fraser.stlouisfed.org/ Federal Reserve Bank of St. Louis

870 Federal Reserve Bulletin • September 1996
APPLICATIONS APPROVED UNDER BANK MERGER ACT
By the Secretary of the Board
Recent applications have been approved by the Secretary of the Board as listed below. Copies are available upon request to the Freedom of Information Office, Office of the Secretary, Board of Governors of the Federal Reserve System, Washington, D.C. 20551.
Applicant(s) Bank(s) Effective Date
Home Bank, California United Bank, N.A., July 24, 1996 Signal Hill, California Encino, California
APPLICATIONS APPROVED UNDER BANK MERGER ACT By Federal Reserve Banks
Recent applications have been approved by the Federal Reserve Banks as listed below. Copies are available upon request to the Reserve Banks.
Applicant(s) Bank(s) Reserve Bank Effective Date
Centura Bank, Rocky Mount, North Carolina
DeMotte State Bank, DeMotte, Indiana
F & M Bank-Hallmark, Springfield, Virginia
Silsbee State Bank, Silsbee, Texas
Tri-City Bank & Trust Company, Blountville, Tennessee
First Community Bank, Gastonia, North Carolina
NBD Bank, N.A., Indianapolis, Indiana
F & M Bank-Potomac, Herndon, Virginia
Fairfax Bank & Trust Company, Fairfax, Virginia
First Bank of Texas, Tomball, Texas
National Bank of Commerce, Memphis, Tennessee
Richmond
Chicago
Richmond
Dallas
Atlanta
July 19, 1996
July 23, 1996
July 10, 1996
July 11, 1996
July 18, 1996
PENDING CASES INVOLVING THE BOARD OF GOVERNORS
This list of pending cases does not include suits against the Federal Reserve Banks in which the Board of Governors is not named a party.
Long v. Board of Governors, No. 96-9526 (10th Cir., filed July 31, 1996). Petition for review of Board order dated July 2, 1996, assessing a civil money penalty and cease and desist order for violations of the Bank Holding Company Act.
Esformes v. Board of Governors, No. 96-1916 (S.D. Fla., filed July 12, 1996). Complaint challenging Board denial of administrative request for confidential supervisory informa-tion. On July 12, 1996, plaintiffs moved for an expedited hearing on the complaint.
Board of Governors v. Interamericas Investments, Ltd., No. 96-7108 (D.C. Cir., filed June 14, 1996). Appeal of district court ruling granting, in part, the Board's application to enforce an adminstrative investigatory subpoena for docu-ments and testimony. Appellants filed a motion for a stay of
the district court ruling on July 17, 1996; the Board's opposition was filed on July 23, 1996.
Interamericas Investments, Ltd. v. Board of Governors, No. 96-60326 (5th Cir., filed May 8, 1996). Petition for review of order imposing civil money penalties and cease and desist order in enforcement case. Petitioners' brief was filed on July 26, 1996.
Kuntz v. Board of Governors, No. 96-1137 (D.C. Cir., filed April 25, 1996). Petition for review of a Board order dated March 25, 1996, approving an application by CoreStates Financial Corp., Philadelphia, Pennsylvania to acquire Me-ridian Bancorp, Inc., Reading, Pennsylvania. The Board's motion to dismiss was filed on June 3, 1996.
Kuntz v. Board of Governors, No. 96-1079 (D.C. Cir., filed March 7, 1996). Petition for review of a Board order dated February 7, 1996, approving applications by The Fifth Third Bank, Cincinnati, Ohio, and he Firth Third Bank of Columbus, Columbus, Ohio, to acquire certain assets and assume certain liabilities of 25 branches of NBD Bank, Columbus, Ohio. Petitioner has moved to consolidate the
Digitized for FRASER http://fraser.stlouisfed.org/ Federal Reserve Bank of St. Louis

Legal Developments 871
case with Kuntz v. Board of Governors, No. 95-1495. On April 8, 1996, the Board filed a motion to dismiss the action.
Henderson v. Board of Governors, No. 96-1054 (D.C. Cir., filed February 16, 1996). Petition for review of a Board order dated January 17, 1996, approving the merger of First Citizens BancShares, Inc., Raleigh, North Carolina, with Allied Bank Capital, Inc., Sanford, North Carolina. Petition-ers' motion for a stay was denied on March 7, 1996.
Research Triangle Institute v. Board of Governors, No. 1:96CV00102 (M.D.N.C., filed February 12, 1996). Con-tract dispute. On May 3, 1996, the Board filed a motion to dismiss the action.
Inner City Press/Community on the Move v. Board of Gover-nors, No. 96-4008 (2nd Cir., filed January 19, 1996). Peti-tion for review of a Board order dated January 5, 1996, approving the applications and notices by Chemical Bank-ing Corporation to merge with The Chase Manhattan Cor-poration, both of New York, New York, and by Chemical Bank to merge with The Chase Manhattan Bank, N.A., both of New York, New York. Petitioners' motion for an emer-gency stay of the transaction was denied following oral argument on March 26, 1996. The case has been consoli-dated for oral argument and decision with Lee v. Board of Governors, No. 95-4134 (2d Cir.).
Menick v. Greenspan, No. 95-CV-01916 (D. D.C., filed Octo-ber 10, 1995). Complaint alleging sex, age, and handicap discrimination in employment.
Kuntz v. Board of Governors, No. 95-1495 (D.C. Cir., filed September 21, 1995). Petition for review of Board order dated August 23, 1995, approving the applications of The Fifth Third Bank, Cincinnati, Ohio, to acquire certain assets and assume certain liabilities of 12 branches of PNC Bank, Ohio, N.A., Cincinnati, Ohio, and to establish certain branches. The Board's motion to dismiss was filed on October 26, 1995.
Lee v. Board of Governors, No. 95-4134 (2nd Cir., filed August 22, 1995). Petition for review of Board orders dated July 24, 1995, approving certain steps of a corporate reorga-nization of U.S. Trust Corporation, New York, New York, and the acquisition of U.S. Trust by Chase Manhattan Corporation, New York, New York. On September 12, 1995, the court denied petitioners' motion for an emergency stay of the Board's orders. The Board's brief was filed on April 16, 1996.
Beckman v. Greenspan, No. 95-35473 (9th Cir., filed May 4, 1995). Appeal of dismissal of action against Board and others seeking damages for alleged violations of constitu-tional and common law rights. The appellants' brief was filed on June 23, 1995; the Board's brief was filed on July 12, 1995.
Money Station, Inc. v. Board of Governors, No. 95-1182 (D.C. Cir., filed March 30, 1995). Petition for review of a Board order dated March 1, 1995, approving notices by Bank One Corporation, Columbus, Ohio; CoreStates Finan-cial Corp., Philadelphia, Pennsylvania; PNC Bank Corp., Pittsburgh, Pennsylvania; and KeyCorp, Cleveland, Ohio, to acquire certain data processing assets of National City
Corporation, Cleveland, Ohio, through a joint venture sub-sidiary. On April 23, 1996, the court vacated the Board's order. On July 31, 1996, the full court granted the Board's suggestion for rehearing in banc, and vacated the April 23 panel decision.
In re Subpoena Duces Tecum, Misc. No. 95-06 (D.D.C., filed January 6, 1995). Action to enforce subpoena seeking pre-decisional supervisory documents sought in connection with an action by Bank of New England Corporation's trustee in bankruptcy against the Federal Deposit Insurance Corpora-tion. The Board filed its opposition on January 20, 1995. Oral argument on the motion was held July 14, 1995.
Board of Governors v. Pharaon, No. 91-CIV-6250 (S.D. New York, filed September 17, 1991). Action to freeze assets of individual pending administrative adjudication of civil money penalty assessment by the Board. On September 17, 1991, the court issued an order temporarily restraining the transfer or disposition of the individual's assets.
FINAL ENFORCEMENT DECISIONS ISSUED BY THE BOARD OF GOVERNORS
In the Matter of
Cedar Vale Bank Holding Company, Inc., Wellington, Kansas
Docket Nos.
91-027-B-HC 91-027-B-I1 91-027-CMP-I1
Final Decision and Order
This is an administrative proceeding initiated by the Board of Governors of the Federal Reserve System (the "Board") on February 7, 1994, by the issuance of a Notice of Charges and of Hearing Pursuant to Section 8(b) of the Federal Deposit Insurance Act, as Amended ("FDI Act"), and Notice of Assessment of Civil Money Penalty Pursu-ant to Section 8(b) of the Bank Holding Company Act, as Amended (the "BHC Act") (the "Notice") against Cedar Vale Bank Holding Company, Inc., Wellington, Kansas ("Cedar Vale") and W.C. Long, Jr. ("Long"), Cedar Vale's chairman, president and sole shareholder.1 The Notice al-leged that Cedar Vale, at Long's direction, violated sec-tions 3(a)(1) and 4 of the BHC Act, and Regulation Y (12 C.F.R. Part 225), by its unlawful acquisition of Sumner County Bancshares, Inc. ("Sumner County"), its subsid-iary bank, the Bank of Commerce and Trust Company (the
1. The Notice of Assessment of Civil Money Penalty was also issued against James J. Long ("J. Long"), Cedar Vale's attorney and W.C. Long's son. On June 12, 1995, J. Long consented to the issuance of an Order of Assessment of Civil Money Penalty in settlement of the Board's proceeding against him.
Digitized for FRASER http://fraser.stlouisfed.org/ Federal Reserve Bank of St. Louis

872 Federal Reserve Bulletin • September 1996
"Bank"), and Tri-County Financial Corporation ("Tri-County"), an insurance agency. The Notice sought the entry of a cease and desist order prohibiting Long and Cedar Vale from further violations of law and requiring Cedar Vale and Long to correct Cedar Vale's violations by reversing the unauthorized acquisitions, and sought a $300,000 civil money penalty from Long.
Upon review of the administrative record, including all post-hearing submissions of the parties, the Board hereby makes its Final Decision, assessing a civil money penalty against Long in the amount of $717,941 and ordering that Long be prohibited from future violations of the BHC Act.
Procedural History
Following the issuance of the Notice, Board Enforcement Counsel ("Enforcement Counsel") and Respondents filed cross-motions for summary disposition. On February 21, 1994, Administrative Law Judge Walter J. Alprin (the "ALJ") issued a partial summary disposition order in favor of Enforcement Counsel finding that Cedar Vale violated section 3 of the BHC Act and Regulation Y by acquiring Sumner County and the Bank without Board approval and section 4 of the BHC Act and Regulation Y by retaining control of Tri-County without Board approval. The ALJ further found that Long caused Cedar Vale's violations of the BHC Act and Regulation Y. The ALJ recommended summary disposition on the cease and desist relief sought in the Notice, but found that there were issues of fact regarding the assessment of a civil money penalty that required adjudication at hearing.
Thereafter, a formal adjudicatory hearing to determine the appropriateness and amount of a penalty was held before the ALJ in Wichita, Kansas from June 12-15, 1995. After receiving the parties' post-hearing briefs, the ALJ issued his Recommended Decision on November 21, 1995, including his proposed Findings of Fact and Conclusions of Law. The Recommended Decision incorporated the findings of the ALJ's summary disposition order that Ce-dar Vale violated the BHC Act and that Long caused such violations. Based on his finding that Long had received a benefit of at least $567,941 as a result of the violations, the ALJ recommended a civil money penalty in the amount of $717,941.
The ALJ also recommended that a cease and desist order be issued prohibiting Cedar Vale and Long from further violations of the BHC Act. The ALJ did not recommend a reversal of the unlawful transactions because none of the original entities remained.2
On January 31, 1996, Long filed Exceptions to the Recommended Decision pursuant to Section 263.39(a) of the Uniform Rules of Practice and Procedure, 12 C.F.R. 263.39(a). Long's Exceptions were directed only to the amount of the penalty and the finding of a violation with respect to the retention of control of Tri-County. In partic-
2. In January 1995, Long merged Cedar Vale, Sumner County and Tri-County into the Bank.
ular, Long argued that the ALJ erred in his penalty determi-nation because he failed to apply the civil money penalty matrix used by the Board; incorrectly concluded that Long or Cedar Vale benefitted as a result of the violation and that Long acted in bad faith; and failed to consider the benefit to the Bank as a result of the merger. Long's exception to the finding that Cedar Vale illegally retained control of Tri-County was based on his contention that Board ap-proval was not required because Tri-County was a dormant company.
Statutory and Regulatory Authority
Section 3(a) requires prior Board approval before a com-pany can become a bank holding company. 12 U.S.C. § 1842(a). A "bank holding company" is any company that has control over any bank or over any company that is or becomes a bank holding company. 12 U.S.C. § 1841(a)(1). Section 11(a) of the Board's Reg-ulation Y implements this statutory provision by requiring a prior application to the Board for the formation of a bank holding company. 12 C.F.R. 225.11(a). Section 4 of the BHC Act requires prior Board approval before a bank holding company may acquire or retain control of any company which is not a bank or which engages in non-banking activities. 12 U.S.C. §§ 1841(a) and (c)(8). Sec-tion 21(a) of the Board's Regulation Y implements this section by providing that a bank holding company or a subsidiary may only engage in activities that are closely related to banking when it obtains prior Board approval for such activities. 12 C.F.R. 225.21(a). Any company that violates, and any individual who participates in a violation of, the BHC Act may be assessed a penalty of up to $25,000 per day for each day the violation continues. 12 U.S.C. § 1847(b)(1).
Summary of Findings of Fact
The Board adopts the ALJ's Recommended Decision and Recommended Findings of Fact and Conclusions of Law, except as specifically supplemented or modified herein.
At all relevant times to the Notice, Long was the presi-dent and chairman of Cedar Vale, Sumner County, the Bank and Tri-County, as well the sole shareholder of Cedar Vale, Sumner County and Tri-County. Prior to his owner-ship of Cedar Vale and Sumner County, Long had exten-sive experience in the banking industry dating back to 1955 that included running, owning and serving as a direc-tor for several other banks. Long also had prior experience with the Federal Reserve's application process, having filed other applications, including his 1976 application seeking approval for Sumner County to become a bank holding company and engage in permissible insurance activities, and his 1984 change-of-control notice in connec-tion with his acquisition of Cedar Vale.
When Long acquired Cedar Vale in 1984, he financed the acquisition with bank financing (the "Debt") for which Cedar Vale was the principal obligor and Long and Sumner
Digitized for FRASER http://fraser.stlouisfed.org/ Federal Reserve Bank of St. Louis

Legal Developments 873
County were guarantors. From 1985 to 1989, Long himself serviced the debt using personal funds, including dividends paid to him by Sumner County. In 1988, Cedar Vale's sole subsidiary bank, Cedar Vale State Bank, failed and was closed by the Kansas State Banking Department. This caused Cedar Vale to cease to be a bank holding company, since it no longer controlled a bank. Cedar Vale was left with Debt with a principal amount of approximately $904,000 and no source of income with which to service it. In 1989, Long was required to change his status from guarantor to co-maker of the Debt.
Due to its heavy losses prior to the failure of Cedar Vale State Bank, Cedar Vale had accumulated $1.3 million in net operating loss carry-forwards ("NOLs"). NOLs can be used to offset taxable income and thereby reduce corporate income tax liability. With no source of income, however, Cedar Vale was unable to use its NOLs.
Accordingly, Long sought a means of utilizing the NOLs and creating a source of repayment of the Debt by causing Cedar Vale to acquire an income-producing subsidiary. In January 1989, Long began a series of contacts with the Federal Reserve Bank of Kansas City (the "Reserve Bank") with regard to merging Cedar Vale and Sumner County. Long advised the Reserve Bank staff that such a merger would allow Sumner County to assume Cedar Vale's debt and also generate over $400,000 in tax sav-ings.3 Early on in these discussions, the Reserve Bank advised Long that it could not sanction a merger of Cedar Vale into Sumner County because Sumner County's as-sumption of Cedar Vale's debt would hamper Sumner County's ability to serve as a source of strength to the Bank. Several months later, in June 1989, Long filed an application (the "June Application") with the Reserve Bank for approval for Cedar Vale to acquire and then merge with Sumner County, with Cedar Vale as the surviv-ing corporation. The Reserve Bank returned the application advising Long that it had several concerns which made approval of the application "highly unlikely."4
Thereafter, on or about August 29, 1989, Cedar Vale filed another application, this time under section 3(a)(1) of the BHC Act to become a bank holding company by acquiring 90.5 percent of the stock of the Bank. Cedar Vale also filed an application under section 4(c)(8) of the BHC Act for approval to engage in non-banking activities by acquiring all of the shares of Tri-County, which according to Cedar Vale's representations to the Board had been engaged in the business of selling insurance to customers
3. According to Long, he planned for Sumner County to pay Cedar Vale's debt with income derived from the Bank, as well as deduct Cedar Vale's NOLs from its income, thus reducing the merged enti-ty's tax liability.
4. The Reserve Bank's letter dated June 26, 1989 explained that the proposed transaction was inconsistent with the Board's policy regard-ing the formation of small one-bank holding companies because the debt which would be incurred as a result of the transaction had not been used to acquire the proposed subsidiary bank, the Bank. The Reserve Bank also stated that, in light of the Bank's financial condi-tion, the Board would likely have concerns about the Bank's ability to service the Debt.
of the Bank. In the application, Long falsely represented that he personally owned all of Tri-County's voting shares, when in fact he had previously transferred all of its shares to Cedar Vale in mid-1989.
The Reserve Bank advised Long that the chances for approval of his applications were poor because the staff had the same concerns as they did with his earlier applica-tion. Although the Reserve Bank advised him that he could withdraw the applications without prejudice to refiling if the Bank's condition improved, Long elected to have the applications processed as filed. In later providing notice to Long that the applications had been accepted, the Reserve Bank stated in a letter that the applications would be processed according to a 60-calendar day schedule and that "a decision regarding your application will be forthcoming on or before December 22, 1989, unless you are notified to the contrary." Reserve Bank staff continued to communi-cate with Long and his son regarding the applications.5
On December 28, 1989, having received no decision on his applications, Long held special meetings of the share-holders and directors of Sumner County and Cedar Vale at which resolutions approving the merger of Sumner County into Cedar Vale were unanimously ratified. The following day, Long received an undated letter from Board staff, postmarked December 26, 1989, informing him that the Board needed additional time to evaluate the financial and policy issues raised by the applications, and that the Board would act within the 91-day period set forth in Regula-tion Y. Upon receipt of the letter, J. Long telephoned Board staff and stated his view that the applications had been approved by operation of law by virtue of the Board's failure to act within the 60 day period set forth in the Reserve Bank's letter. Board staff explained that the 60-day period referenced in the Reserve Bank's letter was only an internal processing period and that an application is only granted by operation of law if the Board fails to act within 91 days of receipt of a complete application.6 Board staff told J. Long that the proposed transactions should not be consummated because the Board had not acted on the applications. J. Long thereafter reported to his father that Board staff did not agree with their view that the transac-tions had been approved because the 60 day period had passed.
The day following Board's staff instructions not to con-summate the transactions, Long announced at meetings of Sumner County's and Cedar Vale's boards of directors that he would be transferring his shares of Sumner County to
5. In one such conversation in November 1989, Respondent in-formed Board and Reserve Bank staff that the purpose of the applica-tions was to enable Cedar Vale to utilize the NOLs and that he anticipated tax savings of approximately $435,000 as a result of the NOLs.
6. The 91 -day rule is a statutory requirement which provides that if the Board fails to act within 91 days of the date when the Board has received the complete application under sections 3 or 4(c)(8) of the BHC Act, the application is deemed approved by operation of law. 12 U.S.C. §§ 1842(b)(1), 1843(c).
Digitized for FRASER http://fraser.stlouisfed.org/ Federal Reserve Bank of St. Louis

874 Federal Reserve Bulletin • September 1996
Cedar Vale.7 He did so four days later, on January 3, 1990.8
Long never notified the Board or Reserve Bank staff that he had consummated the transaction, although he continued to communicate with both staffs with respect to their requests for additional information needed in the Board's consider-ation of the applications. During this same period, J. Long wrote a letter to Board staff suggesting that the acquisitions had not yet occurred.9 In response, Board staff again ad-vised J. Long, by letter dated January 30, 1990, that "Ce-dar Vale should not take any action to consummate either of the transactions represented in Cedar Vale's applications until the Board has taken final action on Cedar Vale's applications and Cedar Vale has received notice of the Board's decision in these matters."10
On February 9, 1990, the Board issued an order denying Cedar Vale's applications. The Cedar Vale Bank Holding Company, 76 Federal Reserve Bulletin 257 (1990). The Board found, among other things, that Cedar Vale would not have sufficient financial resources or flexibility to ser-vice the outstanding debt without straining the resources of the combined organization and the Bank.11 Although Long received the Board's order, he neither reversed the trans-fers nor informed the Board or Reserve Bank that the transfers had occurred. On February 15, 1990, Cedar Vale requested reconsideration of the Board's order but did not challenge the Board's finding that its action on the applica-tions had been timely. Nor did Cedar Vale disclose it had already acquired Sumner County. The Board denied the request for reconsideration and no judicial review was sought.
The transaction went undetected until May 1990 when Reserve Bank examiners, during an inspection of Sumner County, discovered that Long had transferred the Sumner County shares to Cedar Vale on January 3, 1990. At an inspection the following year, examiners discovered that Long had transferred his ownership of Tri-County to Cedar Vale before the end of 1989, when the applications were still outstanding. Starting in June 1990, and on a number of
7. This transaction was essentially that described in the June Appli-cation which had been returned to Long by the Reserve Bank. The application before the Board involved the acquisition by Cedar Vale of the stock of the Bank, not of its parent, Sumner County. Thus, even if the application had been approved by operation of law, the transac-tion effected by Long would have been unapproved.
8. Long testified that he wanted to transfer the shares at the beginning of 1990 so that he could get a full year's tax benefits from the NOLs.
9. In his letter dated January 24, 1990, J. Long stated that because, in his view, the Board's 91-day period had expired, he would be advising his clients to "proceed with and consummate [the] acquisi-tion."
10. The Board's letter further stated that "[consummation of the proposed transactions without the prior approval of the Board and prior to the expiration of the statutory ninety-one day period would constitute a violation of the BHC Act and would subject Cedar Vale and its principals to possible penalties under the Act."
11. The Board considered and rejected Long's contention that the applications had been approved by operation of law, finding that in light of the Board's receipt of information necessary to its decision on the applications as late as January 19, 1990, the 91-day period had not expired. 76 Federal Reserve Bulletin at 258 n.9.
occasions thereafter, the Reserve Bank and Board staff instructed Long that his actions violated the BHC Act and that if his transfers were not reversed he could face sub-stantial penalties. Long took no action to reverse the trans-fers. On January 1, 1995, during the course of this proceed-ing, Long merged Cedar Vale into Tri-County, and then Tri-County and Sumner County into the Bank. Long took these actions without consulting the Board. As a result, as of January 1, 1995, Cedar Vale, Tri-County and Sumner County ceased to exist.
Between 1990 and 1994, as a result of the violations, Cedar Vale/Sumner County saved $567,941 in federal taxes as a result of being able to deduct Cedar Vale's NOLs from Sumner County's taxable income.12 The violations also enabled Cedar Vale, rather than Long, to service the Debt by using estimated tax payments and dividends that it received from the Bank, thereby reducing Long's liability as a co-maker on the Debt.13
Violations of the BHC Act and Regulation Y
The Board adopts the ALJ's finding that Cedar Vale vio-lated section 3(a)(1) of the BHC Act, and Regulation Y thereunder by becoming a bank holding company without Board approval through its acquisition of all of the shares of Sumner County, a registered bank holding company, on January 3, 1990. Cedar Vale remained an illegal bank holding company until January 1, 1995. The Board also finds, as the ALJ did, that by transferring all of Sumner County's shares to Cedar Vale on January 3, 1990, Long participated in Cedar Vale's violations of section 3(a)(1) of the BHC Act and Regulation Y within the meaning of section 8(b)(1) of the BHC Act.
The ALJ also concluded that Cedar Vale violated section 4 of the BHC Act and Regulation Y by retaining control of Tri-County, without Board approval, after January 3, 1990, the day when Cedar Vale effectively became an illegal bank holding company. Long has objected to that finding based on his contention that Board approval was not re-quired because Tri-County was a "dormant" company, not engaged in any activities, after January 3, 1990.
The Board finds that Long's objection is without merit because the record does not demonstrate that Tri-County was a dormant company. Just four months prior to the time Long claims Tri-County was dormant, Long had repre-sented that Tri-County was actively engaged in the insur-
12. The ALJ found that between 1990 and 1994, Sumner County's stand-alone taxable income would have been $1,684,330. Its total tax liability on this income would have been $567,941. However, because the violations enabled the combined Cedar Vale/Sumner County en-tity to offset Sumner County's taxable income with Cedar Vale's NOLs, the combined entity paid no taxes between 1990 and 1994. Accordingly, the tax benefit accruing to the combined entity through 1994 totalled $567,941. In his Exceptions, Long does not take issue with these tax calculations.
13. From January 3, 1990 through December 31, 1994, Cedar Vale made payments totalling $956,205 on the Debt, consisting of $282,205 of interest and $674,000 of principal. The outstanding principal amount of the Debt was thereby reduced to $230,000.
Digitized for FRASER http://fraser.stlouisfed.org/ Federal Reserve Bank of St. Louis

Legal Developments 875
ance business and would continue to sell insurance.14 Tri-County also had income and some assets, as Long admitted at the hearing. Moreover, even if there had been an inter-ruption in its active operations in January 1990, Tri-County could have resumed its insurance sales at the whim of Long, who was a licensed insurance agent.
Accordingly, the Board finds that Cedar Vale, through its retention of control of Tri-County without Board approval, violated section 4 of the BHC Act and Regulation Y. The Board also adopts the ALJ's finding that Long participated in Cedar Vale's violations of section 4 of the BHC Act and Regulation Y within the meaning of section 8(b)(1) of the BHC Act by failing to reverse the transfer of Tri-County's shares to Cedar Vale after Cedar Vale became a bank holding company on January 3, 1990.
Imposition of A Civil Money Penalty
Finding that Long's violations subject him to the penalty provisions of the BHC Act, the Board now considers the appropriateness and amount of such penalty. Under appli-cable law, an individual who participates in a violation of the BHC Act may be assessed a civil money penalty of up to $25,000 per day for each day the violation continues. 12 U.S.C. § 1847(b)(1). The violations were outstanding for 1824 days between January 3, 1990 and January 1, 1995. Accordingly, the maximum penalty that may be assessed under the BHC Act is $45,600,000.
In determining the appropriate amount of a penalty, the applicable statutes require the Board to "take into ac-count" the financial resources and good faith of the person charged, the gravity of the violation, the history of previ-ous violations, and such other matters as justice may re-quire. 12 U.S.C. §§ 1847(b)(2), 1818(i)(2)(G). The Board's regulations require that it also consider the "economic benefit derived by the person from the misconduct." 12 C.F.R. 263.62 (1995). In addition, the Board has adopted an Interagency Policy Regarding Assessment of Civil Money Penalties ("Policy Statement"), 1 F.R.R.S. § 3-1605 at 3.635-37 (1995), which provides additional guidance on the proper assessment of penal-ties.15 The Policy Statement states that the agencies believe that in determining the amount of a civil money penalty,
14. Cedar Vale's application to acquire Tri-County, dated August 29, 1989, stated: "[Tri-County] is now engaged and, upon [consum-mation] of the proposed acquisition, will continue to engage in, the insurance business (SIC Code 641) from the offices of the Bank of Commerce & Trust Co., in Wellington, Kansas. The types of insur-ance being and to be offered are credit life, accident and health and crop insurance written in connection with loans to bank customers."
15. The Policy Statement includes thirteen factors (the "Policy Statement Factors") to be used by the banking agencies in determin-ing whether a violation is of sufficient gravity to warrant the initiation of civil money penalty assessment proceedings. Those factor are: evidence of wilfulness or disregard of the law or the consequences to the institution; frequency of the violation and the length of time the violation has been outstanding; whether the violation continued after respondent became aware of it; failure to cooperate with the agency in effecting an early resolution of the problem; evidence of concealment
a significant consideration should be the financial or eco-nomic benefit the respondent obtained from the violation . . . . The removal of economic benefit will, however, usually be insufficient by itself to promote compliance with the statutory provisions. The penalty may, therefore, in appropriate circum-stances reflect some additional amount beyond the economic benefit derived to provide a deterrent to future conduct. Id.
In his Exceptions, Long argues that the ALJ erred in his penalty assessment because he failed to apply a civil money penalty matrix included in an "SR Letter" issued by Board staff in 1991.16 Long contends that the matrix must be used in determining the amount of civil money penalties. The Board finds no merit in this argument. First, contrary to Long's assertion, the SR Letter was not "pro-mulgated by the Board" but was issued by Board staff to the staff of the Federal Reserve Banks for their use in evaluating proposed civil money penalty assessments. Con-sequently, it has no binding effect on the Board.17 More-over, the SR Letter states that the matrix does not include consideration of the amount of gain to the respondent, and that this factor "must be considered separately before setting the final penalty amount." SR 91-13 (FIS) at 4. Finally, the matrix and the suggested civil money penalty assessments it includes relate to so-called "tier 1" penal-ties under section 8(i)(2)(A) of the FDI Act, 12 U.S.C. § 1818(i)(2)(A). Tier 1 penalties are set at $5,000 per day, in contrast to the $25,000 per day penalties permit-ted for the violations of the BHC Act found in this case. Thus, even if the Board were required to consider the matrix, which it is not, the penalty amount recommended by the ALJ would be permissible under that matrix.18
The Board notes that the civil money penalty recom-mended by the ALJ exceeds that assessed in the Notice. It is undisputed that the Board has the authority to increase the penalty amount from that originally assessed. Section 8(i)(2)(F) of the FDI Act, applicable to this proceeding under section 8(b)(2) of the BHC Act, expressly permits the Board to "compromise, modify or remit any penalty" assessed. 12 U.S.C. § 1818(i)(2)(F). The Board's rules for assessments of civil money penalties also explicitly autho-rize the Board to "modify the amount of the penalty
of the violation or its voluntary disclosure; threat of or actual loss or harm to the institution; whether respondent received a financial or other gain or benefit; evidence of restitution; history of prior viola-tions; previous criticisms by regulators for similar violations; presence or absence of a compliance program and its effectiveness; tendency to create an unsafe or unsound banking practice or a breach of a fiduciary duty; and the existence of agreements, commitments or orders in-tended to prevent the subject violations. 1 F.R.R.S. § 3-1605 at 3-637.
16. An "SR letter" is a supervisory memorandum issued by the staff of the Board's Division of Banking Supervision and Regulation to provide guidance to the supervisory staffs of the Federal Reserve Banks. The matrix included in SR Letter 91-13 (FIS), to which Long refers, identifies most of the statutory and Policy Statement factors and provides for a numerical weight to be given to each factor.
17. See Rapp v. Office of Thrift Supervision, 52 F.3d 1510 (10th Cir. 1995) (Office of Thrift Supervision is not bound by methodology of civil money penalty matrix).
18. Long concedes that even under his calculations the matrix yields a penalty—exclusive of his gain—in excess of $100,000.
Digitized for FRASER http://fraser.stlouisfed.org/ Federal Reserve Bank of St. Louis

876 Federal Reserve Bulletin • September 1996
specified in the notice of assessment" following a hearing. 12 C.F.R. 263.63. See Lovgren v. Byrne, 787 F.2d 857, 867 (3d Cir. 1986) (where agency decision-maker took into account the required statutory factors, no abuse of discre-tion in increasing penalty following hearing).
Such an increase may be particularly appropriate where evidence is available at the time of the hearing that was not available when the notice was issued. In this case, the facts leading to the ALJ's recommendation of an increase in the penalty principally involve the tax benefits derived from the illegal transaction. Those benefits for the years 1993 and 1994 were unknown at the time the Notice was issued in February 1994. Accordingly, the Board may appropri-ately increase the penalty from that originally assessed to take into account the full record with respect to the benefits derived from the transaction.
With respect to the statutory factors that the Board is required to consider, the record indicates that Long, whose net worth as of March 10, 1994 was $2,342,700, has considerable financial resources.19 The Board views Long's conduct, in knowingly transferring the shares of Sumner County to Cedar Vale without Board approval, attempting to hide the transaction, and blatantly disregarding the regu-lators' instructions to unwind the transfer, to be egregious. Although there is no history of previous violations, the violations continued over five years, despite repeated no-tices to reverse the violative transactions.
Under both the statutory and Policy Statement factors, the Board is required to consider is whether respondent acted in good faith. Long objected to the ALJ's finding of bad faith, claiming that his actions were based on his good faith belief that the applications had been approved by operation of law.
After careful review of the record, the Board adopts the ALJ's finding that Long acted in bad faith. It is uncontro-verted that before Long transferred Sumner County to Cedar Vale, he saw the Board's letter stating that more time would be needed to consider the applications. In addition, prior to the transfer Board staff had instructed Cedar Vale not to complete the transactions. Furthermore, Long testified that his motivation in transferring the shares in January 1990 was to get the tax benefits of the transac-tion for the full year.
The record is also replete with other instances of Long's bad faith. Most notable are Long's concealment of the transaction and his disregard of Board and Reserve Bank staff's instructions to correct the violations.20 In short, the
19. Long claims in his brief accompanying his Exceptions that there was no analysis of the liquidity of his assets. The statute does not require the Board to consider only liquid assets in determining the size of a respondent's financial resources. Moreover, the record reflects that Long holds over $3 million in stocks and bonds.
20. The Board finds Long's claim that he failed to reverse the transactions because of the adverse consequences that would have resulted to be meritless. The only adverse consequences evident from the record are that Long would not have enjoyed the tax benefits that the Board's denial order withheld from him. In addition, Long's claim that he did not reverse the transactions because he was following advice of counsel is not supported by the record. The discussions with
Board concludes that Long's willful and deceptive con-duct, motivated by personal gain, overwhelmingly demon-strates that his actions were in bad faith.
The statute also requires the Board to consider "such other matters as justice may require." As noted above, the Board gives considerable weight in assessing penalties to the financial or economic benefit derived by the respondent from the illegal activity. The Policy Statement provides that a civil money penalty should require the respondent to disgorge the benefits from the violation, and in appropriate circumstances, the penalty may include an additional amount in order to provide a deterrent to future miscon-duct. 1 F.R.R.S. § 3-1605 at 3-637.
The ALJ found that Long, at a minimum, directly bene-fitted from the $567,941 that Cedar Vale saved in taxes as a result of his status as its sole shareholder. Long argues that the ALJ erred in such finding because Cedar Vale's "pa-per" tax savings did not result in any "actual monetary benefit" to Long.21
The Board finds that the record supports the ALJ's determination that Long benefitted in an amount of at least $567,941. As the ALJ found, Long's equity investment increased in value because of the $567,941 in tax savings and the resulting additional funds that accrued to the com-bined entity. Furthermore, as the sole shareholder, chair-man and president of the bank holding company, Long had direct control of how those additional funds were spent.22
In addition to the benefits stemming from the $567,941 in tax savings, Long derived other benefits from the viola-tion. Long benefitted from Cedar Vale's ability to service the $904,000 Debt, thus relieving Long, as co-maker, of this obligation.23 Only as a result of the illegal transaction was Cedar Vale able to service the Debt through its receipt of the Bank's dividends and estimated tax payments, which were Cedar Vale's principal source of income between 1990 and 1994. During this time, the principal on the Debt,
counsel that Long is relying on came after Long had consummated the transactions. Moreover, these discussions do not evidence that Long was advised to disregard the Board's order denying the applications or the Board's staff's instructions to reverse the transactions. Accord-ingly, the Board need not consider whether such a defense has merit, as the record in this case is insufficient.
21. Long also argues that Cedar Vale had no benefit from the tax savings because it could have achieved similar results by using the NOLs in some other way. Long failed to present any evidence suggest-ing a realistic alternative available to him to utilize the NOLs. Had such alternatives existed, it seems likely that Long would have availed himself of them to avoid engaging in the illegal transaction found here. Consequently, the Board rejects this argument.
22. Long could further control how Cedar Vale's funds were spent through his control of its board of directors, which consisted of him, his son and one other family member.
23. Long claims that Sumner County, as guarantor of the Debt, and not Long, would have been liable on the Debt had Cedar Vale not been able to make the Debt payments. Long's argument obliterates the distinction between the primary liability of a principal debtor and the secondary liability of a guarantor. Accordingly, the Board rejects this contention.
Digitized for FRASER http://fraser.stlouisfed.org/ Federal Reserve Bank of St. Louis

Legal Developments 877
for which Long was liable, was reduced by $674,000.24
Thus, had the violations not occurred, Long would have been responsible for making those payments, as he had done from 1985 through 1989.
Moreover, Cedar Vale's ability to pay the Debt using funds derived from the Bank resulted in additional tax savings to Long. In the absence of the illegal transaction, had Long been required to service the Debt, he would have had to have done so, at least in part, with after-tax income derived from Sumner County dividends.25 Thus, in addi-tion to the dollar amount needed to service the Debt, Long would have had to pay income tax on the dividend income from Sumner County. Instead, the illegal transaction al-lowed Long to satisfy Cedar Vale's Debt with funds from the Bank transferred tax free to Sumner County.26 In sum, the Board finds that Long derived a benefit in an amount of at least $567,941.
In addition to the factor of personal gain, the other Policy Statement factors also weigh heavily in favor of assessment of a significant penalty. The violation was, as discussed above, intentional. It was outstanding for five years, during which time Long was not only aware of the violation but was repeatedly urged to correct it. Long's actions in the application process indicate concealment of the violation. Finally, the illegal transaction tended to cre-ate an unsafe or unsound practice. The Board's Order denying Cedar Vale's application noted that the Bank might not have the financial strength to service the Debt without undue strain on its resources. The Board's concern was borne out in the record, which indicates that examina-tion reports for the Bank evidenced concern that the large dividends paid by the Bank to service the Debt adversely affected its capital.
In his Exceptions, Long argues that the Bank benefitted from his illegal transactions and that his penalty should be reduced as a result. The Board rejects this contention. In brief, Long asserts that because of the tax benefits associ-ated with the availability of Cedar Vale's NOLs and the fact that Cedar Vale could service the Debt with before-tax earnings, the transaction "in fact reduced financial pres-sures on the Bank's holding company and reduced the amount of [Bank] funds necessary to service the Cedar Vale debt." Exceptions at 6. This argument ignores the fact that neither the Bank nor its parent, Sumner County, was liable on the Debt. The Debt was incurred to permit Long to acquire a separate bank, Cedar Vale State Bank. The Bank obtained no benefit from Long's acquisition of Cedar Vale, and was in no way responsible for servicing the Debt. Any financial pressures that might have been placed on the
24. The reduction in Cedar Vale's underlying debt would have had a corresponding effect of increasing the value of Long's equity invest-ment in Cedar Vale.
25. The record reflects that the payments on the Debt made by Long between 1985 and 1989 were funded at least in part by Sumner County dividends.
26. Had Long been required to pay off the Debt and used only dividends from Sumner County, he would have incurred $292,857 in personal income taxes.
Bank to service the debt would have been inappropriate, and the removal of such inappropriate pressures can hardly be counted as a benefit.
The Board believes this is an appropriate case for sub-stantial penalties to assure that the respondent does not benefit from his wrongdoing and is deterred from such action in the future. Long sought to combine Cedar Vale and Sumner County through his application to the Board in order to utilize Cedar Vale's NOLs and reduce his obliga-tion on the Debt. The Board refused to permit the transac-tion, citing its concern about the effect of such a combina-tion on the Bank. Long nonetheless proceeded with the transaction and reaped substantial benefits as a result. It is entirely fitting that he should be deprived of those benefits and that some additional penalty should be imposed to deter such action in the future.
Accordingly, the Board also affirms the additional $150,000 penalty that the ALJ recommended in order to deter others from engaging in similar conduct. As a general rule, the Board accords considerable weight to the recom-mendations of administrative law judges with respect to penalties.27 This is appropriate here where the ALJ had the opportunity to assess Long's credibility and demeanor. Moreover, the Board finds that severity of Long's conduct supports the additional $150,000 penalty. Although Long argues that his conduct was "neither outrageous nor incom-prehensible," the Board cannot agree. The Board views Long's conduct as demonstrating a total disregard for the regulatory process entrusted to the Board. Furthermore, the Board finds that $150,000 penalty is justified because Long had benefits in addition to the $567,941 in tax savings.
For these reasons, the Board affirms the ALJ's penalty determination and assesses a civil money penalty against Long in the amount of $717,941.
Cease and Desist Order
The ALJ recommended that Long and Cedar Vale be prohibited from engaging in future violations of the BHC Act. However, the ALJ did not order that the violative transactions be reversed because Cedar Vale, Sumner County and Tri-County no longer exist as independent entities. The Board adopts the ALJ's recommendation with respect to Long. As Cedar Vale no longer exists, it cannot be subject to a cease and desist order.
Conclusion
For the foregoing reasons, the Board orders that the at-tached Combined Order to Cease and Desist and of Assess-ment of Civil Money Penalty issue against Long.
27. See In the matter ofEvco, Inc., 76 Federal Reserve Bulletin 679 (1990); In the Matter ofCBC, Inc., 79 Federal Reserve Bulletin 247 (1993); In the Matter of Vic Sather & Associates, Inc., 79 Federal Reserve Bulletin 160 (1993).
Digitized for FRASER http://fraser.stlouisfed.org/ Federal Reserve Bank of St. Louis

878 Federal Reserve Bulletin • September 1996
By Order of the Board of Governors, this 2nd day of July, 1996.
Board of Governors of the Federal Reserve System
WILLIAM W. WILES Secretary of the Board
Combined Order to Cease and Desist and of Assessment of Civil Money Penalty
WHEREAS, the Board of Governors of the Federal Re-serve System (the "Board of Governors"), on February 7, 1994, issued a Notice of Charges and Hearing and of Assessment of Civil Money Penalties (the "Notice") against, inter alia, Cedar Vale Bank Holding Company, Inc., Wellington, Kansas ("Cedar Vale") and W. C. Long, Jr. ("Long"), an institution-affiliated party of Cedar Vale, as defined by sections 3(u) and 8(b)(3) of the Federal Deposit Insurance Act, as amended (the "FDI Act") (12 U.S.C. §§ 1813(u) and 1818(b)(3));
WHEREAS, the Notice alleged that Cedar Vale, with the direct participation of Long, violated sections 3(a)(1) and 4 of the Bank Holding Company Act of 1956, as amended (the "BHC Act") (12 U.S.C. §§ 1842(a)(1) and 1843) by failing to obtain prior approval of the Board of Governors before acquiring control of a bank, and thereby becoming a bank holding company, and by retaining control of a non-bank subsidiary;
WHEREAS, on January 1, 1995, Cedar Vale was merged into the Bank of Commerce and Trust Company, Welling-ton, Kansas;
WHEREAS, on June 12-15, 1995, a public administra-tive hearing was conducted in Wichita, Kansas, before an administrative law judge (the "ALJ") concerning the mat-ters alleged in the Notice, and, thereafter, the ALJ certified to the Board of Governors the record of this proceeding, including his Recommended Decision dated November 21, 1995, proposed findings of fact and conclusions of law;
WHEREAS, upon consideration of the record in this proceeding, the Board of Governors is of the opinion, for the reasons set forth in the accompanying Final Decision in this matter, that this Combined Order to Cease and Desist and of Assessment of Civil Money Penalty (the "Order") should be issued against Long.
NOW, THEREFORE, IT IS HEREBY ORDERED, pur-suant to section 8(b)(2) and (3) of the FDI Act (12 U.S.C. §§ 1818(b)(2) and (3)) and section 8(b) of the BHC Act (12 U.S.C. 1847(b)), that:
1. Long shall not, directly or indirectly, engage in any violation of the BHC Act. 2. Long is assessed and shall forfeit and pay a civil money penalty of $717,941. 3. No portion of the civil money penalty assessed by this Order shall be, directly or indirectly, paid, advanced, reimbursed or otherwise funded by the Bank of Com-
merce and Trust, Wellington, Kansas, or any successors or assigns. 4. The penalty assessed by this Order shall be remitted in full on or before the thirtieth day following the effective date of the Order. Payment of the penalty shall be made to the "Board of Governors of the Federal Reserve System," and shall be forwarded to William W. Wiles, Secretary, Board of Governors of the Federal Reserve System, Washington, D.C. 20551, who shall make remit-tance of the same to the Treasury of the United States, as required by statute. 5. The provisions of this Order shall not bar, estop, or otherwise prevent the Board of Governors, or any other federal or state agency or department, from taking any other action affecting Long. 6. This Order, and each and every provision thereof, is and shall remain fully effective and enforceable until expressly stayed, modified, terminated or suspended in writing by the Board of Governors. 7. This Order shall become effective upon service.
By Order of the Board of Governors, this 2nd day of July, 1996.
Board of Governors of the Federal Reserve System
WILLIAM W. WILES Secretary of the Board
In the Matter of
United Security Bancorporation Lincoln, Nebraska
Docket Nos.
94-031-B-HC 94-031-B-I1 94-031-B-I2
Final Decision
This is an administrative enforcement proceeding instituted by the Board of Governors of the Federal Reserve System (the "Board") pursuant to section 8(b) of the Federal Deposit Insurance Act (the "FDI Act") against United Security Bancorporation, Lincoln, Nebraska, a registered bank holding company ("United"), and Harold S. Myers and David C. Myers, United's principal officers, directors and controlling shareholders (collectively, "the Myers"). On March 20, 1995, the Board issued a Notice of Charges and of Hearing alleging, inter alia, that respondents vio-lated section 23A of the Federal Reserve Act, 12 U.S.C. § 371c, by selling low quality assets to Security National Bank of Superior, Superior, Nebraska ("Security" or "the Bank"), United's bank subsidiary. The Notice
Digitized for FRASER http://fraser.stlouisfed.org/ Federal Reserve Bank of St. Louis

Legal Developments 879
sought a cease and desist order against the respondents prohibiting further violations of section 23A.
In a Recommended Decision issued on February 15, 1996, Administrative Law Judge Arthur L. Shipe (the "ALJ") recommended that the Board grant, in part, a motion for summary disposition filed by the enforcement staff of the Board ("Enforcement Counsel"). The ALJ found that the respondents violated section 23A, but rec-ommended that the Board limit a cease and desist order to United because the Office of the Comptroller of the Cur-rency ("OCC") had already issued a similar order against Security.1
Respondents filed exceptions to the Recommended Deci-sion arguing that the Board does not have authority under the FDI Act to issue a cease and desist order against respondents for violations of section 23A. Enforcement Counsel did not file exceptions to the ALJ's Recom-mended Decision.
Upon review of the administrative record, the Board hereby makes its Final Decision and adopts the ALJ's Recommended Decision, Recommended Findings of Fact, and Recommended Conclusions of Law as they relate to the section 23A violations, except as specifically supple-mented or modified herein. The Board therefore deter-mines that the attached Cease and Desist Order shall issue against the respondents prohibiting further violations of section 23A.
Statement of the Case
A. Standards for Cease and Desist Orders
The FDI Act provides that the appropriate Federal banking agency may issue a cease and desist notice against a depository institution or institution-affiliated party within its jurisdiction if it has reasonable cause to believe that the institution or party has engaged in an unsafe or unsound practice, or has violated a law, rule, regulation, or certain conditions imposed in writing. 12 U.S.C. § 1818(b)(1). The FDI Act further provides that the Board is the appro-priate Federal banking agency with respect to bank holding companies, 12 U.S.C. § 1813(q)(2), and that the notice and cease and desist provisions of subsection (b)(1) shall apply to any bank holding company in the same manner as they apply to a State member insured depository institution. 12 U.S.C. § 1818(b)(3).
After the Board issues a Notice under the FDI Act, the Board's Rules of Practice assign responsibility to an ALJ to hear the matter and make a recommended decision to the Board. 12 C.F.R. 263.5. The parties may file exceptions to
1. The ALJ also recommended that the Board grant summary disposition for Enforcement Counsel in connection with certain un-safe and unsound practices that were alleged in the Notice. The Board has remanded that portion of the case to the ALJ pursuant to a separate Order. Therefore, this Decision and the Cease and Desist Order issued pursuant to it constitute the Board's final determination and order only in connection with the issues relating to respondents' section 23A violations.
the ALJ's recommended decision with the Board, and the Board makes final findings of fact, conclusions of law and determination whether to issue a cease and desist order. 12 C.F.R. 263.40.
B. Standards for Summary Disposition
The Rules of Practice specifically provide that where there is no genuine issue as to any material fact and a moving party is entitled to a decision in its favor as a matter of law, the ALJ shall recommend that the Board issue a final decision granting a party's motion for summary disposi-tion. 12 C.F.R. 263.29. The ALJ's decision may be based on undisputed pleadings, admissions, affidavits, stipula-tions, documentary evidence, matters as to which official notice may be taken, and any other evidentiary materials properly submitted in connection with a motion for sum-mary disposition.
Motions for summary disposition should be decided by essentially the same standards as motions for summary judgment under Rule 56(c) of the Federal Rules of Civil Procedure.2 The nonmovant's evidence is to be accepted as true and all justifiable inferences are to be drawn in its favor. Eastman Kodak Co. v. Image Technical Services, Inc., 504 U.S. 451 (1992). In general, summary disposition should be granted where the evidence is so one-sided that one can reasonably arrive at only one conclusion.3
Findings and Conclusions
A. Findings
1. Relevant Individuals and Business Entities. United is a registered bank holding company which is owned and controlled by Harold S. Myers and David C. Myers. Its primary asset is the stock of Security, its sole bank subsid-iary. Security is a small rural community bank that had assets of approximately $41.7 million as of December 31, 1994. At all times relevant to this case, United's only operations were through Security.
At all times relevant to this case, the Myers controlled United through their ownership of 96 percent of its stock and their power to vote all of its shares. Harold Myers served as United's president and director, and David Myers served as United's vice president, secretary and director. United had one other director and no other officers. The Myers also served as directors of Security.4
2. United's Sale of Loans to Security. On November 11, 1990, Security sold loans to United for $200,000. On March 18, 1991, United sold the loans back to the Bank for $163,000. At the time of the resale to the Bank, the loans
2. Accord, In the Matter of David L. Paul, OTS Order No. 93-104, n.27 (Dec. 15, 1993).
3. E.g., Allstate Ins. Co. v. Brown, 920 F.2d 664, 668 (10th Cir. 1990).
4. At all times relevant to this case, Harold Myers served as Chairman of Security.
Digitized for FRASER http://fraser.stlouisfed.org/ Federal Reserve Bank of St. Louis

880 Federal Reserve Bulletin • September 1996
were on a nonaccrual status and were, by definition, "low quality assets" under the terms of section 23A of the Federal Reserve Act. 12 U.S.C. § 371c. United repurchased these loans from the Bank on April 4, 1994.
B. Conclusions
Respondents do not challenge the ALJ's conclusion that they violated section 23A when they resold loans to Secu-rity in 1991. The record establishes that the loans were on nonaccrual status and section 23A by its terms defines such an asset as a "low quality asset" that may not be trans-ferred to a bank by a company controlling the bank. 12 U.S.C. § 371c(b)(10). Instead, respondents have ex-cepted to the ALJ's conclusions that the Board has author-ity under section 8(b)(3) of the FDI Act to issue a cease and desist order against institution-affiliated parties of bank holding companies, and argue that because the Bank has agreed with the OCC not to violate section 23A in the future, the issue of a cease and desist order against the Myers and United is "moot." The Board rejects these arguments.
Section 8(b)(3) of the FDI Act, 12 U.S.C. § 1818(b)(3), provides, among other things, that the provisions of section 8(b)(1), authorizing cease and desist proceedings against depository institutions and their institution-affiliated par-ties, "shall apply to any bank holding company . . . in the same manner as they apply to a State member insured depository institution." Respondents argue that this provi-sion only supports cease and desist actions against the bank holding company itself, and does not authorize such ac-tions against institution-affiliated parties like the Myers.
It is not disputed that the term "institution-affiliated party" ("IAP") includes directors, officers, agents, and employees of bank holding companies. See 12 U.S.C. § 1813(u) (definition of IAP); In the Matter of Interamericas Investments, Ltd., 82 Federal Reserve Bulle-tin 609 at n.l (1996).5 Accordingly, respondents' sole contention here is that section 8(b)(3) of the FDI Act, which applies a number of provisions of section 8 to "any bank holding company . . . in the same manner as they apply to a State member insured depository institution," does not extend the remedies of section 8 to IAPs of bank holding companies.
The Board finds that this reading is inconsistent with the purpose of the statute and would render some of its provi-sions a nullity. Congress enacted section 8(b)(3) in 1974 to make the Board's existing cease and desist authority with
respect to State member banks equally applicable to bank holding companies and their nonbank subsidiaries. S. Rep. No. 902, 93rd Cong., 2d Sess. 10 (1974), reprinted in, 1974 U.S.C.C.A.N. 6128. Congress later amended sec-tion 8(b)(3) so that the suspension, removal, and prohibi-tion provisions contained in sections 8(e), (f), and (g) were also made applicable to bank holding companies and their nonbank subsidiaries in the same manner that they previ-ously applied to State member banks.6 Because the provi-sions of sections 8(e), (f), and (g) deal exclusively with actions against persons affiliated with depository institu-tions, as opposed to the institutions themselves, the amend-ments making these sections applicable to bank holding companies would have been meaningless if they were not intended to permit actions against individuals affiliated with bank holding companies.
The Board has on a number of occasions issued enforce-ment orders against persons affiliated with bank holding companies under the authority of section 8(b)(3). See, e.g., Interamericas, supra, 82 Federal Reserve Bulletin at 620 (cease and desist order against bank holding company IAP); In the Matter of Northwest Indiana Bancshares, Inc. (orders dated September 7, 1990), affirmed sub nom., Stan-ley v. Board of Governors, 940 F.2d 267 (7th Cir. 1991) (civil money penalties against bank holding company IAPs based in part on section 8(i) of FDI Act); In the Matter of EVCO, Inc. (orders dated January 30, 1990), affirmed sub nom., Burke v. Board of Governors, 940 F.2d 1360 (10th Cir. 1991) (prohibition orders against bank holding com-pany IAPs).
Accordingly, the Board declines to adopt the reading of section 8(b)(3) advanced by respondents, and holds that that section authorizes the Board to take the same enforce-ment measures identified in the section against IAPs of bank holding companies that it may take against IAPs of State member banks.
Finally, respondents argue that the Board is without authority to issue a cease and desist order based on the section 23A violations because Security has already agreed not to purchase assets from United pursuant to a written agreement with the OCC. Respondents contend that the OCC agreement effectively precludes further section 23A violations by the Myers and their corporate interests, and that Enforcement Counsel's request for an order directing United to cease and desist from the same conduct is now moot. The Board disagrees.
A review of the written agreement between Security and the OCC reveals that it does not provide complete protec-
5. See also 12 U.S.C. § 1847(c), which explicitly applies the IAP definition in 12 U.S.C. § 1813(u) to "an institution-affiliated party . . . with respect to a bank holding company." Respondents argued before the ALJ that the term "institution-affiliated party" in the FDI Act did not apply to persons affiliated solely with bank holding companies. That argument has been abandoned in respondents' exceptions, which urge only that section 8(b)(3) of the FDI Act does not authorize the Board to seek cease and desist orders "against institution affiliated parties like the Myers." Brief in Support of Respondents' Exceptions, at 7.
6. In 1978, Congress amended section 8(b)(3) to make the suspen-sion and removal provisions of section 8(e) applicable to bank holding companies and their subsidiaries. Pub. L. 95-630, § 107(b). See, S. Rep. 95-323, 95th Cong., 1st Sess. (1977) at 19 ("The amendment further makes it clear that the Board of Governors has similar powers with respect to bank holding companies and their officers, directors, employees, and agents."). In 1989, Congress again amended section 8(b)(3) so that the provisions of section 8(g) relating to the suspension or removal of a person charged with a felony were made applicable to these entities. Pub. L. 101-73, § 902(a)(1)(A).
Digitized for FRASER http://fraser.stlouisfed.org/ Federal Reserve Bank of St. Louis

Legal Developments 881
tion against further violations of section 23A by either United or the Myers. The written agreement prohibits the Bank from acquiring low-quality assets from the Myers or United. The written agreement does not, and cannot, gov-ern the conduct of United, which is beyond the OCC's jurisdiction. Nor does it purport to govern the conduct of the Myers individually. The cease and desist order entered by the Board, by contrast, prevents United and the Myers from engaging in violations of section 23A with Security or any other institution.7
Therefore, the Board rejects respondents' argument that the OCC's action divested the Board of authority to take enforcement action. For similar reasons, the Board rejects the ALJ's suggestion that a cease and desist order solely against United would be appropriate.
Conclusion
For the foregoing reasons, the Board orders that the at-tached Cease and Desist Order prohibiting further viola-tions of section 23A shall issue against the respondents.
By Order of the Board of Governors, this 15th day of July, 1996.
Board of Governors of the Federal Reserve System
WILLIAM W. WILES Secretary of the Board
Cease and Desist Order
WHEREAS, on March 20, 1995, the Board of Governors of the Federal Reserve System (the "Board of Gover-nors"), issued a Notice of Charges and Hearing (the "No-tice") against United Security Bancorporation ("United"), a registered bank holding company, which owns and con-trols the Security National Bank of Superior, Superior, Nebraska (the "Bank"), and Harold S. Myers ("H.S. My-ers") and David C. Myers ("D.C. Myers"), United's prin-cipal officers, directors and controlling shareholders;
WHEREAS, the Notice alleged, inter alia, that United, H.S. Myers and D.C. Myers caused a violation of sec-tion 23A of the Federal Reserve Act (the "FR Act") (12 U.S.C. 371c) as a result of United's sale of low quality assets to the Bank;
WHEREAS, on February 15, 1996, pursuant to sec-tion 263.29 of the Uniform Rules of Practice and Proce-dure, upon consideration of Board Enforcement Counsel's motion for summary disposition, the Administrative Law Judge determined that Board Enforcement Counsel was entitled to summary disposition of the matters alleged in the Notice relating to the alleged violations of section 23A
7. In addition, the Order would be enforceable in United States district court pursuant to 12 U.S.C. § 1818(i)(l) while the OCC's written agreement would not.
of the FR Act and submitted a recommended decision to that effect to the Board;
WHEREAS, the Board of Governors has determined, upon review of the record, that United and H.S. Myers and D.C. Myers, institution-affiliated parties as defined by sec-tions 3(u) and 8(b)(3) of the FDI Act (12 U.S.C. §§ 1813(u) and 1818(b)(3)), have engaged in, and will continue, unless restrained, to engage in certain violations of law;
IT IS HEREBY ORDERED, pursuant to section 8(b) of the Federal Deposit Insurance Act (the "FDI Act") (12 U.S.C. § 1818(b)) that United and its institution-affiliated parties and H.S. Myers and D.C. Myers cease and desist and take affirmative action as follows:
1. United shall take all actions necessary to ensure that all transactions entered into with the Bank, or with any bank subsidiary that it directly or indirectly controls, fully comply with the requirements of section 23A of the FR Act, and shall not, directly or indirectly, engage in any violations of section 23A of the FR Act.
2. H.S. Myers and D.C. Myers shall take all actions necessary to ensure that United does not violate section 23A of the FR Act, and shall not directly or indirectly engage in any violations of section 23A of the FR Act.
3. All communications regarding this Order shall be sent to:
(a) Mr. James H. Jonson Vice President Federal Reserve Bank of Kansas City 925 Grand Boulevard Kansas City, Missouri 64198
(b) Mr. Harold S. Myers President United Security Bancorporation 635 South 14th, Suite 320 Lincoln, Nebraska 68508
(c) Mr. Harold S. Myers United Security Bancorporation 635 South 14th, Suite 320 Lincoln, Nebraska 68508
(d) Mr. David C. Myers United Security Bancorporation 635 South 14th, Suite 320 Lincoln, Nebraska 68508
4. The provisions of paragraph 1 this Order shall be binding upon United and each of its institution-affiliated parties in their capacities as such, and their successors and assigns; the provisions of paragraph 2 of this Order shall be binding upon H.S. Myers and D.C. Myers in their individ-ual capacities.
5. Each provision of this Order shall remain effective and enforceable until stayed, modified, terminated or sus-pended by the Board of Governors.
6. The provisions of this Order shall not bar, stop or otherwise prevent the Board of Governors, or any federal or state agency or department, from taking any other action affecting H.S. Myers, D.C. Myers or United or any of United's current or former institution-affiliated parties or their successors or assigns.
Digitized for FRASER http://fraser.stlouisfed.org/ Federal Reserve Bank of St. Louis

882 Federal Reserve Bulletin • September 1996
By Order of the Board of Governors of the Federal Reserve System, effective this 15th day of July, 1996.
Board of Governors of the Federal Reserve System
WILLIAM W. WILES Secretary of the Board
FINAL ENFORCEMENT ORDERS ISSUED BY THE BOARD OF GOVERNORS
Bangkok Metropolitan Bank, PCL. Bangkok, Thailand
The Federal Reserve Board announced on July 25, 1996, the issuance of an Order to terminate United States Bank-ing Activities against the Bangkok Metropolitan Bank, PCL., Bangkok, Thailand. The Order was issued jointly with the New York State Banking Department and the California State Banking Department.
William B. Black, III Houston, Texas
The Federal Reserve Board announced on July 1, 1996, the issuance of an Order of Assessment of a Civil Money Penalty against William B. Black, III, the Chairman of the Board and President of The State Bank of Texas, Houston, Texas.
Mark E. Marteeny Somerset, Pennsylvania
The Federal Reserve Board announced on July 3, 1996, the issuance of an Order of Prohibition against Mark E. Mar-
teeny, a former officer of Somerset Trust Company, Somer-set, Pennsylvania.
Scott A. Noyes Colorado Springs, Colorado
The Federal Reserve Board announced on July 29, 1996, the issuance of a combined Order of Prohibition and Order of Assessment of a Civil Money Penalty against Scott A. Noyes, a former vice president and secretary/treasurer of Peoples Bancshares, Inc., Colorado Springs, Colorado.
TERMINATION OF ENFORCEMENT ACTIONS
The Federal Reserve Board announced on July 1, 1996, the termination of the following enforcement actions:
Merchants Bancshares, Inc. Burlington, Vermont
Written Agreement dated February 18, 1994—terminated June 3, 1996.
First Bancorp of Oklahoma, Inc. Tonkawa, Oklahoma
Written Agreement dated June 30, 1992—terminated May 6, 1996.
Digitized for FRASER http://fraser.stlouisfed.org/ Federal Reserve Bank of St. Louis

A1
Financial and Business Statistics
A 3 GUIDE TO TABULAR PRESENTATION
DOMESTIC FINANCIAL STATISTICS
Money Stock and Bank Credit A4 Reserves, money stock, liquid assets, and debt
measures A5 Reserves of depository institutions, Reserve Bank
credit A6 Reserves and borrowings—Depository
institutions A6 Selected borrowings in immediately available
funds—Large member banks
Policy Instruments A7 Federal Reserve Bank interest rates A8 Reserve requirements of depository institutions A9 Federal Reserve open market transactions
Federal Reserve Banks A10 Condition and Federal Reserve note statements A l l Maturity distribution of loan and security
holdings
Monetary and Credit Aggregates A12 Aggregate reserves of depository institutions
and monetary base A13 Money stock, liquid assets, and debt measures A15 Deposit interest rates and amounts outstanding—
commercial and BIF-insured banks A16 Bank debits and deposit turnover
Commercial Banking Institutions A17 Assets and liabilities, Wednesday figures
Weekly Reporting Commercial Banks— Assets and liabilities
A19 Large reporting banks A21 Branches and agencies of foreign banks
Financial Markets A22 Commercial paper and bankers dollar
acceptances outstanding A22 Prime rate charged by banks on short-term
business loans A23 Interest rates—money and capital markets A24 Stock market—Selected statistics
Federal Finance A25 Federal fiscal and financing operations A26 U.S. budget receipts and outlays A27 Federal debt subject to statutory limitation A27 Gross public debt of U.S. Treasury—
Types and ownership A28 U.S. government securities
dealers—Transactions A29 U.S. government securities dealers—
Positions and financing A30 Federal and federally sponsored credit
agencies—Debt outstanding
Securities Markets and Corporate Finance A31 New security issues—Tax-exempt state and local
governments and corporations A32 Open-end investment companies—Net sales
and assets A32 Corporate profits and their distribution A33 Domestic finance companies—Assets and
liabilities, and consumer, real estate, and business credit
Real Estate A34 Mortgage markets A35 Mortgage debt outstanding
Consumer Installment Credit A36 Total outstanding A3 6 Terms
Flow of Funds A37 Funds raised in U.S. credit markets A39 Summary of financial transactions A40 Summary of credit market debt outstanding A41 Summary of financial assets and liabilities
DOMESTIC NONFINANCIAL STATISTICS
Selected Measures A42 Nonfinancial business activity—
Selected measures A42 Labor force, employment, and unemployment A43 Output, capacity, and capacity utilization A44 Industrial production—Indexes and gross value A46 Housing and construction A47 Consumer and producer prices
Digitized for FRASER http://fraser.stlouisfed.org/ Federal Reserve Bank of St. Louis

2 Federal Reserve Bulletin • September 1996
DOMESTIC NONFINANCIAL STATISTICS-CONTINUED
Selected Measures—Continued
A48 Gross domestic product and income A49 Personal income and saving
INTERNATIONAL STATISTICS
Summary Statistics
A50 U.S. international transactions—Summary A51 U.S. foreign trade A51 U.S. reserve assets A51 Foreign official assets held at Federal Reserve
Banks A52 Selected U.S. liabilities to foreign official
institutions
Reported by Banks in the United States
A52 Liabilities to and claims on foreigners A53 Liabilities to foreigners A55 Banks' own claims on foreigners A56 Banks' own and domestic customers' claims on
foreigners A56 Banks' own claims on unaffiliated foreigners A57 Claims on foreign countries—
Combined domestic offices and foreign branches
Reported by Nonbanking Business Enterprises in the United States
A58 Liabilities to unaffiliated foreigners A59 Claims on unaffiliated foreigners
Securities Holdings and Transactions
A60 Foreign transactions in securities A61 Marketable U.S. Treasury bonds and
notes—Foreign transactions
Interest and Exchange Rates
A61 Discount rates of foreign central banks A61 Foreign short-term interest rates A62 Foreign exchange rates
A 6 3 GUIDE TO STATISTICAL RELEASES AND SPECIAL TABLES
SPECIAL TABLES
A64 Assets and liabilities of U.S. branches and agencies of foreign banks, March 31, 1996
A68 Residential lending reported under the Home Mortgage Disclosure Act, 1995
A 7 6 INDEX TO STATISTICAL TABLES
Digitized for FRASER http://fraser.stlouisfed.org/ Federal Reserve Bank of St. Louis

A3
Guide to Tabular Presentation
SYMBOLS AND ABBREVIATIONS
c Corrected e Estimated n.a. Not available n.e.c. Not elsewhere classified p Preliminary r Revised (Notation appears on column heading
when about half of the figures in that column are changed.)
* Amounts insignificant in terms of the last decimal place shown in the table (for example, less than 500,000 when the smallest unit given is millions)
0 Calculated to be zero . . . Cell not applicable ATS Automatic transfer service BIF Bank insurance fund CD Certificate of deposit CMO Collateralized mortgage obligation FFB Federal Financing Bank FHA Federal Housing Administration FHLBB Federal Home Loan Bank Board FHLMC Federal Home Loan Mortgage Corporation FmHA Farmers Home Administration FNMA Federal National Mortgage Association FSLIC Federal Savings and Loan Insurance Corporation G-7 Group of Seven
G-10 Group of Ten GNMA Government National Mortgage Association GDP Gross domestic product HUD Department of Housing and Urban
Development IMF International Monetary Fund IO Interest only IPCs Individuals, partnerships, and corporations IRA Individual retirement account MMDA Money market deposit account MSA Metropolitan statistical area NOW Negotiable order of withdrawal OCD Other checkable deposit OPEC Organization of Petroleum Exporting Countries OTS Office of Thrift Supervision PO Principal only REIT Real estate investment trust REMIC Real estate mortgage investment conduit RP Repurchase agreement RTC Resolution Trust Corporation SAIF Savings Association Insurance Fund SCO Securitized credit obligation SDR Special drawing right SIC Standard Industrial Classification VA Department of Veterans Affairs
GENERAL INFORMATION
In many of the tables, components do not sum to totals because of rounding.
Minus signs are used to indicate (1) a decrease, (2) a negative figure, or (3) an outflow.
"U.S. government securities" may include guaranteed issues of U.S. government agencies (the flow of funds figures also
include not fully guaranteed issues) as well as direct obliga-tions of the Treasury. "State and local government" also in-cludes municipalities, special districts, and other political subdivisions.
Digitized for FRASER http://fraser.stlouisfed.org/ Federal Reserve Bank of St. Louis

A4 Domestic Nonfinancial Statistics • September 1996
1.10 RESERVES, MONEY STOCK, LIQUID ASSETS, A N D DEBT MEASURES
Percent annual rate of change, seasonally adjusted1
Monetary or credit aggregate 1995 1996 1996
Monetary or credit aggregate
Q3 Q4 Q1 Q2 Feb. Mar. Apr. May June
Reserves of depository institutions' 1 Total - 1 . 5 - 6 . 9 - 7 . 9 - 6 . 4 - 1 6 . 4 19.2 -11 .7 -20 .8 ' - 2 . 5 2 Required - 2 . 5 - 7 . 7 - 8 . 5 - 5 . 7 - 2 . 7 13.2 - 1 1 . 6 -15 .4 - 9 . 2 3 Nonborrowed - 2 . 4 - 6 . 4 - 6 . 5 - 7 . 6 - 1 6 . 3 19.6 - 1 3 . 2 -21 .6 r - 8 . 2 4 Monetary base3 1.7 2.7 1.5 2.1 - 4 . 2 r 8.9' - , 6 r 1.0 5.7
Concepts of money, liquid assets, and debt4
5 Ml - 1 . 5 - 5 . 1 - 2 . 7 - . 5 - 2 . 0 10.0 - 3 . 1 - 6 . 5 r - . 4 6 M2 6.9 4.1 5.9 4.1 5.4 11.7 2.0 - 1 . 6 5.6 7 M3 8.0 4.5 7.2 5.5 i o . r 11 . r 1.9r 3 . r 4.7 8 L 9.1 5.9 5.1 n.a. 4.4 12.6r 4.6r - . 9 n.a. 9 Debt 4.9r 4.7r 4.7' n.a. 6.6r 6.0r 4.6r 3.7 n.a.
Nontransaction components 10 In M25 10.9 8.3 9.7 6.2 8.6 12.4 4.2 .6 8.2 11 In M3 only6 12.1 6.3 12.6r 10.6 28.6r 9.0r 1.5r 21.4r 1.4
Time and savings deposits Commercial banks
12 Savings, including MMDAs 9.0 13.1 22.6 12.7 16.5 25.2 8.8 4.2r 12.3 13 Small time7 11.0 4.8 2.5 - 2 . 7 - 1 . 2 - 4 . 5 - 3 . 5 - 2 . 3 1.0 14 Large time8'9 13.0 19.4 8.9r 17.4 20. l r 27.4 7.8r 19.9r 16.6
Thrift institutions 15 Savings, including MMDAs - 7 . 3 - 2 . 8 - . 3 8.1 6.0 5.7 14.3 4.9 2.9 16 Small time7 4.1 5.0 - 2 . 5 r - 3 . 4 ,0r - 8 . 4 r - 1 . 7 - 2 . 7 - 3 . 1 17 Large time8 13.7 8.0 6.2 - 2 . 8 1.6 - 9 . 5 1.6 - 9 . 5 6.4
Monev market mutual funds 18 Retail 36.9 16.5 14.7 11.5 15.6 32.6 2.7 - 3 . 2 21.2 19 Institution-only 27.6 10.3 27.9 8.7 69.2 21.6 - 1 3 . 0 - 1 0 . 3 29.1
Repurchase agreements and Eurodollars 20 Repurchase agreements10 - 5 . 0 -14 .6 1.3 5.4 11.7 - 1 3 . 5 - 7 . 8 80.0r - 6 7 . 0 21 Eurodollars10 9.4 - 6 . 7 17.0r 11.9 12.6r —29.8r 35.7r 18.6r 11.0
Debt components4
22 Federal 4.6 2.3 2.7 n.a. 7.6 11.2 3.6r 1.8 n.a. 23 Nonfederal 5.0r 5.5r 5.4r n.a. 6.3r 4.1r 4.9r 4.4 n.a.
1. Unless otherwise noted, rates of change are calculated from average amounts outstand-ing during preceding month or quarter.
2. Figures incorporate adjustments for discontinuities, or "breaks," associated with regulatory changes in reserve requirements. (See also table 1.20.)
3. The seasonally adjusted, break-adjusted monetary base consists of (1) seasonally adjusted, break-adjusted total reserves (line 1), plus (2) the seasonally adjusted currency component of the money stock, plus (3) (for all quarterly reporters on the "Report of Transaction Accounts, Other Deposits and Vault Cash" and for all weekly reporters whose vault cash exceeds their required reserves) the seasonally adjusted, break-adjusted difference between current vault cash and the amount applied to satisfy current reserve requirements.
4. Composition of the money stock measures and debt is as follows: Ml : (1) currency outside the U.S. Treasury, Federal Reserve Banks, and the vaults of
depository institutions, (2) travelers checks of nonbank issuers, (3) demand deposits at all commercial banks other than those owed to depository institutions, the U.S. government, and foreign banks and official institutions, less cash items in the process of collection and Federal Reserve float, and (4) other checkable deposits (OCDs), consisting of negotiable order of withdrawal (NOW) and automatic transfer service (ATS) accounts at depository institutions, credit union share draft accounts, and demand deposits at thrift institutions. Seasonally adjusted Ml is computed by summing currency, travelers checks, demand deposits, and OCDs, each seasonally adjusted separately.
M2: Ml plus (1) savings (including MMDAs), (2) small-denomination time deposits (time deposits—including retail RPs—in amounts of less than $100,000), and (3) balances in retail money market mutual funds (money funds with minimum initial investments of less than $50,000). Excludes individual retirement accounts (IRAs) and Keogh balances at depository institutions and money market funds. Seasonally adjusted M2 is calculated by summing savings deposits, small-denomination time deposits, and retail money fund balances, each seasonally adjusted separately, and adding this result to seasonally adjusted Ml .
M3: M2 plus (1) large-denomination time deposits (in amounts of $100,000 or more), (2) balances in institutional money funds (money funds with minimum initial investments of $50,000 or more), (3) RP liabilities (overnight and term) issued by all depository institutions, and (4) Eurodollars (overnight and term) held by U.S. residents at foreign branches of U.S. banks worldwide and at all banking offices in the United Kingdom and Canada. Excludes
amounts held by depository institutions, the U.S. government, money market funds, and foreign banks and official institutions. Seasonally adjusted M3 is calculated by summing large time deposits, institutional money fund balances, RP liabilities, and Eurodollars, each seasonally adjusted separately, and adding this result to seasonally adjusted M2.
L: M3 plus the nonbank public holdings of U.S. savings bonds, short-term Treasury securities, commercial paper, and bankers acceptances, net of money market fund holdings of these assets. Seasonally adjusted L is computed by summing U.S. savings bonds, short-term Treasury securities, commercial paper, and bankers acceptances, each seasonally adjusted separately, and then adding this result to M3.
Debt: The debt aggregate is the outstanding credit market debt of the domestic nonfinancial sectors—the federal sector (U.S. government, not including government-sponsored enter-prises or federally related mortgage pools) and the nonfederal sectors (state and local governments, households and nonprofit organizations, nonfinancial corporate and nonfarm noncorporate businesses, and farms). Nonfederal debt consists of mortgages, tax-exempt and corporate bonds, consumer credit, bank loans, commercial paper, and other loans. The data, which are derived from the Federal Reserve Board's flow of funds accounts, are break-adjusted (that is, discontinuities in the data have been smoothed into the series) and month-averaged (that is, the data have been derived by averaging adjacent month-end levels).
5. Sum of (1) savings deposits (including MMDAs), (2) small time deposits, and (3) retail money fund balances, each seasonally adjusted separately.
6. Sum of (1) large time deposits, (2) institutional money fund balances, (3) RP liabilities (overnight and term) issued by depository institutions, and (4) Eurodollars (overnight and term) of U.S. addressees, each seasonally adjusted separately.
7. Small time deposits—including retail RPs—are those issued in amounts of less than $100,000. All IRA and Keogh account balances at commercial banks and thrift institutions are subtracted from small time deposits.
8. Large time deposits are those issued in amounts of $100,000 or more, excluding those booked at international banking facilities.
9. Large time deposits at commercial banks less those held by money market funds, depository institutions, the U.S. government, and foreign banks and official institutions.
10. Includes both overnight and term.
Digitized for FRASER http://fraser.stlouisfed.org/ Federal Reserve Bank of St. Louis

Money Stock and Bank Credit A5
1.11 RESERVES OF DEPOSITORY INSTITUTIONS AND RESERVE BANK CREDIT1
Millions of dollars
Average of daily figures
Apr. May
Average of daily figures for week ending on date indicated
May 15 May 22 May 29 June 5 June 12 June 19 June 26
SUPPLYING RESERVE FUNDS
1 Reserve Bank credit outstanding 418,391 416,807 420,910 415,263 416,944 416,366r 420,290 417,340 422,869 420,635 U.S. government securities2
2 Bought outright—System account 378,891 380,178 382,000 379,272 380,634 380,439 380,367 380,762 382,857 382,495 3 Held under repurchase agreements 4,566 1,983 4,456 727 2,315 2,176 5,772 2,402 5,418 3,086
Federal agency obligations 2,388 4 Bought outright 2,492 2,442 2,401 2,444 2,444 2,439 2,428 2,414 2,388 2,388
5 Held under repurchase agreements 180 503 524 2 876 686 1,118 511 256 747 6 Acceptances 0 0 0 0 0 0 0 0 0 0
Loans to depository institutions 7 Adjustment credit 57 24 185 27 26 25 12 7 586 22 8 Seasonal credit 33 106 190 92 113 133 142 152 193 227 9 Extended credit 0 0 0 0 0 0 0 0 0 0
10 Float 315 517 384 867 393 156r 73 642 312 730 11 Other Federal Reserve assets 31,857 31,054 30,769 31,832 30,143 30,313 30,378 30,451 30,861 30,941
12 Gold stock 11,052 11,051 11,051 11,051 11,051 11,051 11,051 11,051 11,051 11,050 13 Special drawing rights certificate account 10,168 10,168 10,168 10,168 10,168 10,168 10,168 10,168 10,168 10,168 14 Treasury currency outstanding 24,330r 24,408r 24,469 24,400r 24,414r 24,428r 24,442 24,456 24,470 24,484
ABSORBING RESERVE FUNDS
15 Currency in circulation 418,294r 420,043r 423,432 419,451r 419,729r 422,170r 423,021 423,295 423,204 423,290 16 Treasury cash holdings 312 276 281 265 265 264 269 288 285 279
Deposits, other than reserve balances, with Federal Reserve Banks
17 Treasury 7,318 5,714 6,162 5,673 5,127 5,175 4,276 5,697 6,022 7,184 18 Foreign 187 196 177 185 224 196 171 179 173 171 19 Service-related balances and adjustments 5,938 6,188 6,161 6,037 6,006 6,714 6,237 6,123 6,117 6,184 20 Other 370 362 330 381 365 348 311 330 336 332 21 Other Federal Reserve liabilities and capital 12,813 12,885 13,224 12,930 12,929 12,971 13,153 13,088 13,304 13,252 22 Reserve balances with Federal Reserve Banks' . . . 18,709 16,771 16,830 15,961 17,932 14,176r 18,515 14,016 19,117 15,646
End-of-month figures Wednesday figures
Mar. Apr. May May 15 May 22 May 29 June 5 June 12 June 19 June 26
SUPPLYING RESERVE FUNDS
1 Reserve Bank credit outstanding 416,892 420,959r 425,289 418,328 423,609 419,893r 422,764 418,454 433,333 421,389 U.S. government securities2
382,522 2 Bought outright—System account 381,806 381,346 383,914 380,134 380,661 381,789 379,748 382,860 382,761 382,522 3 Held under repurchase agreements 0 5,704 7,086 5,089 7,903 3,365 7,412 2,160 12,711 4,226
Federal agency obligations 2,388 4 Bought outright 2,444 2,428 2,388 2,444 2,444 2,428 2,428 2,388 2,388 2,388
5 Held under repurchase agreements 0 1,350 0 15 1,867 850 1,428 95 195 0 6 Acceptances 0 0 0 0 0 0 0 0 0 0
Loans to depository institutions 7 Adjustment credit 21 8 388 23 18 22 6 2 3,644 17 8 Seasonal credit 71 148 248 103 124 139 137 170 207 241 9 Extended credit 0 0 0 0 0 0 0 0 0 0
10 Float 821 —342r - 1 7 8 573 62 649r 1,215 189 92 919 11 Other Federal Reserve assets 31,728 30,318 31,443 29,948 30,529 30,652 30,391 30,590 31,334 31,076
12 Gold stock 11,052 11,051 11,050 11,051 11,051 11,051 11,051 11,051 11,051 11,050 13 Special drawing rights certificate account 10,168 10,168 10,168 10,168 10,168 10,168 10,168 10,168 10,168 10,168 14 Treasury currency outstanding 24,372r 24,442r 24,498 24,400r 24,414r 24,428r 24,442 24,456 24,470 24,484
ABSORBING RESERVE FUNDS
15 Currency in circulation 417,746r 422,397r 424,767 420,447r 421,086r 423,794r 423,832 424,231 423,817 424,817 16 Treasury cash holdings 288 265 280 265 264 265 288 287 279 280
Deposits, other than reserve balances, with Federal Reserve Banks
17 Treasury 11,042 3,757 7,701 4,079 4,906 5,381 5,588 5,562 6,142 7,290 18 Foreign 166 160 183 229 175 180 164 166 167 163 19 Service-related balances and adjustments 6,055 6,237 6,172 6,037 6,006 6,714 6,237 6,123 6,117 6,184 20 Other 360 300 326 376 353 357 329 336 326 326 21 Other Federal Reserve liabilities and capital 12,559 13,148 13,374 12,712 12,805 12,781 12,896 13,093 13,141 13,024 22 Reserve balances with Federal Reserve Banks3 . . 14,268 20,357r 18,203 19,803 23,648 16,067r 19,090 14,332 29,033 15,009
1. Amounts of cash held as reserves are shown in table 1.12, line 2. 3. Excludes required clearing balances and adjustments to compensate for float. 2. Includes securities loaned—fully guaranteed by U.S. government securities pledged
with Federal Reserve Banks—and excludes securities sold and scheduled to be bought back under matched sale-purchase transactions.
Digitized for FRASER http://fraser.stlouisfed.org/ Federal Reserve Bank of St. Louis

A6 Domestic Nonfinancial Statistics • September 1996
1.12 RESERVES A N D BORROWINGS Depository Institutions'
Millions of dollars
Prorated monthly averages of biweekly averages
Reserve classification 1993 1994 1995 1995 1996 Reserve classification
Dec. Dec. Dec. Dec. Jan. Feb. Mar. Apr. May June
1 Reserve balances with Reserve Banks" 29,374 24,658 20,440 20,440 17,763 16,792 18,426 19,181 16,753 16,593 2 Total vault cash3 36,818 40,378 42,088r 42,088r 44,676r 42,115r 40,892r 40,889r 41,146 41,979 3 Applied vault cash4 33,484 36,682 37,460 37,460 39,170 36,957 36,458 36,688 36,382 37,095 4 Surplus vault cash5 3,334 3,696 4,628r 4.628r 5,506r 5,158r 4,435r 4,20 r 4,764 4,883 5 Total reserves6 62,858 61,340 57,900 57,900 56,934 53,749 54,884 55,869 53,135 53,688 6 Required reserves 61,795 60,172 56,622 56.622 55,449 52,898 53,747 54,750 52,275 52,534 7 Excess reserve balances at Reserve Banks7 1,063 1,168 1,278 1,278 1,485 851 1,137 1,120 860 1,155 8 Total borrowings at Reserve Banks8 82 209 257 257 38 35 21 91 127 386 9 Seasonal borrowings 31 100 40 40 7 7 10 34 105 192
10 Extended credit9 0 0 0 0 0 0 0 0 0 0
Biweekly averages of daily figures for two week periods ending on dates indicated
1996
Feb. 28 Mar. 13 Mar. 27 Apr. 10 Apr. 24 May 8 May 22 June 5r June 19 July 3
1 Reserve balances with Reserve Banks2 17,938 18,192 18,492 18,954 20,331 16,876 16,946 16,341 16,565 16,743 2 Total vault cash"1 40.242r 41,461r 40,362r 40,903r 40,398r 42,013r 40,823r 40,879 42,824 41,403 3 Applied vault cash4 35,468 36,845 36,011 36,767 36,417 37,190 36,091 36,117 37,747 36,712 4 Surplus vault cash5 4,774r 4,616r 4,352r 4,136r 3,98 l r 4,823r 4,732r 4,762 5,078 4,692 5 Total reserves6 53,406 55,037 54,502 55,721 56,748 54,065 53,037 52,458 54,311 53,455 6 Required reserves 52,436 53,926 53.346 54,567 55,629 53,002 52,201 51,743 53,234 52,003 7 Excess reserve balances at Reserve Banks7 970 1,111 1,156 1,154 1,119 1,063 836 715 1,078 1,451 8 Total borrowings at Reserve Banks8 47 15 20 47 122 92 129 156 469 386 9 Seasonal borrowings 8 8 12 16 30 71 103 138 173 241
10 Extended credit9 0 0 0 0 0 0 0 0 0 0
1. Data in this table also appear in the Board's H.3 (502) weekly statistical release. For ordering address, see inside front cover. Data are not break-adjusted or seasonally adjusted.
2. Excludes required clearing balances and adjustments to compensate for float and includes other off-balance-sheet "as-of ' adjustments.
3. Total "lagged" vault cash held by depository institutions subject to reserve requirements. Dates refer to the maintenance periods during which the vault cash may be used to satisfy reserve requirements. The maintenance period for weekly reporters ends sixteen days after the lagged computation period during which the vault cash is held. Before Nov. 25, 1992, the maintenance period ended thirty days after the lagged computation period.
4. All vault cash held during the lagged computation period by "bound" institutions (that is, those whose required reserves exceed their vault cash) plus the amount of vault cash applied during the maintenance period by "nonbound" institutions (that is, those whose vault cash exceeds their required reserves) to satisfy current reserve requirements.
5. Total vault cash (line 2) less applied vault cash (line 3). 6. Reserve balances with Federal Reserve Banks (line 1) plus applied vault cash
(line 3). 7. Total reserves (line 5) less required reserves (line 6). 8. Also includes adjustment credit. 9. Consists of borrowing at the discount window under the terms and conditions estab-
lished for the extended credit program to help depository institutions deal with sustained liquidity pressures. Because there is not the same need to repay such borrowing promptly as with traditional short-term adjustment credit, the money market effect of extended credit is similar to that of nonborrowed reserves.
1.13 SELECTED BORROWINGS IN IMMEDIATELY AVAILABLE FUNDS Large Banks'
Millions of dollars, averages of daily figures
Source and maturity
1996, week ending Monday
Source and maturity Apr. 2 9 May 6 May 13 May 2 0 May 2 7 June 3 June 10 June 17 June 24
Federal funds purchased, repurchase agreements, and other selected borrowings
From commercial banks in the United States 1 For one day or under continuing contract 8 1 , 9 2 0 9 0 , 6 3 4 9 0 , 2 8 1 8 7 , 2 7 1 8 3 . 4 6 1 8 5 , 5 7 7 8 2 , 1 7 9 8 0 , 0 9 2 7 3 , 5 0 3 2 For all other maturities 17,657 17 .658 18 ,091 1 7 , 7 1 9 18 .158 1 8 , 8 7 3 1 7 , 8 7 6 18 ,253 1 8 , 3 0 6
From other depository institutions, foreign banks and official institutions, and U.S. government agencies
3 For one day or under continuing contract 19 ,054 1 9 . 8 7 6 2 6 , 5 1 3 2 2 , 6 1 3 2 1 , 7 9 3 2 1 , 1 5 8 19 ,602 1 7 , 3 9 4 2 4 , 7 7 6 4 For all other maturities 19 ,418 2 1 . 2 7 0 2 1 , 7 3 8 2 1 , 8 6 8 2 3 , 2 9 6 2 2 , 2 0 6 2 1 , 0 5 4 2 1 , 1 8 3 2 1 , 9 3 2
Repurchase agreements on U.S. government and federal agency securities
Brokers and nonbank dealers in securities 5 For one day or under continuing contract 16.707 1 9 , 4 9 0 2 0 . 2 6 8 2 4 , 2 0 2 2 1 , 3 5 4 2 2 , 7 0 6 2 0 , 4 4 0 19 ,331 19 ,183 6 For all other maturities 4 0 , 4 7 9 4 1 . 9 1 0 4 4 . 4 2 7 3 8 , 9 2 3 4 0 , 4 4 5 3 9 , 7 5 8 3 9 , 5 3 4 3 8 , 9 1 7 3 8 , 1 7 3
All other customers 3 8 , 1 7 3
7 For one day or under continuing contract 3 5 , 3 1 4 3 6 , 1 4 9 3 7 , 5 9 4 3 8 , 3 3 1 3 9 , 1 6 6 3 9 , 4 3 9 3 8 , 1 5 3 3 7 , 5 6 0 3 5 , 5 8 8 8 For all other maturities 13 ,962 13 ,732 14 .125 14 ,259 1 4 , 1 3 0 1 3 , 6 5 2 13,611 14 ,195 1 4 , 3 6 2
MEMO Federal funds loans and resale agreements in immediately
available funds in maturities of one day or under continuing contract
9 To commercial banks in the United States 6 8 , 1 1 7 7 4 , 7 2 1 6 8 . 7 0 8 6 5 , 6 4 4 6 5 , 1 5 3 6 8 , 8 7 4 6 8 , 5 5 9 7 0 , 4 9 0 6 6 , 1 1 2 10 To all other specified customers" 2 6 , 5 4 8 2 9 , 9 2 2 2 6 , 3 9 6 2 6 , 4 3 2 2 5 , 6 4 7 2 7 , 1 3 6 2 5 , 8 4 7 2 7 , 7 6 2 2 4 , 7 7 5
1. Banks with assets of $4 billion or more as of Dec. 31, 1988. 2. Brokers and nonbank dealers in securities, other depository institutions, foreign banks Data in this table also appear in the Board's H.5 (507) weekly statistical release. For and official institutions, and U.S. government agencies,
ordering address, see inside front cover.
Digitized for FRASER http://fraser.stlouisfed.org/ Federal Reserve Bank of St. Louis

Policy Instruments A7
1.14 FEDERAL RESERVE BANK INTEREST RATES
Percent per year
Current and previous levels
Federal Reserve Bank
Adjustment credit
On 8/2/96
Seasonal credit '
On 8/2/96
Extended credit3
On 8/2/96 Effective date Previous rate
Boston New York. . . . Philadelphia. . Cleveland Richmond. . . . Atlanta
Chicago St. Louis Minneapolis . . Kansas City . . Dallas San Francisco.
2/1/96 1/31/96 1/31/96 1/31/96 2/1/96 1/31/96
2/1/96 2/5/96 1/31/96 2/1/96 1/31/96 1/31/96
8/1/96 8/1/96
8/1/96 8/1/96
Range of rates for adjustment credit in recent years
Effective date Range (or
level)—All F.R. Banks
F.R. Bank of
N.Y.
Range (or F.R. Bank Range (or F.R. Bar level)—All of Effective date level)—All of F.R. Banks N.Y. F.R. Banks N.Y.
13-14 13 1988—Aug. 9 6-6 .5 6.5 13 13 11 6.5 6.5 12 12
1989—Feb. 24 6.5-7 7 11.5-12 11.5 27 7 7
11.5 11.5 11-11.5 11 1990—Dec. 19 6.5 6.5
11 11 10.5 10.5 1991—Feb. 1 6-6.5 6
10-10.5 10 4 6 6 10 10 Apr. 30 5.5-6 5.5
9.5-10 9.5 May 2 5.5 5.5 9.5 9.5 Sept. 13 5-5.5 5
9-9.5 9 17 5 5 9 9 Nov. 6 4.5-5 4.5
8.5-9 9 7 4.5 4.5 8.5-9 8.5 Dec. 20 3 . 5 ^ . 5 3.5
8.5 8.5 24 3.5 3.5
8.5-9 9 1992—July 2 3-3.5 3 9 9 7 3 3
8.5-9 8.5 8.5 8.5 1994—May 17 3-3.5 3.5 8 8 18 3.5 3.5
Aug. 16 3.5-4 4 7.5-8 7.5 18 4 4
7.5 7.5 Nov. 15 4-4.75 4.75 17 4.75 4.75
7-7.5 7 7 7 1995—Feb. 1 4.75-5.25 5.25
6.5-7 6.5 9 5.25 5.25 6.5 6.5 6 6 1996—Jan. 31 5.00-5.25 5.00
5.5-6 5.5 Feb. 5 5.00 5.00 5.5 5.5
In effect Aug. 2, 1996 5.00 5.00 5.5-6 6
6 6
In effect Dec. 31, 1977
1978—Jan. 9 20
May 11 12
July 3 10
Aug. 21 Sept. 22 Oct. 16
20 Nov. 1
3
1979—July 20 Aug. 17
20 Sept. 19
21 Oct. 8
10
1980—Feb. 15 19
May 29 30
June 13 16
July 28 29
Sept. 26 Nov. 17 Dec. 5
8 1981—May 5
6-6.5 6.5
6.5-7 7
7-7.25 7.25 7.75
8 8-8.5
8.5 8.5-9.5
9.5
10 10-10.5
10.5 10.5-11
11 11-12
12
12-13 13
12-13 12
11-12 11
10-11 10 11 12
12-13 13
13-14 14
6.5 6.5 7 7 7.25 7.25 7.75
9.5 9.5
10 10.5 10.5 11 11 12 12
13 13 13 12 11 11 10 10 11 12 13 13 14 14
1981—Nov. 2 6
Dec. 4
1982—July 20 23
Aug. 2 3
16 27 30
Oct. 12 13
Nov. 22 26
Dec. 14 15 17
1984—Apr. 9 13
Nov. 21 26
Dec. 24
1985—May 20 24
1986—Mar. 7 10
Apr. 21 23.
July 11 Aug. 21
22
1987—Sept. 4 11
1. Available on a short-term basis to help depository institutions meet temporary needs for funds that cannot be met through reasonable alternative sources. The highest rate established for loans to depository institutions may be charged on adjustment credit loans of unusual size that result from a major operating problem at the borrower's facility.
2. Available to help relatively small depository institutions meet regular seasonal needs for funds that arise from a clear pattern of intrayearly movements in their deposits and loans and that cannot be met through special industry lenders. The discount rate on seasonal credit takes into account rates charged by market sources of funds and ordinarily is reestablished on the first business day of each two-week reserve maintenance period; however, it is never less than the discount rate applicable to adjustment credit.
3. May be made available to depository institutions when similar assistance is not reasonably available from other sources, including special industry lenders. Such credit may be provided when exceptional circumstances (including sustained deposit drains, impaired access to money market funds, or sudden deterioration in loan repayment performance) or practices involve only a particular institution, or to meet the needs of institutions experiencing difficulties adjusting to changing market conditions over a longer period (particularly at times of deposit disintermediation). The discount rate applicable to adjustment credit ordinarily is charged on extended-credit loans outstanding less than thirty days; however, at the discretion
of the Federal Reserve Bank, this time period may be shortened. Beyond this initial period, a flexible rate somewhat above rates charged on market sources of funds is charged. The rate ordinarily is reestablished on the first business day of each two-week reserve maintenance period, but it is never less than the discount rate applicable to adjustment credit plus 50 basis points.
4. For earlier data, see the following publications of the Board of Governors: Banking and Monetary Statistics, 1914-1941, and 1941-1970; and the AnnuaI Statistical Digest, 1970-1979.
In 1980 and 1981, the Federal Reserve applied a surcharge to short-term adjustment-credit borrowings by institutions with deposits of $500 million or more that had borrowed in successive weeks or in more than four weeks in a calendar quarter. A 3 percent surcharge was in effect from Mar. 17, 1980, through May 7, 1980. A surcharge of 2 percent was reimposed on Nov. 17, 1980; the surcharge was subsequently raised to 3 percent on Dec. 5, 1980, and to 4 percent on May 5, 1981. The surcharge was reduced to 3 percent effective Sept. 22, 1981, and to 2 percent effective Oct. 12, 1981. As of Oct. 1, 1981, the formula for applying the surcharge was changed from a calendar quarter to a moving thirteen-week period. The surcharge was eliminated on Nov. 17, 1981.
Digitized for FRASER http://fraser.stlouisfed.org/ Federal Reserve Bank of St. Louis

A8 Domestic Nonfinancial Statistics • September 1996
1.15 RESERVE REQUIREMENTS OF DEPOSITORY INSTITUTIONS1
Type of deposit
Requirement
Type of deposit Percentage of
deposits Effective date
Net transaction accounts2
1 $0 million-$52.0 million3 3 10
0
0
12/19/95 12/19/95
12/27/90
12/27/90
3 10
0
0
12/19/95 12/19/95
12/27/90
12/27/90
3 10
0
0
12/19/95 12/19/95
12/27/90
12/27/90
3 10
0
0
12/19/95 12/19/95
12/27/90
12/27/90
3 10
0
0
12/19/95 12/19/95
12/27/90
12/27/90
1. Required reserves must be held in the form of deposits with Federal Reserve Banks or vault cash. Nonmember institutions may maintain reserve balances with a Federal Reserve Bank indirectly, on a pass-through basis, with certain approved institutions. For previous reserve requirements, see earlier editions of the Annual Report or the Federal Reserve Bulletin. Under the Monetary Control Act of 1980, depository institutions include commercial banks, mutual savings banks, savings and loan associations, credit unions, agencies and branches of foreign banks, and Edge Act corporations.
2. Transaction accounts include all deposits against which the account holder is permitted to make withdrawals by negotiable or transferable instruments, payment orders of with-drawal, or telephone or preauthorized transfers for the purpose of making payments to third persons or others. However, money market deposit accounts (MMDAs) and similar accounts subject to the rules that permit no more than six preauthorized, automatic, or other transfers per month (of which no more than three may be by check, draft, debit card, or similar order) are savings deposits, not transaction accounts.
3. The Monetary Control Act of 1980 requires that the amount of transaction accounts against which the 3 percent reserve requirement applies be modified annually by 80 percent of the percentage change in transaction accounts held by all depository institutions, determined as of June 30 of each year. Effective Dec. 19, 1995, the amount was decreased from $54.0 million to $52.0 million.
Under the Garn-St Germain Depository Institutions Act of 1982, the Board adjusts the amount of reservable liabilities subject to a zero percent reserve requirement each year for the
succeeding calendar year by 80 percent of the percentage increase in the total reservable liabilities of all depository institutions, measured on an annual basis as of June 30. No corresponding adjustment is made in the event of a decrease. The exemption applies only to accounts that would be subject to a 3 percent reserve requirement. Effective Dec. 19, 1995, the exemption was raised from $4.2 million to $4.3 million.
4. The reserve requirement was reduced from 12 percent to 10 percent on Apr. 2, 1992, for institutions that report weekly, and on Apr. 16, 1992, for institutions that report quarterly.
5. For institutions that report weekly, the reserve requirement on nonpersonal time deposits with an original maturity of less than 1 xfi years was reduced from 3 percent to 1 l/i percent for the maintenance period that began Dec. 13, 1990, and to zero for the maintenance period that began Dec. 27, 1990. For institutions that report quarterly, the reserve requirement on nonpersonal time deposits with an original maturity of less than 1 years was reduced from 3 percent to zero on Jan. 17, 1991.
The reserve requirement on nonpersonal time deposits with an original maturity of 1 'A years or more has been zero since Oct. 6, 1983.
6. The reserve requirement on Eurocurrency liabilities was reduced from 3 percent to zero in the same manner and on the same dates as the reserve requirement on nonpersonal time deposits with an original maturity of less than 1 l/i years (see note 5).
Digitized for FRASER http://fraser.stlouisfed.org/ Federal Reserve Bank of St. Louis

Policy Instruments A9
1.17 FEDERAL RESERVE OPEN MARKET TRANSACTIONS1
Millions of dollars
Type of transaction and maturity 1993 1994 1995
1995 1996 Type of transaction
and maturity 1993 1994 1995 Nov. Dec. Jan. Feb. Mar. Apr. May
U.S. TREASURY SECURITIES
Outright transactions (excluding matched transactions)
Treasury bills 1 Gross purchases 17,717 17,484 10,932 4,271 0 0 0 0 88 0 2 Gross sales 0 0 0 0 0 0 0 0 0 0 3 Exchanges 332,229 376,277 398,487 39,057 31,535 31,476 39,332 30,556 32,218 40,467 4 Redemptions 0 0 900 0 0 0 0 0 0 0
Others within one year 5 Gross purchases 1,223 1,238 390 0 390 0 0 0 35 0 6 Gross sales 0 0 0 0 0 0 0 0 0 0 7 Maturity shifts 31,368 0 0 6,108 0 2,048 2,746 0 3,511 5,107 8 Exchanges -36,582 -21,444 0 -4 ,937 0 -3 ,287 -7 ,575 0 -4 ,824 -5 ,448 9 Redemptions 0 0 0 0 0 1,228 0 0 787 0
One to five years 10 Gross purchases 10,350 9,168 4,966 0 2,317 0 0 0 1,899 0 11 Gross sales 0 0 0 0 0 0 0 0 0 0 12 Maturity shifts -27 ,140 -6 ,004 0 -5 ,292 0 -2 ,048 -1 ,908 0 -3 ,511 -4 ,049 13 Exchanges 0 17,801 0 3,237 0 3,287 5,175 0 4,824 3,748
Five to ten years 14 Gross purchases 4,168 3,818 1,239 400 0 0 0 0 479 0 15 Gross sales 0 0 0 0 0 0 0 0 0 0 16 Maturity shifts 0 -3 ,145 0 - 8 1 6 0 0 - 8 1 8 0 0 -1 ,058 17 Exchanges 0 2,903 0 1,700 0 0 1,500 0 0 1,700
More than ten years 18 Gross purchases 3,457 3,606 3,122 0 1,884 0 0 0 1,065 0 19 Gross sales 0 0 0 0 0 0 0 0 0 0 20 Maturity shifts 0 - 9 1 8 0 0 0 0 - 2 0 0 0 0 21 Exchanges 0 775 0 0 0 0 900 0 0 0
All maturities 22 Gross purchases 36,915 35,314 20,649 4,671 4,591 0 0 0 3,566 0 23 Gross sales 0 0 0 0 0 0 0 0 0 0 24 Redemptions 767 2,337 2,376 0 0 1,228 0 0 787 0
Matched transactions 25 Gross purchases 1,475,941 1,700,836 2,197,736 226,340 227,858 260,425 274,290 251,623 253,482 259,135 26 Gross sales 1,475,085 1,701,309 2,202,030 228,419 228,071 259,186 275,979 251,086 251,510 259,595
Repurchase agreements 48,869 27 Gross purchases 475,447 309,276 331,694 44,569 34,325 16,040 6,230 31,602 48,869 30,688
28 Gross sales 470,723 311,898 328,497 39,876 28,546 28,802 6,230 27,706 50,345 23,703
29 Net change in U.S. Treasury securities 41,729 29,882 17,175 7,285 10,157 -12,751 -1 ,689 4,433 3,274 6,525
FEDERAL AGENCY OBLIGATIONS
Outright transactions 30 Gross purchases 0 0 0 0 0 0 0 0 0 0 31 Gross sales 0 0 0 0 0 0 0 0 0 0 32 Redemptions 774 1,002 1,303 120 58 0 0 108 82 16
Repurchase agreements M Gross purchases 35,063 52,696 36,851 3,763 2,888 9,793 765 5,640 2,372 5,222 34 Gross sales 34,669 52,696 36,776 3,973 1,788 10,893 765 4,640 3,372 3,122
35 Net change in federal agency obligations - 3 8 0 -1 ,002 -1 ,228 - 3 3 0 1,042 -1 ,100 0 892 -1 ,082 2,084
36 Total net change in System Open Market Accoun t . . . 41,348 28,880 15,948 6,955 11,199 -13 ,851 -1 ,689 5,325 2,192 8,609
1. Sales, redemptions, and negative figures reduce holdings of the System Open Market Account; all other figures increase such holdings.
Digitized for FRASER http://fraser.stlouisfed.org/ Federal Reserve Bank of St. Louis

A10 Domestic Nonfinancial Statistics • September 1996
1.18 FEDERAL RESERVE BANKS Condition and Federal Reserve Note Statements'
Millions of dollars
Wednesday End of month
Account 1996 1 9 9 6
May 2 9 June 5 June 12 June 19 June 26 Apr. 3 0 May 31 June 30
Consolidated condition statement
ASSETS
1 Gold certificate account 11 ,051 11,051 11 ,051 11 ,051 1 1 , 0 5 0 1 1 , 0 5 2 11 ,051 1 1 , 0 5 0 2 Special drawing rights certificate account 10 ,168 10 ,168 10 ,168 1 0 , 1 6 8 1 0 , 1 6 8 1 0 , 1 6 8 1 0 , 1 6 8 1 0 , 1 6 8 3 5 3 8 5 2 9 5 3 8 5 4 2 5 3 6 5 7 4 5 5 2 5 5 2
Loans 4 To depository institutions 161 142 172 3 , 8 5 1 2 5 8 9 3 155 6 3 6 5 Other 0 0 0 0 0 0 0 0 6 Acceptances held under repurchase agreements 0 0 0 0 0 0 0 0
Federal agency obligations 2 , 4 2 8 7 Bought outright 2 , 4 2 8 2 , 4 2 8 2 , 3 8 8 2 , 3 8 8 2 , 3 8 8 2 , 4 4 4 2 , 4 2 8 2 , 3 8 8
8 Held under repurchase agreements 8 5 0 1 ,428 9 5 195 0 0 1 ,350 0
9 Total U.S. Treasury securities 385,154 387,160 385,020 395,472 386,748 381,806 387,050 391,000
10 Bought outright" 3 8 1 , 7 8 9 3 7 9 , 7 4 8 3 8 2 , 8 6 0 3 8 2 , 7 6 1 3 8 2 . 5 2 2 3 8 1 , 8 0 6 3 8 1 , 3 4 6 3 8 3 , 9 1 4 n Bills 1 8 5 , 2 4 4 183 ,203 1 8 6 , 3 1 5 1 8 6 , 2 1 6 1 8 5 , 9 7 8 1 8 5 , 2 6 2 1 8 4 , 8 0 1 1 8 7 , 3 7 0 i? Notes 1 5 0 , 1 0 2 1 5 0 , 1 0 2 1 5 0 , 1 0 2 1 5 0 , 1 0 2 1 5 0 , 1 0 2 1 5 0 , 1 0 2 1 5 0 , 1 0 2 1 5 0 , 1 0 2 13 Bonds 4 6 , 4 4 3 4 6 , 4 4 3 4 6 , 4 4 3 4 6 , 4 4 3 4 6 , 4 4 3 4 6 , 4 4 3 4 6 , 4 4 3 4 6 , 4 4 3 14 Held under repurchase agreements 3 , 3 6 5 7 , 4 1 2 2 , 1 6 0 12 ,711 4 , 2 2 6 0 5 , 7 0 4 7 , 0 8 6
15 Total loans and securities 388,593 391,159 387,675 401,906 389,394 384,343 390,983 394,025
16 Items in process of collection 8 , 2 0 0 7 , 7 0 8 6 , 0 9 8 6 , 3 8 4 6 , 1 6 2 8 , 4 5 2 4 , 0 0 7 4 , 1 5 2 17 Bank premises 1 ,170 1,171 1,181 1 ,182 1 ,182 1 ,158 1 ,171 1 ,182
Other assets 18 Denominated in foreign currencies3 19 ,737 19 ,567 1 9 , 5 7 4 19 ,583 19 ,591 1 9 , 7 0 5 19 ,561 1 9 , 5 5 4 19 All other4 9 , 6 9 3 9 , 5 8 9 9 , 7 8 0 1 0 , 5 2 4 1 0 , 3 2 8 1 0 , 7 6 0 9 , 5 3 8 1 0 , 7 2 6
2 0 Total assets 449,151 450,941 446,065 461,339 448,412 446,211 447,032 451,409
LIABILITIES
21 Federal Reserve notes 4 0 0 , 1 6 9 4 0 0 , 2 0 8 4 0 0 , 5 9 9 4 0 0 , 1 6 8 4 0 1 , 1 4 9 3 9 4 , 2 3 6 3 9 8 , 7 7 3 4 0 1 , 1 0 1
2 2 Total deposits 28,579 31,494 26,672 42,090 28,845 31,975 30,901 32,804
2 3 Depository institutions 2 2 . 6 6 0 2 5 , 4 1 2 2 0 , 6 0 8 3 5 , 4 5 6 2 1 , 0 6 7 2 0 , 4 0 7 2 6 , 6 8 5 2 4 , 5 9 4 2 4 U.S. Treasury—General account 5 , 3 8 1 5 , 5 8 8 5 , 5 6 2 6 , 1 4 2 7 , 2 9 0 1 1 , 0 4 2 3 , 7 5 7 7 , 7 0 1 2 5 Foreign—Official accounts 180 164 166 167 163 166 160 183 2 6 Other 3 5 7 3 2 9 3 3 6 3 2 6 3 2 6 3 6 0 3 0 0 3 2 6
2 7 Deferred credit items 7 , 6 2 2 6 , 3 4 3 5 ,701 5 , 9 4 0 5 , 3 9 3 7 , 4 4 1 4 , 2 1 0 4 , 1 3 0 2 8 Other liabilities and accrued dividends5 4 , 1 5 3 4 , 4 1 1 4 , 3 9 1 4 , 4 1 5 4 , 3 1 4 4 , 0 6 1 4 , 5 4 2 4 , 4 6 4
2 9 Total liabilities 440,523 442,456 437,363 452,614 439,701 437,713 438,426 442,499
CAPITAL ACCOUNTS
3 0 Capital paid in 4 , 1 0 0 4 , 1 5 5 4 , 1 3 9 4 , 1 4 7 4 , 1 3 8 4 , 0 2 3 4 , 1 5 4 4 , 1 3 8 31 Surplus 3 , 9 6 6 3 , 9 6 6 3 . 9 6 6 3 , 9 6 6 3 , 9 6 6 3 , 9 5 7 3 , 9 6 0 3 , 9 6 6 3 2 Other capital accounts 5 6 2 3 6 4 5 9 8 6 1 1 6 0 7 5 1 8 4 9 2 8 0 6
3 3 Total liabilities and capital accounts 449,151 450,941 446,065 461,339 448,412 446,211 447,032 451,409
MEMO 3 4 Marketable U.S. Treasury securities held in custody for
foreign and international accounts 5 5 3 , 9 7 3 5 6 3 , 1 6 6 5 6 1 , 6 0 1 5 5 3 , 4 0 3 5 4 9 , 3 4 5 5 5 0 , 6 6 2 5 5 6 , 8 3 2 5 5 1 , 7 9 7
Federal Reserve note statement
3 5 Federal Reserve notes outstanding (issued to Banks) 5 1 3 , 9 4 3 5 1 4 , 4 4 9 5 1 6 , 4 8 8 5 1 8 , 2 8 0 5 1 8 , 5 1 3 5 0 7 , 9 2 8 5 1 4 , 0 9 8 5 1 9 , 2 3 4 3 6 LESS: Held by Federal Reserve Banks 1 1 3 , 7 7 4 114 ,241 1 1 5 , 8 8 9 1 1 8 , 1 1 2 1 1 7 , 3 6 4 1 1 3 , 6 9 1 1 1 5 , 3 2 5 1 1 8 , 1 3 3 3 7 Federal Reserve notes, net 4 0 0 , 1 6 9 4 0 0 , 2 0 8 4 0 0 . 5 9 9 4 0 0 , 1 6 8 4 0 1 , 1 4 9 3 9 4 , 2 3 6 3 9 8 , 7 7 3 4 0 1 , 1 0 1
Collateral held against notes, net 3 8 Gold certificate account 11 ,051 11 ,051 11.051 11,051 1 1 , 0 5 0 1 1 , 0 5 2 11 ,051 1 1 , 0 5 0 3 9 Special drawing rights certificate account 1 0 , 1 6 8 1 0 , 1 6 8 1 0 , 1 6 8 1 0 , 1 6 8 1 0 , 1 6 8 1 0 , 1 6 8 10 ,168 1 0 , 1 6 8 4C Other eligible assets 0 0 0 0 0 0 0 0 41 U.S. Treasury and agency securities 3 7 8 , 9 5 0 3 7 8 , 9 8 9 3 7 9 , 3 8 0 3 7 8 , 9 4 9 3 7 9 , 9 3 1 3 7 3 , 0 1 7 3 7 7 , 5 5 4 3 7 9 , 8 8 3
4 2 Total collateral 400,169 400,208 400,599 400,168 401,149 394,236 398,773 401,101
1. Some of the data in this table also appear in the Board's H.4.1 (503) weekly statistical release. For ordering address, see inside front cover.
2. Includes securities loaned—fully guaranteed by U.S. Treasury securities pledged with Federal Reserve Banks—and excludes securities sold and scheduled to be bought back under matched sale-purchase transactions.
3. Valued monthly at market exchange rates. 4. Includes special investment account at the Federal Reserve Bank of Chicago in Treasury
bills maturing within ninety days. 5. Includes exchange-translation account reflecting the monthly revaluation at market
exchange rates of foreign exchange commitments.
Digitized for FRASER http://fraser.stlouisfed.org/ Federal Reserve Bank of St. Louis

Federal Reserve Banks A l l
1.19 FEDERAL RESERVE BANKS Maturity Distribution of Loan and Security Holding
Millions of dollars
Type of holding and maturity
Wednesday End of month
Type of holding and maturity 1996 1996 Type of holding and maturity
May 29 June 5 June 12 June 19 June 26 Apr. 30 May 31 June 30
1 Total loans 161 143 172 3,851 258 92 156 249
2 Within fifteen days' 148 31 37 3,833 245 59 75 231 3 Sixteen days to ninety days 12 112 135 19 13 33 80 18
4 Total U.S. Treasury securities 385,154 387,160 385,020 395,472 386,748 381,806 381,346 383,914
5 Within fifteen days' 20,249 15,453 14,548 21,867 18,573 15,945 2,926 4,410 6 Sixteen days to ninety days 92,031 93,546 89,860 93,144 92,629 91,464 98,950 99,558 7 Ninety-one days to one year 109,536 114,805 117,256 117,106 112,191 111,381 116,114 116,591 8 One year to five years 91,676 91,694 91,694 91,694 91,694 91,995 91,694 91,694 9 Five years to ten years 32,941 32,941 32,941 32,941 32,941 32,299 32,941 32,941
10 More than ten years 38,721 38,721 38,721 38,721 38,721 38,721 38,721 38,721
11 Total federal agency obligations 3,278 3,856 2,483 2,582 2,387 2,443 2,428 2,388
12 Within fifteen days' 1,222 1,458 95 465 307 154 372 307 13 Sixteen days to ninety days 473 770 800 530 493 685 473 495 14 Ninety-one days to one year 575 610 612 612 612 577 575 610 15 One year to five years 512 512 485 485 485 512 512 485 16 Five years to ten years 472 472 467 467 467 492 472 467 17 More than ten years 25 25 25 25 25 25 25 25
1. Holdings under repurchase agreements are classified as maturing within fifteen days in NOTE. Total acceptances data have been deleted from this table because data are no longer accordance with maximum maturity of the agreements. available.
Digitized for FRASER http://fraser.stlouisfed.org/ Federal Reserve Bank of St. Louis

A12 Domestic Nonfinancial Statistics • September 1996
1.20 AGGREGATE RESERVES OF DEPOSITORY INSTITUTIONS AND MONETARY BASE1
Billions of dollars, averages of daily figures
1995 1996
Item 1992 1993 1994 1995 Item Dec. Dec. Dec. Dec. Nov. Dec. Jan. Feb. Mar. Apr. Mayr June
ADJUSTED FOR Seasonally adjusted
CHANGES IN RESERVE REQUIREMENTS-
1 Total reserves3 54.37 60.52 59.36 56.36 56.33 56.36 55.61 54.85 55.73 55.18 54.23 54.12 2 Nonborrowed reserves4 54.24 60.44 59.16 56.11 56.13 56.11 55.57 54.81 55.71 55.09 54.10 53.73 3 Nonborrowed reserves plus extended credit5 54.24 60.44 59.16 56.11 56.13 56.11 55.57 54.81 55.71 55.09 54.10 53.73 4 Required reserves 53.21 59.46 58.20 55.09 55.39 55.09 54.12 54.00 54.59 54.06 53.37 52.96 5 Monetary base6 351.24 386.88 418.72 435.01 433.21 435.01 435.18r 433.67 436.87r 436.64r 437.00 439.07
Not seasonally adjusted
6 Total reserves7 56.06 62.37 61.13 58.02 56.57 58.02 56.95 53.80 54.97 56.00 53.29 53.87 7 Nonborrowed reserves 55.93 62.29 60.92 57.76 56.37 57.76 56.91 53.77 54.95 55.90 53.16 53.49 8 Nonborrowed reserves plus extended credit' 55.93 62.29 60.92 57.76 56.37 57.76 56.91 53.77 54.95 55.90 53.16 53.49 9 Required reserves8 54.90 61.31 59.96 56.74 55.63 56.74 55.47 52.95 53.84 54.88 52.43 52.72
10 Monetary baseJ 354.55 390.59 422.51 439.03 433.22 439.03 436.01 430.29 434.86r 437.12r 436.13 439.87
NOT ADJUSTED FOR CHANGES IN RESERVE REQUIREMENTS10
11 Total reserves" 56.54 62.86 61.34 57.90 56.40 57.90 56.93 53.75 54.88 55.87 53.14 53.69 12 Nonborrowed reserves 56.42 62.78 61.13 57.64 56.19 57.64 56.90 53.72 54.86 55.78 53.01 53.30 13 Nonborrowed reserves plus extended credit5 56.42 62.78 61.13 57.64 56.19 57.64 56.90 53.72 54.86 55.78 53.01 53.30 14 Required reserves 55.39 61.80 60.17 56.62 55.45 56.62 55.45 52.90 53.75 54.75 52.28 52.53 15 Monetary base1- 360.90 397.62 427.25 444.45 438.19 444.45 441.96 436.26 440.77r 442.96r 442.16 445.93 16 Excess reserves13 1.16 1.06 1.17 1.28 .94 1.28 1.49 .85 1.14 1.12 .86 1.16 17 Borrowings from the Federal Reserve .12 .08 .21 .26 .20 .26 .04 .04 .02 .09 .13 .39
1. Latest monthly and biweekly figures are available from the Board's H.3 (502) weekly statistical release. Historical data starting in 1959 and estimates of the effect on required reserves of changes in reserve requirements are available from the Money and Reserves Projections Section, Division of Monetary Affairs, Board of Governors of the Federal Reserve System, Washington, DC 20551.
2. Figures reflect adjustments for discontinuities, or "breaks," associated with regulatory changes in reserve requirements. (See also table 1.10.)
3. Seasonally adjusted, break-adjusted total reserves equal seasonally adjusted, break-adjusted required reserves (line 4) plus excess reserves (line 16).
4. Seasonally adjusted, break-adjusted nonborrowed reserves equal seasonally adjusted, break-adjusted total reserves (line 1) less total borrowings of depository institutions from the Federal Reserve (line 17).
5. Extended credit consists of borrowing at the discount window under the terms and conditions established for the extended credit program to help depository institutions deal with sustained liquidity pressures. Because there is not the same need to repay such borrowing promptly as with traditional short-term adjustment credit, the money market effect of extended credit is similar to that of nonborrowed reserves.
6. The seasonally adjusted, break-adjusted monetary base consists of (1) seasonally adjusted, break-adjusted total reserves (line 1), plus (2) the seasonally adjusted currency component of the money stock, plus (3) (for all quarterly reporters on the "Report of Transaction Accounts, Other Deposits and Vault Cash" and for all those weekly reporters whose vault cash exceeds their required reserves) the seasonally adjusted, break-adjusted difference between current vault cash and the amount applied to satisfy current reserve requirements.
7. Break-adjusted total reserves equal break-adjusted required reserves (line 9) plus excess reserves (line 16).
8. To adjust required reserves for discontinuities that are due to regulatory changes in reserve requirements, a multiplicative procedure is used to estimate what required reserves would have been in past periods had current reserve requirements been in effect. Break-adjusted required reserves include required reserves against transactions deposits and nonper-sonal time and savings deposits (but not reservable nondeposit liabilities).
9. The break-adjusted monetary base equals (1) break-adjusted total reserves (line 6), plus (2) the (unadjusted) currency component of the money stock, plus (3) (for all quarterly reporters on the "Report of Transaction Accounts, Other Deposits and Vault Cash" and for all those weekly reporters whose vault cash exceeds their required reserves) the break-adjusted difference between current vault cash and the amount applied to satisfy current reserve requirements.
10. Reflects actual reserve requirements, including those on nondeposit liabilities, with no adjustments to eliminate the effects of discontinuities associated with regulatory changes in reserve requirements.
11. Reserve balances with Federal Reserve Banks plus vault cash used to satisfy reserve requirements.
12. The monetary base, not break-adjusted and not seasonally adjusted, consists of (1) total reserves (line 11), plus (2) required clearing balances and adjustments to compensate for float at Federal Reserve Banks, plus (3) the currency component of the money stock, plus (4) (for all quarterly reporters on the "Report of Transaction Accounts, Other Deposits and Vault Cash" and for all those weekly reporters whose vault cash exceeds their required reserves) the difference between current vault cash and the amount applied to satisfy current reserve requirements. Since the introduction of contemporaneous reserve requirements in February 1984, currency and vault cash figures have been measured over the computation periods ending on Mondays.
13. Unadjusted total reserves (line 11) less unadjusted required reserves (line 14).
Digitized for FRASER http://fraser.stlouisfed.org/ Federal Reserve Bank of St. Louis

Monetary and Credit Aggregates A13
1.21 MONEY STOCK, LIQUID ASSETS, AND DEBT MEASURES1
Billions of dollars, averages of daily figures
1996
Item 1992 1993 1994 1995 Item Dec. Dec. Dec. Dec. Mar. Apr. May June
Seasonally adjusted
Measures2
1 Ml 1,024.4 1,128.6 1,148.7 1,124.9 1,126.6 1,123.7 1,117.6' 1,117.2 2 M2 3,438.7 3,494.1 3,509.4 3,662.6 3,729.9 3,736.2' 3,731.2' 3,748.7 3 M3 4,187.3 4,249.6 4,319.7 4,576.0 4,686.2r 4,693.7' 4,705.8' 4,724.4 4 L 5,075.8 5,164.5 5,303.7 5,685.5 5,785.2r 5,807.3' 5,803.1 n.a. 5 Debt 1 l,880.5r 12,517.4r 13,159.3r 13,894.8r 14,080.9r 14,134.3' 14,178.2 n.a.
Ml components 379.4 6 Currency3 292.9 322.4 354.9 373.2 375.2 376.0' 377.1' 379.4
7 Travelers checks4 8.1 7.9 8.5 8.9 8.9 8.9 8.7 8.6 8 Demand deposits5 339.1 384.3 382.4 389.8 407.1 406.3 409.6' 413.6 9 Other checkable deposits6 384.2 414.0 402.9 353.0 335.4 332.6 322.1 315.6
Nontransaclion components 10 In M27 2,414.3 2,365.4 2,360.7 2,537.7 2,603.3 2,612.4 2,613.6 2,631.5 11 In M3 only8 748.6 755.6 810.3 913.4 956.3r 957.5' 974.6' 975.7
Commercial banks 12 Savings deposits, including MMDAs 754.1 785.0 751.9 775.0 821.0 827.0 829.9' 838.4 13 Small time deposits9 509.3 470.4 505.4 578.5 578.1 576.4 575.3 575.8 14 Large time deposits10- " 286.6 272.3 298.7 342.4 354.2r 356.5' 362.4' 367.4
Thrift institutions 15 Savings deposits, including MMDAs 433.0 433.8 397.0 359.5 362.1 366.4 367.9 368.8 16 Small time deposits9 361.9 317.6 318.2 359.6 354.5 354.0 353.2 352.3 17 Large time deposits10 67.1 61.5 64.8 75.0 75.5 75.6 75.0 75.4
Money market mutual funds 18 Retail 356.0 358.7 388.1 465.1 487.6 488.7 487.4 496.0 19 Institution-only 199.8 197.9 183.7 227.2 248.3 245.6 243.5 249.4
Repurchase agreements and Eurodollars 20 Repurchase agreements12 128.1 157.5 180.8 177.6 184.1 182.9 195.1' 184.2 21 Eurodollars'2 66.9 66.3 82.3 91.2 94.2r 97.0' 98.5' 99.4
Debt components 3,712.6 22 Federal debt 3,068.6 3,328.3 3,497.6 3,644.6 3,696.0 3,707.0' 3,712.6 n.a.
23 Nonfederal debt 8,812.0r 9,189.1r 9,661.7r 10,250.2r 10,384.9r 10,427.3' 10,465.6 n.a.
Not seasonally adjusted
Measures2
24 Ml 1,046.0 1,153.7 1,174.2 1,150.7 1,115.9 1,130.1' 1,104.4' 1,113.3 25 M2 3,455.1 3,514.1 3,529.8 3,682.3 3,722.7 3,749.1' 3,716.6 3,747.0 26 M3 4,205.3 4,271.3 4,341.5 4,597.1 4,676. l r 4,698.5' 4,690.6' 4,721.6 27 L 5,103.1 5,194.2 5,333.2 5,715.0 5,786.0r 5,812.9' 5,783.9 n.a. 28 Debt ll,881.5 r 12,509.6' 13,150.2' 13,878.0'' 14,032.7' 14,061.0' 14,070.0 n.a.
Ml components 377.5 380.5 29 Currency3 295.0 324.8 357.5 376.1 374.3 375.8 377.5 380.5
30 Travelers checks4 7.8 7.6 8.1 8.5 8.6 8.6 8.6 8.9 31 Demand deposits5 354.4 401.8 400.1 407.9 397.5 406.1 399.5 409.8 32 Other checkable deposits6 388.9 419.4 408.4 358.1 335.6' 339.6' 318.7 314.2
Nontransaclion components 33 In M27 2,409.1 2,360.4 2,355.6 2,531.5 2,606.8 2,619.0 2,612.3 2,633.7 34 In M3 only8 750.2 757.1 811.7 914.8 953.4' 949.4' 974.0' 974.6
Commercial banks 35 Savings deposits, including MMDAs 752.9 784.3 751.6 775.0 819.0 826.0 827.9' 840.1 36 Small time deposits9 507.8 468.2 502.5 574.5 579.3 578.3 577.4 577.9 37 Large time deposits10, " 286.2 272.1 298.5 342.3 352.6 353.8' 364.7' 368.1
Thrift institutions 38 Savings deposits, including MMDAs 432.4 433.4 396.9 359.5 361.2 365.9 367.0 369.6 39 Small time deposits9 360.9 316.1 316.4 357.1 355.2' 355.2 354.5 353.5 40 Large time deposits10 67.0 61.5 64.8 75.0 75.2 75.0 75.5 75.5
Money market mutual funds 41 Retail 355.1 358.3 388.2 465.4 492.1 493.5 485.5 492.5 42 Institution-only 201.1 199.4 185.5 229.4 248.7 242.8 241.1 244.5
Repurchase agreements and Eurodollars 43 Repurchase agreements'2 127.2 156.6 179.6 176.1 182.3 182.3 195.4' 187.9 44 Eurodollars'2 68.7 67.6 83.4 91.9 94.6' 95.6' 97.3' 98.6
Debt components 45 Federal debt 3,069.8 3,329.5 3,499.0 3,645.9 3,698.1 3,699.5' 3,692.1 n.a. 46 Nonfederal debt 8,811.7r 9,180.1r 9,651.2' 10,232. l r 10,334.5' 10,361.5' 10,378.0 n.a.
Footnotes appear on following page.
Digitized for FRASER http://fraser.stlouisfed.org/ Federal Reserve Bank of St. Louis

A14 Domestic Nonfinancial Statistics • September 1996
NOTES TO TABLE 1.21
1. Latest monthly and weekly figures are available from the Board's H.6 (508) weekly statistical release. Historical data starting in 1959 are available from the Money and Reserves Projections Section, Division of Monetary Affairs, Board of Governors of the Federal Reserve System, Washington, DC 20551.
2. Composition of the money stock measures and debt is as follows: Ml : (1) currency outside the U.S. Treasury, Federal Reserve Banks, and the vaults of
depository institutions, (2) travelers checks of nonbank issuers, (3) demand deposits at all commercial banks other than those owed to depository institutions, the U.S. government, and foreign banks and official institutions, less cash items in the process of collection and Federal Reserve float, and (4) other checkable deposits (OCDs), consisting of negotiable order of withdrawal (NOW) and automatic transfer service (ATS) accounts at depository institutions, credit union share draft accounts, and demand deposits at thrift institutions. Seasonally adjusted Ml is computed by summing currency, travelers checks, demand deposits, and OCDs, each seasonally adjusted separately.
M2: Ml plus (1) savings deposits (including MMDAs), (2) small-denomination time deposits (time deposits—including retail RPs—in amounts of less than $100,000), and (3) balances in retail money market mutual funds (money funds with minimum initial invest-ments of less than $50,000). Excludes individual retirement accounts (IRAs) and Keogh balances at depository institutions and money market funds. Seasonally adjusted M2 is calculated by summing savings deposits, small-denomination time deposits, and retail money fund balances, each seasonally adjusted separately, and adding this result to seasonally adjusted Ml .
M3: M2 plus (1) large-denomination time deposits (in amounts of $100,000 or more) issued by all depository institutions, (2) balances in institutional money funds (money funds with minimum initial investments of $50,000 or more), (3) RP liabilities (overnight and term) issued by all depository institutions, and (4) Eurodollars (overnight and term) held by U.S. residents at foreign branches of U.S. banks worldwide and at all banking offices in the United Kingdom and Canada. Excludes amounts held by depository institutions, the U.S. govern-ment, money market funds, and foreign banks and official institutions. Seasonally adjusted M3 is calculated by summing large time deposits, institutional money fund balances, RP liabilities, and Eurodollars, each seasonally adjusted separately, and adding this result to seasonally adjusted M2.
L: M3 plus the nonbank public holdings of U.S. savings bonds, short-term Treasury securities, commercial paper, and bankers acceptances, net of money market fund holdings of
these assets. Seasonally adjusted L is computed by summing U.S. savings bonds, short-term Treasury securities, commercial paper, and bankers acceptances, each seasonally adjusted separately, and then adding this result to M3.
Debt: The debt aggregate is the outstanding credit market debt of the domestic nonfinancial sectors—the federal sector (U.S. government, not including government-sponsored enter-prises or federally related mortgage pools) and the nonfederal sectors (state and local governments, households and nonprofit organizations, nonfinancial corporate and nonfarm noncorporate businesses, and farms). Nonfederal debt consists of mortgages, tax-exempt and corporate bonds, consumer credit, bank loans, commercial paper, and other loans. The data, which are derived from the Federal Reserve Board's flow of funds accounts, are break-adjusted (that is, discontinuities in the data have been smoothed into the series) and month-averaged (that is, the data have been derived by averaging adjacent month-end levels).
3. Currency outside the U.S. Treasury, Federal Reserve Banks, and vaults of depository institutions.
4. Outstanding amount of U.S. dollar-denominated travelers checks of nonbank issuers. Travelers checks issued by depository institutions are included in demand deposits.
5. Demand deposits at commercial banks and foreign-related institutions other than those owed to depository institutions, the U.S. government, and foreign banks and official institu-tions, less cash items in the process of collection and Federal Reserve float.
6. Consists of NOW and ATS account balances at all depository institutions, credit union share draft account balances, and demand deposits at thrift institutions.
7. Sum of (1) savings deposits (including MMDAs), (2) small time deposits, and (3) retail money fund balances.
8. Sum of (1) large time deposits, (2) institutional money fund balances, (3) RP liabilities (overnight and term) issued by depository institutions, and (4) Eurodollars (overnight and term) of U.S. addressees.
9. Small time deposits—including retail RPs—are those issued in amounts of less than $100,000. All IRAs and Keogh accounts at commercial banks and thrift institutions are subtracted from small time deposits.
10. Large time deposits are those issued in amounts of $ 100,000 or more, excluding those booked at international banking facilities.
11. Large time deposits at commercial banks less those held by money market funds, depository institutions, the U.S. government, and foreign banks and official institutions.
12. Includes both overnight and term.
Digitized for FRASER http://fraser.stlouisfed.org/ Federal Reserve Bank of St. Louis

Monetary and Credit Aggregates A15
1.22 DEPOSIT INTEREST RATES AND AMOUNTS OUTSTANDING Commercial and BIF-insured saving banks1
1995 1 9 9 6
Item 1993 1994R
Item Dec. Dec. Oct. Nov. Dec. Jan. Feb. Mar. Apr. May June
Interest rates (annual effective yields)2
INSURED COMMERCIAL BANKS
1 Negotiable order of withdrawal accounts 1.86 1.96 1.91 1.93 1.91 1 .90 1.91 1.85 1 .89 1.88 1 .90 2 Savings deposits3 2 . 4 6 2 . 9 2 3 .11 3 . 1 3 3 . 1 0 3 .01 2 . 9 8 2 .91 2 .91 2 . 8 9 2 . 8 5
Interest-bearing time deposits with balances of less than $100,000, by maturity
3 7 to 91 days 2.65 3.79 4.11 4.13 4.10 4.02 3.99 4.02 4.01 3.99 4 . 0 5 4 92 to 182 days 2.91 4.44 4.75 4.74 4.68 4.57 4.45 4.49 4.51 4.51 4.55 5 183 days to 1 year 3.13 5.12 5.15 5.11 5 . 0 2 4.91 4.79 4.83 4 . 8 6 4.89 4.94 6 More than 1 year to 2 l/i years 3.55 5.74 5.31 5.27 5.17 5.03 4.89 4.94 5.03 5.11 5.18 7 More than 2 Vi years 4.28 6.30 5.56 5.49 5.40 5.26 5.10 5.19 5.28 5.36 5.46
BIF-INSURED SAVINGS BANKS 4
8 Negotiable order of withdrawal accounts 1.87 1.94 1.98 1.94 1.91 1.85 1.84 1.83 1.84 1.82 1.80 9 Savings deposits3 2.63 2.87 2.96 2.99 2.98 2.95 2.92 2.86 2.85 2.84 2.85
Interest-bearing time deposits with balances of less than $100,000, by maturity
10 7 to 91 days 2.81 3.80 4.32 4.43 4.43 4.38 4.26 4.37 4.42 4.49 4.54 11 92 to 182 days 3.02 4.89 5.05 5.02 4.95 4.86 4.77 4.76 4.77 4.83 4.91 12 183 days to 1 year 3.31 5.52 5.31 5.28 5.18 5.06 4.91 4.89 4.91 4.96 5.02 13 More than 1 year to 2[A years 3.67 6.09 5.51 5.47 5.33 5.22 5.10 5.15 5.23 5.25 5.35 14 More than 2 Vl years 4.62 6.43 5.68 5.64 5.46 5.34 5.24 5.24 5.32 5.38 5.51
Amounts outstanding (millions of dollars)
INSURED COMMERCIAL BANKS
15 Negotiable order of withdrawal accounts 305,237 304,896 258,175 257,098 248,417 245,749 242,930 218,604 228,736 208,881' 202,948 16 Savings deposits3 767,035 737,068 745,936 753,139 776,466 768,071 784,035 827,666 805,431 839,457' 844,223 17 Personal 598,276 580,438 585,896 588,995 615,113 612,321 623,110 661,919 640,003 670,124' 673,452 18 Nonpersonal 168,759 156,630 160,040 164,144 161,353 155,750 160,925 165,748 165,428 169,333' 170,771
Interest-bearing time deposits with balances of less than $100,000, by maturity
19 7 to 91 days 29,362 32,265 29,906 31,093 32,170 33,783 35,719 35,377 34,076 33,414r 30,636 20 92 to 182 days 109,050 96,650 93,390 95,513 93,941 95,350 97,219 97,141 96,064 96,264' 93,809 21 183 days to 1 year 145,386 163,062 187,727 184,704 183,834 184,046 184,095 186,158 190,045 193,021' 195,384 22 More than 1 year to 21/2 years 139,781 164,395 206,579 208,315 208,601 212,394 210,493 208,915 208,277 207,826' 210,216 23 More than 2 Vi years 180,461 192,712 199,471 199,389 199,002 199,254 198,922 198,980 197,797 196,542' 199,405
24 IRA and Keogh plan deposits 144,011 144,155 150,101 149,647 150,546' 150,366 149,965 150,496 150,586 150,084' 150,537
BIF-INSURED SAVINGS BANKS 4
25 Negotiable order of withdrawal accounts 11,191 11,175 10,789 11,088 11,918 11,139 11,597 11,703 11,492 11,744 11,234 26 Savings deposits3 80,376 70,082 67,732 68,345 68,643 66,702 67,614 67,276 66,808 67,715 66,886 27 Personal 77,263 67,159 64,432 64,932 65,366 63,377 64,524 64,208 63,559 64,199 63,554 28 Nonpersonal 3,113 2,923 3,300 3,413 3,277 3,325 3,090 3,068 3,249 3,516 3,331
Interest-bearing time deposits with balances of less than $100,000, by maturity
29 7 to 91 days 2,746 2,144 1,691 1,819 2,001 2,009 2,131 2,140 2,179 2,345 2,226 30 92 to 182 days 12,974 11,361 10,790 11,394 12,140 12,334 13,247 13,477 13,911 13,934 13,702 31 183 days to 1 year 17,469 18,391 24,006 24,833 25,686 26,304 26,863 26,534 27,265 28,079 27,907 32 More than 1 year to years 16,589 17,787 26,678 27,149 27,482 26,582 26,945 25,934 25,684 25,422 25,492 33 More than 2Vi years 20,501 21,293 22,411 22,552 22,866 22,449 21,819 22,646 22,526 22,638 22,568
34 IRA and Keogh plan accounts 19,791 19,013 21,042 21,231 21,321' 20,827 20,845 20,615 20,553 20,543 20,709
1. BIF, Bank Insurance Fund. Data in this table also appear in the Board's H.6 (508) Special Supplementary Table monthly statistical release. For ordering address, see inside front cover. Estimates are based on data collected by the Federal Reserve System from a stratified random sample of about 425 commercial banks and 75 savings banks on the last day of each month. Data are not seasonally adjusted and include IRA and Keogh deposits and foreign currency-denominated deposits. Data exclude retail repurchase agreements and depos-its held in U.S. branches and agencies of foreign banks.
2. As of October 31, 1994, interest rate data for NOW accounts and savings deposits reflect a series break caused by a change in the survey used to collect these data.
3. Includes personal and nonpersonal money market deposits. 4. Includes both mutual and federal savings banks.
Digitized for FRASER http://fraser.stlouisfed.org/ Federal Reserve Bank of St. Louis

A16 Domestic Nonfinancial Statistics • September 1996
1.23 BANK DEBITS A N D DEPOSIT TURNOVER1
Debits are in billions of dollars; turnover is ratio of debits to deposits; monthly data are at annual rates
1995 1996r
Bank group, or type of deposit 19932 Bank group, or type of deposit 19932
Nov. Dec. Jan. Feb. Mar. Apr.
DEBITS Seasonally adjusted
Demand deposits3
1 All insured banks 334,784.1 369,029.1 397,649.3 409,460.9 397,538.3 430,421.2 447,869.0 422,696.7 463,745.4 2 Major New York City banks 171,224.3 191,168.8 201,161.4 204,484.0 203,977.5 229,379.2 238,538.4 224,066.5 245,449.1 3 Other banks 163,559.7 177,860.3 196,487.9 204,976.9 193,560.8 201,042.0 209,330.6 198,630.2 218,296.3
4 Other checkable deposits4 3,481.5 3,798.6 4,207.4 4,891.5 4,595.5 4,975.7 5,034.6 5,023.9 5,355.8 5 Savings deposits (including MMDAs)5 3,497.4 3,766.3 4,507.8 5,679.4 5,703.6 6,029.4 6,397.6 6,340.6 7,325.5
DEPOSIT TURNOVER
Demand deposits3
6 All insured banks 785.9 817.4 874.1 905.5 852.7 916.8 950.6 881.0 970.1 7 Major New York City banks 4,198.1 4.481.5 4,867.3 5,222.3 5,069.7 5,368.0 5,852.3 5,608.2 5,884.4 8 Other banks 424.6 435.1 475.2 496.3 454.4 471.1 486.4 451.6 500.3
9 Other checkable deposits4 11.9 12.6 15.4 19.1 18.6 20.8 21.6 22.1 23.6 10 Savings deposits (including MMDAs)5 4.6 4.9 6.1 7.5 7.4 7.7 8.1 7.8 9.0
DEBITS Not seasonally adjusted
Demand deposits3
11 All insured banks 334,899.2 369,121.8 397,657.8 398,219.1 411,802.7 429,213.3 414,819.1 442,977.6 457,392.9 12 Major New York City banks 171,283.5 191,226.0 201,182.6 202,744.5 210,780.0 227,293.7 222,007.5 236,954.2 238,335.3 13 Other banks 163,615.7 177,895.7 196.475.3 195,474.6 201,022.7 201,919.6 192,811.6 206,023.4 219,057.6
14 Other checkable deposits4 3,481.7 3,795.6 4,202.6 4,566.6 4,784.8 5,402.5 4,638.5 5,072.5 5,659.7 15 Savings deposits (including MMDAs)5 3,498.3 3,764.4 4,500.8 5,388.7 6,013.9 6,302.9 5,790.7 6,503.7 7,657.1
DEPOSIT TURNOVER
Demand deposits3
16 All insured banks 786.1 818.2 874.6 860.5 847.5 895.4 900.9 947.0 956.6 17 Major New York City banks 4,197.9 4,490.3 4,873.1 5,046.6 4,900.9 5,109.7 5,427.5 6,060.5 5,774.9 18 Other banks 424.8 435.3 475.4 462.5 453.9 464.3 459.6 480.6 501.4
19 Other checkable deposits4 11.9 12.6 15.3 17.8 19.0 22.1 19.9 22.2 24.4 20 Savings deposits (including MMDAs)5 4.6 4.9 6.1 7.1 7.8 8.1 7.3 8.0 9.4
1. Historical tables containing revised data for earlier periods can be obtained from the Publications Section, Division of Support Services, Board of Governors of the Federal Reserve System, Washington, DC 20551.
Data in this table also appear in the Board's G.6 (406) monthly statistical release. For ordering address, see inside front cover.
2. Annual averages of monthly figures. 3. Represents accounts of individuals, partnerships, and corporations and of states and
political subdivisions.
4. As of January 1994, other checkable deposits (OCDs), previously defined as automatic transfer to demand deposits (ATSs) and negotiable order of withdrawal (NOW) accounts, were expanded to include telephone and preauthorized transfer accounts. This change redefined OCDs for debits data to be consistent with OCDs for deposits data.
5. Money market deposit accounts.
Digitized for FRASER http://fraser.stlouisfed.org/ Federal Reserve Bank of St. Louis

Commercial Banking Institutions A17
1.26 ASSETS A N D LIABILITIES OF COMMERCIAL BANKS1
Billions of dollars
Monthly averages Wednesday figures
Account 1995 1995 1996 1996
June Dec. Jan.r Feb/ Mar/ Apr/ Mayr June June 5 June 12 June 19 June 26
ALL COMMERCIAL BANKING INSTITUTIONS
Seasonally adjusted
Assets 1 Bank credit 3,515.1 3,606.1r 3,631.8 3,642.0 3,632.5 3,647.8 3,651.9 3,656.8 3,643.8 3,666.0 3,651.2 3,661.0 2 Securities in bank credit 987.8 991.5r 991.0 996.6 980.3 978.1 984.8 976.6 978.5 982.9 971.4 976.2 3 U.S. government securities 709.9 710.9r 703.0 715.9 705.1 704.5 713.2 706.8 706.4 708.7 703.6 708.1 4 Other securities 277.9 280.6r 288.0 280.6 275.1 273.7 271.5 269.8 272.1 274.2 267.8 268.1 5 Loans and leases in bank credit2 . . . 2,527.3 2,614.6r 2,640.8 2,645.5 2,652.2 2,669.7 2,667.2 2,680.2 2,665.3 2,683.1 2,679.9 2,684.8 6 Commercial and industrial 692.1 716.6 722.6 725.5 723.2 729.1 731.3 734.0 730.7 733.8 733.6 736.8 7 Real estate 1,052.9 1,079.3 1,086.4 1,089.4 1,094.0 1,095.2 1,096.6 1,099.5 1,096.4 1,100.1 1,100.2 1,099.9 8 Revolving home equity 77.8 79.1 79.7 79.9 79.9 80.0 79.7 79.2 78.9 78.9 79.1 79.8 9 Other 975.2 1,000.2 1,006.7 1,009.6 1,014.1 1,015.2 1,016.9 1,020.3 1,017.5 1,021.2 1,021.1 1,020.1
10 Consumer 478.6 495.7 499.5 499.2 502.1 504.6 502.2 507.7 506.6 508.3 507.0 507.8 11 Security3 88.0 83.8r 85.0 85.8 85.0 86.1 82.7 82.2 80.9 86.1 81.6 79.7 12 Other 215.7 239. l r 247.3 245.5 247.8 254.7 254.3 256.7 250.7 254.9 257.4 260.5 13 Interbank loans4 188.0 196.8 204.0 194.2 205.7 212.9 212.4 209.5 215.8 207.5 208.6 210.3 14 Cash assets5 211.2 223.7 233.1 219.1 215.6 221.7 218.5 215.8 210.8 214.2 222.0 219.2 15 Other assets6 223.7 239.6 237.0 242.6 241.6 244.1 243.3 253.4 261.4 253.2 250.4 248.5
16 Total assets7 4,081.2 4,209.7r 4,249.1 4,241.4 4,238.8 4,269.7 4,269.4 4,278.5 4,275.0 4,284.1 4,275.5 4,282.0
Liabilities 17 Deposits 2,587.0 2,659.2 2,687.2 2,681.0 2,701.3 2,717.8 2,715.9 2,720.1 2,719.7 2,721.3 2,711.8 2,727.9 18 Transaction 782.2 773.9 783.3 766.6 768.3 772.0 758.1 752.2 751.8 753.7 751.3 766.8 19 Nontransaction 1,804.8 1,885.3 1,903.9 1,914.4 1,933.0 1,945.8 1,957.8 1,967.9 1,967.9 1,967.6 1,960.5 1,961.0 20 Large time 397.7 421.3 421.7 425.8 428.3 432.5 439.1 444.4 443.0 444.0 443.6 443.1 21 Other 1,407.2 1,464.0 1,482.1 1,488.6 1,504.8 1,513.3 1,518.7 1,523.5 1,524.9 1,523.6 1,516.8 1,517.9 22 Borrowings 675.1 690.5 704.4 690.1 686.2 708.0 707.0 697.5 685.0 692.9 708.8 708.2 23 From banks in the U.S 187.0 198.4 207.3 194.2 206.6 209.3 208.5 203.8 211.1 203.5 199.8 204.8 24 From nonbanks in the U.S 488.1 492.2 497.1 495.9 479.7 498.7 498.5 493.7 473.9 489.4 509.0 503.4 25 Net due to related foreign offices 244.9 262.6 270.1 276.5 261.3 254.4 255.8 255.0 248.2 254.2 260.0 253.6 26 Other liabilities8 222.8 239.5r 231.9 235.2 226.3 234.1 222.3 228.9 238.6 231.3 228.0 222.4
27 Total liabilities 3,729.9 3,851.8r 3,893.7 3,882.7 3,875.3 3,914.2 3,901.0 3,901.4 3,891.5 3,899.7 3,908.7 3,912.0
28 Residual (assets less liabilities)9 351.3 357.9"" 355.4 358.6 363.5 355.4 368.4 377.0 383.4 384.4 366.8 369.9
Not seasonally adjusted
Assets 29 Bank credit 3,514.0 3,613.8r 3,622.5 3,633.7 3,626.9 3,649.0 3,648.8 3,653.6 3,646.7 3,660.4 3,651.5 3,649.3 30 Securities in bank credit 990.5 981.7' 978.7 991.6 984.8 983.5 989.2 977.8 985.3 984.1 973.6 974.6 31 U.S. government securities 710.7 1063' 697.7 711.3 709.5 710.6 714.1 706.9 709.2 708.9 704.9 706.8 32 Other securities 279.8 215.4' 281.0 280.3 275.3 272.9 275.1 270.8 276.1 275.2 268.7 267.8 33 Loans and leases in bank credit2 . . . 2,523.5 2,632. l r 2,643.9 2,642.1 2,642.0 2,665.5 2,659.6 2,675.8 2,661.5 2,676.4 2,677.9 2,674.7 34 Commercial and industrial 694.8 714.8r 719.6 723.7 727.1 735.0 736.8 737.0 734.7 734.5 737.4 738.6 35 Real estate 1,051.7 1,084. l r 1,086.1 1,086.3 1,088.4 1,091.4 1,093.5 1,098.1 1,094.1 1,099.0 1,098.1 1,098.5 36 Revolving home equity 77.7 79.2 79.5 79.4 79.1 79.5 79.6 79.2 78.7 78.8 79.0 79.9 37 Other 974.0 1,004.9 1,006.6 1,006.9 1,009.3 1,011.9 1,014.0 1,019.0 1,015.4 1,020.2 1,019.1 1,018.7 38 Consumer 475.1 501.5 504.1 499.8 497.9 501.8 500.5 504.0 503.3 504.1 503.1 504.7 39 Security3 86.0 87.7r 86.9 88.8 84.9 86.9 78.5 80.1 77.4 85.0 82.4 75.3 40 Other 215.8 244.0 247.1 243.6 243.6 250.5 250.3 256.6 252.0 253.8 256.8 257.6 41 Interbank loans4 184.5 209.2 213.0 196.1 203.6 209.9 205.7 205.7 215.6 207.2 200.7 198.0 42 Cash assets5 209.5 238.4 240.6 219.9 208.4 216.2 215.9 213.8 214.1 207.0 222.4 204.8 43 Other assets6 223.1 239.3 237.7 242.0 240.1 241.6 244.2 252.9 262.4 251.4 247.7 246.2
44 Total assets7 4,074.2 4v244.0r 4.2573 4,235.1 4,222.2 4,260.1 4,257.8 4,268.9 4,281.9 4,269.0 4,2653 4,241.4
Liabilities 45 Deposits 2,583.9 2,690.4 2,694.0 2,672.0 2,687.6 2,714.6 2,705.5 2,716.9 2,737.3 2,724.4 2,702.9 2,685.0 46 Transaction 775.9 809. lr 795.1 759.4 753.5 770.9 745.7 745.7 757.7 746.5 740.3 729.8 47 Nontransaction 1,808.0 1,881.2 1,898.9 1,912.6 1,934.1 1,943.7 1,959.8 1,971.2 1,979.5 1,977.9 1,962.6 1,955.2 48 Large time 397.7 420.3 418.8 426.4 429.8 432.4 444.5 444.3 447.1 446.9 443.6 440.4 49 Other 1,410.3 1,461.0 1,480.1 1,486.2 1,504.3 1,511.3 1,515.3 1,527.0 1,532.5 1,530.9 1,519.0 1,514.9 50 Borrowings 685.3 695.2 691.3 684.1 677.9 693.6 704.2 707.0 700.2 698.0 719.8 712.6 51 From banks in the U.S 188.4 211.4 214.3 195.9 201.7 208.0 205.6 205.4 215.6 207.1 200.7 198.7 52 From nonbanks in the U.S 496.9 483.8 477.0 488.2 476.2 485.5 498.7 501.7 484.6 490.8 519.2 513.9 53 Net due to related foreign offices 238.3 263.8 277.2 278.2 262.1 254.7 258.3 247.5 237.4 245.6 248.6 254.2 54 Other liabilities8 223.3 234.6r 233.7 235.7 227.8 230.4 224.9 229.7 241.0 232.8 226.5 223.8
55 Total liabilities 3,730.9 3,883.9r 3,896.2 3,870.0 3,855.5 3,8933 3,893.0 3,901.0 3,915.8 3,900.8 3,897.9 3,875.6
56 Residual (assets less liabilities)' 343.3 360. r 361.0 365.2 366.8 366.9 364.9 367.8 366.1 368.2 367.4 365.8
Footnotes appear on following page.
Digitized for FRASER http://fraser.stlouisfed.org/ Federal Reserve Bank of St. Louis

A18 Domestic Financial Statistics • September 1996
1.26 ASSETS AND LIABILITIES OF COMMERCIAL BANKS1
Billions of dollars
-Continued
Monthly averages Wednesday figures
Account 1995 1995 1996 1996
June Dec. Jan.r Feb.r Mar.r Apr/ Mayr June June 5 June 12 June 19 June 26
DOMESTICALLY CHARTERED COMMERCIAL BANKS
Seasonally adjusted
Assets 57 Bank credit 3,099.2 3,176.5r 3,197.0 3,195.2 3,195.8 3,207.0 3,209.1 3,206.5 3.200.1 3,207.8 3,204.0 3,210.3 58 Securities in bank credit 857.0 855.0 854.6 853.3 843.6 841.5 845.3 835.8 836.8 837.4 832.5 837.2 59 U.S. government securities 645.9 644.0r 640.2 643.5 635.5 634.6 637.1 629.3 629.5 630.0 626.7 631.0 60 Other securities 211.0 211.0r 214.4 209.8 208.1 206.9 208.3 206.5 207.3 207.4 205.9 206.3 61 Loans and leases in bank credit2 2,242.2 2.321.5r 2,342.4 2,341.9 2,352.2 2,365.5 2,363.7 2,370.7 2,363.3 2,370.4 2,371.4 2,373.1 62 Commercial and industrial 518.8 535.3r 540.2 540.6 540.8 545.4 547.5 547.7 546.3 546.7 547.7 549.0 63 Real estate 1,014.7 1,043.0 1,051.1 1,055.1 1.060.7 1,062.0 1,063.5 1,066.7 1,063.9 1,067.4 1,067.6 1,066.8 64 Revolving home equity 77.8 79.1 79.6 79.8 79.8 80.0 79.7 79.2 78.9 78.9 79.1 79.8 65 Other 936.9 963.9 971.5 975.3 980.9 982.0 983.9 987.5 985.0 988.5 988.6 987.0 66 Consumer 478.6 495.7 499.5 499.2 502.1 504.6 502.2 507.7 506.6 508.3 507.0 507.8 67 Security3 54.4 56.2 55.6 52.3 51.4 53.1 50.8 46.9 47.5 47.4 47.3 45.5 68 Other 175.7 191.2 196.0 194.7 197.1 200.4 199.6 201.6 199.0 200.6 201.8 204.0 69 Interbank loans4 165.5 173.7 182.2 173.5 184.9 191.9 191.0 187.1 190.9 185.4 180.9 192.6 70 Cash assets5 184.6 193.6 202.0 189.8 188.3 195.5 192.4 190.6 184.9 189.2 196.4 194.4 71 Other assets6 169.8 184.4 182.6 186.0 186.6 189.2 187.9 201.2 205.6 198.1 199.7 198.9
72 Total assets7 3,562.3 3,671.8r 3,707.0 3,687.9 3,699.0 3,726.7 3,723.7 3,728.5 3,724.7 3,723.7 3,724.2 3,7393
Liabilities 73 Deposits 2,424.9 2,491.8r 2,523.3 2,516.2 2,533.4 2,548.2 2,543.3 2,548.0 2,546.2 2,547.6 2,540.7 2,558.6 74 Transaction 772.8 763.4 772.6 755.9 758.5 761.4 747.1 741.3 740.7 742.8 739.9 756.3 75 Nontransaction 1,652.1 1,728.4 1,750.7 1,760.3 1,774.9 1,786.8 1,796.1 1,806.7 1,805.5 1,804.8 1,800.7 1,802.3 76 Large time 247.4 270.1 272.1 273.9 272.5 274.8 278.5 282.1 280.2 280.8 282.0 282.5 77 Other 1,404.6 1,458.3 1,478.7 1,486.4 1,502.4 1,511.9 1,517.6 1,524.5 1,525.3 1,524.0 1,518.8 1,519.8 78 Borrowings 562.6 577.5 590.1 572.4 574.4 588.6 582.1 577.5 565.7 568.9 588.0 589.0 79 From banks in the U.S 168.5 179.9 185.9 174.7 186.1 186.1 185.1 183.5 187.7 183.2 180.0 184.3 80 From nonbanks in the U.S 394.1 397.6 404.3 397.7 388.4 402.4 397.0 393.9 378.0 385.7 408.0 404.7 81 Net due to related foreign offices . . . . 90.8 91.0 93.0 90.5 81.2 84.6 88.0 79.7 72.9 79.7 80.7 81.5 82 Other liabilities8 142.6 155.3 153.5 155.7 149.7 157.6 149.2 157.8 164.1 156.1 159.5 154.6
83 Total liabilities 3,221.0 3,315.7 3360.0 3,334.7 3338.7 3378.9 3362.5 3362.9 3,348.8 33523 3368.9 3,383.7
84 Residual (assets less liabilities)9 341.3 356. l r 346.9 353.2 360.3 347.8 361.2 365.5 375.8 371.4 355.2 355.6
Not seasonally adjusted
Assets 85 Bank credit 3,100.9 3,182.5r 3,185.3 3,187.1 3,188.7 3,209.8 3,209.4 3,206.7 3,205.7 3,208.7 3,206.2 3,203.0 86 Securities in bank credit 861.0 848.5 843.6 849.4 847.0 846.8 848.6 839.1 843.7 842.0 837.2 838.1 87 U.S. government securities 647.6 640.2 633.0 639.4 638.7 640.3 638.7 630.5 633.3 631.8 628.7 630.6 88 Other securities 213.5 208.3r 210.5 210.0 208.3 206.4 209.9 208.6 210.3 210.1 208.5 207.5 89 Loans and leases in bank credit2 2,239.9 2,334.0r 2,341.7 2,337.7 2,341.8 2,363.1 2,360.8 2,367.6 2,362.0 2,366.7 2,369.0 2,364.9 90 Commercial and industrial 521.1 533.3r 537.1 539.8 543.9 551.3 553.0 550.1 550.1 548.1 550.9 550.1 91 Real estate 1,013.5 l,047.8r 1,051.0 1,051.8 1,055.0 1,058.6 1,060.6 1,065.4 1,061.6 1,066.3 1,065.4 1,065.6 92 Revolving home equity 77.7 79.2 79.5 79.4 79.1 79.4 79.5 79.2 78.7 78.8 79.0 79.8 93 Other 935.8 968.6 971.5 972.5 975.9 979.1 981.1 986.2 983.0 987.5 986.4 985.7 94 Consumer 475.1 501.5 504.1 499.8 497.9 501.8 500.5 504.0 503.3 504.1 503.1 504.7 95 Security3 54.7 56.9 54.0 53.3 51.4 54.0 49.7 47.1 47.5 49.1 48.8 43.4 96 Other 175.4 194.5 195.6 193.0 193.5 197.3 197.0 201.0 199.5 199.0 200.7 201.2 97 Interbank loans4 163.2 184.7 189.9 177.2 183.5 189.7 184.2 185.0 193.5 187.1 177.9 178.9 98 Cash assets5 182.1 208.5 209.8 191.7 181.4 190.6 190.1 187.8 187.9 181.1 196.0 179.0 99 Other assets6 169.5 183.7 183.5 184.9 185.9 188.4 188.1 200.9 206.1 195.9 197.6 197.3
100 Total assets7 3,558.8 3,702.7r 3,712.0 3,6843 3,682.9 3,722.0 3,715.2 3,723.4 3,736.2 3,715.8 3,720.7 3,701.4
Liabilities 101 Deposits 2,419.4 2,522.1 2,529.2 2,507.5 2,519.3 2,547.4 2,531.5 2,542.6 2,560.6 2,547.4 2,529.4 2,513.1 102 Transaction 766.8 798.3 784.2 748.8 743.8 760.9 735.4 735.1 747.2 736.3 729.5 719.2 103 Nontransaction 1,652.6 1,723.8 1,744.9 1,758.7 1,775.4 1,786.5 1,796.1 1,807.5 1,813.4 1,811.1 1,799.9 1,794.0 104 Large time 247.3 265.8 269.4 275.3 273.0 276.2 281.8 282.0 282.7 282.6 281.9 280.0 105 Other 1,405.3 1,458.1 1,475.5 1,483.4 1,502.5 1,510.3 1,514.3 1,525.5 1,530.7 1,528.5 1,518.0 1,514.0 106 Borrowings 569.1 584.0 580.8 571.2 566.7 573.2 581.1 582.8 577.3 570.1 594.1 591.0 107 From banks in the U.S 168.6 191.8 192.8 177.2 181.1 185.8 183.8 183.5 190.7 184.5 179.7 178.1 108 From nonbanks in the U.S 400.5 392.2 388.0 394.0 385.6 387.5 397.2 399.3 386.6 385.7 414.4 412.9 109 Net due to related foreign offices . . . . 89.6 89.3 92.9 92.3 84.5 85.0 93.2 78.5 73.0 79.5 77.2 82.8 110 Other liabilities8 142.7 153.3 154.2 154.1 151.5 155.6 150.6 158.2 165.2 156.6 158.6 154.9
111 Total liabilities 3,220.8 3348.8 3357.1 3325.1 3322.0 3361.2 3356.4 3362.0 3376.1 3,353.6 3359.4 3,341.8
112 Residual (assets less liabilities)9 337.9 353.9r 355.0 359.2 360.9 360.8 358.9 361.4 360.0 362.2 361.3 359.6
1. Covers the following types of institutions in the fifty states and the District of Columbia: domestically chartered commercial banks that submit a weekly report of condition (large domestic); other domestically chartered commercial banks (small domestic); branches and agencies of foreign banks; New York State investment companies, and Edge Act and agreement corporations (foreign-related institutions). Excludes international banking facili-ties. Data are Wednesday values, or pro rata averages of Wednesday values. Large domestic banks constitute a universe; data for small domestic banks and foreign-related institutions are estimates based on weekly samples and on quarter-end condition reports. Data are adjusted for breaks caused by reclassifications of assets and liabilities.
2. Excludes federal funds sold to, reverse repurchase agreements with, and loans to commercial banks in the United States.
3. Consists of reserve repurchase agreements with broker-dealers and loans to purchase and carry securities.
4. Consists of federal funds sold to, reverse repurchase agreements with, and loans to commercial banks in the United States.
5. Includes vault cash, cash items in process of collection, demand balances due from depository institutions in the United States, balances due from Federal Reserve Banks, and other cash assets.
6. Excludes the due-from position with related foreign offices, which is included in lines 25. 53, 81, and 109.
7. Excludes unearned income, reserves for losses on loans and leases, and reserves for transfer risk. Loans are reported gross of these items.
8. Excludes the due-to position with related foreign offices, which is included in lines 25, 53, 81, and 109.
9. This balancing item is not intended as a measure of equity capital for use in capital adequacy analysis.
Digitized for FRASER http://fraser.stlouisfed.org/ Federal Reserve Bank of St. Louis

Weekly Reporting Commercial Banks A19
1.27 ASSETS AND LIABILITIES OF LARGE WEEKLY REPORTING COMMERCIAL BANKS
Millions of dollars, Wednesday figures
Account
1996
Account May l r May 8 May 15 May 22 May 29 June 5 June 12 June 19 June 26
ASSETS
1 Cash and balances due from depository institutions 117,983 118,580r 119,739r l l l ,089 r 122,997r 114,726 110,322 125,851 110,485 2 U.S. Treasury and government securities 281,227 283,773 284,139 280,103 279,703 277,713 273,645 271,603 272,833 3 Trading account 18,987 21,981 23,863 22,017 22,965 21,150 18,954 18,345 17,982 4 Investment account 262,240 261,792 260,276 258,086 256,737 256,563 254,691 253,258 254,851 5 Mortgage-backed securities' 116,013 115,626 116,568r 116,008' 115,61 r 115,964 115,590 114,558 115,923
All others, by maturity 33,645 ft One year or less 35,918 35,602 33,388r 32,719r 33,333r 33,750 34,018 33,613 33,645
7 One year through five years 62,094 62,703 62,704r 61,837r 60,857r 59,892 57,885 57,577 59,462 8 More than five years 48,215 47,860 47,616r 47,523r 46,937r 46,956 47,198 47,510 45,821 9 Other securities 124,004 123,818r 124,623r 122,294 123,354 124,631 124,182 123,464 122,014
10 Trading account 2,014 1,830 2,481 1,123 1,237 1,657 1,794 2,360 2,242 11 Investment account 63,379 63,387 63,557 63,397 63,411 63,475 63,743 64,111 63,689 12 State and local government, by maturity 18,941 18,800 18,789 18,815 18,829 18.444 18,543 18,775 18.845 13 One year or less 4,083 4,037 4,016 4,032 4,019 3,909 3,915 3,995 4,012 14 More than one year 14,857 14,762 14,773 14,784 14,811 14,535 14,627 14,779 14,833 15 Other bonds, corporate stocks, and securities 44,438 44,588 44,768 44,581 44,582 45,030 45,200 45,336 44,844 16 Other trading account assets 58,611 58,600r 58,586r 57,775 58,706 59,499 58,645 56,992 56,084
17 Federal funds sold2 126,298 121,656 119,912 112,698 106,695 112,854 115,303 110,919 111,917 18 To commercial banks in the United States 87,625 83,777 87,610 78,385 74,940 81,728 82,091 79,256 83,254 19 To nonbank brokers and dealers in securities 34,526 33,468 26,860 28,966 26,801 26,224 28,326 26,292 22,608 20 To others3 4,146 4,412 5,443 5,348 4,953 4,902 4,885 5,371 6,055 21 Other loans and leases, gross 1,302,972 1,297,559 1,295,818r l,293,796r l,296,133r 1,298,990 1,298,139 1,305,751 1,306,656 ?.?. Commercial and industrial 363,164 360,605r 360,776r 359,043r 356,856r 355,609 353,369 357,817 357,599 23 Bankers acceptances and commercial paper 1,499 1,489 1,432 1,373 1,418 1,369 1,401 1,390 1,324 24 All other 361,665 359,117r 359,343r 357,670r 355,438r 354,240 351,968 356,427 356,274 25 U.S. addressees 358,868 356,309r 356,52 l r 354,857r 352,663r 351,643 349,359 353,791 353,669 26 Non-U.S. addressees 2,797 2,807r 2,822 2,812 2,775 2,597 2,609 2,637 2,605 27 Real estate loans 506,452 506,655r 505,46 l r 503,656r 504,150r 506,019 507,727 508,668 508,198 28 Revolving, home equity 48,816 48,095 48,097r 47,990r 48,04 r 48,092 48,135 48,594 48,854 29 All other 457,636 458,560r 457,363r 455,665r 456,109r 457,927 459,592 460,074 459,343 30 To individuals for personal expenditures 250,435 250,763 249,910r 250,274r 251,668r 253,104 254,143 253,398 255,344 31 To depository and financial institutions 74,328 74,70 r 73,416r 72,467r 75,176r 75,897 75,821 75,057 75,479 32 Commercial banks in the United States 42,512 42,332 42,673 41,619 43,517 44,109 43,194 43,189 43,596 33 Banks in foreign countries 4,099 3,813 2,877 3,532 3,780 3,174 3,456 3,339 3,254 34 Nonbank depository and other financial institutions 27,717 28,556r 27,866r 27,316r 27,879r 28,614 29,171 28,529 28,629 35 For purchasing and carrying securities 15,885 14,031 14,604r 16,701r 15,105r 15,356 15,196 17,183 15,602 36 To finance agricultural production 6,694 6,762 6,814 6,902 6,913 6,833 6,893 7,065 7,243 37 To states and political subdivisions 10,189 10,260 10,359 10,507 10,461 10,384 10,163 10,392 10,520 38 To foreign governments and official institutions 1,124 1,080 1,117 1,096 1,086 1,095 1,106 1,207 1,066 39 All other loans 28,794 26,235r 26,748r 26,443r 27,838r 27,321 25,707 26,479 26,723 40 Lease-financing receivables 45,907 46,467 46,614 46,707 46,880 47,373 48,013 48,486 48,883 41 LESS: Unearned income 1,805 1,869 1,877 1,880 1,865 1,935 1,987 2,002 2,003 42 Loan and lease reserve3 33,111 33,228 33,181 33,087 33,033 33,291 33,244 33,284 33,153 43 Other loans and leases, net 1,268,056 1,262,462 l,260,760r l,258,829r l,261,235r 1,263,764 1,262,908 1,270,465 1,271,500 44 All other assets 145,869 147,118r 149,016r 140,917r 143,508r 169,655 155,524 158,979 157,831
45 Total assets 2,063,437 2,057,405r 2,058,189r 2,025,931r 2,037,492r 2,063,343 2,041,883 2,061,280 2,046,580
Footnotes appear on the following page.
Digitized for FRASER http://fraser.stlouisfed.org/ Federal Reserve Bank of St. Louis

A20 Domestic Nonfinancial Statistics • September 1996
1.27 ASSETS AND LIABILITIES OF LARGE WEEKLY REPORTING COMMERCIAL BANKS—Continued
Millions of dollars, Wednesday figures
Account
1996
Account
May l r May 8 May 15 May 22 May 29 June 5 June 12 June 19 June 26
LIABILITIES
46 Deposits 1,232,707 l,215,603r l,236,838r l,202,154r 1,221,199' 1,238,748 1,230,539 1,230,209 1,221,262 47 Demand deposits 322,792 301,004r 322,941r 294,012r 315,480' 317,013 311,611 311,034 305,247 48 Individuals, partnerships, and corporations 274,470 258,108r 275,635r 252,286r 267,745' 271,951 267,381 262,712 260,886 49 Other holders 48,322 42,896 47,306 41,726' 47,735' 45,061 44,230 48,323 44,361 50 States and political subdivisions 9,846 8,264 8,914 8,303 8,535 8,238 7,790 9,318 9,059 51 U.S. government 3,107 1,731 3,075 1,740r 1,471' 2,147 2,432 4,319 2,095 52 Depository institutions in the United States 21,821 20,457 22,383 19,637 24,101 22,222 20,565 21,596 19,480 53 Banks in foreign countries 5,042 5,293 5,443 5,004 5,546 5,172 5,933 5,464 5,892 54 Foreign governments and official institutions 663 594 691 590 776 564 588 569 555 55 Certified and officers' checks 7,844 6,557 6,800 6,452 7,306 6,718 6,922 7,057 7,279 56 Transaction balances other than demand deposits4 80,873 80,250 76,766 71,437 72,032 73,194 72,100 73,684 72,220 57 Nontransaction balances 829,042 834,349 837,131 836,705 833,687 848,541 846,828 845,491 843,795 58 Individuals, partnerships, and corporations 799,967 804,613 807,569 806,910 804,219 818,924 817,297 816,880 815,778 59 Other holders 29,075 29,736 29,562 29,795 29,468 29,618 29,531 28,611 28,017 60 States and political subdivisions 22,815 23,440r 23,261 23,478 23,225 23,619 23,587 22,663 21,938 61 U.S. government 4,014 4,019 4,042 4,040 4,040 4,030 4,014 4,009 4,050 62 Depository institutions in the United States 1,941 1,966 1,948 1,958 1,884 1,669 1,631 1,633 1,724 63 Foreign governments, official institutions, and banks . . 306 310 311 318 319 300 299 305 306
64 Liabilities for borrowed money5 411,596 421,002 406,865 405,249r 406,708' 408,777 400,126 419,678 413,207 65 Borrowings from Federal Reserve Banks 0 0 0 0 0 0 0 3,522 0 66 Treasury tax and loan notes 24,225 14,238 3,648 2,782 3,355 580 2,710 24,581 22,963 67 Other liabilities for borrowed money6 387,371 406,764 403,217 402,467r 403,353' 408,197 397,416 391,575 390,244 68 Other liabilities (including subordinated notes and debentures) . . . 224,157 225,60 l r 219,273r 222,648r 213,367' 218,946 213,405 213,780 214,996
69 Total liabilities 1,868,461 l,862,206r l,862,976r l,830,051r l,841,274r 1,866,471 1,844,069 1,863,667 1,849,464
70 Residual (total assets less total liabilities)7 194,977 195,199 195,213r 195,880' 196,218' 196,872 197,814 197,613 197,115
MEMO 71 Total loans and leases, gross, adjusted, plus securities8 1,704,364 l,700,696r l,694,209r 1,688,888' 1,687,427' 1,688,351 1,685,983 1,689,292 1,686,570 72 Time deposits in amounts of $100,000 or more 121,493 123,988 125,319 125,591 124,714 126,160 126,540 126,910 126,032 73 Loans sold outright to affiliates9 1,080 1,056 1,048 1,039 1,032 1,020 1,014 1,000 989 74 Commercial and industrial 268 268 268 268 268 264 264 264 263 75 Other 812 789 780 771 765 755 750 736 725 76 Foreign branch credit extended to U.S. residents10 27,527 27,113 28,057 27,880 28,262 28,415 28,332 29,051 28,633 77 Net owed to related institutions abroad 91,145 93,087 83,508 97,840 87,464 68,820 74,965 72,643 78,224
1. Includes certificates of participation, issued or guaranteed by agencies of the U.S. government, in pools of residential mortgages.
2. Includes securities purchased under agreements to resell. 3. Includes allocated transfer risk reserve. 4. Includes negotiable order of withdrawal (NOWs) and automatic transfer service (ATS)
accounts, and telephone and preauthorized transfers of savings deposits. 5. Includes borrowings only from other than directly related institutions. 6. Includes federal funds purchased and securities sold under agreements to repurchase. 7. This balancing item is not intended as a measure of equity capital for use in capital-
adequacy analysis.
8. Excludes loans to and federal funds transactions with commercial banks in the United States.
9. Affiliates include a bank's own foreign branches, nonconsolidated nonbank affiliates of the bank, the bank's holding company (if not a bank), and nonconsolidated nonbank subsidiaries of the holding company.
10. Credit extended by foreign branches of domestically chartered weekly reporting banks to nonbank U.S. residents. Consists mainly of commercial and industrial loans, but includes an unknown amount of credit extended to other than nonfinancial businesses.
Digitized for FRASER http://fraser.stlouisfed.org/ Federal Reserve Bank of St. Louis

Weekly Reporting Commercial Banks A21
1.28 LARGE WEEKLY REPORTING U.S. BRANCHES A N D AGENCIES OF FOREIGN BANKS Assets and Liabilities
Millions of dollars, Wednesday figures
Account
1996
Account
May 1 May 8 May 15 May 22 May 29 June 5 June 12 June 19 June 26
ASSETS
1 Cash and balances due from depository institutions 15,133 15,613 15,215 15,727 15,991 15,943 15,613 15,994 15,533
2 U.S. Treasury and government agency 15,133
securities 47,839 49,834 48,825 49,549 49,983 49,899 50,413 50,018 49,962 3 Other securities 43,659r 42,162r 43,153r 43,239r 43,942r 43,525 42,793 40,347 40,278 4 Federal funds sold' 29,435r 27,443r 21,673r 25,940r 28,270r 26,267 30,215 29,399 27,389 5 To commercial banks in the United States 7,079 6,889 5,720 7,242 10,570 7,320 6,078 7,787 6,285 6 To others2 22,356r 20,554r 15,954r 18,697r 17,700r 18,947 24,138 21,612 21,104 7 Other loans and leases, gross 185,595 183,506 185,905 187,250 187,162 186,845 188,543 190,727 190,777 8 Commercial and industrial 119,407 118,350 119,599 119,906 119,734 120,260 120,539 121,100 121,958 9 Bankers acceptances and commercial paper . 4,735 4,792 4,787 4,756 4,912 4,942 5,066 4,887 4,969
10 All other 114,671 113,558 114,812 115,150 114,823 115,318 115,473 116,214 116,989 11 U.S. addressees 108,344 107,269 108,613 108,953 108,625 109,080 109,233 109,935 109,927 12 Non-U.S. addressees 6,327 6,288 6,199 6,197 6,197 6,239 6,241 6,279 7,061 13 Loans secured by real estate 20,322 20,374 20,389 20,612 20,533 20,195 20,201 20,294 20,438 14 Loans to depository and financial
20,322
institutions 33,015r 33,129r 33,789r 33,874r 34,332r 33,676 35,306 35,978 36,044 15 Commercial banks in the United States 2,138 2,171 2,466 2,627 2,895 3,100 3.253 3,007 2,735 16 Banks in foreign countries 3,271 3,089 3,328 3,008 3,021 3,062 3,075 3,075 3,129 17 Nonbank financial institutions 27,605r 27,868r 27,995r 28,239r 28,417r 27,514 28,978 29,896 30,181 18 For purchasing and carrying securities 5,818r 4,667r 4,758r 5,475r 5,186r 5,387 5,143 5,742 4,994 19 To foreign governments and official
institutions 575 585 584 601 596 587 599 791 783 20 All other 4,462 4,423 4,687 4,685 4,684 4,656 4,666 4,712 4,531 21 Other assets (claims on nonrelated parties) 38,649 39,085 40,867 39,636 39,469 39,804 38,917 34,646 33,640
22 Total assets3 395,636 393,997 394,132 397,039 401,131 397,261 398,942 391,895 388,800
LIABILITIES
23 Deposits or credit balances owed to other than directly related institutions 108,436 108,354 109,334 111.375 112,528 111,088 110,595 108,608 108,311
24 Demand deposits4 4,202 4,253 4,203 4,104 4,355 4,325 4,145 4,462 4,380 25 Individuals, partnerships, and corporations . . . . 3,481 3,422 3,550 3,510 3,573 3,617 3,487 3,563 3,684 26 Other 721 831 652 594 783 708 658 899 696 27 Nontransaction accounts 104,234 104,100 105,131 107,271 108,172 106,763 106,450 104,146 103,931 28 Individuals, partnerships, and corporations . . . . 75,123 74,808 77,091 79,368 79,222 78,147 77,787 75,870 76,005 29 Other 29,110 29,293 28,040 27,903 28,951 28,616 28,663 28,276 27,927 30 Borrowings from other than directly
29,110
related institutions 88,351 85,024 83,075 82,707 79,485 81,729 86,177 84,714 81,610 31 Federal funds purchased5 55,066 50,405 49,206 46,632 45,657 49,330 52,350 50,509 49,987 32 From commercial banks in the United States . . 16,175 10,602 13,804 8,888 8,760 11,993 11,234 11,002 10,202 33 From others 38,890 39,804 35,402 37,744 36,897 37,337 41,116 39,507 39,786 34 Other liabilities for borrowed money 33,285 34,619 33,869 36,075 33,828 32,399 33,827 34,206 31,623 35 To commercial banks in the United States 4,068 4,221 4,201 4,472 4,100 3,812 3,970 4,024 4,241 36 To others 29,218 30,398 29,667 31,604 29,728 28,587 29,856 30,181 27,382 37 Other liabilities to nonrelated parties 60,558 60,368 62,440 60,571 61,855 61,982 61,878 55,315 56,293
38 Total liabilities6 395,636 393,997 394,132 397,039 401,131 397,261 398,942 391,895 388,800
MEMO 39 Total loans (gross) and securities, adjusted7 297,312 293,884 291,371 296,109 295,893 296,117 302,634 299,696 299,386 40 Net owed to related institutions abroad 102,966 103,897 100,790 106,688 110,949 107,485 107,845 112,493 111,364
1. Includes securities purchased under agreements to resell. 2. Includes transactions with nonbank brokers and dealers in securities. 3. For U.S. branches and agencies of foreign banks having a net "due from" position,
includes net due from related institutions abroad. 4. Includes other transaction deposits.
5. Includes securities sold under agreements to repurchase. 6. For U.S. branches and agencies of foreign banks having a net "due to" position,
includes net owed to related institutions abroad. 7. Excludes loans to and federal funds transactions with commercial banks in the United
States.
Digitized for FRASER http://fraser.stlouisfed.org/ Federal Reserve Bank of St. Louis
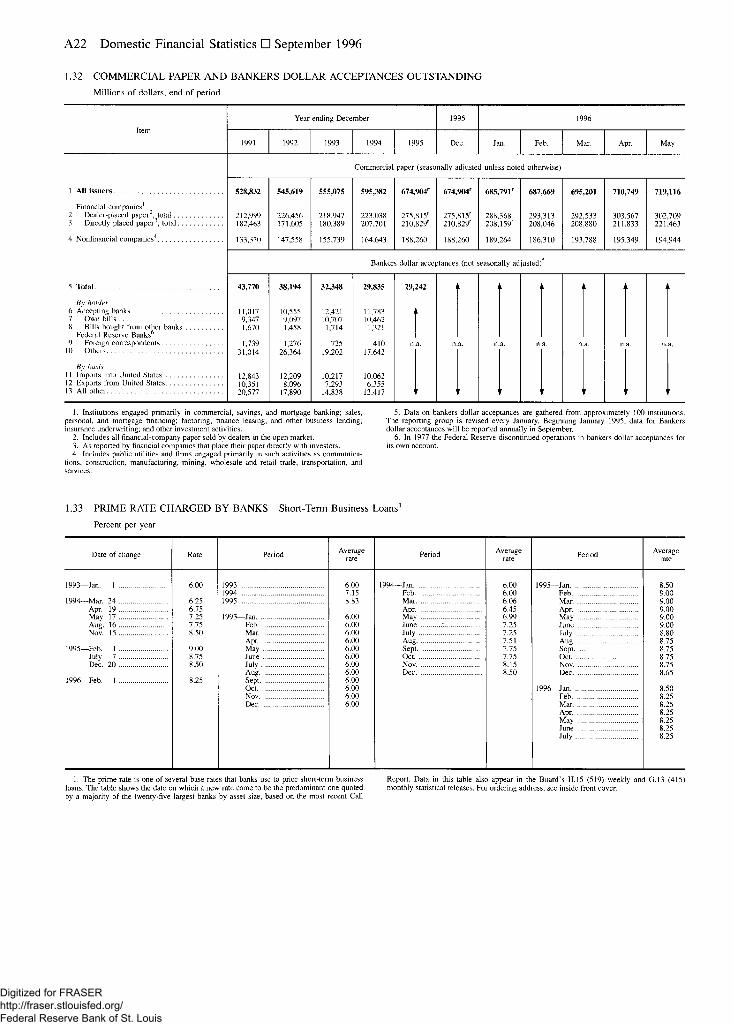
A22 Domestic Nonfinancial Statistics • September 1996
1.32 COMMERCIAL PAPER A N D BANKERS DOLLAR ACCEPTANCES OUTSTANDING
Millions of dollars, end of period
Item
Year ending December 1995 1996 Item
1991 1992 1993 1994 1995 Dec. Jan. Feb. Mar. Apr. May
1 All issuers
Financial companies' 2 Dealer-placed paper2, total 3 Directly placed paper3, total
4 Nonfinancial companies4
Commercial paper (seasonally adjusted unless noted otherwise)
1 All issuers
Financial companies' 2 Dealer-placed paper2, total 3 Directly placed paper3, total
4 Nonfinancial companies4
528,832
212,999 182,463
133,370
545,619
226,456 171,605
147,558
555,075
218,947 180,389
155,739
595,382
223,038 207,701
164,643
674,904r
275,815r
210,829r
188,260
674,904r
275,815r
210,829r
188,260
685,791r
288,368 208,159r
189,264
687,669
293,313 208,046
186,310
695,201
292,533 208,880
193,788
710,749
303,567 211,833
195,349
719,116
302,709 221,463
194,944
Bankers dollar acceptances (not seasonally adjusted)
5 Total 43,770 38,194 32,348 29,835 29,242
By holder 6 Accepting banks 11,017 10,555 12,421 11,783 7 Own bills 9,347 9,097 10,707 10,462 8 Bills bought from other banks 1,670 1,458 1,714 1,321
Federal Reserve Banks6 1,458 1,714
9 Foreign correspondents 1,739 1,276 725 410 n.a. n.a. n.a. n.a. n.a. n.a. n.a. 10 Others 31,014 26,364 19,202 17,642
By basis 11 Imports into United States 12,843 12,209 10,217 10,062 12 Exports from United States 10,351 8,096 7,293 6,355 13 All other 20,577 17,890 14,838 13,417
1. Institutions engaged primarily in commercial, savings, and mortgage banking; sales, personal, and mortgage financing; factoring, finance leasing, and other business lending; insurance underwriting; and other investment activities.
2. Includes all financial-company paper sold by dealers in the open market. 3. As reported by financial companies that place their paper directly with investors. 4. Includes public utilities and firms engaged primarily in such activities as communica-
tions, construction, manufacturing, mining, wholesale and retail trade, transportation, and services.
5. Data on bankers dollar acceptances are gathered from approximately 100 institutions. The reporting group is revised every January. Beginning January 1995, data for Bankers dollar acceptances will be reported annually in September.
6. In 1977 the Federal Reserve discontinued operations in bankers dollar acceptances for its own account.
1.33 PRIME RATE CHARGED BY BANKS Short-Term Business Loans1
Percent per year
Date of change Rate Period Average rate Period Average
rate Period Average rate
1993—Jan. 1 6.00 1993 6.00 1994—Jan 6.00 1995—Jan 8.50 1994 7.15 Feb 6.00 Feb 9.00
1994—Mar. 24 6.25 1995 8.83 Mar 6.06 Mar. 9.00 Apr. 19 6.75 Apr 6.45 Apr 9.00 May 17 7.25 1993—Jan 6.00 May 6.99 May 9.00 Aug. 16 7.75 Feb 6.00 June : 7.25 June 9.00 Nov. 15 8.50 Mar. 6.00 July 7.25 July 8.80
Apr 6.00 Aug 7.51 Aug 8.75 1995—Feb. 1 9.00 Mav 6.00 Sept 7.75 Sept 8.75
July 7 8.75 June 6.00 Oct 7.75 Oct 8.75 Dec. 20 8.50 July 6.00 Nov 8.15 Nov 8.75
6.00 Dec 8.50 Dec 8.65 1996—Feb. 1 8.25 Sept 6.00
8.50 8.65
Oct 6.00 1996—Jan 8.50 Nov 6.00 Feb 8.25 Dec 6.00 8 25 6.00
Apr 8.25 May 8.25 June 8.25 July 8.25
1. The prime rate is one of several base rates that banks use to price short-term business loans. The table shows the date on which a new rate came to be the predominant one quoted by a majority of the twenty-five largest banks by asset size, based on the most recent Call
Report. Data in this table also appear in the Board's H.15 (519) weekly and G.13 (415) monthly statistical releases. For ordering address, see inside front cover.
Digitized for FRASER http://fraser.stlouisfed.org/ Federal Reserve Bank of St. Louis

Financial Markets A23
1.35 INTEREST RATES Money and Capital Markets
Percent per year; figures are averages of business day data unless otherwise noted
Item 1993 1994 1995
1996 1996, week ending
Item 1993 1994 1995 Mar. Apr. May June May 31 June 7 June 14 June 21 June 28
MONEY MARKET INSTRUMENTS
1 Federal funds1 '2 '3 3.02 4.21 5.83 5.31 5.22 5.24 5.27 5.19 5.33 5.24 5.45 5.21 2 Discount window borrowing2,4 3.00 3.60 5.21 5.00 5.00 5.00 5.00 5.00 5.00 5.00 5.00 5.00
Commercial paper3,5,6
3 1-month 3.17 4.43 5.93 5.39 5.40 5.38 5.45 5.38 5.42 5.43 5.46 5.50 4 3-month 3.22 4.66 5.93 5.31 5.39 5.39 5.49 5.38 5.44 5.50 5.50 5.51 5 6-month 3.30 4.93 5.93 5.26 5.38 5.42 5.57 5.41 5.49 5.60 5.60 5.61
Finance paper, directly placed3'5'7
6 1-month 3.12 4.33 5.81 5.29 5.31 5.29 5.35 5.27 5.32 5.34 5.36 5.38 7 3-month 3.16 4.53 5.78 5.18 5.28 5.29 5.37 5.28 5.32 5.38 5.39 5.40 8 6-month 3.15 4.56 5.68 5.04 5.20 5.23 5.35 5.24 5.29 5.38 5.37 5.38
Bankers acceptances3,5,8
9 3-month 3.13 4.56 5.81 5.21 5.28 5.29 5.38 5.30 5.34 5.40 5.39 5.40 10 6-month 3.21 4.83 5.80 5.17 5.28 5.31 5.47 5.33 5.42 5.49 5.48 5.49
Certificates of deposit, secondary market3,9
11 1-month 3.11 4.38 5.87 5.31 5.34 5.32 5.37 5.31 5.35 5.36 5.36 5.39 12 3-month 3.17 4.63 5.92 5.29 5.36 5.36 5.46 5.36 5.42 5.48 5.47 5.49 13 6-month 3.28 4.96 5.98 5.30 5.42 5.47 5.64 5.47 5.59 5.67 5.65 5.66
14 Eurodollar deposits, 3-month3,10 3.18 4.63 5.93 5.28 5.36 5.36 5.46 5.35 5.43 5.48 5.45 5.48
U.S. Treasury bills Secondary market3'5
15 3-month 3.00 4.25 5.49 4.96 4.95 5.02 5.09 5.04 5.09 5.11 5.09 5.09 16 6-month 3.12 4.64 5.56 4.96 5.06 5.12 5.25 5.14 5.22 5.30 5.25 5.22 17 1-year 3.29 5.02 5.60 5.06 5.23 5.33 5.48 5.39 5.46 5.52 5.48 5.47
Auction average3 '5 '" 18 3-month 3.02 4.29 5.51 4.96 4.99 5.02 5.11 5.03 5.09 5.16 5.08 5.10 19 6-month 3.14 4.66 5.59 4.96 5.08 5.12 5.26 5.14 5.21 5.34 5.27 5.23 20 1-year 3.33 5.02 5.69 4.98 5.17 5.31 5.56 5.32 n.a. n.a. n.a. 5.56
U .S . TREASURY NOTES AND BONDS
Constant maturities'2
21 1-year 3.43 5.32 5.94 5.34 5.54 5.64 5.81 5.70 5.78 5.86 5.82 5.79 22 2-year 4.05 5.94 6.15 5.66 5.96 6.10 6.30 6.17 6.26 6.36 6.32 6.25 23 3-year 4.44 6.27 6.25 5.79 6.11 6.27 6.49 6.34 6.44 6.56 6.50 6.44 24 5-year 5.14 6.69 6.38 5.97 6.30 6.48 6.69 6.55 6.63 6.77 6.73 6.63 25 7-year 5.54 6.91 6.50 6.19 6.48 6.66 6.83 6.69 6.77 6.93 6.87 6.76 26 10-year 5.87 7.09 6.57 6.27 6.51 6.74 6.91 6.77 6.85 6.99 6.95 6.86 27 20-year 6.29 7.49 6.95 6.74 6.98 7.11 7.22 7.09 7.16 7.30 7.25 7.16 28 30-year 6.59 7.37 6.88 6.60 6.79 6.93 7.06 6.93 6.99 7.13 7.10 7.02
Composite 29 More than 10 years (long-term) 6.45 7.41 6.93 6.72 6.94 7.08 7.20 7.07 7.14 7.28 7.23 7.14
STATE AND LOCAL NOTES AND BONDS
Moody's series'3
30 Aaa 5.38 5.77 5.80 5.33 5.62 5.75 5.67 5.70 5.15 5.89 5.72 5.90 31 Baa
Bond Buyer series14 5.83 6.17 6.10 5.72 5.94 5.97 5.98 6.01 5.75 6.18 6.02 5.96
32 Baa Bond Buyer series14 5.60 6.18 5.95 5.79 5.94 5.98 6.02 5.94 5.94 6.12 6.06 5.97
CORPORATE BONDS
33 Seasoned issues, all industries15 7.54 8.26 7.83 7.65 7.80 7.91 8.00 7.89 7.95 8.07 8.03 7.96
Rating group 34 Aaa 7.22 7.97 7.59 7.35 7.50 7.62 7.71 7.61 7.67 7.78 7.74 7.66 35 Aa 7.40 8.15 7.72 7.52 7.68 7.77 7.87 7.75 7.81 7.93 7.90 7.83 36 A 7.58 8.28 7.83 7.68 7.83 7.94 8.02 7.92 7.98 8.09 8.04 7.97 37 Baa
A-rated, recently offered utility bonds'6 7.93 8.63 8.20 8.03 8.19 8.30 8.40 8.27 8.34 8.47 8.44 8.36
38 Baa A-rated, recently offered utility bonds'6 7.46 8.29 7.86 7.75 7.90 8.02 8.13 8.08 8.12 8.20 8.20 7.97
MEMO Dividend-price ratio17
39 Common stocks 2.78 2.82 2.56 2.22 2.24 2.21 2.21 2.22 2.17 2.22 2.22 2.22
1. The daily effective federal funds rate is a weighted average of rates on trades through New York brokers.
2. Weekly figures are averages of seven calendar days ending on Wednesday of the current week; monthly figures include each calendar day in the month.
3. Annualized using a 360-day year for bank interest. 4. Rate for the Federal Reserve Bank of New York. 5. Quoted on a discount basis. 6. An average of offering rates on commercial paper placed by several leading dealers for
firms whose bond rating is AA or the equivalent. 7. An average of offering rates on paper directly placed by finance companies. 8. Representative closing yields for acceptances of the highest-rated money center banks. 9. An average of dealer offering rates on nationally traded certificates of deposit.
10. Bid rates for Eurodollar deposits at approximately 11:00 a.m. London time. Data are for indication purposes only.
11. Auction date for daily data; weekly and monthly averages computed on an issue-date basis.
12. Yields on actively traded issues adjusted to constant maturities. Source: U.S. Depart-ment of the Treasury.
13. General obligation bonds based on Thursday figures; Moody's Investors Service. 14. State and local government general obligation bonds maturing in twenty years are used
in compiling this index. The twenty-bond index has a rating roughly equivalent to Moodys' Al rating. Based on Thursday figures.
15. Daily figures from Moody's Investors Service. Based on yields to maturity on selected long-term bonds.
16. Compilation of the Federal Reserve. This series is an estimate of the yield on recently offered, A-rated utility bonds with a thirty-year maturity and five years of call protection. Weekly data are based on Friday quotations.
17. Standard & Poor's corporate series. Common stock ratio is based on the 500 stocks in the price index.
NOTE. Some of the data in this table also appear in the Board's H.15 (519) weekly and G.13 (415) monthly statistical releases. For ordering address, see inside front cover.
Digitized for FRASER http://fraser.stlouisfed.org/ Federal Reserve Bank of St. Louis

A24 Domestic Nonfinancial Statistics • September 1996
1.36 STOCK MARKET Selected Statistics
Indicator 1993 1994 1995
1995 1996
Indicator 1993 1994 1995 Oct. Nov. Dec. Jan. Feb. Mar. Apr. May June
Common stock prices (indexes) 1 New York Stock Exchange
(Dec. 31, 1965 = 50) 2 Industrial 3 Transportation 4 Utility 5 Finance
6 Standard & Poor's Corporation (1941-43 = 10)1
7 American Stock Exchange (Aug. 31, 1973 = 50)2
Volume of trading (thousands of shares) 8 New York Stock Exchange 9 American Stock Exchange
10 Margin credit at broker-dealers3
Free credit balances at brokers4
11 Margin accounts5
12 Cash accounts
13 Margin stocks 14 Convertible bonds 15 Short sales
Prices and trading volume (averages of daily figures)
Common stock prices (indexes) 1 New York Stock Exchange
(Dec. 31, 1965 = 50) 2 Industrial 3 Transportation 4 Utility 5 Finance
6 Standard & Poor's Corporation (1941-43 = 10)1
7 American Stock Exchange (Aug. 31, 1973 = 50)2
Volume of trading (thousands of shares) 8 New York Stock Exchange 9 American Stock Exchange
10 Margin credit at broker-dealers3
Free credit balances at brokers4
11 Margin accounts5
12 Cash accounts
13 Margin stocks 14 Convertible bonds 15 Short sales
249.71 300.10 242.68 114.55 216.55
451.63
438.77
263,374 18,188
254.16 315.32 247.17 104.96 209.75
460.42
449.49
290,652 17,951
291.18 367.40 270.14 114.61 238.48
541.72
498.13
345,729 20,354
311.78 389.63 291.16 123.59 265.12
582.92
530.26
365,108 17,672
317.58 398.66 300.06 119.49 266.12
595.53
529.93
360,199 16,724
327.90 412.11 303.53 123.95 273.36
614.57
538.01
384,310 21,085
329.22 413.05 300.43 127.09 274.96
614.42
540.48
416,048 21,069
346.46 435.92 315.29 135.51 290.97
649.54
562.34
434,607 27,107
346.73 439.55 324.77 122.83 290.44
647.07
565.69
426,198 22,988
347.50 441.99 326.42 122.44 287.92
647.17
580.60
419,941 24,886
354.84 452.63 334.66 124.86 290.43
661.23
600.93
404,184 28,127
358.32 458.30 331.57 123.60 294.42
668.50
591.99
392,413 23,903
Common stock prices (indexes) 1 New York Stock Exchange
(Dec. 31, 1965 = 50) 2 Industrial 3 Transportation 4 Utility 5 Finance
6 Standard & Poor's Corporation (1941-43 = 10)1
7 American Stock Exchange (Aug. 31, 1973 = 50)2
Volume of trading (thousands of shares) 8 New York Stock Exchange 9 American Stock Exchange
10 Margin credit at broker-dealers3
Free credit balances at brokers4
11 Margin accounts5
12 Cash accounts
13 Margin stocks 14 Convertible bonds 15 Short sales
Customer financing (millions of dollars, end-of-period balances)
Common stock prices (indexes) 1 New York Stock Exchange
(Dec. 31, 1965 = 50) 2 Industrial 3 Transportation 4 Utility 5 Finance
6 Standard & Poor's Corporation (1941-43 = 10)1
7 American Stock Exchange (Aug. 31, 1973 = 50)2
Volume of trading (thousands of shares) 8 New York Stock Exchange 9 American Stock Exchange
10 Margin credit at broker-dealers3
Free credit balances at brokers4
11 Margin accounts5
12 Cash accounts
13 Margin stocks 14 Convertible bonds 15 Short sales
60,310
12,360 27,715
61,160
14,095 28,870
76,680
16,250 34,340
75,005
14,753 29,908
77,875
15,590 30,340
76,680
16,250 34,340
73,530
14,950 32,465
77,090
15,840 34,700
78,308
15,770 33,113
81,170
15,780 33,100
86,100
16,890 33,760
87,160
16,600 32,930
Common stock prices (indexes) 1 New York Stock Exchange
(Dec. 31, 1965 = 50) 2 Industrial 3 Transportation 4 Utility 5 Finance
6 Standard & Poor's Corporation (1941-43 = 10)1
7 American Stock Exchange (Aug. 31, 1973 = 50)2
Volume of trading (thousands of shares) 8 New York Stock Exchange 9 American Stock Exchange
10 Margin credit at broker-dealers3
Free credit balances at brokers4
11 Margin accounts5
12 Cash accounts
13 Margin stocks 14 Convertible bonds 15 Short sales
Margin requirements (percent of market value and effective date)6
Common stock prices (indexes) 1 New York Stock Exchange
(Dec. 31, 1965 = 50) 2 Industrial 3 Transportation 4 Utility 5 Finance
6 Standard & Poor's Corporation (1941-43 = 10)1
7 American Stock Exchange (Aug. 31, 1973 = 50)2
Volume of trading (thousands of shares) 8 New York Stock Exchange 9 American Stock Exchange
10 Margin credit at broker-dealers3
Free credit balances at brokers4
11 Margin accounts5
12 Cash accounts
13 Margin stocks 14 Convertible bonds 15 Short sales
Mar. 11, 1968 June 8, 1968 May 6, 1970 Dec. 6, 1971 Nov. 24, 1972 Jan. 3, 1974
Common stock prices (indexes) 1 New York Stock Exchange
(Dec. 31, 1965 = 50) 2 Industrial 3 Transportation 4 Utility 5 Finance
6 Standard & Poor's Corporation (1941-43 = 10)1
7 American Stock Exchange (Aug. 31, 1973 = 50)2
Volume of trading (thousands of shares) 8 New York Stock Exchange 9 American Stock Exchange
10 Margin credit at broker-dealers3
Free credit balances at brokers4
11 Margin accounts5
12 Cash accounts
13 Margin stocks 14 Convertible bonds 15 Short sales
70 50 70
80 60 80
65 50 65
55 50 55
65 50 65
50 50 50
1. In July 1976 a financial group, composed of banks and insurance companies, was added to the group of stocks on which the index is based. The index is now based on 400 industrial stocks (formerly 425), 20 transportation (formerly 15 rail), 40 public utility (formerly 60), and 40 financial.
2. On July 5, 1983, the American Stock Exchange rebased its index, effectively cutting previous readings in half.
3. Since July 1983, under the revised Regulation T, margin credit at broker-dealers has included credit extended against stocks, convertible bonds, stocks acquired through the exercise of subscription rights, corporate bonds, and government securities. Separate report-ing of data for margin stocks, convertible bonds, and subscription issues was discontinued in April 1984.
4. Free credit balances are amounts in accounts with no unfulfilled commitments to brokers and are subject to withdrawal by customers on demand.
5. Series initiated in June 1984. 6. Margin requirements, stated in regulations adopted by the Board of Governors pursuant
to the Securities Exchange Act of 1934, limit the amount of credit that can be used to purchase and carry "margin securities" (as defined in the regulations) when such credit is
collateralized by securities. Margin requirements on securities other than options are the difference between the market value (100 percent) and the maximum loan value of collateral as prescribed by the Board. Regulation T was adopted effective Oct. 15, 1934; Regulation U, effective May 1, 1936; Regulation G, effective Mar. 11, 1968; and Regulation X, effective Nov. 1, 1971.
On Jan. 1, 1977, the Board of Governors for the first time established in Regulation T the initial margin required for writing options on securities, setting it at 30 percent of the current market value of the stock underlying the option. On Sept. 30, 1985, the Board changed the required initial margin, allowing it to be the same as the option maintenance margin required by the appropriate exchange or self-regulatory organization; such maintenance margin rules must be approved by the Securities and Exchange Commission. Effective Jan. 31, 1986, the SEC approved new maintenance margin rules, permitting margins to be the price of the option plus 15 percent of the market value of the stock underlying the option.
Effective June 8, 1988, margins were set to be the price of the option plus 20 percent of the market value of the stock underlying the option (or 15 percent in the case of stock-index options).
Digitized for FRASER http://fraser.stlouisfed.org/ Federal Reserve Bank of St. Louis

Federal Finance A25
1.38 FEDERAL FISCAL A N D FINANCING OPERATIONS
Millions of dollars
Type of account or operation
Fiscal year Calendar year
Type of account or operation
1993 1994 1995
1996 Type of account or operation
1993 1994 1995
Jan. Feb. Mar. Apr. May June
U.S. budget1
1 Receipts, total 1,153,535 1,257,737 1,355,213 142,922 89,349 89,011 203,386 90,044 151,919 2 On-budget 841,601 922,711 1,004,134 110,615 60,912 56,677 160,774 60,106 116,718 3 Off-budget 311,934 335,026 351,079 32,307 28,437 32,334 42,612 29,938 35,201 4 Outlays, total 1,408,675 1,460,841 1,519,133 123,647 133,644 136,286 130,993 143,342 117,818 5 On-budget 1,142,088 1,181,469 1,230,469 98,057 105,711 108,365 105,131 114,486 104,161 6 Off-budget 266,587 279,372 288,664 25,591 27,933 27,921 25,862 28,856 13,657 7 Surplus or deficit ( - ) , total -255,140 -203,104 -163,920 19,274 -44,295 -47,275 72,393 -53,298 34,101 8 On-budget -300,487 -258,758 -226,335 12,558 -44,799 -51,688 55,643 -54 ,380 12,557 9 Off-budget 45,347 55,654 62,415 6,716 504 4,413 16,750 1,082 21,544
Source of financing (total) 10 Borrowing from the public 248,619 185,344 171,288 -4 ,747 47,022 39,189 -35,466 20,633 -8 ,619 11 Operating cash (decrease, or increase ( - ) ) 6,283 16,564 -2 ,007 -16,959 6,297 9,283 -26,449 43,809 -33,519 12 Other2 238 1,196 -5 ,361 2,432 -9 ,024 - 1 9 7 -10,478 -11 ,144 8,037
MEMO 13 Treasury operating balance (level, end of
period) 52,506 35,942 37,949 37,454 31,157 21,874 48,323 4,514 38,033 14 Federal Reserve Banks 17,289 6,848 8,620 8,210 5,632 7,021 11,042 3,757 7,701 15 Tax and loan accounts 35,217 29,094 29,329 29,243 25,525 14,853 37,281 757 30,332
1. Since 1990, off-budget items have been the social security trust funds (federal old-age survivors insurance and federal disability insurance) and the U.S. Postal Service.
2. Includes special drawing rights (SDRs); reserve position on the U.S. quota in the International Monetary Fund (IMF); loans to the IMF; other cash and monetary assets; accrued interest payable to the public; allocations of SDRs; deposit funds; miscellaneous liability (including checks outstanding) and asset accounts; seigniorage; increment on gold;
net gain or loss for U.S. currency valuation adjustment; net gain or loss for IMF loan-valuation adjustment; and profit on sale of gold.
SOURCE. Monthly totals: U.S. Department of the Treasury, Monthly Treasury Statement of Receipts and Outlays of the U.S. Government; fiscal year totals: U.S. Office of Management and Budget, Budget of the U.S. Government.
Digitized for FRASER http://fraser.stlouisfed.org/ Federal Reserve Bank of St. Louis

A26 Domestic Nonfinancial Statistics • September 1996
1.39 U.S. BUDGET RECEIPTS A N D OUTLAYS'
Millions of dollars
Source or type
Fiscal year Calendar year
Source or type
1994 1995
1994 1995 1996 1996 Source or type
1994 1995
H2 HI H2 HI Apr. May June
RECEIPTS
1 All sources 1,257,737 1,355,213 625,556 710,542 656,402 766,631 203,386 90,044 151,919
2 Individual income taxes, net 543,055 590,244 273,315 307,498 292,393 347,285 107,513 29,914 60,816 3 Withheld 459,699 499,927 240,063 251,398 256,916 264,177 38,930 45,399 35,941 4 Nonwithheld 160,433 175,855 42,029 132,001 43,100 162,782 89,392 6,352 26,926 5 Refunds 77,077 85,538 8,787 75,959 10,058 79,735 20,822 21,850 2,061
Corporation income taxes 6 Gross receipts 154,205 174,422 78,393 92,132 88,302 96,480 26,912 3,647 37,950 7 Refunds 13,820 17,418 7,747 10,399 7,518 9,704 1,975 1,077 992 8 Social insurance taxes and contributions, net . . . 461,475 484,473 220,140 261,837 224,269 277,767 60,588 48,676 45,583 9 Employment taxes and contributions2 428,810 451,045 206,615 241,557 211,323 257,446 56,615 38,104 44,888
10 Unemployment insurance 28,004 28,878 11,177 18,001 10,702 18,068 3,628 10,155 400 11 Other net receipts3 4,661 4,550 2,349 2,279 2,247 2,254 346 417 295
12 Excise taxes 55,225 57,484 30,178 27,452 30,014 25,682 4,577 4,113 4,310 13 Customs deposits 20,099 19,301 11,041 8,848 9,849 8,731 1,388 1,427 1,450 14 Estate and gift taxes 15,225 14,763 7,067 7,425 7,718 8,775 2,704 1,415 1,141 15 Miscellaneous receipts4 22,274 31,944 13,169 15,750 11,374 11,620 1,680 1,929 1,663
OUTLAYS
16 All types 1,460,841 1,519,133 752,150 760,824 752,511 785,730 130,993 143,342 117,818
17 National defense 281,642 272,066 141,885 135,648' 132,954 133,516 22,725 988
26,609 19,769 18 International affairs 17,083 16,434 11,889 4,797 6,994 8,074
22,725 988 1,165 837
19 General science, space, and technology 16,227 16,724 7,604 8,611 8,810 8,897 1,534 1,584 1,536 20 Energy 5,219 4,936 2,923 2,358' 2,203 1,355 17 216 822 21 Natural resources and environment 21,064 22,105 11,911 I0,273r 12,633 10,238 1,660 1,757 1,543 22 Agriculture 15,046 9,773 7,623 4,039' 3,062 71 - 2 4 9 - 1 7 5 - 1 2 4
23 Commerce and housing credit -5 ,118 -14,441 -4 ,270 -13,937 -4 ,412 -7 ,334 -1 ,741 256 -1 ,368 24 Transportation 38,066 39,350 21,835 18,193' 19,931 18,291 2,864 3,324 3,185 25 Community and regional development 10,454 10,641 6,283 5,073' 6,085 5,160 1,026 826 896 26 Education, training, employment, and
social services 46,307 54,263 27,450 25,893' 24,894 26,137 4,014 3,961 3,903
27 Health 107,122 115,418 54,147 59,057' 57,078 59,957 10,458 11,201 9,762 28 Social security and Medicare 464,312 495,701 236,817 251,975 251,387 264,649 44,216 46,727 44,731 29 Income security 214,031 220,449 101,806 117,190' 104,078 121,032 21,417 21,407 11,332
30 Veterans benefits and services 37,642 37,938 19,761 19,269' 18,684 18,164 2,974 5,254 1,570 31 Administration of justice 15,256 16,223 7,753 8,051' 8,117 9,021 1,585 1,683 1,327 32 General government 11,303 13,835 7,355 5,796' 7,621 4,641 - 2 5 180 1,755 33 Net interest5 202,957 232,173 109,434 116,169 119,350 120,579 20,463 20,359 18,977 34 Undistributed offsetting receipts6 -37,772 -44,455 -20,066 -17 ,631 ' -26,994 -16 ,716 -2 ,932 -2 ,991 -2 ,636
1. Functional details do not sum to total outlays for calendar year data because revisions to monthly totals have not been distributed among functions. Fiscal year total for receipts and outlays do not correspond to calendar year data because revisions from the Budget have not been fully distributed across months.
2. Old-age, disability, and hospital insurance, and railroad retirement accounts. 3. Federal employee retirement contributions and civil service retirement and
disability fund.
4. Deposits of earnings by Federal Reserve Banks and other miscellaneous receipts. 5. Includes interest received by trust funds. 6. Rents and royalties for the outer continental shelf, U.S. government contributions for
employee retirement, and certain asset sales. SOURCE. Fiscal year totals: U.S. Office of Management and Budget, Budget of the U.S.
Government, Fiscal Year 1997; monthly and half-year totals: U.S. Department of the Trea-sury, Monthly Treasury Statement of Receipts and Outlays of the U.S. Government.
Digitized for FRASER http://fraser.stlouisfed.org/ Federal Reserve Bank of St. Louis

Federal Finance A27
1.40 FEDERAL DEBT SUBJECT TO STATUTORY LIMITATION
Billions of dollars, end of month
Item
1994 1995 1996
Item
June 30 Sept. 30 Dec. 31 Mar. 31 June 30 Sept. 30 Dec. 31 Mar. 31 June 30
1 Federal debt outstanding 4,673 4,721 4,827 4,891 4,978 5,001 5,017 5,153 5,197
2 Public debt securities 4,646 4,693 4,800 4,864 4,951 4,974 4,989 5,118 5,161 3 Held by public 3,443 3,480 3,543 3,610 3,635 3,653 3,684 3,764 n.a. 4 Held by agencies 1,203 1,213 1,257 1,255 1,317 1,321 1,305 1,354 n.a.
5 Agency securities 28 29 27 27 27 27 28 36 36 6 Held by public 27 29 27 26 27 27 28 28 n.a. 7 Held by agencies 0 0 0 0 0 0 0 8 n.a.
8 Debt subject to statutory limit 4,559 4,605 4,711 4,775 4,861 4,885 4,900 5,030 5,073
9 Public debt securities 4,559 4,605 4,711 4,774 4,861 4,885 4,900 5,030 5,073 10 Other debt1 0 0 0 0 0 0 0 0 0
MEMO 11 Statutory debt limit 4,900 4,900 4,900 4,900 4,900 4,900 4,900 5,500 5,500
1. Consists of guaranteed debt of U.S. Treasury and other federal agencies, specified SOURCE. U.S. Department of the Treasury, Monthly Statement of the Public Debt of the participation certificates, notes to international lending organizations, and District of Colum- United States and Treasury Bulletin. bia stadium bonds.
1.41 GROSS PUBLIC DEBT OF U.S. TREASURY Types and Ownership
Billions of dollars, end of period
Type and holder 1992 1993 1994 1995
1995 1996
Type and holder 1992 1993 1994 1995
Q3 Q4 Q1 Q2
1 Total gross public debt 4,177.0 4,535.7 4,800.2 4,988.7 4,974.0 4,988.7 5,117.8 5,161.1
By type 2 Interest-bearing 4,173.9 4,532.3 4,769.2 4,964.4 4,950.6 4,964.4 5,083.0 5,126.8 3 Marketable 2,754.1 2,989.5 3,126.0 3,307.2 3,260.5 3,307.2 3,375.1 3,348.4 4 Bills 657.7 714.6 733.8 760.7 742.5 760.7 811.9 773.6 5 Notes 1,608.9 1,764.0 1,867.0 2,010.3 1,980.3 2,010.3 2,014.1 2,025.8 6 Bonds 472.5 495.9 510.3 521.2 522.6 521.2 534.1 534.1 7 Nonmarketable' 1,419.8 1,542.9 1,643.1 1,657.2 1,690.2 1,657.2 1,707.9 1,778.3 8 State and local government series 153.5 149.5 132.6 104.5 113.4 104.5 96.5 97.8 9 Foreign issues2 37.4 43.5 42.5 40.8 41.0 40.8 40.4 37.8
10 Government 37.4 43.5 42.5 40.8 41.0 40.8 40.4 37.8 11 Public .0 .0 .0 .0 .0 .0 .0 .0 12 Savings bonds and notes 155.0 169.4 177.8 181.9 181.2 181.9 183.0 183.8 13 Government account series3 1,043.5 1,150.0 1,259.8 1,299.6 1,324.3 1,299.6 1,357.7 1,428.5 14 Non-interest-bearing 3.1 3.4 31.0 24.3 23.3 24.3 34.8 34.3
By holder 4
15 U.S. Treasury and other federal agencies and trust funds 1,047.8 1,153.5 1,257.1 1,304.5 1,320.8 1,304.5 1,353.8 16 Federal Reserve Banks 302.5 334.2 374.1 391.0 374.1 391.0 381.0 17 Private investors 2,839.9 3,047.4 3,168.0 3,294.9 3,279.5 3,294.9 3,382.8 18 Commercial banks 294.4 322.2 290.1 280. l r 289.0 280. l r 281.0 19 Money market funds 79.7 80.8 67.6 71.3 64.2 71.3 87.3 20 Insurance companies 197.5 234.5 240.1 252.6r 249.8r 252.6r 254.5 21 Other companies 192.5 213.0 226.5 228.8r 224.1 228.8r 229.0 n a. 22 State and local treasuries5,6 563.3r 605.9r 483.4r 343.8r 384.9r 343.8r 343.0
Individuals 23 Savings bonds 157.3 171.9 180.5 185.0 183.5 185.0 185.8 24 Other securities 131.9 137.9 150.7 162.7 162.4 162.7 161.4 25 Foreign and international7 549.7 623.0 688.6 861.8 848.1 861.8 930.1 26 Other miscellaneous investors6'8 673.5r 658.3r 840.5r 908.8' 873.5r 908.8' 910.7
1. Includes (not shown separately) securities issued to the Rural Electrification Administra-tion, depository bonds, retirement plan bonds, and individual retirement bonds.
2. Nonmarketable series denominated in dollars, and series denominated in foreign cur-rency held by foreigners.
3. Held almost entirely by U.S. Treasury and other federal agencies and trust funds. 4. Data for Federal Reserve Banks and U.S. government agencies and trust funds are actual
holdings; data for other groups are Treasury estimates. 5. Includes state and local pension funds. 6. In March 1996, in a redefinition of series, fully defeased debt backed by nonmarketable
federal securities was removed from "Other miscellaneous investors" and added to "State and local treasuries." The data shown here have been revised accordingly.
7. Consists of investments of foreign balances and international accounts in the United States.
8. Includes savings and loan associations, nonprofit institutions, credit unions, mutual savings banks, corporate pension trust funds, dealers and brokers, certain U.S. Treasury deposit accounts, and federally sponsored agencies.
SOURCE. U.S. Treasury Department, data by type of security, Monthly Statement of the Public Debt of the United States; data by holder, Treasury Bulletin.
Digitized for FRASER http://fraser.stlouisfed.org/ Federal Reserve Bank of St. Louis
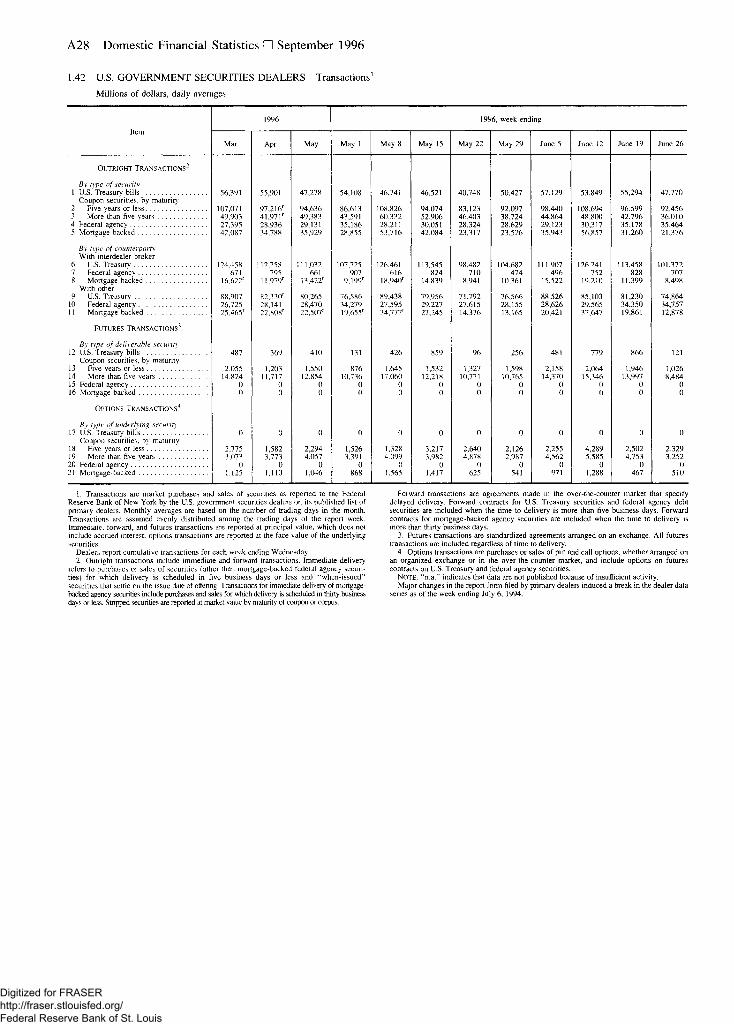
A28 Domestic Nonfinancial Statistics • September 1996
1.42 U.S. GOVERNMENT SECURITIES DEALERS Transactions'
Millions of dollars, daily averages
Item
1996 1996, week ending
Item Mar. Apr. May May 1 May 8 May 15 May 22 May 29 June 5 June 12 June 19 June 26
OUTRIGHT TRANSACTIONS2
By type of security 1 U.S. Treasury bills 56,391 55,901 47,278 54,108 46,741 46,521 40,748 50,427 57,129 53,849 55,294 47,770
Coupon securities, by maturity 2 Five years or less 107,071 97,216r 94,636 86,613 108,826 94,074 83,123 92,097 98,440 108,694 96,599 92,456 3 More than five years 49,903 41,971r 49,383 43,591 60,332 52,906 46,403 38,724 44,864 48,800 42,796 36,010 4 Federal agency 27,395 28,936 29,131 35,186 28,211 30,051 28,324 28,629 29,123 30,317 35,178 35,464 5 Mortgage-backed 42,087 34,788 35,929 28,855 53,716 42,084 23,317 23,526 35,943 56,857 31,260 21,376
By type of counterparty With interdealer broker
6 U.S. Treasury 124,458 112,758 111,032 107,725 126,461 113,545 98,482 104,682 111,907 126,241 113,458 101,372 7 Federal agency 671 795 661 907 616 824 710 474 496 752 828 707 8 Mortgage-backed 16,622r 11,979r 13,422r 9,199r 18,940r 14,839 8,941 10,361 15,522 19,210 11,399 8,498
With other 9 U.S. Treasury 88,907 82,330r 80,265 76,586 89,438 79,956 71,792 76,566 88,526 85,103 81,230 74,864
10 Federal agency 26,725 28,141 28,470 34,279 27,595 29,227 27,615 28,155 28,626 29,565 34,350 34,757 11 Mortgage-backed 25.465r 22,808r 22,507r 19.655r 34,777r 27,245 14,376 13,165 20,421 37,647 19,861 12,878
FUTURES TRANSACTIONS3
By type of deliverable security 12 U.S. Treasury bills 487 369 410 131 426 859 96 256 481 779 866 121
Coupon securities, by maturity 13 Five years or less 2,055 1,203 1,550 876 1.645 1,532 1,327 1,598 2,158 2,064 1,946 1,026 14 More than five years 14,824 11,717 12,854 10,736 17.060 12,218 10,771 10,765 14,370 15,346 13,997 8,484 15 Federal agency 0 0 0 0 0 0 0 0 0 0 0 0 16 Mortgage-backed 0 0 0 0 0 0 0 0 0 0 0 0
OPTIONS TRANSACTIONS4
By type of underlying security 17 U.S. Treasury bills 0 0 0 0 0 0 0 0 0 0 0 0
Coupon securities, by maturity 18 Five years or less 2,775 1,582 2,294 1,526 1,328 3,217 2,640 2,126 2,255 4,289 2,502 2,329 19 More than five years 3,073 3,773 4,057 3.391 4.099 3,982 4,878 2,987 4,562 5,585 4,753 3,252 20 Federal agency 0 0 0 0 0 0 0 0 0 0 0 0 21 Mortgage-backed 1,125 1,110 1,046 868 1.565 1,417 625 541 971 1,288 467 510
1. Transactions are market purchases and sales of securities as reported to the Federal Reserve Bank of New York by the U.S. government securities dealers on its published list of primary dealers. Monthly averages are based on the number of trading days in the month. Transactions are assumed evenly distributed among the trading days of the report week. Immediate, forward, and futures transactions are reported at principal value, which does not include accrued interest; options transactions are reported at the face value of the underlying securities.
Dealers report cumulative transactions for each week ending Wednesday. 2. Outright transactions include immediate and forward transactions. Immediate delivery
refers to purchases or sales of securities (other than mortgage-backed federal agency securi-ties) for which delivery is scheduled in five business days or less and "when-issued" securities that settle on the issue date of offering. Transactions for immediate delivery of mortgage-backed agency securities include purchases and sales for which delivery is scheduled in thirty business days or less. Stripped secunties are reported at market value by matunty of coupon or corpus.
Forward transactions are agreements made in the over-the-counter market that specify delayed delivery. Forward contracts for U.S. Treasury securities and federal agency debt securities are included when the time to delivery is more than five business days. Forward contracts for mortgage-backed agency securities are included when the time to delivery is more than thirty business days.
3. Futures transactions are standardized agreements arranged on an exchange. All futures transactions are included regardless of time to delivery.
4. Options transactions are purchases or sales of put and call options, whether arranged on an organized exchange or in the over-the-counter market, and include options on futures contracts on U.S. Treasury and federal agency securities.
NOTE, "n.a." indicates that data are not published because of insufficient activity. Major changes in the report form filed by primary dealers induced a break in the dealer data
series as of the week ending July 6, 1994.
Digitized for FRASER http://fraser.stlouisfed.org/ Federal Reserve Bank of St. Louis

Federal Finance A29
1.43 U.S. GOVERNMENT SECURITIES DEALERS Positions and Financing1
M i l l i o n s of do l l a r s
1996 1996, week ending
Mar. Apr. May May 1 May 8 May 15 May 22 May 29 June 5 June 12 June 19
Positions2
NET OUTRIGHT POSITIONS3
By type of security 1 U.S. Treasury bills 20,889 17,119 15,447 11,554 12,031 16,296 14,951 15,433 28,159 22,380 8,845
Coupon securities, by maturity 2 Five years or less 6,296 7,771 2,210 6,523 6,242 1,796 - 4 6 2 1,554 —961 - 3 , 0 4 2 -10 ,342 3 More than five years -24 ,377 -27 ,702 - 2 3 , 2 9 1 - 2 6 , 2 6 8 - 2 5 , 0 0 3 - 2 3 , 3 3 8 - 2 2 , 0 4 1 - 2 2 , 6 3 5 - 2 2 , 3 1 5 -21 ,501 - 2 1 , 0 0 6 4 Federal agency 25,754 26,566 23,921 31,139 28,135 23,321 24,464 19,096 22,655 24,935 22,365 5 Mortgage-backed 36,887 32,583 34,206 32,543 30,376 35,251 35,657 35,190 36,270 35,104 35,001
NET FUTURES POSITIONS4
By type of deliverable security 6 U.S. Treasury bills - 2 , 8 4 2 - 3 , 5 6 0 - 4 , 6 2 5 - 4 , 5 4 7 - 4 , 6 1 0 - 4 , 8 9 8 - 4 , 5 6 3 - 4 , 7 6 5 - 3 , 4 8 4 - 2 , 9 4 1 - 1 , 1 5 7
Coupon securities, by maturity 7 Five years or less 623 1,073 632 788 1,062 1,267 401 - 4 5 7 466 1,617 8 More than five years - 4 , 3 6 1 - 4 , 2 8 5 - 3 , 5 9 8 - 5 , 3 5 1 - 2 , 7 8 3 - 2 , 4 6 6 - 4 , 5 4 1 - 3 , 9 7 5 - 4 , 9 1 0 - 5 , 9 4 5 - 5 , 8 2 1 9 Federal agency 0 0 0 0 0 0 0 0 0 0 0
10 Mortgage-backed 0 0 0 0 0 0 0 0 0 0 0
NET OPTIONS POSITIONS
By type of deliverable security 11 U.S. Treasury bills 0 0 0 0 0 0 0 0 0 0 0
Coupon securities, by maturity 12 Five years or less 1,381 1,542 - 1 3 9 1,023 691 676 - 3 0 7 - 1 , 2 8 7 - 1 , 8 6 8 - 2 , 2 7 6 - 3 , 0 9 9 13 More than five years 177 1,081 - 7 0 3 429 - 1 , 4 9 1 - 1 , 3 6 6 688 - 7 9 7 - 7 3 5 235 70 14 Federal agency 0 0 0 0 0 0 0 0 0 0 0 15 Mortgage-backed 4,949 4,435 3,902 4,808 4,570 3,688 3,603 3,741 3,465 3,479 2,941
Financing5
Reverse repurchase agreements 16 Overnight and continuing 258,213 256,694 251,988 252,381 245,232 271,735 252,858 242,766 235,548 238,277 248,074 17 Term 435,402 467,590 453,182 478,354 499,560 416,344 448,774 451,521 428,448 470,543 471,190
Securities borrowed 18 Overnight and continuing 172,347 166,490 173,105 166,473 168,222 175,434 178,128 168,867 182,616 181,178 182,894 19 Term 66,212 67,330 63,987 69,357 69,339 62,296 62,976 62,021 58,906 61,003 60,316
Securities received as pledge 20 Overnight and continuing 4,477 3,275 2,488 2,241 2,063 2,487 2,446 2,414 4,501 4,446 5,423 21 Term 65 53 52 27 39 29 41 102 47 91 112
Repurchase agreements 22 Overnight and continuing 557,094 577,949 559,390 567,907 560,778 577,866 564,022 534,374 556,952 561,144 545,801 23 Term 393,406 399,259 392,946 413,066 426,042 357,241 392,652 401,719 362,346 403,262 415,376
Securities loaned 24 Overnight and continuing 5,202 4,728 4,804 4,812 4,803 4,579 4,769 4,841 5,577 5,711 5,890 25 Term 2,362 2,611 3,094 3,242 3,223 3,086 n.a. 2,952 n.a. n.a. n.a.
Securities pledged 26 Overnight and continuing 40,936 37,160 41,591 36,547 36,965 41,397 43,031 44,627 45,317 45,388 47,466 27 Term 8,343 8,518 6,797 8,465 8,025 6,738 6,163 6,249 6,016 6,063 6,060
Collateralized loans 28 Overnight and continuing n.a. n.a. n.a. n.a. n.a. n.a. n.a. n.a. n.a. n.a. n.a. 29 Term n.a. n.a. n.a. n.a. n.a. n.a. n.a. n.a. n.a. n.a. n.a. 30 Total 12,176 14,045r 12,091 10,602r 13,316 12,567 12,697 9,708 13,097 13,550 12,200
MEMO: Matched book6
Securities in 31 Overnight and continuing 239,030 244,480 244,668 245,137 236,730 259,949 250,282 233,953 236,593 236,204 250,199 32 Term 433,861 464,018 441,772 480,346 488,139 407,901 437,150 436,335 413,953 459,074 453,905
Securities out 33 Overnight and continuing 328,321 348,557 334,416 344,315 341,079 345,621 334,007 314,633 337,593 356,820 350,654 34 Term 338,096 349,263 337,119 365,614 372,213 303,369 332,831 343,905 309,423 345,288 360,676
1. Data for positions and financing are obtained from reports submitted to the Federal Reserve Bank of New York by the U.S. government securities dealers on its published list of primary dealers. Weekly figures are close-of-business Wednesday data. Positions for calendar days of the report week are assumed to be constant. Monthly averages are based on the number of calendar days in the month.
2. Securities positions are reported at market value. 3. Net outright positions include immediate and forward positions. Net immediate posi-
tions include securities purchased or sold (other than mortgage-backed agency securities) that have been delivered or are scheduled to be delivered in five business days or less and "when-issued" securities that settle on the issue date of offering. Net immediate positions for mortgage-backed agency securities include securities purchased or sold that have been delivered or are scheduled to be delivered in thirty business days or less.
Forward positions reflect agreements made in the over-the-counter market that specify delayed delivery. Forward contracts for U.S. Treasury securities and federal agency debt securities are included when the time to delivery is more than five business days. Forward contracts for mortgage-backed agency securities are included when the time to delivery is more than thirty business days.
4. Futures positions reflect standardized agreements arranged on an exchange. All futures positions are included regardless of time to delivery.
5. Overnight financing refers to agreements made on one business day that mature on the next business day; continuing contracts are agreements that remain in effect for more than one business day but have no specific maturity and can be terminated without advance notice by either party; term agreements have a fixed maturity of more than one business day. Financing data are reported in terms of actual funds paid or received, including accrued interest.
6. Matched-book data reflect financial intermediation activity in which the borrowing and lending transactions are matched. Matched-book data are included in the financing break-downs given above. The reverse repurchase and repurchase numbers are not always equal because of the "matching" of securities of different values or different types of collateraliza-tion.
NOTE, "n.a." indicates that data are not published because of insufficient activity. Major changes in the report form filed by primary dealers induced a break in the dealer data
series as of the week ending July 6, 1994.
Digitized for FRASER http://fraser.stlouisfed.org/ Federal Reserve Bank of St. Louis

A30 Domestic Nonfinancial Statistics • September 1996
1.44 FEDERAL AND FEDERALLY SPONSORED CREDIT AGENCIES Debt Outstanding
Millions of dollars, end of period
Agency 1 9 9 2 1993 1994 1995
1995 1 9 9 6
Agency 1 9 9 2 1993 1994 1995
Dec. Jan. Feb. Mar. Apr.
1 Federal and federally sponsored agencies 483,970 570,711 738,928 844,611 844,611 836,820 840,384 846,807
2 Federal agencies 4 1 , 8 2 9 4 5 , 1 9 3 3 9 , 1 8 6 3 7 , 3 4 7 3 7 , 3 4 7 3 7 , 2 7 3 3 1 , 9 8 6 3 1 , 2 8 4 3 Defense Department' 7 6 6 6 6 6 6 6 4 Export-Import Bank2'1 7 , 2 0 8 5 , 3 1 5 3 , 4 5 5 2 , 0 5 0 2 , 0 5 0 2 , 0 5 0 2 , 0 5 0 2 , 0 1 5 5 Federal Housing Administration4 3 7 4 2 5 5 116 9 7 9 7 31 3 5 5 2 n a. 6 Government National Mortgage Association certificates of
participation5 n.a. n.a. n.a. n.a. n.a. n.a. n.a. n.a. 7 Postal Service6 1 0 , 6 6 0 9 , 7 3 2 8 , 0 7 3 5 , 7 6 5 5 , 7 6 5 5 , 7 6 5 3 0 0 3 0 0 8 Tennessee Valley Authority 2 3 , 5 8 0 2 9 , 8 8 5 2 7 , 5 3 6 2 9 , 4 2 9 2 9 , 4 2 9 2 9 , 4 2 1 2 9 , 5 9 5 2 8 , 9 1 1 9 United States Railway Association6 n.a. n.a. n.a. n.a. n.a. n.a. n.a. n.a.
10 Federally sponsored agencies7 4 4 2 , 1 4 1 5 2 3 , 4 5 2 6 9 9 , 7 4 2 8 0 7 , 2 6 4 8 0 7 , 2 6 4 7 9 9 , 5 4 7 8 0 8 , 3 9 8 8 1 5 , 5 2 3 11 Federal Home Loan Banks 1 1 4 , 7 3 3 1 3 9 , 5 1 2 2 0 5 , 8 1 7 2 4 3 , 1 9 4 2 4 3 , 1 9 4 2 3 4 , 6 6 4 2 3 3 , 4 0 4 2 3 9 , 2 5 3 2 4 2 , 4 3 7 12 Federal Home Loan Mortgage Corporation 2 9 , 6 3 1 4 9 , 9 9 3 9 3 , 2 7 9 1 1 9 , 9 6 1 1 1 9 , 9 6 1 1 2 0 , 8 6 8 1 2 3 , 7 7 7 1 2 4 , 2 7 8 1 3 6 , 1 8 5 13 Federal National Mortgage Association 1 6 6 , 3 0 0 2 0 1 , 1 1 2 2 5 7 , 2 3 0 2 9 9 , 1 7 4 2 9 9 , 1 7 4 2 9 7 , 6 5 7 3 0 4 , 1 5 9 3 0 6 , 8 1 5 3 0 6 , 3 6 1 14 Farm Credit Banks8 5 1 , 9 1 0 5 3 , 1 2 3 5 3 , 1 7 5 5 7 , 3 7 9 5 7 , 3 7 9 5 8 , 6 5 9 5 7 , 5 3 6 5 9 , 4 2 8 6 0 , 8 1 5 15 Student Loan Marketing Association9 3 9 , 6 5 0 3 9 , 7 8 4 5 0 , 3 3 5 4 7 , 5 2 9 4 7 , 5 2 9 4 7 , 6 7 3 4 9 , 4 9 5 4 5 , 7 2 3 n a. 16 Financing Coiporation10 8 , 1 7 0 8 , 1 7 0 8 , 1 7 0 8 , 1 7 0 8 , 1 7 0 8 , 1 7 0 8 , 1 7 0 8 , 1 7 0 8 , 1 7 0 17 Farm Credit Financial Assistance Corporation" 1,261 1 ,261 1,261 1 ,261 1 ,261 1,261 1 ,261 1,261 1 ,261 18 Resolution Funding Corporation12 2 9 , 9 9 6 2 9 , 9 9 6 2 9 , 9 9 6 2 9 , 9 9 6 2 9 , 9 9 6 2 9 , 9 9 6 2 9 , 9 9 6 2 9 , 9 9 6 2 9 , 9 9 6
MEMO 19 Federal Financing Bank debt13 154,994 128,187 103,817 78,681 78,681 78,512 68,037 66,725
Lending to federal and federally sponsored agencies 2 0 Export-Import Bank3 7 , 2 0 2 5 , 3 0 9 3 , 4 4 9 2 , 0 4 4 2 , 0 4 4 2 , 0 4 4 2 , 0 4 4 2 , 0 0 9 21 Postal Service6 1 0 , 4 4 0 9 , 7 3 2 8 , 0 7 3 5 , 7 6 5 5 , 7 6 5 5 , 7 6 5 3 0 0 3 0 0 2 2 Student Loan Marketing Association 4 , 7 9 0 4 , 7 6 0 n.a. n.a. n.a. n.a. n.a. n.a. 2 3 Tennessee Valley Authority 6 , 9 7 5 6 , 3 2 5 3 , 2 0 0 3 , 2 0 0 3 , 2 0 0 3 , 2 0 0 n.a. n.a. n.a. 2 4 United States Railway Association6 n.a. n.a. n.a. n.a. n.a. n.a. n.a. n.a.
Other lending14
2 5 Farmers Home Administration 4 2 , 9 7 9 3 8 , 6 1 9 3 3 , 7 1 9 2 1 , 0 1 5 2 1 , 0 1 5 2 1 , 0 1 5 2 1 , 0 1 5 2 1 , 0 1 5 2 6 Rural Electrification Administration 1 8 , 1 7 2 1 7 , 5 7 8 1 7 , 3 9 2 1 7 , 1 4 4 1 7 , 1 4 4 1 7 , 0 2 6 1 7 , 0 4 0 1 7 , 0 4 9 2 7 Other 6 4 , 4 3 6 4 5 , 8 6 4 3 7 , 9 8 4 2 9 , 5 1 3 2 9 , 5 1 3 2 9 , 4 6 2 2 7 , 6 3 8 2 6 , 3 5 2
1. Consists of mortgages assumed by the Defense Department between 1957 and 1963 under family housing and homeowners assistance programs.
2. Includes participation certificates reclassified as debt beginning Oct. 1, 1976. 3. On-budget since Sept. 30, 1976. 4. Consists of debentures issued in payment of Federal Housing Administration insurance
claims. Once issued, these securities may be sold privately on the securities market. 5. Certificates of participation issued before fiscal year 1969 by the Government National
Mortgage Association acting as trustee for the Farmers Home Administration, the Department of Health, Education, and Welfare, the Department of Housing and Urban Development, the Small Business Administration, and the Veterans Administration.
6. Off-budget. 7. Includes outstanding noncontingent liabilities: notes, bonds, and debentures. Includes
Federal Agricultural Mortgage Corporation; therefore details do not sum to total. Some data are estimated.
8. Excludes borrowing by the Farm Credit Financial Assistance Corporation, which is shown on line 17.
9. Before late 1982, the association obtained financing through the Federal Financing Bank (FFB). Borrowing excludes that obtained from the FFB, which is shown on line 22.
10. The Financing Corporation, established in August 1987 to recapitalize the Federal Savings and Loan Insurance Corporation, undertook its first borrowing in October 1987.
11. The Farm Credit Financial Assistance Corporation, established in January 1988 to provide assistance to the Farm Credit System, undertook its first borrowing in July 1988.
12. The Resolution Funding Corporation, established by the Financial Institutions Reform, Recovery, and Enforcement Act of 1989, undertook its first borrowing in October 1989.
13. The FFB, which began operations in 1974, is authorized to purchase or sell obligations issued, sold, or guaranteed by other federal agencies. Because FFB incurs debt solely for the purpose of lending to other agencies, its debt is not included in the main portion of the table to avoid double counting.
14. Includes FFB purchases of agency assets and guaranteed loans; the latter are loans guaranteed by numerous agencies, with the amounts guaranteed by any one agency generally being small. The Farmers Home Administration entry consists exclusively of agency assets, whereas the Rural Electrification Administration entry consists of both agency assets and guaranteed loans.
Digitized for FRASER http://fraser.stlouisfed.org/ Federal Reserve Bank of St. Louis

Securities Market and Corporate Finance A31
1.45 NEW SECURITY ISSUES Tax-Exempt State and Local Governments
Millions of dollars
Type of issue or issuer, or use 1993 1994 1995
1995 1996 Type of issue or issuer,
or use 1993 1994 1995 Nov. Dec. Jan. Feb. Mar. Apr. May June
1 All issues, new and refunding1 279,945 153,950 143,101 16,839 16,978 11,545 11,598 15,244 13,199 14,991 16,533
By type of issue 2 General obligation 90,599 54,404 55,737 6,194 5,489 6,074 2,063 4,846 5,083 5,476 6,493 3 Revenue 189,346 99,546 86,555 10,645 11,489 5,471 9,535 10,398 8,116 9,515 10,040
By type of issuer 4 State 27,999 19,186 14,215 1,491 951 1,630 695 904 926 2,807 1,047 5 Special district or statutory authority2 178,714 95,896 91,419 10,736 11,678 7,052 7,820 10,141 9,571 9,824 9,899 6 Municipality, county, or township 73,232 38,868 36,658 4,612 4,349 2,863 3,083 4,199 2,702 2,360 5,587
7 Issues for new capital 91,434 105,972 94,412 11,415 11,070 6,517 6,383 10,621 9,487 9,594 13,864
By use of proceeds 8 Education 16,831 21,267 24,926 3,377 2,968 2,065 2,226 1,847 2,142 2,442 3,453 9 Transportation 9,167 10,836 11,887 1,469 1,178 573 359 1,417 682 778 1,390
10 Utilities and conservation 12,014 10,192 9,618 554 1,664 439 582 892 592 1,368 974 11 Social welfare 13,837 20,289 18,612 2,177 1,614 935 904 2,715 1,669 1,764 3,152 12 Industrial aid 6,862 8,161 6,566 650 1,325 322 110 785 751 302 414 13 Other purposes 32,723 35,227 26,518 3,188 2,321 2,183 2,202 2,965 3,651 2,940 4,481
1. Par amounts of long-term issues based on date of sale. SOURCE. Securities Data Company beginning January 1993; Investment 2. Includes school districts. Dealer's Digest before then.
1.46 NEW SECURITY ISSUES U.S. Corporations
Millions of dollars
Type of issue, offering, or issuer 1993 1994 1995
1995 1996 Type of issue, offering,
or issuer 1993 1994 1995
Oct. Nov. Dec. Jan. Feb. Mar. Apr. May
1 All issues' 769,088 583,240 n.a. 52,112 55,349 40,149 47,499r 60,784r 54,980r 45,000r 59,890
2 Bonds2 646,634 498,039 n.a. 43,452 47,568 34,619 42,743r 51,624r 47,587r 32,500 46300
By type of offering 3 Public, domestic 487,029 365,222 408,806 36,692 43,336 32,219 33,982r 44,969r 40,763' 27,000 39,300 4 Private placement, domestic3 121,226 76,065 n.a. n.a. n.a. n.a. n.a. n.a. n.a. n.a. n.a. 5 Sold abroad 38,379 56,755 76,910 6,760 4,232 2,399 8,761 6,656 6,824' 5,500 7,000
By industry group 6 Manufacturing 88,160 43,423 42,950 3,397 4,017 3,205 3,809 2,472 3,335' 2,210 5,646 7 Commercial and miscellaneous 58,559 40,735 37,139 3,532 4,178 3,099 2,151 2,601 3,852 3,064 4,810 8 Transportation 10,816 6,867 5,727 187 225 1,240 664 584 137' 120 565 9 Public utility 56,330 13,322 11,974 1,241 485 685 1,821 955 678 465' 611
10 Communication 31,950 13,340 18,158 2,389 3,333 648 748 2,691 2,073' 535 1,187 11 Real estate and financial 400,820 380,352 369,769 32,706 35,330 25,742 33,550r 42,323r 37,512' 26,106' 33,481
12 Stocks2 122,454 85,155 n.a. 8,660 7,781 5,530 4,756 9,160 7,393 12,500r 13,590
By type of offering 13 Public preferred 18,897 12,570 10,964 836 2,210 890 2,167 3,258 967 2,000 1,660 14 Common 82,657 47,828 57,809 7,824 5,571 4,640 2,589 5,902 6,426 10,500' 11,930 15 Private placement 20,900 24,800 n.a. n.a. n.a. n.a. n.a. n.a. n.a. n.a.
By industry group 16 Manufacturing 22,271 17,798 1,815 2,209 681 295 1,543 2,036 3,968' 2,777 17 Commercial and miscellaneous 25,761 15,713 n.a. 4,628 3,274 2,632 2,521 2,659 3,577 4,122' 5,349 18 Transportation 2,237 2,203 39 97 156 38 141 232 37 322 19 Public utility 7,050 2,214 60 36 322 115 809 319 149 147 20 Communication 3,439 494 0 0 0 200 122 100 144 1,205 21 Real estate and financial 61,004 46,733 2,118 2,166 1,739 1,588 3,719 1,130 4,079' 3,789
1. Figures represent gross proceeds of issues maturing in more than one year; they are the principal amount or number of units calculated by multiplying by the offering price. Figures exclude secondary offerings, employee stock plans, investment companies other than closed-end, intracorporate transactions, equities sold abroad, and Yankee bonds. Stock data include ownership securities issued by limited partnerships.
2. Monthly data cover only public offerings. 3. Monthly data are not available. SOURCE. Beginning July 1993, Securities Data Company and the Board of Governors of
the Federal Reserve System.
Digitized for FRASER http://fraser.stlouisfed.org/ Federal Reserve Bank of St. Louis

A32 Domestic Financial Statistics • September 1996
1.47 OPEN-END INVESTMENT COMPANIES Net Sales and Assets1
Millions of dollars
Item 1994 1995
1995 1996
Item 1994 1995 Oct. Nov. Dec. Jan. Feb. Mar. Apr.r May
1 Sales of own shares2 841,286 871,415 72,730 70,499 94,719 112,332 90,370 93,856 101,310 96,501
2 Redemptions of own shares 699,823 699,497 56,174 52,727 67,945 75,354 60,398 65,748 81,005 69,419 3 Net sales3 141,463 171,918 16,556 17,772 26,774 36,978 29,972 28,108 20,305 27,082
4 Assets4 1,550,490 2,067,337 1,963,496 2,032,958 2,067,337 2,143,185 2,181,711 2,212,517 2,293,491 2,356,307
5 Cash5 121,296 142,572 133,653 141,489 142,572 150,772 144,520 142,697 148,777 145,554 6 Other 1,429,195 1,924,765 1,829,843 1,891,470 1,924,765 1,992,414 2,037,191 2,069,820 2,144,713 2,201,752
1. Data on sales and redemptions exclude money market mutual funds but include limited-maturity municipal bond funds. Data on asset positions exclude both money market mutual funds and limited-maturity municipal bond funds.
2. Includes reinvestment of net income dividends. Excludes reinvestment of capital gains distributions and share issue of conversions from one fund to another in the same group.
3. Excludes sales and redemptions resulting from transfers of shares into or out of money market mutual funds within the same fund family.
4. Market value at end of period, less current liabilities. 5. Includes all U.S. Treasury securities and other short-term debt securities. SOURCE. Investment Company Institute. Data based on reports of membership, which
comprises substantially all open-end investment companies registered with the Securities and Exchange Commission. Data reflect underwritings of newly formed companies after their initial offering of securities.
1.48 CORPORATE PROFITS AND THEIR DISTRIBUTION
Billions of dollars; quarterly data at seasonally adjusted annual rates
Account 1993 1994 1995 1994 1995 1996
Account 1993 1994 1995 Q2 Q3 Q4 Ql Q2 Q3 Q4 Ql
1 Profits with inventory valuation and capital consumption adjustment 464.5 526.5 588.6 531.5 549.8 568.9 559.6 561.1 614.9 618.6 652.0
2 Profits before taxes 464.3 528.2 600.8 523.2 547.5 570.4 594.1 588.4 609.6 611.0 649.0 3 Profits-tax liability 163.8 195.3 218.7 192.8 203.4 213.5 217.3 214.2 224.5 218.7 233.4 4 Profits after taxes 300.5 332.9 382.1 330.4 344.1 356.8 376.8 374.1 385.1 392.3 415.6 5 Dividends 197.3 211.0 227.4 208.8 212.5 218.5 221.7 224.6 228.5 234.7 239.9 6 Undistributed profits 103.3 121.9 154.7 121.7 131.6 138.3 155.1 149.6 156.6 157.6 175.7
7 Inventory valuation -6 .6 -13.3 -28.1 -9 .8 -16.5 -22.8 -51 .9 -42.3 -9 .3 -8 .8 -17 .4 8 Capital consumption adjustment 6.7 11.6 15.9 18.1 18.8 21.3 17.4 15.0 14.6 16.5 20.4
SOURCE. U.S. Department of Commerce, Survey of Current Business.
Digitized for FRASER http://fraser.stlouisfed.org/ Federal Reserve Bank of St. Louis

Securities Markets and Corporate Finance A3 3
1.51 DOMESTIC FINANCE COMPANIES Assets and Liabilities1
Billions of dollars, end of period; not seasonally adjusted
Account 1993 1994 1995
1994 1995 1996
Account 1993 1994 1995
Q3 Q4 Q1 Q2 Q3 Q4 Q1
ASSETS
1 Accounts receivable, gross2 482.8 551.0 614.6 524.1 551.0 568.5 586.9 594.7 614.6 623.3 2 Consumer 116.5 134.8 152.0 130.3 134.8 135.8 141.7 146.2 152.0 153.2 3 Business 294.6 337.6 375.9 317.2 337.6 351.9 361.8 362.4 375.9 381.0 4 Real estate 71.7 78.5 86.6 76.6 78.5 80.8 83.4 86.1 86.6 89.1
5 LESS; Reserves for unearned income 50.7 55.0 63.2 51.1 55.0 58.9 62.1 61.2 63.2 61.8 6 Reserves for losses 11.2 12.4 14.1 12.1 12.4 12.9 13.7 13.8 14.1 14.2
7 Accounts receivable, net 420.9 483.5 537.3 460.9 483.5 496.7 511.1 519.7 537.3 547.3 8 All other 170.9 183.4 210.7 177.2 183.4 194.6 198.1 198.1 210.7 211.6
9 Total assets 591.8 666.9 748.0 638.1 666.9 691.4 709.2 717.8 748.0 758.9
LIABILITIES AND CAPITAL
10 Bank loans 25.3 21.2 23.1 21.6 21.2 21.0 21.5 21.8 23.1 23.5 11 Commercial paper 159.2 184.6 184.5 171.0 184.6 181.3 181.3 178.0 184.5 184.8
Debt 12 Owed to parent 42.7 51.0 62.3 50.0 51.0 52.5 57.5 59.0 62.3 62.3 13 Not elsewhere classified 206.0 235.0 284.7 228.2 235.0 254.4 264.4 272.1 284.7 291.4 14 All other liabilities 87.1 99.5 106.2 95.0 99.5 102.5 102.1 102.4 106.2 105.7 15 Capital, surplus, and undivided profits 71.4 75.7 87.2 72.3 75.7 79.7 82.5 84.4 87.2 91.1
16 Total liabilities and capital 591.8 666.9 748.0 638.1 666.9 691.4 709.2 717.8 748.0 758.9
1. Includes finance company subsidiaries of bank holding companies but not of retailers 2. Before deduction for unearned income and losses, and banks. Data are amounts carried on the balance sheets of finance companies; securitized pools are not shown, as they are not on the books.
1.52 DOMESTIC FINANCE COMPANIES Consumer, Real Estate, and Business Credit1
Millions of dollars, amounts outstanding, end of period
Type of credit 1993 1994 1995
1995 1996
Type of credit 1993 1994 1995
Dec. Jan. Feb. Mar. Apr. May
Seasonally adjusted
1 Total 546,103 615,618 691,616 691,616 696,099 700,977 703,398r 708,343r 710,367
2 Consumer 160,227 176,085 198,861 198,861 200,162 202,548 203,280 205,184 207,027 3 Real estate2 72,043 78,910 87,077 87,077 88,084 88,188 89,502 89,943 90,180 4 Business 313,833 360,624 405,678 405,678 407,853 410,241 410,616r 413,216r 413,160
Not seasonally adjusted
5 Total 550,751 620,975 697,340 697,340 697,312 701,576 705,650r 710,762r 712,429
6 Consumer 162,770 178,999 202,101 202,101 201,774 202,108 202,337 203,532 205,678 7 Motor vehicles 56,057 61,609 70,061 70,061 71,420 73,312 72,129 73,810 74,327 8 Other consumer3 60,396 73,221 81,988 81,988 81,186 81,214 79,779 79,489 80,435 9 Securitized motor vehicles4 36,024 31,897 33,633 33,633 32,128 30,364 31,093 30,476 31,435
10 Securitized other consumer4 10,293 12,272 16,419 16,419 17,040 17,218 19,336 19,757 19,481 11 Real estate2 71,727 78,479 86,606 86,606 88,495 88,520 89,056 89,975 90,182 12 Business 316,254 363,497 408,633 408,633 407,043 410,948 414,257r 417,255r 416,569 13 Motor vehicles 95,173 118,197 133,277 133,277 132,062 132,153 134,098' 134,500' 134,196 14 Retail5 18,091 21,514 25,304 25,304 25,906 26,591 27,140r 27,954' 27,151 15 Wholesale6 31,148 35,037 36,427 36,427 34,198 33,386 33,910 32,155 31,360 16 Leasing 45,934 61,646 71,546 71,546 71,958 72,176 73,048 74,391 75,685 17 Equipment 145,452 157,953 177,297 177,297 175,984 176,461 177,285 178,507 178,151 18 Retail 35,513 39,680 48,843 48,843 48,737 48,660 48,696 47,913 46,941 19 Wholesale6 8,001 9,678 10,266 10,266 9,260 8,914 9,213 9,663 10,386 20 Leasing 101,938 108,595 118,188 118,188 117,987 118,887 119,376 120,931 120,824 21 Other business7 53,997 61,495 65,363 65,363 66,643 68,070 69,497 69,193 68,112 22 Securitized business assets4 21,632 25,852 32,696 32,696 32,354 34,264 33,377 35,055 36,110 23 Retail 2,869 4,494 4,723 4,723 4,467 4,252 4,067 4,367 4,790 24 Wholesale 10,584 14,826 21,327 21,327 21,130 23,460 22,622 24,327 25,028 25 Leasing 8,179 6,532 6,646 6,646 6,757 6,552 6,688 6,361 6,292
1. Includes finance company subsidiaries of bank holding companies but not of retailers and banks. Data are before deductions for unearned income and losses. Data in this table also appear in the Board's G.20 (422) monthly statistical release. For ordering address, see inside front cover.
2. Includes all loans secured by liens on any type of real estate, for example, first and junior mortgages and home equity loans.
3. Includes personal cash loans, mobile home loans, and loans to purchase other types of consumer goods such as appliances, apparel, general merchandise, and recreation vehicles.
4. Outstanding balances of pools upon which securities have been issued; these balances are no longer carried on the balance sheets of the loan originator.
5. Passenger car fleets and commercial land vehicles for which licenses are required. 6. Credit arising from transactions between manufacturers and dealers, that is, floor plan
financing. 7. Includes loans on commercial accounts receivable, factored commercial accounts, and
receivable dealer capital; small loans used primarily for business or farm purposes; and wholesale and lease paper for mobile homes, campers, and travel trailers.
Digitized for FRASER http://fraser.stlouisfed.org/ Federal Reserve Bank of St. Louis

A34 Domestic Nonfinancial Statistics • September 1996
1.53 MORTGAGE MARKETS Mortgages on New Homes
Millions of dollars except as noted
1995 1996
Item 1993 1995 Item 1993 1995 Dec. Jan. Feb. Mar. Apr. May June
Terms and yields in primary and secondary markets
PRIMARY MARKETS
Terms1
1 Purchase price (thousands of dollars) 163.1 170.4 175.8 181.7 179.2 181.7 184.5 175.2 179.5 180.1 2 Amount of loan (thousands of dollars) 123.0 130.8 134.5 140.9 135.8 143.2 141.5 133.2 137.6 139.4 3 Loan-to-price ratio (percent) 78.0 78.8 78.6 79.1 77.3 80.3 77.8 78.4 79.3 78.7 4 Maturity (years) 26.1 27.5 27.7 27.6 27.7 27.8 26.4 27.1 27.2 25.8 5 Fees and charges (percent of loan amount)2 1.30 1.29 1.21 1.21 1.07 1.24 1.30 1.17 1.16 1.31
Yield (percent per year) 6 Contract rate' 7.03 7.26 7.65 7.20 7.15 7.00 7.25 7.57 7.61 7.75 7 Effective rate1,3 7.24 7.47 7.85 7.40 7.32 7.20 7.49 7.76 7.80 8.05 8 Contract rate (HUD series)4 7.37 8.58 8.05 7.30 7.23 7.56 7.97 8.22 8.34 8.37
SECONDARY MARKETS
Yield (percent per year) 8.18 7.11 7.57 8.52 8.55 9 FHA mortgages (Section 203)5 7.46 8.68 8.18 7.52 7.11 7.57 8.09 8.52 8.57 8.55
10 GNMA securities6 6.65 7.96 7.57 6.82 6.71 6.85 7.40 7.63 7.81 7.91
Activity in secondary markets
FEDERAL NATIONAL MORTGAGE ASSOCIATION
Mortgage holdings (end of period) 11 Total 190,861 222,057 253,511 253,511 255,619 257,970 262,014 263,809 267,330 270,042 12 F H A / V A i n s u r e d 23,857 27,558 28,762 28,762 28,622 28,502 28,744 29,132 30,442 30,936 13 Conventional 167,004 194,499 224,749 224,749 226,997 229,468 233,270 234,677 236,888 239,106
14 Mortgage transactions purchased (during period) 92,037 62,389 56,598 6,243 4,810 5,371 7,681 5,339 6,720 5,421
Mortgage commitments (during period) 15 Issued7 92,537 54,038 56,092 4,765 5,750 7,013 6,293 5,599 5,228 5,280 16 To sell8 5,097 1,820 360 0 3 0 29 0 13 0
FEDERAL HOME LOAN MORTGAGE CORPORATION
Mortgage holdings (end of period f 17 Total 55,012 72,693 107,424 107,424 111,143 114,793 117,420 119,520 121,058 123,806 18 F H A / V A i n s u r e d 321 276 267 267 226 223 220 216 212 212 19 Conventional 54,691 72,416 107,157 107,157 110,917 114,570 117,200 119,304 120,846 123,594
Mortgage transactions (during period) 20 Purchases 229,242 124,697 98,470 13,108 13,357 10,891 11,984 12,740 12,385 10,266 21 Sales 208,723 117,110 85,877 11,712 11,624 9,733 11,384 11,958 11,904 9,969
22 Mortgage commitments contracted (during period)9 274,599 136,067 118,659 14,609 12,765 10,378 14,520 13,009 11,075 11,164
1. Weighted averages based on sample surveys of mortgages originated by major institu-tional lender groups for purchase of newly built homes; compiled by the Federal Housing Finance Board in cooperation with the Federal Deposit Insurance Corporation.
2. Includes all fees, commissions, discounts, and "points" paid (by the borrower or the seller) to obtain a loan.
3. Average effective interest rate on loans closed for purchase of newly built homes, assuming prepayment at the end of ten years.
4. Average contract rate on new commitments for conventional first mortgages; from U.S. Department of Housing and Urban Development (HUD). Based on transactions on the first day of the subsequent month.
5. Average gross yield on thirty-year, minimum-downpayment first mortgages insured by the Federal Housing Administration (FHA) for immediate delivery in the private secondary market. Based on transactions on first day of subsequent month.
6. Average net yields to investors on fully modified pass-through securities backed by mortgages and guaranteed by the Government National Mortgage Association (GNMA), assuming prepayment in twelve years on pools of thirty-year mortgages insured by the Federal Housing Administration or guaranteed by the Department of Veterans Affairs.
7. Does not include standby commitments issued, but includes standby commitments converted.
8. Includes participation loans as well as whole loans. 9. Includes conventional and government-underwritten loans. The Federal Home Loan
Mortgage Corporation's mortgage commitments and mortgage transactions include activity under mortgage securities swap programs, whereas the corresponding data for FNMA exclude swap activity.
Digitized for FRASER http://fraser.stlouisfed.org/ Federal Reserve Bank of St. Louis

Real Estate A35
1.54 MORTGAGE DEBT OUTSTANDING1
Millions of dollars, end of period
Type of holder and property 1992 1993 1994 1995 1996
Type of holder and property 1992 1993 1994
Ql Q2 Q3 Q4 Ql p
1 All holders 4,092,984 4,268,420 4,473,100 4,515,854 4,584,566 4,663,864 4,715,884 4,773,998
By type of property 2 One- to four-family residences 3,037,408 3,227,134 3,430,023 3,465,065 3,524,378 3,593,966 3,634,698 3,682,610 3 Multifamily residences 274,234 270,796 275,303 276,398 280,390 284,238 288,090 292,448 4 Nonfarm, nonresidential 700,604 689,296 684,803 690,988 695,947 701,241 708,467 713,751 5 80,738 81,194 82,971 83,403 83,850 84,420 84,629 85,189
By type of holder 6 Major financial institutions 1,769,187 1,767,835 1,815,810 1,841,815 1,868,175 1,895,285 1,890,539 1,895,878 7 Commercial banks2 894,513 940,444 1,004,280 1,024,854 1,053,048 1,072,780 1,080,373 1,087,174 8 One- to four-family 507,780 556,538 611,697 625,378 648,705 662,126 663,588 666,306 9 Multifamily 38,024 38,635 38,916 39,746 40,593 43,003 43,846 45,201
10 Nonfarm, nonresidential 328,826 324,409 331,100 336,795 340,176 343,826 349,109 351,736 11 Farm 19,882 20,862 22,567 22,936 23,575 23,824 23,829 23,931 12 Savings institutions3 627,972 598,330 596,199 601,777 599,745 604,614 596,789 595,903 13 One- to four-family 489,622 469,959 477,499 483,625 482,005 489,150 482,765 484,020 14 Multifamily 69,791 67,362 64,400 63,778 64,404 63,569 61,926 60,494 15 Nonfarm, nonresidential 68,235 60,704 54,011 54,085 53,054 51,604 51,809 51,089 16 Farm 324 305 289 288 282 291 288 299 17 Life insurance companies 246,702 229,061 215,332 215,184 215,382 217,892 213,377 212,801 18 One- to four-family 11,441 9,458 7,910 7,892 7,911 8,006 7,833 7,815 19 Multifamily 27,770 25,814 24,306 24,250 24,310 24,601 24,070 24,013 20 Nonfarm, nonresidential 198,269 184,305 173,539 173,142 173,565 175,643 171,855 171,445 21 Farm 9,222 9,484 9,577 9,900 9,596 9,643 9,619 9,528
22 Federal and related agencies 286,263 327,014 319,401 317,753 315,722 319,923 320,828 322,131 23 Government National Mortgage Association 30 22 6 15 7 2 2 2 24 One- to four-family 30 15 6 15 7 2 2 2 25 Multifamily 0 7 0 0 0 0 0 0 26 Farmers Home Administration4 41,695 41,386 41,781 41,857 41,917 41,858 41,791 41,594 27 One- to four-family 16,912 15,303 13,826 13,507 13,217 12,914 12,643 12,327 28 Multifamily 10,575 10,940 11,319 11,418 11,512 11,557 11,617 11,636 29 Nonfarm, nonresidential 5,158 5,406 5,670 5,807 5,949 6,096 6,248 6,365 30 Farm 9,050 9,739 10,966 11,124 11,239 11,291 11,282 11,266 31 Federal Housing and Veterans' Administrations 12,581 12,215 10,964 10,890 10,098 9,535 9,809 8,439 32 One- to four-family 5,153 5,364 4,753 4,715 4,838 4,918 5,180 4,228 33 Multifamily 7,428 6,851 6,211 6,175 5,260 4,617 4,629 4,211 34 Resolution Trust Corporation 32,045 17,284 10,428 9,342 6,456 4,889 1,864 0 35 One- to four-family 12,960 7,203 5,200 4,755 2,870 2,299 691 0 36 Multifamily 9,621 5,327 2,859 2,494 1,940 1,420 647 0 37 Nonfarm, nonresidential 9,464 4,754 2,369 2,092 1,645 1,170 525 0 38 Farm 0 0 0 0 0 0 0 0 39 Federal Deposit Insurance Corporation 0 14,112 7,821 6,730 6,039 5,015 4,303 5,553 40 One- to four-family 0 2,367 1,049 840 731 618 492 1,848 41 Multifamily 0 1,426 1,595 1,310 1,135 722 428 560 42 Nonfarm, nonresidential 0 10,319 5,177 4,580 4,173 3,674 3,383 3,145 43 Farm 0 0 0 0 0 0 0 0 44 Federal National Mortgage Association 137,584 166,642 178,059 177,615 178,462 182,229 183,782 183,531 45 One- to four-family 124,016 151,310 162,160 161,780 162,674 166,393 168,122 167,895 46 Multifamily 13,568 15,332 15,899 15,835 15,788 15,836 15,660 15,636 47 Federal Land Banks 28,664 28,460 28,555 28,065 28,005 28,151 28,428 28,891 48 One- to four-family 1,687 1,675 1,671 1,651 1,648 1,656 1,673 1,700 49 Farm 26,977 26,785 26,885 26,414 26,357 26,495 26,755 27,191 50 Federal Home Loan Mortgage Corporation 33,665 46,892 41,786 43,239 44,738 48,243 50,849 54,120 51 One- to four-family 31,032 44,345 38,956 40,105 41,477 44,809 46,997 50,058 52 Multifamily 2,633 2,547 2,830 3,134 3,261 3,434 3,852 4,062
53 Mortgage pools or trusts5 1,434,264 1,564,571 1,718,297 1,731,468 1,759,091 1,795,041 1,853,613 1,895,309 54 Government National Mortgage Association 419,516 414,066 450,934 454,401 457,101 463,654 472,298 475,823 55 One- to four-family 410,675 404,864 441,198 444,632 446,855 453,114 461,453 464,644 56 Multifamily 8,841 9,202 9,736 9,769 10,246 10,540 10,845 11,179 57 Federal Home Loan Mortgage Corporation 407,514 447,147 490,851 492,194 498,216 503,370 515,051 524,326 58 One- to four-family 401,525 442,612 487,725 489,114 495,182 500,417 512,238 521,721 59 Multifamily 5,989 4,535 3,126 3,080 3,034 2,953 2,813 2,605 60 Federal National Mortgage Association 444,979 495,525 530,343 533,262 543,669 559,585 582,959 599,546 61 One- to four-family 435,979 486,804 520,763 523,903 533,091 548,400 569,724 585,527 62 Multifamily 9,000 8,721 9,580 9,359 10,578 11,185 13,235 14,019 63 Farmers Home Administration 38 28 19 14 13 12 11 10 64 One- to four-family 8 5 3 2 2 2 2 1 65 Multifamily 0 0 0 0 0 0 0 0 66 Nonfarm, nonresidential 17 13 9 7 6 5 5 5 67 Farm 13 10 7 5 5 5 4 4 68 Private mortgage conduits 162,217 207,806 246,150 251,597 260,093 268,420 283,294 295,604 69 One- to four-family 140,718 173,635 194,451 198,040 202,718 207,679 214,635 220,022 70 Multifamily 6,305 8,701 14,925 15,743 17,281 18,903 21,279 24,477 71 Nonfarm, nonresidential 15,194 25,469 36,774 37,814 40,094 41,838 47,380 51,104 72 Farm 0 0 0 0 0 0 0 0
73 Individuals and others6 603,270 609,000 619,592 624,819 641,578 653,615 650,904 660,680 74 One- to four-family 447,871 455,676 461,157 465,111 480,447 491,463 486,660 494,495 75 Multifamily 64,688 65,397 69,601 70,305 71,050 71,897 73,243 74,354 76 Nonfarm, nonresidential 75,441 73,917 76,153 76,667 77,284 77,384 78,152 78,861 77 15,270 14,009 12,681 12,736 12,796 12,872 12,850 12,970
1. Multifamily debt refers to loans on structures of five or more units. 2. Includes loans held by nondeposit trust companies but not loans held by bank trust
departments. 3. Includes savings banks and savings and loan associations. 4. FmHA-guaranteed securities sold to the Federal Financing Bank were reallocated from
FmHA mortgage pools to FmHA mortgage holdings in 1986:Q4 because of accounting changes by the Farmers Home Administration.
5. Outstanding principal balances of mortgage-backed securities insured or guaranteed by the agency indicated.
6. Other holders include mortgage companies, real estate investment trusts, state and local credit agencies, state and local retirement funds, noninsured pension funds, credit unions, and finance companies.
SOURCE. Based on data from various institutional and government sources. Separation of nonfarm mortgage debt by type of property, if not reported directly, and interpolations and extrapolations, when required for some quarters, are estimated in part by the Federal Reserve. Line 69 from Inside Mortgage Securities.
Digitized for FRASER http://fraser.stlouisfed.org/ Federal Reserve Bank of St. Louis

A36 Domestic Nonfinancial Statistics • September 1996
1.55 CONSUMER INSTALLMENT CREDIT'
Millions of dollars, amounts outstanding, end of period
Holder and type of credit 1993 1994 1995 1995 1996
Holder and type of credit 1993 1994 1995
Dec. Jan. Feb. Mar. Apr. May
Seasonally adjusted
1 Total 844,118 966,457 1,103,164 1,103,164 1,113,509 1,124,253 1,133,642 1,140,181 1,145,061
2 Automobile 279,786 317,182 351,052 351,052 352,461 354,810 356,310 359,507 360,539 3 Revolving 287,011 339,337 413,894 413,894 419,030 425,778 431,196 438,460 444,389 4 Other2 277,321 309,939 338,218 338,218 342,018 343,666 346,136 342,214 340,133
Not seasonally adjusted
5 Total 863,924 990,247 1,131,747 1,131,747 1,123,813 1,121,348 1,123,315 1,129,433 1,135,310
By major holder 6 Commercial banks 399,683 462,923 507,414 507,414 502,400 500,140 499,762 504,652 503,951 7 Finance companies 116,453 134,830 152,624 152,624 152,606 154,365 151,749 153,299 154,762 8 Credit unions 101,634 119,594 131,939 131,939 131,257 130,839 130,837 131,873 133,354 9 Savings institutions 37,855 38,468 40,106 40,106 40,000 40,000 40,000 39,999 40,000
10 Nonfinancial business3 77,229 86,621 85,061 85,061 80,733 78,138 76,681 73,765 74,680 11 Pools of securitized assets4 131,070 147,811 214,603 214,603 216,817 217,866 224,286 225,845 228,563
By major type of credit 12 Automobile 281,538 319,715 354,260 354,260 351,969 352,583 352,634 355,073 357,868 13 Commercial banks 122,000 141,895 149,094 149,094 148,186 147,703 148,455 150,455 151,038 14 Finance companies 56,057 61,609 70,626 70,626 71,420 73,312 72,129 73,810 74,327 15 Pools of securitized assets4 39,561 36,376 44,616 44,616 42,569 41,755 42,868 40,596 41,021
16 Revolving 302,201 357,307 435,674 435,674 426,024 424,657 425,823 431,733 438,507 17 Commercial banks 149,920 182,021 210,298 210,298 200,080 198,886 196,836 201,858 205,011 18 Nonfinancial business3 50,125 56,790 53,525 53,525 50,520 48,613 47,416 44,526 45,182 19 Pools of securitized assets4 80,242 96,130 147,934 147,934 151,640 153,390 157,690 161,185 163,774
20 Other 280,185 313,225 341,813 341,813 345,820 344,108 344,858 342,627 338,935 21 Commercial banks 127,763 139,007 148,022 148,022 154,134 153,551 154,471 152,339 147,902 22 Finance companies 60,396 73,221 81,998 81,998 81,186 81,053 79,620 79,489 80,435 23 Nonfinancial business3 27,104 29,831 31,536 31,536 30,213 29,525 29,265 29,239 29,498 24 Pools of securitized assets4 11,267 15,305 22,053 22,053 22,608 22,721 23,728 24,064 23,768
1. The Board's series on amounts of credit covers most short- and intermediate-term credit extended to individuals that is scheduled to be repaid (or has the option of repayment) in two or more installments. Data in this table also appear in the Board's G.19 (421) monthly statistical release. For ordering address, see inside front cover.
2. Comprises mobile home loans and all other installment loans that are not included in automobile or revolving credit, such as loans for education, boats, trailers, or vacations. These loans may be secured or unsecured.
3. Includes retailers and gasoline companies. 4. Outstanding balances of pools upon which securities have been issued; these balances
are no longer carried on the balance sheets of the loan originator. 5. Totals include estimates for certain holders for which only consumer credit totals are
available.
1.56 TERMS OF CONSUMER INSTALLMENT CREDIT1
Percent per year except as noted
Item 1993 1994 1995 1995 1996
Item 1993 1994 1995 Nov. Dec. Jan. Feb. Mar. Apr. May
INTEREST RATES
Commercial banks2
1 48-month new car 8.09 8.12 9.57 9.36 n.a. n.a. 9.12 n.a. 8.93 2 24-month personal 13.47 13.19 13.94 13.80 n.a. n.a. 13.63 n.a. n.a. 13.52
Credit card plan 3 All accounts n.a. 15.69 16.02 15.81 n.a. n.a. 15.82 n.a. 15.44 4 Accounts assessed interest n.a. 15.77 15.79 15.71 n.a. n.a. 15.41 n.a. n.a. 15.41
Auto finance companies 5 New car 9.48 9.79 11.19 10.84 10.52 9.74 9.86 9.77 9.64 9.37 6 Used car 12.79 13.49 14.48 13.98 13.83 13.27 13.28 13.19 13.26 13.49
OTHER TERMS3
Maturity (months) 1 New car 54.5 54.0 54.1 54.5 53.6 51.8 52.3 51.8 51.5 50.8 8 Used car 48.8 50.2 52.2 52.2 51.8 52.2 52.1 52.0 51.8 51.7
Loan-to-value ratio 9 New car 91 92 92 92 92 92 91 91 91 91
10 Used car 98 99 99 99 99 99 98 98 99 99
Amount financed (dollars) 11 New car 14,332 15,375 16,210 16,583 17,034 16,698 16,627 16,520 16,605 16,686 12 Used car 9,875 10,709 11,590 12,012 12,152 12,059 11,990 11,934 12,024 12,233
1. The Board's series on amounts of credit covers most short- and intermediate-term credit 2. Data are available for only the second month of each quarter, extended to individuals that is scheduled to be repaid (or has the option of repayment) in two 3. At auto finance companies, or more installments. Data in this table also appear in the Board's G.19 (421) monthly statistical release. For ordering address, see inside front cover.
Digitized for FRASER http://fraser.stlouisfed.org/ Federal Reserve Bank of St. Louis

Flow of Funds A37
1.57 FUNDS RAISED IN U.S. CREDIT MARKETS1
Billions of dollars; quarterly data at seasonally adjusted annual rates
1994 1995 1996
Q3 Q4 01 Q2 Q3 Q4 Ql
Nonfinancial sectors
1 Total net borrowing by domestic nonfinancial sectors. . . . 481.7 543.0 628.5 618.9 732.9 587.6 634.8 880.4 888.3 584.8 578.2 863.5
By sector and instrument 2 U.S. government 278.2 304.0 256.1 155.9 144.4 135.6 150.1 266.8 202.8 65.8 42.4 288.7 3 Treasury securities 292.0 303.8 248.3 155.7 142.9 132.8 155.7 268.0 201.2 65.4 37.2 291.0 4 Budget agency issues and mortgages -13 .8 .2 7.8 .2 1.5 2.9 -5 .7 - 1 . 2 1.6 .4 5.1 - 2 . 3
5 Private 203.5 239.0 372.3 463.1 588.5 452.0 484.7 613.6 685.6 519.1 535.9 574.8
By instrument 6 Municipal securities 87.8 30.5 74.8 -29 .3 -41 .3 -58.4 -53 .8 -45.8 - 4 . 3 -107.4 - 7 . 6 -6 .4 7 Corporate bonds 78.8 67.6 75.2 23.3 73.3 15.4 6.2 53.0 98.4 59.8 82.0 58.9 8 Mortgages 158.4 130.9 157.2 194.3 237.5 205.5 210.6 222.5 239.6 290.5 197.4 285.4 9 Home mortgages 173.6 187.6 187.9 202.4 204.7 210.3 216.8 196.8 207.2 256.8 157.8 250.1
10 Multifamily residential - 5 . 5 -10 .4 - 6 . 0 1.3 11.0 5.6 - 4 . 2 2.7 14.2 13.7 13.6 15.6 11 Commercial -10 .0 -47 .8 -25 .0 -11 .1 20.1 -12.7 - 3 . 4 21.2 16.3 17.7 25.2 17.4 1? Faim .4 1.4 .5 1.8 1.7 2.2 1.4 1.7 1.8 2.3 .8 2.2 13 Consumer credit -13 .7 5.0 61.5 124.9 142.9 133.8 141.8 138.3 156.9 158.5 118.2 121.7 14 Bank loans n.e.c -40 .9 -13 .7 3.8 73.1 103.0 92.1 76.7 152.5 96.8 76.8 86.0 52.8 15 Commercial paper -18 .4 8.6 10.0 21.4 18.1 28.5 30.7 12.3 39.1 13.9 7.2 37.9 16 Other loans and advances -48 .5 10.1 -10.2 55.4 54.9 35.1 72.4 80.8 59.1 27.1 52.7 24.5
By borrowing sector 17 Household 183.8 198.4 249.1 362.2 383.5 385.3 392.4 358.6 393.0 448.1 334.5 387.7 IS Noniinancial business -61.9 19.5 61.0 144.3 250.6 132.1 160.8 300.1 303.6 181.5 217.4 190.7 19 Farm 2.1 1.3 2.0 2.8 2.0 2.4 - 2 . 0 .9 3.6 4.3 - . 8 .9 20 Nonfarm noncoiporate - 1 1 . 0 -16 .0 7.0 12.1 35.9 8.8 16.5 51.3 34.4 29.8 28.2 29.3 21 Corporate -53 .0 34.1 52.0 129.3 212.7 120.9 146.3 247.9 265.6 147.4 190.0 160.5 22 State and local government 81.6 21.1 62.3 -43.4 -45.7 -65 .4 -68 .5 -45.1 -11.1 -110.6 -16 .0 -3 .7
23 Foreign net borrowing in United States 14.8 22.6 68.8 -20 .3 67.7 19.6 33,5 61.4 40.4 94.1 75.1 36.9 74 Bonds 15.0 15.7 81.3 7.1 46.5 20.8 27.7 13.5 49.9 52.1 70.6 45.4 25 Bank loans n.e.c 3.1 2.3 .7 1.4 8.5 4.7 - . 5 8.1 5.6 8.2 11.9 8.7 26 Commercial paper 6.4 5.2 - 9 . 0 -27 .3 13.6 - 8 . 1 5.9 37.9 -11 .1 30.9 - 3 . 4 -13.8 27 Other loans and advances - 9 . 8 - . 6 -4 .2 - 1 . 6 - . 8 2.2 .4 1.9 - 4 . 0 2.9 -4 .1 -3 .3
28 Total domestic plus foreign 496.S 565.6 697.3 598.6 800.7 607.2 668.3 941.8 928.8 678.9 653.3 900.4
Financial sectors
29 Total net borrowing by financial sectors 15S.6 240.0 291.1 467.9 444.9 428.7 536.8 273.1 436.1 490.0 580.4 313.6
By instrument 30 U.S. government-related 145.7 155.8 164.2 288.6 205.1 250.3 321.2 89.4 192.1 221.4 317.5 147.2 31 Government-sponsored enterprise securities 9.2 40.3 80.6 176.9 106.9 152.1 249.0 62.9 127.2 101.5 136.1 37.4 32 Mortgage pool securities 136.6 115.6 83.6 116.5 98.2 98.3 72.2 26.4 64.9 119.9 181.4 109.8 33 Loans from U.S. government .0 .0 .0 - 4 . 8 .0 .0 .0 .0 .0 .0 .0 .0
34 9.8 84.2 126.9 179.2 239.8 178.3 215.6 183.7 244.0 268.6 262.9 166.4 35 Corporate bonds 69.9 82.7 120.1 117.5 185.5 103.9 84.9 167.5 182.3 208.1 184.0 136.2 36 Mortgages .5 .6 3.6 9.8 5.3 12.0 4.9 5.2 5.2 5.2 5.6 5.5 37 Bank loans n.e.c 8.8 2.2 -13.0 -12 .3 3.0 -11.7 1.9 - 3 . 0 21.2 7.1 -13 .4 7.6 38 Open market paper -32 .0 - . 7 -6 .2 41.6 42.6 41.3 85.9 38.5 34.0 43.3 54.7 22.6 39 Other loans and advances -37 .3 - . 6 22.4 22.6 3.4 32.8 38.1 -24.5 1.3 4.9 32.0 - 5 . 5
By borrowing sector 40 Government-sponsored enterprises 9.1 40.2 80.6 172.1 106.9 152.1 249.0 62.9 127.2 101.5 136.1 37.4 41 Federally related mortgage pools 136.6 115.6 83.6 116.5 98.2 98.3 72.2 26.4 64.9 119.9 181.4 109.8 47 Private financial sectors 9.8 84.2 126.9 179.2 239.8 178.3 215.6 183.7 244.0 268.6 262.9 166.4 43 Commercial banks -10.7 7.7 4.6 9.9 8.1 23.9 4.1 6.3 18.2 8.8 - . 9 -4 .8 44 Bank holding companies - 2 . 5 2.3 8.8 10.3 14.4 11.5 16.0 16.3 20.8 28.2 - 7 . 8 -25 .8 45 Funding corporations - 6 . 5 13.2 2.9 24.2 32.0 47.3 11.1 61.5 21.7 52.1 - 7 . 3 26.6 46 Savings institutions -44.7 - 7 . 0 11.3 12.8 2.6 14.8 36.1 -18.9 - 7 . 2 5.1 31.5 10.9 47 Credit unions .0 .0 .2 .2 - . 1 .5 .2 - . 3 - . 1 .1 .0 - . 1 48 Life insurance companies .0 .0 .2 .3 - . 1 .0 1.3 .0 .1 - . 1 - . 4 2.5 49 Finance companies 17.7 - 1 . 6 .2 50.2 51.6 16.3 57.3 83.1 57.2 6.5 59.6 50.0 50 Mortgage companies - 2 . 4 8.0 .0 -11.5 -2 .1 - 7 . 0 1.1
6.3 - 7 . 4 14.8 4.0 -20 .0 .7
51 Real estate investment trusts (REITs) 1.2 .3 3.4 13.7 5.4 18.8 1.1 6.3 5.2 5.2 5.2 6.0 5.9
57 Brokers and dealers 3.7 2.7 12.0 .5 - 5 . 0 - 7 . 6 19.3 -29.5 - . 1 2.1 7.7 -31 .8 53 Issuers of asset-backed securities (ABSs) 54.0 58.5 83.3 68.5 133.0 59.8 62.8 67.6 113.2 156.5 194.5 132.2
Digitized for FRASER http://fraser.stlouisfed.org/ Federal Reserve Bank of St. Louis

A38 Domestic Nonfinancial Statistics • September 1996
1.57 FUNDS RAISED IN U.S. CREDIT MARKETS'—Continued
Transaction category or sector 1991 1992 1993 1994 1995
1994 1995 1996 Transaction category or sector 1991 1992 1993 1994 1995
Q3 Q4 Q1 Q2 Q3 Q4 Q1
54 Total net borrowing, all sectors
55 U.S. government securities 56 Municipal securities 57 Corporate and foreign bonds 58 Mortgages 59 Consumer credit 60 Bank loans n.e.c 61 Open market paper 62 Other loans and advances
63 Total net share issues
64 Mutual funds 65 Corporate equities 66 Nonfinancial corporations 67 Financial corporations 68 Foreign shares purchased by U.S. residents
All sectors
54 Total net borrowing, all sectors
55 U.S. government securities 56 Municipal securities 57 Corporate and foreign bonds 58 Mortgages 59 Consumer credit 60 Bank loans n.e.c 61 Open market paper 62 Other loans and advances
63 Total net share issues
64 Mutual funds 65 Corporate equities 66 Nonfinancial corporations 67 Financial corporations 68 Foreign shares purchased by U.S. residents
652.1
424.0 87.8
163.6 158.9
- 1 3 . 7 - 2 9 . 1 - 4 4 . 0 - 9 5 . 6
805.6
459.8 30.5
166.0 131.5
5.0 - 9 . 3 13.1 8.9
988.4
420.3 74.8
276.6 160.8 61.5
- 8 . 5 - 5 . 1
8.0
1,066.5
449.3 - 2 9 . 3 147.9 204.1 124.9 62.2 35.7 71.7
1,245.6
349.5 - 4 1 . 3 305.3 242.8 142.9 114.5 74.3 57.5
1,035.9
386.0 - 5 8 . 4 140.1 217.5 133.8 85.1 61.7 70.2
1,205.2
471.3 - 5 3 . 8 118.8 215.5 141.8 78.1
122.5 111.0
1,214.8
356.2 - 4 5 . 8 234.0 227.7 138.3 157.6 88.8 58.1
1,364.9
394.9 - 4 . 3
330.6 244.8 156.9 123.7 61.9 56.5
1,169.0
287.2 -107 .4
320.0 295.7 158.5 92.1 88.1 34.9
1,233.7
359.9 - 7 . 6
336.7 202.9 118.2 84.5 58.5 80.6
1,214.0
435.9 - 6 . 4
240.5 290.9 121.7 69.0 46.6 15.7
54 Total net borrowing, all sectors
55 U.S. government securities 56 Municipal securities 57 Corporate and foreign bonds 58 Mortgages 59 Consumer credit 60 Bank loans n.e.c 61 Open market paper 62 Other loans and advances
63 Total net share issues
64 Mutual funds 65 Corporate equities 66 Nonfinancial corporations 67 Financial corporations 68 Foreign shares purchased by U.S. residents
Funds raised through mutual funds and corporate equities
54 Total net borrowing, all sectors
55 U.S. government securities 56 Municipal securities 57 Corporate and foreign bonds 58 Mortgages 59 Consumer credit 60 Bank loans n.e.c 61 Open market paper 62 Other loans and advances
63 Total net share issues
64 Mutual funds 65 Corporate equities 66 Nonfinancial corporations 67 Financial corporations 68 Foreign shares purchased by U.S. residents
209.4
147.2 62.2 18.3 13.3 30.7
294.9
209.1 85.8 27.0 28.1 30.7
442.1
323.7 118.4 21.3 36.6 60.5
150.8
128.9 21.9
-44 .9 24.1 42.7
159.3
173.9 -14 .7 - 7 4 . 2
12.3 47.2
113.2
129.7 - 1 6 . 4 - 5 0 . 0
10.5 23.1
- 8 1 . 1
- 1 2 . 6 -68 .5
-118 .0 16.3 33.2
40.0
78.5 - 3 8 . 5 - 6 0 . 0
8.7 12.8
156.7
173.3 - 1 6 . 6 - 7 1 . 3
17.7 37.0
196.1
195.3 .7
- 9 2 . 8 9.7
83.9
244.3
248.6 - 4 . 3
- 7 2 . 8 13.3 55.3
273.4
290.9 - 1 7 . 6
-118 .0 11.5 89.0
1. Data in this table also appear in the Board's Z. 1 (780) quarterly statistical release, tables F.2 through F.5. For ordering address, see inside front cover.
Digitized for FRASER http://fraser.stlouisfed.org/ Federal Reserve Bank of St. Louis

Flow of Funds A39
1.58 SUMMARY OF FINANCIAL TRANSACTIONS1
Billions of dollars except as noted; quarterly data at seasonally adjusted annual rates
Transaction category or sector 1991 1 9 9 2 1993 1 9 9 4 1995
1 9 9 4 1995 1 9 9 6
Transaction category or sector 1991 1 9 9 2 1993 1 9 9 4 1995
Q 3 Q 4 Q1 Q 2 Q 3 Q 4 QL
NET LENDING IN CREDIT MARKETS2
1 Total net lending in credit markets 652.1 805.6 988.4 1,066.5 1,245.6 1,035.9 1,205.2 1,214.8 1,364.9 1,169.0 1,233.7 1,214.0
2 Private domestic nonfinancial sectors 105 .2 8 7 . 9 6 5 . 6 2 5 8 . 9 - 8 4 . 8 2 1 3 . 4 2 2 7 . 8 3 5 . 3 - 1 4 2 . 3 - 5 4 . 9 - 1 7 7 . 3 - 1 3 3 . 6 3 Households 2 9 . 0 8 1 . 7 5 2 . 2 3 0 4 . 7 5 1 . 5 2 9 2 . 3 3 4 3 . 4 170 .8 - 7 7 . 2 2 0 3 . 2 - 9 0 . 7 - 1 0 3 . 6 4 Nonfarm noncorporate business - 5 . 3 - . 1 .6 .7 1.0 .7 .9 .5 1.1 1.1 1.2 1.2 5 Nonfinancial corporate business 3 0 . 7 2 7 . 8 9.1 4 8 . 1 - 3 . 5 3 7 . 3 5 3 . 2 - 4 1 . 1 3 9 . 5 - 5 0 . 2 3 7 . 6 5 2 . 7 6 State and local governments 5 0 . 8 - 2 1 . 5 3 .7 - 9 4 . 6 - 1 3 3 . 7 - 1 1 7 . 0 - 1 6 9 . 7 - 9 4 . 9 - 1 0 5 . 7 - 2 0 9 . 0 - 1 2 5 . 3 - 8 3 . 9 7 U.S. government 10.5 - 1 1 . 9 - 1 8 . 4 - 2 4 . 2 - 2 1 . 3 - 1 1 . 3 - 2 4 . 4 - 1 3 . 2 - 2 4 . 3 - 2 3 . 9 - 2 3 . 9 - 2 4 . 6 8 Rest of the world 13.3 9 8 . 2 128 .3 1 3 4 . 4 2 7 1 . 7 137 .5 2 1 0 . 9 2 4 1 . 2 3 2 6 . 1 3 5 8 . 0 161 .7 3 2 7 . 6 9 Financial sectors 5 2 3 . 1 6 3 1 . 5 8 1 2 . 8 6 9 7 . 4 1 , 0 8 0 . 0 6 9 6 . 3 7 9 0 . 8 9 5 1 . 6 1 , 2 0 5 . 3 8 8 9 . 8 1 ,273 .1 1 ,044 .5
10 Government sponsored enterprises 15.1 6 8 . 8 9 0 . 2 119.1 9 4 . 7 121 .9 1 7 1 . 4 2 8 . 2 9 7 . 5 6 1 . 5 191 .7 4 2 . 3 11 Federally related mortgage pools 136 .6 1 1 5 . 6 8 3 . 6 116 .5 9 8 . 2 9 8 . 3 7 2 . 2 2 6 . 4 6 4 . 9 119 .9 181 .4 109 .8 12 Monetary authority 31 .1 2 7 . 9 3 6 . 2 31 .5 12.7 2 9 . 7 3 0 . 0 16 .3 2 0 . 8 - 1 1 . 1 2 4 . 7 14.3 13 Commercial banking 8 0 . 8 9 5 . 3 142 .2 163 .4 2 6 6 . 3 1 8 3 . 4 174 .5 3 4 3 . 1 3 1 5 . 6 2 4 8 . 9 157 .7 130 .7 14 U.S. chartered banks 3 5 . 7 6 9 . 5 1 4 9 . 6 148 .1 1 8 6 . 6 1 5 5 . 6 174 .2 183 .4 2 2 2 . 4 2 2 7 . 5 1 1 2 . 9 8 5 . 9 15 Foreign banking offices in United States 4 8 . 5 16.5 - 9 . 8 11 .2 7 5 . 4 2 2 . 9 - 5 . 6 158 .8 8 3 . 9 24 .1 3 5 . 0 51 .1 16 Bank holding companies - 1 . 5 5 . 6 .0 .9 - . 3 2 .7 - 2 . 4 - 1 . 5 5 . 3 - 9 . 6 4 . 6 - 5 . 3 17 Banks in U.S. affiliated areas - 1 . 9 3 .7 2 . 4 3 .3 4 .7 2 . 2 8 .3 2 . 4 4 . 0 7 . 0 5 . 2 - . 9 18 Funding corporations 8 .2 17.7 - 1 9 . 4 - 2 7 . 4 6 . 2 - 4 3 . 4 - 4 . 2 3 9 . 8 - 3 . 5 5 .5 - 1 7 . 0 154 .9 19 Thrift institutions - 1 4 6 . 1 - 6 1 . 3 - 1 . 7 3 4 . 9 8 .7 5 3 . 8 3 2 . 4 2 8 . 2 9 .7 4 3 . 6 - 4 6 . 8 - 2 . 1 2 0 Life insurance companies 8 6 . 5 7 8 . 5 100 .9 6 6 . 3 9 8 . 7 89 .5 7 9 . 4 132 .4 131 .2 7 7 . 0 5 4 . 3 122.1 21 Other insurance companies 3 0 . 0 6 .7 2 7 . 7 2 4 . 9 2 1 . 4 2 5 . 3 3 0 . 4 19 .2 2 1 . 7 2 1 . 8 2 2 . 8 2 2 . 2 2 2 Private pension funds 3 5 . 4 4 1 . 1 4 5 . 9 4 7 . 0 6 1 . 3 4 2 . 5 7 4 . 7 5 8 . 9 5 7 . 2 5 0 . 5 7 8 . 5 7 7 . 8 2 3 State and local government retirement funds 4 1 . 1 2 3 . 0 19.8 2 9 . 0 2 1 . 4 - 1 1 . 1 3 6 . 6 6 2 . 4 3 . 2 6 . 8 13 .2 8 7 . 3 2 4 Finance companies - 9 . 2 7 . 5 - 9 . 0 6 8 . 2 6 3 . 6 6 3 . 8 8 1 . 7 9 2 . 5 6 5 . 7 4 3 . 7 5 2 . 7 5 6 . 7 25 Mortgage companies 11 .2 .1 .0 - 2 2 . 9 - 3 . 4 - 1 4 . 0 2.1 - 1 4 . 4 2 9 . 9 7 .3 - 3 6 . 4 1.7 2 6 Mutual funds 80 .1 126 .2 159.5 - 7 . 1 5 2 . 5 - 2 9 . 3 - 7 0 . 4 - 1 5 . 1 2 1 . 5 5 2 . 0 151 .5 6 2 . 9 2 7 Closed-end funds 12.8 18 .2 11 .0 - 5 . 5 5 . 8 - 1 3 . 6 - 1 0 . 0 3 .5 6 . 4 8 . 4 5 . 0 - 1 . 2 2 8 Money market mutual funds 3 2 . 7 4 . 7 2 0 . 4 3 0 . 0 8 6 . 5 5 7 . 7 5 3 . 9 53 .1 1 3 5 . 2 3 3 . 2 1 2 4 . 6 170.1 2 9 Real estate investment trusts (REITs) - . 7 1.1 .6 4 .7 1.8 5 . 5 .2 1.8 1.8 1.8 1.9 1.9 3 0 Brokers and dealers 17.5 - 1 . 3 14.8 - 4 4 . 2 90 .1 - 2 1 . 9 - 8 . 0 3 0 . 5 1 4 6 . 2 - 1 . 8 1 8 5 . 6 - 1 0 1 . 1 31 Asset-backed securities issuers (ABSs) 5 0 . 0 5 3 . 7 8 0 . 8 6 1 . 9 112 .3 5 0 . 6 4 2 . 6 5 5 . 5 1 0 0 . 9 1 4 4 . 6 1 4 8 . 0 112 .2 3 2 Bank personal trusts 10 .0 8 . 0 9 . 5 7.1 - 1 8 . 8 7 .7 1 .4 - 1 0 . 8 - 2 0 . 6 - 2 3 . 7 - 2 0 . 2 - 1 8 . 1
RELATION OF LIABILITIES TO FINANCIAL ASSETS
33 Net flows through credit markets 652.1 805.6 988.4 1,066.5 1,245.6 1,035.9 1,205.2 1,214.8 1,364.9 1,169.0 1,233.7 1,214.0
Other financial sources 3 4 Official foreign exchange - 5 . 9 - 1 . 6 .8 - 5 . 8 8 . 8 .2 - 8 . 6 17 .8 10 .3 9 . 0 - 1 . 9 - 2 . 1 35 Special drawing rights certificates . 0 - 2 . 0 .0 .0 2 . 2 .0 .0 .0 .0 8 . 6 .0 .0 3 6 Treasury currency .0 .2 .4 .7 .6 .8 .7 .7 .7 .8 .0 .0 3 / Life insurance reserves 2 5 . 7 2 7 . 3 3 5 . 2 3 4 . 0 4 9 . 9 6 7 . 7 2 1 . 6 5 4 . 0 4 9 . 9 2 9 . 9 6 6 . 0 5 6 . 0 3 8 Pension fund reserves 198 .2 2 3 8 . 6 2 4 7 . 3 2 4 8 . 0 2 5 8 . 5 2 3 8 . 0 2 9 3 . 4 3 0 2 . 5 3 1 0 . 7 2 2 3 . 0 197 .7 3 0 1 . 5 3 9 Interbank claims - 3 . 4 4 9 . 4 5 0 . 5 8 9 . 7 10.1 4 . 1 9 9 . 9 - 1 3 . 6 2 5 . 2 - 4 3 . 2 7 1 . 8 - 8 0 . 9 4 0 Checkable deposits and currency 8 6 . 3 113 .5 1 1 7 . 3 - 9 . 7 - 1 2 . 5 - 6 6 . 0 - 4 0 . 5 4 2 . 8 133 .5 - 1 5 1 . 5 - 7 5 . 0 5 1 . 7 4 1 Small time and savings deposits 1.5 - 5 7 . 2 - 7 0 . 3 - 4 0 . 0 9 6 . 5 - 5 1 . 8 - 4 6 . 9 18.1 1 1 2 . 0 1 4 2 . 2 1 1 3 . 6 174 .7 4 2 Large time deposits - 5 8 . 5 - 7 3 . 2 - 2 3 . 5 19 .6 6 5 . 6 8 4 . 0 3 6 . 5 116 .8 6 9 . 2 7 6 . 3 .3 5 2 . 0 4 3 Money market fund shares 4 1 . 6 4 . 5 2 0 . 2 4 3 . 3 142 .3 5 6 . 4 8 6 . 5 5 9 . 9 2 3 3 . 5 121 .2 154 .8 2 2 5 . 6 4 4 Security repurchase agreements - 1 6 . 5 43 .1 7 1 . 2 7 8 . 3 110 .7 8 6 . 0 5 1 . 9 161 .8 130 .7 85 .1 6 5 . 2 - 3 1 . 6 4 5 Foreign deposits - 2 6 . 5 - 3 . 5 - 1 8 . 5 4 5 . 8 5 . 8 2 8 . 1 9 7 . 9 3 9 . 2 9 0 . 6 - 6 3 . 8 - 4 2 . 8 - 3 2 . 0 4 6 Mutual fund shares 147 .2 2 0 9 . 1 3 2 3 . 7 128 .9 173 .9 129 .7 - 1 2 . 6 7 8 . 5 1 7 3 . 3 1 9 5 . 3 2 4 8 . 6 2 9 0 . 9 4 7 Corporate equities 6 2 . 2 8 5 . 8 118 .4 2 1 . 9 - 1 4 . 7 - 1 6 . 4 - 6 8 . 5 - 3 8 . 5 - 1 6 . 6 .7 - 4 . 3 - 1 7 . 6 4 8 Security credit 5 1 . 4 4 . 6 6 1 . 4 - . 1 2 6 . 7 - 5 9 . 3 37 .1 - 1 0 . 7 3 0 . 8 3 5 . 4 5 1 . 3 8 0 . 3 4 9 Trade payables 3 1 . 0 4 6 . 6 5 4 . 4 111 .0 106 .0 9 7 . 2 1 4 9 . 4 113 .6 3 0 . 5 183 .2 9 6 . 8 129 .7 5 0 Taxes payable - 7 . 4 9 .7 5 . 2 3 . 2 1.3 10 .2 4 . 2 15.3 - 4 . 3 4 . 0 - 9 . 8 9 .5 51 Noncorporate proprietors' equity .5 16.7 3 . 4 2 2 . 6 3 8 . 7 4 6 . 0 23 .1 2 6 . 9 33 .5 4 8 . 6 4 5 . 7 53 .1 5 2 Investment in bank personal trusts 16.1 - 7 . 1 1.6 18.8 - 4 7 . 7 2 3 . 6 11 .9 - 4 4 . 3 - 4 5 . 6 - 6 3 . 9 - 3 7 . 1 - 4 7 . 3 5 3 Miscellaneous 2 7 8 . 2 2 8 0 . 5 3 6 4 . 6 2 3 6 . 8 4 6 1 . 9 2 6 4 . 8 3 0 3 . 4 3 2 7 . 2 5 0 5 . 1 3 4 7 . 6 6 6 7 . 6 4 6 6 . 0
5 4 Total financial sources 1,473.9 1,790.4 2,351.7 2,113.5 2,730.1 1,979.2 2,245.7 2,482.9 3,237.8 2,357.5 2,842.3 2,893.5
Floats not included in assets (—) 5 5 U.S. government checkable deposits - 1 3 . 1 .7 - 1 . 5 - 4 . 8 - 6 . 0 7 . 4 - 2 4 . 4 13 .2 - 1 6 . 3 3 .5 - 2 4 . 3 17.8 5 6 Other checkable deposits 4 . 5 1.6 - 1 . 3 - 2 . 8 - 3 . 8 - 3 . 3 - 2 . 3 - 3 . 7 - 3 . 9 - 3 . 5 - 4 . 2 - 3 . 9 5 7 Trade credit 36 .1 11.3 - 6 . 6 - 7 . 8 - 1 4 . 8 12 .6 - 4 4 . 0 7 9 . 5 12.7 - 4 4 . 1 - 1 0 7 . 3 - 7 1 . 6
Liabilities not identified as assets (—) 5 8 Treasury currency - . 6 - . 2 - . 2 - . 2 - . 5 - . 2 - . 2 - . 2 - . 4 - . 3 - 1 . 0 - . 9 5 9 Interbank claims 2 6 . 2 - 4 . 9 4 . 2 - 2 . 7 - 3 . 1 10.1 - 1 . 7 .8 8 . 2 7 . 6 - 2 9 . 1 12.4 6 0 Security repurchase agreements - 9 . 5 3 . 6 3 4 . 3 31 .5 11 .0 - 5 3 . 5 8 6 . 7 6 4 . 4 - 4 7 . 3 3 9 . 6 - 1 2 . 7 - 7 6 . 7 61 Foreign deposits - 2 4 . 0 - 2 . 8 - 7 . 0 3 6 . 9 - 1 . 5 39 .5 5 5 . 7 4 5 . 6 8 1 . 6 - 9 3 . 6 - 3 9 . 5 - 4 1 . 5 6 2 Taxes payable - 2 . 2 11.9 11.1 8 .6 8 .7 10.8 - . 9 - 8 . 9 3 1 . 6 10.8 1.4 - 2 4 . 0 6 3 Miscellaneous 9 .7 - . 1 - 1 2 6 . 1 - 1 3 8 . 7 - 2 9 . 8 - 4 4 . 3 - 1 0 7 . 3 - 2 3 0 . 6 - 3 6 . 9 - 4 . 8 153.1 123 .3
6 4 Total identified to sectors as assets 1,446.8 1,769.3 2,444.9 2,193.7 2,769.8 2,000.1 2,284.2 2,522.7 3,208.3 2,442.4 2,905.9 2,958.8
1. Data in this table also appear in the Board's Z.l (780) quarterly statistical release, tables 2. Excludes corporate equities and mutual fund shares. F.6 and F.7. For ordering address, see inside front cover.
Digitized for FRASER http://fraser.stlouisfed.org/ Federal Reserve Bank of St. Louis

A40 Domestic Financial Statistics • September 1996
1.59 SUMMARY OF CREDIT MARKET DEBT OUTSTANDING1
Billions of dollars, end of period
1994 1995 1996 lyyz
Q3 Q4 Q1 Q2 Q3 Q4 Q1
Nonfinancial sectors
1 Total credit market debt owed by domestic nonfinancial sectors 11,894.5 12,537.8 13,163.0 13,895.9 12,965.8 13,163.0 13,339.3 13,548.4 13,707.8 13,895.9 14,072.1
By sector and instrument 2 U.S. government 3,080.3 3,336.5 3,492.3 3,636.7 3,432.3 3,492.3 3,557.9 3,583.5 3,603.4 3,636.7 3,717.2 3 Treasury securities 3,061.6 3,309.9 3,465.6 3,608.5 3,404.1 3,465.6 3,531.5 3,556.7 3,576.5 3,608.5 3,689.6 4 Budget agency issues and mortgages 18.8 26.6 26.7 28.2 28.2 26.7 26.4 26.8 26.9 28.2 27.6
5 Private 8,814.2 9,201.3 9,670.7 10,259.2 9,533.6 9,670.7 9,781.4 9,964.9 10,104.4 10,259.2 10,354.9
By instrument 6 Municipal securities 1,302.8 1,377.5 1,348.2 1,307.0 1,362.6 1,348.2 1,335.4 1,331.7 1,309.9 1,307.0 1,304.1 / Corporate bonds 1,154.5 1,229.7 1,253.0 1,326.3 1,251.5 1,253.0 1,266.3 1,290.9 1,305.8 1,326.3 1,341.0 8 Mortgages 4,088.7 4,260.0 4,454.4 4,691.8 4,400.5 4,454.4 4,495.8 4,563.2 4,641.2 4,691.8 4,748.6 y Home mortgages 3.037.4 3,227.6 3,430.0 3,634.7 3,374.6 3,430.0 3,465.1 3,524.4 3,594.0 3,634.7 3,682.6
10 Multifamily residential 272.5 267.8 269.1 280.2 270.2 269.1 269.8 273.3 276.8 280.2 284.1 11 Commercial 698.1 683.4 672.3 692.4 673.1 672.3 677.6 681.6 686.1 692.4 696.7 12 Farm 80.7 81.2 83.0 84.6 82.6 83.0 83.4 83.9 84.4 84.6 85.2 13 Consumer credit 802.4 863.9 988.8 1,131.7 933.9 988.8 989.3 1,029.7 1,077.5 1,131.7 1,123.3 14 Bank loans n.e.c 672.2 676.0 749.0 852.0 724.9 749.0 782.8 810.6 825.6 852.0 861.9 15 Commercial paper 107.1 117.8 139.2 157.4 138.7 139.2 149.8 162.9 163.3 157.4 173.2 16 Other loans and advances 686.5 676.3 738.0 792.9 721.6 738.0 762.0 775.8 781.2 792.9 802.7
By borrowing sector 17 Household 4.021.4 4,272.9 4,634.7 5,018.3 4,515.1 4,634.7 4,676.5 4,784.1 4,908.0 5,018.3 5,063.2 18 Nonfinancial business 3,696.8 3,770.3 3,921.1 4,171.8 3,885.6 3,921.1 4,002.7 4,084.0 4,122.3 4,171.8 4,224.8 19 Farm 136.3 138.3 141.2 143.2 143.1 141.2 138.9 142.8 144.9 143.2 140.9 20 Nonfarm noncorporate 1,122.9 1,129.9 1,142.0 1,178.0 1,137.4 1,142.0 1,154.5 1,163.3 1,170.4 1,178.0 1,185.0 21 Corporate 2,437.6 2,502.0 2,638.0 2,850.7 2,605.0 2,638.0 2,709.2 2,777.8 2,807.0 2,850.7 2,898.9 22 State and local government 1,095.9 1,158.2 1,114.8 1,069.1 1,132.8 1,114.8 1,102.2 1,096.8 1,074.1 1,069.1 1,066.9
23 Foreign credit market debt held in United States 313.1 381.9 361.6 429.4 352.4 361.6 376.8 387.6 409.9 429.4 438.5
24 Bonds 146.2 227.4 234.6 281.1 227.6 234.6 237.9 250.4 263.4 281.1 292.4 2b Bank loans n.e.c 23.9 24.6 26.1 34.6 26.3 26.1 28.2 29.6 31.6 34.6 36.8 26 Commercial paper 77.7 68.7 41.4 55.0 39.9 41.4 50.9 48.1 55.8 55.0 51.5 27 Other loans and advances 65.3 61.1 59.6 58.7 58.6 59.6 59.8 59.5 59.0 58.7 57.8
28 Total credit market debt owed by nonfinancial sectors, domestic and foreign 12,207.6 12,919.7 13,524.6 14,325.3 13,318.3 13,524.6 13,716.1 13,935.9 14,117.7 14,325.3 14,510.7
Financial sectors
29 Total credit market debt owed by financial sectors 3,025.0 3,321.5 3,794.6 4,242.1 3,656.2 3,794.6 3,861.4 3,971.8 4,093.9 4,242.1 4,317.1
By instrument 30 U.S. government-related 1,720.0 1,884.1 2,172.7 2,377.8 2,093.3 2,172.7 2,196.2 2,247.1 2,300.1 2,377.8 2,416.6 31 Government-sponsored enterprises securities 443.1 523.7 700.6 807.5 638.3 700.6 716.3 748.1 773.5 807.5 816.9 32 Mortgage pool securities 1,272.0 1,355.6 1,472.1 1,570.3 1,454.9 1,472.1 1,479.9 1,499.0 1,526.6 1,570.3 1,599.7 33 Loans from U.S. government 4.8 4.8 .0 .0 .0 .0 .0 .0 .0 .0 .0 34 Private 1,305.1 1,437.4 1,621.9 1,864.3 1,563.0 1,621.9 1,665.2 1,724.7 1,793.8 1,864.3 1,900.6
Corporate bonds 738.4 858.5 973.5 1,158.9 949.5 973.5 1,012.3 1,056.4 1,110.2 1,158.9 1,189.6 36 Mortgages 5.4 8.9 18.7 24.0 17.5 18.7 20.0 21.3 22.6 24.0 25.4 37 Bank loans n.e.c 80.5 67.6 55.3 58.3 53.4 55.3 53.4 58.4 60.3 58.3 59.1 38 Open market paper 394.3 393.5 442.8 488.1 420.5 442.8 454.1 462.8 473.6 488.1 492.8 39 Other loans and advances 86.6 108.9 131.6 135.0 122.0 131.6 125.4 125.7 127.0 135.0 133.6
By borrowing sector 40 Government-sponsored entetpnses 447.9 528.5 700.6 807.5 638.3 700.6 716.3 748.1 773.5 807.5 816.9 41 Federally related mortgage pools 1,272.0 1,355.6 1,472.1 1,570.3 1,454.9 1,472.1 1,479.9 1,499.0 1,526.6 1,570.3 1,599.7 42 Private financial sectors 1,305.1 1,437.4 1,621.9 1,864.3 1,563.0 1,621.9 1,665.2 1,724.7 1,793.8 1,864.3 1,900.6 43 Commercial banks 80.0 84.6 94.5 102.6 92.6 94.5 95.0 99.9 102.0 102.6 100.5 44 Bank holding companies 114.6 123.4 133.6 148.0 129.6 133.6 137.7 142.9 150.0 148.0 141.6 45 Funding corporations 161.6 169.9 199.3 233.9 200.6 199.3 221.0 229.9 240.0 233.9 244.6 46 Savings institutions 88.4 99.6 112.4 115.0 103.4 112.4 107.7 105.9 107.2 115.0 117.8 47 Credit unions .0 .2 .5 .4 .4 .5 .4 .3 .4 .4 .4 48 Life insurance companies .0 .2 .6 .5 .3 .6 .6 .6 .6 .5 1.1 49 Finance companies 390.4 390.5 440.7 492.3 420.9 440.7 456.7 467.2 471.9 492.3 499.8 50 Mortgage companies 30.2 30.2 18.7 16.6 18.5 18.7 16.9 20.6 21.6 16.6 16.8 51 Real estate investment trusts (REITs) 13.9 17.4 31.1 36.5 29.5 31.1 32.4 33.7 35.0 36.5 38.0 52 Brokers and dealers 21.7 33.7 34.3 29.3 29.4 34.3 26.9 26.8 27.4 29.3 21.4 53 Issuers of asset-backed securities (ABSs) 404.3 487.6 556.1 689.1 537.7 556.1 570.0 596.8 637.8 689.1 718.8
All sectors
54 Total credit market debt, domestic and foreign.... 15,232.6 16,241.2 17,319-2 18,567.4 16,974.5 17,319.2 17,577.5 17,907.8 18,211.5 18,567.4 18,827.8
55 U.S. government securities 4,795.5 5,215.8 5,665.0 6,014.6 5,525.6 5,665.0 5,754.1 5,830.6 5,903.5 6,014.6 6,133.8 56 Municipal securities 1,302.8 1,377.5 1,348.2 1,307.0 1,362.6 1,348.2 1,335.4 1,331.7 1,309.9 1,307.0 1,304.1 57 Corporate and foreign bonds 2,039.0 2,315.6 2,461.0 2,766.3 2,428.6 2,461.0 2,516.5 2,597.7 2,679.5 2,766.3 2,823.1 58 Mortgages 4,094.1 4,269.0 4,473.1 4,715.9 4,418.0 4,473.1 4,515.9 4,584.6 4,663.9 4,715.9 4,774.0 59 Consumer credit 802.4 863.9 988.8 1,131.7 933.9 988.8 989.3 1,029.7 1,077.5 1,131.7 1,123.3 60 Bank loans n.e.c 776.6 768.2 830.4 944.9 804.5 830.4 864.4 898.6 917.4 944.9 957.8 61 Open market paper 579.0 580.0 623.5 700.4 599.2 623.5 654.7 673.8 692.7 700.4 717.6 62 Other loans and advances 843.1 851.1 929.1 986.6 902.2 929.1 947.2 961.0 967.1 986.6 994.2
1. Data in this table also appear in the Board's Z.l (780) quarterly statistical release, tables L.2 through L.4. For ordering address, see inside front cover.
Digitized for FRASER http://fraser.stlouisfed.org/ Federal Reserve Bank of St. Louis

Flow of Funds A41
1.60 SUMMARY OF FINANCIAL ASSETS AND LIABILITIES'
Billions of dollars except as noted, end of period
Transaction category or sector 1992 1993 1994 1995 1994 1995 1996
Transaction category or sector 1992 1993 1994 1995
Q3 Q4 Ql Q2 Q3 Q4 Ql
CREDIT MARKET DEBT OUTSTANDING2
1 Total credit market assets 1 5 , 2 3 2 . 6 1 6 , 2 4 1 . 2 1 7 , 3 1 9 . 2 1 8 , 5 6 7 . 4 1 6 , 9 7 4 . 5 1 7 , 3 1 9 . 2 1 7 , 5 7 7 . 5 1 7 , 9 0 7 . 8 1 8 , 2 1 1 . 5 1 8 , 5 6 7 . 4 1 8 , 8 2 7 . 8
2 Private domestic nonfinancial sectors 2,671.6 2,730.1 3,019.3 2,930.4 2,900.6 3,019.3 2,984.8 2,935.1 2,942.2 2,930.4 2,858.6 3 Households 1,618.5 1,658.9 1,993.9 2,041.3 1,857.7 1,993.9 2,013.6 1,974.3 2,048.3 2,041.3 2,001.8 4 Nonfarm noncorporate business 38.1 38.8 39.5 40.4 39.3 39.5 39.6 39.9 40.2 40.4 40.7 5 Nonfinancial corporate business 257.8 271.5 319.7 316.1 295.3 319.7 291.0 302.8 290.4 316.1 306.6 6 State and local governments 757.2 760.8 666.3 532.5 708.3 666.3 640.6 618.1 563.4 532.5 509.4 7 U.S. government 235.0 230.7 206.5 185.2 212.6 206.5 203.2 197.1 191.2 185.2 179.0 8 Rest of the world 1,022.8 1,146.6 1,255.7 1,527.5 1,240.7 1,255.7 1,324.4 1,402.6 1,493.1 1,527.5 1,617.8 9 Financial sectors 11,303.2 12,133.8 12,837.7 13,924.3 12,620.6 12,837.7 13,065.2 13,372.9 13,585.1 13,924.3 14,172.5
10 Government-sponsored enterprises 457.8 548.0 667.1 761.8 624.3 667.1 673.5 698.6 714.0 761.8 771.7 11 Federally related mortgage pools 1,272.0 1,355.6 1,472.1 1,570.3 1,454.9 1,472.1 1,479.9 1,499.0 1,526.6 1,570.3 1,599.7 12 Monetary authority 300.4 336.7 368.2 380.8 356.8 368.2 367.1 375.7 370.6 380.8 379.6 13 Commercial banking 2,948.6 3,090.8 3,254.3 3,520.6 3,203.9 3,254.3 3,327.8 3,409.8 3,474.2 3,520.6 3,541.4 14 U.S. chartered banks 2,571.9 2,721.5 2,869.6 3,056.1 2,822.3 2,869.6 2,906.5 2,963.7 3,023.7 3,056.1 3,068.8 15 Foreign banking offices in United States 335.8 326.0 337.1 412.6 335.5 337.1 373.6 396.0 401.1 412.6 422.3 16 Bank holding companies 17.5 17.5 18.4 18.0 19.0 18.4 18.0 19.3 16.9 18.0 16.7 17 Banks in U.S. affiliated areas 23.4 25.8 29.2 33.8 27.1 29.2 29.8 30.8 32.5 33.8 33.6 18 Funding corporations 162.5 149.2 129.5 138.3 130.2 129.5 140.8 137.4 143.1 138.3 174.9 19 Thrift institutions 1,134.5 1,132.7 1,167.6 1,176.3 1,160.4 1,167.6 1,173.4 1,177.4 1,188.9 1,176.3 1,174.6 20 Life insurance companies 1,309.1 1,420.6 1,487.0 1,585.7 1,470.7 1,487.0 1,523.1 1,557.1 1,575.5 1,585.7 1,619.2 21 Other insurance companies 389.4 422.7 446.4 471.9 439.1 446.4 451.8 458.5 464.4 471.9 478.1 22 Private pension funds 571.7 617.6 664.6 725.9 645.9 664.6 679.3 693.6 706.2 725.9 745.3 23 State and local government retirement funds 417.5 437.3 466.3 487.7 454.3 466.3 480.7 482.1 481.8 487.7 508.2 24 Finance companies 496.4 482.8 551.0 614.6 524.1 551.0 568.5 586.9 594.7 614.6 623.3 25 Mortgage companies 60.5 60.4 37.5 34.1 37.0 37.5 33.9 41.4 43.2 34.1 34.5 26 Mutual funds 566.4 725.9 718.8 771.3 741.8 718.8 719.3 724.8 739.2 771.3 791.7 27 Closed-end funds 67.7 78.6 73.1 78.9 75.6 73.1 74.0 75.6 77.7 78.9 78.6 28 Money market mutual funds 408.6 429.0 459.0 545.5 437.9 459.0 480.6 508.0 505.7 545.5 595.6 29 Real estate investment trusts (REITs) 8.1 8.6 13.3 15.1 13.3 13.3 13.8 14.2 14.7 15.1 15.6 30 Brokers and dealers 122.7 137.5 93.3 183.4 95.3 93.3 101.0 137.5 137.0 183.4 158.2 31 Asset-backed securities issuers (ABSs) 378.0 458.8 520.7 632.9 507.3 520.7 531.5 555.2 593.2 632.9 657.6 32 Bank personal trusts 231.5 240.9 248.0 229.2 247.7 248.0 245.3 240.2 234.2 229.2 224.7
RELATION OF LIABILITIES TO FINANCIAL ASSETS
33 Total credit market debt 1 5 , 2 3 2 . 6 1 6 , 2 4 1 . 2 1 7 , 3 1 9 . 2 1 8 , 5 6 7 . 4 1 6 , 9 7 4 . 5 1 7 , 3 1 9 . 2 1 7 , 5 7 7 . 5 1 7 , 9 0 7 . 8 1 8 , 2 1 1 . 5 1 8 , 5 6 7 . 4 1 8 , 8 2 7 . 8
Other liabilities 34 Official foreign exchange 51.8 53.4 53.2 63.7 55.5 53.2 64.1 67.1 65.1 63.7 62.1 35 Special drawing rights certificates 8.0 8.0 8.0 10.2 8.0 8.0 8.0 8.0 10.2 10.2 10.2 36 Treasury currency 16.5 17.0 17.6 18.2 17.5 17.6 17.8 18.0 18.2 18.2 18.2 37 Life insurance reserves 433.0 468.2 502.2 552.1 496.8 502.2 515.7 528.1 535.6 552.1 566.1 38 Pension fund reserves 4,055.1 4,471.6 4,693.9 5,499.6 4,677.0 4,693.9 4,895.7 5,095.4 5,318.1 5,499.6 5,745.6 39 Interbank claims 138.5 189.3 280.0 290.7 250.1 280.0 273.0 265.9 267.4 290.7 266.2 40 Deposits at financial institutions 5,050.2 5,154.9 5,296.0 5,704.4 5,212.4 5,296.0 5,389.5 5,572.4 5,615.3 5,704.4 5,799.1 41 Checkable deposits and currency 1,134.4 1,251.7 1,242.0 ,229.5 1,205.0 1,242.0 1,193.9 1,246.3 1,200.4 1,229.5 1,183.8 42 Small time and savings deposits 2,293.5 2,223.2 2,183.3 2,279.7 2,199.1 2,183.3 2,200.1 2,222.4 2,255.6 2,279.7 2,336.4 43 Large time deposits 415.2 391.7 411.2 476.9 402.6 411.2 441.1 456.2 477.4 476.9 490.6 44 Money market fund shares 539.5 559.6 602.9 745.3 578.7 602.9 634.0 678.5 702.7 745.3 816.9 45 Security repurchase agreements 399.9 471.1 549.4 660.1 548.1 549.4 603.4 629.3 655.6 660.1 666.5 46 Foreign deposits 267.7 257.6 307.1 312.9 278.9 307.1 316.9 339.6 323.6 312.9 304.9 47 Mutual fund shares 992.5 1,375.4 1,477.3 1,852.8 1,515.8 1,477.3 1,553.3 1,661.0 1,782.0 1,852.8 2,004.8 48 Security credit 217.7 279.0 279.0 305.6 263.9 279.0 269.5 277.9 286.2 305.6 318.3 49 Trade payables 995.1 1,049.4 1,160.5 1,266.5 1,099.8 1,160.5 1,159.8 1,174.2 1,217.3 1,266.5 1,269.7 50 Taxes payable 79.7 84.9 88.0 89.3 87.1 88.0 94.3 89.2 91.9 89.3 94.2 51 Investment in bank personal trusts 660.6 691.3 699.4 767.4 701.1 699.4 719.7 739.7 758.6 767.4 781.6 52 Miscellaneous 4,785.2 5,165.2 5,397.3 5,769.9 5,373.0 5,397.3 5,459.7 5,537.2 5,626.9 5,769.9 5,836.4
53 Total liabilities 3 2 , 7 1 6 . 4 3 5 , 2 4 8 . 7 3 7 , 2 7 1 . 6 4 0 , 7 5 7 . 9 3 6 , 7 3 2 . 4 3 7 , 2 7 1 . 6 3 7 , 9 9 7 . 6 3 8 , 9 4 1 . 9 3 9 , 8 0 4 . 3 4 0 , 7 5 7 . 9 4 1 , 6 0 0 . 4
Financial assets not included in liabilities (+) 54 Gold and special drawing rights 19.6 20.1 21.1 22.1 21.0 21.1 22.7 22.9 22.1 22.1 22.1 55 Corporate equities 5,462.9 6,278.5 6,293.4 8,345.4 6,228.7 6,293.4 6,835.8 7,393.0 8,013.8 8,345.4 8,820.5 56 Household equity in noncorporate business 2,458.3 2,476.3 2,564.6 2,657.7 2,550.9 2,564.6 2,576.7 2,607.0 2,619.3 2,657.7 2,669.9
Floats not included in assets (—) 57 U.S. government checkable deposits 6.8 5.6 3.4 3.1 1.2 3.4 4.2 2.0 .6 3.1 .0 58 Other checkable deposits 42.0 40.7 38.0 34.2 30.6 38.0 33.3 35.7 27.3 34.2 29.6 59 Trade credit -251.1 -251.4 -260.1 -274.9 -323.2 -260.1 -297.1 -315.8 -331.3 -274.9 -356.1
Liabilities not identified as assets ( —) 60 Treasury currency - 4 . 9 -5 .1 - 5 . 4 -5 .8 -5 .3 - 5 . 4 - 5 . 4 -5 .5 -5 .6 -5 .8 -6 .0 61 Interbank claims -9 .3 -4 .7 -6 .5 -9 .0 - 3 . 4 -6 .5 -2 .7 -2 .9 .1 - 9 . 0 -2 .5 62 Security repurchase agreements 43.0 77.3 108.8 119.8 100.7 108.8 132.9 114.5 136.4 119.8 108.7 63 Foreign deposits 217.6 218.4 258.7 257.2 241.3 258.7 270.1 290.5 267.1 257.2 246.8 64 Taxes payable 25.2 26.8 25.0 33.7 22.8 25.0 10.0 25.6 28.7 33.7 13.5 65 Miscellaneous -514.5 -667.2 -830.5 -859.2 -688.2 -830.5 -892.2 -878.5 -884.9 -859.2 -896.0
66 Total identified to sectors as assets 4 1 , 1 0 2 . 3 4 4 , 5 8 3 . 2 4 6 , 8 1 9 . 3 5 2 , 4 8 3 . 9 4 6 , 1 5 6 . 5 4 6 , 8 1 9 . 3 4 8 , 1 7 9 . 7 4 9 , 6 9 9 . 2 5 1 , 2 2 1 . 1 5 2 , 4 8 3 . 9 5 3 , 9 7 5 . 0
1. Data in this table also appear in the Board's Z.l (780) quarterly statistical release, tables 2. Excludes corporate equities and mutual fund shares. L.6 and L.7. For ordering address, see inside front cover.
Digitized for FRASER http://fraser.stlouisfed.org/ Federal Reserve Bank of St. Louis

A42 Domestic Nonfinancial Statistics • September 1996
2.10 NONFINANCIAL BUSINESS ACTIVITY Selected Measures
Monthly data seasonally adjusted, and indexes 1987=100, except as noted
Measure 1993 1994 1995
1995 1996 Measure 1993 1994 1995
Oct. Nov. Dec. Jan. Feb. Mar. Apr.r Mayr June
1 Industrial production1 111.5 118.1 121.9 122.2 122.6 122.8 122.5 124.2 123.6 124.5 125.1 125.7
Market groupings 2 Products, total 110.0 115.6 118.3 118.3 118.8 119.2 118.6 120.7 120.0 120.7 121.1 121.5 3 Final, total 112.7 118.3 121.4 121.3 121.9 122.1 121.9 124.5 123.4r 124.8 125.1 125.5 4 Consumer goods 109.5 113.7 115.1 114.9 115.9 115.7 114.6 116.6 115.3 115.8 116.1 116.2 5 Equipment 117.5 125.3 131.4 131.5 131.4 132.3 133.7 137.3 136.5r 139.2 139.6 140.6 6 Intermediate 101.8 107.3 109.0 109.2 109.3 110.1 108.5 109.3 I09.6r 108.6 109.1 109.5 / Materials 113.8 122.0 127.4 128.1 128.4 128.4 128.5 129.4 129.1r 130.2 131.2 132.3
Industry groupings 8 Manufacturing 112.3 119.7 123.9 124.4 124.5 124.8 124.5 126.2 125.2 126.5 126.9 127.6
9 Capacity utilization, manufacturing (percent)2.. 80.6 83.3 83.0 82.2 82.0 81.9 81.4 82.3 81.3 81.8 81.8 82.0
10 Construction contracts3 105.lr 114.2 118.3r 120.0 122.0r 117.0r 119.0 113.0 125.0r 126.0 122.0 118.0
11 Nonagricultural employment, total4 108.6 112.0 115.0 115.5 115.6 115.9 115.8 116.3 116.5 116.7 117.0 117.2 12 Goods-producing, total 94.6r 96.9r 98.T 97.9 97.8 97.9 97.7 98.3 98.1 98.1 98.3 98.4 13 Manufacturing, total 95.l r 96.4r 97.2r 96.7 96.6 96.7 96.4 96.5 96.2 96.2 96.3 96.3 14 Manufacturing, production workers 95.3 97.5r 98.7r 98.1 98.0 98.1 97.7 97.8 97.4 97.5 97.5 97.5 15 Service-producing 113.1r 116.8' 120.3' 121.1 121.3 121.6 121.6 122.1 122.3 122.6 123.0 123.3 16 Personal income, total 141.3 148.3 157.4 159.6 160.1 161.1 161.2 162.4r 163.0r 163.8 164.5 17 Wages and salary disbursements 136.0 142.6 150.5 153.0 152.9 153.7 153.5r 155.2r 155.9r 156.7 157.6 n.a. 18 Manufacturing 119.3 125.0 129.3 129.5 129.5 129.8 128.6r 130.0r 129.3r 131.6 132.0 n.a. 19 Disposable personal income5 142.4 149.2 157.8 160.0 160.6 161.7 161.6r 162.6r 163.lr 162.3 164.4 n.a. 20 Retail sales5 134.7 144.8 152.2 153.0 154.3 155.3 155.3 158.6 159.3 159.1 160.4 160.0
Prices6
21 Consumer (1982-84=100) 144.5 148.2 152.4 153.7 153.6 153.5 154.4 154.9 155.7 156.3 156.6 156.7 22 Producer finished goods (1982=100) 124.7 125.5 127.9 128.7 128.7 129.1 129.4 129.4 130.2 130.8 131.0 131.6
1. Data in this table also appear in the Board's G.17 (419) monthly statistical release. For the ordering address, see the inside front cover. The latest historical revision of the industrial production index and the capacity utilization rates was released in November 1995. See "A Revision to Industrial Production and Capacity Utilization, 1991-95," Federal Reserve Bulletin, vol. 82 (January 1996), pp. 16—25. For a detailed description of the industrial production index, see "Industrial Production: 1989 Developments and Historical Revision," Federal Reserve Bulletin, vol. 76 (April 1990), pp. 187-204.
2. Ratio of index of production to index of capacity. Based on data from the Federal Reserve, DRI McGraw-Hill, U.S. Department of Commerce, and other sources.
3. Index of dollar value of total construction contracts, including residential, nonresiden-tial, and heavy engineering, from McGraw-Hill Information Systems Company, F.W. Dodge Division.
4. Based on data from U.S. Department of Labor, Employment and Earnings. Series covers employees only, excluding personnel in the armed forces.
5. Based on data from US. Department of Commerce, Survey of Current Business. 6. Based on data not seasonally adjusted. Seasonally adjusted data for changes in the price
indexes can be obtained from the U.S. Department of Labor, Bureau of Labor Statistics, Monthly Labor Review.
NOTE. Basic data (not indexes) for series mentioned in notes 4 and 5, and indexes for series mentioned in notes 3 and 6, can also be found in the Survey of Current Business.
Figures for industrial production for the latest month are preliminary, and many figures for the three months preceding the latest month have been revised. See "Recent Developments in Industrial Capacity and Utilization," Federal Reserve Bulletin, vol. 76 (June 1990), pp. 411-35. See also "Industrial Production Capacity and Capacity Utilization since 1987," Federal Reserve Bulletin, vol. 79 (June 1993), pp. 590-605.
2.11 LABOR FORCE, EMPLOYMENT, AND UNEMPLOYMENT
Thousands of persons; monthly data seasonally adjusted
Category 1993r 1994r 1995r
1995 1996 Category 1993r 1994r 1995r
Nov. Dec. Jan. Feb. Mar. Apr.r Mayr June
HOUSEHOLD SURVEY DATA 1
1 Civilian labor force2 129,200 131,056 132,304 132,471 132,352 132,903 133,018 133,655 133,361 133,910 133,669 Employment
132,903 133,018 133,361 133,910 133,669
2 Nonagricultural industries3 117,144 119,651 121,460 121,739 121,656 121,698 122,143 122,664 122,726 122,971 123,228 3 Agriculture 3,115 3,409 3,440 3,323 3,325 3,529 3,519 3,487 3,368 3,491 3,382
Unemployment 3,529 3,519 3,487 3,368 3,491 3,382
4 Number 8,940 7,996 7,404 7,409 7,371 7,677 7,355 7,504 7,266 7,448 7,060 5 Rate (percent of civilian labor force) 6.9 6.1 5.6 5.6 5.6 5.8 5.5 5.6 5.4 5.6 5.3
ESTABLISHMENT SURVEY DATA
6 Nonagricultural payroll employment4 110,730 114,172 117,203 117,899 118,136 118,070 118,579 118,737 118,928 119,293 119,532
7 Manufacturing 18,075 18,321 18,468 18,353 18,367 18,309 18,332 18,282 18,283 18,299 18,292 8 Mining 610 601 580 569 570 569 573 574 573 576 576 9 Contract construction 4,668 4,986 5,158 5,211 5,223 5,234 5,349 5,340 5,353 5,383 5,406
10 Transportation and public utilities 5,829 5,993 6,165 6,233 6,249 6,254 6,270 6,289 6,294 6,315 6,331 11 Trade 25,755 26,670 27,585 27,778 27,832 27,780 27,869 27,891 27,972 28,037 28,124 12 Finance 6,757 6,896 6,830 6,871 6,887 6,894 6,919 6,932 6,942 6,963 6,974 13 Service 30,197 31,579 33,107 33,546 33,661 33,694 33,902 34,035 34,114 34,270 34,369 14 Government 18,841 19,128 19,310 19,338 19,347 19,336 19,365 19,394 19,397 19,450 19,460
1. Beginning January 1994, reflects redesign of current population survey and population controls from the 1990 census.
2. Persons sixteen years of age and older, including Resident Armed Forces. Monthly figures are based on sample data collected during the calendar week that contains the twelfth day; annual data are averages of monthly figures. By definition, seasonality does not exist in population figures.
3. Includes self-employed, unpaid family, and domestic service workers.
4. Includes all full- and part-time employees who worked during, or received pay for, the pay period that includes the twelfth day of the month; excludes proprietors, self-employed persons, household and unpaid family workers, and members of the armed forces. Data are adjusted to the March 1992 benchmark, and only seasonally adjusted data are available at this time.
SOURCE. Based on data from U.S. Department of Labor, Employment and Earnings.
Digitized for FRASER http://fraser.stlouisfed.org/ Federal Reserve Bank of St. Louis

Selected Measures A43
2.12 OUTPUT, CAPACITY, AND CAPACITY UTILIZATION1
Seasonally adjusted
Series
1995 1996 1995 1996 1995 1996
Series Q3 Q4 Ql r Q2 Q3 Q4 Ql Q2 Q3 Q4 Ql r Q2
Output (1987=100) Capacity (percent of 1987 output) Capacity utilization rate (percent)2
1 Total industry 122.3 122.5 123.4 125.1 146.3 147.7 149.1 150.6 83.6 82.9 82.8 83.1
2 Manufacturing 124.1 124.6 125.3 127.0 150.2 151.9 153.5 155.1 82.6 82.0 81.6 81.9
3 Primary processing3 117.1 117.1 116.7 117.8 135.2 136.1 136.9 137.8 86.6 86.1 85.2 85.6 4 Advanced processing4 127.5 128.1 129.4 131.3 157.5 159.5 161.5 163.5 80.9 80.3 80.1 80.3
5 Durable goods 133.0 134.2 136.0 139.3 161.7 164.2 166.7 169.4 82.3 81.7 81.6 82.2 6 Lumber and products 104.6 105.8 104.6 108.7 119.8 120.9 121.7 122.4 87.3 87.5 85.9 88.8 7 Primary metals 118.2 118.8 118.9 118.9 128.8 129.5 130.3 131.4 91.8 91.8 91.2 90.5 8 Iron and steel 121.3 121.3 122.6 122.2 132.9 133.5 134.4 135.7 91.3 90.9 91.2 90.0 9 Nonferrous 113.9 115.3 113.8 114.4 123.3 124.0 124.8 125.5 92.4 93.0 91.2 91.1
10 Industrial machinery and equipment 178.9 186.8 195.3 201.3 206.1 212.0 218.1 224.5 86.8 88.1 89.5 89.7 11 Electrical machinery 178.4 182.9 186.3 189.1 206.3 213.9 221.8 229.9 86.5 85.5 84.0 82.3 12 Motor vehicles and parts 140.7 140.5 132.6 144.7 176.8 179.2 181.3 182.9 79.6 78.4 73.2 79.1 13 Aerospace and miscellaneous
transportation equipment.. . 86.9 79.0 84.0 86.2 130.1 129.3 128.6 128.1 66.8 61.1 65.3 67.3
14 Nondurable goods 114.3 113.9 113.5 113.5 137.7 138.4 139.0 139.6 83.0 82.3 81.7 81.3 15 Textile mill products 110.9 109.4 106.4 108.5 131.6 132.8 133.7 134.2 84.3 82.4 79.6 80.8 16 Paper and products 119.5 118.1 114.6 118.6 132.8 133.9 134.9 135.8 90.0 88.2 85.0 87.3 17 Chemicals and products 124.6 126.4 126.9 126.0 155.6 156.5 157.5 158.5 80.1 80.7 80.6 79.5 18 Plastics materials 118.3 123.1 126.9 135.4 137.1 138.6 87.3 89.7 91.6 19 Petroleum products 109.2 107.7 109.7 109.7 116.4 116.6 116.8 117.1 93.8 92.4 93.9 93.7
20 Mining 100.2 98.2 98.7 101.3 111.9 111.9 111.9 111.8 89.5 87.8 88.2 90.6 21 Utilities 124.7 124.1 126.7 127.6 135.2 135.6 136.0 136.5 92.3 91.5 93.2 93.5 22 Electric 125.0 123.7 126.4 128.2 132.5 133.0 133.4 133.9 94.3 93.1 94.8 95.7
1973 1975 Previous cycle5 Latest cycle6 1995 1996
High Low High Low High Low June Jan. Feb. Mar.r Apr.' May Junep
Capacity utilization rate (percent)2
1 Total industry 89.2 72.6 87.3 71.8 84.9 78.0 83.5 82.4 83.3 82.6 82.9 83.1 83.2
2 Manufacturing 88.9 70.8 87.3 70.0 85.2 76.6 82.7 81.4 82.3 81.3 81.8 81.8 82.0
3 Primary processing3 92.2 68.9 89.7 66.8 89.0 77.9 87.0 85.4 84.9 85.3 85.3 85.6 85.7 4 Advanced processing4 87.5 72.0 86.3 71.4 83.5 76.1 80.8 79.7 81.1 79.6 80.4 80.2 80.4
5 Durable goods 88.8 68.5 86.9 65.0 84.0 73.7 82.1 81.3 82.5 80.9 82.1 82.1 82.4 6 Lumber and products 90.1 62.2 87.6 60.9 93.3 76.1 86.5 84.8 84.8 88.2 89.2 88.3 88.8 7 Primary metals 100.6 66.2 102.4 46.8 92.8 74.2 91.5 93.5 89.8 90.3 90.7 90.2 90.7 8 Iron and steel 105.8 66.6 110.4 38.3 95.7 72.0 89.9 95.6 88.9 89.1 90.4 89.3 90.4 9 Nonferrous 92.9 61.3 90.5 62.2 88.7 75.2 93.6 90.7 91.0 91.8 91.0 91.3 91.1
10 Industrial machinery and equipment 96.4 74.5 92.1 64.9 84.0 71.8 86.2 88.8 89.9 89.9 89.6 89.6 89.9
11 Electrical machinery 87.8 63.8 89.4 71.1 84.9 77.0 85.9 83.2 85.1 83.7 82.6 82.0 82.2 12 Motor vehicles and parts 93.4 51.1 93.0 44.5 85.1 56.6 79.7 75.0 77.9 66.7 79.1 78.8 79.5 13 Aerospace and miscellaneous
transportation equipment 77.0 66.6 81.1 66.9 88.4 78.8 67.5 63.8 65.5 66.7 67.0 67.3 67.6
14 Nondurable goods 87.9 71.8 87.0 76.9 86.7 80.3 83.3 81.4 81.9 81.6 81.4 81.4 81.3 15 Textile mill products 92.0 60.4 91.7 73.8 92.1 78.8 84.4 78.0 79.4 81.4 80.7 80.6 81.2 16 Paper and products 96.9 69.0 94.2 82.0 94.8 86.7 90.8 85.3 84.1 85.4 87.7 87.6 86.7 17 Chemicals and products 87.9 69.9 85.1 70.1 85.9 79.0 80.3 80.8 80.7 80.1 79.5 79.4 79.6 18 Plastics materials 102.0 50.6 90.9 63.4 97.0 74.8 90.2 90.8 91.3 92.6 93.4 19 Petroleum products 96.7 81.1 89.5 68.2 88.5 84.6 93.4 93.3 94.3 94.0 93.7 93.7 93.6
20 Mining 94.4 88.4 96.6 80.6 86.5 86.1 90.2 86.8 87.6 90.3 89.9 90.3 91.7 71 Utilities 95.6 82.5 88.3 76.2 92.6 83.1 89.7 92.4 93.1 94.0 92.4 94.6 93.3 22 Electric 99.0 82.7 88.3 78.7 94.8 86.7 91.6 94.2 94.9 95.2 94.0 97.2 95.9
1. Data in this table also appear in the Board's G.17 (419) monthly statistical release. For the ordering address, see the inside front cover. The latest historical revision of the industrial production index and the capacity utilization rates was released in November 1995. See "A Revision to Industrial Production and Capacity Utilization, 1991-95," Federal Reserve Bulletin, vol. 82 (January 1996), pp. 16-25. For a detailed description of the industrial production index, see "Industrial Production: 1989 Developments and Historical Revision," Federal Reserve Bulletin, vol. 76 (April 1990), pp. 187-204.
2. Capacity utilization is calculated as the ratio of the Federal Reserve's seasonally adjusted index of industrial production to the corresponding index of capacity.
3. Primary processing includes textiles; lumber; paper; industrial chemicals; synthetic materials; fertilizer materials; petroleum products; rubber and plastics; stone, clay, and glass; primary metals; and fabricated metals.
4. Advanced processing includes foods; tobacco; apparel; furniture and fixtures; printing and publishing; chemical products such as drugs and toiletries; agricultural chemicals; leather and products; machinery; transportation equipment; instruments; and miscellaneous manufac-tures.
5. Monthly highs, 1978-80; monthly lows, 1982. 6. Monthly highs, 1988-89; monthly lows, 1990-91.
Digitized for FRASER http://fraser.stlouisfed.org/ Federal Reserve Bank of St. Louis

A44 Domestic Nonfinancial Statistics • September 1996
2.13 INDUSTRIAL PRODUCTION Indexes and Gross Value1
Monthly data seasonally adjusted
1992 1995 1996 pro- 1995 por- avg. tion June July Aug. Sept. Oct. Nov. Dec. Jan. Feb. Mar.r Apr/ May Junep
Index (1987 = 100)
MAJOR MARKETS
1 Total index 100.0 121.9 121.4 121.5 122.7 122.8 122.2 122.6 122.8 122.5 124.2 123.6 124.5 125.1 125.7
2 Products 60.6 118.3 117.9 118.0 119.2 119.4 118.3 118.8 119.2 118.6 120.7 120.0 120.7 121.1 121.5 3 Final products 46.3 121.4 121.1 121.2 122.4 122.6 121.3 121.9 122.1 121.9 124.5 123.4 124.8 125.1 125.5 4 Consumer goods, total 28.6 115.1 114.8 114.6 115.9 116.0 114.9 115.9 115.7 114.6 116.6 115.3 115.8 116.1 116.2
Durable consumer goods 5.6 124.2 122.3 121.4 124.0 125.8 123.4 124.9 126.3 120.3 125.1 119.3 125.4 125.6 127.7 6 Automotive products 2.5 130.7 129.1 125.3 130.7 132.9 128.5 130.5 132.8 125.9 133.1 120.3 133.6 134.2 136.1 7 Autos and trucks 1.6 131.4 129.5 123.9 132.0 133.1 128.6 129.8 132.1 124.1 133.5 111.1 135.9 135.4 138.2 8 Autos, consumer .9 103.1 99.2 101.0 100.6 102.6 100.2 100.2 99.5 92.8 99.7 77.0 104.1 106.2 109.2 y Trucks, consumer .7 181.7 183.6 163.9 188.2 187.7 179.1 182.8 190.6 180.4 194.4 173.1 192.7 187.3 189.5
10 Auto parts and allied goods .9 127.8 126.8 126.6 126.6 130.8 126.7 130.2 132.7 128.1 130.7 137.2 127.5 130.0 130.2 n Other 3.0 118.6 116.3 118.1 118.1 119.6 118.9 119.9 120.5 115.5 118.1 118.5 118.2 118.2 120.3 12 Appliances, televisions, and air
conditioners .7 135.5 131.4 132.2 135.8 139.4 140.1 145.3 141.9 132.2 137.5 138.3 138.8 135.1 143.6 13 Carpeting and furniture .8 105.8 101.8 107.9 104.4 106.9 105.6 104.1 107.4 101.1 103.4 105.7 104.6 105.4 105.4 14 Miscellaneous home goods 1.5 118.2 118.0 117.4 118.0 117.8 116.9 117.6 118.3 116.2 117.7 116.9 116.6 117.9 118.4 15 Nondurable consumer goods 23.0 112.9 113.1 113.0 113.9 113.7 112.9 113.8 113.2 113.3 114.5 114.4 113.6 113.8 113.4 16 Foods and tobacco 10.3 111.3 113.1 112.8 111.8 111.6 111.1 110.9 110.6 110.6 112.0 112.3 112.0 111.4 111.1 17 Clothing 2.4 94.8 94.6 93.6 93.9 93.4 92.9 91.5 89.7 88.2 90.3 88.9 88.8 89.2 89.3 18 Chemical products 4.5 131.3 128.6 128.6 132.6 134.0 135.7 135.0 136.5 138.1 138.1 136.7 134.0 134.1 134.5 19 Paper products 2.9 106.6 106.3 107.6 106.7 107.3 106.6 108.4 106.3 104.9 106.0 105.8 106.1 107.1 106.2 20 Energy 2.9 116.5 115.8 116.1 122.3 119.0 113.1 121.1 119.5 121.0 122.6 123.9 121.7 124.8 122.4 21 Fuels .9 108.8 108.8 108.2 108.4 111.4 107.3 108.2 108.6 108.6 111.8 112.2 111.5 112.4 110.9 22 Residential utilities 2.1 119.6 118.7 119.4 128.2 122.2 115.4 126.6 124.1 126.1 127.2 128.8 126.0 130.0 127.2
23 Equipment 17.7 131.4 131.2 131.6 132.9 133.1 131.5 131.4 132.3 133.7 137.3 136.5 139.2 139.6 140.6 24 Business equipment 13.7 155.7 155.1 155.7 157.5 158.2 156.5 156.9 158.4 160.5 164.8 162.7 166.4 166.5 168.3 25 Information processing and related 5.7 198.1 196.0 197.2 201.0 203.0 206.5 208.1 209.4 213.3 220.5 221.6 225.0 226.4 230.3 26 Computer and office equipment 1.4 373.5 363.2 371.7 379.6 390.0 402.9 417.8 431.7 442.9 463.3 476.0 491.9 503.5 513.6 27 Industrial 4.0 127.5 126.2 127.1 129.1 128.7 128.6 129.1 129.5 129.6 131.3 130.3 130.1 130.1 130.1 28 Transit 2.6 136.3 140.3 139.8 138.0 137.9 122.3 119.6 124.5 128.1 133.2 121.2 136.1 135.3 136.6 29 Autos and trucks 1.2 140.1 139.5 139.9 141.3 143.3 135.7 134.2 135.3 129.1 136.0 113.6 140.0 138.2 138.4 30 Other 1.4 123.2 122.6 122.6 122.2 123.3 120.9 121.4 121.7 122.1 123.5 122.5 122.1 120.5 120.7 31 Defense and space equipment 3.3 65.9 66.8 66.5 66.1 65.2 64.4 62.9 62.0 61.6 63.1 64.2 64.0 64.4 63.9 32 Oil and gas well drilling .6 87.1 86.8 88.4 89.5 88.3 83.5 83.1 83.8 85.1 89.7 96.3 100.6 104.3 102.3 33 Manufactured homes .2 152.7 149.6 148.6 155.9 158.0 158.9 161.8 164.4 158.1 157.8 168.2 170.7 170.4
34 Intermediate products, total 14.3 109.0 108.2 108.5 109.4 109.5 109.2 109.3 110.1 108.5 109.3 109.6 108.6 109.1 109.5 35 Construction supplies 5.3 108.2 107.2 107.3 107.0 108.4 108.3 108.7 110.5 107.2 109.3 111.5 109.5 110.6 111.5 36 Business supplies 9.0 109.6 109.1 109.5 111 .0 110.3 109.9 109.9 110.0 109.6 109.5 108.6 108.2 108.4 108.4
37 Materials 39.4 127.4 126.8 126.8 128.1 128.1 128.1 128.4 128.4 128.5 129.4 129.1 130.2 131.2 132.3 38 Durable goods materials 20.8 141.5 139.7 140.2 142.3 144.1 143.9 145.3 144.8 145.8 147.3 145.5 147.5 148.6 150.1 39 Durable consumer parts 4.0 138.5 135.8 133.9 138.4 139.8 138.6 140.1 139.3 140.6 141.1 132.5 142.3 142.5 144.0 40 Equipment parts 7.5 163.0 161.7 164.4 167.1 169.1 169.4 171.0 170.8 171.7 176.3 176.8 177.5 179.3 181.9 41 Other 9.2 126.2 124.5 124.4 124.9 126.8 126.5 127.9 127.2 128.2. 127.8 127.4 126.8 127.8 128.5 42 Basic metal materials 3.1 125.7 123.5 124.9 123.1 127.0 124.3 128.1 126.6 125.7 123.7 124.4 123.8 124.1 125.3 43 Nondurable goods materials 8.9 119.8 120.4 118.9 118.8 117.8 118.7 116.6 117.4 115.7 116.1 116.3 118.3 118.3 118.5 44 Textile materials 1.1 109.2 109.0 102.6 109.2 106.2 107.3 104.8 103.3 100.3 101.8 103.0 104.9 105.5 106.2 45 Paper materials 1.8 120.5 121.0 123.9 120.4 117.0 121.4 114.3 115.2 113.4 113.4 113.7 118.9 118.2 116.3 46 Chemical materials 3.9 124.4 125.2 124.4 123.1 123.3 122.9 122.7 121.9 121.8 121.3 121.6 122.4 122.6 123.2 47 Other 2.1 116.5 117.4 113.8 114.6 115.1 114.6 114.1 118.9 115.2 117.1 116.4 117.8 117.6 118.6 48 Energy materials 9.7 106.6 107.2 107.5 108.5 105.8 105.5 105.7 106.0 105.9 106.1 108.2 106.8 108.6 109.3 49 Primary energy 6.3 101.9 103.0 102.3 101.4 101.2 101.7 100.8 101.0 100.6 101.3 103.9 103.1 104.6 105.8 50 Converted fuel materials 3.3 116.0 115.5 118.1 122.8 115.0 113.1 115.4 116.2 116.6 115.5 116.7 114.2 116.5 116.2
SPECIAL AGGREGATES
51 Total excluding autos and trucks 97.2 121.5 121.1 121.2 122.3 122.4 121.9 122.3 122.5 122.4 123.8 123.9 124.1 124.7 125.3 52 Total excluding motor vehicles and parts 95.2 120.9 120.5 120.7 121.7 121.8 121.3 121.7 121.9 121.9 123.3 123.7 123.5 124.1 124.7 53 Total excluding computer and office
equipment 98.2 118.2 117.8 117.8 118.9 118.9 118.1 118.4 118.5 118.0 119.5 118.7 119.5 120.0 120.5 54 Consumer goods excluding autos and trucks . 27.0 114.0 113.9 114.0 114.8 114.9 114.0 115.0 114.7 114.0 115.5 115.6 114.5 114.9 114.7 55 Consumer goods excluding energy 25.7 114.9 114.7 114.5 115.1 115.7 115.1 115.3 115.3 113.9 115.9 114.3 115.2 115.1 115.5 56 Business equipment excluding autos and
trucks 12.5 157.0 156.5 157.2 158.9 159.5 158.4 159.0 160.5 163.5 167.5 167.5 168.9 169.2 171.1 57 Business equipment excluding computer and
office equipment 12.2 133.0 133.2 133.2 134.4 134.3 131.6 130.8 131.3 132.6 135.5 132.3 134.9 134.2 135.2 58 Materials excluding energy 29.7 134.9 133.8 133.7 135.1 136.1 136.2 136.6 136.4 136.6 137.8 136.6 138.6 139.3 140.5
Digitized for FRASER http://fraser.stlouisfed.org/ Federal Reserve Bank of St. Louis

Selected Measures A45
2.13 INDUSTRIAL PRODUCTION Indexes and Gross Value1—Continued
Group SIC code
1992 pro-por-tion
1995 avg.
July Aug. Sept. Mar.r Apr/ May Junep
Index (1987 = 100)
MAJOR INDUSTRIES
59 Total index 100.0 121.9 121.4 121.5 122.7 122.8 122.2 122.6 122.8 122.5 124.2 123.6 124.5 125.1 125.7
60 Manufacturing 85.4 123.9 123.3 123.3 124.2 124.9 124.4 124.5 124.8 124.5 126.2 125.2 126.5 126.9 127.6 61 Primary processing 26.6 117.6 117.1 116.9 116.6 117.8 117.0 117.1 117.3 116.7 116.3 117.1 117.3 117.9 118.3 62 Advanced processing 58.9 126.8 126.3 126.3 127.8 128.2 127.9 128.0 128.4 128.2 131.0 129.0 130.9 131.1 132.0
63 Durable goods 45.0 132.5 131.5 131.5 133.2 134.4 133.5 134.3 134.8 134.9 137.5 135.6 138.4 139.0 140.4 64 Lumber and products 24 2.0 104.5 103.0 103.7 103.7 106.2 105.7 104.8 106.9 103.1 103.3 107.5 108.9 108.1 108.9 65 Furniture and fixtures 25 1.4 111.6 111.3 111.1 110.9 112.0 110.9 109.8 109.3 109.3 110.5 107.7 109.0 111.4 110.8 66 Stone, clay, and glass
products 32 2.1 104.1 103.8 103.2 103.0 103.8 104.5 104.9 104.3 105.5 104.1 102.9 103.1 104.0 104.8 67 Primary metals 33 3.1 119.2 117.5 118.3 115.4 121.0 115.7 120.8 120.0 121.5 117.1 118.0 118.8 118.5 119.5 68 Iron and steel 331,2 1.7 122.4 119.2 119.3 117.7 127.0 115.1 126.1 122.7 128.1 119.5 120.2 122.3 121.2 123.1 69 Raw steel 331PT .1 114.7 112.9 111.5 114.2 118.6 111.3 116.4 118.0 113.9 112.5 114.9 112.9 113.2 70 Nonferrous 333-6 ,9 1.4 114.8 114.9 116.5 111.9 113.2 115.8 113.8 116.2 113.0 113.6 114.8 114.0 114.6 1146 71 Fabricated metal products.. . 34 5.0 113.9 113.7 112.4 114.3 115.1 114.0 114.5 115.0 115.6 117.0 116.1 115.6 116.3 117.0 72 Industrial machinery and
equipment 35 8.0 177.8 174.4 176.0 179.5 181.3 183.8 186.5 190.1 191.9 196.1 197.8 199.1 201.1 203.7 73 Computer and office
equipment 357 1.8 373.5 363.2 371.7 379.6 390.0 402.9 417.8 431.7 442.9 463.3 476.0 491.9 503.5 513.6 74 Electrical machinery 36 7.2 174.9 173.0 175.7 178.7 180.8 182.4 183.6 182.8 182.4 188.7 187.9 187.6 188.5 191.3 75 Transportation equipment. . . 37 9.5 113.3 113.4 111.6 114.1 114.1 109.3 108.6 109.7 108.3 112.1 103.1 114.6 114.6 115.6 76 Motor vehicles and parts . 371 4.8 141.9 139.7 136.7 142.1 143.3 139.7 140.7 141.2 135.5 141.1 121.3 144.3 144.1 145.8 77 Autos and light trucks . 371PT 2.5 131.3 129.2 124.3 131.6 132.8 128.4 129.6 131.5 123.5 132.8 109.9 135.5 135.3 138.2 78 Aerospace and
miscellaneous transportation
86.2 equipment 372-6 ,9 4.7 85.8 88.1 87.6 87.2 85.9 80.0 77.7 79.4 82.2 84.2 85.7 85.9 86.2 86.5 79 Instruments 38 5.4 110.7 110.9 110.2 111.4 111.3 111.4 111.5 109.7 111.0 113.4 112.9 112.8 113.0 113.7 80 Miscellaneous 39 1.3 122.7 123.1 121.4 122.4 122.9 122.2 123.3 123.5 122.1 124.0 124.0 122.6 122.9 124.1
81 Nondurable goods 40.5 114.3 114.3 114.3 114.3 114.4 114.3 113.7 113.8 113.1 113.8 113.6 113.4 113.6 113.6 82 Foods " ' 20 9.4 115.3 116.1 115.3 115.5 115.5 115.4 114.8 114.8 114.8 116.0 115.6 115.4 115.1 114.6 83 Tobacco products 21 1.6 90.2 96.4 99.1 91.3 90.2 88.2 88.9 88.4 87.1 90.9 92.6 94.2 91.1 92.0 84 Textile mill products 22 1.8 112.6 110.4 109.9 112.4 110.5 111.1 108.9 108.3 104.1 106.2 109.0 108.1 108.2 109.2 85 Apparel products 23 2.2 95.7 95.5 94.8 94.5 94.5 93.3 92.4 91.5 89.2 90.9 89.7 90.1 90.6 90.9 86 Paper and products 26 3.6 119.8 119.9 121.3 118.6 118.5 119.7 116.2 118.2 114.9 113.5 115.5 118.8 119.1 118.0 87 Printing and publishing 27 6.8 99.4 98.6 99.0 100.5 99.8 98.9 99.3 98.8 97.9 98.7 96.7 96.2 96.5 96.5 88 Chemicals and products . . . . 28 9.9 125.0 124.4 124.0 124.4 125.3 126.7 126.0 126.5 127.1 127.1 126.5 125.8 125.8 126.4 89 Petroleum products 29 1.4 108.3 108.6 109.0 108.5 110.0 106.9 107.4 108.9 108.9 110.2 109.9 109.6 109.7 109.7 90 Rubber and plastic products . 30 3.5 139.4 137.8 137.7 138.7 139.8 139.7 140.3 139.3 139.0 139.7 140.5 137.6 141.0 141.3 91 Leather and products 31 .3 81.3 81.2 78.7 80.8 80.5 79.7 78.2 76.8 75.6 77.1 76.7 76.2 75.7 76.5
92 Mining 6.9 99.9 101.0 100.7 100.0 100.0 98.2 98.3 98.1 97.1 98.0 101.1 100.5 101.0 102.5 93 Metal 10 .5 169.3 166.8 172.2 172.1 170.8 178.3 175.9 172.8 159.5 157.1 166.1 163.0 165.4 167.5 94 Coal 12 1.0 112.9 112.2 117.0 109.7 116.2 112.3 109.5 108.5 103.3 108.0 114.8 109.5 111.9 113.2 95 Oil and gas extraction 13 4.8 91.9 93.6 91.9 92.4 91.2 89.2 90.1 90.1 90.8 90.2 92.6 93.3 93.6 95.0 96 Stone and earth minerals 14 .6 112.3 111.9 113.5 111.6 113.1 112.4 110.9 112.4 108.9 117.2 117.4 115.5 113.2 115.9
97 Utilities 7.7 122.0 121.0 122.7 128.8 122.7 121.6 125.4 125.1 125.6 126.6 128.0 126.0 129.2 127.6 98 Electric 491,493PT 6.1 122.1 121.2 122.2 130.0 122.7 123.7 123.6 123.9 125.5 126.6 127.1 125.7 130.2 128.7 99 Gas 492.493PT 1.6 121.7 120.6 124.5 124.3 122.4 113.6 132.5 129.9 125.6 126.3 131.5 126.9 125.0 123.2
SPECIAL AGGREGATES
100 Manufacturing excluding motor vehicles and parts 80.6 122.8 122.3 122.5 123.1 123.8 123.4 123.6 123.9 123.9 125.4 125.4 125.4 125.9 126.6
101 Manufacturing excluding office and computing machines . . . 83.7 119.5 119.1 118.9 119.8 120.3 119.6 119.6 119.7 119.3 120.7 119.5 120.6 120.9 121.5
Gross value (billions of 1992 dollars, annual rates)
MAJOR MARKETS
102 Products, total 2,002.9 2,245.6 2,239.1 2,238.8 2,257.8 2,268.1 2,240.3 2,255.8 2,265.7 2,248.9 2,293.1 2,269.5 2,300.2 2,304.5 2,310.7
103 Final 1,552.2 1,748.7 1,745.6 1,743.2 1,760.5 1,768.2 1,741.9 1,756.8 1,761.9 1,753.0 1,794.2 1,766.8 1,801.2 1,804.6 1,808.7 104 Consumer goods 1,033.4 1,130.5 1,128.4 1,124.0 1,135.7 1,141.1 1,125.1 1,139.3 1,139.0 1,124.7 1,148.4 1,129.5 1,144.2 1,145.7 1,145.7 105 Equipment 518.8 618.3 617.1 619.2 624.8 627.1 616.7 617.5 622.9 628.4 645.8 637.3 656.9 658.9 663.0 106 Intermediate 450.7 496.9 493.5 495.6 497.3 499.9 498.4 499.0 503.8 495.9 498.8 502.7 499.0 499.8 502.0
1. Data in this table also appear in the Board's G.17 (419) monthly statistical release. For the ordering address, see the inside front cover. The latest historical revision of the industrial production index and the capacity utilization rates was released in November 1995. See "A Revision to Industrial Production and Capacity Utilization, 1991-95," Federal Reserve
Bulletin, vol. 82 (January 1996), pp. 16-25. For a detailed description of the industrial production index, see "Industrial Production: 1989 Developments and Historical Revision," Federal Reserve Bulletin, vol. 76, (April 1990), pp. 187-204.
2. Standard industrial classification.
Digitized for FRASER http://fraser.stlouisfed.org/ Federal Reserve Bank of St. Louis

A46 Domestic Nonfinancial Statistics • September 1996
2.14 HOUSING AND CONSTRUCTION
Monthly figures at seasonally adjusted annual rates except as noted
1995 1 9 9 6 '
Aug. Sept. Oct. Nov. Dec. Jan. Feb. Mar. Apr. May
Private residential real estate activity (thousands of units except as noted)
NEW UNITS
1 Permits authorized 1 ,199 1 ,372 1 ,332 1 ,379 1 ,427 1 ,393 1 ,450 1 ,487 1 , 3 7 8 1 ,417 1 , 4 2 3 1 , 4 5 9 1 , 4 5 2 2 One-family 9 8 7 1 ,068 9 9 7 1 ,046 1 ,079 1 ,050 1 ,073 1 ,123 1 ,056 1 ,087 1 ,097 1 ,115 1 , 0 9 8 3 Two-family or more 2 1 3 3 0 3 3 3 5 3 3 3 3 4 8 3 4 3 3 7 7 3 6 4 3 2 2 3 3 0 3 2 6 3 4 4 3 5 4 4 Started 1 ,288 1 ,457 1 ,354 1 ,401 1,401 1 ,351 1 ,458 1 ,425 1 ,453 1 ,514 1 ,439 1 ,511 1 ,461 5 One-family 1 ,126 1 ,198 1 ,076 1 ,135 1 ,130 1 ,109 1 , 1 2 9 1 ,150 1 , 1 4 6 1 ,183 1 ,163 1 ,209 1 ,141 6 Two-family or more 1 6 2 2 5 9 2 7 8 2 6 6 2 7 1 2 4 2 3 2 9 2 7 5 3 0 7 3 3 1 2 7 6 3 0 2 3 2 0 7 Under construction at end of period1 6 8 0 7 6 2 7 7 6 7 7 2 7 8 3 7 8 1 7 9 0 8 0 0 8 0 3 8 0 0 8 1 6 8 2 8 8 3 6 8 One-family 5 4 3 5 5 8 5 4 7 5 4 7 5 5 5 5 6 0 5 6 2 5 6 9 5 6 9 5 6 5 5 8 1 5 9 2 5 9 8 9 Two-family or more 137 2 0 4 2 2 9 2 2 5 2 2 8 2 2 1 2 2 8 2 3 1 2 3 4 2 3 5 2 3 5 2 3 6 2 3 8
10 Completed 1 , 1 9 3 1 ,347 1 ,313 1 ,247 1 ,267 1 , 3 2 0 1 , 3 6 0 1 ,225 1 , 4 0 3 1 , 3 2 8 1 ,391 1 ,345 1 , 3 6 6 11 One-family 1 , 0 4 0 1 , 1 6 0 1 , 0 6 6 1 ,019 1 ,009 1 ,039 1 ,081 1 ,003 1 , 1 1 3 1 ,052 1 ,112 1 ,067 1 ,087 12 Two-family or more 153 187 2 4 7 2 2 8 2 5 8 2 8 1 2 7 9 2 2 2 2 9 0 2 7 6 2 7 9 2 7 8 2 7 9 13 Mobile homes shipped 2 5 4 3 0 4 3 4 0 3 4 4 3 5 2 3 5 4 3 5 5 3 5 2 3 5 2 3 4 1 3 6 4 3 7 8 3 6 9
Merchant builder activity in one-family units
14 Number sold 6 6 6 6 7 0 6 6 5 7 0 7 6 8 4 6 7 3 6 7 9 6 8 3 7 4 3 7 8 4 7 2 7 7 7 0 8 2 8 15 Number for sale at end of period1 2 9 3 3 3 7 3 7 2 3 4 9 3 5 0 3 6 0 3 6 8 3 7 2 3 7 0 3 5 5 3 6 6 3 6 6 3 6 0
Price of units sold (thousands of dollars)2
16 Median 126.1 130 .4 133 .4 134 .9 130 .0 135 .2 137 .0 138 .6 1 3 1 . 9 1 3 9 . 4 136 .8 1 3 9 . 9 1 3 5 . 0 17 Average 147 .6 153 .7 157 .6 1 6 2 . 0 1 5 5 . 6 156 .2 160 .7 1 6 5 . 6 1 5 5 . 3 163 .7 1 6 1 . 2 168 .7 1 6 2 . 3
EXISTING UNITS ( o n e - f a m i l y )
18 Number sold 3 , 8 0 0 3 , 9 4 6 3 , 8 0 1 4 , 0 5 0 4 , 0 9 0 4 , 0 7 0 4 , 0 0 0 3 , 8 7 0 3 , 7 2 0 3 , 9 4 0 4 , 2 0 0 4 , 2 0 0 4 , 2 8 0
Price of units sold (thousands of dollars)2
19 Median 106 .5 109 .6 112 .2 1 1 7 . 6 114 .8 113 .2 1 1 4 . 3 113 .9 114 .8 1 1 4 . 0 115 .7 116.5 1 1 7 . 6 2 0 Average 133 .1 1 3 6 . 4 1 3 8 . 4 144 .5 140 .2 138 .7 139 .5 138 .7 141 .2 138 .7 140.1 141 .9 1 4 4 . 4
Value of new construction (millions of dollars)3
CONSTRUCTION
21 Total put in place 482,737r 527,063r 547,079r 542,324r 550,467r 549,952r 549,745r 555,701r 558,952 544,577 556,983 568,334 563,352
2 2 Private 3 6 2 , 5 8 7 ' 4 0 0 , 0 0 7 ' 4 1 0 , 1 9 7 ' 4 0 5 , 9 1 1 ' 4 1 1 , 3 2 6 ' 4 1 0 , 5 5 0 ' 4 1 1 , 0 1 5 ' 4 1 7 , 1 9 1 ' 4 1 8 , 8 9 6 4 1 1 , 2 4 8 4 1 9 , 7 2 6 4 2 7 , 7 0 7 4 2 0 , 1 9 2 2 3 Residential 2 1 0 , 4 5 5 2 3 8 , 8 7 3 ' 2 3 6 , 5 9 8 ' 2 3 4 , 4 6 4 ' 2 3 7 , 6 6 3 ' 2 3 7 , 9 5 2 ' 2 3 9 , 9 3 8 ' 2 4 3 , 1 0 4 ' 2 4 2 , 4 7 4 2 3 8 , 5 5 8 2 4 5 , 8 8 1 2 5 1 , 9 2 0 2 4 8 , 9 0 4 2 4 Nonresidential 1 5 2 , 1 3 2 ' 1 6 1 , 1 3 4 ' 1 7 3 , 5 9 9 ' 1 7 1 , 4 4 7 ' 1 7 3 , 6 6 3 ' 1 7 2 , 5 9 8 ' 1 7 1 , 0 7 7 ' 1 7 4 , 0 8 7 ' 1 7 6 , 4 2 2 1 7 2 , 6 9 0 1 7 3 , 8 4 5 1 7 5 , 7 8 7 1 7 1 , 2 8 8 2 5 Industrial buildings 2 6 , 4 8 2 ' 2 8 , 9 4 7 ' 3 2 , 3 0 1 ' 3 1 , 8 0 9 ' 3 2 , 4 2 7 ' 3 1 , 4 2 2 ' 3 2 , 0 3 2 ' 3 1 , 9 9 6 ' 3 2 , 4 9 5 3 0 , 7 9 2 3 0 , 5 9 3 3 0 , 2 8 5 2 8 , 8 0 5 2 6 Commercial buildings 5 3 , 3 7 5 ' 5 9 , 7 2 8 ' 6 7 , 5 2 8 ' 6 7 , 9 1 1 ' 6 7 , 6 6 0 ' 6 7 , 2 5 9 ' 6 5 , 5 5 5 ' 6 6 , 4 4 7 ' 6 6 , 4 7 5 6 6 , 4 6 1 6 5 , 5 0 3 6 7 , 4 2 4 6 5 , 5 2 4 2 7 Other buildings 2 6 , 2 1 9 ' 2 6 , 9 6 1 ' 2 6 , 9 2 3 ' 2 6 , 4 7 5 ' 2 7 , 3 4 0 ' 2 7 , 8 9 9 ' 2 7 , 4 1 8 ' 2 8 , 1 9 7 ' 2 8 , 1 0 3 2 7 , 4 7 0 2 7 , 8 8 4 2 7 , 3 3 9 2 7 , 5 6 1 2 8 Public utilities and other 4 6 , 0 5 6 ' 4 5 , 4 9 8 ' 4 6 , 8 4 7 ' 4 5 , 2 5 2 ' 4 6 , 2 3 6 ' 4 6 , 0 1 8 ' 4 6 , 0 7 2 ' 4 7 , 4 4 7 ' 4 9 , 3 4 9 4 7 , 9 6 7 4 9 , 8 6 5 5 0 , 7 3 9 4 9 , 3 9 8
2 9 Public 1 2 0 , 1 5 1 ' 1 2 7 , 0 5 6 ' 1 3 6 , 8 8 4 ' 1 3 6 , 4 1 3 ' 1 3 9 , 1 4 0 ' 1 3 9 , 4 0 2 ' 1 3 8 , 7 2 9 ' 1 3 8 , 5 1 0 ' 1 4 0 , 0 5 6 1 3 3 , 3 2 9 1 3 7 , 2 5 7 1 4 0 , 6 2 7 1 4 3 , 1 6 0 3 0 Military 2 , 4 5 4 2 , 3 1 9 3 , 0 0 5 ' 3 , 1 3 1 ' 3 , 2 1 8 ' 2 , 2 9 5 ' 3 , 2 1 7 ' 3 , 2 1 1 ' 3 , 5 5 4 3 , 9 8 2 3 , 1 2 6 3 , 1 8 2 3 , 0 1 7 31 Highway 3 4 , 3 4 2 ' 3 7 , 6 7 3 ' 3 8 , 1 6 1 ' 3 8 , 8 0 9 ' 3 8 , 2 0 9 ' 40 ,125 R 3 8 , 3 4 4 ' 4 0 , 4 0 2 ' 3 9 , 4 4 4 4 0 , 9 5 6 3 9 , 5 2 7 3 9 , 8 6 6 3 8 , 8 7 5 3 2 Conservation and development 5 , 9 0 8 ' 6 , 3 7 0 ' 6 , 3 8 9 ' 7 , 0 0 3 ' 6 , 2 1 2 ' 5 , 2 2 2 ' 5 , 8 8 8 ' 6 , 0 1 4 ' 5 , 3 5 2 5 , 4 5 5 5 , 8 1 1 5 , 1 7 3 4 , 7 5 5 3 3 Other 7 7 , 4 4 7 ' 8 0 , 6 9 4 ' 8 9 , 3 2 9 ' 8 7 , 4 7 0 ' 9 1 , 5 0 1 ' 9 1 , 7 6 0 ' 9 1 , 2 8 0 ' 8 8 , 8 8 3 ' 9 1 , 7 0 6 8 2 , 9 3 6 8 8 , 7 9 3 9 2 , 4 0 6 9 6 , 5 1 3
1. Not at annual rates. 2. Not seasonally adjusted. 3. Recent data on value of new construction may not be strictly comparable with data for
previous periods because of changes by the Bureau of the Census in its estimating techniques. For a description of these changes, see Construction Reports (C-30-76-5), issued by the Census Bureau in July 1976.
SOURCE. Bureau of the Census estimates for all series except (1) mobile homes, which are private, domestic shipments as reported by the Manufactured Housing Institute and season-ally adjusted by the Census Bureau, and (2) sales and prices of existing units, which are published by the National Association of Realtors. All back and current figures are available from the originating agency. Permit authorizations are those reported to the Census Bureau from 19,000 jurisdictions beginning in 1994.
Digitized for FRASER http://fraser.stlouisfed.org/ Federal Reserve Bank of St. Louis

Selected Measures A47
2.15 CONSUMER AND PRODUCER PRICES
Percentage changes based on seasonally adjusted data except as noted
Item
Change from 12 months earlier
Change from 3 months earlier (annual rate) Change from 1 month earlier
Index level, June
1996 1 Item
1995 June
1996 June
1995 1996 1996
Index level, June
1996 1 Item
1995 June
1996 June
Sept. Dec. Mar. June Feb. Mar. Apr. May June
Index level, June
1996 1
CONSUMER PRICES2
(1982-84=100)
1 All items 3 . 0 2 . 8 1 . 6 2 . 4 4 . 0 3 . 1 . 2 .4 .4 .3 .1 1 5 6 . 7
?. 3.1 3.2 2.7 1.9 3.2 4.6 .1 .6 .3 .1 .7 152.6 3 Energy items 3.4 3.5 -10 .5 1.9 15.8 8.4 .4 1.4 3.2 1.1 - 2 . 2 113.1 4 All items less food and energy 3.0 2.7 2.8 2.2 3.5 2.2 .2 .3 .1 .2 .2 165.2 5 Commodities 1.2 1.5 2.0 1.7 2.6 - . 3 - . 1 .4 - . 1 .0 .0 141.0 6 Services 3.8 3.2 3.0 2.5 3.4 3.9 .3 .2 .3 .3 .3 179.0
PRODUCER PRICES (1982=100)
7 Finished goods 2.1 2.7 1.6 4.4 2.5 1.9 - . 1 .5 .4 - . 1 .2 131.6 8 Consumer foods 1.2 4.6 8.8 4.4 .3 5.3 - . 2 .1' - . 3 .0 1.6 133.3 9 Consumer energy 4.0 4.1 -10 .2 10.8 17.8 .0 -.9' 2.6' 2.8 - . 6 - 2 . 1 84.7
10 Other consumer goods 2.0 2.0 2.3 3.4 .3 2.0 .1 .1 .0 .1 .3 144.5 11 Capital equipment 1.6 1.2 1.8 2.9 - . 3 .0 ,0r ,0r .2 - . 1 - . 1 138.0
Intermediate materials 12 Excluding foods and feeds 7.0 - . 6 - . 6 - . 6 - 1 . 0 .0 - , 5 r .2' .3 .2 - . 6 125.9 13 Excluding energy 7.4 - 1 . 2 1.5 - 2 . 9 - 3 . 2 - . 3 -A' -A' - . 2 .2 - . 1 134.1
Crude materials 14 Foods -5 .3 26.1 • 34.8 20.8 - 3 . 8 57.5 — ,7r .2' 4.0 6.3 1.4 128.7 15 Energy -4 .9 8.3 -21 .0 33.9 38.1 - 6 . 0 5.9r -5.0' 10.9 - 3 . 8 - 7 . 7 77.4 16 Other 18.5 -13 .8 -17 .6 -18.4 -10 .2 - 8 . 3 -.2' -2.2' - . 5 - . 3 - 1 . 4 155.7
1. Not seasonally adjusted. SOURCE. U.S. Department of Labor, Bureau of Labor Statistics. 2. Figures for consumer prices are for all urban consumers and reflect a rental-equivalence
measure of homeownership.
Digitized for FRASER http://fraser.stlouisfed.org/ Federal Reserve Bank of St. Louis

A48 Domestic Nonfinancial Statistics • September 1996
2.16 GROSS DOMESTIC PRODUCT AND INCOME
Billions of current dollars except as noted; quarterly data at seasonally adjusted annual rates
Account 1993 1994 1995 1995 1996
Account 1993 1994 1995
Ql Q2 Q3 Q4 Ql
GROSS DOMESTIC PRODUCT
1 Total 6,550.2 6,931.4 7,245.8 7,147.8 7,196.5 7,298.5 7,340.4 7,417.8
By source 2 Personal consumption expenditures 4,454.1 4,698.7 4,924.3 4,836.3 4,908.7 4,960.0 4,992.3 5,062.7 3 Durable goods 530.7 580.9 606.4 593.0 604.0 615.8 612.8 625.2 4 Nondurable goods 1,368.9 1,429.7 1,486.1 1,471.6 1,486.9 1,491.4 1,494.8 1,522.6 5 Services 2,554.6 2,688.1 2,831.8 2,771.7 2,817.9 2,852.8 2,884.7 2,914.9
6 Gross private domestic investment 871.1 1,014.4 1,065.3 1,072.0 1,050.3 1,074.8 1,064.0 1,068.9 7 Fixed investment 850.5 954.9 1,028.2 1,013.9 1,016.3 1,036.6 1,046.2 1,070.7 8 Nonresidential 598.8 667.2 738.5 723.6 734.4 746.3 749.7 769.0 9 Structures 171.8 180.2 199.7 194.5 197.6 202.5 204.0 208.4
10 Producers' durable equipment 427.0 487.0 538.8 529.0 536.8 543.8 545.7 560.6 11 Residential structures 251.7 287.7 289.8 290.4 281.9 290.3 296.5 301.7
12 Change in business inventories 20.6 59.5 37.0 58.1 34.0 38.2 17.8 - 1 . 7 13 Nonfarm 26.8 48.0 39.6 60.8 36.1 41.5 19.9 2.7
14 Net exports of goods and services -64.9 -96 .4 -102.3 -106.6 -122.4 -100.8 -79 .3 -97 .5 15 Exports 660.0 722.0 804.5 778.6 796.9 812.5 829.9 832.2 16 Imports 724.9 818.4 906.7 885.1 919.3 913.3 909.2 929.7
17 Government consumption expenditures and gross investment 1,289.9 1,314.7 1,358.5 1,346.0 1,359.9 1,364.5 1,363.5 1,383.7 18 Federal 522.1 516.3 516.7 519.9 522.6 516.7 507.8 518.6 19 State and local 767.8 798.4 841.7 826.1 837.3 847.7 855.7 865.1
By major type of product 20 Final sales, total 6,529.7 6,871.8 7,208.8 7,089.7 7,162.5 7,260.3 7,322.6 7,419.6 21 Goods 2,400.9 2,534.2 2,660.3 2,617.3 2,642.3 2,684.5 2,697.1 2,749.1 22 Durable 1,013.8 1,085.9 1,144.9 1,118.6 1,134.0 1,162.5 1,164.5 1,191.4 23 Nondurable 1,387.2 1,448.3 1,515.4 1,498.7 1,508.3 1,522.1 1,532.6 1,557.7 24 Services 3,581.7 3,742.4 3,920.9 3,852.6 3,904.5 3,943.2 3,983.1 4,019.1 25 Structures 547.0 595.3 627.6 619.8 615.7 632.6 642.3 651.4
26 Change in business inventories 20.6 59.5 37.0 58.1 34.0 38.2 17.8 - 1 . 7 27 Durable goods 15.7 31.9 34.9 54.4 28.5 29.2 27.3 12.3 28 Nondurable goods 4.9 27.7 2.2 3.7 5.4 9.1 - 9 . 4 -14 .0
MEMO 29 Total GDP in chained 1992 dollars 6,383.8 6,604.2 6,739.0 6,701.6 6,709.4 6,768.3 6,776.5 6,812.7
NATIONAL INCOME
30 Total 5,194.4 5,495.1 5,799.2 5,697.7 5,738.9 5,849.2 5,911.1 6,001.4
31 Compensation of employees 3,809.4 4,008.3 4,209.1 4,141.6 4,178.9 4,235.9 4,280.2 4,325.7 32 Wages and salaries 3,095.2 3,255.9 3,419.7 3,363.0 3,393.3 3,442.3 3,480.1 3,521.6 33 Government and government enterprises 584.2 602.5 621.7 616.3 619.6 624.1 626.9 634.0 34 Other 2,511.0 2,653.4 2,797.9 2,746.6 2,773.6 2,818.2 2,853.2 2,887.6 35 Supplement to wages and salaries 714.2 752.4 789.5 778.6 785.6 793.7 800.1 804.1 36 Employer contributions for social insurance 333.3 350.2 365.5 360.8 363.6 367.8 369.8 375.0 37 Other labor income 380.9 402.2 424.0 417.7 422.0 425.9 430.2 429.1
38 Proprietors' income1 420.0 450.9 478.3 472.0 474.7 479.6 486.7 499.5 39 Business and professional1 388.1 415.9 449.3 443.5 447.1 451.5 454.9 461.1 40 Farm1 32.0 35.0 29.0 28.5 27.6 28.1 31.8 38.4
41 Rental income of persons2 102.5 116.6 122.2 120.6 121.6 120.9 125.8 126.9
42 Corporate profits1 464.5 526.5 588.6 559.6 561.1 614.9 618.6 652.0 43 Profits before tax3 464.3 528.2 600.8 594.1 588.4 609.6 611.0 649.0 44 Inventory valuation adjustment - 6 . 6 -13 .3 -28.1 -51 .9 -42 .3 - 9 . 3 - 8 . 8 -17 .4 45 Capital consumption adjustment 6.7 11.6 15.9 17.4 15.0 14.6 16.5 20.4
46 Net interest 398.1 392.8 401.0 403.9 402.6 397.8 399.7 397.3
1. With inventory valuation and capital consumption adjustments. 2. With capital consumption adjustment.
3. For after-tax profits, dividends, and the like, see table 1.48. SOURCE. U.S. Department of Commerce, Survey of Current Business.
Digitized for FRASER http://fraser.stlouisfed.org/ Federal Reserve Bank of St. Louis

Selected Measures A49
2.17 PERSONAL INCOME AND SAVING
Billions of current dollars except as noted; quarterly data at seasonally adjusted annual rates
Account 1993 1994 1995 1995 1996
Account 1993 1994 1995
Q1 Q2 Q3 Q4 Q1
PERSONAL INCOME AND SAVING
1 Total personal income 5,479.2 5,750.2 6,101.7 5,995.5 6,061.9 6,135.6 6,213.9 6,288.4
2 Wage and salary disbursements 3,090.6 3,241.1 3,419.7 3,361.6 3,393.3 3,442.3 3,481.5 3,520.2 3 Commodity-producing industries 781.3 825.0 858.7 856.2 855.0 859.9 863.5 866.2 4 Manufacturing 593.1 621.3 642.8 643.4 640.5 642.9 644.5 643.0 5 Distributive industries 698.4 739.3 787.9 768.8 778.6 795.4 808.9 821.6 6 Service industries 1,026.6 1,074.3 1,151.3 1,120.2 1,140.0 1,162.8 1,182.2 1,198.4 7 Government and government enterprises 584.2 602.5 621.7 616.3 619.6 624.1 626.9 634.0
8 Other labor income 380.9 402.2 424.0 417.7 422.0 425.9 430.2 429.1 9 Proprietors' income1 420.0 450.9 478.3 472.0 474.7 479.6 486.7 499.5
10 Business and professional1 388.1 415.9 449.3 443.5 447.1 451.5 454.9 461.1 11 Farm1 32.0 35.0 29.0 28.5 27.6 28.1 31.8 38.4 12 Rental income of persons2 102.5 116.6 122.2 120.6 121.6 120.9 125.8 126.9 13 Dividends 186.8 199.6 214.8 209.5 212.2 215.8 221.7 226.6 14 Personal interest income 647.3 661.6 714.6 701.9 713.9 717.5 725.2 724.2 15 Transfer payments 910.7 956.3 1,022.6 1,002.4 1,016.8 1,029.9 1,041.4 1,063.0 16 Old-age survivors, disability, and health insurance benefits 444.4 472.9 507.4 497.6 505.1 510.7 516.1 529.9
17 LESS: Personal contributions for social insurance 259.6 278.1 294.5 290.2 292.7 296.2 298.8 301.0
18 EQUALS: Personal income 5,479.2 5,750.2 6,101.7 5,995.5 6,061.9 6,135.6 6,213.9 6,288.4
19 LESS: Personal tax and nontax payments 689.9 731.4 794.3 770.0 801.5 798.4 807.2 824.9
20 EQUALS: Disposable personal income 4,789.3 5,018.8 5,307.4 5,225.5 5,260.4 5,337.2 5,406.7 5,463.5
21 LESS: Personal outlays 4,572.9 4,826.5 5,066.7 4,972.2 5,049.0 5,104.6 5,140.9 5,214.7
22 EQUALS: Personal saving 216.4 192.4 240.8 253.3 211.4 232.6 265.8 248.8
MEMO Per capita (chained 1992 dollars)
23 Gross domestic product 24,724.1 25,332.7 25,613.7 25,559.1 25,540.2 25,695.9 25,668.7 25,747.1 24 Personal consumption expenditures 16,807.4 17,150.5 17,402.2 17,280.4 17,391.6 17,465.4 17,477.5 17,592.7 25 Disposable personal income 18,075.0 18,320.0 18,757.0 18,672.0 18,634.0 18,794.0 18,926.0 18,988.0
26 Saving rate (percent) 4.5 3.8 4.5 4.8 4.0 4.4 4.9 4.6
GROSS SAVING
27 Gross saving 938.4 1,055.9 1,141.6 1,110.5 1,092.3 1,155.7 1,207.9 1,207.5
28 Gross private saving 964.5 1,006.0 1,062.5 1,039.9 1,007.3 1,076.1 1,126.6 1,123.6
29 Personal saving 216.4 192.4 240.8 253.3 211.4 232.6 265.8 248.8 30 Undistributed corporate profits1 103.4 120.2 142.5 120.6 122.3 162.0 165.2 178.7 31 Corporate inventory valuation adjustment - 6 . 6 -13 .3 -28.1 -51 .9 -42 .3 - 9 . 3 - 8 . 8 -17 .4
Capital consumption allowances 32 Corporate 417.0 441.0 454.0 444.4 451.3 456.9 463.6 465.6 33 Noncorporate 223.1 237.7 225.2 220.2 222.4 224.7 233.4 229.1
34 Gross government saving -26 .1 49.9 79.1 70.5 85.0 79.6 81.3 83.9 35 Federal -186.5 -119.3 -88 .8 -99 .9 -86 .3 -87 .7 -81 .1 -82.2 36 Consumption of fixed capital 68.2 70.6 73.8 73.5 74.2 73.8 73.8 73.2 37 CuiTent surplus or deficit ( - ) , national accounts -254.7 -189.9 -162.6 -173.3 -160.5 -161.6 -154.9 -155.5 38 State and local 160.5 169.2 167.9 170.4 171.3 167.3 162.4 166.1 39 Consumption of fixed capital 65.6 69.4 72.9 71.4 72.3 73.4 74.3 75.1 40 Current surplus or deficit ( - ) , national accounts 94.9 99.7 95.0 99.0 99.0 93.9 88.1 91.0
41 Gross investment 993.5 1,087.2 1,146.1 1,146.7 1,113.9 1,150.7 1,173.0 1,168.0
42 Gross private domestic investment 871.1 1,014.4 1,065.3 1,072.0 1,050.3 1,074.8 1,064.0 1,068.9 43 Gross government investment 210.6 212.3 221.9 219.1 223.7 224.7 220.1 228.8 44 Net foreign investment -88 .2 -139.6 -141.1 -144.4 -160.1 -148.9 -111 .0 -129.8
45 Statistical discrepancy 55.1 31.3 4.5 36.2 21.6 - 5 . 0 -34 .9 -39 .5
1. With inventory valuation and capital consumption adjustments. SOURCE. U.S. Department of Commerce, Survey of Current Business. 2. With capital consumption adjustment.
Digitized for FRASER http://fraser.stlouisfed.org/ Federal Reserve Bank of St. Louis
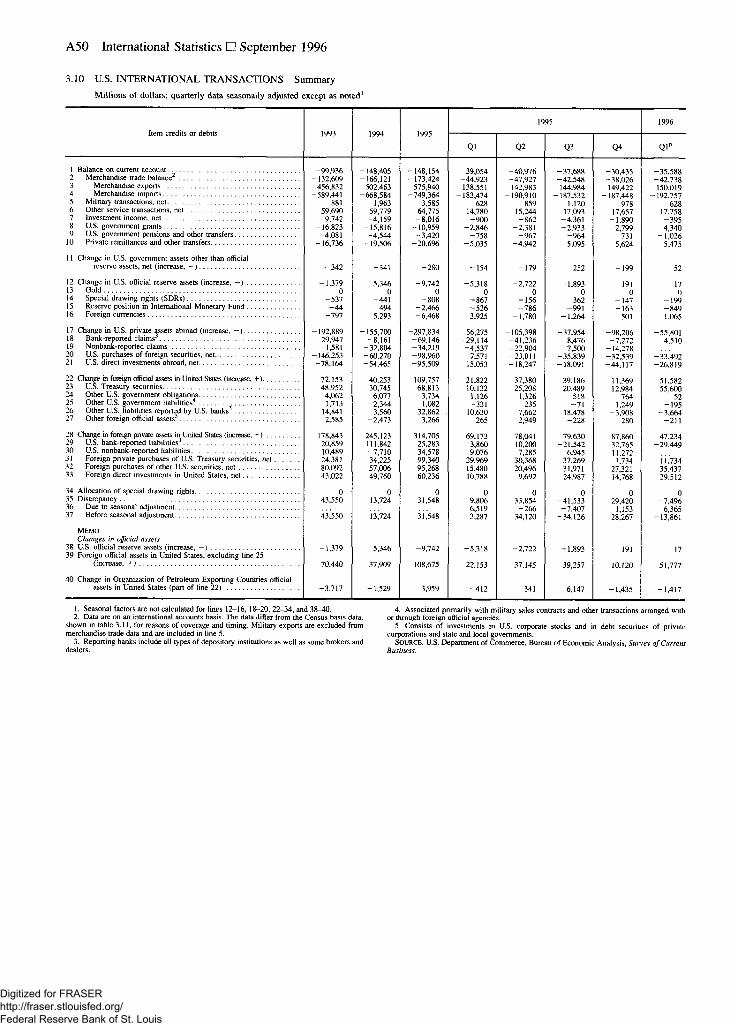
A50 International Statistics • September 1996
3.10 U.S. INTERNATIONAL TRANSACTIONS Summary
Millions of dollars; quarterly data seasonally adjusted except as noted1
1995 1996 1993 1994 1995 1993 1994 1995
Qi Q2 Q3 Q4 Q l p
-99 ,936 -132,609
456,832 -589,441
881 59,690
9,742 -16,823
-4 ,081 -16,736
-148,405 -166,121
502,463 -668,584
1,963 59,779
-4 ,159 -15,816 -4 ,544
-19,506
-148,154 -173,424
575,940 -749,364
3,585 64,775
-8 ,016 -10,959
-3 ,420 -20,696
-39,054 -44 ,923 138,551
-183,474 628
14,780 - 9 0 0
-2 ,846 - 7 5 8
-5 ,035
-40 ,976 -47,927 142,983
-190,910 859
15,244 - 8 6 2
-2 ,381 - 9 6 7
-4 ,942
-37,688 -42,548 144,984
-187,532 1,120
17,093 -4 ,361 -2 ,933
- 9 6 4 -5 ,095
-30,435 -38,026 149,422
-187,448 978
17,657 -1 ,890 -2 ,799
- 7 3 1 -5 ,624
-35,588 -42,738 150,019
-192,757 628
17,758 - 3 9 5
-4 ,340 - 1 , 0 2 6 -5 ,475
- 3 4 2 - 3 4 1 - 2 8 0 - 1 5 4 - 1 7 9 252 - 1 9 9 52
-1 ,379 0
- 5 3 7 - 4 4
- 7 9 7
5,346 0
- 4 4 1 494
5,293
-9 ,742 0
- 8 0 8 -2 ,466 -6 ,468
-5 ,318 0
- 8 6 7 - 5 2 6
-3 ,925
-2 ,722 0
- 1 5 6 - 7 8 6
-1 ,780
-1 ,893 0
362 - 9 9 1
-1 ,264
191 0
- 1 4 7 - 1 6 3
501
17 0
- 1 9 9 - 8 4 9 1,065
-192,889 29,947
1,581 -146,253
-78,164
-155,700 -8 ,161
-32,804 -60,270 -54,465
-297,834 -69 ,146 -34,219 -98 ,960 -95,509
-56,275 -29 ,114
-4 ,537 -7 ,571
-15,053
-105,398 -41 ,236 -22 ,904 -23,011 -18 ,247
-37 ,954 8,476 7,500
-35 ,839 -18,091
-98 ,206 -7 ,272
-14,278 -32,539 -44,117
-55,801 4,510
-33,492 -26 ,819
72,153 48,952
4,062 1,713
14,841 2,585
40,253 30,745 6,077 2,344 3,560
-2 ,473
109,757 68,813
3,734 1,082
32,862 3,266
21,822 10,132
1,126 - 3 3 1
10,630 265
37,380 25,208
1,326 235
7,662 2,949
39,186 20,489
518 - 7 1
18,478 - 2 2 8
11,369 12,984
764 1,249
-3 ,908 280
51,582 55,600
52 - 1 9 5
-3 ,664 - 2 1 1
178,843 20,859 10,489 24,381 80,092 43,022
245,123 111,842 -7 ,710 34,225 57,006 49,760
314,705 25,283 34,578 99,340 95,268 60,236
69,173 3,860 9,076
29,969 15,480 10,788
78,041 10,200 7,285
30,368 20,496
9,692
79,630 -21,542
6,945 37,269 31,971 24,987
87,860 32,765 11,272
1,734 27,321 14,768
47,234 -29 ,449
i 1,734 35,437 29,512
0
43,550
43,550
0
13,724
i 3,724
0
31,548
31,548
0 9,806 6,519 3,287
0 33,854
- 2 6 6 34,120
0 -41,533
-7 ,407 -34 ,126
0 29,420
1,153 28,267
0 -7 ,496
6,365 -13,861
-1 ,379 5,346 -9 ,742 -5 ,318 -2 ,722 -1 ,893 191 17
70,440 37,909 108,675 22,153 37,145 39,257 10,120 51,777
-3 ,717 -1 ,529 3,959 - 4 1 2 - 3 4 1 6,147 -1 ,435 -1 ,417
Item credits or debits
1 Balance on current account 2 Merchandise trade balance2
3 Merchandise exports 4 Merchandise imports 5 Military transactions, net 6 Other service transactions, net 7 Investment income, net 8 U.S. government grants 9 U.S. government pensions and other transfers
10 Private remittances and other transfers
11 Change in U.S. government assets other than official reserve assets, net (increase, - )
12 Change in U.S. official reserve assets (increase, —) 13 Gold 14 Special drawing rights (SDRs) 15 Reserve position in International Monetary Fund 16 Foreign currencies
17 Change in U.S. private assets abroad (increase, - ) 18 Bank-reported claims3
19 Nonbank-reported claims 20 U.S. purchases of foreign securities, net 21 U.S. direct investments abroad, net
22 Change in foreign official assets in United States (increase, +) 23 U.S. Treasury securities 24 Other U.S. government obligations 25 Other U.S. government liabilities4
26 Other US. liabilities reported by U.S. banks3
27 Other foreign official assets5
28 Change in foreign private assets in United States (increase, +) 29 U.S. bank-reported liabilities3
30 U.S. nonbank-reported liabilities 31 Foreign private purchases of U.S. Treasury securities, net 32 Foreign purchases of other U.S. securities, net 33 Foreign direct investments in United States, net
34 Allocation of special drawing rights 35 Discrepancy 36 Due to seasonal adjustment 37 Before seasonal adjustment
MEMO Changes in official assets
38 U.S. official reserve assets (increase, —) 39 Foreign official assets in United States, excluding line 25
(increase, +)
40 Change in Organization of Petroleum Exporting Countries official assets in United States (part of line 22)
1. Seasonal factors are not calculated for lines 12-16, 18-20, 22-34, and 38-40. 2. Data are on an international accounts basis. The data differ from the Census basis data,
shown in table 3.11, for reasons of coverage and timing. Military exports are excluded from merchandise trade data and are included in line 5.
3. Reporting banks include all types of depository institutions as well as some brokers and dealers.
4. Associated primarily with military sales contracts and other transactions arranged with or through foreign official agencies.
5. Consists of investments in U.S. corporate stocks and in debt securities of private corporations and state and local governments.
SOURCE. U.S. Department of Commerce, Bureau of Economic Analysis, Survey of Current Business.
Digitized for FRASER http://fraser.stlouisfed.org/ Federal Reserve Bank of St. Louis

Summary Statistics A51
3.11 U.S. FOREIGN TRADE1
Millions of dollars; monthly data seasonally adjusted
Item 1993 1994 1995 1995 1996
Item 1993 1994 1995 Nov. Dec. Jan. Feb. Mar. Apr. Mayp
1 Goods and services, balance -72,037 -104,381 -105,064 -6,098 -6,399 -9,686 -6,654 -8,012 -9,606 -10,877 2 Merchandise -132,607 -166,123 -173,424 -12,324 -12,601 -15,505 -12,784 -14,450 -15,585 -16,860 3 Services 60,570 61,742 68,360 6,226 6,202 5,819 6,130 6,438 5,979 5,983
4 Goods and services, exports 642,953 698,301 786,529 67,997 68,088 66,493 69,163 69,277 68,990 69,762 5 Merchandise 456,834 502,462 575,939 49,777 50,120 48,645 50,883 50,490 50,740 51,292 6 Services 186,119 195,839 210,590 18,220 17,968 17,848 18,280 18,787 18,250 18,470
7 Goods and services, imports -714,990 -802,682 -891,593 -74,095 -74,487 -76,179 -75,817 -77,289 -78,596 -80,639 8 Merchandise -589,441 -668,585 -749,363 -62,101 -62,721 -64,150 -63,667 -64,940 -66,325 -68,152 9 Services -125,549 -134,097 -142,230 -11,994 -11,766 -12,029 -12,150 -12,349 -12,271 -12,487
1. Data show monthly values consistent with quarterly figures in the U.S. balance of SOURCE. FT900, U.S. Department of Commerce, Bureau of the Census and Bureau of payments accounts. Economic Analysis.
3.12 U.S. RESERVE ASSETS
Millions of dollars, end of period
Asset 1992 1993 1994 1995 1996
Asset 1992 1993 1994 Nov. Dec. Jan. Feb. Mar. Apr. May Junep
1 Total 71,323 73,442 74,335 85,755 85,832 82,717 84,270 84,212 83,710 83,468 83,455
2 Gold stock, including Exchange Stabilization Fund1 11,056 11,053 11,051 11,050 11,050 11,052 11,053 11,053 11,052 11,051 11,050
3 Special drawing rights2'3 8,503 9,039 10,039 11,034 11,037 10,778 11,106 11,049 10,963 11,037 11,046 4 Reserve position in International Monetary
Fund2 11,759 11,818 12,030 14,572 14,649 14,312 14,813 15,249 15,117 15,227 15,282 5 Foreign currencies4 40,005 41,532 41,215 49,099 49,096 46,575 47,298 46,861 46,578 46,153 46,077
1. Gold held "under earmark" at Federal Reserve Banks for foreign and international SDR holdings and reserve positions in the IMF also have been valued on this basis since July accounts is not included in the gold stock of the United States; see table 3.13, line 3. Gold 1974. stock is valued at $42.22 per fine troy ounce. 3. Includes allocations of SDRs by the International Monetary Fund on Jan. 1 of the year
2. Special drawing rights (SDRs) are valued according to a technique adopted by the indicated, as follows: 1970—$867 million; 1971—$717million; 1972—$710million; 1979— International Monetary Fund (IMF) in July 1974. Values are based on a weighted average of $1,139 million; 1980—$1,152 million; 1981—$1,093 million; plus net transactions in SDRs. exchange rates for the currencies of member countries. From July 1974 through December 4. Valued at current market exchange rates. 1980, sixteen currencies were used; since January 1981, five currencies have been used. U.S.
3.13 FOREIGN OFFICIAL ASSETS HELD AT FEDERAL RESERVE BANKS1
Millions of dollars, end of period
Asset 1992 1993 1994 1995 1996
Asset 1992 1993 1994 Nov. Dec. Jan. Feb. Mar. Apr. May Junep
1 Deposits
Held in custody 2 U.S. Treasury securities2
3 Earmarked gold3
205
314,481 13,118
386
379,394 12,327
250
441,866 12,033
194
522,950 11,702
386
522,170 11,702
165
532,776 11,702
209
559,741 11,689
191
573,435 11,590
166
573,924 11,445
160
578,608 11,339
182
572,839 11,296
1. Excludes deposits and U.S. Treasury securities held for international and regional 3. Held in foreign and international accounts and valued at $42.22 per fine troy ounce; not organizations. included in the gold stock of the United States.
2. Marketable U.S. Treasury bills, notes, and bonds and nonmarketable U.S. Treasury securities, in each case measured at face (not market) value.
Digitized for FRASER http://fraser.stlouisfed.org/ Federal Reserve Bank of St. Louis

A52 International Statistics • September 1996
3.15 SELECTED U.S. LIABILITIES TO FOREIGN OFFICIAL INSTITUTIONS
Millions of dollars, end of period
Item 1993 1994 1995 1996
Item 1993 1994 Nov/ Dec/ Jan/ Feb/ Mar/ Apr. Mayp
1 Total1 482,915 520,934 632,860 630,775 644,570 670,229 682,952 687,277 689,773
By type 2 Liabilities reported by banks in the United States2 69,721 73,386 109,646 107,258 103,919 103,242 103,994 111,079 104,993 3 U.S. Treasury bills and certificates3 151,100 139,571 171,366 168,534 173,949 191,188 198,382 186,638 188,321
U.S. Treasury bonds and notes 171,366 168,534 191,188 198,382 186,638 188,321
4 Marketable 212,237 254,059 291,033 293,684 306,299 314,980 319,728 327,981 334,463 5 Nonmarketable4 5,652 6,109 6,449 6,491 6,120 6,159 6,199 6,236 5,898 6 U.S. securities other than U.S. Treasury securities5 44,205 47,809 54,366 54,808 54,283 54,660 54,649 55,343 56,098
By area 7 Europe1 207,034 215,374 228,180 222,314 223,569 231,389 242,589 241,161 244,294 8 Canada 15,285 17,235 19,535 19,473 19,078 18,850 20,846 20,878 21,670 9 Latin America and Caribbean 55,898 41,492 62,474 66,720 70,281 70,497 73,039 71,135 67,799
10 Asia 197,702 236,824 311,638 310,966 320,512 338,999 335,006 341,360 343,418 11 Africa 4,052 4,180 6,086 6,296 6,924 6,574 6,584 7,388 7,173 12 Other countries 2,942 5,827 4,945 5,004 4,204 3,918 4,886 5,353 5,417
1. Includes the Bank for International Settlements. 2. Principally demand deposits, time deposits, bankers acceptances, commercial paper,
negotiable time certificates of deposit, and borrowings under repurchase agreements. 3. Includes nonmarketable certificates of indebtedness and Treasury bills issued to official
institutions of foreign countries. 4. Excludes notes issued to foreign official nonreserve agencies. Includes current value of
zero-coupon Treasury bond issues to foreign governments as follows: Mexico, beginning March 1988, 20-year maturity issue and beginning March 1990, 30-year maturity issue;
Venezuela, beginning December 1990, 30-year maturity issue; Argentina, beginning April 1993, 30-year maturity issue.
5. Debt securities of U.S. government corporations and federally sponsored agencies, and U.S. corporate stocks and bonds.
SOURCE. Based on U.S. Department of the Treasury data and on data reported to the department by banks (including Federal Reserve Banks) and securities dealers in the United States, and on the 1989 benchmark survey of foreign portfolio investment in the United States.
3.16 LIABILITIES TO, AND CLAIMS ON, FOREIGNERS Reported by Banks in the United States1
Payable in Foreign Currencies
Millions of dollars, end of period
Item 1992 1993 1994 1995 1996
Item 1992 1993 1994 June Sept. Dec. Mar.
1 Banks' liabilities 72,796 78,259 89,284 106,621 102,147 112,556 109,620 2 Banks' claims 62,799 62,017 60,689 77,042r 69,48 l r 74,830r 69,522r
3 Deposits 24,240 20,993 19,661 28,909 25.712 22,688 22,220 4 Other claims 38,559 41,024 41,028 48,133r 43,769r 52,142r 47,302r
5 Claims of banks' domestic customers2 4,432 12,854 10,878 10,244 6,624 6,145 6,064
1. Data on claims exclude foreign currencies held by U.S. monetary authorities. 2. Assets owned by customers of the reporting bank located in the United States that represent claims on foreigners held by reporting banks for the accounts of the domestic customers.
Digitized for FRASER http://fraser.stlouisfed.org/ Federal Reserve Bank of St. Louis

Nonbank-Reported Data A53
3.17 LIABILITIES TO FOREIGNERS Reported by Banks in the United States1
Payable in US. dollars
Millions of dollars, end of period
Item 1993 1994 1995
1995 1996 Item 1993 1994 1995
Nov. Dec. Jan. Feb. Mar. Apr. Mayp
B Y HOLDER AND TYPE OF LIABILITY
1 Total, all foreigners 926,672 1,014,808 l,095,568r 1,104,705 l,095,568r l,098,719r l,101,991r l,100,530r 1,100,720 1,096,433
2 Banks' own liabilities 626,919 718,440 749,448r 755,089 749,448r 747,540r 733,oor 729,909r 735,880 723,994 3 Demand deposits 21,569 23,386 24,460 23,114 24,460 22,182 23,507 23,371r 23,958 23,337 4 Time deposits2 175,106 186,512 192,700r 193,719r 192,700' 198,513 192,195r 193,653r 192,179 181,579 5 Other3 111,971 112,984 139,780r 154,280r 139,780r 141,963 149,009r 138,31 r 146,539 144,332 6 Own foreign offices4 318,273 395,558 392,508r 383,976 392,508r 384,882r 368,290r 374,574r 373,204 374,746
7 Banks' custodial liabilities5 299,753 296,368 346,120 349,616 346,120 351,179 368,990 370,621 364,840 372,439 8 U.S. Treasury bills and certificates6 176,739 162,908 197,341 201,845 197,341 203,478 223,395 228,705 217,106 220,802 9 Other negotiable and readily transferable
201,845 197,341 217,106 220,802
instruments7 36,289 42,532 52,246 49,969 52,246 46,973 43,404 40,483 44,823 49,618 10 Other 86,725 90,928 96,533 97,802 96,533 100,728 102,191 101,433 102,911 102,019
11 Nonmonetary international and regional organizations8. . . 10,936 8,606 11,039 9,794 11,039 10,622 11,109r 9,476 11,216 11,914 12 Banks' own liabilities 5,639 8,176 10,347 8,339 10,347 9,628 10,314r 8,558 10,390 11,127 13 Demand deposits 15 29 21 33 21 30 43 16 28 34 14 Time deposits2 2,780 3,298 4,656 3,631 4,656 4,385 3,479 3,527 3,979 3,482 15 Other3 2,844 4,849 5,670 4,675 5,670 5,213 6,792r 5,015 6,383 7,611
16 Banks' custodial liabilities5 5,297 430 692 1,455 692 994 795 918 826 787 17 U.S. Treasury bills and certificates6 4,275 281 350 962 350 764 555 564 426 376 18 Other negotiable and readily transferable
instruments7 1,022 149 341 493 341 230 230 298 400 390 19 Other 0 0 1 0 1 0 10 56 0 21
20 Official institutions9 220,821 212,957 275,792r 281,012 275,792' 277,868 294,430 302,376r 297,717 293,314 21 Banks' own liabilities 64,144 59,935 83,31 r 85,681 83,311r 85,040 84,077 88,537r 91,664 81,961 22 Demand deposits 1,600 1,564 2,098 1,690 2,098 1,522 1,655 1,423 1,679 1,504 23 Time deposits2 21,653 23,511 30,716r 30,597r 30,716r 28,069 29,904r 32,404r 36,487 32,656 24 Other3 40,891 34,860 50,497r 53,394' 50,497r 55,449 52,518r 54,710r 53,498 47,801
25 Banks' custodial liabilities5 156,677 153,022 192,481 195,331 192,481 192,828 210,353 213,839 206,053 211,353 26 U.S. Treasury bills and certificates6 151,100 139,571 168,534 171,366 168,534 173,949 191,188 198,382 186,638 188,321 27 Other negotiable and readily transferable
168,534 171,366 168,534 198,382 186,638 188,321
instruments7 5,482 13,245 23,603 23,610 23,603 18,532 18,138 14,970 19,065 22,661 28 Other 95 206 344 355 344 347 1,027 487 350 371
29 Banks10 592,171 678,367 687,458r 687,285 687,458r 687,259r 670,806r 666,843' 665,596 662,308 30 Banks' own liabilities 478,755 563,466 563,883r 561,985 563,883r 559,030r 541,500r 539,761r 537,533 533,016 31 Unaffiliated foreign banks 160,482 167,908 171,375r 178,009 171,375r 174,148 173,210 165,187r 164,329 158,270 32 Demand deposits 9,718 10,633 11,756 11,232 11,756 10,247 10,948 10,971r 11,453 10,660 33 Time deposits2 105,262 111,171 103,554r 105,266r 103,554r 110,515 104,309 101,117 96,540 89,543 34 Other3 45,502 46,104 56,065r 61,51 LR 56,065r 53,386 57,953 53,099' 56,336 58,067 35 Own foreign offices4 318,273 395,558 392,508r 383,976 392,508r 384,882r 368,290r 374,574r 373,204 374,746
36 Banks' custodial liabilities5 113,416 114,901 123,575 125,300 123,575 128,229 129,306 127,082 128,063 129,292 37 U.S. Treasury bills and certificates6 10,712 11,251 15,869 16,687 15,869 15,992 17,947 15,967 16,801 17,596 38 Other negotiable and readily transferable
16,801 17,596
instruments7 17,020 14,505 13,035 13,070 13,035 13,590 12,094 11,864 10,814 11,738 3 9 Other 85,684 89,145 94,671 95,543 94,671 98,647 99,265 99,251 100,448 99,958
40 Other foreigners 102,744 114,878 121,279r 126,614 121,279r 122,970 125,646 121,835r 126,191 128,897 41 Banks' own liabilities 78,381 86,863 91,907r 99,084 91,907r 93,842 97,110 93,053' 96,293 97,890 42 Demand deposits 10,236 11,160 10,585 10,159 10,585 10,383 10,861 10,961' 10,798 11,139 43 Time deposits2 45,411 48,532 53,774r 54,225 53,774r 55,544 54,503 56,605' 55,173 55,898 44 Other3 22,734 27,171 27,548r 34,700 27,548r 27,915 31,746 25,487 30,322 30,853
45 Banks' custodial liabilities5 24,363 28,015 29,372 27,530 29,372 29,128 28,536 28,782 29,898 31,007 46 U.S. Treasury bills and certificates6 10,652 11,805 12,588 12,830 12,588 12,773 13,705 13,792 13,241 14,509 47 Other negotiable and readily transferable
12,588 13,705 13,241 14,509
instruments7 12,765 14,633 15,267 12,796 15,267 14,621 12,942 13,351 14,544 14,829 48 Other 946 1,577 1,517 1,904 1,517 1,734 1,889 1,639 2,113 1,669
MEMO 49 Negotiable time certificates of deposit in custody for
foreigners 17,567 17,895 9,099 9,837 9,099 10,479 10,544 10,005 8,306 9,284
1. Reporting banks include all types of depository institutions as well as some brokers and dealers. Excludes bonds and notes of maturities longer than one year.
2. Excludes negotiable time certificates of deposit, which are included in "Other negotia-ble and readily transferable instruments."
3. Includes borrowing under repurchase agreements. 4. For U.S. banks, includes amounts owed to own foreign branches and foreign subsidiar-
ies consolidated in quarterly Consolidated Reports of Condition filed with bank regulatory agencies. For agencies, branches, and majority-owned subsidiaries of foreign banks, consists principally of amounts owed to the head office or parent foreign bank, and to foreign branches, agencies, or wholly owned subsidiaries of the head office or parent foreign bank.
5. Financial claims on residents of the United States, other than long-term securities, held by or through reporting banks for foreign customers.
6. Includes nonmarketable certificates of indebtedness and Treasury bills issued to official institutions of foreign countries.
7. Principally bankers acceptances, commercial paper, and negotiable time certificates of deposit.
8. Principally the International Bank for Reconstruction and Development, the Inter-American Development Bank, and the Asian Development Bank. Excludes "holdings of dollars" of the International Monetary Fund.
9. Foreign central banks, foreign central governments, and the Bank for International Settlements.
10. Excludes central banks, which are included in "Official institutions."
Digitized for FRASER http://fraser.stlouisfed.org/ Federal Reserve Bank of St. Louis

A54 International Statistics • September 1996
3.17 LIABILITIES TO FOREIGNERS Reported by Banks in the United States'—Continued
1993 1994 1995
1995 1996
1993 1994 1995
Nov. Dec. Jan. Feb. Mar. Apr. May p
9 2 6 , 6 7 2 1 , 0 1 4 , 8 0 8 L,095,568R 1 , 1 0 4 , 7 0 5 L,095,568 R L,098,719R L,101,991R L,100,530R L,100,720R 1 , 0 9 6 , 4 3 3
9 1 5 , 7 3 6 1 , 0 0 6 , 2 0 2 L,084,529 R 1 , 0 9 4 , 9 1 1 L,084,529 R L,088,097 R L,090,882 R L,091,054R L,089,504 R 1 , 0 8 4 , 5 1 9
377,911 390,710 362,786 384,013 362,786 368,325 374,048 370,58 l r 375,575' 367,874 1,917 3,588 3,537 4,755 3,537 3,437 2,996 2,848 3,477 3,624
28,670 21,877 24,842 28,357 24,842 24,881 27,182 25,584 27,572 25,955 4,517 2,884 2,921 3,418 2,921 2,979 3,861 2,876 2,787 2,645 1,872 1,436 2,831 2,315 2,831 2,421 2,409 1,768 2,203 2,188
40,316 44,361 39,204 40,415 39,204 39,697 41,099 41,332 r 41,354' 39,690 26,685 27,109 24,035 26,798 24,035 25,988 24,695 25,229 24,854 23,950
1,519 1,393 2,011 2,265 2,011 1,998 2,063 1,966 1,714 1,665 11,759 10,885 10,875 10,759 10,875 9,616 12,468 11,475 10,178 11,045 16,096 16,033 13,724 15,317 13,724 11,350 12,173 12,839 12,397 12,578 2,966 2,338 1,394 1,287 1,394 1,067 1,246 1,034 915 828 3,366 2,846 2,761 2,718 2,761 3,055 2,931 2,843 2,529 1,858 2,511 2,726 7,950 8,979 7,950 7,858 9,180 9,321 8,798 7,260
20,496 14,675 10,012 10,809 10,012 11,838 11,589 18,976 19,548 19,010 2,738 3,094 3,245 3,720 3,245 2,555 2,813 2,256 3,943 2,410
41,560 40,515 43,627 41,178 43,627 40,806 42,010 39,083 36,805 37,099 3,227 3,341 4,124 4,010 4,124 4,350 4,559 4,103 4,453 4,669
133,993 163,795 139,127 148,384 139,127 152,654 146,985 144,136r 146,612' 146,385 372 245 177 171 177 163 163 143 145 146
33,331 27,769 26,389 28,358 26,389 21,612 23,626 22,769 25,291 24,869
20,235 24,768 26,373 27,450 26,373 33,012r 32,03 l r 31,500' 31,285' 33,178
362,238 423,830 440,216 436,580 440,216 435,703 422,029 433,703' 431,051' 433,385 14,477 17,203 12,236 13,031 12,236 13,524 11,764 11,985 14,117 11,650 73,820 104,002 94,991 87,719 94,991 96,850 91,203 88,091 85,887' 86,671
8,117 8,424 4,897 6,561 4,897 4,633 4,702 5,035 4,262 4,998 5,301 9,145 23,797 27,364 23,797 22,715 21,761 21,489 20,222' 20,105
193,699 229,599 239,083 240,353 239,083 233,383 227,438 240,605' 239,129' 243,088 3,183 3,127 2,825 2,696 2,825 2,978 2,772 2,815 2,882' 2,867 3,171 4,615 3,666 3,443 3,666 3,505r 3,682r 3,637' 3,790' 3,430
8 33 13 8 8 8 7 7 7 13' 3,430
8 880 875 1,315 1,307 1,315 1,236 1,201 1,274 1,265 1,284
1,207 1,121 1,275 1,210 1,275 1,058 1,075 1,060 1,085 1,073 410 529 481 447 481 500 495 503 516 550
28,019 12,227 24,555 20,993 24,555 23,643 23,899 24,577' 23,330 23,214 4,686 5,217 4,672 5,644 4,672 4,448 4,461 4,402 5,272 4,722 3,582 4,551 4,265 4,287 4,265 4,030 4,166 4,026 3,887' 3,846
929 900 974 916 974 1,025 1,092 962 1,081 1,064 1,611 1,597 1,835 1,912 1,835 1,799 1,726 1,908 1,748 1,757
12,786 13,985 11,810 11,622 11,810 12,662 12,611 13,255 14,244 14,672 6,327 6,700 7,531 7,067 7,531 1,101' 7,974r 8,072' 8,321' 8,386
144,527 154,334 240,740 r 232,222 240,740' 238,175 249,447 241,958' 237,705' 235,906
4,011 10,066 33,750 29,875 33,750 35,733 32,200 24,430 25,861 24,857 10,627 9,844 11,714 11,365 11,714 12,311 12,955 15,513 14,953 14,598 17,132 17,104 20,303r 20,287 20,303 r 20,307 22,286 20,187 18,379' 18,605
1,114 2,338 3,373 3,272 3,373 3,263 3,527 3,990 3,752 3,938 1,986 1,587 2,708 2,485 2,708 2,011 2,349 2,169 2,627 2,374 4,435 5,157 4,073 4,090 4,073 4,348 5,780 5,344 5,450 5,123
61,466 62,981 109,193 105,546 109,193 106,728 113,361 117,325' 111,635' 111,498 4,913 5,124 5,749 r 5,593 5,749' 5,092 5,607 5,875 5,860 5,664 2,035 2,714 3,089 2,880 3,089 2,394 2,366 2,336 2,467' 2,897 6,137 6,466 12,279 12,144 12,279 13,121 13,389 12,158 12,905 13,387
15,822 15,482 15,582 16,238 15,582 14,417 13,491 13,741 14,895 14,234 14,849 15,471 18,927r 18,447 18,927r 18,450 22,136 18,890' 18,921 18,731
6,633 6,524 7,641 7,793 7,641 7,679 7,818 7,089 7,832 7,404 2,208 1,879 2,136 1,907 2,136 1,848 2,375 2,057 2,002 1,873
99 97 104 60 104 99 52 65 114 113 451 433 739 1,206 739 1,217 665 413 1,001
8 745
12 9 10 9 10 11 8 9 1,001
8 16 1,303 1,343 1,797 1,826 1,797 1,774 1,968 1,706 1,904 1,887 2,560 2,763 2,855 2,785 2,855 2,730 2,750 2,839 2,803 2,770
4,192 6,036 6,773 6,853 6,773 5,203 5,509 6,223 6,056 6,772 3,308 5,142 5,644 5,758 5,644 4,326 4,503 5,239 4,896 5,757
884 894 1,129 1,095 1,129 877 1,006 984 1,160 1,015
10,936 8,606 11,039 9,794 11,039 10,622 l l ,109 r 9,476 11,216 11,914 6,851 7,537 9,300 8,470 9,300 9,639 10,075r 7,938 9,932 10,547 3,218 613 893 371 893 349 292 758 422 594
867 456 846 953 846 634 742 780 862 773
AREA
50 Total, all foreigners
51 Foreign countries
52 Europe 53 Austria 54 Belgium and Luxembourg 55 Denmark 56 Finland 57 France 58 Germany 59 Greece 60 Italy 61 Netherlands 62 Norway 63 Portugal 64 Russia 65 Spain 66 Sweden 67 Switzerland 68 Turkey 69 United Kingdom 70 Yugoslavia" 71 Other Europe and other former U.S.S.R.12
72 Canada
73 Latin America and Caribbean 74 Argentina 75 Bahamas 76 Bermuda 77 Brazil 78 British West Indies 79 Chile 80 Colombia 81 Cuba 82 Ecuador 83 Guatemala 84 Jamaica 85 Mexico 86 Netherlands Antilles 87 Panama 88 Peru 89 Uruguay 90 Venezuela 91 Other
92 Asia China
93 People's Republic of China 94 Republic of China (Taiwan) 95 Hong Kong 96 India 97 Indonesia 98 Israel 99 Japan
100 Korea (South) 101 Philippines 102 Thailand 103 Middle Eastern oil-exporting countries13
104 Other
105 Africa 106 Egypt 107 Morocco 108 South Africa 109 Zaire 110 Oil-exporting countries14
111 Other
112 Other 113 Australia 114 Other
115 Nonmonetary international and regional organizations. 116 International15
117 Latin American regional16
118 Other regional17
11. Since December 1992, has excluded Bosnia, Croatia, and Slovenia. 12. Includes the Bank for International Settlements. Since December 1992, has
included all parts of the former U.S.S.R. (except Russia), and Bosnia, Croatia, and Slovenia. 13. Comprises Bahrain, Iran, Iraq, Kuwait, Oman, Qatar, Saudi Arabia, and United Arab
Emirates (Trucial States). 14. Comprises Algeria, Gabon, Libya, and Nigeria.
15. Principally the International Bank for Reconstruction and Development. Excludes "holdings of dollars" of the International Monetary Fund.
16. Principally the Inter-American Development Bank. 17. Asian, African, Middle Eastern, and European regional organizations, except the Bank
for International Settlements, which is included in "Other Europe."
Digitized for FRASER http://fraser.stlouisfed.org/ Federal Reserve Bank of St. Louis

Nonbank-Reported Data A55
3.18 BANKS' OWN CLAIMS ON FOREIGNERS Reported by Banks in the United States1
Payable in U.S. Dollars
Millions of dollars, end of period
Area or country 1993 1994 1995 1995 1996
Area or country 1993 1994 1995 Nov. Dec. Jan. Feb. Mar.r Apr. Mayp
1 Total, all foreigners 488,497 483,242 525,836r 533,891 525,836r 527,317r 520,790r 529,485 524,889 516,734
2 Foreign countries 486,092 478,651 523,905r 532,470 523,905r 525,015r 518,011r 525,671 522,173 513,240
3 Europe 123,741 123,380 130,315r 131,660 130,315r 133,923 138,574 137,465 134,379 133,087 4 Austria 412 692 565 639 565 683 773 792 1,083 1,072 5 Belgium and Luxembourg 6,532 6,738 7,599 10,691 7,599 8,365 8,519 5,778 8,678 8,711 6 Denmark 382 1,129 403 602 403 541 599 398 293 232 7 Finland 594 512 1,055 1,097 1,055 1,397 1,313 1,782 1,305 1,282 8 France 11,822 12,146 14,798r 15,259 14,798r 12,253 13,161 13,740 11,404 11,591 9 Germany 7,724 7,608 8,864 8,431 8,864 8,072 8,774 9,260 8,647 8,003
10 Greece 691 604 449 378 449 555 603 507 622 554 11 Italy 8,834 6,043 5,364 5,390 5,364 5,010 4,838 5,855 5,696 6,166 12 Netherlands 3,063 2,959 5,051 4,909 5,051 4,305 4,722 5,565 6,276 5,548 13 Norway 396 504 665 1,376 665 1,098 1,408 1,016 793 933 14 Portugal 834 938 888 862 888 853 743 773 889 813 15 Russia 2,310 973 660 949 660 678 775 868 741 482 16 Spain 3,717 3,530 2,166 3,191 2,166 3,811 4,041 5,420 5,092 3,158 17 Sweden 4,254 4,098 2,060 2,362 2,060 2,315 2,151 2,056 3,514 2,506 18 Switzerland 6,605 5,746 7,074 5,925 7,074 4,613 4,016 4,841 6,370 8,713 19 Turkey 1,301 878 785 926 785 732 707 810 973 867 20 United Kingdom 62,013 66,846 67,388 66,911 67,388 75,147 78,040 73,191 68,571 69,136 21 Yugoslavia2 473 265 147 237 147 481 118 120 208 204 22 Other Europe and other former U.S.S.R.3 1,784 1,171 4,334 1,525 4,334 3,014 3,273 4,693 3,224 3,116
23 Canada 18,617 18,490 16,095 17,000 16,095 20,068r 18,421r 17,540 21,661 20,485
24 Latin America and Caribbean 225,238 223,523 256,910r 266,635 256,910r 257,146 248,483r 252,727 245,186 237,512 25 Argentina 4,474 5,844 6,439 6,090 6,439 6,185 6,057 6,216 6,187 6,034 26 Bahamas 63,353 66,410 58,770r 60,030 58,770r 60,284 63,240r 65,628 54,251 55,475 27 Bermuda 8,901 8,481 5,111' 8,096 5,111' 5,011 4,742 4,829 5,031 2,993 28 Brazil 11,848 9,583 13,297 12,984r 13,297 13,252 13,915 13,813 14,175 14,190 29 British West Indies 99,319 95,741 123,914 129,468r 123,914 122,759 108,833 113,239 118,599 110,924 30 Chile 3,643 3,820 5,024 4,775 5,024 4,996 4,593 4,559 4,605 4,363 31 Colombia 3,181 4,004 4,550 4,516 4,550 4,622 4,492 4,547 4,518 4,523 32 Cuba 0 0 0 0 0 0 0 0 0 0 33 Ecuador 681 682 825 847 825 841 842 977 959 942 34 Guatemala 288 366 457 424 457 439 461 465 473 460 35 Jamaica 195 258 323 285 323 299 362 332 335 345 36 Mexico 15,879 17,749 18,028 16,829r 18,028 17,114 17,167 16,953 17,071 16,857 37 Netherlands Antilles 2,683 1,396 9,229 12,048 9,229 11,043 12,973 10,902 8,728 8,674 38 Panama 2,894 2,198 3,018 3,049 3,018 2,845 2,820 2,612 2,503 2,397 39 Peru 657 997 1,829 1,577 1,829 1,762 1,928 1,936 2,042 2,348 40 Uruguay 969 503 466 434 466 422 463 623 579 602 41 Venezuela 2,910 1,831 1,661 1,695 1,661 1,575 1,572 1,559 1,376 1,279 42 Other 3,363 3,660 3,363 3,488 3,363 3,697 4,023 3,537 3,754 5,106
43 Asia 111,775 107,079 115,391r 111,438 115,391r 108,989 107,056r 111,390 114,841 115,954 China
44 People's Republic of China 2,271 836 1,023 1,069 1,023 1,014 1,351 2,439 3,405 2,857 45 Republic of China (Taiwan) 2,625 1,448 1,713 1,484 1,713 1,407 1,404 1,729 1,626 1,514 46 Hong Kong 10,828 9,161 12,895 10,713 12,895 13,254 13,867 15,545 15,329 14,738 47 India 589 994 1,846 1,823 1,846 1,864 1,859 1,869 1,787 1,786 48 Indonesia 1,527 1,470 1,678 1,578 1,678 1,458 1,478 1,604 1,526 1,539 49 Israel 826 688 739 728 739 668 683 665 642 615 50 Japan 60,032 59,151 61,308 60,522 61,308 55,897 55,077 52,776 54,657 54,685 51 Korea (South) 7,539 10,286 14,119r 14,115 14,119r 14,501 15,523r 17,362 17,061 17,854 52 Philippines 1,410 662 1,350 789 1,350 814 779 1,202 779 836 53 Thailand 2,170 2,902 2,599r 2,538 2,599r 2,397 3,256 3,060 2,970 3,015 54 Middle Eastern oil-exporting countries4 15,115 13,748 9,639 9,604 9,639 8,053 6,410 7,145 7,252 8,976 55 Other 6,843 5,733 6,482 6,475 6,482 7,662 5,369 5,994 7,807 7,539
56 Africa 3,861 3,050 2,727 2,732 2,727 2,798 2,879 2,884 2,743 2,691 57 Egypt 196 225 210 268 210 208 237 247 225 217 58 Morocco 481 429 514 433 514 514 561 585 594 628 59 South Africa 633 671 465 462 465 483 520 567 493 458 60 Zaire 4 2 1 1 1 1 1 1 1 11 61 Oil-exporting countries5 1,129 856 552 578 552 589 526 516 501 478 62 Other 1,418 867 985 990 985 1,003 1,034 968 929 899
63 Other 2,860 3,129 2,467 3,005 2,467 2,091 2,598 3,665 3,363 3,511 64 Australia 2,037 2,186 1,622 1,969 1,622 1,822 2,243 2,645 2,620 2,333 65 Other 823 943 845 1,036 845 269 355 1,020 743 1,178
66 Nonmonetary international and regional organizations6.. . 2,405 4,591 1,931 1,421 1,931 2,302 2,779 3,814 2,716 3,494
1. Reporting banks include all types of depository institutions as well as some brokers and dealers.
2. Since December 1992, has excluded Bosnia, Croatia, and Slovenia. 3. Includes the Bank for International Settlements. Since December 1992, has included all
parts of the former U.S.S.R. (except Russia), and Bosnia, Croatia, and Slovenia.
4. Comprises Bahrain, Iran, Iraq, Kuwait, Oman, Qatar, Saudi Arabia, and United Arab Emirates (Trucial States).
5. Comprises Algeria, Gabon, Libya, and Nigeria. 6. Excludes the Bank for International Settlements, which is included in "Other Europe."
Digitized for FRASER http://fraser.stlouisfed.org/ Federal Reserve Bank of St. Louis

A56 International Statistics • September 1996
3.19 BANKS' OWN AND DOMESTIC CUSTOMERS' CLAIMS ON FOREIGNERS Reported by Banks in the United States1
Payable in U.S. Dollars
Millions of dollars, end of period
1995 1996 Type of claim Type of claim
Nov. Dec/ Jan/ Feb/ Mar/ Apr. Mayp
1 Total 575,818 599,521 648,603r 648,603 655,376
2 Banks' claims 488,497 483,242 525,836r 533,891 525,836 527,317 520,790 529,485 524,889 516,734 3 Foreign public borrowers 29,228 23,416 22,522 19,368 22,522 23,148 24,383 27,759 25,205 21,753 4 Own foreign offices2 285,510 283,183 303,397r 308,660r 303,397 305,118 295,217 297,601 298,235 300,405 5 Unaffiliated foreign banks 100,865 109,228 98,702r 99,556r 98,702 97,240 98,139 101,654 99,368 96,553 6 Deposits 49,892 59,250 37,343 42,905 37,343 35,520 37,565 41,609 37,411 35,318 / Other 50,973 49,978 61,359r 56,65 lr 61,359 61,720 60,574 60,045 61,957 61,235 8 All other foreigners 72,894 67,415 101,215' 106,307r 101,215 101,811 103,051 102,471 102,081 98,023
9 Claims of banks' domestic customers3 87,321 116,279 122,767 122,767 125,891 10 Deposits 41,734 64,829 58,519 58,519 68,800 11 Negotiable and readily transferable
instruments4 31,186 36,008 44,161 44,161 39,274 12 Outstanding collections and other
31,186 39,274
claims 14,401 15,442 20,087 20,087 17,817
MEMO 13 Customer liability on acceptances 7,920 8,427 8,410 8,410 9,026
14 Dollar deposits in banks abroad, reported by nonbanking business enterprises in the United States5 29,150 32,796 30,717 31,355 30,717 27,830 32,777 33,113 32,309 n.a.
1. For banks' claims, data are monthly; for claims of banks' domestic customers, data are for quarter ending with month indicated.
Reporting banks include all types of depository institution as well as some brokers and dealers.
2. For U.S. banks, includes amounts due from own foreign branches and foreign subsidiar-ies consolidated in quarterly Consolidated Reports of Condition filed with bank regulatory agencies. For agencies, branches, and majority-owned subsidiaries of foreign banks, consists
principally of amounts due from the head office or parent foreign bank, and from foreign branches, agencies, or wholly owned subsidiaries of the head office or parent foreign bank.
3. Assets held by reporting banks in the accounts of their domestic customers. 4. Principally negotiable time certificates of deposit, bankers acceptances, and commercial
paper. 5. Includes demand and time deposits and negotiable and nonnegotiable certificates of
deposit denominated in U.S. dollars issued by banks abroad.
3.20 BANKS' OWN CLAIMS ON UNAFFILIATED FOREIGNERS Reported by Banks in the United States1
Payable in U.S. Dollars
Millions of dollars, end of period
Maturity, by borrower and area2 1992 1993 1994 1995 1996
Maturity, by borrower and area2 1992 1993 1994 June Sept. Dec. Mar.
1 Total 195,119 202,566 200,042 220,289 216,966 222,338 231,746
By borrower 2 Maturity of one year or less 163,325 172,662 168,331 186,312 178,666 176,172r 191,958 3 Foreign public borrowers 17,813 17,828 15,435 15,822 14,192 15,015 19,569 4 All other foreigners 145,512 154,834 152,896 170,490 164,474 161,157r 172,389 5 Maturity of more than one year 31,794 29,904 31,711 33,977 38,300 46,166r 39,788 6 Foreign public borrowers 13,266 10,874 7,838 7,892 8,220 7,506 8,110 7 All other foreigners 18,528 19,030 23,873 26,085 30,080 38,660r 31,678
By area Maturity of one year or less
8 Europe 53,300 57,413 55,742 60,323 52,045 53,897 56,656 9 Canada 6,091 7,727 6,690 7,838 7,135 6,089 4,973
10 Latin America and Caribbean 50,376 60,490 58,877 68,630 71,319 72,393r 84,297 11 Asia 45,709 41,418 39,851 43,945 42,536 40,133 40,332 12 Africa 1,784 1,820 1,376 1,447 1,261 l,271r 1,302 13 Allother3 6,065 3,794 5,795 4,129 4,370 2,389 4,398
Maturity of more than one year 14 Europe 5,367 5,310 4,203 4,240 4,594 4,885 6,827 15 Canada 3,287 2,581 3,505 3,685 3,571 2,731 2,563 16 Latin America and Caribbean 15,312 14,025 15,717 17,557 20,224 27,81 lr 19,532 17 Asia 5,038 5,606 5,318 6,058 7,373 8,023 8,461 18 Africa 2,380 1,935 1,583 1,389 1,389 1,430' 1,474 19 All other3 410 447 1,385 1,048 1,149 1,286 931
1. Reporting banks include all types of depository institutions as well as some brokers and 2. Maturity is time remaining until maturity, dealers. 3. Includes nonmonetary international and regional organizations.
Digitized for FRASER http://fraser.stlouisfed.org/ Federal Reserve Bank of St. Louis

Bank-Reported Data A57
3.21 CLAIMS ON FOREIGN COUNTRIES Held by U.S. and Foreign Offices of U.S. Banks1
Billions of dollars, end of period
Area or country 1992 1993 1994 1995 1996
Area or country 1992 1993 Mar. June Sept. Dec. Mar. June Sept. Dec. Mar.p
1 Total 344.7 407.7 475.7 484.8 485.7 495.6 540.9 525.0 526.3 549.2r 568.8
2 G-10 countries and Switzerland 131.3 161.8 177.8 172.4 182.2 189.9 210.1 201.6 196.6 203.7 201.3 3 Belgium and Luxembourg .0 7.4 7.9 8.6 9.6 7.0 10.2 9.4 10.7 13.5 10.5 4 France 15.3 12.0 16.6 18.6 20.7 19.1 19.8 19.3 17.4 19.2 17.9 5 Germany 9.1 12.6 29.7 24.7 24.0 24.7 31.2 29.8 27.2 26.8 31.5 6 Italy 6.5 7.7 15.6 14.0 11.6 11.8 10.6 10.7 12.6 11.5 13.1 7 Netherlands .0 4.7 3.8 3.4 3.4 3.6 3.5 4.3 4.1 3.4 3.0 8 Sweden 2.3 2.7 2.9 3.0 2.6 2.7 3.1 3.0 2.7 2.7 3.2 9 Switzerland 4.8 5.9 4.5 5.4 5.5 5.1 5.7 6.2 6.3 6.3 5.2
10 United Kingdom 59.7 84.3 69.4 64.0 78.1 85.2 89.4 85.9 79.8 82.4 84.8 11 Canada 6.3 6.9 7.8 9.9 10.2 10.0 10.5 11.1 11.9 9.4 9.2 12 Japan 18.8 17.6 19.6 20.7 16.5 20.7 25.9 22.1 24.0 28.5 22.9
13 Other industrialized countries 24.0 25.6 42.0 42.5 42.5 45.0 43.9 43.1 50.0 50.0 60.7 14 Austria 1.2 .4 1.0 1.0 1.0 1.1 .9 .7 1.2 .9 1.2 15 Denmark .9 1.0 1.0 1.1 .9 1.3 1.7 1.1 1.8 2.6 3.1 16 Finland .7 .4 1.0 .8 .8 .9 1.1 .5 .7 .8 .7 17 Greece 3.0 3.2 3.7 4.6 4.2 4.4 4.8 4.9 5.0 5.6 5.5 18 Norway 1.2 1.7 1.6 1.6 1.6 2.0 2.4 1.8 2.3 3.2 2.1 19 Portugal .4 .8 1.2 1.1 1.0 1.2 1.0 1.2 1.9 1.3 1.6 20 Spain 8.9 9.9 13.2 12.6 14.0 13.6 14.1 13.3 13.3 11.6 17.5 21 Turkey 1.3 2.1 2.4 2.1 1.8 1.6 1.4 1.4 1.9 1.8 1.9 22 Other Western Europe 1.7 2.6 3.1 2.8 1.0 2.7 2.5 2.6 3.0 4.7 3.8 23 South Africa 1.7 1.1 1.2 1.2 1.2 1.0 1.5 1.4 1.3 1.2 1.7 24 Australia 2.9 2.3 12.7 13.7 15.0 15.4 12.6 14.3 17.4 16.4 21.7
25 OPEC2 15.8 17.4 22.9 21.6 21.6 23.8 19.5 20.2 22.4 22.1 21.1 26 Ecuador .6 .5 .6 .5 .4 .5 .5 .7 .7 .7 .8 27 Venezuela 5.2 5.1 4.6 4.4 3.9 3.7 3.5 3.5 3.0 2.7 2.9 28 Indonesia 2.7 3.3 3.4 3.2 3.3 3.8 4.0 4.1 4.4 4.8 4.7 29 Middle East countries 6.2 7.4 13.2 12.4 13.0 15.0 10.7 11.4 13.6 13.3 12.3 30 African countries 1.1 1.2 1.1 1.1 1.1 .8 .7 .5 .6 .6 .5
31 Non-OPEC developing countries 72.6 83.1 94.5 94.7 93.1 95.9 98.4 103.6 104.0 112.5 116.2
Latin America 32 Argentina 6.6 7.7 8.7 9.8 10.5 11.2 11.4 12.3 10.9 12.9 12.7 33 Brazil 10.8 12.0 12.7 12.0 9.3 8.4 9.2 9.9 13.6 13.7 17.2 34 Chile 4.4 4.7 5.1 5.1 5.5 6.1 6.4 7.1 6.4 6.8 6.4 35 Colombia 1.8 2.1 2.1 2.4 2.4 2.6 2.6 2.6 2.9 2.9 2.9 36 Mexico 16.0 17.8 19.0 18.6 19.8 18.4 17.8 17.6 16.3 17.3 16.1 37 .5 .4 .6 .6 .6 .5 .6 .8 .7 .8 .9 38 Other 2.6 3.1 2.9 2.7 2.8 2.7 2.4 2.6 2.6 2.8 3.1
Asia China
39 People's Republic of China .7 2.0 .8 .8 1.0 1.1 1.1 1.4 1.7 1.8 3.3 40 Republic of China (Taiwan) 5.2 7.3 7.6 7.1 6.9 9.2 8.5 9.0 9.0 9.4 9.7 41 3.2 3.2 3.4 3.7 3.9 4.2 3.8 4.0 4.4 4.4 4.7 42 .4 .5 .4 .4 .4 .4 .6 .7 .5 .5 .5 43 Korea (South) 6.6 6.7 14.1 14.3 14.4 16.2 16.9 18.7 18.0 19.1 19.4 44 Malaysia 3.1 4.4 5.2 5.2 3.9 3.1 3.9 4.1 4.3 4.4 4.7 45 Philippines 3.6 3.1 3.4 3.2 2.9 3.3 3.0 3.6 3.3 4.1 3.9 46 Thailand 2.2 3.1 3.0 3.3 3.5 2.1 3.3 3.8 3.9 4.9 5.2 47 Other Asia 3.1 3.1 3.1 3.2 3.4 4.7 4.9 3.5 3.7 4.5 4.3
Africa 48 Egypt .2 .4 .3 .4 .3 .3 .4 .4 .4 .4 .2 49 Morocco .6 .7 .8 .7 .7 .6 .6 .9 .8 .7 .7 50 .0 .0 .0 .0 .0 .0 .0 .0 .0 .0 .0 51 Other Africa3 1.0 .8 1.1 1.0 .9 .8 .7 .6 .7 .9 .7
52 Eastern Europe 3.1 3.2 3.8 3.2 3.0 2.7 2.3 1.8 3.4 4.2 6.2 53 Russia4 1.9 1.6 1.6 1.3 1.1 .8 .7 .4 .6 1.0 1.4 54 Yugoslavia5 .6 .6 .5 .5 .5 .5 .4 .3 .4 .3 .3 55 Other .6 .9 1.6 1.4 1.5 1.4 1.2 1.0 2.3 2.8 4.5
56 Offshore banking centers 58.1 73.0 78.5 80.5 77.1 71.3 84.3 82.1 85.9 99.0r 100.2 57 Bahamas 6.9 10.9 13.7 13.3 13.8 10.3 12.5 8.4 12.6 11.0r 13.4 58 Bermuda 6.2 8.9 8.8 6.5 6.0 8.4 8.6 8.3 6.1 6.3 5.3 59 Cayman Islands and other British West Indies 21.5 18.0 17.8 23.8 21.5 19.9 19.4 23.7 23.4 32.1 28.5 60 Netherlands Antilles 1.1 2.6 3.4 2.5 1.7 1.3 .9 2.4 5.5 9.9 10.7 61 Panama6 1.9 2.4 2.0 2.0 1.8 1.3 1.1 1.3 1.2 1.4 1.1 62 Lebanon .1 .1 .1 .1 .1 .1 .1 .1 .1 .1 .1 63 Hong Kong 13.9 18.7 19.7 21.8 20.3 19.9 22.4 23.1 23.7 25.1 25.6 64 Singapore 6.5 11.2 13.0 10.6 11.8 10.1 19.1 14.8 13.3 13.1 15.4 65 Other' .0 .1 .0 .0 .0 .1 .0 .0 .1 .1 .1
66 Miscellaneous and unallocated8 39.7 43.4 55.9 69.6 65.7 66.6 82.2 72.3 63.9 57.4 62.5
1. The banking offices covered by these data include U.S. offices and foreign branches of U.S. banks, including U.S. banks that are subsidiaries of foreign banks. Offices not covered include U.S. agencies and branches of foreign banks. Beginning March 1994, the data include large foreign subsidiaries of U.S. banks. The data also include other types of U.S. depository institutions as well as some types of brokers and dealers. To eliminate duplication, the data are adjusted to exclude the claims on foreign branches held by a U.S. office or another foreign branch of the same banking institution.
These data are on a gross claims basis and do not necessarily reflect the ultimate country risk or exposure of U.S. banks. More complete data on the country risk exposure of U.S. banks are available in the quarterly Country Exposure Lending Survey published by the Federal Financial Institutions Examination Council.
2. Organization of Petroleum Exporting Countries, shown individually; other members of OPEC (Algeria, Gabon, Iran, Iraq, Kuwait, Libya, Nigeria, Qatar, Saudi Arabia, and United Arab Emirates); and Bahrain and Oman (not formally members of OPEC).
3. Excludes Liberia. Beginning March 1994 includes Namibia. 4. As of December 1992, excludes other republics of the former Soviet Union. 5. As of December 1992, excludes Croatia, Bosnia and Hercegovinia, and Slovenia. 6. Includes Canal Zone. 7. Foreign branch claims only. 8. Includes New Zealand, Liberia, and international and regional organizations.
Digitized for FRASER http://fraser.stlouisfed.org/ Federal Reserve Bank of St. Louis

A58 International Statistics • September 1996
3.22 LIABILITIES TO UNAFFILIATED FOREIGNERS Reported by Nonbanking Business Enterprises in the United States
Millions of dollars, end of period
Type of liability, and area or country 1992 1993 1994 1994 1995 1996
Type of liability, and area or country 1992 1993 1994 Dec. Mar. June Sept. Dec. Mar.p
1 Total 45,511 50,597 54,309 54,309 50,187 49,973 47,673 46,448r 49,608
2 Payable in dollars 37,456 38,728 38,298 38,298 35,903 34,281 33,908 33,903r 36,314 3 Payable in foreign currencies 8,055 11,869 16,011 16,011 14,284 15,692 13,765 12,545 13,294
By type 4 Financial liabilities 23,841 29,226 32,954 32,954 29,775 29,282 26,237 24,24 l r 26,225 5 Payable in dollars 16,960 18,545 18,818 18,818 16,704 15,028 13,872 12,903r 13,826 6 Payable in foreign currencies 6,881 10,681 14,136 14,136 13,071 14,254 12,365 11,338 12,399
7 Commercial liabilities 21,670 21,371 21,355 21,355 20,412 20,691 21,436 22,207 23,383 8 Trade payables 9,566 8,802 10,005 10,005 9,844 10,527 10,061 11,013 10,815 9 Advance receipts and other liabilities 12,104 12,569 11,350 11,350 10,568 10,164 11,375 11,194 12,568
10 Payable in dollars 20,496 20,183 19,480 19,480 19,199 19,253 20,036 21,000 22,488 11 Payable in foreign currencies 1,174 1,188 1,875 1,875 1,213 1,438 1,400 1,207 895
By area or country Financial liabilities
12 Europe 13,387 18,810 21,703 21,703 17,541 18,223 16,401 15,622 16,605 13 Belgium and Luxembourg 414 175 495 495 612 778 347 369 483 14 France 1,623 2,539 1,727 1,727 2,046 1,101 1,365 999 1,679 15 Germany 889 975 1,961 1,961 1,755 1,589 1,670 1,974 2,161 16 Netherlands 606 534 552 552 633 530 474 466 479 17 Switzerland 569 634 688 688 883 1,056 948 895 957 18 United Kingdom 8,610 13,332 15,543 15,543 10,764 12,138 10,518 10,138 10,241
19 Canada 544 859 629 629 1,817 893 797 632 1,166
20 Latin America and Caribbean 4,053 3,359 2,034 2,034 2,065 1,950 1,904 l,783r 1,876 21 Bahamas 379 1,148 101 101 135 81 79 59r 78 22 Bermuda 114 0 80 80 149 138 144 147r 126 23 Brazil 19 18 207 207 58 58 111 57 57 24 British West Indies 2,850 1,533 998 998 1,068 1,030 930 866r 946 25 Mexico 12 17 0 0 10 3 3 12 16 26 Venezuela 6 5 5 5 5 4 3 2 2
27 5,818 5,956 8,403 8,403 8,156 8,023 6,947 5,988 6,390 28 Japan 4,750 4,887 7,314 7,314 7,182 7,141 6,308 5,436 5,980 29 Middle Eastern oil-exporting countries' 19 23 35 35 27 25 25 27 26
30 Africa 6 133 135 135 156 151 149 150 131 31 Oil-exporting countries2 0 123 123 123 122 122 122 122 122
32 All other3 33 109 50 50 40 42 39 66 57
Commercial liabilities 33 Europe 7,398 6,827 6,773 6,773 6,642 6,776 7,263 7,700 8,444 34 Belgium and Luxembourg 298 239 241 241 271 311 349 331 370 35 France 700 655 728 728 642 504 528 481 648 3b Germany 729 684 604 604 482 556 660 767 870 37 Netherlands 535 688 722 722 536 448 566 500 659 38 Switzerland 350 375 327 327 327 432 255 413 432 39 United Kingdom 2,505 2,039 2,444 2,444 2,848 2,902 3,351 3,568 3,525
40 Canada 1,002 879 1,037 1,037 1,235 1,146 1,219 1,040 960
41 Latin America and Caribbean 1,533 1,658 1,857 1,857 1,368 8
1,836 1,607 1
1,740 1
2.114 42 Bahamas 3 21 19 19
1,368 8 3
1,607 1
1,740 1 28
43 Bermuda 307 350 345 345 260 397 219 205 570 44 Brazil 209 214 161 161 96 107 143 98 129 45 British West Indies 33 27 23 23 29 12 5 56 10 46 Mexico 457 481 574 574 356 420 357 416 470 47 Venezuela 142 123 276 276 273 204 175 221 243
48 10,594 10,980 10,741 10,741 10,151 9,978 10,275 10,421 10,496 49 Japan 3,612 4,314 4,555 4,555 4,110 3,531 3,475 3,315 3,726 50 Middle Eastern oil-exporting countries1 1,889 1,534 1,576 1,576 1,787 1,790 1,647 1,912 1,747
51 Africa 568 453 428 428 463 481 589 619 708 52 Oil-exporting countries2 309 167 256 256 248 252 241 254 254
53 Other3 575 574 519 519 553 474 483 687 661
1. Comprises Bahrain, Iran, Iraq, Kuwait, Oman, Qatar, Saudi Arabia, and United Arab 2. Comprises Algeria, Gabon, Libya, and Nigeria. Emirates (Trucial States). 3. Includes nonmonetary international and regional organizations.
Digitized for FRASER http://fraser.stlouisfed.org/ Federal Reserve Bank of St. Louis

Nonbank-Reported Data A59
3.23 CLAIMS ON UNAFFILIATED FOREIGNERS Reported by Nonbanking Business Enterprises in the United States
Millions of dollars, end of period
Type of claim, and area or country 1992 1993 1994 1994 1995 1996
Type of claim, and area or country 1992 1993 1994 Dec. Mar. June Sept. Dec. Mar.p
1 Total 45,073 49,159 57,888 57,888 52,218 58,051 53,424 52,509r 55,398
2 Payable in dollars 42,281 45,161 53,805 53,805 48,425 54,138 49,696 48,71 r 50,999 3 Payable in foreign currencies 2,792 3,998 4,083 4,083 3,793 3,913 3,728 3,798r 4,399
By type 4 Financial claims 26,509 27,771 33,897 33,897 29,606 34,574 29,891 27,398 30,810 5 Deposits 17,695 15,717 18,507 18,507 17,115 22,046 17,974 15,133 17,595 6 Payable in dollars 16,872 15,182 18,026 18,026 16,458 21,351 17,393 14,654 17,044 7 Payable in foreign currencies 823 535 481 481 657 695 581 479 551 8 Other financial claims 8,814 12,054 15,390 15,390 12,491 12,528 11,917 12,265 13,215 9 Payable in dollars 7,890 10,862 14,306 14,306 11,275 11,370 10,689 10,976 11,328
10 Payable in foreign currencies 924 1,192 1,084 1,084 1,216 1,158 1,228 1,289 1,887
11 Commercial claims 18,564 21,388 23,991 23,991 22,612 23,477 23,533 25 , l l l r 24,588 12 Trade receivables 16,007 18,425 21,158 21,158 20,415 21,326 21,409 22,998r 22,077 13 Advance payments and other claims 2,557 2,963 2,833 2,833 2,197 2,151 2,124 2,113r 2,511
14 Payable in dollars 17,519 19,117 21,473 21,473 20,692 21,417 21,614 23,08 r 22,627 15 Payable in foreign currencies 1,045 2,271 2,518 2,518 1,920 2,060 1,919 2,030r 1,961
By area or country Financial claims
16 Europe 9,331 7,299 7,936 7,936 7,630 7,927 7,840 7,609 8,929 17 Belgium and Luxembourg 8 134 86 86 146 155 160 193 159 18 France 764 826 800 800 808 730 753 803 1,015 19 Germany 326 526 540 540 527 356 301 436 320 20 Netherlands 515 502 429 429 606 601 522 517 486 21 Switzerland 490 530 523 523 490 514 530 498 470 22 United Kingdom 6,252 3,585 4,649 4,649 4,040 4,790 4,924 4,303 5,568
23 Canada 1,833 2,032 3,581 3,581 3,848 3,705 3,526 2,851 5,269
24 Latin America and Caribbean 13,893 16,224 19,536 19,536 16,109 21,159 15,345 14,500 13,865 25 Bahamas 778 1,336 2,424 2,424 940 2,355 1,552 1,965 1,588 26 Bermuda 40 125 27 27 37 85 35 81 77 27 Brazil 686 654 520 520 528 502 851 830 1,943 28 British West Indies 11,747 12,699 15,228 15,228 13,531 17,013 11,816 10,393 9,164 29 Mexico 445 872 723 723 583 635 487 554 461 30 Venezuela 29 161 35 35 27 27 50 32 40
31 Asia 864 1,657 1,871 1,871 1,504 1,235 2,160 1,579 1,890 32 Japan 668 892 953 953 621 471 1,404 871 1,171 33 Middle Eastern oil-exporting countries' 3 3 141 141 4 3 4 3 13
34 Africa 83 99 373 373 141 138 188 276 277 35 Oil-exporting countries2 9 1 0 0 9 9 6 5 5
36 All other3 505 460 600 600 374 410 832 583 580
Commercial claims 37 Europe 8,451 9,105 9,540 9,540 8,947 9,200 8,862 9,824r 9,757 38 Belgium and Luxembourg 189 184 213 213 199 218 224 231 247 39 France 1,537 1,947 1,881 1,881 1,790 1,669 1.706 1,830 1,803 40 Germany 933 1,018 1,027 1,027 977 1,023 997 1,070 1,407 41 Netherlands 552 423 311 311 324 341 338 452 442 42 Switzerland 362 432 557 557 556 612 438 520 575 43 United Kingdom 2,094 2,377 2,556 2,556 2,388 2,469 2,479 2,656r 2,607
44 Canada 1,286 1,781 1,988 1,988 2,010 2,003 1,971 1,951r 2,044
45 Latin America and Caribbean 3,043 3,274 4,117 4,117 4,140 4,370 4,359 4,364r 4,147 46 Bahamas 28 11 9 9 17 21 26 30 30 47 Bermuda 255 182 234 234 208 210 245 272 273 48 Brazil 357 460 612 612 695 777 745 898r 808 49 British West Indies 40 71 83 83 55 83 66 79 106 50 Mexico 924 990 1,243 1,243 1,106 1,109 1,026 993r 868 51 Venezuela 345 293 348 348 295 319 325 285 308
52 Asia 4,866 6,014 6,982 6,982 6,200 6,516 6,826 7,312r 7,078 53 Japan 1,903 2,275 2,655 2,655 1,911 2,011 1,998 l,870r 2,009 54 Middle Eastern oil-exporting countries' 693 704 708 708 689 707 775 974 1,024
55 Africa 554 493 454 454 468 478 544 654 667 56 Oil-exporting countries 78 72 67 67 71 60 74 87 107
57 Other3 364 721 910 910 847 910 971 l,006r 895
1. Comprises Bahrain, Iran, Iraq, Kuwait, Oman, Qatar, Saudi Arabia, and United Arab 2. Comprises Algeria, Gabon, Libya, and Nigeria. Emirates (Trucial States). 3. Includes nonmonetary international and regional organizations.
Digitized for FRASER http://fraser.stlouisfed.org/ Federal Reserve Bank of St. Louis

A60 International Statistics • September 1996
3.24 FOREIGN TRANSACTIONS IN SECURITIES
Millions of dollars
1996 1995 1996
Transaction, and area or country 1994 1995R
Jan.-May Nov. Dec/ Jan.r Feb/ Mar.r Apr. Mayp
U.S. corporate securities
STOCKS
1 Foreign purchases 3 5 0 , 5 9 3 4 6 2 , 9 5 0 2 5 9 , 9 8 7 42,003 R 4 6 , 4 7 9 4 3 , 5 7 4 5 2 , 2 6 0 55 ,281 5 3 , 0 4 7 5 5 , 8 2 5 2 Foreign sales 3 4 8 , 7 1 6 4 5 1 , 7 1 0 2 5 0 , 7 4 7 39 ,071 4 4 , 3 7 2 4 1 , 9 4 8 5 1 , 0 8 3 5 4 , 4 5 0 4 8 , 7 7 4 5 4 , 4 9 2
3 Net purchases, or sales (—) 1,877 11,240 9,240 2,932r 2,107 1,626 1,177 831 4,273 1,333
4 Foreign countries 1,867 11,445 9,263 2,943r 2,109 1,623 1,306 877 4,129 1,328
5 Europe 6 , 7 1 4 4 , 9 1 2 3 , 3 4 0 l ,020R 1,028 1 ,954 - 1 , 0 7 2 1,377 1 ,429 - 3 4 8 6 France - 2 0 1 - 1 , 0 9 9 17 - 5 8 - 3 8 2 164 - 1 6 1 6 6 1 - 3 3 6 - 3 1 1 V Germany 2 , 1 1 0 - 1 , 8 3 7 4 2 5 - 1 3 1 - 1 1 2 3 9 - 3 7 8 6 174 - 3 7 8 Netherlands 2 , 2 5 1 3 ,507 1 ,070 2 3 0 3 7 3 6 6 0 2 0 2 0 8 2 3 7 - 5 5 9 Switzerland - 3 0 - 2 , 2 8 3 1 ,299 227 191 6 3 9 - 4 4 1 5 6 6 6 1 8 - 8 3
10 United Kingdom 8 4 0 8 , 0 6 6 3 4 609R 1,277 - 1 6 5 - 2 2 3 - 2 4 1 3 4 5 318 11 Canada - 1 , 1 6 0 - 1 , 5 1 7 7 2 4 4 0 5 - 1 7 5 6 4 5 5 1 8 - 9 0 5 2 - 4 0 1 12 Latin America and Caribbean - 2 , 1 1 1 5 , 8 1 4 3 , 9 0 6 1,361 2 1 9 - 4 8 7 2 , 6 9 4 - 3 1 8 808 1 ,209 13 Middle East1
- 1 , 1 4 2 - 3 3 7 - 1 , 0 6 9 - 6 3 148 - 5 0 7 - 2 8 5 - 3 3 - 6 - 2 3 8 14 Other Asia - 1 , 2 3 4 2 , 5 0 3 2 ,388 3 4 2 8 8 3 - 4 0 - 3 3 6 - 2 9 1 1 ,852 1 ,203 15 Japan 1,162 - 2 , 7 2 5 691 - 4 0 6 1,231 9 4 - 1 3 1 - 7 4 9 1 ,446 31 16 Africa 29 2 - 6 3 - 2 6 - 1 6 - 6 2 - 4 4 31 6 1 / Other countries 771 68 37 - 9 6 7 5 2 - 1 5 1 2 7 6 - 3 7 - 1 0 3
18 Nonmonetary international and regional organizations 10 - 2 0 5 - 2 3 - 1 1 - 2 3 - 1 2 9 - 4 6 144 5
BONDS2
19 Foreign purchases 2 8 9 , 5 8 6 2 9 3 , 5 3 3 157 ,617 3 1 , 6 4 2 2 2 , 0 2 0 2 6 , 5 9 8 3 2 , 7 5 9 3 9 , 8 0 8 2 4 , 1 0 7 3 4 , 3 4 5 2 0 Foreign sales 2 2 9 , 6 6 5 206 ,951 108 ,783 20 ,741 2 1 , 1 1 7 17 ,726 2 3 , 6 0 8 2 5 , 1 1 3 18 ,693 2 3 , 6 4 3
21 Net purchases, or sales (—) 59,921 86,582 48,834 10,901 903 8,872 9,151 14,695 5,414 10,702
22 Foreign countries 59,036 87,036 48,747 10,948 875 8,830 9,230 14,607 5,383 10,697
2 3 Europe 3 7 , 0 6 5 7 0 , 3 1 8 3 2 , 2 0 2 9 , 7 5 9 1,631 5 , 6 3 1 8 ,968 6 , 4 7 6 3 ,947 7 , 1 8 0 24 France 2 4 2 1,143 2 ,721 101 137 8 3 9 3 1 4 6 7 0 7 8 5 113 25 Germany 6 5 7 5 ,938 3 , 7 9 9 8 9 4 2 3 6 - 2 6 1 ,859 4 6 7 721 7 7 8 26 Netherlands 3 , 3 2 2 1,463 7 7 7 2 1 9 101 163 3 6 5 - 6 6 - 5 2 3 6 7
2 8 8 2 / Switzerland 1,055 4 9 4 7 6 101 - 3 8 1 5 6 - 8 6 - 3 8 - 1 4 4 3 6 7 2 8 8
2 8 United Kingdom 3 1 , 6 4 2 57 ,591 2 1 , 4 1 9 6 , 9 9 9 1,247 3 , 8 5 4 6 , 2 8 0 4 , 7 4 5 2 , 2 6 4 4 , 2 7 6 2 9 Canada 2 , 9 5 8 2 , 5 6 9 1 ,749 2 0 181 104 2 3 5 149 3 5 9 9 0 2 3 0 Latin America and Caribbean 5 , 4 4 2 6 ,141 9 , 7 7 8 1 ,426 - 8 4 8 2 , 0 9 6 - 7 1 3 7 , 1 4 0 33 1 ,222 31 Middle East1
771 1 ,869 - 2 6 4 188 187 - 1 9 4 - 3 3 4 13 122 129 32 Other Asia 12 ,153 5 , 6 5 9 5 , 6 3 9 - 7 0 5 - 2 9 3 1 ,272 1,161 831 1,085 1 , 2 9 0 33 Japan 5 , 4 8 6 2 , 2 5 0 1,578 - 8 9 9 - 9 0 4 3 3 8 3 3 6 2 4 5 126 5 3 3 34 Africa - 7 2 3 4 137 2 4 0 86 - 1 6 - 4 0 37 4 9 107 35 Other countries 6 5 4 2 4 6 - 4 9 4 2 0 - 6 9 - 6 3 - 4 7 - 3 9 - 2 1 2 - 1 3 3
3 6 Nonmonetary international and regional organizations 885 - 4 5 4 87 - 4 7 28 42 - 7 9 88 31 5
Foreign securities
37 Stocks, net purchases, or sales (—) - 4 8 , 0 7 1 - 5 0 , 2 9 1 - 3 2 , 2 3 9 — L,718R - 6 , 6 0 2 - 6 , 4 3 4 - 5 , 7 0 4 - 1 0 , 3 4 5 - 6 , 7 0 6 - 3 , 0 5 0 38 Foreign purchases 3 8 6 , 1 0 6 3 4 5 , 5 4 0 187 ,773 30,317R 3 2 , 3 6 9 3 3 , 4 8 1 3 7 , 4 6 4 3 6 , 1 1 5 3 7 , 7 6 4 4 2 , 9 4 9 39 Foreign sales 4 3 4 , 1 7 7 3 9 5 , 8 3 1 2 2 0 , 0 1 2 32,035R 38 ,971 3 9 , 9 1 5 4 3 , 1 6 8 4 6 , 4 6 0 4 4 , 4 7 0 4 5 , 9 9 9 4 0 Bonds, net purchases, or sales (—) - 9 , 2 2 4 - 4 8 , 5 4 5 - 1 2 , 4 7 7 - 6 , 5 1 9 R - 4 , 0 5 0 - 4 , 5 8 4 - 1 , 4 0 4 - 6 , 0 3 8 - 1 5 3 - 2 9 8 41 Foreign purchases 8 4 8 , 3 6 8 8 8 9 , 4 7 1 4 3 6 , 5 1 7 78,647R 8 0 , 3 2 8 8 4 , 6 3 8 9 5 , 2 0 1 9 3 , 3 4 5 8 1 , 2 5 6 8 2 , 0 7 7 4 2 Foreign sales 8 5 7 , 5 9 2 9 3 8 , 0 1 6 4 4 8 , 9 9 4 85,166R 8 4 , 3 7 8 8 9 , 2 2 2 9 6 , 6 0 5 9 9 , 3 8 3 8 1 , 4 0 9 8 2 , 3 7 5
4 3 Net purchases, or sales (—), of stocks and bonds . . . . -57,295 -98,836 -44,716 —8,237r -10,652 -11,018 -7,108 -16,383 -6,859 -3,348
4 4 Foreign countries -57,815 -98,031 -44,460 -8,159r -10,711 -11,049 -6,983 —16,387 -6,802 -3,239
4 5 Europe - 3 , 5 1 6 - 4 8 , 1 2 5 - 1 1 , 4 4 1 —4,699R - 5 , 9 2 6 - 4 , 0 6 8 - 2 , 5 5 2 - 4 , 5 0 8 - 1 , 9 4 9 1 ,636 4 6 Canada - 7 , 4 7 5 - 7 , 9 5 2 - 4 , 2 3 0 - 4 9 4 - 1 4 - 2 , 6 6 8 - 5 8 - 1 , 8 6 5 6 1 4 - 2 5 3 4 / Latin America and Caribbean - 1 8 , 3 3 4 - 7 , 6 3 4 - 6 , 8 3 9 - 3 7 7 R - 8 0 2 - 3 - 1 , 0 3 1 - 2 , 5 8 2 - 1 , 1 9 0 - 2 , 0 3 3 4 8 4 9
- 2 4 , 2 7 5 - 3 4 , 0 5 6 - 1 9 , 3 5 4 - L , 9 9 2 R - 4 , 3 9 1 - 4 , 6 8 5 - 2 , 5 5 7 - 5 , 7 5 6 - 4 , 0 9 4 - 2 , 2 6 2 4 8 4 9 Japan - 1 7 , 4 2 7 - 2 5 , 0 7 2 - 1 0 , 1 1 1 - L , 3 8 9 R - 3 , 6 8 7 - 3 , 4 2 7 - 1 , 5 9 2 - 3 , 2 2 4 - 9 5 0 - 9 1 8 5 0 Africa - 4 6 7 - 3 2 7 - 7 4 0 19 - 4 4 - 9 6 - 1 6 1 - 4 3 6 - 1 4 - 3 3 51 Other countries - 3 , 7 4 8 6 3 - 1 , 8 5 6 -616' 4 6 6 4 7 1 - 6 2 4 - 1 , 2 4 0 - 1 6 9 - 2 9 4
5 2 Nonmonetary international and regional organizations 520 - 8 0 5 - 2 5 6 - 7 8 59 31 - 1 2 5 4 - 5 7 - 1 0 9
1. Comprises oil-exporting countries as follows: Bahrain, Iran, Iraq, Kuwait, Oman, Qatar, 2. Includes state and local government securities and securities of U.S. government Saudi Arabia, and United Arab Emirates (Trucial States). agencies and corporations. Also includes issues of new debt securities sold abroad by U.S.
corporations organized to finance direct investments abroad.
Digitized for FRASER http://fraser.stlouisfed.org/ Federal Reserve Bank of St. Louis

Securities Holdings and Transactions /Interest and Exchange Rates A61
3.25 MARKETABLE U.S. TREASURY BONDS AND NOTES Foreign Transactions'
Millions of dollars; net purchases, or sales (—) during period
Area or country 1994 1995
1996 1995 1996
Area or country 1994 1995 Jan.— May Nov. Dec. Jan. Feb. Mar. Apr. Mayp
1 Total estimated 78,801 133,991 66,243 15,307 -9,454 14,018r 15,451 7,025r 15,742 14,007
2 Foreign countries 78,637 133,552 67,206 14,936 -9,016 13,713r 16,192 6,414r 17,117 13,770
3 Europe 38,542 50,000 36,165 821 -1,120 7,291r 8,462 4,083r 8,712 7,617 4 Belgium and Luxembourg 1,098 591 363 81 171 149 - 1 2 0 81 399 - 1 4 6 5 Germany 5,709 6,136 7,680 52 452 1,385 1,829 958 1,833 1,675 6 Netherlands 1,254 1,891 -3,330 833 381 807 354 -1,597 -2,137 - 7 5 7 7 Sweden 794 358 1,758 - 3 0 - 2 8 5 - 4 5 803 372 286 342 8 Switzerland 481 - 4 7 2 2,235 - 5 6 8 - 6 6 4 76 84 65 1,329 681 9 United Kingdom 23,365 34,778 14,510 1,309 -4,377 l,177r 1,644 2,270r 6,070 3,349
10 Other Europe and former U.S.S.R 5,841 6,718 12,949 - 8 5 6 3,202 3,742 3,868 1,934 932 2,473 11 Canada 3,491 252 4,862 - 4 3 208 1,867 1,863 35 1,766 - 6 6 9
17 Latin America and Caribbean -10,383 48,609 -9,799 13,496 3,762 -2,648 -2,931 -4,985 1,984 -1,219 13 Venezuela - 3 1 9 - 2 - 3 1 4 232 61 - 1 4 2 - 9 3 - 4 4 4 - 3 9 14 Other Latin America and Caribbean -20,493 25,152 5,939 3,723 4,710 8,922 -1,896 -2,696 3,856 -2,247 15 Netherlands Antilles 10,429 23,459 -15,424 9,541 -1,009 -11,428 - 9 4 2 -2,245 -1,876 1,067 16 47,317 32,319 35,017 - 1 0 7 -11,843 6,920 8,616 6,941 4,478 8,062 17 Japan 29,793 16,863 15,074 1,316 -5,695 2,619 3,069 2,443 2,382 4,561 18 Africa 240 1,464 928 458 252 515 - 1 0 0 311 250 - 4 8 19 Other - 5 7 0 908 33 311 - 2 7 5 - 2 3 2 282 29 - 7 3 27
20 Nonmonetary international and regional organizations 164 439 - 9 6 3 371 - 4 3 8 305 - 7 4 1 611 -1,375 237 71 International 526 9 125 368 - 3 4 7 210 - 3 0 8 647 - 4 1 4 - 1 0 22 Latin American regional - 1 5 4 261 -1,286 - 4 3 - 1 1 5 - 4 5 - 2 5 4 12 -1,008 9
MEMO 73 Foreign countries 78,637 133,552 67,206 14,936 -9,016 13,713r 16,192 6,414' 17,117 13,770 74 Official institutions 41,822 39,625 40,779 - 9 1 5 2,651 12,615 8,681 4,748 8,253 6,482 25 Other foreign 36,815 93,927 26,427 15,851 -11,667 l,098r 7,511 l,666r 8,864 7,288
Oil-exporting countries 76 Middle East2 - 3 8 3,075 3,615 - 8 2 6 -1,085 - 6 5 8 122 1,127 863 2,161 27 0 2 2 0 0 0 1 0 0 1
1. Official and private transactions in marketable U.S. Treasury securities having an original maturity of more than one year. Data are based on monthly transactions reports. Excludes nonmarketable U.S. Treasury bonds and notes held by official institutions of foreign countries.
3.26 DISCOUNT RATES OF FOREIGN CENTRAL BANKS'
Percent per year, averages of daily figures
2. Comprises Bahrain, Iran, Iraq, Kuwait, Oman, Qatar, Saudi Arabia, and United Arab Emirates (Trucial States).
3. Comprises Algeria, Gabon, Libya, and Nigeria.
Country
Rate on July 31, 1996
Month effective
Country
Rate on July 31, 1996
Austria... Belgium. , Canada. . . Denmark . France2 . .
2.5 2.5 4.75 3.25 3.55
Apr. 1996 Apr. 1995 July 1996 Apr. 1996 July 1996
Germany . . . Italy Japan Netherlands . Switzerland .
2.5 8.75
.5 2.5 1.5
1. Rates shown are mainly those at which the central bank either discounts or makes advances against eligible commercial paper or government securities for commercial banks or brokers. For countries with more than one rate applicable to such discounts or advances, the rate shown is the one at which it is understood that the central bank transacts the largest proportion of its credit operations.
3.27 FOREIGN SHORT-TERM INTEREST RATES1
Percent per year, averages of daily figures
2. Since February 1981, the rate has been that at which the Bank of France discounts Treasury bills for seven to ten days.
Type or country 1993 1994 1995
1996
Type or country 1993 1994 1995 Jan. Feb. Mar. Apr. May June July
1 Eurodollars 3.18 4.63 5.93 5.40 5.14 5.28 5.36 5.36 5.46 5.49 2 United Kingdom 5.88 5.45 6.63 6.31 6.13 6.02 5.97 6.03 5.80 5.69 3 Canada 5.14 5.57 7.14 5.58 5.22 5.23 5.03 4.82 4.87 4.76 4 Germany 7.17 5.25 4.43 3.51 3.26 3.25 3.22 3.19 3.29 3.29 5 Switzerland 4.79 4.03 2.94 1.65 1.61 1.68 1.68 1.99 2.53 2.52 6 Netherlands 6.73 5.09 4.30 3.20 3.00 3.09 2.83 2.61 2.81 2.99 7 France 8.30 5.72 6.43 4.56 4.29 4.14 3.87 3.78 3.85r 3.73 8 Italy 10.09 8.45 10.43 10.05 9.90 9.82 9.60 8.88 8.73 8.72 9 Belgium 8.10 5.65 4.73 3.47 3.23 3.25 3.23 3.19 3.23 3.29
10 Japan 2.96 2.24 1.20 .55 .61 .60 .61 .62 .57 .67
1. Rates are for three-month interbank loans, with the following exceptions: Canada, finance company paper; Belgium, three-month Treasury bills; and Japan, CD rate.
Digitized for FRASER http://fraser.stlouisfed.org/ Federal Reserve Bank of St. Louis

A62 International Statistics • September 1996
3.28 FOREIGN EXCHANGE RATES1
Currency units per dollar except as noted
Country/currency unit 1993 1994 1995 1996
Country/currency unit 1993 1994 1995 Feb. Mar. Apr. May June July
1 Australia/dollar2 67.993 73.161 74.073 75.557 77.136 78.566 79.700 79.122 78.974 2 Austria/schilling 11.639 11.409 10.076 10.321 10.391 10.580 10.782 10.755 10.576 3 Belgium/franc 34.581 33.426 29.472 30.115 30.371 30.902 31.502 31.433 30.947 4 Canada/dollar 1.2902 1.3664 1.3725 1.3752 1.3656 1.3592 1.3693 1.3658 1.3697 5 China, P.R./yuan 5.7795 8.6404 8.3700 8.3338 8.3495 8.3583 8.3479 8.3424 8.3409 6 Denmark/krone 6.4863 6.3561 5.5999 5.6749 5.7074 s.sostf 5.9160 5.8941 5.8014 7 Finland/markka 5.7251 5.2340 4.3763 4.5532 4.6066 4.7288 4.7541 4.6710 4.5812 8 France/franc 5.6669 5.5459 4.9864 5.0440 5.0583 5.1049 5.1855 5.1787 5.0881 9 Germany/deutsche mark 1.6545 1.6216 1.4321 1.4669 1.4776 1.5048 1.5324 1.5282 1.5025
10 Greece/drachma 229.64 242.50 231.68 242.21 241.54 242.00 243.27 241.75 237.65
11 Hong Kong/dollar 7.7357 7.7290 7.7357 7.7323 7.7325 7.7345 7.7363 7.7404 7.7379 12 India/rupee 31.291 31.394 32.418 36.595 34.485 34.320 35.025 35.100 35.667 13 Ireland/pound2 146.47 149.69 160.35 158.10 157.21 156.51 156.29 158.31 160.31 14 Italy/lira 1,573.41 1,611.49 1,629.45 1,570.00 1,562.43 1,565.60 1,556.71 1,542.30 1,526.82 15 Japan/yen 111.08 102.18 93.96 105.79 105.94 107.20 106.34 108.96 109.19 16 Malaysia/ringgit 2.5738 2.6237 2.5073 2.5487 2.5417 2.5113 2.4936 2.4967 2.4915 17 Netherlands/guilder 1.8585 1.8190 1.6044 1.6424 1.6540 1.6805 1.7135 1.7120 1.6862 18 New Zealand/dollar2 54.127 59.358 65.625 67.495 68.079 68.242 68.571 67.650 69.001 19 Norway/krone 7.1009 7.0553 6.3355 6.4103 6.4277 6.4901 6.5748 6.5376 6.4465 20 Portugal/escudo 161.08 165.93 149.88 152.49 152.93 154.51 157.54 157.40 154.56
21 Singapore/dollar 1.6158 1.5275 1.4171 1.4115 1.4095 1.4082 1.4074 1.4090 1.4160 22 South Africa/rand 3.2729 3.5526 3.6284r 3.7420 3.9293 4.2130 4.3679 4.3519 4.3963 23 South Korea/won 805.75 806.93 772.69r 780.12 781.31 780.42 780.86 798.45 813.03 24 Spain/peseta 127.48 133.88 124.64 123.65 124.39 125.49 127.97 128.87 126.96 25 Sri Lanka/rupee 48.211 49.170 51.047 53.716 53.748 54.163 54.868 55.529 55.293 26 Sweden/krona 7.7956 7.7161 7.1406 6.8775 6.7318 6.7141 6.7984 6.6807 6.6394 27 Switzerland/franc 1.4781 1.3667 1.1812 1.1967 1.1959 1.2180 1.2539 1.2579 1.2320 28 Taiwan/dollar 26.416 26.465 26.495 27.485 27.400 27.188 27.352 27.674 27.573 29 Thailand/baht 25.333 25.161 24.921 25.250 25.251 25.290 25.289 25.354 25.355 30 United Kingdom/pound2 150.16 153.19 157.85 153.60 152.71 151.60 151.52 154.16 155.30
MEMO 31 United States/dollar3 93.18 91.32 84.25 86.41 86.57 87.46 88.28 88.16 87.25
1. Averages of certified noon buying rates in New York for cable transfers. Data in this 3. Index of weighted-average exchange value of U.S. dollar against the currencies of ten table also appear in the Board's G.5 (405) monthly statistical release. For ordering address, industrial countries. The weight for each of the ten countries is the 1972-76 average world see inside front cover. trade of that country divided by the average world trade of all ten countries combined. Series
2. Value in U.S. cents. revised as of August 1978 (see Federal Reserve Bulletin, vol. 64 (August 1978), p. 700).
Digitized for FRASER http://fraser.stlouisfed.org/ Federal Reserve Bank of St. Louis

A63
Guide to Statistical Releases and Special Tables
STATISTICAL RELEASES—List Published Semiannually, with Latest Bulletin Reference Issue Page
Anticipated schedule of release dates for periodic releases June 1996 A72
SPECIAL TABLES—Data Published Irregularly, with Latest Bulletin Reference
Title and Date Issue Page
Assets and liabilities of commercial banks March 31, 1993 August 1993 A70 June 30, 1993 November 1993 A70 September 30, 1993 February 1994 A70 December 31,1993 May 1994 A68
Terms of lending at commercial banks August 1995 November 1995 A68 November 1995 February 1996 A68 February 1996 May 1996 A68 May 1996 August 1996 A64
Assets and liabilities of U.S. branches and agencies of foreign banks June 30, 1995 November 1995 A72 September 30, 1995 February 1996 A72 December 31, 1995 May 1996 A72 March 31,1996 September 1996 A64
Pro forma balance sheet and income statements for priced service operations March 31, 1995 August 1995 A76 June 30, 1995 October 1995 All September 30, 1995 January 1996 A68 March 31, 1996 July 1996 A64
Assets and liabilities of life insurance companies June 30, 1991 December 1991 A79 September 30, 1991 May 1992 A81 December 31, 1991 August 1992 A83 September 30, 1992 March 1993 All
Residential lending reported under the Home Mortgage Disclosure Act 1994 September 1995 A68 1995 September 1996 A68
Digitized for FRASER http://fraser.stlouisfed.org/ Federal Reserve Bank of St. Louis

A66 Special Tables • September 1996
4.30 ASSETS AND LIABILITIES of U.S. Branches and Agencies of Foreign Banks, March 31, 1996'—Continued
Millions of dollars except as noted
Item
All states2 New York California Illinois
Item Total including
IBFs3 IBFs only3
Total including
IBFs IBFs only
Total including
IBFs IBFs only
Total including
IBFs IBFs only
1 Total assets4 759,735 289,394 583,365 236,590 71,880 29,215 60,322 14,505
2 Claims on nonrelated parties 675,492 145,316 516,839 119,807 66,936 12,738 55,529 6,774 Cash and balances due from depository institutions 115,640 85,737 102,963 74,694 5,305 4,720 5,472 5,043
4 Cash items in process of collection and unposted debits 2,543 0 2,452 0 11 0 53 0 5 Currency and coin (U.S. and foreign) 22 n.a. 15 n.a. 1 n.a. 1 n.a. 6 Balances with depository institutions in United States 66,078 44,771 58,960 38,842 2,987 2,462 3,438 3,100 7 U.S. branches and agencies of other foreign banks
58,960 38,842 2,987 3,438 3,100
(including IBFs) 61,730 43,592 55,233 37,740 2,700 2,462 3,296 3,033 8 Other depository institutions in United States (including I B F s ) . . . . 4,349 1,179 3,727 1,102 287 0 142 67 9 Balances with banks in foreign countries and with foreign central
1,179 3,727 1,102
banks 46,666 40,967 41,355 35,852 2,268 1
2,258 1,967 1,943 10 Foreign branches of U.S. banks 2,094 1,174 1,859 962
2,268 1 0 201 201
11 Other banks in foreign countries and foreign central banks 44,572 39,793 39,496 34,890 2,267 2,258 1,766 1,742 12 Balances with Federal Reserve Banks 330 n.a. 181 n.a. 38 n.a. 14 n.a.
13 Total securities and loans 419,467 47,150 288,767 33,955 56,924 7,452 41,152 1,445
14 Total securities, book value 97,210 9,554 89,261 8,438 4,075 644 3,299 452 15 U.S. Treasury 29,197 n.a. 28,053 n.a. 605 n.a. 420 n.a. 16 Obligations of U.S. government agencies and corporations 26,354 n.a. 25,780 n.a. 392 n.a. 61 n.a. 17 Other bonds, notes, debentures, and corporate stock (including state
and local securities) 41,658 9,554 35,427 8,438 3,078 644 2,818 452 18 Securities of foreign governmental units 13,405 4,338 12,061 3,846 690 261 571 211 19 All Other 28,254 5,216 23,366 4,592 2,388 384 2,247 240
20 Federal funds sold and securities purchased under agreements to resell 46,236 8,870 43,112
8,999 8,384 564 124 1,701 20
21 U.S. branches and agencies of other foreign banks 9,982 4,236 43,112
8,999 4,038 402 124 252 0 22 Commercial banks in United States 7,825 81 7,309 71 79 0 174 0 23 Other 28,430 4,553 26,804 4,275 83 0 1,276 20
24 Total loans, gross 322,398 37,606 199,589 25,523 52,895 6,810 37,857 994 25 LESS: Unearned income on loans 141 9 83 5 47 2 4 0 26 EQUALS: Loans, net 322,257 37,597 199,506 25,517 52,848 6,808 37,853 994
Total loans, gross, by category 27 Real estate loans 32,495 204 19,107 50 9,387 152 2,041 0 28 Loans to depository institutions 34,585 21,945 21,768 13,356 6,817 5,055 977 535 29 Commercial banks in United States (including IBFs) 13,406 7,394 7,801 3,929 4,713 3,159 516 255 30 U.S. branches and agencies of other foreign banks 12,102 7,126 6,890 3,720 4,571 3,119 340 241 31 Other commercial banks in United States 1,304 268 912 209 142 40 176 14 32 Other depository institutions in United States (including IBFs) 74 0 74 0 0 0 0 0 33 Banks in foreign countries 21,105 14,551 13,893 9,427 2,104 1,896 461 280 34 Foreign branches of U.S. banks 463 347 373 339 0 0 0 0 35 Other banks in foreign countries 20,642 14,204 13,520 9,088 2,104 1,896 461 280 36 Loans to other financial institutions 34,449 804 27,433 531 2,415 88 3,837 94
37 Commercial and industrial loans 199,177 12,540 112,649 9,593 33,379 1,467 29,376 357 38 U.S. addressees (domicile) 172,087 80 93,301 46 30,336 29 28,110 1 39 Non-U.S. addressees (domicile) 27,090 12,460 19,348 9,546 3,043 1,438 1,266 356 40 Acceptances of other banks 518 39 250 37 112 0 102 0 41 U.S. banks 72 0 47 0 15 0 0 0 42 Foreign banks 446 39 202 37 97 0 101 0 43 Loans to foreign governments and official institutions (including
foreign central banks) 3,250 1,785 2,755 1,678 164 48 84 8 44 Loans for purchasing or carrying securities (secured and unsecured) . . . 10,010 142 9,833 142 86 0 43 0 45 All other loans 6,090 120 4,001 109 507 0 1,394 0
46 Lease financing receivables (net of unearned income) 1,824 28 1,794 28 27 0 3 0 47 U.S. addressees (domicile) 1,272 0 1,242 0 27 0 3 0 48 Non-U.S. addressees (domicile) 552 28 552 28 0 0 0 0 49 Trading assets 50,443 290 44,963 262 629 21 4,851 8 50 All other assets 43,705 3,267 37,035 2,512 3,514 422 2,352 258 51 Customers' liabilities on acceptances outstanding 9,339 n.a. 6,636 n.a. 1,926 n.a. 469 n.a. 52 U.S. addressees (domicile) 6,814 n.a. 4,551 n.a. 1,760 n.a. 334 n.a. 53 Non-U.S. addressees (domicile) 2,525 n.a. 2,085 n.a. 166 n.a. 135 n.a. 54 Other assets including other claims on nonrelated parties 34,366 3,267 30,399 2,512 1,588 422 1,884 258 55 Net due from related depository institutions5 84,243 144,079 66,525 116,783 4,944 16,477 4,793 7,731 56 Net due from head office and other related depository institutions5... 84,243 n.a. 66,525 n.a. 4,944 n.a. 4,793 n.a. 57 Net due from establishing entity, head offices, and other related
66,525 4,944 4,793
depository institutions5 n.a. 144,079 n.a. 116,783 n.a. 16,477 n.a. 7,731
58 Total liabilities4 759,735 289,394 583,365 236,590 71,880 29,215 60,322 14,505
59 Liabilities to nonrelated parties 619,156 271,325 518,575 222,329 46,489 27,864 34,720 13,246
Digitized for FRASER http://fraser.stlouisfed.org/ Federal Reserve Bank of St. Louis

U.S. Branches and Agencies A65
4.30 ASSETS AND LIABILITIES of U.S. Branches and Agencies of Foreign Banks, March 31, 1996 —Continued
Millions of dollars except as noted
Item
All states2 New York California Illinois
Item Total excluding
IBFs3
IBFs only3
Total excluding
IBFs IBFs only
Total excluding
IBFs IBFs only
Total excluding
IBFs IBFs only
60 Total deposits and credit balances 168,711 204,044 144,088 185,231 5,790 5,8 38 9,421 6,550 61 Individuals, partnerships, and corporations 113,077 15,226 94,628 10,407 4,891 677 6,055 59 67, U.S. addressees (domicile) 98 718 130 86,380 130 3,250 0 5,312 0 63 Non-U.S. addressees (domicile) 14,359 15,096 8,248 10,277 1,641 677 743 59 64 Commercial banks in United States (including IBFs) 31,091 44,766 26,491 42,073 483 1,431 2,822 1,113 65 U.S. branches and agencies of other foreign banks 17,836 41,555 15,272 39,211 127 1,222 1,574 990 66 Other commercial banks in United States 13,254 3,211 11,219 2,861 356 209 1,248 123 67 Banks in foreign countries 9,182 114,929 8,704 106,692 192 2,825 39 3,962 68 Foreign branches of U.S. banks 2,527 5,338 2,526 4,137 0 297 0 859 69 Other banks in foreign countries 6,655 109,591 6,178 102,555 192 2,528 39 3,103 70 Foreign governments and official institutions
18 (including foreign central banks) 5,126 29,080 4,742 26,037 202 85 20
18 1,415 71 All other deposits and credit balances 9,963 44 9,294 23 3
85 20 480 1
72 Certified and official checks 272 229 19 8
73 Transaction accounts and credit balances (excluding IBFs) 8,280 6,622 367 338 74 Individuals, partnerships, and corporations 6,513 5,138 303 311 75 U.S. addressees (domicile) 4,618 3,982 227 307 76 Non-U.S. addressees (domicile) 1,895 1,156 76 5 77 Commercial banks in United States (including IBFs) 90 86 2 0 78 U.S. branches and agencies of other foreign banks 8 7 0 0 79 Other commercial banks in United States 82 79 1 0 80 Banks in foreign countries 770 604 35 16 81 Foreign branches of U.S. banks 12 11 0 0 82 Other banks in foreign countries 758 593 35 16 83 Foreign governments and official institutions
324 (including foreign central banks) 386 324 5 2 84 All other deposits and credit balances 249 240 3 0 85 Certified and official checks 272 229 19 8
86 Demand deposits (included in transaction accounts and credit balances) 7,634 6,250 312 325
87 Individuals, partnerships, and corporations 6,094 4,973 251 298 88 U.S. addressees (domicile) 4,441 3,877 189 294 89 Non-U.S. addressees (domicile) 1,653 1,096 62 4 90 Commercial banks in United States (including IBFs) 80 77 1 0 91 U.S. branches and agencies of other foreign banks 8 n a. 7 n.a. 0 n.a. 0 n.a. 92 Other commercial banks in United States 72 70 0 0 93 Banks in foreign countries 750 586 35 16 94 Foreign branches of US. banks 12 11 0 0 95 Other banks in foreign countries 738 575 35 16 96 Foreign governments and official institutions
(including foreign central banks) 366 319 5 2 97 All other deposits and credit balances 72 66 2 0 98 Certified and official checks 272 229 19 8
99 Nontransaction accounts (including MMDAs, excluding IBFs) 160,431 137,466 5,422 9,083 100 Individuals, partnerships, and corporations 106,564 89,490 4,5 88 5,744 101 U.S. addressees (domicile) 94,100 82,398 3,023 5,006 102 Non-U.S. addressees (domicile) 12,464 7,092 1,565 738 103 Commercial banks in United States (including IBFs) 31,001 26,405 482 2,822 104 U.S. branches and agencies of other foreign banks 17,828 15,265 127 1,574 105 Other commercial banks in United States 13,172 11,140 355 1,248 106 Banks in foreign countries 8,412 8,099 156 23 107 Foreign branches of U.S. banks 2,515 2,515 0 0 108 Other banks in foreign countries 5,897 5,584 156 23 109 Foreign governments and official institutions
(including foreign central banks) 4,740 4,418 197 15 110 All other deposits and credit balances 9,714 9,054 0 479
111 IBF deposit liabilities 204 044 185 231 5,8 38 6,5 50 112 Individuals, partnerships, and corporations 15,226 10,407 677 59 113 U.S. addressees (domicile) 130 130 0 0 114 Non U.S. addressees (domicile) 15,096 10,277 677 59 115 Commercial banks in United States (including IBFs) 44,766 42,073 1,431 1,113 116 U.S. branches and agencies of other foreign banks 41,555 39,211 1,222 990 117 Other commercial banks in United States n.a. 3,211 n.a. 2,861 n.a. 209 n.a. 123 118 Banks in foreign countries 114,929 106,692 2,825 3,962 119 Foreign branches of U.S. banks 5,338 4,137 297 859 120 Other banks in foreign countries 109,591 102,555 2,528 3,103 121 Foreign governments and official institutions
(including foreign central banks) 29,080 26,037 85 1,415 122 All other deposits and credit balances 44 23 20 1
Footnotes appear at end of table.
Digitized for FRASER http://fraser.stlouisfed.org/ Federal Reserve Bank of St. Louis

A66 Special Tables • September 1996
4.30 ASSETS AND LIABILITIES of U.S. Branches and Agencies of Foreign Banks, March 31, 1996'—Continued
Millions of dollars except as noted
Item
All states2 New York California Illinois
Item Total including
IBFs3
IBFs only3
Total including
IBFs IBFs only
Total including
IBFs IBFs only
Total including
IBFs IBFs only
m Federal funds purchased and securities sold under agreements to 4,406 repurchase 72,301 14,486 61,605 11,844 5,859 1,519 4,406 1,014
124 U.S. branches and agencies of other foreign banks 10,363 3,045 7,805 1,990 1,854 790 687 257 125 Other commercial banks in United States 9,086 89 5,409 37 2,832 15 627 35 176 52,852 11,352 48,391 9,816 1,172 714 3,092 722 127 Other borrowed money 93,377 48,745 55,297 21,867 25,577 20,113 10,069 5,476 178 Owed to nonrelated commercial banks in United States (including
IBFs) 26,963 13,206 12,707 4,491 10,979 7,142 1,968 1,110 129 Owed to U.S. offices of nonrelated U.S. banks 7,873 1,161 4,723 323 2,208 725 419 n n o Owed to U.S. branches and agencies of nonrelated
foreign banks 19,090 12,044 7,985 4,168 8,771 6,418 1,549 1,038 n i Owed to nonrelated banks in foreign countries 35,773 32,678 18,252 15,579 12,390 12,284 4,204 3,9 88 137 Owed to foreign branches of nonrelated U.S. banks 1,644 1,345 507 448 680 665 428 232 133 Owed to foreign offices of nonrelated foreign banks 34,129 31,333 17,744 15,131 11,710 11,619 3,777 3,756 134 Owed to others 30,641 2,862 24,338 1,797 2,207 687 3,896 378
135 All other liabilities 80,723 4,050 72,353 3,387 3,426 394 4,275 206 136 Branch or agency liability on acceptances executed and
9,626 6,879 1,927 472 outstanding 9,626 n. a. 6,879 n.a. 1,927 n.a. 472 n.a. 137 Trading liabilities 40,429 I l l 37,542 83 530 21 2,335 6 138 Other liabilities to nonrelated parties 30,668 3,939 27,932 3,304 969 373 1,468 200
139 Net due to related depository institutions5 140,579 18,069 64,790 14,261 25,392 1,351 25,601 1,259 140 Net owed to head office and other related depository institutions . . . 140,579 n.a. 64,790 n.a. 25,392 n.a. 25,601 n a. 141 Net owed to establishing entity, head office, and other related
depository institutions5 n.a. 18,069 n.a. 14,261 n.a. 1,351 n.a. 1,259
MEMO 142 Non-interest-bearing balances with commercial banks
0 0 49 0 in United States 1,037 0 849 0 80 0 49 0
143 Holding of commercial paper included in total loans 1,462 1,253 15 I 174 144 Holding of own acceptances included in commercial and
72 industrial loans 5,266 3,719 1,359 72 145 Commercial and industrial loans with remaining maturity of one year
or less 115,858 64,602 20,394 18,040 146 Predetermined interest rates 65,688 n a. 36,110 n.a. 11,367 n.a. 12,586 n.a. 147 Floating interest rates 50,170 28,492 9,026 5,454 148 Commercial and industrial loans with remaining maturity of more
than one year 82,638 47,670 12,866 11,324 149 Predetermined interest rates 20,319 11,889 2,795 3,912 150 Floating interest rates 62,319 35,782 10,071 7,413
Digitized for FRASER http://fraser.stlouisfed.org/ Federal Reserve Bank of St. Louis

U.S. Branches and Agencies A67
4.30 ASSETS AND LIABILITIES of U.S. Branches and Agencies of Foreign Banks, March 31, 1996 —Continued
Millions of dollars except as noted
Item
All states2 New York California Illinois
Item Total excluding
IBFs3
IBFs only3
Total excluding
IBFs IBFs only
Total excluding
IBFs IBFs only
Total excluding
IBFs IBFs only
151 Components of total nontransaction accounts, included in total deposits and credit balances of nontransaction accounts, including IBFs
152 Time CDs in denominations of $100,000 or more 153 Other time deposits in denominations of $100,000
or more 154 Time CDs in denominations of $100,000 or more
with remaining maturity of more than 12 months
155 Immediately available funds with a maturity greater than one day included in other borrowed money
156 Number of reports filed6
164,025 123,150
33,013
7,863
1 n.a. 1
141,967 105,410
29,562
6,995
1 n.a. J
5,575 3,740
1,283
552
i n.a. 1
9,043 7,408
1,411
225
1 n.a. 1
151 Components of total nontransaction accounts, included in total deposits and credit balances of nontransaction accounts, including IBFs
152 Time CDs in denominations of $100,000 or more 153 Other time deposits in denominations of $100,000
or more 154 Time CDs in denominations of $100,000 or more
with remaining maturity of more than 12 months
155 Immediately available funds with a maturity greater than one day included in other borrowed money
156 Number of reports filed6
All states2 New York California Illinois
151 Components of total nontransaction accounts, included in total deposits and credit balances of nontransaction accounts, including IBFs
152 Time CDs in denominations of $100,000 or more 153 Other time deposits in denominations of $100,000
or more 154 Time CDs in denominations of $100,000 or more
with remaining maturity of more than 12 months
155 Immediately available funds with a maturity greater than one day included in other borrowed money
156 Number of reports filed6
Total including
IBFs IBFs only
Total including
IBFs IBFs only
Total including
IBFs IBFs only
Total including
IBFs IBFs only
151 Components of total nontransaction accounts, included in total deposits and credit balances of nontransaction accounts, including IBFs
152 Time CDs in denominations of $100,000 or more 153 Other time deposits in denominations of $100,000
or more 154 Time CDs in denominations of $100,000 or more
with remaining maturity of more than 12 months
155 Immediately available funds with a maturity greater than one day included in other borrowed money
156 Number of reports filed6 53,779
511 n.a. n.a.
26,734 250
n.a. n.a.
20,155 114
n.a. n.a.
5,424 45
n.a. n.a.
1. Data are aggregates of categories reported on the quarterly form FFIEC 002, "Report of Assets and Liabilities of U.S. Branches and Agencies of Foreign Banks." The form was first used for reporting data as of June 30, 1980, and was revised as of December 31, 1985. From November 1972 through May 1980, U.S. branches and agencies of foreign banks had filed a monthly FR 886a report. Aggregate data from that report were available through the Federal Reserve monthly statistical release G. 11, last issued on July 10, 1980. Data in this table and in the G. 11 tables are not strictly comparable because of differences in reporting panels and in definitions of balance sheet items.
2. Includes the District of Columbia. 3. Effective December 1981, the Federal Reserve Board amended Regulations D and Q to
permit banking offices located in the United States to operate international banking facilities (IBFs). Since December 31, 1985, data for IBFs have been reported in a separate column. These data are either included in or excluded from the total columns as indicated in the headings. The notation "n.a." indicates that no IBF data have been reported for that item,
either because the item is not an eligible IBF asset or liability or because that level of detail is not reported for IBFs. From December 1981 through September 1985, IBF data were included in all applicable items reported.
4. Total assets and total liabilities include net balances, if any, due from or owed to related banking institutions in the United States and in foreign countries (see note 5). On the former monthly branch and agency report, available through the G. l l monthly statistical release, gross balances were included in total assets and total liabilities. Therefore, total asset and total liability figures in this table are not comparable to those in the G.l 1 tables.
5. Related depository institutions includes the foreign head office and other U.S. and foreign branches and agencies of a bank, a bank's parent holding company, and majority-owned banking subsidiaries of the bank and of its parent holding company (including subsidiaries owned both directly and indirectly).
6. In some cases two or more offices of a foreign bank within the same metropolitan area file a consolidated report.
Digitized for FRASER http://fraser.stlouisfed.org/ Federal Reserve Bank of St. Louis

A68 Special Tables • September 1996
4.34 RESIDENTIAL LENDING ACTIVITY OF FINANCIAL INSTITUTIONS COVERED BY HMDA, 1982-95
Number
Item 1983 1984 1985 1986 1987
1 Loans or applications (millions)2 1.71 1.86 1.98 2.83 3.42
2 Reporting institutions 8,050 8,491 8,072 8,898 9,431 3 Disclosure reports 10,970 11,799 12,567 12,329 13,033
1. Before 1990, includes only home purchase, home refinancing, and home improvement loans originated by covered institutions; beginning in 1990 (first year under revised reporting system), includes such loans originated and purchased, applications approved but not ac-cepted by the applicant, applications denied or withdrawn, and applications closed because information was incomplete.
1988 1989 19901 1991 1992 1993 1994 1995
3.39 3.13 6.59 7.89 12.01 15.38 12.19 11.23
9,319 9,203 9,332 9,358 9,073 9,650 9,858 9,539 13,919 14,154 24,041 25,934 28,782 35,976 38,750 36,611
2. Revised from preliminary data published in Glenn B. Canner and Dolores S. Smith, "Home Mortgage Disclosure Act: Expanded Data on Residential Lending," Federal Reserve Bulletin, vol. 77 (November 1991), p. 861, to reflect corrections and the reporting of additional data.
SOURCE. FFIEC, Home Mortgage Disclosure Act.
4.35 APPLICATIONS FOR HOME LOANS REPORTED UNDER HMDA By Type of Dwelling, Purpose of Loan, and Loan Program, 1995
Thousands
Loan program One- to four-family dwellings
Multifamily dwellings1 All Loan program
Home purchase Home refinancing Home improvement All
Multifamily dwellings1 All
1 FHA 699.7 93.7 168.8 962.2 * 962.5 2 VA 272.5 50.5 3.0 326.0 * 326.0 3 FmHA 14.8 .5 * 15.4 * 15.4 4 Conventional 4497.3 2548.1 1577.4 8622.8 28.5 8651.3
5 Total 5484.3 2692.8 1749.3 9926.4 28.7 9955.2
*Fewer than 500. SOURCE. FFIEC, Home Mortgage Disclosure Act. 1. Multifamily dwellings are those for five or more families.
4.36 HOME LOANS ORIGINATED BY LENDERS REPORTING UNDER HMDA By Type of Dwelling, Purpose of Loan, and Type of Lender, 1995
Percent
Type of lender
One- to four-family dwellings
Multifamily dwellings1 All Type of lender Home purchase
Home refinancing
Home improvement All
Multifamily dwellings1 All Type of lender
FHA-insured VA-guaranteed
FmHA-insured Conventional All
Home refinancing
Home improvement All
Multifamily dwellings1 All
1 Commercial bank 8.7 9.6 17.1 25.2 21.7 30.5 68.9 31.7 51.4 31.8 2 Savings association. . . . 9.7 9.4 13.5 22.0 19.3 17.2 7.5 16.8 42.3 16.9 3 Credit union .2 1.7 .2 1.8 1.5 4.1 11.8 3.9 .5 3.9 4 Mortgage company2.. . . 81.5 79.2 69.2 51.1 57.5 48.1 11.8 47.6 5.8 47.4
5 Total 100 100 100 100 100 100 100 100 100 100
MEMO Distribution of loans
6 Number 538,697 210,379 10,548 2,736,125 3,495,749 1,638,858 997,395 6,132,002 19,234 6,151,236 7 Percent 8.8 3.4 .2 44.5 56.8 26.6 16.2 99.7 .3 100.0
*Less than 0.05 percent. 2. Comprises all covered mortgage companies, including those affiliated with a commer-1. Multifamily dwellings are those for five or more families. cial bank, savings association, or credit union.
SOURCE. FFIEC, Home Mortgage Disclosure Act.
Digitized for FRASER http://fraser.stlouisfed.org/ Federal Reserve Bank of St. Louis

Home Mortgage Disclosure A69
4.37 APPLICATIONS FOR LOANS FOR ONE- TO FOUR-FAMILY HOMES REPORTED UNDER HMDA By Purpose of Loan and Characteristics of Applicant and Census Tract, 1995
Characteristic
Home purchase
Government-backed
Number
MEMO Percentage of
characteristic's home purchase
loans
MEMO Percentage of
characteristic's home purchase
loans
Home refinancing Home improvement
Racial/ethnic identity 1 American Indian or
Alaskan Native . . . 4,051 .4 2 Asian or Pacific
Islander 15,172 1.6 3 Black 146,717 15.4 4 Hispanic 106,687 11.2 5 White 643,050 67.4 6 Other 5,933 .6 7 All 32,652 3.4
8 Total 954,262 100.0
Income (percentage of MSA median)2
9 Less than 80 314,092 39.1 10 80-99 172,951 21.5 11 100-119 126,099 15.7 12 120 or more 189,610 23.6
13 Total 802,752 100.0
CENSUS TRACT
Racial/ethnic compostion (minorities as percentage of population)
14 Less than 10 295,903 37.1 15 10-19 186,689 23.4 16 20-49 206,070 25.8 17 50-79 64,117 8.0 18 80-100 44,770 5.6
19 Total 797,549 100.0
Income 3
20 Low or moderate 144,546 17.9 21 Middle 463,961 57.5 22 Upper 197,731 24.5
23 Total 806,238 100.0
Location 4
24 Central city 379,043 46.3 25 Non-central city 439,447 53.7
26 Total 818,490 100.0
12.9
11.1 31.0 29.3 15.7 12.6 25.7
18.1
26.1 29.1 25.2 12.3
20.9
15.9 22.5 28.4 27.5 29.3
21.0
26.1 23.6 15.3
24.2 18.9
27,351 .6
121,089 2.8 325,849 7.5 257,826 6.0
3,462,366 80.0 41,107 .9 94,386 2.2
4,329,974 100.0
890,953 29.3 420,408 13.8 374,235 12.3
1,357,489 44.6
3,043,085 100.0
1,562,872 641,595 518,268 168,716 108,084
2,999,535
409,030 1,500,430 1,092,905
3,002,365
1,186,518 1,886,593
3,073,111
52.1 21.4 17.3 5.6 3.6
100.0
13.6 50.0 36.4
38.6 61.4
87.1
88.9 69.0 70.7 84.3 87.4 74.3
81.9
73.9 70.9 74.8 87.7
79.1
84.1 77.5 71.6 72.5 70.7
79.0
73.9 76.4 84.7
75.8 81 .1
10,578
65,964 189,379 128,399
1,740,552 27,321 44,033
2,206,226
541,331 272,217 251,248 885,912
1,950,708
975,894 396,944 366,150 155,564 163,603
2,058,155
358,685 1,033,298
674,890
2,066,873
833,506 1,276,772
2,110,278
3.0 8.6 5.8
78.9 1.2 2.0
100.0
27.8 14.0 12.9 45.4
100.0
47.4 19.3 17.8 7.6 7.9
100.0
17.4 50.0 32.7
39.5 60.5
9,617
20,414 171,075 115,237
1,054,827 14,633 25,527
1,411,330
482,376 196,614 174,783 496,706
1,350,479
617,724 233,098 228,549 103,062 135,092
1,317,525
296,817 694,042 349,440
1,340,299
606,417 765,234
1,371,651
.7
1.4 12.1 8.2
74.7 1.0 1.8
100.0
35.7 14.6 12.9 36.8
100.0
46.9 17.7 17.3 7.8
10.3
100.0
22.1 51.8 26.1
100.0
44.2 55.8
NOTE. Lenders reported 9,926,444 applications for home loans in 1995. Not all character-istics were reported for all applications; thus the number of applications being distributed by characteristic varies by characteristic.
1. Loans backed by the Federal Housing Administration, the Department of Veterans Affairs, or the Farmers Home Administration.
2. MSA median is median family income of the metropolitan statistical area (MSA) in which the property related to the loan is located.
3. Census tracts are categorized by the median family income for the tract relative to the
median family income for the MSA in which the tract is located. Categories are defined as follows: Low or moderate income, median family income for census tract less than 80 percent of median family income for MSA; Middle income, median family income at least 80 percent and less than 120 percent of MSA median; Upper income, median family income 120 percent and greater of MSA median.
4. For census tracts located in MSAs. SOURCE. FFTEC, Home Mortgage Disclosure Act.
Digitized for FRASER http://fraser.stlouisfed.org/ Federal Reserve Bank of St. Louis

A68 Special Tables • September 1996
4.38 APPLICATIONS FOR LOANS FOR ONE- TO FOUR-FAMILY HOMES REPORTED UNDER HMDA By Purpose of Loan, with Denial Rate, and by Characteristic of Applicant, 1995
Applicant characteristic1
Home purchase
Home refinancing Home improvement Applicant
characteristic1 Government-backed2 Conventional
Home refinancing Home improvement Applicant
characteristic1
Distribution Denial rate Distribution Denial rate Distribution Denial rate Distribution Denial rate
American Indian or Alaskan Native 1 One male 32.30 12.40 27.20 42.10 27.50 21.10 28.90 35.30 2 Two males 1.60 15.40 1.70 35.30 1.50 17.20 1.40 28.70 3 One female 25.90 14.40 27.60 43.30 22.70 22.00 27.60 36.50 4 Two females 2.90 9.40 2.40 43.10 1.80 15.90 1.20 29.80 5 One male and one female 37.20 13.50 41.20 39.80 46.50 17.40 41.00 27.90
6 Total3 100.00 13.30 100.00 41.40 100.00 19.70 100.00 32.60
Asian or Pacific Islander 1 One male 20.70 9.70 18.60 15.20 15.80 21.00 22.50 36.80 8 Two males 3.70 10.10 3.00 14.90 1.90 19.30 1.40 33.50 9 One female 13.10 9.00 13.60 15.20 13.70 21.90 16.10 34.10
10 Two females 2.30 8.90 1.90 14.80 1.70 18.10 1.10 33.30 11 One male and one female 60.20 8.00 62.90 10.50 67.00 18.40 59.00 24.90
12 Total3 100.00 8.70 100.00 12.50 100.00 19.30 100.00 29.40
Black 13 One male 26.80 14.90 25.00 40.80 23.40 25.80 26.60 40.10 14 Two males 1.00 14.00 1.00 40.80 .70 25.00 .50 42.10 15 One female 30.60 14.20 34.60 42.20 30.70 25.80 36.80 40.70 16 Two females 2.80 16.60 2.90 45.80 2.00 26.80 1.80 44.20 17 One male and one female 38.90 16.20 36.50 38.10 43.20 23.70 34.30 35.50
18 Total3 100.00 15.30 100.00 40.50 100.00 24.90 100.00 38.80
Hispanic 19 One male 21.00 9.70 24.70 34.00 19.20 23.80 28.90 43.60 20 Two males 6.80 6.60 3.80 28.10 1.70 28.00 1.30 42.00 21 One female 11.00 10.20 15.00 31.00 16.30 22.80 21.30 45.20 22 Two females 2.20 9.10 2.00 31.40 1.50 26.80 1.10 44.40 23 One male and one female 59.10 9.70 54.40 26.90 61.30 23.70 47.40 35.40
24 Total3 100.00 9.50 100.00 29.50 100.00 23.70 100.00 40.10
White 25 One male 23.10 8.90 20.80 25.70 18.10 16.60 21.20 24.30 26 Two males 1.40 9.00 1.50 21.00 1.20 13.40 .60 24.20 27 One female 15.00 7.80 16.00 24.40 14.00 15.10 17.20 24.10 28 Two females 1.10 9.60 1.20 27.90 .80 15.40 .80 27.90 29 One male and one female 59.40 8.50 60.50 17.60 65.90 12.00 60.10 17.90
30 Total3 100.00 8.50 100.00 20.60 100.00 13.30 100.00 20.40
All 31 One male 23.50 10.10 21.30 27.60 18.60 18.20 22.60 28.90 32 Two males 2.00 8.50 1.60 22.70 1.20 15.60 .70 28.90 33 One female 17.00 9.90 17.40 27.50 15.60 17.60 20.00 30.10 34 Two females 1.50 11.60 1.40 30.70 1.00 18.60 1.00 33.40 35 One male and one female 56.00 9.50 58.20 19.00 63.50 13.60 55.70 20.70
36 Total3 100.00 9.80 100.00 22.60 100.00 15.20 100.00 24.60
1. Applicants are categorized by race of first applicant listed on Loan Application Register, 3. Includes all applicants from racial or ethnic group regardless of whether gender was except for joint white and minority applications, which are not shown in this table. reported.
2. Loans backed by the Federal Housing Administration, the Department of Veterans SOURCE. FFIEC, Home Mortgage Disclosure Act. Affairs, or the Farmers Home Administration.
Digitized for FRASER http://fraser.stlouisfed.org/ Federal Reserve Bank of St. Louis

Home Mortgage Disclosure A71
4.39 APPLICATIONS FOR HOME LOANS REPORTED UNDER HMDA By Loan Program and Size of Dwelling, 1995
Percent
One- to four-family dwellings
Type of loan Home purchase Home refinancing
Approved Approved Approved Approved and but not Denied Withdrawn File closed Total and but not Denied Withdrawn File closed Total
accepted accepted accepted accepted
1 FHA 77.0 1.5 9.8 10.2 1.6 100 68.6 4.1 8.2 14.0 5.2 100 2 VA 77.2 1.3 10.0 10.2 1.4 100 76.9 3.0 6.0 11.1 3.0 100 3 FmHA 71.2 1.7 15.1 10.5 1.5 100 51.3 .4 39.4 8.4 .6 100 4 Conventional 60.8 8.0 22.6 7.2 1.3 100 60.3 6.1 19.9 11.7 2.1 100 5 All 63.7 6.8 20.3 7.7 1.3 100 60.9 5.9 19.2 11.8 2.2 100
One- to four-family dwellings
Home improvement
Approved Approved Approved Approved and but not Denied Withdrawn File closed Total and but not Denied Withdrawn File closed Total
accepted accepted accepted accepted
1 FHA 33.1 13.4 41.6 10.8 1.0 100 79.4 .9 12.0 7.3 .4 100 2 VA 32.3 8.9 42.2 16.4 .2 100 74.1 * 14.8 11.1 * 100 3 FmHA 64.0 2.2 22.5 7.9 3.4 100 91.7 * * 8.3 * 100 4 Conventional 59.6 7.7 27.3 4.7 .7 100 66.8 3.8 17.4 10.2 1.8 100 5 All 57.0 8.2 28.7 5.3 .7 100 67.0 3.7 17.4 10.1 1.8 100
NOTE. Loans approved and accepted were approved by the lender and accepted by the *Less than 0.05 percent, applicant. Loans approved but not accepted were approved by the lender but not accepted by 1. Multifamily dwellings are those for five or more families, the applicant. Applications denied were denied by the lender, and applications withdrawn SOURCE. FFIEC, Home Mortgage Disclosure Act. were withdrawn by the applicant. When an application was left incomplete by the applicant, the lender reported file closed and took no further action. >
Digitized for FRASER http://fraser.stlouisfed.org/ Federal Reserve Bank of St. Louis

A68 Special Tables • September 1996
4.40 APPLICATIONS FOR ONE- TO FOUR-FAMILY HOME LOANS REPORTED UNDER HMDA By Disposition of Loan and Characteristics of Applicant and Census Tract, 1995
A. Home Purchase Loans Percent
Government-backed 1 Conventional Characteristic
Approved Denied Withdrawn File closed Total Approved Denied Withdrawn File closed Total
APPLICANT
Racial or ethnic identity 1 American Indian or
Alaskan Native 71.9 13.3 12.7 2.1 100 50.7 41.4 6.8 1.1 100 2 Asian or Pacific Islander. . 79.4 8.7 10.6 1.4 100 75.9 12.5 9.7 1.9 100 3 Black 71.1 15.3 11.4 2.2 100 51.1 40.5 6.7 1.7 100 4 Hispanic 77.6 9.5 11.2 1.6 100 60.2 29.5 8.3 2.0 100 5 White 81.1 8.5 9.1 1.3 100 71.8 20.6 6.5 1.1 100 6 Other 76.7 10.7 10.8 1.9 100 59.4 29.6 8.9 2.0 100 7 Joint2 79.1 10.1 9.6 1.2 100 68.5 22.4 7.7 1.3 100
Income ratio (percentage of MSA median)3
8 Less than 80 79.1 10.9 8.8 1.3 100 63.1 29.9 5.9 1.1 100 9 American Indian or
Alaskan Native . . . 72.4 14.1 11.1 2.4 100 52.6 40.8 5.5 1.1 100 10 Asian or Pacific
Islander 79.0 9.6 10.2 1.2 100 73.6 16.5 8.2 1.7 100 11 Black 72.1 15.6 10.4 1.9 100 54.2 37.3 6.6 1.8 100 12 Hispanic 79.1 10.0 9.4 1.5 100 59.1 32.4 6.8 1.8 100 13 White 82.0 9.2 7.9 1.0 100 65.5 28.4 5.2 .9 100 14 Other 76.2 12.0 10.2 1.6 100 54.3 37.4 6.9 1.4 100 15 Joint2 77.8 12.3 8.9 1.0 100 57.4 35.6 6.0 1.0 100 16 80-99 83.6 7.6 7.8 1.0 100 74.0 18.0 6.8 1.2 100 17 American Indian or
Alaskan Native . . . 78.0 10.2 10.5 1.4 100 64.8 26.4 7.7 1.1 100 18 Asian or Pacific
Islander 82.9 7.4 8.8 1.0 100 78.2 11.2 9.0 1.6 100 19 Black 77.2 11.8 9.4 1.6 100 61.8 27.9 8.4 1.9 100 20 Hispanic 81.6 8.2 9.1 1.1 100 65.7 24.6 7.9 1.8 100 21 White 85.8 6.3 7.1 .8 100 76.5 16.4 6.1 1.0 100 22 Other 80.8 9.3 8.9 1.0 100 67.3 22.7 8.3 1.6 100 23 Joint2 83.2 8.4 7.6 .8 100 68.0 24.1 6.7 1.1 100 24 100-119 84.7 6.8 7.6 .9 100 77.7 13.9 7.2 1.2 100 25 American Indian or
Alaskan Native . . . 77.5 9.4 11.8 1.3 100 69.2 19.6 9.6 1.6 100 26 Asian or Pacific
Islander 84.0 6.0 8.7 1.2 100 78.7 10.4 9.2 1.6 100 27 Black 78.0 11.3 9.3 1.4 100 64.8 23.9 9.0 2.2 100 28 Hispanic 82.0 7.4 9.5 1.1 100 67.2 22.4 8.5 1.9 100 29 White 86.8 5.7 6.8 .7 100 80.3 12.3 6.4 1.0 100 30 Other 79.4 9.1 9.8 1.7 100 69.8 19.2 9.1 2.0 100 31 Joint2 84.5 7.1 7.8 .7 100 74.2 17.5 7.1 1.2 100 32 120 or more 84.4 6.4 8.2 .9 100 82.2 8.7 7.9 1.2 100 33 American Indian or
Alaskan Native . . . 80.5 7.6 10.3 1.6 100 74.7 13.4 10.4 1.5 100 34 Asian or Pacific
Islander 83.6 6.7 8.8 .9 100 79.0 9.5 9.8 1.7 100 35 Black 79.1 10.5 8.9 1.5 100 70.7 17.5 9.6 2.1 100 36 Hispanic 80.7 7.0 11.1 1.2 100 72.2 15.6 10.1 2.2 100 37 White 86.5 5.4 7.3 .8 100 84.2 7.6 7.3 1.0 100 38 Other 81.9 7.1 9.5 1.5 100 73.7 13.6 10.5 2.2 100 39 Joint2 84.0 7.2 8.0 .8 100 79.9 10.7 8.3 1.2 100
CENSUS TRACT
Racial or ethnic composition (minorities as percentage of population)
40 Less than 10 84.4 7.4 7.3 .9 100 79.2 13.2 6.6 .9 100 41 10-19 82.7 8.0 8.3 1.0 100 74.7 16.1 7.9 1.2 100 42 20-49 80.1 9.3 9.4 1.2 100 69.6 20.8 8.2 1.5 100 43 50-79 76.8 11.1 10.6 1.6 100 65.2 24.0 8.9 1.9 100 44 80-100 74.5 11.6 11.8 2.1 100 59.5 28.1 9.9 2.5 100
Income4
45 Low or moderate 77.6 10.9 10.0 1.6 100 64.4 26.3 7.7 1.6 100 46 Middle 82.4 8.3 8.2 1.0 100 73.9 18.0 6.9 1.1 100 47 Upper 83.0 7.4 8.7 .9 100 80.8 10.1 8.0 1.1 100
Location5
48 Central city 80.5 9.5 8.8 1.2 100 73.4 17.6 7.6 1.3 100 49 Non-central city 82.7 7.8 8.5 1.0 100 75.9 15.7 7.2 1.1 100
Digitized for FRASER http://fraser.stlouisfed.org/ Federal Reserve Bank of St. Louis

Home Mortgage Disclosure A73
4.40 APPLICATIONS FOR ONE- TO FOUR-FAMILY HOME LOANS REPORTED UNDER HMDA By Disposition of Loan and Characteristics of Applicant and Census Tract, 1995—Continued
B. Home Refinancing and Home Improvement Loans Percent
Characteristic
Home refinancing Home improvement
Characteristic
Approved Denied Withdrawn File closed Total Approved Denied Withdrawn File closed Total
APPLICANT
Racial or ethnic identity 1 American Indian or
Alaskan Native 62.4 19.7 15.0 2.9 100 62.0 32.6 4.7 .7 100 2 Asian or Pacific Islander. . 66.2 19.3 12.0 2.5 100 62.7 29.4 6.0 1.9 100 3 Black 58.9 24.9 13.1 3.0 100 56.4 38.8 4.2 .6 100 4 Hispanic 60.5 23.7 13.0 2.9 100 54.9 40.1 4.1 .9 100 5 White 75.9 13.3 8.8 1.9 100 75.2 20.4 3.8 .5 100 6 Other 55.1 25.3 16.6 3.0 100 54.0 33.7 11.4 .9 100 7 Joint2 70.8 17.7 9.4 2.1 100 71.2 23.6 4.4 .7 100
Income ratio (percentage of MSA median)3
8 Less than 80 59.3 26.5 12.2 2.0 100 55.6 38.7 5.0 .7 100 9 American Indian or
Alaskan Native . . . 59.4 23.6 14.4 2.6 100 55.7 39.1 4.5 .8 100 10 Asian or Pacific
Islander 60.1 24.1 13.0 2.8 100 51.4 41.4 5.4 1.8 100 11 Black 56.2 28.3 12.8 2.7 100 50.7 44.6 4.1 .6 100 12 Hispanic 56.1 28.9 12.3 2.7 100 48.3 46.5 4.2 .9 100 13 White 71.1 18.0 9.1 1.8 100 67.3 28.3 3.9 .5 100 14 Other 47.4 32.7 17.0 2.9 100 48.2 41.6 9.1 1.0 100 15 Joint2 62.5 25.7 9.8 2.0 100 55.9 38.8 4.7 .6 100 16 80-99 67.1 20.0 10.9 2.0 100 64.8 29.6 4.9 .7 100 17 American Indian or
Alaskan Native . . . 64.3 19.8 14.3 1.7 100 68.6 25.7 5.2 .5 100 18 Asian or Pacific
Islander 67.3 19.4 11.2 2.1 100 60.7 30.9 6.7 1.7 100 19 Black 59.8 24.6 12.7 2.9 100 58.0 37.4 4.0 .6 100 20 Hispanic 59.5 25.9 11.7 2.9 100 54.5 39.9 4.6 1.0 100 21 White 76.7 13.3 8.2 1.7 100 74.7 21.2 3.6 .5 100 22 Other 57.9 24.1 14.4 3.6 100 54.5 33.9 10.9 .6 100 23 Joint2 69.8 18.8 9.0 2.4 100 65.9 28.9 4.5 .8 100 24 100-119 69.7 18.0 10.4 1.8 100 68.4 25.9 5.0 .7 100 25 American Indian or
Alaskan Native . . . 65.2 18.4 14.1 2.2 100 70.1 23.6 5.5 .8 100 26 Asian or Pacific
Islander 68.9 18.4 10.6 2.1 100 63.4 28.1 6.6 1.8 100 27 Black 61.3 23.8 12.3 2.6 100 60.5 35.0 4.0 .4 100 28 Hispanic 59.9 25.3 12.0 2.8 100 55.9 38.5 4.7 .9 100 29 White 78.4 12.1 7.9 1.6 100 77.7 18.2 3.6 .5 100 30 Other 59.7 23.8 13.2 3.4 100 52.1 33.7 13.6 .5 100 31 Joint2 70.8 18.7 8.7 1.7 100 72.0 23.6 3.9 .5 100 32 120 or more 73.7 14.7 9.7 1.9 100 74.3 19.9 4.8 .9 100 33 American Indian or
Alaskan Native . . . 66.3 15.6 15.2 2.8 100 73.9 19.9 5.4 .8 100 34 Asian or Pacific
Islander 69.1 17.4 10.9 2.5 100 69.6 22.5 5.8 2.1 100 35 Black 62.4 22.9 11.9 2.8 100 65.8 29.5 4.1 .6 100 36 Hispanic 66.1 19.4 11.9 2.6 100 62.7 33.1 3.3 .9 100 37 White 79.6 10.8 7.9 1.7 100 82.3 13.6 3.5 .7 100 38 Other 62.1 21.8 13.0 3.1 100 60.4 26.1 12.0 1.4 100 39 Joint2 73.3 16.0 8.8 1.9 100 77.1 18.0 4.2 .8 100
CENSUS TRACT
Racial or ethnic composition (minorities as percentage of population)
40 Less than 10 73.7 14.8 9.7 1.8 100 74.1 20.7 4.6 .5 100 41 10-19 67.4 18.7 11.5 2.4 100 66.4 27.3 5.3 1.0 100 42 20-49 61.6 22.6 13.2 2.6 100 59.4 33.9 5.6 1.1 100 43 50-79 55.5 27.0 14.8 2.7 100 52.4 40.9 5.6 1.1 100 44 80-100 51.1 30.3 15.8 2.8 100 48.2 45.1 5.8 1.0 100
Income4
45 Low or moderate 56.2 26.9 14.5 2.5 100 54.2 39.9 5.1 .8 100 46 Middle 68.1 18.6 11.1 2.2 100 67.1 27.3 4.9 .7 100 47 Upper 71.8 15.5 10.6 2.2 100 71.9 21.8 5.2 1.0 100
Location5
48 Central city 63.8 21.2 12.7 2.4 100 62.1 32.1 5.0 .8 100 49 Non-central city 69.7 17.5 10.7 2.1 100 68.4 25.8 5.0 .7 100
NOTE. Applicant income ratio is applicant income as a percentage of MSA median. MSA median is median family income of the metropolitan statistical area (MSA) in which the property related to the loan is located.
1. Loans backed by the Federal Housing Administration, the Department of Veterans Affairs, or the Farmers Home Administration.
2. White and minority. 3. MSA median is median family income of the metropolitan statistical area (MSA) in
which the property related to the loan is located.
4. Census tracts are categorized by the median family income for the tract relative to the median family income for the MSA in which the tract is located. Categories are defined as follows: Low or moderate income, median family income for census tract less than 80 percent of median family income for MSA; Middle income, median family income at least 80 percent and less than 120 percent of MSA median; Upper income, median family income 120 percent and greater of MSA median.
5. For census tracts located in MSAs. SOURCE. FFIEC, Home Mortgage Disclosure Act.
Digitized for FRASER http://fraser.stlouisfed.org/ Federal Reserve Bank of St. Louis

A74 Special Tables • September 1996
4.41 HOME LOANS SOLD By Purchaser and Characteristics of Borrower and Census Tract, 1995
Fannie Mae Ginnie Mae Freddie Mac FmHA Commercial bank Characteristic Characteristic
Number Percent Number Percent Number Percent Number Percent Number Percent
1 All 974,528 100.0 630,742 100.0 589,130 100.0 4,832 100.0 109,889 100.0
BORROWER
Racial or ethnic identity 2 American Indian or Alaskan Native . . . . 3 Asian or Pacific Islander 4 Black 5 Hispanic 6 White 7 Other 8 Joint
3,300 33,327 39,457 48,216
716,818 6,444
19,379
.4 3.8 4.6 5.6
82.7 .7
2.2
1,984 7,648
64,647 50,380
329,672 2,961
15,860
.4 1.6
13.7 10.6 69.7
.6 3.4
1,566 16,320 18,289 20,412
458,543 3,370
10,639
.3 3.1 3.5 3.9
86.7 .6
2.0
13 116 299 516
3,224 30 85
.3 2.7 7.0
12.0 75.3
.7 2.0
384 1,996 9,931 7,427
75,839 710
2,151
.4 2.0
10.1 7.5
77.0 .7
2.2
9 Total 866,941 100.0 473,152 100.0 529,139 100.0 4,283 100.0 98,438 100.0
Income ratio (percentage of MSA median)
10 Less than 80 11 80-99 12 100-119 13 120 or more
153,849 112,007 110,791 359,305
20.9 15.2 15.1 48.8
135,399 83,691 65,105 98,646
35.4 21.9 17.0 25.8
80,395 60,698 63,857
212,033
19.3 14.6 15.3 50.8
1,197 711 352 499
43.4 25.8 12.8 18.1
23,040 14,534 12,920 40,296
25.4 16.0 14.2 44.4
14 Total 735,952 100.0 382,841 100.0 416,983 100.0 2,759 100.0 90,790 100.0
CENSUS TRACT
Racial or ethnic composition (minorities as percentage of population)
15 Less than 10 16 10-19 17 20-49 18 50-79 19 80-100
427,204 168,129 130,785 42,855 26,561
53.7 21.1 16.4 5.4 3.3
200,880 127,528 136,795 41,075 27,526
37.6 23.9 25.6
7.7 5.2
271,474 90,454 62,239 16,789 9,162
60.3 20.1 13.8 3.7 2.0
1,779 983 702 175 134
47.2 26.1 18.6 4.6 3.6
46,625 19,570 17,851 5,291 4,681
49.6 20.8 19.0 5.6 5.0
20 Total 795,534 100.0 533,804 100.0 450,118 100.0 3,773 100.0 94,018 100.0
Income 21 Low or moderate 22 Middle 23 Upper
80,537 397,045 317,978
10.1 49.9 40.0
88,904 315,846 135,715
16.4 58.4 25.1
38,772 228,226 183,183
8.6 50.7 40.7
638 2,223
916
16.9 58.9 24.3
12,459 47,562 35,158
13.1 50.0 36.9
24 Total 795,560 100.0 540,465 100.0 450,181 100.0 3,777 100.0 95,179 100.0
Location 25 Central city 26 Non-central city
299,737 496,568
37.6 62.4
242,436 298,320
44.8 55.2
158,869 291,712
35.3 64.7
979 2,799
25.9 74.1
37,672 57,636
39.5 60.5
27 Total 796,305 100.0 540,756 100.0 450,581 100.0 3,778 100.0 95,308 100.0
Digitized for FRASER http://fraser.stlouisfed.org/ Federal Reserve Bank of St. Louis

Home Mortgage Disclosure A75
4.41 HOME LOANS SOLD By Purchaser and Characteristics of Borrower and Census Tract, 1995—Continued
Characteristic
Savings bank or savings and loan association Life insurance company Affiliate
Characteristic
Number Percent Number Percent Number Percent Number
1 All 44,587 100.0 6,433 100.0 389,980 100.0 1,036,012
BORROWER
Racial or ethnic identity 1 American Indian or Alaskan Native . . . . 86 .2 18 .3 1,741 .5 4,193 3 Asian or Pacific Islander 766 1.9 123 2.0 7,530 2,2 24,089 4 Black 2,782 7.0 726 11.7 26,491 7.7 94,321 5 Hispanic 1,568 3.9 406 6.6 18,268 5.3 70,252 6 White 33,549 84.4 4,757 76.8 279,339 81.1 716,203 7 Other 233 .6 34 .5 3,356 1.0 10,302 8 Joint 753 1.9 128 2.1 7,628 2.2 25,228
9 Total 3 9 , 7 3 7 1 0 0 . 0 6 , 1 9 2 1 0 0 . 0 3 4 4 , 3 5 3 1 0 0 . 0 9 4 4 , 5 8 8
Income ratio (percentage of MSA median)
10 Less than 80 8,377 23.0 1,605 28.3 71,678 27.6 236,104 11 80-99 5,361 14.7 968 17.1 34,586 13.3 127,709 12 100-119 5,036 13.8 843 14.9 29,687 11.4 104,946 13 120 or more 17,606 48.4 2,246 39.7 123,716 47.6 307,577
14 Total 3 6 , 3 8 0 1 0 0 . 0 5 , 6 6 2 1 0 0 . 0 2 5 9 , 6 6 7 1 0 0 . 0 7 7 6 , 3 3 6
CENSUS TRACT
Racial or ethnic composition (minorities as percentage of population)
53.9 15 Less than 10 24,295 63.8 3,069 52.7 156,068 53.9 362,771 16 10-19 6,498 17.1 1,214 20.9 65,387 22.6 188,767 17 20-49 4,562 12.0 928 15.9 47,479 16.4 176,808 18 50-79 1,448 3.8 359 6.2 12,651 4.4 57,415 19 80-100 1,253 3.3 252 4.3 8,038 2.8 49,423
20 Total 3 8 , 0 5 6 1 0 0 . 0 5 , 8 2 2 1 0 0 . 0 2 8 9 , 6 2 3 1 0 0 . 0 8 3 5 , 1 8 4
Income 21 Low or moderate 4,573 12.0 783 13.5 36,422 12.4 132,639 22 Middle 18,334 48.0 3,076 52.9 137,963 47.0 436,930 23 Upper 15,302 40.0 1,956 33.6 119,015 40.6 269,138
24 Total 3 8 , 2 0 9 1 0 0 . 0 5 , 8 1 5 1 0 0 . 0 2 9 3 , 4 0 0 1 0 0 . 0 8 3 8 , 7 0 7
Location 25 Central city 12,941 33.8 2,181 37.5 115,675 39.4 345,319 26 Non-central city 25,314 66.2 3,641 62.5 177,954 60.6 494,282
27 Total 3 8 , 2 5 5 1 0 0 . 0 5 , 8 2 2 1 0 0 . 0 2 9 3 , 6 2 9 1 0 0 . 0 8 3 9 , 6 0 1
Note. Includes securitized loans. See also notes to table 4.40. Fannie Mae—Federal National Mortgage Association Ginnie Mae—Government National Mortgage Association Freddie Mac—Federal Home Loan Mortgage Corporation
FmHA—Farmers Home Administration Affiliate—Affiliate of institution reporting the loan SOURCE. FFIEC, Home Mortgage Disclosure Act.
Digitized for FRASER http://fraser.stlouisfed.org/ Federal Reserve Bank of St. Louis

A76
Index to Statistical Tables
References are to pages A3-A75 although the prefix "A" is omitted in this index ACCEPTANCES, bankers (See Bankers acceptances) Agricultural loans, commercial banks, 19, 20 Assets and liabilities (See also Foreigners)
Banks, by classes, 17-21 Domestic finance companies, 33 Federal Reserve Banks, 10 Financial institutions, 25 Foreign banks, U.S. branches and agencies, 21, 64-67
Automobiles Consumer installment credit, 36 Production, 44, 45
Deposits—Continued Interest rates, 15 Turnover, 16
Discount rates at Reserve Banks and at foreign central banks and foreign countries (See Interest rates)
Discounts and advances by Reserve Banks (See Loans) Dividends, corporate, 32
EMPLOYMENT, 42 Eurodollars, 23
BANKERS acceptances, 10, 11, 19-22, 23 Bankers balances, 17-21, 64-67. (See also Foreigners) Bonds (See also U.S. government securities)
New issues, 31 Rates, 23
Branch banks, 21 Business activity, nonfinancial, 42 Business loans (See Commercial and industrial loans)
CAPACITY utilization, 43 Capital accounts
Banks, by classes, 17 Federal Reserve Banks, 10
Central banks, discount rates, 61 Certificates of deposit, 23 Commercial and industrial loans
Commercial banks, 19, 20 Weekly reporting banks, 19-21
Commercial banks Assets and liabilities, 17-21 Commercial and industrial loans, 17-21 Consumer loans held, by type and terms, 36 Deposit interest rates of insured, 15 Loans sold outright, 20 Real estate mortgages held, by holder and property, 35, 74 Time and savings deposits, 4
Commercial paper, 22, 23, 33 Condition statements (See Assets and liabilities) Construction, 42, 46 Consumer installment credit, 36 Consumer prices, 42 Consumption expenditures, 49, 50 Corporations
Profits and their distribution, 32 Security issues, 31, 61
Cost of living (See Consumer prices) Credit unions, 36 Currency in circulation, 5 ,13 Customer credit, stock market, 24
DEBITS to deposit accounts, 16 Debt (See specific types of debt or securities) Demand deposits
Banks, by classes, 17-21 Ownership by individuals, partnerships, and
corporations, 20, 21 Turnover, 16
Depository institutions Reserve requirements, 8 Reserves and related items, 4, 5, 6, 12
Deposits (See also specific types) Banks, by classes, 4, 17—21 Federal Reserve Banks, 5, 10
FARM mortgage loans, 35 Federal agency obligations, 5, 9, 10, 11, 28, 29 Federal credit agencies, 30 Federal finance
Debt subject to statutory limitation, and types and ownership of gross debt, 27
Receipts and outlays, 25, 26 Treasury financing of surplus, or deficit, 25 Treasury operating balance, 25
Federal Financing Bank, 30 Federal funds, 6, 19, 20, 21, 23, 25 Federal Home Loan Banks, 30 Federal Home Loan Mortgage Corporation, 30, 34, 35 Federal Housing Administration, 30, 34, 35 Federal Land Banks, 35 Federal National Mortgage Association, 30, 34, 35 Federal Reserve Banks
Condition statement, 10 Discount rates (See Interest rates) U.S. government securities held, 5, 10, 11, 27
Federal Reserve credit, 5, 6, 10, 11 Federal Reserve notes, 10 Federally sponsored credit agencies, 30 Finance companies
Assets and liabilities, 33 Business credit, 33 Loans, 36 Paper, 22, 23
Financial institutions, loans to, 19, 20, 21 Float, 5 Flow of funds, 3 7 ^ 1 Foreign banks, assets and liabilities of U.S. branches and agencies,
20, 21, 64-67 Foreign currency operations, 10 Foreign deposits in U.S. banks, 5, 20 Foreign exchange rates, 62 Foreign trade, 51 Foreigners
Claims on, 52, 55, 56, 57, 59 Liabilities to, 20, 51, 52, 53, 58, 60, 61
GOLD Certificate account, 10 Stock, 5, 51
Government National Mortgage Association, 30, 34, 35 Gross domestic product, 48
HOME Mortgage Disclosure Act Applications for home loans, 68-73 Home loans by lenders, 68, 74, 75 Residential lending by financial institutions, 68, 71, 74, 75
Housing, new and existing units, 46
Digitized for FRASER http://fraser.stlouisfed.org/ Federal Reserve Bank of St. Louis

A77
INCOME, personal and national, 42, 48, 49 Industrial production, 42, 44 Installment loans, 36 Insurance companies, 27, 35 Interest rates
Bonds, 23 Consumer installment credit, 36 Deposits, 15 Federal Reserve Banks, 7 Foreign central banks and foreign countries, 61 Money and capital markets, 23 Mortgages, 34 Prime rate, 22
International capital transactions of United States, 50-61 International organizations, 52, 53, 55, 58, 59 Inventories, 48 Investment companies, issues and assets, 32 Investments (See also specific types)
Banks, by classes, 17-21 Commercial banks, 4, 17-21 Federal Reserve Banks, 10, 11 Financial institutions, 35
LABOR force, 42 Life insurance companies (See Insurance companies) Loans (See also specific types)
Banks, by classes, 17-21 Commercial banks, 17-21, 74, 75 Conventional, 68, 71 Fannie Mae, 74 Federal Reserve Banks, 5, 6, 7, 10, 11 FHA, 68, 71 Financial institutions, 35 FmHA, 68, 71, 74 Freddie Mac, 74 Ginnie Mae, 74 Home purchase, 72 Insured or guaranteed by United States, 34, 35 VA, 68, 71
MANUFACTURING Capacity utilization, 43 Production, 43, 45
Margin requirements, 24 Member banks (See also Depository institutions)
Federal funds and repurchase agreements, 6 Reserve requirements, 8
Mining production, 45 Mobile homes shipped, 46 Monetary and credit aggregates, 4, 12 Money and capital market rates, 23 Money stock measures and components, 4, 13 Mortgages (See Real estate loans) Mutual funds, 32 Mutual savings banks (See Thrift institutions)
NATIONAL defense outlays, 26 National income, 48
OPEN market transactions, 9
PERSONAL income, 49 Prices
Consumer and producer, 42, 47 Stock market, 24
Prime rate, 22 Producer prices, 42, 47 Production, 42, 44 Profits, corporate, 32
REAL estate loans Banks, by classes, 19, 20, 35 Terms, yields, and activity, 34 Type of holder and property mortgaged, 35
Repurchase agreements, 6 Reserve requirements, 8 Reserves
Commercial banks, 17 Depository institutions, 4, 5, 6, 12 Federal Reserve Banks, 10 U.S. reserve assets, 51
Residential mortgage loans, 34, 68-75 Retail credit and retail sales, 36, 42
SAVING Flow of funds, 37-41 National income accounts, 48
Savings institutions, 35, 36, 37 Savings deposits (See Time and savings deposits) Securities (See also specific types)
Federal and federally sponsored credit agencies, 30 Foreign transactions, 60 New issues, 31 Prices, 24
Special drawing rights, 5, 10, 50, 51 State and local governments
Deposits, 19, 20 Holdings of U.S. government securities, 27 New security issues, 31 Ownership of securities issued by, 19, 21 Rates on securities, 23
Stock market, selected statistics, 24 Stocks (See also Securities)
New issues, 31 Prices, 24
Student Loan Marketing Association, 30
TAX receipts, federal, 26 Thrift institutions, 4. (See also Credit unions and Savings
institutions) Time and savings deposits, 4, 13, 15, 17-21 Trade, foreign, 51 Treasury cash, Treasury currency, 5 Treasury deposits, 5, 10, 25 Treasury operating balance, 25 UNEMPLOYMENT, 42 U.S. government balances
Commercial bank holdings, 17-21 Treasury deposits at Reserve Banks, 5, 10, 25
U.S. government securities Bank holdings, 17-21, 27 Dealer transactions, positions, and financing, 29 Federal Reserve Bank holdings, 5, 10, 11, 27 Foreign and international holdings and
transactions, 10, 27, 61 Open market transactions, 9 Outstanding, by type and holder, 27, 28 Rates, 23
U.S. international transactions, 50-62 Utilities, production, 45
VETERANS Administration, 34, 35
WEEKLY reporting banks, 17-21 Wholesale (producer) prices, 42, 47
YIELDS (See Interest rates)
Digitized for FRASER http://fraser.stlouisfed.org/ Federal Reserve Bank of St. Louis

A78
Federal Reserve Board of Governors and Official Staff
ALAN GREENSPAN, Chairman ALICE M . RIVLIN, Vice Chair
E D W A R D W . K E L L E Y , JR. L A W R E N C E B . L I N D S E Y
OFFICE OF BOARD MEMBERS
JOSEPH R . COYNE, Assistant to the Board DONALD J. WINN, Assistant to the Board THEODORE E. ALLISON, Assistant to the Board for Federal
Reserve System Affairs LYNN S. FOX, Deputy Congressional Liaison WINTHROP P. HAMBLEY, Special Assistant to the Board BOB STAHLY MOORE, Special Assistant to the Board DIANE E. WERNEKE, Special Assistant to the Board PORTIA W. THOMPSON, Equal Employment Opportunity
Programs Adviser
LEGAL DIVISION
J. VIRGIL MATTINGLY, JR., General Counsel SCOTT G. ALVAREZ, Associate General Counsel RICHARD M . ASHTON, Associate General Counsel OLIVER IRELAND, Associate General Counsel KATHLEEN M . O'DAY, Associate General Counsel ROBERT DEV. FRIERSON, Assistant General Counsel KATHERINE H. WHEATLEY, Assistant General Counsel
OFFICE OF THE SECRETARY WILLIAM W. WILES, Secretary JENNIFER J. JOHNSON, Deputy Secretary BARBARA R. LOWREY, Associate Secretary and Ombudsman
DIVISION OF BANKING SUPERVISION AND REGULATION RICHARD SPILLENKOTHEN, Director STEPHEN C . SCHEMERING, Deputy Director WILLIAM A. RYBACK, Associate Director HERBERT A. BIERN, Deputy Associate Director ROGER T. COLE, Deputy Associate Director JAMES I. GARNER, Deputy Associate Director HOWARD A. AMER, Assistant Director GERALD A. EDWARDS, JR., Assistant Director STEPHEN M . HOFFMAN, JR., Assistant Director JAMES V. HOUPT, Assistant Director JACK P. JENNINGS, Assistant Director MICHAEL G. MARTINSON, Assistant Director RHOGER H PUGH, Assistant Director SIDNEY M . SUSSAN, Assistant Director MOLLY S. WASSOM, Assistant Director WILLIAM SCHNEIDER, Project Director,
National Information Center
DIVISION OF INTERNATIONAL FINANCE EDWIN M . TRUMAN, Staff Director LARRY J. PROMISEL, Senior Associate Director CHARLES J. SIEGMAN, Senior Associate Director DALE W. HENDERSON, Associate Director DAVID H. HOWARD, Senior Adviser DONALD B. ADAMS, Assistant Director THOMAS A . CONNORS, Assistant Director PETER HOOPER III, Assistant Director KAREN H. JOHNSON, Assistant Director CATHERINE L. MANN, Assistant Director RALPH W. SMITH, JR., Assistant Director
DIVISION OF RESEARCH AND STATISTICS MICHAEL J. PRELL, Director EDWARD C. ETTIN, Deputy Director DAVID J. STOCKTON, Deputy Director MARTHA BETHEA, Associate Director WILLIAM R. JONES, Associate Director MYRON L. KWAST, Associate Director PATRICK M . PARKINSON, Associate Director THOMAS D. SIMPSON, Associate Director LAWRENCE SLIFMAN, Associate Director MARTHA S. SCANLON, Deputy Associate Director PETER A. TINSLEY, Deputy Associate Director FLINT BRAYTON, Assistant Director DAVID S. JONES, Assistant Director STEPHEN A. RHOADES, Assistant Director CHARLES S. STRUCKMEYER, Assistant Director ALICE PATRICIA WHITE, Assistant Director JOYCE K. ZICKLER, Assistant Director JOHN J. MINGO, Senior Adviser GLENN B. CANNER, Adviser
DIVISION OF MONETARY AFFAIRS
DONALD L. KOHN, Director DAVID E . LINDSEY, Deputy Director BRIAN F. MADIGAN, Associate Director RICHARD D. PORTER, Deputy Associate Director VINCENT R . REINHART, Assistant Director NORMAND R.V. BERNARD, Special Assistant to the Board
DIVISION OF CONSUMER AND COMMUNITY AFFAIRS
GRIFFITH L. GARWOOD, Director GLENN E. LONEY, Associate Director DOLORES S. SMITH, Associate Director MAUREEN P. ENGLISH, Assistant Director IRENE SHAWN MCNULTY, Assistant Director
Digitized for FRASER http://fraser.stlouisfed.org/ Federal Reserve Bank of St. Louis

S U S A N M . PHILLIPS J A N E T L . Y E L L E N
L A U R E N C E H . M E Y E R
OFFICE OF DIVISION OF RESERVE BANK OPERATIONS STAFF DIRECTOR FOR MANAGEMENT AND PAYMENT SYSTEMS
S. DAVID FROST, Staff Director SHEILA CLARK, EEO Programs Director
DIVISION OF HUMAN RESOURCES MANAGEMENT DAVID L. SHANNON, Director JOHN R. WEIS, Associate Director JOSEPH H. HAYES, JR., Assistant Director FRED HOROWITZ, Assistant Director
OFFICE OF THE CONTROLLER GEORGE E. LIVINGSTON, Controller STEPHEN J. CLARK, Assistant Controller (Programs and Budgets) DARRELL R. PAULEY, Assistant Controller (Finance)
DIVISION OF SUPPORT SERVICES
CLYDE H. FARNSWORTH, JR., Director DAVID L. ROBINSON, Deputy Director (Finance and Control) LOUISE L. ROSEMAN, Associate Director CHARLES W. BENNETT, Assistant Director JACK DENNIS, JR., Assistant Director EARL G. HAMILTON, Assistant Director JEFFREY C . MARQUARDT, Assistant Director JOHN H. PARRISH, Assistant Director FLORENCE M . YOUNG, Assistant Director
OFFICE OF THE INSPECTOR GENERAL BRENT L. BOWEN, Inspector General DONALD L. ROBINSON, Assistant Inspector General BARRY R. SNYDER, Assistant Inspector General
ROBERT E. FRAZIER, Director GEORGE M . LOPEZ, Assistant Director DAVID L. WILLIAMS, Assistant Director
DIVISION OF INFORMATION RESOURCES MANAGEMENT
STEPHEN R . MALPHRUS, Director MARIANNE M . EMERSON, Assistant Director Po KYUNG KIM, Assistant Director RAYMOND H. MASSEY, Assistant Director EDWARD T. MULRENIN, Assistant Director DAY W. RADABAUGH, JR., Assistant Director ELIZABETH B. RIGGS, Assistant Director RICHARD C. STEVENS, Assistant Director
Digitized for FRASER http://fraser.stlouisfed.org/ Federal Reserve Bank of St. Louis

80 Federal Reserve Bulletin • September 1996
Federal Open Market Committee and Advisory Councils
FEDERAL OPEN MARKET COMMITTEE
MEMBERS
ALAN GREENSPAN, Chairman WILLIAM J. MCDONOUGH, Vice Chairman
EDWARD G. BOEHNE JERRY L. JORDAN EDWARD W. KELLEY, JR.
LAWRENCE B. LINDSEY ROBERT D. MCTEER, JR. LAURENCE H . MEYER SUSAN M . PHILLIPS
ALICE M . RIVLIN GARY H. STERN JANET L . YELLEN
ALTERNATE MEMBERS
J. ALFRED BROADDUS, JR. MICHAEL H. MOSKOW ERNEST T. PATRIKIS JACK GUYNN ROBERT T. PARRY
DONALD L . KOHN, Secretary and Economist NORMAND R.V. BERNARD, Deputy Secretary JOSEPH R . COYNE, Assistant Secretary GARY P. GILLUM, Assistant Secretary J. VIRGIL MATTINGLY, JR., General Counsel THOMAS C. BAXTER, JR., Deputy General Counsel MICHAEL J. PRELL, Economist EDWIN M . TRUMAN, Economist RICHARD W. LANG, Associate Economist
STAFF
DAVID E . LINDSEY, Associate Economist FREDERIC S. MISHKIN, Associate Economist LARRY J. PROMISEL, Associate Economist ARTHUR J. ROLNICK, Associate Economist HARVEY ROSENBLUM, Associate Economist CHARLES J. SIEGMAN, Associate Economist THOMAS D. SIMPSON, Associate Economist MARK S. SNIDERMAN, Associate Economist DAVID J. STOCKTON, Associate Economist
PETER R. FISHER, Manager, System Open Market Account
FEDERAL ADVISORY COUNCIL
RICHARD G. TILGHMAN, President FRANK V. CAHOUET, Vice President
WILLIAM M . CROZIER, JR., First District WALTER V. SHIPLEY, Second District WALTER E. DALLER, JR., Third District FRANK V. CAHOUET, Fourth District RICHARD G. TILGHMAN, Fifth District CHARLES E. RICE, Sixth District
ROGER L. FITZSIMONDS, Seventh District THOMAS H. JACOBSEN, Eighth District RICHARD M . KOVACEVICH, Ninth District CHARLES E. NELSON, Tenth District CHARLES T. DOYLE, Eleventh District WILLIAM F. ZUENDT, Twelfth District
HERBERT V. PROCHNOW, Secretary Emeritus JAMES ANNABLE, Co-Secretary
WILLIAM J. KORSVIK, Co-Secretary
Digitized for FRASER http://fraser.stlouisfed.org/ Federal Reserve Bank of St. Louis

A81
CONSUMER ADVISORY COUNCIL
KATHARINE W. MCKEE, Durham, North Carolina, Chairman JULIA M . SEWARD, Richmond, Virginia, Vice Chairman
RICHARD S. AMADOR, LOS Angeles, California THOMAS R. BUTLER, Riverwoods, Illinois ROBERT A. COOK, Baltimore, Maryland ALVIN J. COWANS, Orlando, Florida ELIZABETH G. FLORES, Laredo, Texas HERIBERTO FLORES, Springfield, Massachusetts EMANUEL FREEMAN, Philadelphia, Pennsylvania DAVID C. FYNN, Cleveland, Ohio ROBERT G. GREER, Houston, Texas KENNETH R. HARNEY, Chevy Chase, Maryland GAIL K. HILLEBRAND, San Francisco, California TERRY JORDE, Cando, North Dakota FRANCINE JUSTA, New York, New York EUGENE I. LEHRMANN, Madison, Wisconsin
ERROL T. LOUIS, Brooklyn, New York WILLIAM N. LUND, Falmouth, Maine RONALD A. PRILL, Minneapolis, Minnesota LISA RICE-COLEMAN, Toledo, Ohio JOHN R. RINES, Detroit, Michigan MARGOT SAUNDERS, Washington, D.C. ANNE B. SHLAY, Philadelphia, Pennsylvania REGINALD J. SMITH, Kansas City, Missouri GEORGE P. SURGEON, Arkadelphia, Arkansas GREGORY D. SQUIRES, Milwaukee, Wisconsin JOHN E. TAYLOR, Washington, D.C. LORRAINE VANETTEN, Troy, Michigan THEODORE J. WYSOCKI, JR., Chicago, Illinois LILY K. YAO, Honolulu, Hawaii
THRIFT INSTITUTIONS ADVISORY COUNCIL
E. LEE BEARD, Hazleton, Pennsylvania, President DAVID F. HOLLAND, Burlington, Massachusetts, Vice President
BARRY C. BURKHOLDER, Houston, Texas MICHAEL T. CROWLEY, JR., Milwaukee, Wisconsin GEORGE L. ENGELKE, JR., Lake Success, New York DOUGLAS A. FERRARO, Englewood, Colorado BEVERLY D. HARRIS, Livingston, Montana
CHARLES R. RINEHART, Irwindale, California JOSEPH C. SCULLY, Chicago, Illinois RONALD W. STIMPSON, Memphis, Tennessee LARRY T. WILSON, Raleigh, North Carolina WILLIAM W. ZUPPE, Spokane, Washington
Digitized for FRASER http://fraser.stlouisfed.org/ Federal Reserve Bank of St. Louis

A82
Federal Reserve Board Publications
For ordering assistance, write PUBLICATIONS SERVICES, MS-127, Board of Governors of the Federal Reserve System, Washington, DC 20551 or telephone (202) 452-3244 or FAX (202) 728-5886. You may also use the publications order form available on the Board's World Wide Web site (http://www.bog.frb.fed.us). When a charge is indicated, payment should accompany request and be made payable to the Board of Governors of the Federal Reserve System or may be ordered via Mastercard or Visa. Payment from foreign residents should be drawn on a U.S. bank.
BOOKS AND MISCELLANEOUS PUBLICATIONS THE FEDERAL RESERVE SYSTEM—PURPOSES AND FUNCTIONS.
1994. 157 pp. ANNUAL REPORT. ANNUAL REPORT: BUDGET REVIEW, 1995-96. FEDERAL RESERVE BULLETIN. Monthly. $25.00 per year or $2.50
each in the United States, its possessions, Canada, and Mexico. Elsewhere, $35.00 per year or $3.00 each.
ANNUAL STATISTICAL DIGEST: period covered, release date, num-ber of pages, and price.
1981 October 1982 239 pp. $ 6.50 1982 December 1983 266 pp. $ 7.50 1983 October 1984 264 pp. $11.50 1984 October 1985 254 pp. $12.50 1985 October 1986 231 pp. $15.00 1986 November 1987 288 pp. $15.00 1987 October 1988 272 pp. $15.00 1988 November 1989 256 pp. $25.00 1980-89 March 1991 712 pp. $25.00 1990 November 1991 185 pp. $25.00 1991 November 1992 215 pp. $25.00 1992 December 1993 215 pp. $25.00 1993 December 1994 281 pp. $25.00 1994 December 1995 190 pp. $25.00
SELECTED INTEREST AND EXCHANGE RATES—WEEKLY SERIES OF CHARTS. Weekly. $30.00 per year or $.70 each in the United States, its possessions, Canada, and Mexico. Elsewhere, $35.00 per year or $.80 each.
THE FEDERAL RESERVE ACT and other statutory provisions affect-ing the Federal Reserve System, as amended through August 1990. 646 pp. $10.00.
REGULATIONS OF THE BOARD OF GOVERNORS OF THE FEDERAL RESERVE SYSTEM.
ANNUAL PERCENTAGE RATE TABLES (Truth in Lending— Regulation Z) Vol. I (Regular Transactions). 1969. 100 pp. Vol. II (Irregular Transactions). 1969. 116 pp. Each volume $2.25.
GUIDE TO THE FLOW OF FUNDS ACCOUNTS. 672 pp. $8.50 each. FEDERAL RESERVE REGULATORY SERVICE. Loose-leaf; updated
monthly. (Requests must be prepaid.) Consumer and Community Affairs Handbook. $75.00 per year.
Monetary Policy and Reserve Requirements Handbook. $75.00 per year.
Securities Credit Transactions Handbook. $75,00 per year. The Payment System Handbook. $75.00 per year. Federal Reserve Regulatory Service. Four vols. (Contains all
four Handbooks plus substantial additional material.) $200.00 per year.
Rates for subscribers outside the United States are as follows and include additional air mail costs:
Federal Reserve Regulatory Service, $250.00 per year. Each Handbook, $90.00 per year.
FEDERAL RESERVE REGULATORY SERVICE FOR PERSONAL COMPUTERS. Diskettes; updated monthly.
Standalone PC. $300 per year. Network, maximum 1 concurrent user. $300 per year. Network, maximum 10 concurrent users. $750 per year. Network, maximum 50 concurrent users. $2,000 per year. Network, maximum 100 concurrent users. $3,000 per year. Subscribers outside the United States should add $50 to cover
additional airmail costs. THE U.S. ECONOMY IN AN INTERDEPENDENT WORLD: A MULTI-
COUNTRY MODEL, May 1984. 590 pp. $14.50 each. INDUSTRIAL PRODUCTION —1986 EDITION. December 1986.
440 pp. $9.00 each. FINANCIAL FUTURES AND OPTIONS IN THE U.S. ECONOMY.
December 1986. 264 pp. $10.00 each. FINANCIAL SECTORS IN OPEN ECONOMIES: EMPIRICAL ANALY-
SIS AND POLICY ISSUES. August 1990. 608 pp. $25.00 each.
EDUCATION PAMPHLETS Short pamphlets suitable for classroom use. Multiple copies are available without charge.
Consumer Handbook on Adjustable Rate Mortgages Consumer Handbook to Credit Protection Laws A Guide to Business Credit for Women, Minorities, and Small
Businesses Series on the Structure of the Federal Reserve System
The Board of Governors of the Federal Reserve System The Federal Open Market Committee Federal Reserve Bank Board of Directors Federal Reserve Banks Organization and Advisory Committees
A Consumer's Guide to Mortgage Lock-Ins A Consumer's Guide to Mortgage Settlement Costs A Consumer's Guide to Mortgage Refinancings Home Mortgages: Understanding the Process and Your Right
to Fair Lending How to File a Consumer Complaint Making Deposits: When Will Your Money Be Available? Making Sense of Savings SHOP: The Card You Pick Can Save You Money Welcome to the Federal Reserve When Your Home is on the Line: What You Should Know
About Home Equity Lines of Credit
Digitized for FRASER http://fraser.stlouisfed.org/ Federal Reserve Bank of St. Louis

A83
STAFF STUDIES: Only Summaries Printed in the B U L L E T I N
Studies and papers on economic and financial subjects that are of general interest. Requests to obtain single copies of the full text or to be added to the mailing list for the series may be sent to Publications Services.
Staff Studies 1-157 are out of print.
158. THE ADEQUACY AND CONSISTENCY OF MARGIN REQUIRE-MENTS IN THE MARKETS FOR STOCKS AND DERIVATIVE PRODUCTS, by Mark J. Warshawsky with the assistance of Dietrich Earnhart. September 1989. 23 pp.
159. NEW DATA ON THE PERFORMANCE OF NONBANK SUBSIDI-ARIES OF BANK HOLDING COMPANIES, by Nellie Liang and Donald Savage. February 1990. 12 pp.
160. BANKING MARKETS AND THE USE OF FINANCIAL SER-VICES BY SMALL AND MEDIUM-SIZED BUSINESSES, by Gregory E. Elliehausen and John D. Wolken. September 1990. 35 pp.
161. A REVIEW OF CORPORATE RESTRUCTURING ACTIVITY, 1 9 8 0 - 9 0 , by Margaret Hastings Pickering. May 1991. 21pp.
162. EVIDENCE ON THE SIZE OF BANKING MARKETS FROM MORT-GAGE LOAN RATES IN TWENTY CITIES, by Stephen A . Rhoades. February 1992. 11 pp.
163. CLEARANCE AND SETTLEMENT IN U.S. SECURITIES MAR-KETS, by Patrick Parkinson, Adam Gilbert, Emily Gollob, Lauren Hargraves, Richard Mead, Jeff Stehm, and Mary Ann Taylor. March 1992. 37 pp.
164. THE 1989-92 CREDIT CRUNCH FOR REAL ESTATE, by James T. Fergus and John L. Goodman, Jr. July 1993. 20 pp.
165. THE DEMAND FOR TRADE CREDIT: AN INVESTIGATION OF MOTIVES FOR TRADE CREDIT USE BY SMALL BUSINESSES, b y Gregory E. Elliehausen and John D. Wolken. September 1993. 18 pp.
166. THE ECONOMICS OF THE PRIVATE PLACEMENT MARKET, by Mark Carey, Stephen Prowse, John Rea, and Gregory Udell. January 1994. I l l pp.
167. A SUMMARY OF MERGER PERFORMANCE STUDIES IN BANK-ING, 1 9 8 0 - 9 3 , AND AN ASSESSMENT OF THE "OPERATING PERFORMANCE" AND "EVENT STUDY" METHODOLOGIES, by Stephen A. Rhoades. July 1994. 37 pp.
168. THE ECONOMICS OF THE PRIVATE EQUITY MARKET, by George W. Fenn, Nellie Liang, and Stephen Prowse. Novem-ber 1995. 69 pp.
169. BANK MERGERS AND INDUSTRYWIDE STRUCTURE, 1 9 8 0 - 9 4 , by Stephen A. Rhoades. February 1996. 32 pp.
Digitized for FRASER http://fraser.stlouisfed.org/ Federal Reserve Bank of St. Louis

A84
Maps of the Federal Reserve System
M M M M g ^ J MINNEAPOLIS •
WMSMBBBB. l l p l l II
1 ^ BO^ON
12 • SAN FRANCISCO
— ^ W A A I I i CHICAGO •
10 . „ KANSAS CITY H ^
ST. LOUIS J M I!IIIIHISPIS;BSrii!:
^ ^ • NEW YORK
CLEVELAND PSLADELPHIA
4 g RICHMOND
5 O
iiilllillllliilll IIIIIIIH1 11 •
DALLAS
^ATLANTA
ALASKA HAWAII
L E G E N D
Both pages
• Federal Reserve Bank city
• Board of Governors of the Federal Reserve System, Washington, D.C.
NOTE
The Federal Reserve officially identifies Districts by number and Reserve Bank city (shown on both pages) and by letter (shown on the facing page).
In the 12th District, the Seattle Branch serves Alaska, and the San Francisco Bank serves Hawaii.
The System serves commonwealths and territories as follows: the New York Bank serves the Commonwealth
Facing page
• Federal Reserve Branch city
— Branch boundary
of Puerto Rico and the U.S. Virgin Islands; the San Francisco Bank serves American Samoa, Guam, and the Commonwealth of the Northern Mariana Islands. The Board of Governors revised the branch boundaries of the System most recently in December 1991.
Digitized for FRASER http://fraser.stlouisfed.org/ Federal Reserve Bank of St. Louis

A85
1-A
VT
NH M A ^
CT
BOSTON
2 - B
j t f Buffalo
i CT I / / I / NY
NJ
NEW YORK
3 - C
PHILADELPHIA
4 - D
•Cincinnati
CLEVELAND
5 - E Baltimore MD
VA •
RICHMOND
6 - F
Birmingham^
MS
LA New Orleans
•Nashville
ATLANTA
Jacksonville
> Miami
7 - G
CHICAGO
8 - H
KY
* , / M " ') in Louisville
Little •Memphis
ST. LOUIS
9 - 1 MT
MINNEAPOLIS
10-J WY
1 w
l u Omaha*
Denver ^ MO
KS
Oklahoim City
OK
KANSAS CITY
11-K
DALLAS
12-L
A L A S K A W A •
Seattle
Portland
OR )
N V L
D>
U K (
•T os Anp
Salt iSke City
GJGG
HAWAII * AZ
SAN FRANCISCO
Digitized for FRASER http://fraser.stlouisfed.org/ Federal Reserve Bank of St. Louis

A86
Federal Reserve Banks, Branches, and Offices FEDERAL RESERVE BANK Chairman President Vice President branch, or facility Zip Deputy Chairman First Vice President in charge of branch
BOSTON* 02106 Jerome H. Grossman Cathy E. Minehan William C. Brainard Paul M. Connolly
NEW YORK* 10045 John C. Whitehead William J. McDonough Thomas W. Jones Ernest T. Patrikis
Buffalo 14240 Joseph J. Castiglia Carl W. Turnipseed1
PHILADELPHIA 19105 Donald J. Kennedy Edward G. Boehne Joan Carter William H. Stone, Jr.
CLEVELAND* 44101 A. William Reynolds Jerry L. Jordan G. Watts Humphrey, Jr. Sandra Pianalto
Cincinnati 45201 John N. Taylor, Jr. Charles A. Cerino1
Pittsburgh 15230 John T. Ryan III Harold J. Swart1
RICHMOND* 23219 Claudine B. Malone J. Alfred Broaddus, Jr. Robert L. Strickland Walter A. Varvel
Baltimore 21203 Michael R. Watson William J. Tignanelli1
Charlotte 28230 James O. Roberson Dan M. Bechter1
Culpeper 22701 Julius Malinowski, Jr.2
ATLANTA 30303 Hugh M. Brown Jack Guynn Daniel E. Sweat, Jr. Patrick K. Barron James M. Mckee1
Birmingham 35283 Donald E. Boomershine Fred R. Herr1
Jacksonville 32231 Joan D. Ruffier James D. Hawkins1
Miami 33152 R. Kirk Landon James T. Curry III Nashville 37203 Paula Lovell Melvyn K. Purcell New Orleans 70161 Lucimarian Roberts Robert J. Musso
CHICAGO* 60690 Robert M. Healey Michael H. Moskow Lester H. McKeever, Jr. William C. Conrad
Detroit 48231 Florine Mark David R. Allardice1
ST. LOUIS 63166 John F. McDonnell Thomas C. Melzer Susan S. Elliott W. LeGrande Rives
Little Rock 72203 Janet M. Jones Robert A. Hopkins Louisville 40232 John A. Williams Thomas A. Boone Memphis 38101 John V. Myers John P. Baumgartner
MINNEAPOLIS 55480 Jean D. Kinsey Gary H. Stern David A. Koch Colleen K. Strand
Helena 59601 Lane W. Basso John D.Johnson
KANSAS CITY 64198 Herman Cain Thomas M. Hoenig A. Drue Jennings Richard K. Rasdall
Denver 80217 Peter I. Wold Carl M. Gambs1
Oklahoma City 73125 Barry L. Eller Kelly J. Dubbert Omaha 68102 LeRoy W. Thorn Harold L. Shewmaker
DALLAS 75201 Cece Smith Robert D. McTeer, Jr. Roger R. Hemminghaus Helen E. Holcomb
El Paso 79999 Patricia Z. Holland-Branch Sammie C. Clay Houston 77252 Issac H Kempner III Robert Smith, III1
San Antonio 78295 Carol L. Thompson James L. Stull1
SAN FRANCISCO . . . . 94120 Judith M. Runstad Robert T. Parry James A. Vohs John F. Moore
Los Angeles 90051 Anita E. Landecker Mark Mullinix1
Portland 97208 Ross R. Runkel Raymond H. Laurence1
Salt Lake City 84125 Gerald R. Sherratt Andrea P. Wolcott Seattle 98124 George F. Russell, Jr. Gordon Werkema3
•Additional offices of these Banks are located at Lewiston, Maine 04240; Windsor Locks, Connecticut 06096; East Rutherford, New Jersey 07016; Jericho, New York 11753; Utica at Oriskany, New York 13424; Columbus, Ohio 43216; Columbia, South Carolina 29210; Charleston, West Virginia 25311; Des Moines, Iowa 50306; Indianapolis, Indiana 46204; Milwaukee, Wisconsin 53202; and Peoria, Illinois 61607.
1. Senior Vice President. 2. Assistant Vice President. 3. Executive Vice President
Digitized for FRASER http://fraser.stlouisfed.org/ Federal Reserve Bank of St. Louis

Publications of Interest
FEDERAL RESERVE CONSUMER CREDIT PUBLICATIONS
The Federal Reserve Board publishes a series of pam-phlets covering individual credit laws and topics, as pictured below.
Three booklets on the mortgage process are available: A Consumer's Guide to Mortgage Lock-Ins, A Consum-er's Guide to Mortgage Refinancings, and A Consumer's Guide to Mortgage Settlement Costs. These booklets were prepared in conjunction with the Federal Home Loan Bank Board and in consultation with other federal agencies and trade and consumer groups. The Board also publishes the Consumer Handbook to Credit Pro-tection Laws, a complete guide to consumer credit pro-tections. This forty-four-page booklet explains how to shop and obtain credit, how to maintain a good credit rating, and how to dispute unfair credit transactions.
Shop . . . The Card You Pick Can Save You Money is designed to help consumers comparison shop when looking for a credit card. It contains the results of the Federal Reserve Board's survey of the terms of credit card plans offered by credit card issuers throughout the United States. Because the terms can affect the amount an individual pays for using a credit card, the booklet lists the annual percentage rate (APR), annual fee, grace period, type of pricing (fixed or variable rate), and a telephone number for each card issuer surveyed.
Copies of consumer publications are available free of charge from Publications Services, Mail Stop 127, Board of Governors of the Federal Reserve System, Washington, DC 20551. Multiple copies for classroom use are also available free of charge.
Business C r e d i t
for Women , Minor i t ies , and Sma l l B u s i n e s s e
A C o n s u m e r ' s G u i d e t o
M o r t g a g e Lock - Ins
A fiWMWMNNftl
SHOP
The Card You Pick Can Save You Money
Digitized for FRASER http://fraser.stlouisfed.org/ Federal Reserve Bank of St. Louis

Publications of Interest
FEDERAL RESERVE REGULATORY SERVICE
To promote public understanding of its regulatory func-tions, the Board publishes the Federal Reserve Regu-latory Service, a four-volume loose-leaf service con-taining all Board regulations as well as related statutes, interpretations, policy statements, rulings, and staff opinions. For those with a more specialized interest in the Board's regulations, parts of this service are pub-lished separately as handbooks pertaining to monetary policy, securities credit, consumer affairs, and the pay-ment system.
These publications are designed to help those who must frequently refer to the Board's regulatory materi-als. They are updated monthly, and each contains cita-tion indexes and a subject index.
The Monetary Policy and Reserve Requirements Handbook contains Regulations A, D, and Q, plus related materials.
The Securities Credit Transactions Handbook con-tains Regulations G, T, U, and X, dealing with exten-sions of credit for the purchase of securities, together with related statutes, Board interpretations, rulings, and staff opinions. Also included are the Board's list of marginable OTC stocks and its list of foreign margin stocks.
The Consumer and Community Affairs Handbook contains Regulations B, C, E, M, Z, AA, BB, and DD, and associated materials.
The Payment System Handbook deals with expedited funds availability, check collection, wire transfers, and risk-reduction policy. It includes Regulations CC, J, and EE, related statutes and commentaries, and policy statements on risk reduction in the payment system.
For domestic subscribers, the annual rate is $200 for the Federal Reserve Regulatory Service and $75 for each Handbook. For subscribers outside the United States, the price including additional air mail costs is $250 for the Service and $90 for each Handbook.
The Federal Reserve Regulatory Service is also avail-able on diskette for use on personal computers. For a standalone PC, the annual subscription fee is $300. For network subscriptions, the annual fee is $300 for 1 con-current user, $750 for a maximum of 10 concurrent users, $2,000 for a maximum of 50 concurrent users, and $3,000 for a maximum of 100 concurrent users. Subscribers outside the United States should add $50 to cover additional airmail costs. For further informa-tion, call (202) 452-3244.
All subscription requests must be accompanied by a check or money order payable to the Board of Gover-nors of the Federal Reserve System. Orders should be addressed to Publications Services, mail stop 127, Board of Governors of the Federal Reserve System, Washing-ton, DC 20551.
GUIDE TO THE FLOW OF FUNDS ACCOUNTS
A recent Federal Reserve publication, Guide to the Flow of Funds Accounts, explains in detail how the US. financial flow accounts are prepared. The accounts, which are compiled by the Division of Research and Statistics, are published in the Board's quarterly Z.l statistical release, "Flow of Funds Accounts, Flows and Outstandings." The Guide updates and replaces Intro-duction to Flow of Funds, published in 1980.
The 670-page Guide begins with an explanation of the organization and uses of the flow of funds accounts and their relationship to the national income and product accounts prepared by the U.S. Department of Commerce. Also discussed are the individual data series that make up the accounts and such proce-
dures as seasonal adjustment, extrapolation, and interpolation.
The balance of the Guide contains explanatory tables corresponding to the tables of financial flows data that appeared in the September 1992 Z.l release. These tables give, for each data series, the source of the data or the methods of calculation, along with annual data for 1991 that were published in the September 1992 release.
Guide to the Flow of Funds Accounts is available for $8.50 per copy from Publications Services, Board of Governors of the Federal Reserve System, Washington, DC 20551. Orders must include a check or money order, in U.S. dollars, made payable to the Board of Governors of the Federal Reserve System.
Digitized for FRASER http://fraser.stlouisfed.org/ Federal Reserve Bank of St. Louis


