FRAUD Investigation Report
21
FRAUD Investigation Report October – December 2005 California Department of Social Services Data Systems and Survey Design Bureau April 2006
Transcript of FRAUD Investigation Report

FRAUD Investigation
Report
October – December 2005
California Department of Social Services Data Systems and Survey Design Bureau
April 2006
STATE OF CALIFORNIA – HEALTH AND HUMAN SERVICES AGENCY CALIFORNIA DEPARTMENT OF SOCIAL SERVICES DATA SYSTEMS AND SURVEY DESIGN BUREAU
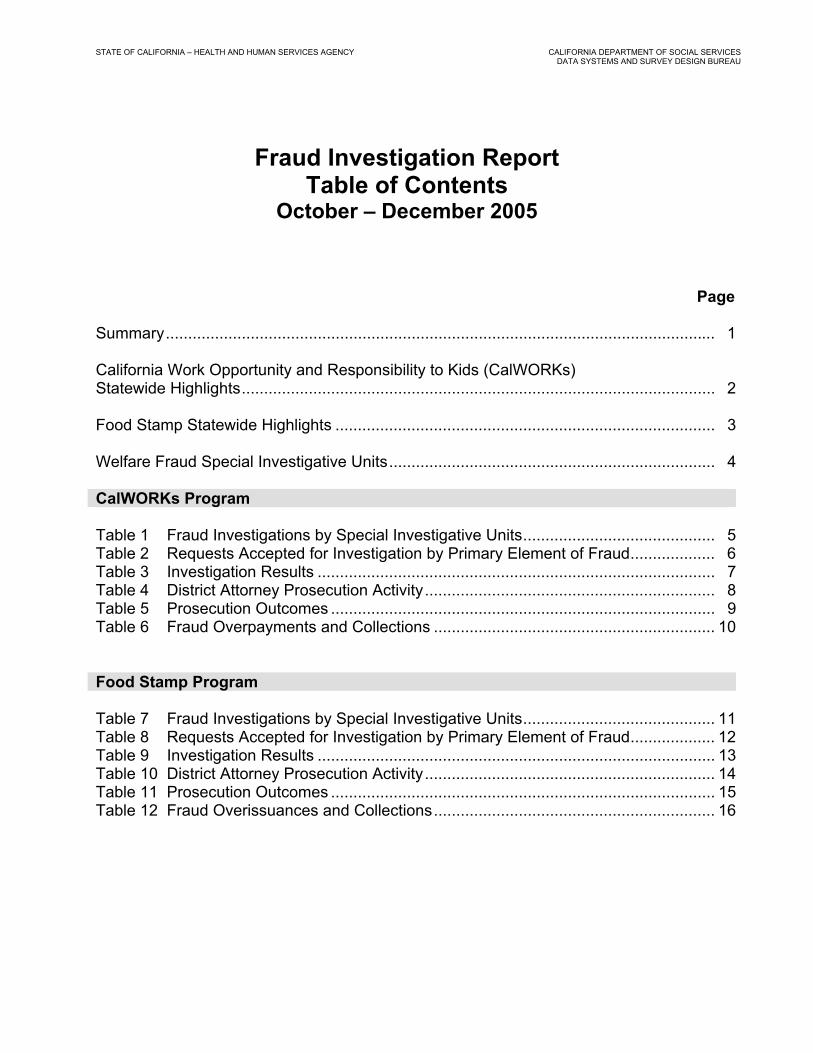
Fraud Investigation Report Table of Contents
October – December 2005
Page
Summary........................................................................................................................... 1 California Work Opportunity and Responsibility to Kids (CalWORKs) Statewide Highlights.......................................................................................................... 2 Food Stamp Statewide Highlights ..................................................................................... 3 Welfare Fraud Special Investigative Units......................................................................... 4 CalWORKs Program Table 1 Fraud Investigations by Special Investigative Units........................................... 5 Table 2 Requests Accepted for Investigation by Primary Element of Fraud................... 6 Table 3 Investigation Results ......................................................................................... 7 Table 4 District Attorney Prosecution Activity................................................................. 8 Table 5 Prosecution Outcomes ...................................................................................... 9 Table 6 Fraud Overpayments and Collections ............................................................... 10 Food Stamp Program Table 7 Fraud Investigations by Special Investigative Units........................................... 11 Table 8 Requests Accepted for Investigation by Primary Element of Fraud................... 12 Table 9 Investigation Results ......................................................................................... 13 Table 10 District Attorney Prosecution Activity................................................................. 14 Table 11 Prosecution Outcomes ...................................................................................... 15 Table 12 Fraud Overissuances and Collections............................................................... 16

STATE OF CALIFORNIA – HEALTH AND HUMAN SERVICES AGENCY CALIFORNIA DEPARTMENT OF SOCIAL SERVICES DATA SYSTEMS AND SURVEY DESIGN BUREAU
Page 1 of 16
Fraud Investigation Report Summary
October – December 2005 In California, fraud prevention and detection is an integral part of the overall management of public assistance programs. The fraud prevention program is administered at the local level by 58 county welfare departments. The California Department of Social Services (CDSS) is responsible for developing regulations and disseminating policy information/interpretation to local entities. Within the county welfare departments, the income and maintenance units have primary responsibility for determining eligibility and computing grant amounts. If fraud is suspected, the case is referred for investigation to the Special Investigative Unit (SIU). At the discretion of the county, the SIU may be placed in the county welfare department or within another county law enforcement agency such as the District Attorney’s or Sheriff’s Office. It is the responsibility of the SIU to conduct an investigation of such cases for the purpose of establishing whether or not evidence exists to support a charge of welfare fraud. The Fraud Investigation Report provides statewide and county-specific fraud activity data on the California Work Opportunity and Responsibility to Kids (CalWORKs) and Food Stamp programs. Investigation activity by the SIUs is reflected in this report. Data shown represents the most current statistics available at the time of publication. The following three reports are the data sources for this publication, and are available on the CDSS Research and Data Reports (RADR) internet website at http://www.cdss.ca.gov/research. • DPA 266 - Fraud Investigation Activity Report
October, November and December 2005
• CA 237 CW - CalWORKs Cash Grant Caseload Movement Report October, November and December 2005
• DFA 256 - Food Stamp Program Participation and Benefit Issuance Report October, November and December 2005
Unless otherwise stated, each data item in the publication is a quarterly rollup of three months of data from the DPA 266 – Fraud Investigation Activity Report.

STATE OF CALIFORNIA – HEALTH AND HUMAN SERVICES AGENCY CALIFORNIA DEPARTMENT OF SOCIAL SERVICES DATA SYSTEMS AND SURVEY DESIGN BUREAU
Page 2 of 16
CalWORKs Statewide Highlights
October – December 2005 Investigation Requests
31,546 requests for investigation were received by California Special Investigative Units (SIUs) during the quarter, with a monthly average during the quarter of 10,515 investigation requests. The monthly average of investigation requests represents 2.18% of the 481,417 CalWORKs statewide caseload (monthly average during October – December 2005).
30,883 investigation requests were accepted for investigation during the quarter. This is 98% of the 31,546
investigation requests received. 20,714 (67%) were Early Fraud Prevention/Detection Program requests. 5,344 (17%) were investigation requests for other reasons including other unreported income, homeless
assistance, unreported resources/assets, duplicate/replaced warrants, duplicate aid, forgery, residence, fictitious identity, internal affairs, child care, drug felon, fleeing felon, probation/parole violators, and other miscellaneous elements of fraud.
3,377 (11%) were family (household) composition requests. 1,448 (5%) were Income and Eligibility Verification System (IEVS) requests.
97,822 investigations were available during the quarter.
66,939 (68%) of the available investigations were pending at the beginning of the quarter. 30,883 (32%) of the available investigations were accepted for investigation during the quarter.
Investigations Completed and the Results
34,254 investigations were completed during the quarter. This is 35% of the 97,822 total investigations available. 10,698 (31%) of the completed cases had evidence sufficient to support an allegation of fraud. 23,556 (69%) of the completed cases did not have evidence sufficient to support an allegation of fraud.
Of the 34,254 completed investigations, the results included:
6,056 (18%) of the cases were denied, reduced or discontinued due to the Early Fraud Prevention/Detection Program.
1,838 (5%) of the cases had fraud found, but with no adverse financial impact. 1,554 (5%) of the cases had restitution action taken. 1,415 (4%) of the cases were reduced or discontinued in non-Early Fraud cases. 656 (2%) of the cases were referred for prosecution. 61 (.18%) of the cases were referred to an Administrative Disqualification Hearing. 61 (.18%) of the cases had expiration of statutes.
Note: Completed investigations could have multiple results. Completed investigations with allegation unfounded, insufficient evidence, and other miscellaneous results included in the 34,254 are not shown in this report.
Prosecution Activity
2,854 referrals were available to the District Attorney for prosecution during the quarter. 2,092 (73%) were referrals pending at the beginning of the quarter. 762 (27%) were referrals received during the quarter.
There were 2,854 referrals available to the District Attorney for prosecution consideration during the quarter.
468 prosecutions were filed. This is 16% of the available prosecution referrals.
There were 468 prosecutions filed by the District Attorney during the quarter. 460 convictions were obtained. Some convictions obtained were from prosecutions filed in prior quarters.
Overpayments and Collections
$4,109,274 fraud overpayments were identified during the quarter. $4,358,874 collections were made during the quarter. Some collections obtained were from overpayments identified
in prior quarters.

STATE OF CALIFORNIA – HEALTH AND HUMAN SERVICES AGENCY CALIFORNIA DEPARTMENT OF SOCIAL SERVICES DATA SYSTEMS AND SURVEY DESIGN BUREAU
Page 3 of 16
Food Stamp Statewide Highlights
October – December 2005 Investigation Requests
51,269 requests for investigation were received by California Special Investigative Units (SIUs) during the quarter, with a monthly average during the quarter of 17,090 investigation requests. The monthly average of investigation requests represents 2.32% of the 737,316 Food Stamp statewide caseload (monthly average during October – December 2005).
50,321 investigation requests were accepted for investigation during the quarter. This is 98% of the 51,269
investigation requests received. 29,248 (58%) were Early Fraud Prevention/Detection Program requests. 12,019 (24%) were investigation requests for other reasons including other unreported income, unreported resources/assets, duplicate/replaced Food Stamps, duplicate aid, forgery, residence, fictitious identity, Food
Stamp trafficking, internal affairs, child care, drug felon, fleeing felon, probation/parole violators, and other miscellaneous elements of fraud.
4,756 (9%) were family (household) composition requests. 4,298 (9%) were Income and Eligibility Verification System (IEVS) requests.
165,384 investigations were available during the quarter.
115,063 (70%) of the available investigations were pending at the beginning of the quarter. 50,321 (30%) of the available investigations were accepted for investigation during the quarter.
Investigations Completed and the Results
50,562 investigations were completed during the quarter. This is 31% of the 165,384 total investigations available. 15,021 (30%) of the completed cases had evidence sufficient to support an allegation of fraud. 35,541 (70%) of the completed cases did not have evidence sufficient to support an allegation of fraud.
Of the 50,562 completed investigations, the results included:
8,582 (17%) of the cases were denied, reduced or discontinued due to the Early Fraud Prevention/Detection Program.
2,208 (4%) of the cases had fraud found, but with no adverse financial impact. 2,198 (4%) of the cases were reduced or discontinued in non-Early Fraud cases. 2,163 (4%) of the cases had restitution action taken. 778 (2%) of the cases were referred for prosecution. 84 (.17%) of the cases were referred to an Administrative Disqualification Hearing. 64 (.13%) of the cases had expiration of statutes. Note: Completed investigations could have multiple results. Completed investigations with allegation unfounded,
insufficient evidence, and other miscellaneous results included in the 50,562 are not shown in this report. Prosecution Activity
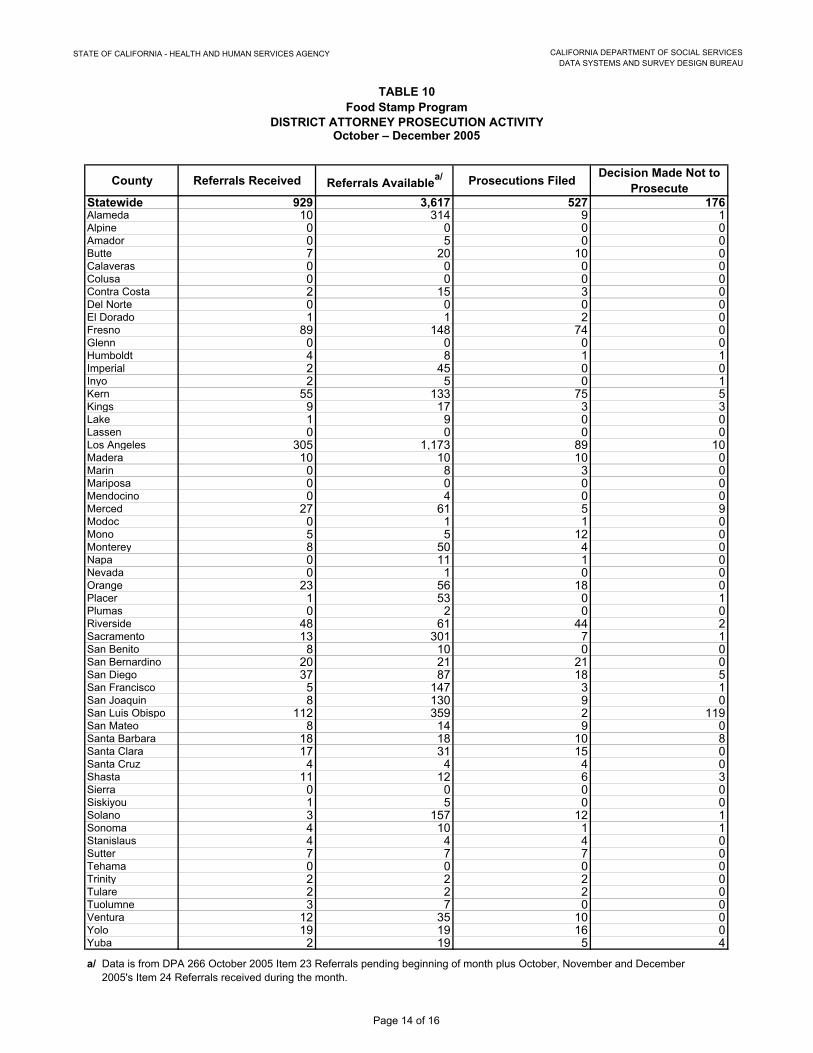
3,617 referrals were available to the District Attorney for prosecution during the quarter. 2,688 (74%) were referrals pending at the beginning of the quarter. 929 (26%) were referrals received during the quarter.
There were 3,617 referrals available to the District Attorney for prosecution consideration during the quarter.
527 prosecutions were filed. This is 15% of the available prosecution referrals.
There were 527 prosecutions filed by the District Attorney during the quarter. 499 convictions were obtained. Some convictions obtained were from prosecutions filed in prior quarters.
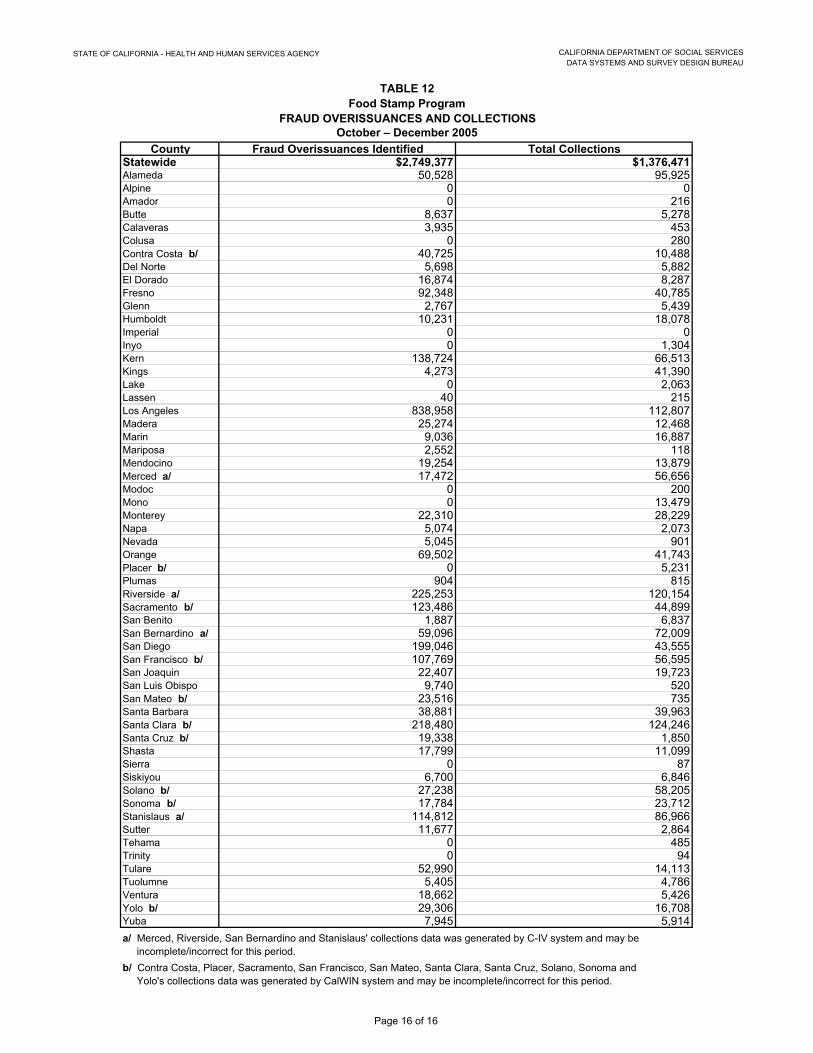
Overissuances and Collections
$2,749,377 fraud overissuances were identified during the quarter. $1,376,471 collections were made during the quarter. Some collections obtained were from overissuances identified
in prior quarters.

STATE OF CALIFORNIA - HEALTH AND HUMAN SERVICES AGENCY CALIFORNIA DEPARTMENT OF SOCIAL SERVICESDATA SYSTEMS AND SURVEY DESIGN BUREAU
County County Welfare Department
District Attorney's Office
County Welfare Department and District Attorney's Office
Sheriff's Office
Statewide 26 21 9 2AlamedaAlpine AmadorButteCalaveras Colusa Contra CostaDel NorteEl DoradoFresnoGlennHumboldtImperialInyoKernKingsLakeLassenLos AngelesMaderaMarinMariposaMendocinoMercedModocMonoMontereyNapaNevadaOrangePlacerPlumasRiversideSacramentoSan BenitoSan BernardinoSan Diego San Francisco San JoaquinSan Luis ObispoSan MateoSanta BarbaraSanta ClaraSanta CruzShastaSierraSiskiyouSolanoSonomaStanislausSutterTehama TrinityTulare TuolumneVentura YoloYuba
Welfare Fraud Special Investigative Units
Below is a listing of the locations of each county's Welfare Fraud Special Investigative Unit(s).October – December 2005
Page 4 of 16

CalWORKs
Tables
STATE OF CALIFORNIA - HEALTH AND HUMAN SERVICES AGENCY CALIFORNIA DEPARTMENT OF SOCIAL SERVICESDATA SYSTEMS AND SURVEY DESIGN BUREAU
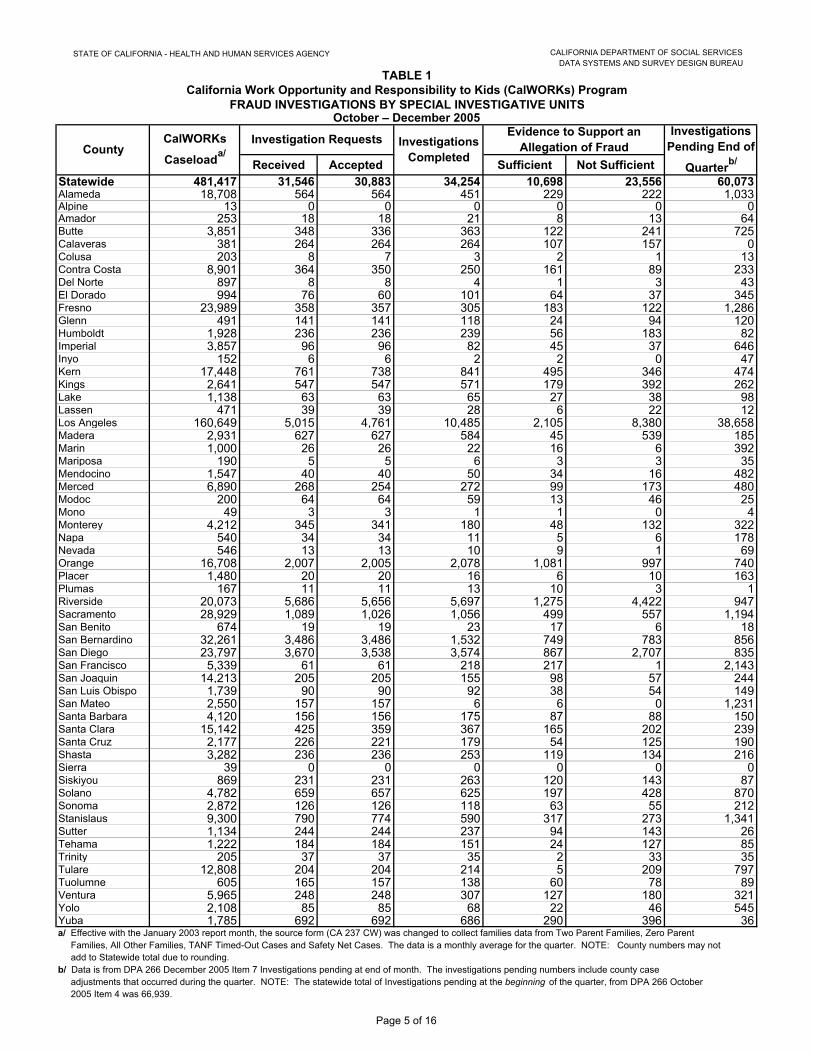
Received Accepted Sufficient Not SufficientStatewide 481,417 31,546 30,883 34,254 10,698 23,556 60,073Alameda 18,708 564 564 451 229 222 1,033Alpine 13 0 0 0 0 0 0Amador 253 18 18 21 8 13 64Butte 3,851 348 336 363 122 241 725Calaveras 381 264 264 264 107 157 0Colusa 203 8 7 3 2 1 13Contra Costa 8,901 364 350 250 161 89 233Del Norte 897 8 8 4 1 3 43El Dorado 994 76 60 101 64 37 345Fresno 23,989 358 357 305 183 122 1,286Glenn 491 141 141 118 24 94 120Humboldt 1,928 236 236 239 56 183 82Imperial 3,857 96 96 82 45 37 646Inyo 152 6 6 2 2 0 47Kern 17,448 761 738 841 495 346 474Kings 2,641 547 547 571 179 392 262Lake 1,138 63 63 65 27 38 98Lassen 471 39 39 28 6 22 12Los Angeles 160,649 5,015 4,761 10,485 2,105 8,380 38,658Madera 2,931 627 627 584 45 539 185Marin 1,000 26 26 22 16 6 392Mariposa 190 5 5 6 3 3 35Mendocino 1,547 40 40 50 34 16 482Merced 6,890 268 254 272 99 173 480Modoc 200 64 64 59 13 46 25Mono 49 3 3 1 1 0 4Monterey 4,212 345 341 180 48 132 322Napa 540 34 34 11 5 6 178Nevada 546 13 13 10 9 1 69Orange 16,708 2,007 2,005 2,078 1,081 997 740Placer 1,480 20 20 16 6 10 163Plumas 167 11 11 13 10 3 1Riverside 20,073 5,686 5,656 5,697 1,275 4,422 947Sacramento 28,929 1,089 1,026 1,056 499 557 1,194San Benito 674 19 19 23 17 6 18San Bernardino 32,261 3,486 3,486 1,532 749 783 856San Diego 23,797 3,670 3,538 3,574 867 2,707 835San Francisco 5,339 61 61 218 217 1 2,143San Joaquin 14,213 205 205 155 98 57 244San Luis Obispo 1,739 90 90 92 38 54 149San Mateo 2,550 157 157 6 6 0 1,231Santa Barbara 4,120 156 156 175 87 88 150Santa Clara 15,142 425 359 367 165 202 239Santa Cruz 2,177 226 221 179 54 125 190Shasta 3,282 236 236 253 119 134 216Sierra 39 0 0 0 0 0 0Siskiyou 869 231 231 263 120 143 87Solano 4,782 659 657 625 197 428 870Sonoma 2,872 126 126 118 63 55 212Stanislaus 9,300 790 774 590 317 273 1,341Sutter 1,134 244 244 237 94 143 26Tehama 1,222 184 184 151 24 127 85Trinity 205 37 37 35 2 33 35Tulare 12,808 204 204 214 5 209 797Tuolumne 605 165 157 138 60 78 89Ventura 5,965 248 248 307 127 180 321Yolo 2,108 85 85 68 22 46 545Yuba 1,785 692 692 686 290 396 36
TABLE 1California Work Opportunity and Responsibility to Kids (CalWORKs) Program
FRAUD INVESTIGATIONS BY SPECIAL INVESTIGATIVE UNITS
b/ Data is from DPA 266 December 2005 Item 7 Investigations pending at end of month. The investigations pending numbers include county case adjustments that occurred during the quarter. NOTE: The statewide total of Investigations pending at the beginning of the quarter, from DPA 266 October 2005 Item 4 was 66,939.
CalWORKs
Caseloada/CountyEvidence to Support an
Allegation of FraudInvestigations
Pending End of
Quarterb/
a/ Effective with the January 2003 report month, the source form (CA 237 CW) was changed to collect families data from Two Parent Families, Zero Parent Families, All Other Families, TANF Timed-Out Cases and Safety Net Cases. The data is a monthly average for the quarter. NOTE: County numbers may not add to Statewide total due to rounding.
Investigation Requests Investigations Completed
October – December 2005
Page 5 of 16

STATE OF CALIFORNIA - HEALTH AND HUMAN SERVICES AGENCY CALIFORNIA DEPARTMENT OF SOCIAL SERVICESDATA SYSTEMS AND SURVEY DESIGN BUREAU
CountyEarly Fraud Prevention/Detection
Income and Eligibility
Verification System
Family (Household) Composition
Other Unreported
IncomeResidence
Unreported Resources/
AssetsOthera/
Statewide 20,714 1,448 3,377 1,160 1,070 329 2,785Alameda 376 42 43 14 11 23 55Alpine 0 0 0 0 0 0 0Amador 0 0 6 4 2 0 6Butte 65 2 78 25 23 9 134Calaveras 209 0 25 4 8 4 14Colusa 0 0 3 0 0 0 4Contra Costa 172 131 7 27 0 0 13Del Norte 0 0 3 0 1 0 4El Dorado 1 4 19 13 5 3 15Fresno 102 43 125 45 29 3 10Glenn 79 3 20 21 11 0 7Humboldt 20 1 93 17 1 88 16Imperial 27 0 28 15 25 0 1Inyo 0 0 0 6 0 0 0Kern 290 24 249 101 31 9 34Kings 439 1 70 15 9 0 13Lake 5 1 25 2 12 1 17Lassen 27 0 8 2 2 0 0Los Angeles 3,363 502 30 28 0 9 829Madera 576 8 29 6 2 0 6Marin 1 6 6 0 8 2 3Mariposa 2 0 1 1 1 0 0Mendocino 2 15 10 4 2 3 4Merced 26 13 76 32 21 6 80Modoc 57 0 3 4 0 0 0Mono 1 1 0 0 0 1 0Monterey 156 13 12 7 56 1 96Napa 0 0 14 8 2 2 8Nevada 6 0 3 0 4 0 0Orange 1,865 21 38 22 7 1 51Placer 0 0 5 1 3 7 4Plumas 5 0 3 1 1 1 0Riverside 5,228 32 175 55 19 16 131Sacramento 667 4 90 42 54 1 168San Benito 0 4 1 5 2 0 7San Bernardino 1,115 138 1,060 279 334 48 512San Diego 3,230 88 74 36 4 4 102San Francisco 60 0 0 0 0 0 1San Joaquin 111 2 35 5 4 2 46San Luis Obispo 16 0 31 15 11 1 16San Mateo 49 0 23 51 21 0 13Santa Barbara 41 5 45 21 11 2 31Santa Clara 218 67 47 10 1 8 8Santa Cruz 197 1 5 4 1 0 13Shasta 134 0 63 14 4 1 20Sierra 0 0 0 0 0 0 0Siskiyou 58 0 53 12 45 53 10Solano 464 82 55 21 20 0 15Sonoma 22 26 32 8 0 1 37Stanislaus 137 122 294 30 134 3 54Sutter 169 1 24 33 10 0 7Tehama 68 6 49 18 11 7 25Trinity 7 10 5 3 4 1 7Tulare 0 7 96 27 53 1 20Tuolumne 125 0 15 1 5 0 11Ventura 175 2 29 5 1 4 32Yolo 29 13 15 11 7 2 8Yuba 522 7 29 29 37 1 67a/ "Other" includes homeless assistance, duplicate warrants, duplicate (multiple) aid, forgery, fictitious identity, internal affairs, child care, drug felon, fleeing felon, probation/parole violators, and other miscellaneous elements of fraud.
TABLE 2
October – December 2005
California Work Opportunity and Responsibility to Kids (CalWORKs) ProgramREQUESTS ACCEPTED FOR INVESTIGATION BY PRIMARY ELEMENT OF FRAUD
Page 6 of 16

STATE OF CALIFORNIA - HEALTH AND HUMAN SERVICES AGENCY CALIFORNIA DEPARTMENT OF SOCIAL SERVICESDATA SYSTEMS AND SURVEY DESIGN BUREAU
ProsecutionAdministrative Disqualification
HearingStatewide 6,056 656 61 1,554 1,415 1,838 61Alameda 202 9 0 10 0 8 16Alpine 0 0 0 0 0 0 0Amador 2 0 0 0 0 7 0Butte 74 7 0 13 29 10 12Calaveras 86 0 0 3 18 0 0Colusa 0 0 0 0 0 2 0Contra Costa 18 5 1 28 0 109 0Del Norte 1 0 0 0 1 1 0El Dorado 0 3 0 14 9 41 0Fresno 24 78 36 1 44 0 6Glenn 6 0 0 1 9 8 0Humboldt 21 3 0 9 16 18 0Imperial 6 1 0 2 14 1 0Inyo 0 2 0 0 0 0 0Kern 167 41 0 46 181 64 0Kings 119 6 0 5 31 18 0Lake 4 1 0 8 14 3 0Lassen 8 0 0 0 1 0 0Los Angeles 981 250 0 728 18 632 0Madera 5 2 0 7 25 6 0Marin 3 0 0 5 4 4 0Mariposa 1 0 0 0 2 0 0Mendocino 1 0 0 29 2 2 3Merced 13 7 0 6 89 21 0Modoc 11 0 0 0 1 1 1Mono 0 1 0 0 0 0 0Monterey 68 9 0 4 23 4 6Napa 2 0 0 2 2 1 0Nevada 3 0 0 2 3 1 0Orange 749 17 4 30 270 166 1Placer 0 0 0 1 4 1 0Plumas 6 0 0 0 3 3 0Riverside 1,137 35 0 94 1 8 0Sacramento 373 11 0 62 47 6 4San Benito 4 0 0 2 8 3 0San Bernardino 387 18 0 21 138 209 0San Diego 599 38 14 147 0 116 0San Francisco 1 3 0 1 0 0 1San Joaquin 55 6 6 1 12 19 8San Luis Obispo 7 2 0 6 29 4 0San Mateo 37 6 0 17 32 8 0Santa Barbara 14 13 0 31 43 16 0Santa Clara 109 20 0 12 0 24 1Santa Cruz 42 2 0 3 7 0 0Shasta 51 7 0 7 18 36 0Sierra 0 0 0 0 0 0 0Siskiyou 14 1 0 8 33 63 0Solano 107 3 0 37 15 20 0Sonoma 15 4 0 47 20 46 0Stanislaus 75 5 0 71 144 74 0Sutter 44 6 0 10 17 19 0Tehama 8 2 0 1 9 4 0Trinity 1 2 0 0 2 0 0Tulare 0 2 0 0 0 3 2Tuolumne 30 4 0 3 10 14 0Ventura 118 9 0 0 0 0 0Yolo 7 12 0 1 0 2 0Yuba 240 3 0 18 17 12 0a/ This table reflects the outcome of an investigation. In some instances an investigation may have more than one outcome reported. Therefore, the data displayed on this table may not correspond to the numbers on Table 1.
County
Early Fraud (Denials/Benefits
Reduced/Discontinuances)
Expiration of Statutes
Referred forRestitution
Action
Benefits Reduced or
Discontinued(Non-Early Fraud)
Fraud Found, No Adverse
Financial Impact
October – December 2005
TABLE 3
INVESTIGATION RESULTSa/California Work Opportunity and Responsibility to Kids (CalWORKs) Program
Page 7 of 16

STATE OF CALIFORNIA - HEALTH AND HUMAN SERVICES AGENCY CALIFORNIA DEPARTMENT OF SOCIAL SERVICESDATA SYSTEMS AND SURVEY DESIGN BUREAU
County Referrals Received Referrals Availablea/ Prosecutions Filed Decision Made Not to Prosecute
Statewide 762 2,854 468 132Alameda 9 414 8 1Alpine 0 0 0 0Amador 0 3 0 0Butte 6 17 9 0Calaveras 0 0 0 0Colusa 0 0 0 0Contra Costa 2 19 3 0Del Norte 0 0 0 0El Dorado 1 1 2 0Fresno 77 181 64 0Glenn 0 0 0 0Humboldt 3 7 1 1Imperial 1 44 0 0Inyo 2 5 0 1Kern 43 117 67 4Kings 7 9 0 1Lake 1 9 0 0Lassen 0 0 0 0Los Angeles 250 481 92 10Madera 2 2 2 0Marin 0 7 3 0Mariposa 0 0 0 0Mendocino 0 4 0 0Merced 17 43 5 5Modoc 0 1 1 0Mono 4 4 7 0Monterey 9 47 4 0Napa 0 8 0 0Nevada 0 0 0 0Orange 17 54 12 0Placer 1 44 0 1Plumas 0 1 0 0Riverside 39 50 36 2Sacramento 11 394 7 1San Benito 6 6 0 0San Bernardino 18 19 19 0San Diego 38 53 22 4San Francisco 3 100 2 0San Joaquin 6 94 7 0San Luis Obispo 90 288 2 90San Mateo 5 6 6 0Santa Barbara 13 13 8 5Santa Clara 20 34 16 0Santa Cruz 2 4 2 0Shasta 7 7 5 0Sierra 0 0 0 0Siskiyou 1 5 0 0Solano 3 161 11 1Sonoma 4 9 1 1Stanislaus 5 5 5 0Sutter 6 6 6 0Tehama 0 0 0 0Trinity 2 2 2 0Tulare 2 2 2 0Tuolumne 4 7 0 0Ventura 9 36 10 0Yolo 14 14 14 0Yuba 2 17 5 4
a/ Data is from DPA 266 October 2005 Item 23 Referrals pending beginning of month plus October, November and December 2005's Item 24 Referrals received during the month.
TABLE 4
October – December 2005DISTRICT ATTORNEY PROSECUTION ACTIVITY
California Work Opportunity and Responsibility to Kids (CalWORKs) Program
Page 8 of 16

STATE OF CALIFORNIA - HEALTH AND HUMAN SERVICES AGENCY CALIFORNIA DEPARTMENT OF SOCIAL SERVICESDATA SYSTEMS AND SURVEY DESIGN BUREAU
County Convictions Administrative Action
Disqualification Consent
Agreements
Charge Pleaded Dismissals Acquittals Declinations Expiration
of Statutes
Statewide 460 9 11 113 45 1 7 14Alameda 4 0 0 0 6 0 1 0Alpine 0 0 0 0 0 0 0 0Amador 0 0 0 0 0 0 0 0Butte 14 0 0 4 0 0 0 0Calaveras 0 0 0 0 0 0 0 0Colusa 0 0 0 0 0 0 0 0Contra Costa 0 0 0 0 0 0 0 0Del Norte 0 0 0 0 0 0 0 0El Dorado 2 0 0 0 0 0 0 0Fresno 53 3 0 0 1 0 0 0Glenn 0 0 0 0 0 0 0 0Humboldt 1 0 1 0 1 0 0 0Imperial 0 0 0 0 0 0 0 0Inyo 1 0 0 0 0 0 0 0Kern 30 0 0 0 1 0 0 0Kings 3 0 1 0 1 0 0 14Lake 0 0 0 0 0 0 0 0Lassen 0 0 0 0 0 0 0 0Los Angeles 79 0 0 0 9 0 0 0Madera 6 0 3 0 0 0 0 0Marin 0 0 0 0 0 0 0 0Mariposa 0 0 0 0 0 0 0 0Mendocino 0 0 0 0 0 0 0 0Merced 18 0 0 0 3 0 0 0Modoc 0 0 0 3 0 0 0 0Mono 5 0 0 3 0 0 0 0Monterey 0 0 0 2 2 0 0 0Napa 0 0 0 0 0 0 0 0Nevada 0 0 0 0 0 0 0 0Orange 10 2 0 9 0 0 0 0Placer 0 0 0 0 0 0 0 0Plumas 0 0 0 0 0 0 0 0Riverside 37 0 0 65 2 0 0 0Sacramento 11 0 0 0 0 0 0 0San Benito 8 0 0 0 0 0 0 0San Bernardino 20 0 0 0 6 0 0 0San Diego 24 0 0 0 4 0 0 0San Francisco 1 0 0 0 0 0 0 0San Joaquin 15 0 0 0 2 0 0 0San Luis Obispo 0 0 0 0 0 0 0 0San Mateo 7 0 0 0 0 0 0 0Santa Barbara 5 4 4 0 0 0 0 0Santa Clara 25 0 0 0 1 0 0 0Santa Cruz 2 0 0 0 0 0 0 0Shasta 10 0 0 0 1 0 0 0Sierra 0 0 0 0 0 0 0 0Siskiyou 0 0 0 0 0 0 0 0Solano 10 0 0 0 3 0 1 0Sonoma 3 0 0 0 0 0 1 0Stanislaus 12 0 0 0 0 0 0 0Sutter 0 0 0 5 0 0 0 0Tehama 0 0 0 0 0 0 0 0Trinity 0 0 0 0 0 0 0 0Tulare 22 0 0 19 1 1 0 0Tuolumne 0 0 0 0 0 0 0 0Ventura 2 0 0 0 0 0 0 0Yolo 19 0 0 0 0 0 0 0Yuba 1 0 2 3 1 0 4 0a/ This table reflects the outcome of a prosecution. In some instances a prosecution may have more than one outcome reported.
California Work Opportunity and Responsibility to Kids (CalWORKs) Program
PROSECUTION OUTCOMESa/
October – December 2005
TABLE 5
Page 9 of 16

STATE OF CALIFORNIA - HEALTH AND HUMAN SERVICES AGENCY CALIFORNIA DEPARTMENT OF SOCIAL SERVICESDATA SYSTEMS AND SURVEY DESIGN BUREAU
County Fraud Overpayments Identified Total CollectionsStatewide $4,109,274 $4,358,874Alameda 106,701 411,993Alpine 0 0Amador 0 1,003Butte 11,007 6,647Calaveras 2,220 847Colusa 0 198Contra Costa b/ 38,227 70,275Del Norte 11,057 7,195El Dorado 22,294 14,201Fresno 127,555 215,696Glenn 966 3,106Humboldt 6,577 8,138Imperial 0 0Inyo 0 299Kern 150,557 93,417Kings 2,127 42,972Lake 0 2,935Lassen 779 1,514Los Angeles 1,863,913 1,380,290Madera 30,371 11,083Marin 4,794 21,522Mariposa 4,091 480Mendocino 27,479 22,852Merced a/ 36,848 79,750Modoc 0 1,471Mono 1,600 43,300Monterey 29,759 45,935Napa 867 2,317Nevada 1,154 3,533Orange 119,595 120,340Placer b/ 671 12,942Plumas 1,080 1,858Riverside a/ 220,834 221,438Sacramento b/ 132,364 226,397San Benito 1,079 27,779San Bernardino a/ 29,188 126,673San Diego 315,458 286,999San Francisco b/ 48,302 85,614San Joaquin 50,597 48,765San Luis Obispo 9,279 5,789San Mateo b/ 36,037 1,461Santa Barbara 37,374 122,312Santa Clara b/ 239,764 129,508Santa Cruz b/ 39,340 3,716Shasta 28,552 15,347Sierra 0 6,670Siskiyou 8,700 9,250Solano b/ 47,138 101,981Sonoma b/ 39,457 51,033Stanislaus a/ 79,762 121,215Sutter 19,799 5,011Tehama 0 883Trinity 0 785Tulare 53,072 24,023Tuolumne 5,880 3,335Ventura 9,465 59,159Yolo b/ 45,964 34,226Yuba 9,581 11,396
TABLE 6
October – December 2005
b/ Contra Costa, Placer, Sacramento, San Francisco, San Mateo, Santa Clara, Santa Cruz, Solano, Sonoma and Yolo's collections data was generated by CalWIN system and may be incomplete/incorrect for this period.
a/ Merced, Riverside, San Bernardino and Stanislaus' collections data was generated by C-IV system and may be incomplete/incorrect for this period.
California Work Opportunity and Responsibility to Kids (CalWORKs) ProgramFRAUD OVERPAYMENTS AND COLLECTIONS
Page 10 of 16

Food Stamp
Tables
STATE OF CALIFORNIA - HEALTH AND HUMAN SERVICES AGENCY CALIFORNIA DEPARTMENT OF SOCIAL SERVICESDATA SYSTEMS AND SURVEY DESIGN BUREAU
Received Accepted Sufficient Not Sufficient
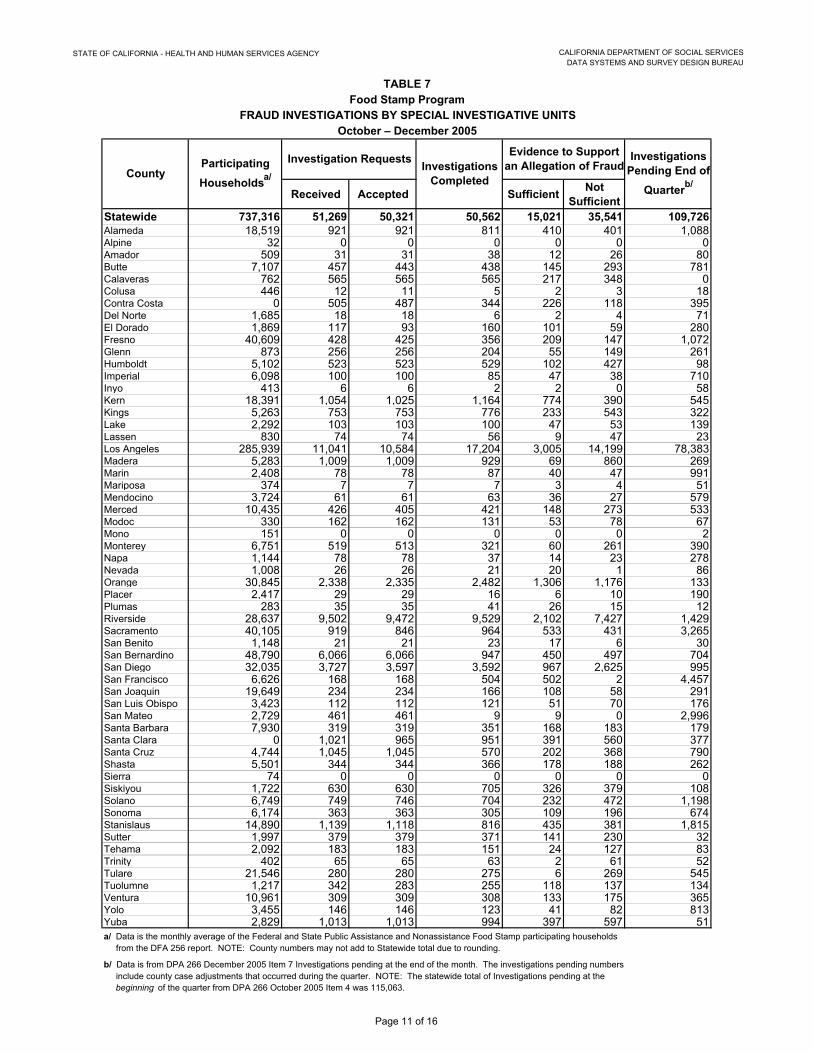
Statewide 737,316 51,269 50,321 50,562 15,021 35,541 109,726Alameda 18,519 921 921 811 410 401 1,088Alpine 32 0 0 0 0 0 0Amador 509 31 31 38 12 26 80Butte 7,107 457 443 438 145 293 781Calaveras 762 565 565 565 217 348 0Colusa 446 12 11 5 2 3 18Contra Costa 0 505 487 344 226 118 395Del Norte 1,685 18 18 6 2 4 71El Dorado 1,869 117 93 160 101 59 280Fresno 40,609 428 425 356 209 147 1,072Glenn 873 256 256 204 55 149 261Humboldt 5,102 523 523 529 102 427 98Imperial 6,098 100 100 85 47 38 710Inyo 413 6 6 2 2 0 58Kern 18,391 1,054 1,025 1,164 774 390 545Kings 5,263 753 753 776 233 543 322Lake 2,292 103 103 100 47 53 139Lassen 830 74 74 56 9 47 23Los Angeles 285,939 11,041 10,584 17,204 3,005 14,199 78,383Madera 5,283 1,009 1,009 929 69 860 269Marin 2,408 78 78 87 40 47 991Mariposa 374 7 7 7 3 4 51Mendocino 3,724 61 61 63 36 27 579Merced 10,435 426 405 421 148 273 533Modoc 330 162 162 131 53 78 67Mono 151 0 0 0 0 0 2Monterey 6,751 519 513 321 60 261 390Napa 1,144 78 78 37 14 23 278Nevada 1,008 26 26 21 20 1 86Orange 30,845 2,338 2,335 2,482 1,306 1,176 133Placer 2,417 29 29 16 6 10 190Plumas 283 35 35 41 26 15 12Riverside 28,637 9,502 9,472 9,529 2,102 7,427 1,429Sacramento 40,105 919 846 964 533 431 3,265San Benito 1,148 21 21 23 17 6 30San Bernardino 48,790 6,066 6,066 947 450 497 704San Diego 32,035 3,727 3,597 3,592 967 2,625 995San Francisco 6,626 168 168 504 502 2 4,457San Joaquin 19,649 234 234 166 108 58 291San Luis Obispo 3,423 112 112 121 51 70 176San Mateo 2,729 461 461 9 9 0 2,996Santa Barbara 7,930 319 319 351 168 183 179Santa Clara 0 1,021 965 951 391 560 377Santa Cruz 4,744 1,045 1,045 570 202 368 790Shasta 5,501 344 344 366 178 188 262Sierra 74 0 0 0 0 0 0Siskiyou 1,722 630 630 705 326 379 108Solano 6,749 749 746 704 232 472 1,198Sonoma 6,174 363 363 305 109 196 674Stanislaus 14,890 1,139 1,118 816 435 381 1,815Sutter 1,997 379 379 371 141 230 32Tehama 2,092 183 183 151 24 127 83Trinity 402 65 65 63 2 61 52Tulare 21,546 280 280 275 6 269 545Tuolumne 1,217 342 283 255 118 137 134Ventura 10,961 309 309 308 133 175 365Yolo 3,455 146 146 123 41 82 813Yuba 2,829 1,013 1,013 994 397 597 51
TABLE 7
a/ Data is the monthly average of the Federal and State Public Assistance and Nonassistance Food Stamp participating households from the DFA 256 report. NOTE: County numbers may not add to Statewide total due to rounding.
Participating Householdsa/
Investigations Completed
Food Stamp ProgramFRAUD INVESTIGATIONS BY SPECIAL INVESTIGATIVE UNITS
October – December 2005
b/ Data is from DPA 266 December 2005 Item 7 Investigations pending at the end of the month. The investigations pending numbers include county case adjustments that occurred during the quarter. NOTE: The statewide total of Investigations pending at the beginning of the quarter from DPA 266 October 2005 Item 4 was 115,063.
Evidence to Support an Allegation of Fraud
Investigations Pending End of
Quarterb/
Investigation RequestsCounty
Page 11 of 16

STATE OF CALIFORNIA - HEALTH AND HUMAN SERVICES AGENCY CALIFORNIA DEPARTMENT OF SOCIAL SERVICESDATA SYSTEMS AND SURVEY DESIGN BUREAU
CountyEarly Fraud Prevention/Detection
Income and Eligibility
Verification System
Family (Household) Composition
Other Unreported
IncomeResidence
Unreported Resources/
AssetsOthera/
Statewide 29,248 4,298 4,756 1,722 1,859 692 7,746Alameda 425 44 43 14 12 23 360Alpine 0 0 0 0 0 0 0Amador 0 0 8 4 3 0 16Butte 88 4 99 41 82 14 115Calaveras 488 1 25 5 11 8 27Colusa 0 0 5 0 0 0 6Contra Costa 220 183 10 35 0 1 38Del Norte 1 1 3 0 1 0 12El Dorado 4 7 25 20 5 3 29Fresno 118 58 144 50 12 3 40Glenn 127 11 29 59 18 2 10Humboldt 19 2 325 20 4 96 57Imperial 29 0 28 15 27 0 1Inyo 0 0 0 6 0 0 0Kern 486 35 266 131 37 14 56Kings 611 4 79 28 12 1 18Lake 8 2 29 3 17 1 43Lassen 60 0 9 2 3 0 0Los Angeles 5,191 2,699 30 111 0 9 2,544Madera 930 19 29 13 2 0 16Marin 1 17 6 0 11 2 41Mariposa 1 0 1 1 3 0 1Mendocino 3 15 13 5 7 7 11Merced 35 18 104 34 34 6 174Modoc 146 0 4 6 2 1 3Mono 0 0 0 0 0 0 0Monterey 185 19 14 6 67 1 221Napa 0 0 19 11 4 4 40Nevada 16 0 3 0 6 1 0Orange 2,179 29 38 29 8 1 51Placer 0 0 5 1 3 8 12Plumas 21 0 9 1 3 1 0Riverside 8,882 42 243 64 22 18 201Sacramento 452 8 86 40 55 1 204San Benito 0 9 0 3 2 0 7San Bernardino 28 232 1,864 476 743 241 2,482San Diego 3,260 163 81 56 4 4 29San Francisco 75 0 0 0 0 0 93San Joaquin 121 2 36 5 4 2 64San Luis Obispo 17 1 34 21 18 1 20San Mateo 168 1 53 82 94 0 63Santa Barbara 166 9 53 28 12 3 48Santa Clara 815 79 47 14 1 7 2Santa Cruz 988 3 2 0 0 1 51Shasta 226 0 69 23 5 1 20Sierra 0 0 0 0 0 0 0Siskiyou 272 0 61 22 74 179 22Solano 485 140 50 23 20 0 28Sonoma 24 144 31 8 0 2 154Stanislaus 151 228 375 46 195 4 119Sutter 293 2 29 43 9 0 3Tehama 68 6 49 18 11 7 24Trinity 15 14 8 6 5 3 14Tulare 0 13 102 37 108 1 19Tuolumne 236 0 16 6 10 1 14Ventura 238 1 18 2 1 6 43Yolo 65 25 18 13 8 2 15Yuba 811 8 29 35 64 1 65a/ "Other" includes replaced lost Food Stamps, duplicate (multiple) aid, forgery, fictitious identity, Food Stamp trafficking, internal affairs, child care, drug felon, fleeing felon, probation/parole violators, and other miscellaneous elements of fraud.
TABLE 8
October – December 2005
Food Stamp ProgramREQUESTS ACCEPTED FOR INVESTIGATION BY PRIMARY ELEMENT OF FRAUD
Page 12 of 16
STATE OF CALIFORNIA - HEALTH AND HUMAN SERVICES AGENCY CALIFORNIA DEPARTMENT OF SOCIAL SERVICESDATA SYSTEMS AND SURVEY DESIGN BUREAU
ProsecutionAdministrative Disqualification
Hearing
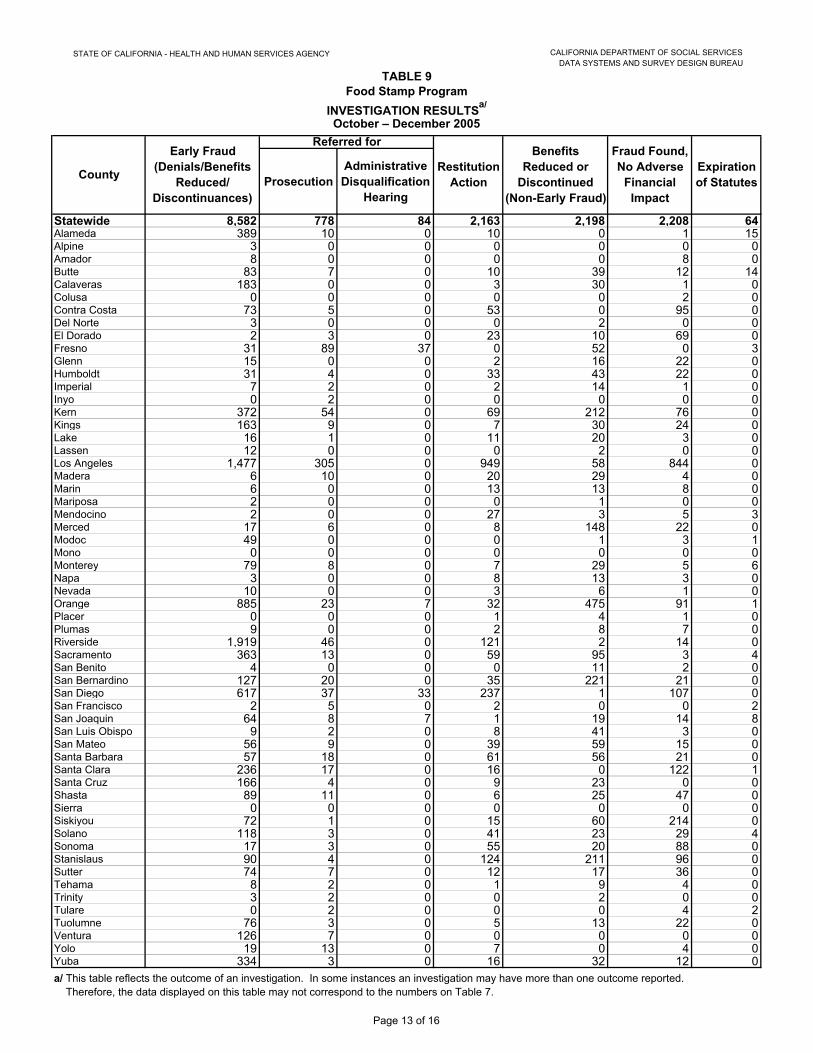
Statewide 8,582 778 84 2,163 2,198 2,208 64Alameda 389 10 0 10 0 1 15Alpine 3 0 0 0 0 0 0Amador 8 0 0 0 0 8 0Butte 83 7 0 10 39 12 14Calaveras 183 0 0 3 30 1 0Colusa 0 0 0 0 0 2 0Contra Costa 73 5 0 53 0 95 0Del Norte 3 0 0 0 2 0 0El Dorado 2 3 0 23 10 69 0Fresno 31 89 37 0 52 0 3Glenn 15 0 0 2 16 22 0Humboldt 31 4 0 33 43 22 0Imperial 7 2 0 2 14 1 0Inyo 0 2 0 0 0 0 0Kern 372 54 0 69 212 76 0Kings 163 9 0 7 30 24 0Lake 16 1 0 11 20 3 0Lassen 12 0 0 0 2 0 0Los Angeles 1,477 305 0 949 58 844 0Madera 6 10 0 20 29 4 0Marin 6 0 0 13 13 8 0Mariposa 2 0 0 0 1 0 0Mendocino 2 0 0 27 3 5 3Merced 17 6 0 8 148 22 0Modoc 49 0 0 0 1 3 1Mono 0 0 0 0 0 0 0Monterey 79 8 0 7 29 5 6Napa 3 0 0 8 13 3 0Nevada 10 0 0 3 6 1 0Orange 885 23 7 32 475 91 1Placer 0 0 0 1 4 1 0Plumas 9 0 0 2 8 7 0Riverside 1,919 46 0 121 2 14 0Sacramento 363 13 0 59 95 3 4San Benito 4 0 0 0 11 2 0San Bernardino 127 20 0 35 221 21 0San Diego 617 37 33 237 1 107 0San Francisco 2 5 0 2 0 0 2San Joaquin 64 8 7 1 19 14 8San Luis Obispo 9 2 0 8 41 3 0San Mateo 56 9 0 39 59 15 0Santa Barbara 57 18 0 61 56 21 0Santa Clara 236 17 0 16 0 122 1Santa Cruz 166 4 0 9 23 0 0Shasta 89 11 0 6 25 47 0Sierra 0 0 0 0 0 0 0Siskiyou 72 1 0 15 60 214 0Solano 118 3 0 41 23 29 4Sonoma 17 3 0 55 20 88 0Stanislaus 90 4 0 124 211 96 0Sutter 74 7 0 12 17 36 0Tehama 8 2 0 1 9 4 0Trinity 3 2 0 0 2 0 0Tulare 0 2 0 0 0 4 2Tuolumne 76 3 0 5 13 22 0Ventura 126 7 0 0 0 0 0Yolo 19 13 0 7 0 4 0Yuba 334 3 0 16 32 12 0
Referred forEarly Fraud
(Denials/Benefits Reduced/
Discontinuances)
County Restitution Action
a/ This table reflects the outcome of an investigation. In some instances an investigation may have more than one outcome reported. Therefore, the data displayed on this table may not correspond to the numbers on Table 7.
TABLE 9
October – December 2005
Food Stamp Program
Benefits Reduced or
Discontinued (Non-Early Fraud)
Fraud Found, No Adverse
Financial Impact
Expiration of Statutes
INVESTIGATION RESULTSa/
Page 13 of 16
STATE OF CALIFORNIA - HEALTH AND HUMAN SERVICES AGENCY CALIFORNIA DEPARTMENT OF SOCIAL SERVICESDATA SYSTEMS AND SURVEY DESIGN BUREAU
County Referrals Received Referrals Availablea/ Prosecutions Filed Decision Made Not to Prosecute
Statewide 929 3,617 527 176Alameda 10 314 9 1Alpine 0 0 0 0Amador 0 5 0 0Butte 7 20 10 0Calaveras 0 0 0 0Colusa 0 0 0 0Contra Costa 2 15 3 0Del Norte 0 0 0 0El Dorado 1 1 2 0Fresno 89 148 74 0Glenn 0 0 0 0Humboldt 4 8 1 1Imperial 2 45 0 0Inyo 2 5 0 1Kern 55 133 75 5Kings 9 17 3 3Lake 1 9 0 0Lassen 0 0 0 0Los Angeles 305 1,173 89 10Madera 10 10 10 0Marin 0 8 3 0Mariposa 0 0 0 0Mendocino 0 4 0 0Merced 27 61 5 9Modoc 0 1 1 0Mono 5 5 12 0Monterey 8 50 4 0Napa 0 11 1 0Nevada 0 1 0 0Orange 23 56 18 0Placer 1 53 0 1Plumas 0 2 0 0Riverside 48 61 44 2Sacramento 13 301 7 1San Benito 8 10 0 0San Bernardino 20 21 21 0San Diego 37 87 18 5San Francisco 5 147 3 1San Joaquin 8 130 9 0San Luis Obispo 112 359 2 119San Mateo 8 14 9 0Santa Barbara 18 18 10 8Santa Clara 17 31 15 0Santa Cruz 4 4 4 0Shasta 11 12 6 3Sierra 0 0 0 0Siskiyou 1 5 0 0Solano 3 157 12 1Sonoma 4 10 1 1Stanislaus 4 4 4 0Sutter 7 7 7 0Tehama 0 0 0 0Trinity 2 2 2 0Tulare 2 2 2 0Tuolumne 3 7 0 0Ventura 12 35 10 0Yolo 19 19 16 0Yuba 2 19 5 4
DISTRICT ATTORNEY PROSECUTION ACTIVITY
TABLE 10
October – December 2005
a/ Data is from DPA 266 October 2005 Item 23 Referrals pending beginning of month plus October, November and December 2005's Item 24 Referrals received during the month.
Food Stamp Program
Page 14 of 16

STATE OF CALIFORNIA - HEALTH AND HUMAN SERVICES AGENCY CALIFORNIA DEPARTMENT OF SOCIAL SERVICESDATA SYSTEMS AND SURVEY DESIGN BUREAU
County Convictions Administrative Action
Disqualification Consent
Agreements
Charge Pleaded Dismissals Acquittals Declinations Expiration
of Statutes
Statewide 499 10 22 120 52 1 9 12Alameda 5 0 0 0 6 0 1 0Alpine 0 0 0 0 0 0 0 0Amador 0 0 0 0 0 0 0 0Butte 15 0 0 4 0 0 0 0Calaveras 0 0 0 0 0 0 0 0Colusa 0 0 0 0 0 0 0 0Contra Costa 0 0 0 0 0 0 0 0Del Norte 0 0 0 0 0 0 0 0El Dorado 2 0 0 0 0 0 0 0Fresno 56 1 0 0 2 0 0 0Glenn 0 0 0 0 0 0 0 0Humboldt 1 0 1 0 1 0 0 0Imperial 0 0 0 0 0 0 0 0Inyo 1 0 0 0 0 0 0 0Kern 37 0 0 0 2 0 0 0Kings 4 0 3 0 2 0 0 12Lake 0 0 0 0 0 0 0 0Lassen 0 0 0 0 0 0 0 0Los Angeles 70 0 0 0 6 0 0 0Madera 9 0 8 0 0 0 0 0Marin 0 0 0 0 0 0 0 0Mariposa 0 0 0 0 0 0 0 0Mendocino 0 0 0 0 0 0 0 0Merced 30 0 0 0 7 0 0 0Modoc 0 0 0 1 0 0 0 0Mono 6 1 0 4 0 0 0 0Monterey 0 0 0 0 2 0 0 0Napa 0 0 0 0 1 0 0 0Nevada 0 0 0 0 0 0 0 0Orange 10 3 0 17 0 0 0 0Placer 0 0 0 0 0 0 0 0Plumas 0 0 0 0 0 0 0 0Riverside 45 0 0 63 4 0 0 0Sacramento 10 0 0 0 0 0 0 0San Benito 9 0 0 0 0 0 0 0San Bernardino 25 0 0 0 6 0 0 0San Diego 25 0 0 0 3 0 0 0San Francisco 1 0 0 0 0 0 1 0San Joaquin 13 0 0 0 2 0 1 0San Luis Obispo 0 0 0 0 0 0 0 0San Mateo 8 0 0 0 0 0 0 0Santa Barbara 7 5 8 0 0 0 0 0Santa Clara 24 0 0 0 3 0 0 0Santa Cruz 2 0 0 0 0 0 0 0Shasta 10 0 0 0 0 0 0 0Sierra 0 0 0 0 0 0 0 0Siskiyou 0 0 0 0 0 0 0 0Solano 11 0 0 0 3 0 1 0Sonoma 3 0 0 0 0 0 1 0Stanislaus 11 0 0 0 0 0 0 0Sutter 0 0 0 7 0 0 0 0Tehama 0 0 0 0 0 0 0 0Trinity 0 0 0 0 0 0 0 0Tulare 25 0 0 21 1 1 0 0Tuolumne 0 0 0 0 0 0 0 0Ventura 3 0 0 0 0 0 0 0Yolo 20 0 0 0 0 0 0 0Yuba 1 0 2 3 1 0 4 0a/ This table reflects the outcome of a prosecution. In some instances a prosecution may have more than one outcome reported.
Food Stamp ProgramPROSECUTION OUTCOMESa/
TABLE 11
October – December 2005
Page 15 of 16
STATE OF CALIFORNIA - HEALTH AND HUMAN SERVICES AGENCY CALIFORNIA DEPARTMENT OF SOCIAL SERVICESDATA SYSTEMS AND SURVEY DESIGN BUREAU
County Fraud Overissuances Identified Total CollectionsStatewide $2,749,377 $1,376,471Alameda 50,528 95,925Alpine 0 0Amador 0 216Butte 8,637 5,278Calaveras 3,935 453Colusa 0 280Contra Costa b/ 40,725 10,488Del Norte 5,698 5,882El Dorado 16,874 8,287Fresno 92,348 40,785Glenn 2,767 5,439Humboldt 10,231 18,078Imperial 0 0Inyo 0 1,304Kern 138,724 66,513Kings 4,273 41,390Lake 0 2,063Lassen 40 215Los Angeles 838,958 112,807Madera 25,274 12,468Marin 9,036 16,887Mariposa 2,552 118Mendocino 19,254 13,879Merced a/ 17,472 56,656Modoc 0 200Mono 0 13,479Monterey 22,310 28,229Napa 5,074 2,073Nevada 5,045 901Orange 69,502 41,743Placer b/ 0 5,231Plumas 904 815Riverside a/ 225,253 120,154Sacramento b/ 123,486 44,899San Benito 1,887 6,837San Bernardino a/ 59,096 72,009San Diego 199,046 43,555San Francisco b/ 107,769 56,595San Joaquin 22,407 19,723San Luis Obispo 9,740 520San Mateo b/ 23,516 735Santa Barbara 38,881 39,963Santa Clara b/ 218,480 124,246Santa Cruz b/ 19,338 1,850Shasta 17,799 11,099Sierra 0 87Siskiyou 6,700 6,846Solano b/ 27,238 58,205Sonoma b/ 17,784 23,712Stanislaus a/ 114,812 86,966Sutter 11,677 2,864Tehama 0 485Trinity 0 94Tulare 52,990 14,113Tuolumne 5,405 4,786Ventura 18,662 5,426Yolo b/ 29,306 16,708Yuba 7,945 5,914
TABLE 12
October – December 2005
b/ Contra Costa, Placer, Sacramento, San Francisco, San Mateo, Santa Clara, Santa Cruz, Solano, Sonoma and Yolo's collections data was generated by CalWIN system and may be incomplete/incorrect for this period.
a/ Merced, Riverside, San Bernardino and Stanislaus' collections data was generated by C-IV system and may be incomplete/incorrect for this period.
FRAUD OVERISSUANCES AND COLLECTIONSFood Stamp Program
Page 16 of 16

CALIFORNIA DEPARTMENT OF SOCIAL SERVICES
Cliff Allenby, Interim Director