Dr. Duffy Microeconomics The end of CHAPTER 3 Frank and Bernanke With supplemental material.
description
11
Frank & BernankeFrank & Bernanke44thth edition, 2009 edition, 2009
Ch. 10: Short-Term Ch. 10: Short-Term Economic FluctuationsEconomic Fluctuations

22
DefinitionsDefinitions Recession (or contraction):Recession (or contraction): A period in which the economy is A period in which the economy is
growing at a rate significantly below normal.growing at a rate significantly below normal. Depression:Depression: A particularly severe or protracted recession.A particularly severe or protracted recession.
Peak:Peak: The beginning of a recession, the high point of economic The beginning of a recession, the high point of economic activity prior to a downturn.activity prior to a downturn.
Trough:Trough: The end of a recession, the low point of economic activity The end of a recession, the low point of economic activity prior to a recovery.prior to a recovery.
ExpansionExpansion:: A period in which the economy is growing at A period in which the economy is growing at a rate significantly above normal.a rate significantly above normal.
BoomBoom:: A particularly strong and protracted expansion.A particularly strong and protracted expansion.
33
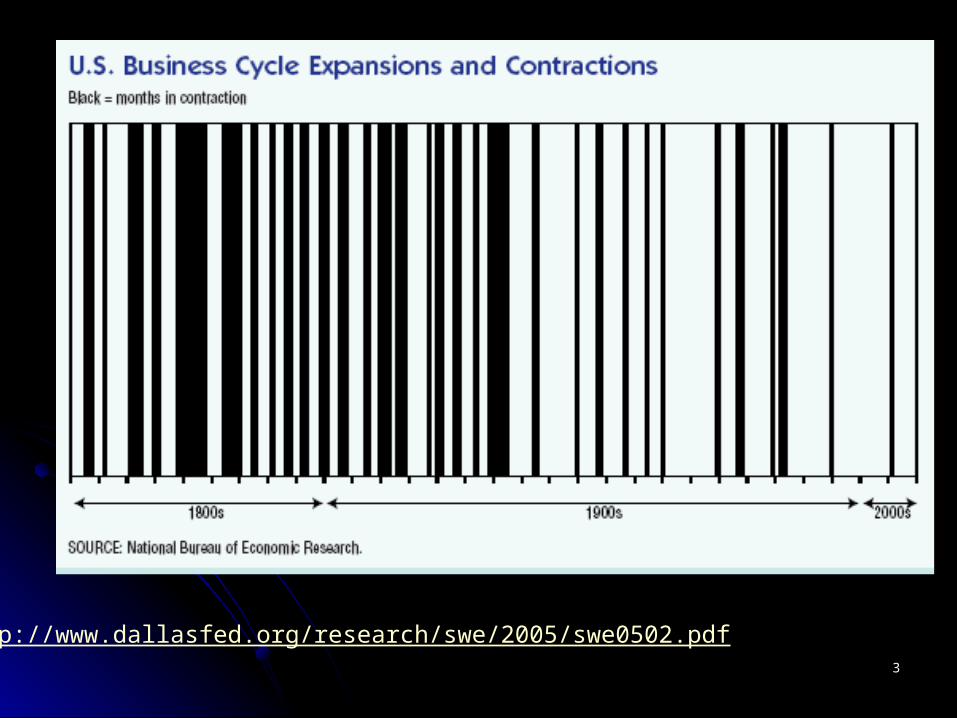
http://www.dallasfed.org/research/swe/2005/swe0502.pdf
44
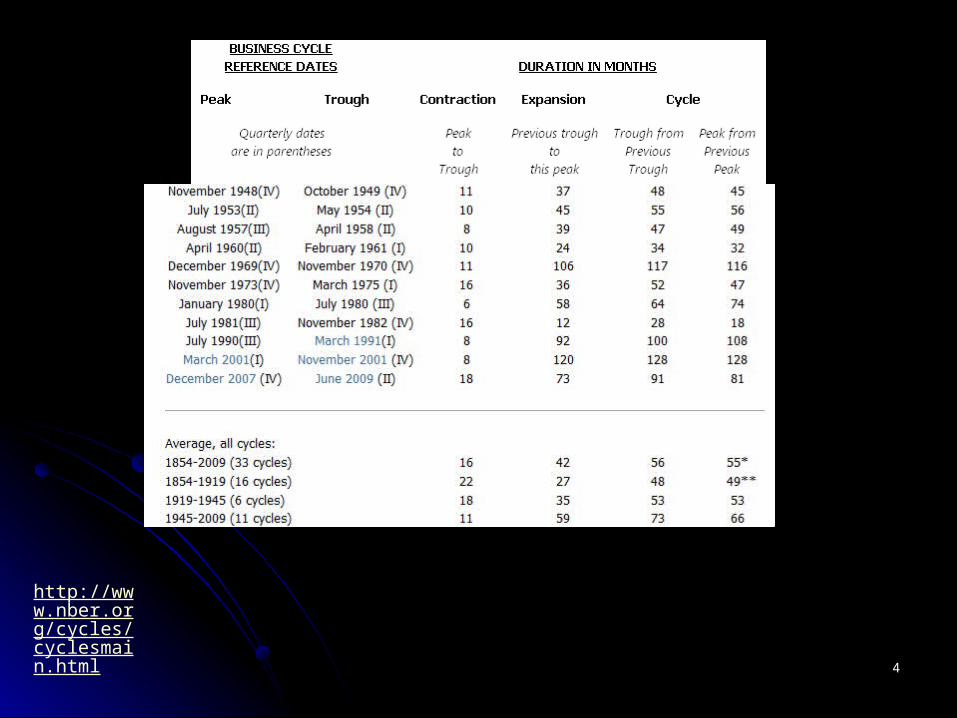
http://www.nber.org/cycles/cyclesmain.html

55
66
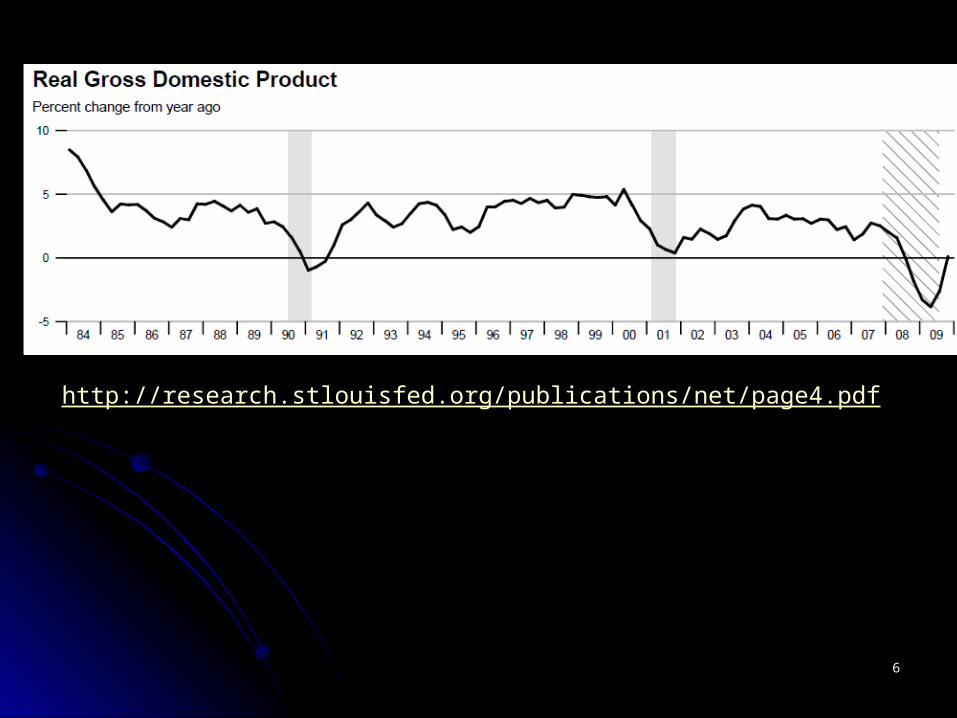
http://research.stlouisfed.org/publications/net/page4.pdf

77
Fluctuations in U.S. Real GDP, Fluctuations in U.S. Real GDP, 1920-20041920-2004
88
Recessions and ExpansionsRecessions and Expansions
Growth rates of GDP show peaks and Growth rates of GDP show peaks and troughs.troughs.A peak is the onset of slowdown, perhaps A peak is the onset of slowdown, perhaps
the beginning of a recession.the beginning of a recession.A trough is the end of a slowdown or a A trough is the end of a slowdown or a
recession.recession.Expansions and slowdowns are irregular, Expansions and slowdowns are irregular,
though they are called business cycles. though they are called business cycles.

99
1010
Calling the 2001 recessionCalling the 2001 recession
Indicators of the business cycleIndicators of the business cycleIndustrial productionIndustrial productionTotal sales in manufacturing, wholesale Total sales in manufacturing, wholesale
trade, and retail tradetrade, and retail tradeNonfarm employmentNonfarm employmentReal after-tax income of households Real after-tax income of households
excluding transfersexcluding transfers

1111
U.S. Recessions Since 1929U.S. Recessions Since 1929Peak date
(beginning)Trough date
(end)Duration (months)
Highest unemployment
rate (%)
Change in real GDP (%)
Duration of subsequent
expansion (months)
Aug. 1929 Mar. 1933 43 24.9 -28.8 50
May 1937 June 1938 13 19.0 -5.5 80
Feb. 1945 Oct. 1945 8 3.9 -8.5 37
Nov. 1948 Oct. 1949 11 5.9 -1.4 45
July 1953 May 1954 10 5.5 -1.2 39
Aug. 1957 Apr. 1958 8 6.8 -1.7 24
Apr. 1960 Feb. 1961 10 6.7 2.3 106
Dec. 1969 Nov. 1970 11 5.9 0.1 36
Nov. 1973 Mar. 1975 16 8.5 -1.1 58
Jan. 1980 July 1980 6 7.6 -0.3 12
July 1981 Nov. 1982 16 9.7 -2.1 92
July 1990 Mar. 1991 8 7.5 -0.9 120
Mar. 2001 Nov. 2001 8 5.8 0.8

1212
UnemploymentUnemploymentDuring recessions unemployment rate During recessions unemployment rate
rises sharply.rises sharply.Usually unemployment rates are lagging Usually unemployment rates are lagging
indicators: they start to rise after the indicators: they start to rise after the economy has passed the peak.economy has passed the peak.
During expansions unemployment rate During expansions unemployment rate falls, rather slowly. falls, rather slowly.
1313
Durable IndustriesDurable Industries
During recessions, durable industries, During recessions, durable industries, like construction, cars, machines are like construction, cars, machines are more affected by recessions than more affected by recessions than service and non-durable industries service and non-durable industries because basic consumption because basic consumption expenditures continue.expenditures continue.
1414
InflationInflation
Inflation rate drops during recessions.Inflation rate drops during recessions. Usually, inflation rates would be rising before Usually, inflation rates would be rising before
recessions.recessions. In late nineties many East Asian, Latin In late nineties many East Asian, Latin
American and European newly industrializing American and European newly industrializing countries experienced recessions because of countries experienced recessions because of exchange rate crisis.exchange rate crisis.
US is a relatively closed economy, somewhat US is a relatively closed economy, somewhat insulated from global shocks compared to insulated from global shocks compared to others.others.

1515
U.S. Inflation, 1960-2004U.S. Inflation, 1960-2004

1616
CPICPI
http://data.bls.gov/PDQ/servlet/SurveyOutputServlet
1717
Measuring FluctuationsMeasuring Fluctuations
In order to claim a recession is big or In order to claim a recession is big or small, an unemployment rate is too high small, an unemployment rate is too high or too low, one needs to have a or too low, one needs to have a standard to measure against.standard to measure against.
The “normal” or “trend” or “potential” or The “normal” or “trend” or “potential” or “full employment” output is the standard “full employment” output is the standard to compare expansions or recessions.to compare expansions or recessions.
Long run average unemployment rate is Long run average unemployment rate is the “natural” or “full employment” rate of the “natural” or “full employment” rate of unemployment.unemployment.
1818
Output Gaps andOutput Gaps andCyclical UnemploymentCyclical Unemployment
Potential Output and the Output GapPotential Output and the Output GapChanges in the rate at which the Changes in the rate at which the
country’s potential output is increasingcountry’s potential output is increasingActual output does not always equal Actual output does not always equal
potential outputpotential outputYY (actual output) - (actual output) - Y* Y* (potential output) (potential output) The difference between the economy’s The difference between the economy’s
actual output and its potential output at a actual output and its potential output at a point in timepoint in time

1919
Output GapsOutput GapsRecessionary Gap: Y-Y* < 0Recessionary Gap: Y-Y* < 0
Y* > YY* > YA A negativenegative output gap, which occurs when output gap, which occurs when
potential output exceeds actual outputpotential output exceeds actual outputCapital and labor resources are not fully Capital and labor resources are not fully
utilizedutilizedOutput and employment are below normal Output and employment are below normal
levelslevels
2020
Output GapsOutput GapsExpansionary Gap: Y-Y* > 0Expansionary Gap: Y-Y* > 0
Y > Y*Y > Y*A A positivepositive output gap, which occurs when output gap, which occurs when
actual output is higher than potential outputactual output is higher than potential outputHigher output and employment than normalHigher output and employment than normalDemand for goods exceed the capacity to Demand for goods exceed the capacity to
produce them and prices riseproduce them and prices riseHigh inflation reduces economic efficiencyHigh inflation reduces economic efficiency

2121
Natural rate of unemployment, Natural rate of unemployment, u*u*
U* is attributable to frictional and U* is attributable to frictional and structural unemploymentstructural unemployment
Cyclical unemployment equals zeroCyclical unemployment equals zeroNo recessionary or expansionary gapNo recessionary or expansionary gapCyclical unemployment : Cyclical unemployment : u - u* > 0u - u* > 0If u<u*, there is negative cyclical If u<u*, there is negative cyclical
unemployment, labor is being used unemployment, labor is being used more intensively than normal.more intensively than normal.

2222
What Can Cause Slow Growth?What Can Cause Slow Growth? If the potential growth of the economy slows, the If the potential growth of the economy slows, the
society would experience a recession.society would experience a recession. CapitalCapital TechnologyTechnology LaborLabor
The experience of US in the second half of the The experience of US in the second half of the nineties was an acceleration of the potential nineties was an acceleration of the potential growth rate of the economy.growth rate of the economy.
The experience of Japan was that the rate of The experience of Japan was that the rate of growth of potential output slowed from 3.6% in the growth of potential output slowed from 3.6% in the eighties to 2.2% in the nineties.eighties to 2.2% in the nineties.
2323
What Can Cause Slow Growth?What Can Cause Slow Growth? If the economy produces less than its If the economy produces less than its
potential amount, the “negative output potential amount, the “negative output gap” will also be responsible for slow gap” will also be responsible for slow growth and recession.growth and recession.
If the economy produces more than its If the economy produces more than its potential amount because labor and/or potential amount because labor and/or capital is overworked, the “positive capital is overworked, the “positive output gap” will be responsible for fast output gap” will be responsible for fast growth.growth.
2424
Natural Rate of UnemploymentNatural Rate of Unemployment
Why has the natural rate of unemployment in Why has the natural rate of unemployment in the United States apparently declined in the the United States apparently declined in the nineties?nineties?Aging labor forceAging labor forceMore efficient labor marketMore efficient labor market

2525
Okun’s LawOkun’s LawArthur Okun in the sixties observed that Arthur Okun in the sixties observed that
every time unemployment rate in the US every time unemployment rate in the US rose one percentage point above the rose one percentage point above the natural rate, GDP fell 3 percentage natural rate, GDP fell 3 percentage points below the potential GDP.points below the potential GDP.
Recent data indicate that the Recent data indicate that the relationship is now one percent relationship is now one percent deviation of unemployment rate implies deviation of unemployment rate implies two percentage point deviation in GDP.two percentage point deviation in GDP.
2626
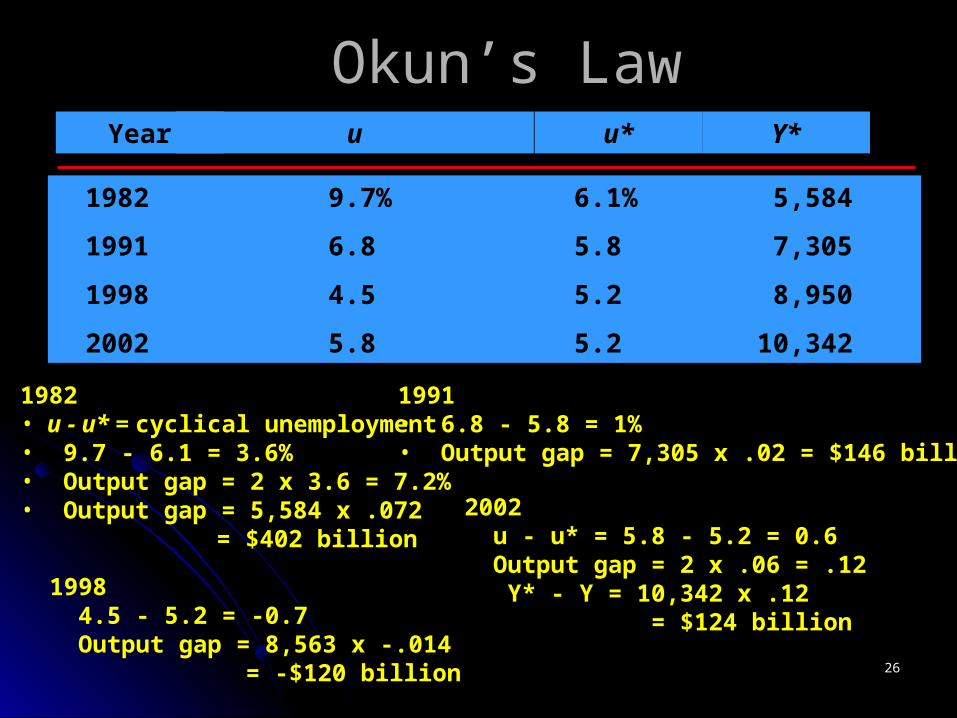
Okun’s LawOkun’s LawYear u u* Y*
1982 9.7% 6.1% 5,584
1991 6.8 5.8 7,305
1998 4.5 5.2 8,950
2002 5.8 5.2 10,342
1982• u - u* = cyclical unemployment• 9.7 - 6.1 = 3.6%• Output gap = 2 x 3.6 = 7.2%• Output gap = 5,584 x .072
= $402 billion
1991• 6.8 - 5.8 = 1%• Output gap = 7,305 x .02 = $146 billion
1998 4.5 - 5.2 = -0.7 Output gap = 8,563 x -.014
= -$120 billion
2002 u - u* = 5.8 - 5.2 = 0.6 Output gap = 2 x .06 = .12 Y* - Y = 10,342 x .12 = $124 billion

2727http://www.econ.yale.edu/alumni/conf2011/shiller-presentation.pdf

2828
Significance of Output GapsSignificance of Output GapsThe 1982 output gap per capitaThe 1982 output gap per capita
$402 billion/230 million = $1,748 for a $402 billion/230 million = $1,748 for a family of fourfamily of four
In 2000 dollars it equals $7,000 for a In 2000 dollars it equals $7,000 for a family of fourfamily of four

2929
Problem #5, p. 341Problem #5, p. 341
Year Y Y* u* u
1 7840 8000 6%2 8100 5% 5%3 8200 4.5% 4%4 8415 8250 5%
3030
Why Do Output Gaps Occur?Why Do Output Gaps Occur? If prices in every market adjusted If prices in every market adjusted
immediately to demand shifts, there would immediately to demand shifts, there would not have been any output gaps. Firms do not not have been any output gaps. Firms do not change their prices every day: contracts, change their prices every day: contracts, menu costs keep prices constant for a period menu costs keep prices constant for a period of time.of time.
Show a partial equilibrium, market supply Show a partial equilibrium, market supply and demand case to indicate the above.and demand case to indicate the above.
Coke example.Coke example.

3131
Why Do Output Gaps Occur?Why Do Output Gaps Occur?
If some markets are experiencing positive If some markets are experiencing positive output gaps and others negative output output gaps and others negative output gaps, the net outcome might be no gaps, the net outcome might be no change.change.
For the economy as whole to experience For the economy as whole to experience positive or negative output gaps, total positive or negative output gaps, total spending in the economy has to be below spending in the economy has to be below or above the total output produced.or above the total output produced.

3232
Why Do Output Gaps Occur?Why Do Output Gaps Occur?
It is the total spending (aggregate It is the total spending (aggregate demand) that determines the gaps in the demand) that determines the gaps in the short run.short run.
Total spending is C+I+G+NX.Total spending is C+I+G+NX.

FIRMS
GOVERNMENT
FINANCIAL SYSTEM
HOUSEHOLDS
REST OF THE WORLD
Y=wages+salaries+rent+profits+interest
C
Spri
T>TR+INT+G :
Sgov
T TR+INTI
NX<0 Sfor
EX IM
G
GDP
NX>0 -Sfor
-Sgov
3434
Why Output Gaps Don’t Last?Why Output Gaps Don’t Last?
In the long run firms will adjust prices upward In the long run firms will adjust prices upward if total spending is more than the potential if total spending is more than the potential output, eliminating the gap.output, eliminating the gap.
Likewise, if total spending is less than the Likewise, if total spending is less than the potential output, firms will reduce prices.potential output, firms will reduce prices.
In the long run, the economy settles at the In the long run, the economy settles at the potential output.potential output.
Chronic excess total spending will create Chronic excess total spending will create chronic inflation but not an increase in output.chronic inflation but not an increase in output.