Franck-Hertz - Department of Physicsphysics.nyu.edu/~physlab/Classical and Quantum Wave...
8
HB 02-28-07 Franck-Hertz Lab 1 Franck-Hertz Equipment Franck-Hertz tube in mount, Franck-Hertz power supply, SWS, BK 2120B Scope, leads, small 15 cm ruler so apparatus dimensions can be checked PLEASE BE CAREFUL The Franck-Hertz tube is quite expensive (about $1,000). Please handle it carefully. Be sure the electron accelerating voltage U 2 is set to zero while the tube is heating up and while it is cooling down. Otherwise a discharge may occur which can damage the tube. The tube should be in the oven when the power supply is turned on and should remain in the oven until the power supply has been turned off and the oven cooled to room temperature. In other words, avoid thermal shock. 1 Introduction In 1913 the Danish physicist Niels Bohr postulated that the electron in the hydrogen atom could only occupy discrete energy states, and that the emission line spectrum of the hydrogen atom was due to this electron jumping from a higher energy state to a lower one with the emission of light. Further evidence that the electron energy levels of other atoms were quantized was provided in 1914 by experiments done by James Franck and Gustav Hertz. They accelerated electrons in an evacuated tube that contained mercury at a vapor pressure of about 3 kPa. (They also used other elements.) They found that the electrons collided elastically with the mercury atoms as long as the electron energy remained below 4.9 eV. If the electrons had an energy greater than 4.9 eV the electrons could lose 4.9 eV of energy in colliding with the mercury atoms. While Franck and Hertz thought they were measuring the first ionization potential of mercury, they were in fact measuring the energy of the first excited state. Their experiment showed that if the electron kinetic energy was below the energy of the first excited state of mercury, the electrons could not excite the mercury atoms. If the electron energy was equal to or greater than the energy of the first excited state of mercury the electrons could lose an amount of energy equal to that excitation energy, but not any more energy if the electron energy remained below the energy of the 2nd excited state of mercury. Mercury has 2 electrons outside 5 completed shells. In LS coupling the ground state is 6s 2 1 S 0 . The first exited state is the 6s6p 3 P 0 state, but this is metastable as it requires 4J = 0 for a transition to the ground state. The nearby 3 P 1 state, when it decays to the ground state, produces the strong intercombination line at 4.9 eV or 253.7 nm and is the transition usually referred to in a discussion of the Franck-Hertz experiment. This is the transition responsible for the operation of fluorescent lights. More broadly, the first excited state of mercury is a triplet. There is probably some excitation of the metastable 3 P 0 state, which lies a little below the 3 P 1 state, and of the metastable 3 P 2 state which lies a little above the 3 P 1 state. Electron collisions do not obey optical selection rules.
Transcript of Franck-Hertz - Department of Physicsphysics.nyu.edu/~physlab/Classical and Quantum Wave...
HB 02-28-07 Franck-Hertz Lab 1
Franck-Hertz
Equipment Franck-Hertz tube in mount, Franck-Hertz power supply, SWS, BK 2120BScope, leads, small 15 cm ruler so apparatus dimensions can be checked
PLEASE BE CAREFUL
The Franck-Hertz tube is quite expensive (about $1,000). Please handle it carefully. Be surethe electron accelerating voltage U2 is set to zero while the tube is heating up and while itis cooling down. Otherwise a discharge may occur which can damage the tube. The tubeshould be in the oven when the power supply is turned on and should remain in the ovenuntil the power supply has been turned off and the oven cooled to room temperature. Inother words, avoid thermal shock.
1 Introduction
In 1913 the Danish physicist Niels Bohr postulated that the electron in the hydrogen atomcould only occupy discrete energy states, and that the emission line spectrum of the hydrogenatom was due to this electron jumping from a higher energy state to a lower one with theemission of light. Further evidence that the electron energy levels of other atoms werequantized was provided in 1914 by experiments done by James Franck and Gustav Hertz.They accelerated electrons in an evacuated tube that contained mercury at a vapor pressureof about 3 kPa. (They also used other elements.) They found that the electrons collidedelastically with the mercury atoms as long as the electron energy remained below 4.9 eV. Ifthe electrons had an energy greater than 4.9 eV the electrons could lose 4.9 eV of energyin colliding with the mercury atoms. While Franck and Hertz thought they were measuringthe first ionization potential of mercury, they were in fact measuring the energy of the firstexcited state. Their experiment showed that if the electron kinetic energy was below theenergy of the first excited state of mercury, the electrons could not excite the mercury atoms.If the electron energy was equal to or greater than the energy of the first excited state ofmercury the electrons could lose an amount of energy equal to that excitation energy, butnot any more energy if the electron energy remained below the energy of the 2nd excitedstate of mercury.
Mercury has 2 electrons outside 5 completed shells. In LS coupling the ground state is6s2 1S0. The first exited state is the 6s6p 3P0 state, but this is metastable as it requires4J = 0 for a transition to the ground state. The nearby 3P1 state, when it decays to theground state, produces the strong intercombination line at 4.9 eV or 253.7 nm and is thetransition usually referred to in a discussion of the Franck-Hertz experiment. This is thetransition responsible for the operation of fluorescent lights.
More broadly, the first excited state of mercury is a triplet. There is probably someexcitation of the metastable 3P0 state, which lies a little below the 3P1 state, and of themetastable 3P2 state which lies a little above the 3P1 state. Electron collisions do not obeyoptical selection rules.
HB 02-28-07 Franck-Hertz Lab 2
2 Description of the Apparatus
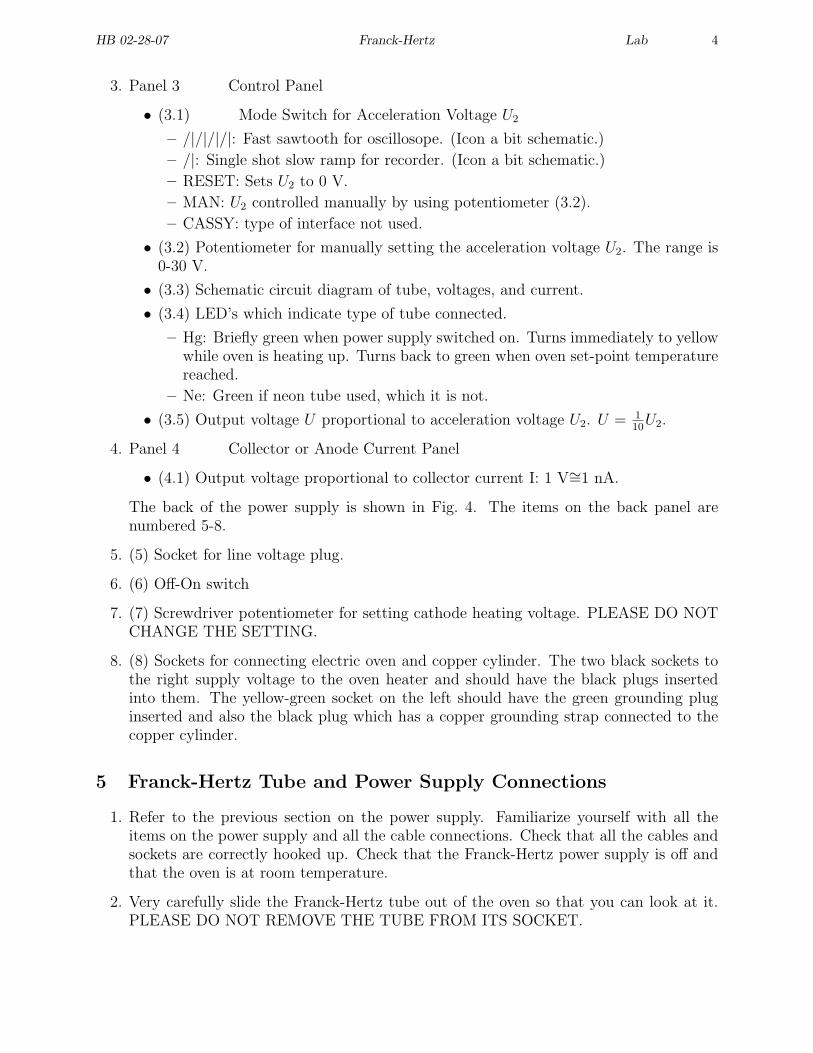
The Franck-Hertz tube has cylindrical geometry. See Fig. 1. A cathode (K) is indirectlyheated by a filament. The filament is heated by the voltage UH . Close to the cathode is thecontrol grid G1 which is kept a few volts positive with respect to the cathode by the voltageU1. The magnitude of the electron current through the tube is largely but not completelycontrolled by U1. At a relatively larger distance is the accelerating grid G2. The voltagebetween G1 and G2 is U2. With U1 fixed, the electron energy is varied by changing U2. Thevoltage U2 has a range of 0-30 V, with G2 positive with respect to G1. A short distanceoutside G2 is the collector or anode (A). The current to the anode is (I). The voltage betweenG2 and A is U3. This is a retarding voltage of a few volts.
The tube has a small amount of liquid mercury in it. For the mercury pressure to besufficient it is necessary to heat the tube to 170-200 deg C. There is an oven into whichthe tube is inserted. Inside the oven is a cylindrical copper tube to provide temperatureuniformity. The Franck-Hertz tube goes inside the copper tube. A slide mechanism isprovided to hold the tube and to insert the tube into the oven. A thermocouple in the formof a long thin tube sticks through a hole in the oven wall and goes all the way into a blindhole in the copper tube. It is important that the thermocouple probe go all the way into thehole in the wall of the copper tube. See Fig. 5. If it does not, the oven will overheat the tubeand ruin it.
All the voltages are supplied by a single power supply unit with appropriate cables. Thesame power supply unit provides a thermocouple reading and amplifies the anode current.The power supply unit has voltage output terminals for the anode current I and the voltageU2 of grid G2.
3 Description of the Experiment
Assume that the control grid voltage U1 and retarding voltage U3 are held constant. Electronsemitted with a thermal energy from the cathode are accelerated by the control grid voltageU1 and pass through G1 into the region between G1 and G2. In this region the electrons areaccelerated by U2 and make a number of collisions with mercury atoms. These collisions willbe elastic if the electron energy is everywhere below 4.9 eV. The anode current I will increaseas U2 is increased, as some of the electric field produced by G2 will leak through grid G1.For the moment let us assume that U2 has a value such that the electron energy just beforepassing through G2 is just below 4.9 eV. The electrons, after passing through G2, will haveenough energy to overcome a suitable retarding potential U3 and produce the plate current I.If now U2 is raised a bit so that the electron energy is a little above 4.9 eV just before passingthrough G2, some of the electrons will make inelastic collisions with mercury atoms. Theseelectrons will have very little kinetic energy and when they pass through G2 will not haveenough energy to overcome the retarding voltage U3. The anode current will then be lesseven though the accelerating voltage has been increased. In other words, as U2 is increased,the anode current I decreases! When U2 is increased more, the current through the tubewill start to increase once again, and the point at which electrons make inelastic collisionswill move further and further from the grid G2. But after the first inelastic collisions whichleave the electrons with very little kinetic energy, they are accelerated once again, and ifU2 is increased enough the electron energy is enough so they can make a second inelastic

HB 02-28-07 Franck-Hertz Lab 3
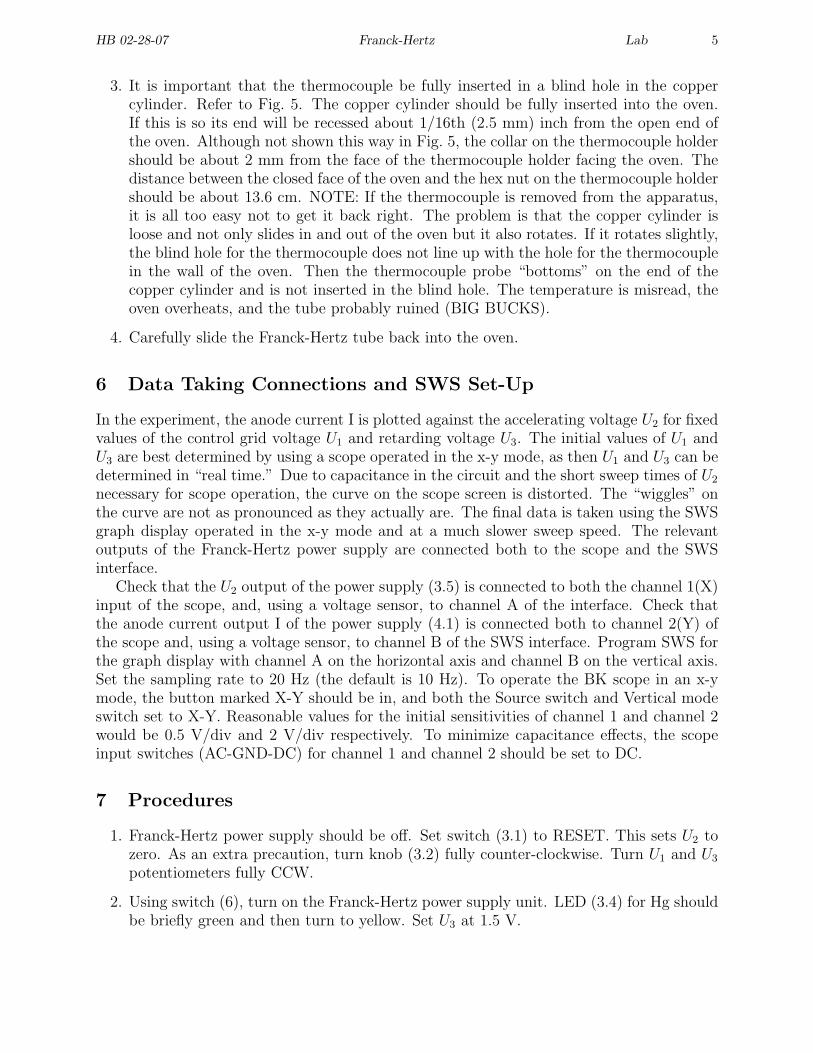
collision just before G2, resulting in another decrease of anode current as U2 is raised. Thisprocess can be repeated a number of times, resulting in a curve of I vs U2 shown in Fig 2.The difference in voltage between the peaks is the excitation voltage 4.9 eV.
4 Description of Power Supply
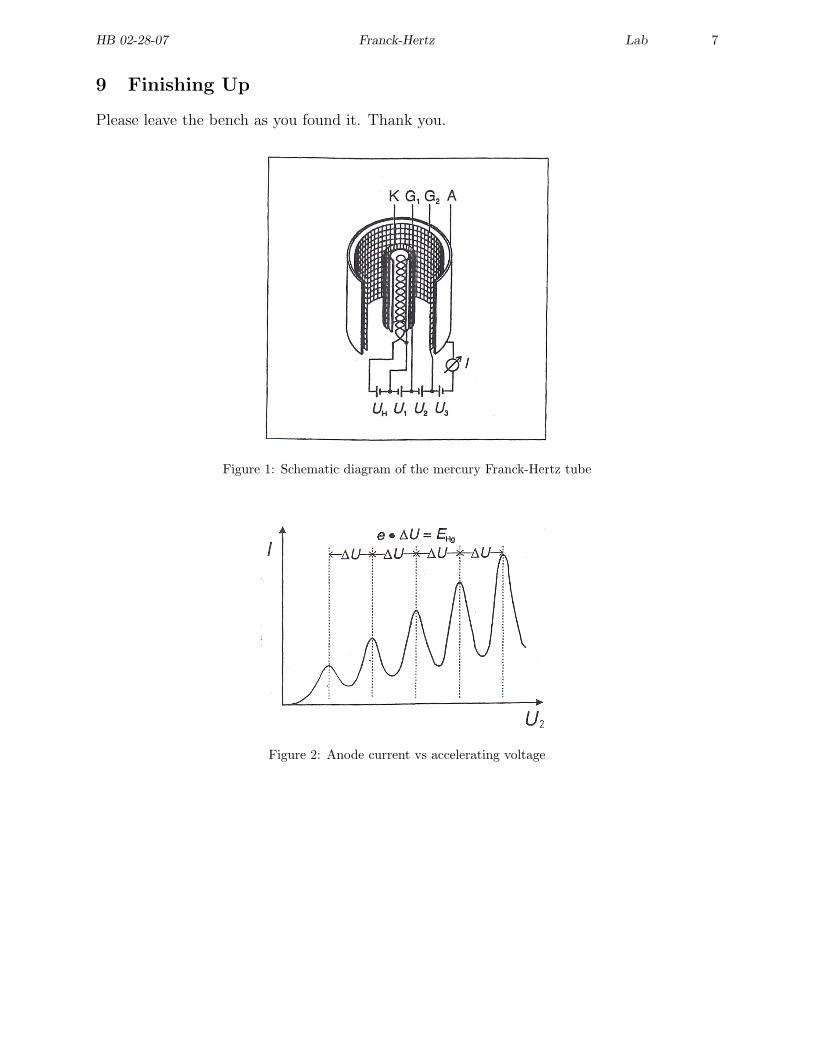
The front of the power supply can be divided into 4 panels which are labeled 1 through 4.See Fig. 3. Panels are labeled 1-4 by the first digit. Items within a panel are labeled in thefirst decimal place.
1. Panel 1 Tube Connection Panel
• (1.1) Female DIN socket for connecting cable from socket of Franck-Hertz tube.
• (1.2) Not used (alternative sockets for tube).
• (1.3) Not used (special interface connection).
2. Panel 2 Display Panel
• (2.1) DIN socket for connecting the temperature sensor.
• (2.2) Screwdriver potentiometer for setting the temperature of the electric oven.The preset value will probably be in the range 170-200 deg C. PLEASE DONOT CHANGE THE SETTING OF THIS POTENTIOMETER WITHOUT CON-SULTING THE 2ND FLOOR STAFF OR THE LAB INSTRUCTOR.
• (2.3) Potentiometer for setting the retarding voltage U3. The voltage range is 0-10 V.
• (2.4) Potentiometer for setting the control grid voltage U1. The voltage range is0-5 V.
• (2.5) Selector switch for reading parameters and measured values on the digitaldisplay (2.6).
– ϑs Set point temperature for oven.
– ϑ Actual or measured temperature of oven.
– U1 Control grid voltage
– U3 Retarding voltage
– U2 Acceleration voltage
– I Collector current in nA.
• (2.6) Digital Display. Parameter displayed chosen by switch (2.5). Units are in degC, V, or nA. U3 is a negative voltage.
• (2.7) Analog voltage out for items selected by switch (2.5). The output voltage isapproximately proportional to the chosen quantity as follows.
– ϑs and ϑ: 100 deg C ∼= 1 V
– U1: 1 V ∼= 1 V
– U3: -1 V ∼= 1 V
– U2: 10 V ∼= 1 V
– I: 1 nA ∼= 1 V.
HB 02-28-07 Franck-Hertz Lab 4
3. Panel 3 Control Panel
• (3.1) Mode Switch for Acceleration Voltage U2
– /|/|/|/|: Fast sawtooth for oscillosope. (Icon a bit schematic.)
– /|: Single shot slow ramp for recorder. (Icon a bit schematic.)
– RESET: Sets U2 to 0 V.
– MAN: U2 controlled manually by using potentiometer (3.2).
– CASSY: type of interface not used.
• (3.2) Potentiometer for manually setting the acceleration voltage U2. The range is0-30 V.
• (3.3) Schematic circuit diagram of tube, voltages, and current.
• (3.4) LED’s which indicate type of tube connected.
– Hg: Briefly green when power supply switched on. Turns immediately to yellowwhile oven is heating up. Turns back to green when oven set-point temperaturereached.
– Ne: Green if neon tube used, which it is not.
• (3.5) Output voltage U proportional to acceleration voltage U2. U = 110
U2.
4. Panel 4 Collector or Anode Current Panel
• (4.1) Output voltage proportional to collector current I: 1 V∼=1 nA.
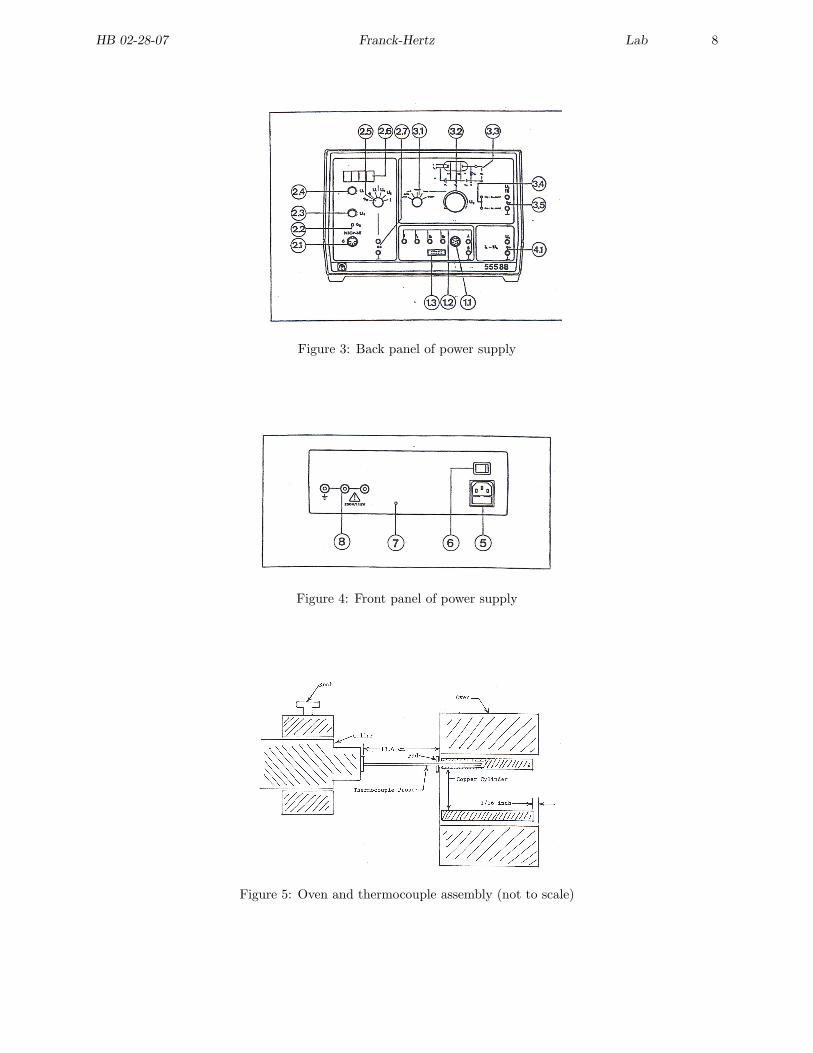
The back of the power supply is shown in Fig. 4. The items on the back panel arenumbered 5-8.
5. (5) Socket for line voltage plug.
6. (6) Off-On switch
7. (7) Screwdriver potentiometer for setting cathode heating voltage. PLEASE DO NOTCHANGE THE SETTING.
8. (8) Sockets for connecting electric oven and copper cylinder. The two black sockets tothe right supply voltage to the oven heater and should have the black plugs insertedinto them. The yellow-green socket on the left should have the green grounding pluginserted and also the black plug which has a copper grounding strap connected to thecopper cylinder.
5 Franck-Hertz Tube and Power Supply Connections
1. Refer to the previous section on the power supply. Familiarize yourself with all theitems on the power supply and all the cable connections. Check that all the cables andsockets are correctly hooked up. Check that the Franck-Hertz power supply is off andthat the oven is at room temperature.
2. Very carefully slide the Franck-Hertz tube out of the oven so that you can look at it.PLEASE DO NOT REMOVE THE TUBE FROM ITS SOCKET.
HB 02-28-07 Franck-Hertz Lab 5
3. It is important that the thermocouple be fully inserted in a blind hole in the coppercylinder. Refer to Fig. 5. The copper cylinder should be fully inserted into the oven.If this is so its end will be recessed about 1/16th (2.5 mm) inch from the open end ofthe oven. Although not shown this way in Fig. 5, the collar on the thermocouple holdershould be about 2 mm from the face of the thermocouple holder facing the oven. Thedistance between the closed face of the oven and the hex nut on the thermocouple holdershould be about 13.6 cm. NOTE: If the thermocouple is removed from the apparatus,it is all too easy not to get it back right. The problem is that the copper cylinder isloose and not only slides in and out of the oven but it also rotates. If it rotates slightly,the blind hole for the thermocouple does not line up with the hole for the thermocouplein the wall of the oven. Then the thermocouple probe “bottoms” on the end of thecopper cylinder and is not inserted in the blind hole. The temperature is misread, theoven overheats, and the tube probably ruined (BIG BUCKS).
4. Carefully slide the Franck-Hertz tube back into the oven.
6 Data Taking Connections and SWS Set-Up
In the experiment, the anode current I is plotted against the accelerating voltage U2 for fixedvalues of the control grid voltage U1 and retarding voltage U3. The initial values of U1 andU3 are best determined by using a scope operated in the x-y mode, as then U1 and U3 can bedetermined in “real time.” Due to capacitance in the circuit and the short sweep times of U2
necessary for scope operation, the curve on the scope screen is distorted. The “wiggles” onthe curve are not as pronounced as they actually are. The final data is taken using the SWSgraph display operated in the x-y mode and at a much slower sweep speed. The relevantoutputs of the Franck-Hertz power supply are connected both to the scope and the SWSinterface.
Check that the U2 output of the power supply (3.5) is connected to both the channel 1(X)input of the scope, and, using a voltage sensor, to channel A of the interface. Check thatthe anode current output I of the power supply (4.1) is connected both to channel 2(Y) ofthe scope and, using a voltage sensor, to channel B of the SWS interface. Program SWS forthe graph display with channel A on the horizontal axis and channel B on the vertical axis.Set the sampling rate to 20 Hz (the default is 10 Hz). To operate the BK scope in an x-ymode, the button marked X-Y should be in, and both the Source switch and Vertical modeswitch set to X-Y. Reasonable values for the initial sensitivities of channel 1 and channel 2would be 0.5 V/div and 2 V/div respectively. To minimize capacitance effects, the scopeinput switches (AC-GND-DC) for channel 1 and channel 2 should be set to DC.
7 Procedures
1. Franck-Hertz power supply should be off. Set switch (3.1) to RESET. This sets U2 tozero. As an extra precaution, turn knob (3.2) fully counter-clockwise. Turn U1 and U3
potentiometers fully CCW.
2. Using switch (6), turn on the Franck-Hertz power supply unit. LED (3.4) for Hg shouldbe briefly green and then turn to yellow. Set U3 at 1.5 V.

HB 02-28-07 Franck-Hertz Lab 6
3. Monitor the temperature while the oven heats up by turning switch (2.5) to ϑ. You cancheck the set-point temperature by turning this switch to ϑs.
4. In about 20 min the oven will reach the set-point temperature ϑs and LED (3.4) willchange from yellow to green. The temperature of the oven will overshoot by about7 deg C and then settle down to near the set-point temperature.
5. Turn the mode switch (3.1) to the fast saw-tooth position and adjust the scope and thepotentials U1 and U3 for a reasonable scope trace. You might try values for U1 and U3
between 1 and 2 volts. You want a trace that looks somewhat like Fig. 2, although onthe scope you will not see such pronounced dips. If you make I too large by making U1
too large or U3 too small, you will saturate the amplifier. The peaks on the right willhave flat tops. You can make I too small by making U1 too small or U3 too large. IfU3 is made too large, the dips in the curve will “bottom out.” As a general procedure,set U1 and vary U3 for the best curve. Then try another value of U1, vary U3, and seeif the results improve.
If in spite of adjustments of U1 and U3 the current I is very low, the first maximumpoorly defined, and the curve rather flat, it may be necessary to decrease the oventemperature. This should be done in consultation with the 2nd floor staff and yourinstructor. If the temperature is reduced too much, a discharge will result which maywell damage the tube. If the current I is too high (amplifier saturates) it may benecessary to increase the oven temperature.
6. When you have the kind of curve you want on the scope, set switch (2.5) so thatdisplay (2.6) shows the voltage U2. Click REC in the left experiment set-up windowand immediately turn the mode switch (3.1) to the single shot ramp so as to starta 0-30 V sweep of U2. When the sweep is complete as shown by display (2.6), clickSTOP. Click auto-scale on the graph display. Click the analyze button on the graphdisplay and use the cross hairs to measure the voltages of the peaks. Find the voltagedifferences between the peaks and compare to the accepted value of 4.9 V. Print outyour curve. (Recall that the voltage along the horizontal axis of the graph display isU2/10, not U2.)
7. Looking at the scope, slowly increase U1 until the signal shows a small amount ofsaturation. Record the curve and print it out. Mark your print-out, showing the regionof saturation.
8 Questions
1. Why is it better to have the cathode indirectly heated rather than directly heated?
2. When the oven temperature is too low, why is there the possibility of a discharge?
3. Why should the oven temperature not be too high?
4. Does the first peak occur at (U1 + U2) = 4.9 V? Can you think of reasons as to why itwould not?
HB 02-28-07 Franck-Hertz Lab 7
9 Finishing Up
Please leave the bench as you found it. Thank you.
Figure 1: Schematic diagram of the mercury Franck-Hertz tube
Figure 2: Anode current vs accelerating voltage
HB 02-28-07 Franck-Hertz Lab 8
Figure 3: Back panel of power supply
Figure 4: Front panel of power supply
Figure 5: Oven and thermocouple assembly (not to scale)