Frameworks for Environment Statistics – A Common Denominator?
17
DEPARTMENT OF ECONOMIC AND SOCIAL AFFAIRS STATISTICS DIVISION UNITED NATIONS ESA/STATISTICS/AC.228 EGM-FDES/1/15 _____________________________________________________________________________ Expert Group Meeting on the Revision of the Framework for the Development of Environment Statistics (FDES) New York, 8-10 November 2010 Frameworks for Environment Statistics – A Common Denominator? Torstein Bye Statistics Norway
Transcript of Frameworks for Environment Statistics – A Common Denominator?
DEPARTMENT OF ECONOMIC AND SOCIAL AFFAIRS
STATISTICS DIVISION
UNITED NATIONS
ESA/STATISTICS/AC.228
EGM-FDES/1/15
_____________________________________________________________________________ Expert Group Meeting on the Revision of the Framework
for the Development of Environment Statistics (FDES)
New York, 8-10 November 2010
Frameworks for Environment Statistics –
A Common Denominator?
Torstein Bye Statistics Norway
2
1. Introduction
There exist a lot of suggested frameworks and/or environmental information systems concerning
development of environmental statistics. Examples are DPSIR (driving forces, pressure, state,
impact, response), the Ecosystem approach (focusing on terrestrial, marine water, freshwater and
atmosphere components of ecosystems), SEEA (system of environmental economic accounts),
NAMEA (National Account Matrix including Environmental Accounts) and the capital approach
(produced/physical and financial capital, human capital, environmental and social capital). In
addition a lot of information initiatives have come up like the beyond GDP initiative, the Stiglitz
commission, Europe 2020, Environmental indicators and Suistainable development indicators etc.
We also have the MDI (millennium development indicators), the CSD (Commission development
indicators) and the recent OECD initiative, the indicators for the green growth strategy.
Although all these frameworks and/or initiatives may seem different, because the point of
departure for developing them is different, there possibly exist some common denominators that
unite them. This is very important because of potential simplifications of the data requirements
and potential data quality improvements within the statistical system that is going to support all
these frameworks and form most of their information basis. The statistical system should serve
these frameworks in a consistent, systematic and efficient way, i.e. having a multipurpose flexible
statistical system is very important to avoid double work, double counting, confusion and
resignation.
In this paper the focus is on the common features among the systems rather than on the
differences in approaches, and our intention is to show that there principally exists a “general
framework” that can reduce all the suggested frameworks to variants or dimensions of this
general framework. This “general framework” then helps us to unite rather than disperse our
thoughts about the frameworks and then to simplify the practical work of compiling
environmental statistics. The discussion of choice of framework may then be reduced to a
discussion of the particular focus of a separate block of such frameworks rather than of the
differences between the frameworks.
To address the question of sustainability, which is an important question in environmental
statistics, we need a conceptual framework: It is necessary to have a tight, analytical sound
framework from which to approach to practical decisions. Along the way corners have to be cut
and qualitative judgements have to be made. But having a correct framework at the back of one’s
practical mind is good practise and enables us to recognize when a corner has to be cut and it
forces him to search for good way to do this (Dasgupta (2001). This statement addresses the
important question of accuracy, quality and reliability and accepts that due to measuring problems
this puts the statistical community into tough methodological and practical challenges. At the
same time it indirectly addresses the consistency question, i.e. consistency across different
frameworks, which the statistical community should highlight in their production process of
statistics.
First we start by giving a brief explanation of the main elements in the DPSIR approach, and then
we continue with the SEEA/NAMEA approach, the capital approach and the Ecosystem
approach.
Then we make some remarks about other initiatives and finally we try to sum up and try to set up
a formal link between all these frameworks – illustrated in figures - and finally ask whether it
could suffice with just one framework when working with production of the statistics. If so, the
statistical system could be kind of a multipurpose system that serves all the

3
frameworks/initiatives in a consistent, systematic and efficient way which also eases the
statistical discussions, the analyses and the environmental policy formation.
Another but related question is the role of national statistical offices vs. the role of other public
agencies and environmental research institutes in the contribution of relevant statistics to fill in
the frameworks with facts. A Norwegian example is presented at the end of the paper, just to
show the complexity in environmental data gathering.
2. DPSIR or SDPI-R?
DPSIR (Driving forces, Pressure, State, Impact and Responses) is a causal framework for
describing the interactions between society and the environment. The framework has been
adopted by the European Environment Agency, forms the basis of the present framework for
environmental statistics in UN and is an extension of the pressure-state-response model
developed by OECD.
When we discussed this framework in Norway in the 1980s our ranking of the letters DPSIR
where kind of different. We, see Alfsen, Bye and Lorentsen (1987), applied the SDPI-R ranking.
This may seem to be a semantic question, but in the discussions below, especially when it comes
to the ecosystem approach, this ranking may be important for the understanding of the framework
and in particular for the importance of focusing on the role of policy response – as rationale for
environmental statistics.
In the State part of the model we find information on the amount of non-renewable and
renewable resources (oil, gas, minerals, land, fish, water, etc), and information on different
aspects of the state of the environment (atmosphere, land, marine The Driving forces are
economic activities having effects on resources and environment, and in our context, this implies
a connection between the economic accounting in the national accounts and the resulting pressure
on the environment. From this driving forces elements, we derive a set of Pressure measures. The
Pressure follows from some kind of activity that generates changes in the State, like for instance
pollution that affects water quality, emissions that affect climate etc. The Impact part is then
equivalent to the change in the State variables (for example increased CO2 concentration). The
State variables could be influenced by the pressure variables but also by the Response, which
include environmental policy variables like taxes, tradable emission permit markets, regulations,
investments in environmental projects etc. Note that in our interpretation the Response element of
the framework only contains policy response, i.e. human response to environmental change,
whereas other interpretations have suggested that it also encompasses self-remedying responses
of the environment. The links between all dimensions of the SDPI-R framework may be linear,
non-linear or more complex depending upon the activity.
As a first step, data and information on all the different elements in the SDPI-R chain is collected.
Then possible connections between these different aspects are postulated. Through the use of the
SDPI-R modelling framework, it is possible then to gauge the effectiveness of environmental
policy responses put into place
In Alfsen, Bye and Lorentsen (1987) we formulated the following model for generation of the
necessary statistics in our SDPI-R framework.
Table 1. The SDPI framework in Alfsen, Bye and Lorentsen (1987)

4
1. Resource base (or Environment status) at date t-1
2. Adjustments of resource base in t (new discoveries, reappraisal of old discoveries)
3. Resource base at date t
4. Reserves – i.e. profitable resources to develop, (developed and non-developed) at date t
5. Adjustments of reserve base (new technology, new cost of extraction, new information on
prices, new regulations)
6. Total gross extraction in period t
7. Use of reserves in extraction process
8. Net extraction
9. Reserves base at t+1
10. Import
11. Export
12. Total domestic use
13. Domestic use by source
Item 1-9 deal with the State part of the framework, while item 10, 11, 12 and 13 cover the
Driving forces part. Item 6 says something about the direct changes in the past on the
resource/ecosystem base (Pressure and Impact in the extraction process) and item 12 and 13
linked with other information (for instance emission coefficients, water use coefficients, land use
coefficients etc), say something about the indirect effect on the environment (pressure and
impact).The pressure and impact parts affects item 2 and 4 and thereby item 3 and 8.
In the figure we see the link between the SDPI part
and the Response part. In Bye, Bye and Lorentsen
(1988) this was included through a formal policy
analysis based on a model.
We will come back to this table as a reference for
discussion when commenting on the other
frameworks below. In the following we are
consciously referring to the SDPI-R instead of the
DPSIR approach since this fits best in our
reasoning, with particular emphasis on the crucial
role of environmental statistics in the process of
evaluating environmental policy.
3. SEEA approach
SEEA (System of integrated economic environmental accounting) is a framework for organising
statistics (natural resources and environment) where we combine accounting in physical and

5
economic units (UN 2003)1. The link to the national accounts is essential in the framework, as
parts of the SDPI-R approach commented on above.
The main elements in the SEEA approach are the following, the Asset accounts and the Physical
flow accounts:
Asset accounts (following the definitions and valuation principles in the SNA)
• i) Stock levels at t
• ii) Extraction
• ii) New developments
• iii) Revaluation (due to technology improvements and information on cost and prices)
• iv) Depletion and degradation
• v) Stock levels at t+1
The stock levels may in principle capture traditional resources like fossil energy, renewables,
marine resources, land, freshwater, atmosphere etc, however just a few of them are so far covered
in the first proposal of the SEEA framework.This asset part of the SEEA approach is almost in
principle identical to the State part of the SDPI-R approach described above, with Stock levels
corresponding to the State, and Extraction representing the Driving forces. In the SDPI-R
approach we only focus on physical measures while the asset accounts in the SEEA also focus on
the valuation of the assets – following the principles of evaluation in the national accounts. This,
however, should not influence on the physical part of the measures, cf. the difference between
resources and reserves in the SDPI-R approach.
Physical flow accounts
• Flows from the environment to the economy
o Resources
� Materials
� Energy
� Water
• Flows from the Economy to the environment (these are Impacts that represent the change
in the state?)
o Waste
o Disposals
o Residuals
o Emissions
In the physical accounts we may distinguish
between the flows from the environment to the
economy and flows from the economy to the
environment. Flows from the environment to the
economy are obviously comparable to item 6 in
the SDPI-R approach in chapter 2, i.e. the
extraction of resources and thereby change in the
state of the resource/environment base. But the
main focus in SEEA is on the driving forces
aspect since this element combines the use of
1 An editorial board is now working with outcome papers from the London Group to develop a new revised manual for
SEEA which is supposed to be submitted to the 43rd session of the UNSC for adoption in February 2012.

6
resources with the driving forces in the national account activities.
Flows from the economy to the environment are obviously part of the chain from Driving forces
to Pressure and Impact, cf the mentioned activities above. In statistical sense it is hard to see that
this is really different from how this is treated in the SDPI-R approach, hence there is clearly a
common denominator between the SDPI-R and the SEEA frameworks in how the interactions
between the economy and the environment can be represented in statistical terms.
Schenau (2010) also discusses the relation between the SEEA and the DPSIR frameworks.
4. NAMEA
The acronym NAMEA stands for National accounting matrix with environmental accounts. A
good description of the NAMEA approach is given in Haan and Kee (xx). From their work we
find the following explanation:
The environmental accounts show the interactions between producer and consumer (household)
activities and the natural environment. These interrelationships occur as a consequence of the
environmental requirements of these activities: natural resource inputs and residual outputs.
These requirements are appointed to these activities when and where they actually take place.
This direct recording is consistent with prevailing national accounting practices. By providing
economic and environmental data in a consistent Leontief-type framework, the NAMEA is
particularly suited for analytical purposes.
This is exactly the same intention as in the SEEA approach and detailing the analyses of the
approaches shows that there are no major differences between them when it comes to the
relationships between the economic driving forces and the environmental pressures and impacts ;
i.e what is said about the principles of SEEA above also is relevant for the NAMEA approach,
however, the State of the environment in not included in the NAMEA framework (?).
5. Capital approach
The point of departure for the capital approach is the need to address the question of sustainable
development accepting the importance of capital and investments to foster such a development in
terms of securing the long-term “wealth of nations” (see Smith (1776)). This does not concern
just capital in a traditional economic sense , but all kinds of capital –physical capital (buildings,
machineries etc), financial capital (serving the investment in new capital), human capital, natural
resource capital (the market part of environmental capital), environmental capital (the non-market
part) and social capital.2
The relevance of the capital approach in this context is along two dimensions: i) the environment
as a separate capital category (with all the challenges on measuring and valuing) and ii) the
substitutability between environmental capital and other forms of capital, see UN (2008).
2 In the preliminary draft of the SEEA in 2003, accepting that SEEA was not developed to directly serve
the measuring of sustainable development, this may still be one of the applications. Three conceptions of
sustainable development are described in the SEEA handbook, with the capital approach noted as the one to
which SEEA is best suited, i.e there are clear links between the SEEA approach and the capital approach.
7
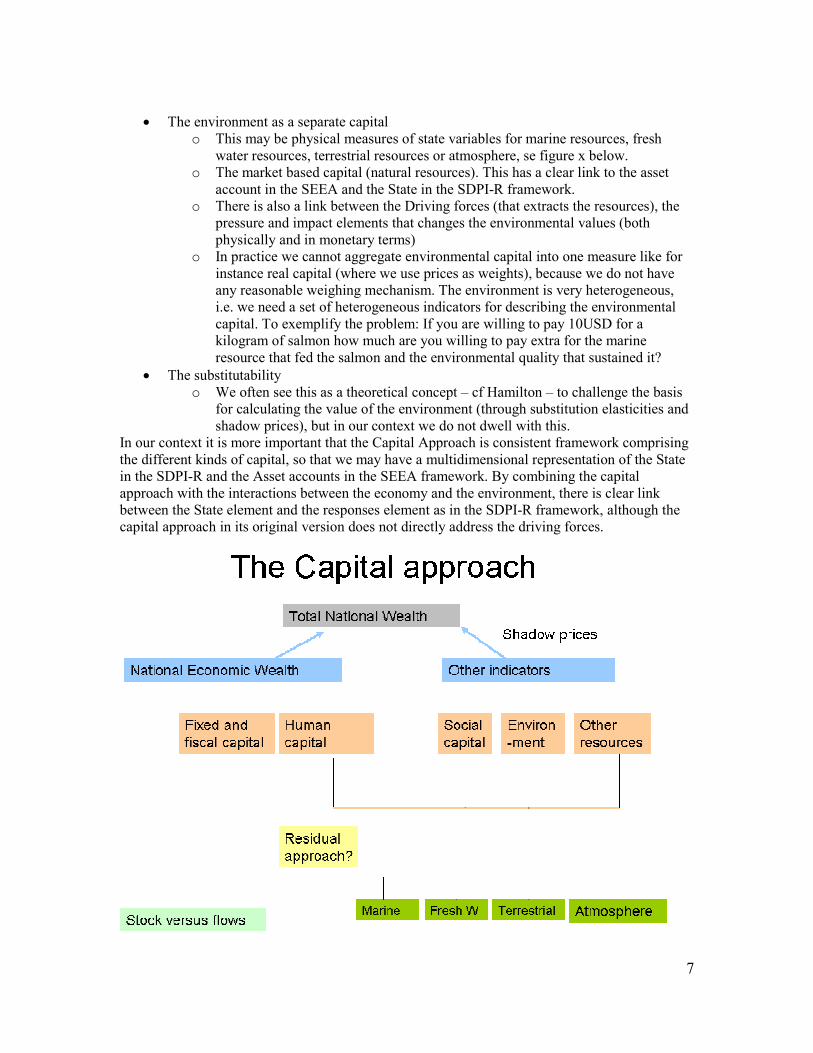
• The environment as a separate capital
o This may be physical measures of state variables for marine resources, fresh
water resources, terrestrial resources or atmosphere, se figure x below.
o The market based capital (natural resources). This has a clear link to the asset
account in the SEEA and the State in the SDPI-R framework.
o There is also a link between the Driving forces (that extracts the resources), the
pressure and impact elements that changes the environmental values (both
physically and in monetary terms)
o In practice we cannot aggregate environmental capital into one measure like for
instance real capital (where we use prices as weights), because we do not have
any reasonable weighing mechanism. The environment is very heterogeneous,
i.e. we need a set of heterogeneous indicators for describing the environmental
capital. To exemplify the problem: If you are willing to pay 10USD for a
kilogram of salmon how much are you willing to pay extra for the marine
resource that fed the salmon and the environmental quality that sustained it?
• The substitutability
o We often see this as a theoretical concept – cf Hamilton – to challenge the basis
for calculating the value of the environment (through substitution elasticities and
shadow prices), but in our context we do not dwell with this.
In our context it is more important that the Capital Approach is consistent framework comprising
the different kinds of capital, so that we may have a multidimensional representation of the State
in the SDPI-R and the Asset accounts in the SEEA framework. By combining the capital
approach with the interactions between the economy and the environment, there is clear link
between the State element and the responses element as in the SDPI-R framework, although the
capital approach in its original version does not directly address the driving forces.
8
In reality one has accepted that within the framework of the capital approach it may be hard or
even impossible to measure the environmental capital value and some times also to calculate
meaningful capital measures of capital in physical terms (for instance atmosphere or marine
resources). In the spirit of Dasgupta then, see the introduction, we have chosen to calculate flows
instead of the capital. Even though the change in capital (i.e. neglecting the revaluation and
degradation aspects) should equal the flows we do not know the initial value of the capital so we
can not calculate the t+1 value.
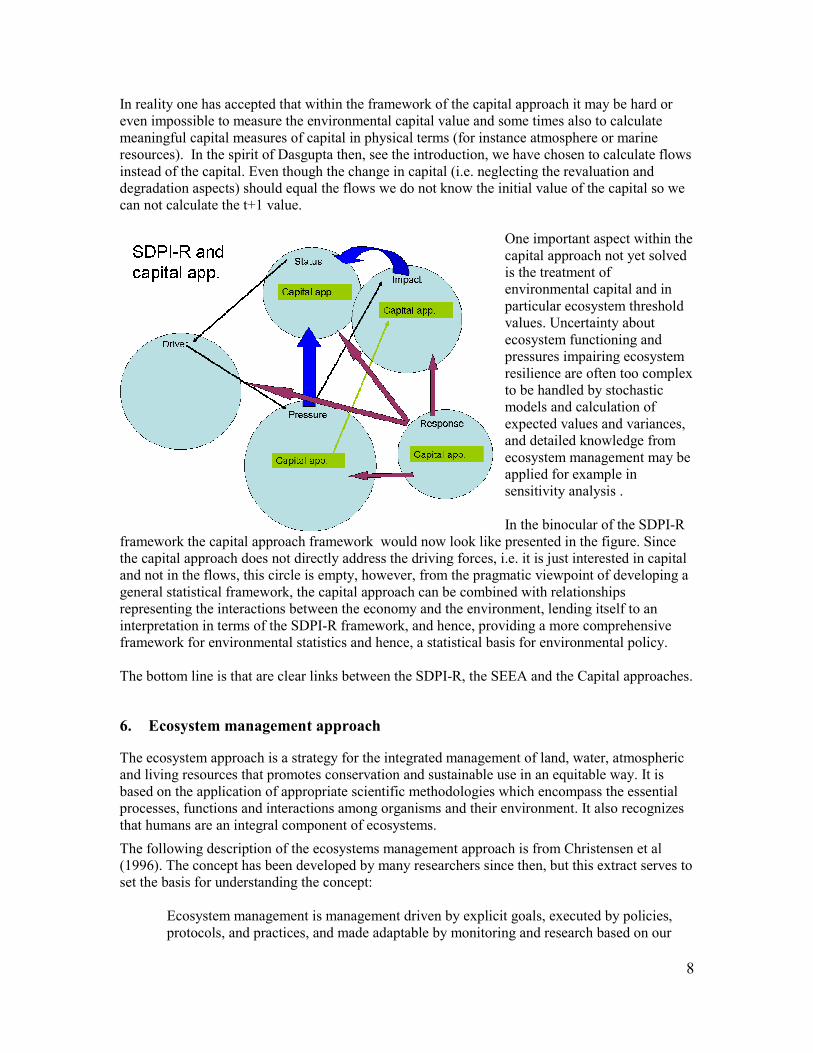
One important aspect within the
capital approach not yet solved
is the treatment of
environmental capital and in
particular ecosystem threshold
values. Uncertainty about
ecosystem functioning and
pressures impairing ecosystem
resilience are often too complex
to be handled by stochastic
models and calculation of
expected values and variances,
and detailed knowledge from
ecosystem management may be
applied for example in
sensitivity analysis .
In the binocular of the SDPI-R
framework the capital approach framework would now look like presented in the figure. Since
the capital approach does not directly address the driving forces, i.e. it is just interested in capital
and not in the flows, this circle is empty, however, from the pragmatic viewpoint of developing a
general statistical framework, the capital approach can be combined with relationships
representing the interactions between the economy and the environment, lending itself to an
interpretation in terms of the SDPI-R framework, and hence, providing a more comprehensive
framework for environmental statistics and hence, a statistical basis for environmental policy.
The bottom line is that are clear links between the SDPI-R, the SEEA and the Capital approaches.
6. Ecosystem management approach
The ecosystem approach is a strategy for the integrated management of land, water, atmospheric
and living resources that promotes conservation and sustainable use in an equitable way. It is
based on the application of appropriate scientific methodologies which encompass the essential
processes, functions and interactions among organisms and their environment. It also recognizes
that humans are an integral component of ecosystems.
The following description of the ecosystems management approach is from Christensen et al
(1996). The concept has been developed by many researchers since then, but this extract serves to
set the basis for understanding the concept:
Ecosystem management is management driven by explicit goals, executed by policies,
protocols, and practices, and made adaptable by monitoring and research based on our

9
best understanding of the ecological interactions and processes necessary to sustain
ecosystem composition, structure, and function. In recent years, sustainability has become
an explicitly stated, even legislatively mandated, goal of natural resource management
agencies. In practice, however, management approaches have often focused on
maximizing short-term yield and economic gain rather than long-term sustainability. A
prevailing public perception is that the immediate economic and social value of
supposedly renewable resources outweighs the risk of future ecosystem damage or the
benefits of alternative management approaches. This may be a misconception but do we
have the proper information to convince otherwise?
The ecosystem management is driven by explicit goals, executed by policies, protocols, and
practices, and made adaptable by monitoring and research based on our best understanding of the
ecological interactions and processes necessary to sustain ecosystem composition, structure, and
function. The central goal of ecosystem management is sustainability, where the emphasis is on
delivering ecosystems services for current use without compromising the ability to provide them
in the future. A fundamental aspect is the need to protect sources of resources; that is, ecosystems
require appropriate protection to ensure the provision of ecosystem services. It is biodiversity that
is the key to supporting resilient, productive and healthy functioning ecosystems and therefore
underpins the provision of ecosystems services.

10
Ecosystems are normally divided into four main components
• Marine water (open ocean, coastal)
• Fresh Water (Wetlands, Lakes, Rivers)
• Terrestrial (Forest, Gras/rangeland, Desert, Tundra,Cropland,Urban)
• Atmosphere (climate)
The ecosystems deliver services beyond extraction of natural resources (forest, minerals, energy ,
fish, freshwater, clean air)
• Some services are
o sink for sequestration (marine, soil, forest) of greenhouse gases,
o a recipient for polluting items,
o services for leisure time activities, etc.
o biodiversity
Several other aspects are important
• Stochastic capacity, resilience and threshold levels
• Restoring capability, adaptation and substitution possibilities.
• Ecosystem degradation and decline in service capacity
In Statistics Canada (2010) the following statements are made:
• …….. each framework attempts to organize and link human activities to their impact on
the environment. Each one also includes the state of the environment at a particular point
in time and society’s response to its negative impact on the environment.
• In a multi�component system framework, it may be impossible to establish cause and
effect. In the natural world, each process and state influences and is influenced, making it
difficult to separate out the pressure, the state and the response. Public policy and
decision makers may also have difficulty interpreting the results from a multi�component
framework that can result in misclassifications and improper conclusions being drawn
from the results
In the first bullet point we are close to the SDPI-R approach, the second doubts the possibility to
establish reliable driving forces within the ecosystem management approach. (The nature respons
to respons is included ?) This raises two issues
• With no driving forces included in the ecosystem management approach, the policy
makers are not able to implement an effective policy to stop or weaken these driving
forces, i.e. you will have an ever lasting driving pressure against deterioration of
important ecosystems.
• The policy measure should then be directed towards the ecosystem itself. For situations
of reaching ecosystem threshold values (corner solutions) this seems reasonable, for non-
corner solution a regulation implies shadow prices that affect the driving forces. But,
within the original version of the ecosystem management approach we are not able to
calculate the effects of the regulation on economic activity.
11
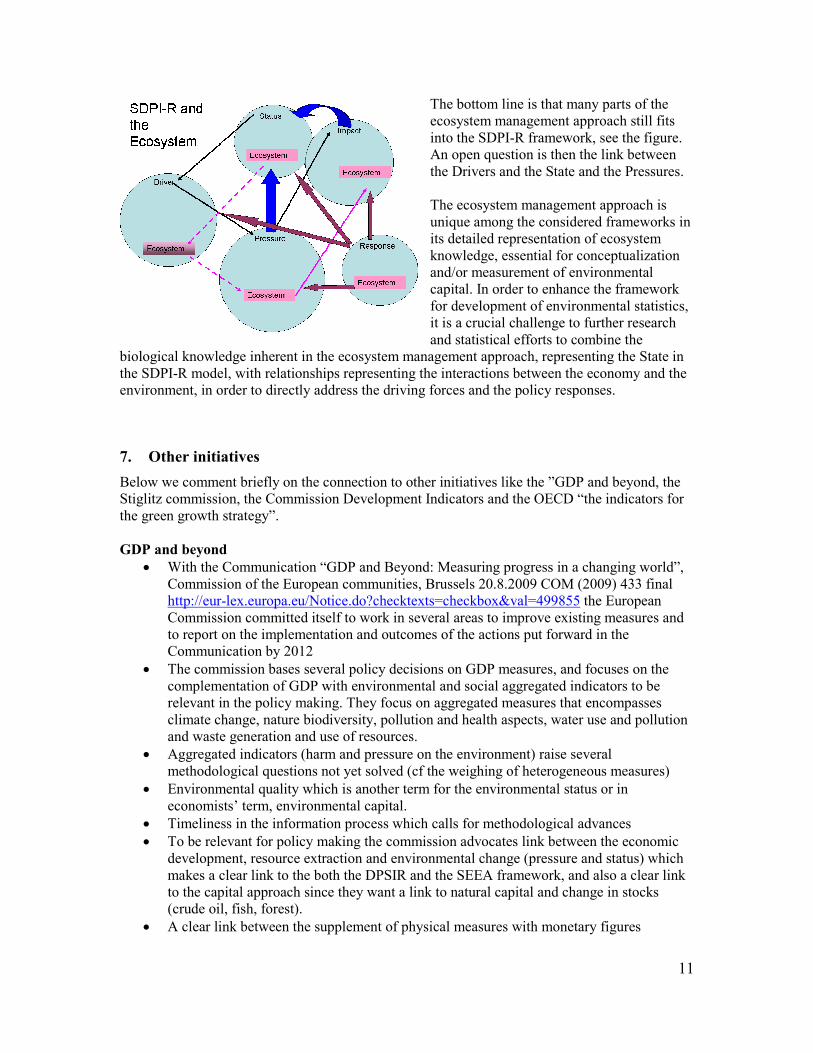
The bottom line is that many parts of the
ecosystem management approach still fits
into the SDPI-R framework, see the figure.
An open question is then the link between
the Drivers and the State and the Pressures.
The ecosystem management approach is
unique among the considered frameworks in
its detailed representation of ecosystem
knowledge, essential for conceptualization
and/or measurement of environmental
capital. In order to enhance the framework
for development of environmental statistics,
it is a crucial challenge to further research
and statistical efforts to combine the
biological knowledge inherent in the ecosystem management approach, representing the State in
the SDPI-R model, with relationships representing the interactions between the economy and the
environment, in order to directly address the driving forces and the policy responses.
7. Other initiatives
Below we comment briefly on the connection to other initiatives like the ”GDP and beyond, the
Stiglitz commission, the Commission Development Indicators and the OECD “the indicators for
the green growth strategy”.
GDP and beyond
• With the Communication “GDP and Beyond: Measuring progress in a changing world”,
Commission of the European communities, Brussels 20.8.2009 COM (2009) 433 final
http://eur-lex.europa.eu/Notice.do?checktexts=checkbox&val=499855 the European
Commission committed itself to work in several areas to improve existing measures and
to report on the implementation and outcomes of the actions put forward in the
Communication by 2012
• The commission bases several policy decisions on GDP measures, and focuses on the
complementation of GDP with environmental and social aggregated indicators to be
relevant in the policy making. They focus on aggregated measures that encompasses
climate change, nature biodiversity, pollution and health aspects, water use and pollution
and waste generation and use of resources.
• Aggregated indicators (harm and pressure on the environment) raise several
methodological questions not yet solved (cf the weighing of heterogeneous measures)
• Environmental quality which is another term for the environmental status or in
economists’ term, environmental capital.
• Timeliness in the information process which calls for methodological advances
• To be relevant for policy making the commission advocates link between the economic
development, resource extraction and environmental change (pressure and status) which
makes a clear link to the both the DPSIR and the SEEA framework, and also a clear link
to the capital approach since they want a link to natural capital and change in stocks
(crude oil, fish, forest).
• A clear link between the supplement of physical measures with monetary figures

12
• They even seem to support the development of valuation methods for valuing
environmental services.
The Stiglitz commission
The Stiglitz commission focuses on a lot of variables and distributional aspects, of which some is
also relevant for the FDES. Especially they focus on the measuring of all sorts of capital,
including environmental capital, in addition to all kinds of flow variables also relevant to the
environment. On the environment the Stiglitz commission suggestions look pretty much like the
suggestions in the capital approach.
CSD Indicators
The United Nations Commission on Sustainable Development (CSD) was established by the UN
General Assembly in December 1992 to ensure effective follow-up of United Nations Conference
on Environment and Development.
The indicator set covers poverty, governance, health, education, natural hazards, atmosphere,
land, Oceans seas and coasts, biodiversity, economic development, global economic partnership,
consumption and production patterns (which also includes pressure and impact on the
environment – like for instance generation of waste).
Again, several of the indicators are closely linked to information we want to gather in the other
approaches presented here which again addresses the multipurpose aspect of the statistical
framework.

13
The indicators for the green growth strategy
In OECD (2010) examples of
indicators for the green growth
strategy are presented. The indicator
set will support policy analysis in the
OECD. The focus is on market
failures and externalities. The
intention is that the indicators will
help identifying instruments to foster
environmentally friendly economic
growth. Policy relevance, analytical
soundness and measurability are
highlighted.
The figure is a copy of the figure in
OECD (2010) illustrating framework. The four left block in the figure coincide with the Driving
force block in the frameworks presented earlier in this paper. The arrows at the bottom show links
back and forth to/from the environment, while the right hand block is the instrument part, i.e. the
response part in the other frameworks presented here. The resemblance is obvious, in particular
since the focus on market failures and externalities emphasizes important economic mechanisms
underlying the driving forces from the economy to the environment.
8. A common denominator Framework for environment statistics
In the introduction we asked the question whether there is possible to find a common
denominator framework for all the frameworks presented. The review has shown that the
common features between all the frameworks are more obvious than the differences among
approaches.
The point of departure for the frameworks
are different, obviously, and there is also a
difference with respect to which element
is most in focus. For instance, the capital
approach framework and the ecosystem
management approach focus most on the
state or capital part, while the SEEA focus
very much on the capital and the driver
part. The description of the response and
impacts parts is also slightly different in
the semantics, but not really in principle.
All frameworks consider the response
part.
In our context the important question if
whether these frameworks are very different with respect to the statistical challenges. Our view is
that important ecosystem and resource questions are the same. Although the capital and
ecosystem approach seem to be less concerned about the driving forces, deriving such relations
does not harm the content in these approaches, on the contrary it deepens the approaches. Some

14
approaches may be diving deep down in the details while other framework just scratch the
surface, but again, this is a question of aggregation (which of course may be hard to overcome
because of weighing problems over heterogeneous characteristics).
When the approaches seem to have so common features the statistical challenge is to provide
them all with data in a consistent and efficient way within the same statistical system (including
the initiatives described in chapter 7).

15
9. The role of statistical offices
The devil is always in the details,
which we have not discussed very
much in this paper. Along all these
dimensions a lot of institutions are
producing statistics, which follows
from responsibilities and competence.
It is inefficient that statistical offices
produce all the statistics necessary to
follow up environmental
considerations. The table shows a
selection of other institutions in
Norway - public agencies and
environmental research institutes - that
produce relevant statistics for several
parts of the earlier discussed
frameworks, and so it has to be. Still,
it is important that all these
institutions have a common
understanding of the necessity of a
framework to be able to communicate about the development of environmental statistics, and in
this context the link between frameworks is also important to understand. We do not think that it
is possible for all institutions to work along the same framework, but if we know about the links
the communication process is much easier, also the communication with policy formation bodies.
10. Conclusions
The environmental statistics framework cannot exist in a vacuum. The real value of a framework
is that we focus on the relationship between the different elements in the framework – in the
saying “all depends on all”. The framework is a systematic way of organising the information
flow to obtain relevance, accuracy, accessibility, interpretability, quality, coherence and
consistency and at last but not at least; efficiency in the production of statistics.
It is not the number of frameworks, the name of the framework or the point of departure of the
framework that matters – it is the content that is important – the rest is a matter of organizing the
statistical information in a rational way.
It is obviously important to describe status (this is the main elements in the ecosystem approach,
the status in the SDPI-R framework, the Asset element in the SEEA framework, the capital
approach and most of the other initiatives). It is also important to describe what kind of driving
forces that changes (pressure, impact) the status – it may be difficult but efforts should be made to
make statistics relevant for policy formation. This seems to be most clearly stated in the SDPI-R
framework and the SEEA framework.
I.e. – whether we choose one or another point of departure should not be that big a deal –
therefore two other elements may be very important:
• We should try to unite on one framework – what are the arguments?
• KLIF – Norwegian Climate and Pollution Agency –
www.klif.no
• DN – Directorate for Nature Management –
www.dirnat.no
• NVE - Norwegian Water and Energy Directorate –
www.nve.no
• NINA – Norwegian Institute for Nature Research –
www.nina.no
• NGU – Geology for Society – www.ngu.no
• NILU – Norwegian Institute for Air Research –
www.nilu.no
• NIVA – Norwegian Institute for Water Research –
www.niva.no
• IMR – Institute of Marine Research – www.imr.no
• NILF – The Norwegian Forest and Landscape Institute –
www.skogoglandskap.no
• Bjerknes – Bjerknes Center for Climate Research –
www.bjerknes.uio.no
• NPD – Norwegian Petroleum Directorate – www.npd.no
• NPRA – Norwegian Public Roads Administration –
www.vegvesen.no

16
o The DPSIR is a long proven success –
o The SEEA is a highly emphasized framework from UN
o Although the ecosystem approach has also existed a couple of decades it is not
implemented in a large scale?
o The ecosystem approach lacks the driving force aspect that seems to be important
in most other initiatives? The other approaches lack the understanding of the
ecosystems. A crucial challenge for development of the framework for
environmental statistics is to combine the insights from the various approaches.
o The rest is just analytical variants?
• The statistical system should serve the frameworks in a consistent way – i.e. be
multipurpose
o The same figures should be applicable in all frameworks and recognisable from
framework to framework
o The statistics has just one language- or so it seems – but the selection and
interpretation of data and numbers are highly dependent on what is sometimes
called the “statistical narrative” (Giampietro and Sorman 2009), that is, how the
purpose of the statistical production process is defined, and the choice of
statistical framework is crucial for clarifying this purpose – enhancing the
understanding of the interactions between the economy and the environment in
statistical terms.
o Regardless of choice of conceptual and statistical framework, an important
common denominator is to recognize the need for a disaggregated and
comprehensive information basis for environmental data in physical units, in
order to represent the complex interactions between the economy and the
environment.
And to repeat the bottom line: The environmetal statistics framework is a systematic way of
organising the information flow to obtain relevance, accuracy, accessibility, interpretability,
quality, coherence and consistency and at last but not at least; efficiency in the production of
statistics.
11. References
Alfsen, Bye, Lorentsen (1987): Natural Resource Accounting and analysis, The Norwegian
Experience, 1978-1986, Social and Economic studies no 65, Statistics Norway
http://www.ssb.no/histstat/sos/sos_065.pdf
.Bye, Bye and Lorentsen (1988). SIMEN 2000 - Studies of industry, environment and energy
2000, Statistics Norway 1988
Statistics Canada (2009): A Framework for Developing Environmental Statistics, October 28,
2009
Christensen et al (1996).
Dasgupta, P (2001): Human wellbeing and the natural environment, Oxford University press,
Oxford
17
de Haan, Mark and Peter Kee (xx): Accounting for sutainable development: The NAMEA based
approach, Statistics Netherlands. http://www.cbs.nl/nr/rdonlyres/789fc43c-28ac-4a07-a4e1-
158745589a50/0/accountingforsustainabledevelopmentthenameabasedapproach.pdf
Schenau, Sjoerd (2010): SEEA as a framework for assessing policy responses to climate change.
Paper to the IOAS statistical conference in Santiago, Chile 20-22 october 2010.
Smith, Adam (1776): An inquiry into the Nature and Causes of the wealth of Nations, Edinburgh,
see http://www.Adamsmith.org/smith/won-index.htm
UN et al., 2003. System of integrated environmental and economic accounting 2003, Commission
of the European Communities, International Monetary Fund, Organisation for Economic Co-
operation and Development, United Nations & World Bank (2003). Final draft circulated for
information prior to official editing, United Nations, New York
UN (2007): Indicators of sustainable development: Guidelines and Methodologies; Economic and
social affairs, United Nations
UN (2008): Report on measuring sustainable development. Commonalities between current
practice and theory. United Nations, Economic and Social Council, ECE/CES/2008/29, 9 may
2008