PEER 2002 PEER Annual Meeting PEER 2002 Annual Meeting uHelmut Krawinkler Seismic Demand Analysis.
Framework for Performance-Based Earthquake Engineering
Helmut Krawinkler, Stanford U.
PEER Summative Meeting – June 13, 2007

NSF-PEER Summative Meeting
Where were we 10 years ago?
SEAOC Vision 2000, FEMA 273, ATC-40 Descriptive performance levels (IO, LS, CP, etc.)Associated with specific hazard levels → Performance ObjectivesQualitative (and a few quantitative) damage measuresLimited consideration of uncertaintiesImplementation in terms of FORCES and DEFORMATIONS
Unacceptable Performance
(for New Construction)Basic Objective
Essential/Hazardous Objective
Safety Critical Objective
Fully Operational Operational Life Safe Near Collapse
Frequent
(43 year)
Occasional
(72 year)
Rare
(475 year)
Very Rare
(970 year)
Earthquake Performance Level
Ear
thqu
ake
Des
ign
Lev
el
Unacceptable Performance
(for New Construction)Basic Objective
Essential/Hazardous Objective
Safety Critical Objective
Fully Operational Operational Life Safe Near Collapse
Frequent
(43 year)
Occasional
(72 year)
Rare
(475 year)
Very Rare
(970 year)
Earthquake Performance Level
Unacceptable Performance
(for New Construction)Basic Objective
Essential/Hazardous Objective
Safety Critical Objective
Fully Operational Operational Life Safe Near Collapse
Frequent
(43 year)
Occasional
(72 year)
Rare
(475 year)
Very Rare
(970 year)
Unacceptable Performance
(for New Construction)Basic Objective
Essential/Hazardous Objective
Safety Critical Objective
Fully Operational Operational Life Safe Near Collapse
Unacceptable Performance
(for New Construction)Basic Objective
Essential/Hazardous Objective
Safety Critical Objective
Fully Operational Operational Life Safe Near Collapse
Basic Objective
Essential/Hazardous Objective
Safety Critical Objective
Basic Objective
Essential/Hazardous Objective
Safety Critical Objective
Fully Operational Operational Life Safe Near Collapse
Frequent
(43 year)
Occasional
(72 year)
Rare
(475 year)
Very Rare
(970 year)
Earthquake Performance Level
Ear
thqu
ake
Des
ign
Lev
el

NSF-PEER Summative Meeting
Measures of Performance - PBEE
Forces and deformation?Yes, but only for engineering calculationsIntermediate variables Not for communication with clients and community
Communication in terms of the three D’s:Dollars (direct economic loss)Downtime (loss of operation/occupancy)Death (injuries, fatalities, collapse)
QuantificationLosses for a given shaking intensityLosses for a specific scenario (M & R)Annualized lossesWith or without rigorous consideration of uncertainties
NSF-PEER Summative Meeting
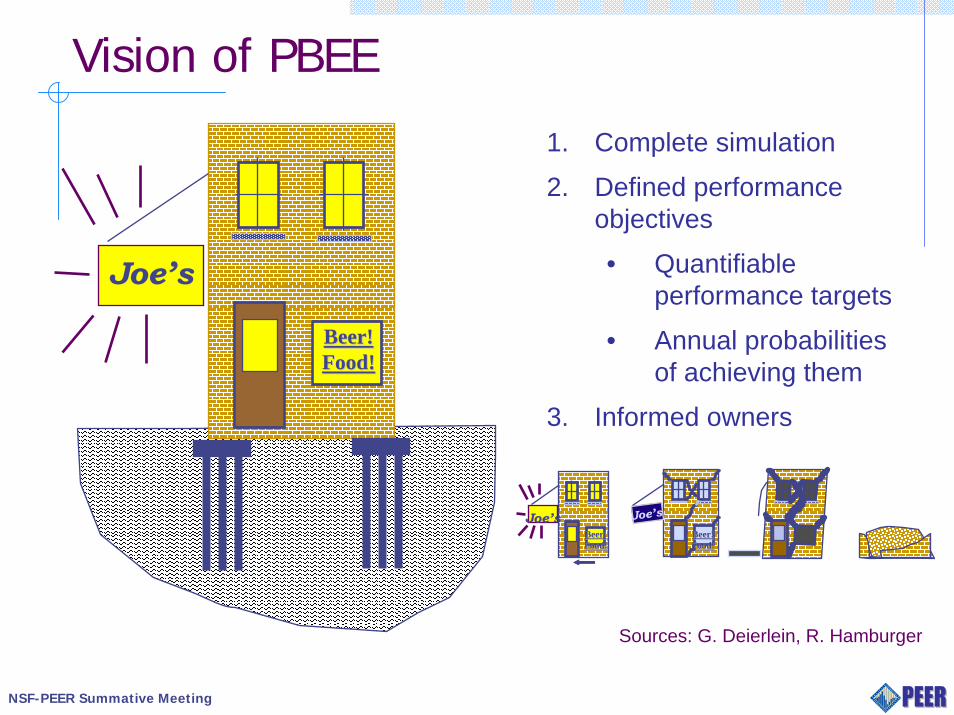
Vision of PBEE
Joe’s
Beer!Beer!Food!Food!
1. Complete simulation
2. Defined performance objectives
• Quantifiable performance targets
• Annual probabilities of achieving them
3. Informed owners
Joe’sBeer!Beer!Food!Food!
Joe’sBeer!Beer!Food!Food!
Sources: G. Deierlein, R. Hamburger

The Peer Framework Equation - 1999
( ) ∫∫∫= )(||| IMdIMEDPdGEDPDMdGDMDVGDVv λ
Performance (Loss) Models and Simulation HazardImpact
BlessingCurse?

NSF-PEER Summative Meeting
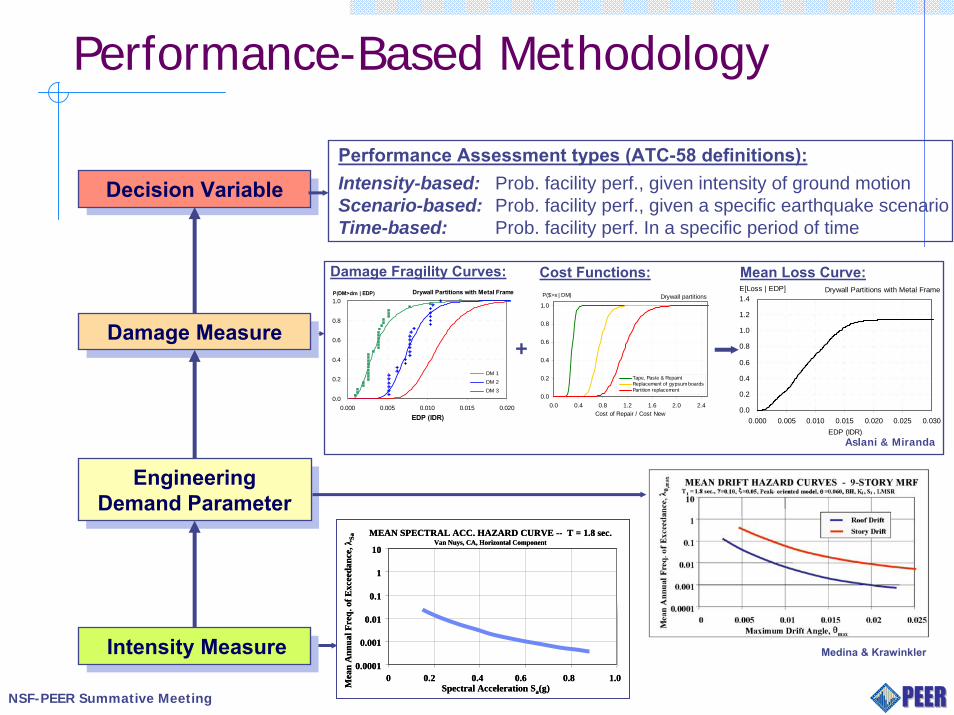
Performance-Based Methodology – Bldgs.
Engineering Demand Parameter
Engineering Demand Parameter
Intensity MeasureIntensity Measure
Damage MeasureDamage Measure
drift as an EDP
Decision VariableDecision Variable• Collapse & Casualties• Direct Financial Loss• Downtime
Measures of Performance

NSF-PEER Summative Meeting
Performance-Based Methodology
Intensity MeasureIntensity Measure0.0001
0.001
0.01
0.1
1
10
0 0.2 0.4 0.6 0.8 1.0Spectral Acceleration Sa(g)M
ean
Ann
ual F
req.
of E
xcee
danc
e, λ
Sa MEAN SPECTRAL ACC. HAZARD CURVE -- T = 1.8 sec.Van Nuys, CA, Horizontal Component
0.0001
0.001
0.01
0.1
1
10
0 0.2 0.4 0.6 0.8 1.0Spectral Acceleration Sa(g)M
ean
Ann
ual F
req.
of E
xcee
danc
e, λ
Sa MEAN SPECTRAL ACC. HAZARD CURVE -- T = 1.8 sec.Van Nuys, CA, Horizontal Component
Engineering Demand Parameter
Engineering Demand Parameter
Medina & Krawinkler
NSF-PEER Summative Meeting
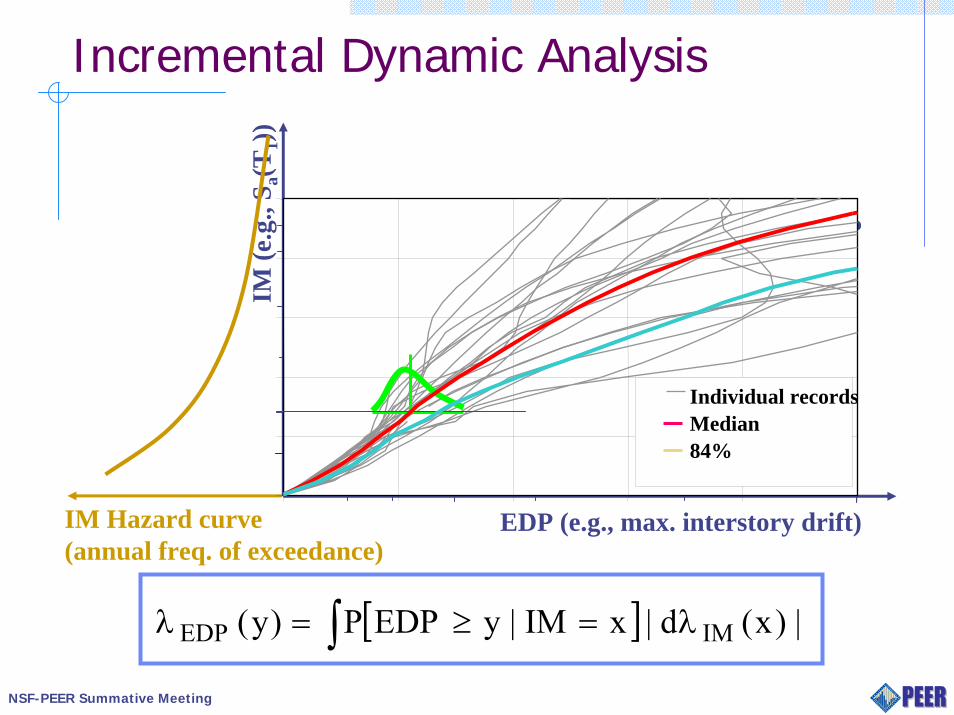
Incremental Dynamic Analysis
EDP (e.g., max. interstory drift)
IM (e
.g.,
S a(T
1))
IM Hazard curve(annual freq. of exceedance)
Individual recordsMedian84%
[ ] |)x(d|xIM|yEDPP)y( IMEDP λ=≥=λ ∫
NSF-PEER Summative Meeting
Performance-Based Methodology
Decision VariableDecision Variable
Engineering Demand Parameter
Engineering Demand Parameter
Intensity MeasureIntensity Measure0.0001
0.001
0.01
0.1
1
10
0 0.2 0.4 0.6 0.8 1.0Spectral Acceleration Sa(g)M
ean
Ann
ual F
req.
of E
xcee
danc
e, λ
Sa MEAN SPECTRAL ACC. HAZARD CURVE -- T = 1.8 sec.Van Nuys, CA, Horizontal Component
0.0001
0.001
0.01
0.1
1
10
0 0.2 0.4 0.6 0.8 1.0Spectral Acceleration Sa(g)M
ean
Ann
ual F
req.
of E
xcee
danc
e, λ
Sa MEAN SPECTRAL ACC. HAZARD CURVE -- T = 1.8 sec.Van Nuys, CA, Horizontal Component
Medina & Krawinkler
Damage MeasureDamage Measure
Drywall Partitions with Metal Frame
0.0
0.2
0.4
0.6
0.8
1.0
0.000 0.005 0.010 0.015 0.020EDP (IDR)
DM 1 DM 2 DM 3
P(DM>dm | EDP)
Damage Fragility Curves:Drywall partitions
0.0
0.2
0.4
0.6
0.8
1.0
0.0 0.4 0.8 1.2 1.6 2.0 2.4Cost of Repair / Cost New
Tape, Paste & RepaintReplacement of gypsum boardsPartition replacement
P($>x | DM)
Cost Functions:
+
Drywall Partitions with Metal Frame
0.0
0.2
0.4
0.6
0.8
1.0
1.2
1.4
0.000 0.005 0.010 0.015 0.020 0.025 0.030EDP (IDR)
E[Loss | EDP]
Mean Loss Curve:
Aslani & Miranda
Performance Assessment types (ATC-58 definitions):Intensity-based:Scenario-based:Time-based:
Prob. facility perf., given intensity of ground motionProb. facility perf., given a specific earthquake scenarioProb. facility perf. In a specific period of time
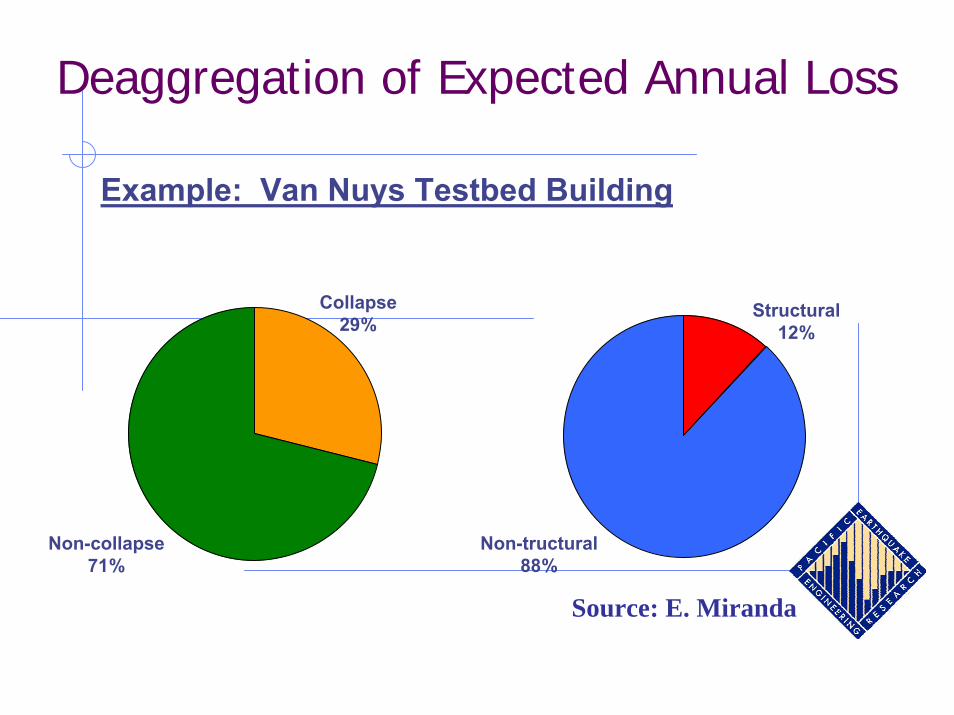
Deaggregation of Expected Annual Loss
Example: Van Nuys Testbed Building
Source: E. Miranda
Collapse29%
Non-collapse71%
Structural12%
Non-tructural88%

NSF-PEER Summative Meeting
Design Decision SupportStructural System Domain
Loss Domain
Hazard Domain
NSDSS NSASS
EDP = Max. Interstory Drift EDP = Max. Floor Acceleration
Mean Subsystem Loss Curves
EDP = Max. Interstory Drift EDP = Max. Floor Acceleration
Mean IM-EDP Curves
Mean Hazard Curve
10/50
Expe
cted
$Lo
ss
Zareian & Krawinkler (2005)
NSF-PEER Summative Meeting
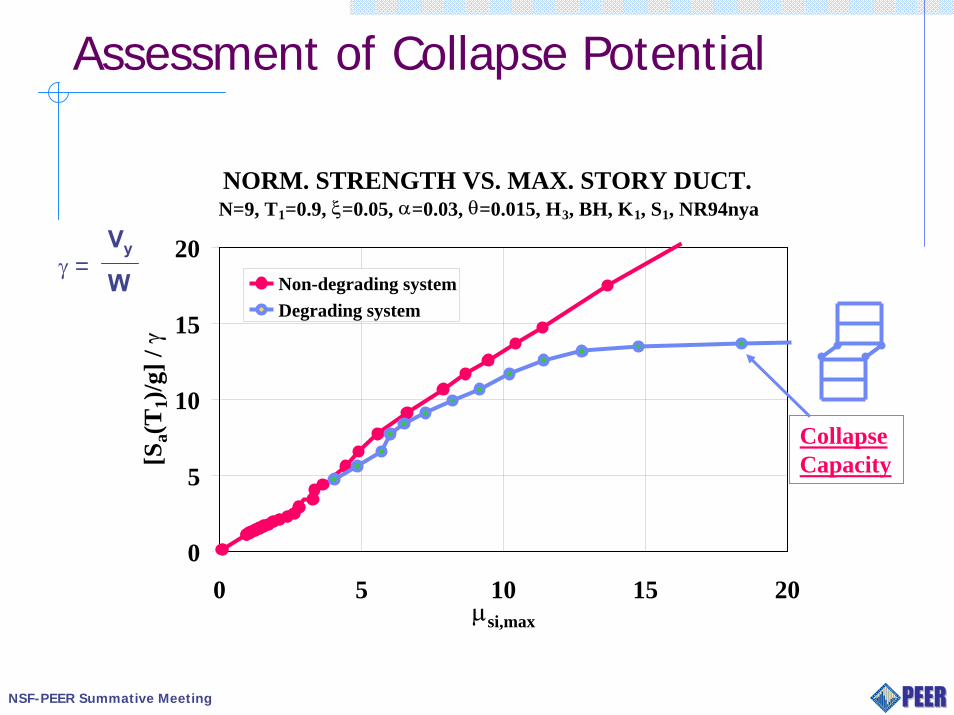
Assessment of Collapse Potential
NORM. STRENGTH VS. MAX. STORY DUCT.N=9, T1=0.9, ξ=0.05, α=0.03, θ=0.015, H3, BH, K1, S1, NR94nya
5
10
15
20
[Sa(
T1)
/g] /
γ
γ = Vy
W Non-degrading systemDegrading system
Collapse Capacity
00 5 10
µsi,max
15 20

NSF-PEER Summative Meeting
Modeling of Deterioration
UCI G12 OSBFy=8.2 kips, δy=0.45 in, αs=0.047, αc=-0.081, αu=1.94, δc/δy=5.44
-10-8-6-4-202468
10
-4 -2 0 2 4Displacement (in)
Load
(kip
s)
UCI G12 OSBPinching Model, κ=0.5, Fy=8.2 kips, δy=0.45 in
αs=0.047, αc=-0.081, αc=1.94, δc/δy=5.44, γs=270, γc=270, γk=∞, γa=270
-10-8-6-4-202468
10
-4 -2 0 2 4Displacement (in)
Load
(kip
s)

NSF-PEER Summative Meeting
Collapse Capacity for a Set of Ground Motions
M AX. STORY DUCTILITY vs. NORM . STRENGTHN=9, T1=0.9, ξ=0.05, K 1, S1, BH, θ=0.015, Peak-Oriented M odel,
α s=0.05, δc/δy=4, α c=-0.10, γs=8 , γc=8 , γk=8 , γa=8 , λ=0, LM SR
0
2
4
6
8
10
0 10 20 30M aximum Story Ductility Over the Height, µs,max
[Sa(
T1)
/g]/ γ
Individual responses

NSF-PEER Summative Meeting
Collapse Fragility Curve
Obtaining the collapse fragility curve (MRF)N = 8, T1 = 1.2, γ = 0.17, Stiff & Str = Shear, SCB = 2.4-2.4, ξ = 0.05
θp = 0.03, θpc/θp = 5, λ = 20, Mc/My = 1.1
0
0.25
0.5
0.75
1
0 0.5 1 1.5 2 2.5 3 3.5 4 4.5IM[Sa(T1)]
Prob
abili
ty o
f Col
laps
e
Data points
Collapse fragility curve
Zareian & Krawinkler (2004)
0.1

NSF-PEER Summative Meeting
Probability of Collapse at MCE, for MRFs with R = 8
P(Collapse) at MCE given R = 8 & Ω = 2.5 (MRF)Siff. & Str. = Shear, SCB = 2.4-1.2, ξ = 0.05, θpc/θp = 15.0, λ = 50, Mc/My = 1.1
0
0.1
0.2
0.3
0.4
0.5
0.6
0.7
0.8
0 0.5 1 1.5 2 2.5 3 3.5First Mode Period (sec.)
P(C
olla
pse)
at M
CE
leve
l
θp = 0.06
θp = 0.03
Design Spectrum:Sa(T1)/g = 0.32 ≤ 0.6/T < 1.0
Zareian & Krawinkler (2007)

NSF-PEER Summative Meeting
Implementation of Framework
ATC-58 – Guidelines for Seismic Performance Assessment of BuildingsATC-63 – Recommended Methodology for Quantification of Building System PerformanceTBI – Tall Building InitiativeLRFD for bridge design

NSF-PEER Summative Meeting
Concluding Remarks - 1999
• Performance based engineering is here to stay
• It enforces a transparent design/assessment approach
• Much more emphasis must be placed on $ losses andloss of function (downtime)•
• Performance based design should be reliability based
• We have a long road ahead of us