Fracture Toughness Assessment of Hydrogen...
30
1 February 2008 M. Dadfarnia, M. Martin, P. Sofronis, I. M. Robertson, D. D. Johnson University of Illinois at Urbana-Champaign In collaboration with B. Somerday Sandia National Laboratories Materials Innovations in an Emerging Hydrogen Economy American Ceramic Society Florida, February 26, 2008 Fracture Toughness Assessment of Hydrogen Pipelines
Transcript of Fracture Toughness Assessment of Hydrogen...
1
February 2008
M. Dadfarnia, M. Martin, P. Sofronis, I. M. Robertson, D. D. JohnsonUniversity of Illinois at Urbana-Champaign
In collaboration withB. Somerday
Sandia National Laboratories
Materials Innovations in an Emerging Hydrogen EconomyAmerican Ceramic SocietyFlorida, February 26, 2008
Fracture Toughness Assessment of Hydrogen Pipelines

2
February 2008
Hydrogen-Induced Crack Propagation
a b c
d e f
0 s 17s 21s
29s 32 s 39s
Static crack in vacuum. Hydrogen gas introduced
thinning thinning
maincrack
maincrack
Micro-crackformed
Crack linkage
No load increase is needed for the crack to grow
We do not understand the relationship between macroscopic parameters(e.g. applied load and pressure) and the operating microscopic
degradation mechanism

3
February 2008
Hydrogen Embrittlement Mechanisms
Several candidate mechanisms have evolved over the years each of which is supported by a set of experimental observations and strong personal views
Viable mechanisms of embrittlementStress induced hydride formation and cleavage
Metals with stable hydrides (Group Vb metals, Ti, Mg, Zr and their alloys)Supported by experimental observations
Hydrogen enhanced localized plasticity (HELP)Increased dislocation mobility, failure by plastic deformation mechanismsSupported by experimental observations
Hydrogen induced decohesionDirect evidence is lackingSupported by First Principles Calculations (DFT)
Degradation is often due to the synergistic action of mechanisms

4
February 2008
Embrittlement and Phenomenology
Fractographic evidence suggests that low strength steels under static loading fail by
Hydrogen-assisted transgranular fracture induced by void or microcrack initiation through decohesion at internal interface (precipitate/inclusion or phase boundaries) ahead of a crack or notch accompanied by shear localization (HELP) leading to the linking of the void/microcrack with the tip of the crackFracture is controlled by yield strength level and microstructure
Our contention, which needs to be verified through experiment, is that embrittlement
Under static load is a result of the synergistic action of the HELP and decohesion mechanismsUnder cyclic load can be intergranular (extremely dangerous mode of failure)

5
February 2008
Fracture Mechanics Approach to Design of Steel Pipelines Transporting Hydrogen
H2 gas
Hydrogen diffusion
H2 gas
Objective: Determine stress,deformation, and hydrogen concentration fields in the neighborhood of an axial crack in a steel pipeline
H2-Pressure of 15MPa
To characterize embrittlement we need to understandthe interaction of hydrogen with the elastoplasticdeformation of the material at a crack tip

6
February 2008
Fracture Mechanics Approach to Design of PipelinesActual-Pipeline Solution vs Laboratory-Specimen Solution
Is there a similarity between the full-field
(pipeline) solution and that at laboratory
specimens?
H2 gas
Subcritical crack growth experiments with
WOL specimen carried out at Sandia
If yes, we conjecture that parameters which characterize fracture in the laboratory specimencan be used to characterize fracture in the pipeline
Tranferrability
2IKr
σπ
=r
Crack tip σ
If characterizes fracture in the specimen,can it be used to characterize fracture inthe pipeline in the presence of hydrogen?
IK

7
February 2008
Diffusing hydrogen resides atNormal Interstitial Lattice Sites (NILS)Trapping Sites
Microstructural heterogeneities such as dislocations, grain boundaries, inclusions, voids, interfaces, impurity atom clusters
Diffusing hydrogen interacts with stresses and strainsHydrogen dilates the lattice and thus interacts with hydrostatic stress
Moves from regions under compression toward regions under tension, e.gahead of a crack tip
Hydrogen enhances dislocation mobility, thus it facilitates plastic flow
As hydrogen diffuses stresses and strains change. At the same time local stresses and strains affect the diffusion paths. So the problem is coupled
Hydrogen Transport Analysis
dislocations inclusions
Grain boundaries
TC
LC
Crack tip0σ >

8
February 2008
Cracked Pipeline: Problem Statement
( ) 0LC t =
( )LC t K f= ×
0 100-200 200-100
( ) 0LC t =
( )LC t f∝
( ) 0J t =
( ) 0LC t =
( )LC t f∝
( ) 0J t =
Hydrogen gas at pressure P
15 MPaHydrogen
gas
Hydrogen transport
15 MPa
time 1 sec
2.0 hrs
P
t
dimensions are in mm
outer diameter:thickness:
crack depth:initial CTOD:
40.64 cmh = 9.52 mma = 1.9 mmb0= 1.5 μma / h = 0.2
K : SolubilityJ : Hydrogen fluxP : Pressuref : Fugacity
9
February 2008
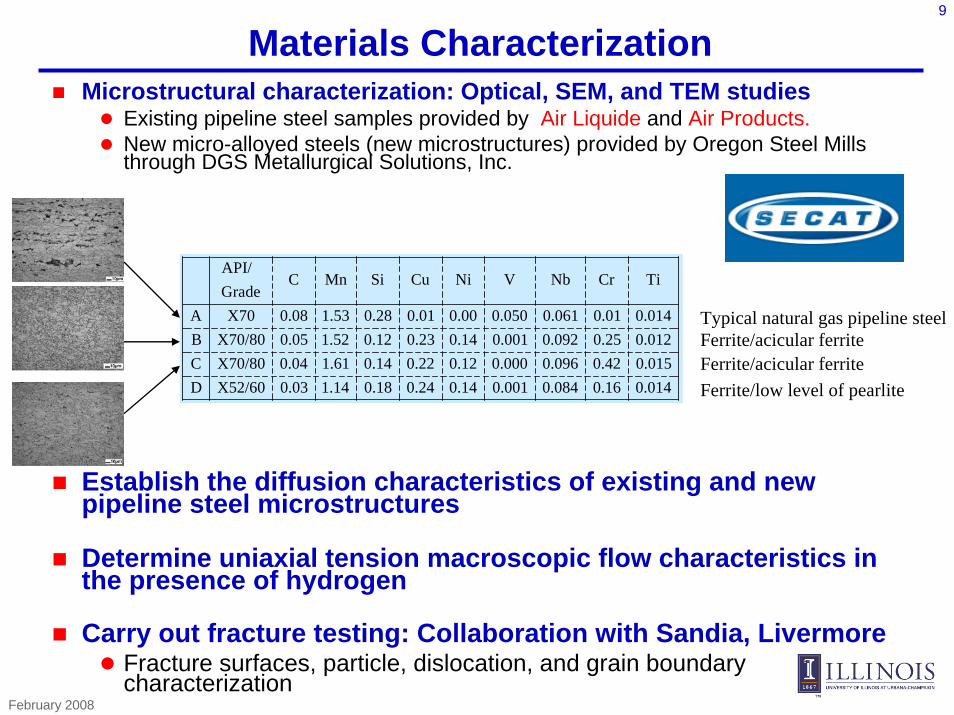
Materials CharacterizationMicrostructural characterization: Optical, SEM, and TEM studies
Existing pipeline steel samples provided by Air Liquide and Air Products.New micro-alloyed steels (new microstructures) provided by Oregon Steel Mills through DGS Metallurgical Solutions, Inc.
Establish the diffusion characteristics of existing and new pipeline steel microstructures
Determine uniaxial tension macroscopic flow characteristics in the presence of hydrogen
Carry out fracture testing: Collaboration with Sandia, LivermoreFracture surfaces, particle, dislocation, and grain boundary characterization
API/C Mn Si Cu Ni V Nb Cr Ti
GradeA X70 0.08 1.53 0.28 0.01 0.00 0.050 0.061 0.01 0.014B X70/80 0.05 1.52 0.12 0.23 0.14 0.001 0.092 0.25 0.012C X70/80 0.04 1.61 0.14 0.22 0.12 0.000 0.096 0.42 0.015D X52/60 0.03 1.14 0.18 0.24 0.14 0.001 0.084 0.16 0.014
Typical natural gas pipeline steel
Ferrite/acicular ferriteFerrite/acicular ferrite
Ferrite/low level of pearlite

10
February 2008
Optical Analysis of New “Steel C” Microstructure
Average grain size :35 μm
3% pearlite
Demonstrated to be good in the presence of H2S sour service natural gasapplications
API Grade C Mn Si Cu Ni V Nb Cr Ti
X70/80 0.04 1.61 0.14 0.22 0.12 0.000 0.096 0.42 0.015
Ferrite/acicular ferrite
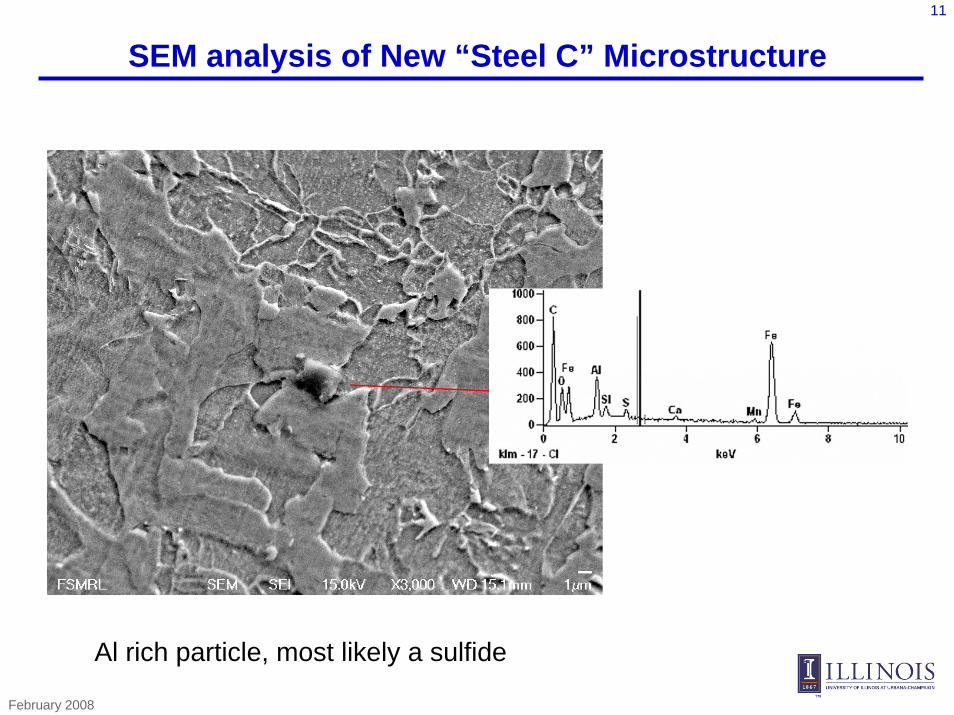
11
February 2008
SEM analysis of New “Steel C” Microstructure
Al rich particle, most likely a sulfide

12
February 2008
TEM analysis of New “Steel C” Microstructure
a) EDS spectrum from particleb) Bright field TEM image of typical rectangular particlec) EDS spectrum from matrix
EDS analysis of fine precipitate inside ferrite grain suggests that precipitate is composed of Ti and Nb
(window detector: C, N, O not detected)
13
February 2008
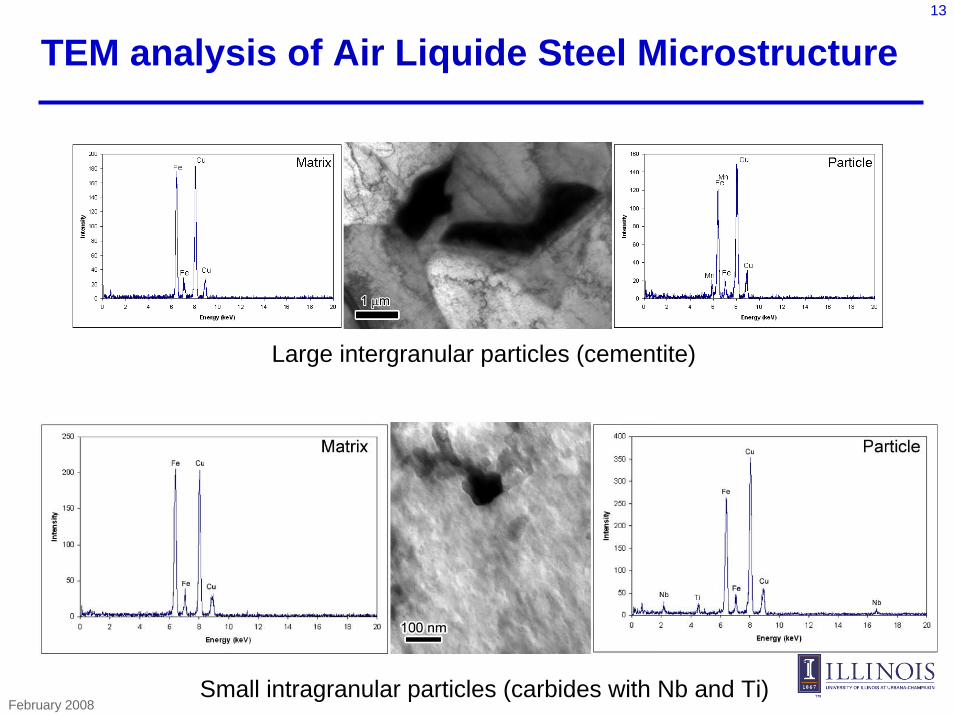
TEM analysis of Air Liquide Steel Microstructure
Large intergranular particles (cementite)
Small intragranular particles (carbides with Nb and Ti)

14
February 2008
TEM analysis of Air Products Steel Microstructure
Pearlite colonies.
Left: cementite plate arrangement
Right: cross-section of platelets

15
February 2008
0.00E+00
2.00E+14
4.00E+14
6.00E+14
8.00E+14
1.00E+15
1.20E+15
0 200 400 600 800 1000 1200
time (s)
flux
(ato
ms/
m^2
s)
0.00E+00
2.00E+14
4.00E+14
6.00E+14
8.00E+14
1.00E+15
1.20E+15
0 5 10 15 20 25 30 35 40
time (s)
flux
(ato
ms/
m^2
s)
0.0E+00
5.0E+17
1.0E+18
1.5E+18
2.0E+18
0 20 40 60 80 100 120 140
time (s)
Inte
gral
of f
lux
(ato
ms/
m^2
)
0.00E+00
5.00E+10
1.00E+11
1.50E+11
2.00E+11
2.50E+11
3.00E+11
3.50E+11
4.00E+11
4.50E+11
0 10 20 30 40 50 60 70
Sqrt Pressure Pa^1/2
Stea
dy S
tate
flux
* th
ickn
ess
(ato
ms/
m s
)
•Oregon Steel Mills sample: thickness •room temperature
Ultrahigh vacuum (10-9 torr)Hydrogen pressure (10 torr)
Hydrogen Permeation Measurements
2
6Teff
LtD
=6.8sTt =
Steady state:
12 H atoms6.26 10MPa.m.s
Φ = ×
4.7torr 627PaP = =
J
J L∞
120micronsL =
Jdt∫
Time lag
Permeabilityat room temperature
J∞
0.0E+00
5.0E+16
1.0E+17
1.5E+17
2.0E+17
2.5E+17
3.0E+17
0 5 10 15 20 25 30
time (s)
Inte
gral
of f
lux
(ato
ms/
m^2
)

16
February 2008
Material: X70/80 acicular ferrite microstructure
Dislocation trapping modeling
0 . 0 0 . 2 0 . 4 0 . 6 0 . 8 1 . 0 1 . 2 1 . 4 1 . 6
2 0
2 1
2 2
2 3
2 4
E x p e r i m e n t a l r e s u l t s [ 8 1 ]
Lo
g(N T)
ε p
pε 0 0 .2 0 .4 0 .6 0 .8 1 .0 1 .2 1 .4 1 .6
24 23 22 21 20
( )TLog N 60.0 KJ/molBW =2
TNaρ
=
0 0.150 15
const. 0.15.
p p
p
γρ ε ερ
ε
⎧ + ≤⎪= ⎨⎪ >⎩
10 2 16 20 10 10,m mρ γ− −= =
20.2 KJ/molBW =
Kumnick and Johnsontrapping model
Stress-strain
Plastic Strain
Stre
ss(M
Pa)
0 0.1 0.2 0.30
200
400
600
800
00
1np
Yεσ σε
⎛ ⎞= +⎜ ⎟
⎝ ⎠
0 595 MPaσ =
0.059n =
pε
, pσ ε
Experiment Model
8 21.271 10 m /sD −= ×Lattice diffusion coefficient
22 30 2.65932 10 H atom / mC = ×
183
H atoms6.54696 10m Pa
K = ×
21 30 2.084 10 H atom / mC = ×
15 MPa P =
1 atm P =
C K f= exp P df PRT
⎛ ⎞= ⎜ ⎟⎝ ⎠
3= 15.84 cm /mold

17
February 2008
Lattice Hydrogen Concentration at Steady State
-202 -200 -198 -196 -1940
2
4
6
8
2.52.42.32.22.121.91.81.71.61.51.41.31.21.110.90.80.70.60.50.40.30.20.1
0
LCC
195 200 2050
5
10
15
20
25
30
10.90.80.70.60.50.40.30.20.1
0
LCC
Kumnick and Johnson trapping model
22 30 2.65932 10 H atom / mC = × 15 MPa P =
Time to steady-state: 2.0 hrs68secsst =

18
February 2008
Evolution of Hydrogen Concentration at NILS
1.17 μmb =
0 2 4 6 8 10 12 14 16 18 200
0.5
1
1.5
2
2.5
1.0sec
0.25sec
0.5sec0.75sec
25sec10sec
0.1sec
3sec
R / b
68sec
at steady state (2hrs) R
b
Rb
0
LCC
68 secsst

19
February 2008
Trapped Hydrogen Concentration at Steady State
-202 -200 -198 -196 -1940
2
4
6
8
6.56.2565.755.55.2554.754.54.2543.753.53.2532.752.52.2521.751.51.2510.750.50.25
0
TCC
195 200 2050
5
10
15
20
25
30
0.10.090.080.070.060.050.040.030.020.01
0
TCC
Kumnick and Johnson trapping model
22 30 2.65932 10 H atom / mC = × 15 MPa P =

20
February 2008
Fracture Mechanics ParametersFrom the Full Pipeline to the Laboratory Specimen
0 0.1 0.2 0.3 0.4
0
20
40
60
80
-0.35
-0.33
-0.31
-0.29
-0.27
-0.25
KI
T/σ0
IK0
Tσ
ah
Crack depth/pipe thickness
h
a H2 pressure15 MPa
Tr
/ 2IK rσ π=

21
February 2008
Full Field (pipeline) vs Boundary Layer Solution (laboratory specimen)
0 2 4 6 8 101.5
2
2.5
3 Rb
y
Modified Boundary Layer solution
Elastoplastic full-field solution at 15 MPaP =0
14.38 MPa m/ -0.292IK
T σ=
=
Modified Boundary Layer solution0
14.38 MPa m/ 0IK
T σ=
=
0T =0
yyσσ
/ 0.05a h =R
b 1.17 μmb =
Neglecting the T -stress in the MBL formulationfails to predict the true stress

22
February 2008
Crack-Tip Fields Scale with KI and T-stressIndependence from Crack Depth
R / b0 2 4 6 8 101
1.5
2
2.5
3
0
0.5
1
1.5
2
2.5
CL / C0
σkk / 3σ0
Crack depth a = 0.476 mm
Crack depth a = 1.9 mm
b03
kkσσ
0
LCC
h
a
T
0
34.12 MPa m/ 0.316IK
T σ== −
/ 0.2a h =
0
14.38MPa m/ 0.292IK
T σ== −
/ 0.05a h =
Rb
2IK Rσ π=
1.17 μmb =
7.13 μmb =
ConstraintFracture Mechanics

23
February 2008
0 1 2 3 4 50
0.5
1
1.5
2
2.5
ξ = 1, No softening
ζ
ξ = 0.955, Softening
Tr = σkk / σYTr
h
a
no hydrogen
ς
a / h = 0.05
0
H
H
ςς
ς=
=
b R
with hydrogen
Hydrogen Accelerates Void Growth
Rb
( )0
0
( ) ln exp /p
p pvv kk Y
R a dR
ες ε σ σ ε
⎛ ⎞= =⎜ ⎟
⎝ ⎠∫
Void growth parameter
triaxialitykk
Y
Tr σσ
= =

24
February 2008
WOL Specimen for Subcritical Crack GrowthFinite Element Mesh
W
a
2mV
0V
Crack tip
H
1.090 2.240 2.745H W B′′ ′′ ′′= = =
B
Applied displacement
: Crack mouth opening displacementmV

25
February 2008
WOL Specimen (X-100) loaded to KI=158 MPa√m
Pl. strain0.10.090.080.070.060.050.040.030.020.010
Plastic zone
W
a
2H
/ 0.5608a W =
2.180 2.240H W′′ ′′= =
2mV
1.204mmmV =0V
Plasticity is confined to the crack tip under K-dominance

26
February 2008
Crack Arrest in WOL Specimen : KI - dominance
FEM/ 0.9408a W =1.204mmmV =
63.8 MPa mIK =
57.5 MPa mIK =ASTM
FEM (Plastic)
16008 N/mJ =
62.2 MPa mIK =
21IJ EKν
=−
KI dominance when crack stops

27
February 2008
Long Term Objective: Multiscale Fracture Approach
3u
33Σ maxσ
Γ Dissipated energy
(c) Traction - separation law(b) Axisymmetricunit cell model(a) Crack tip
fracture process zone
TriaxialityHydrogen concentration
(e) Cohesive elements characterized bya traction-separation law based on the unit cell model
1 11,u Σ
3 33,u Σ
at time=0initialLc
(d) Cohesive element
Adjacent finite element
, LT c
Δa/D0
J/(σ
0D0)
0 2 4 6 8 100
2
4
6
8
10
12
With hydrogen softening in(1) cohesive zone and matrix(2) cohesive zone only
No hydrogen
28
February 2008
Conclusions and Future WorkAttempted to characterize the hydrogen concentration and stress fields in a pipeline in terms of KI and T-stress (J-T fracture locus - constraint fracture mechanics)
Model depends on assumptions (e.g. trapping according to Kumnick and Johnson model, reversible traps, etc) that need to be explored through microstructural characterization and permeation measurementsSelf similarity and no explicit dependence on crack depthTransferability of results from laboratory specimensIf void growth is the mechanism of failure, hydrogen enhances void growth through softening-induced straining
Developed cohesive element technology to simulate decohesion- or ductile-driven processes for crack propagation
Simulated J-R curve
29
February 2008
Coupling fracture mechanisms and microstructuralanalysis with hydrogen transport, thermodynamics of decohesion, and plastic flow localization to understand
Interaction of time scales (loading rate, diffusion rate, adsorption rateCrack initiationCrack propagationDevise fracture criteria with predicting capabilities
Possibly a JIC-T locus
Fracture mechanics/mechanism-based approach to design
As opposed to the SMYS approach
Conclusions and Future Work
30
February 2008
We have years of experience and extensive knowledge of all aspects of hydrogen embrittlement. We have a tremendous collection of analysis tools. We can tame the problem
Where We Go From Here
Support by theU.S. Department of Energy is
Gratefully Acknowledged