Fracture risk assessment Norwich, John A Kanis SCOOP Launch, November 07.
26
Fracture risk assessment Norwich, John A Kanis SCOOP Launch, November 07
-
Upload
marjory-brooks -
Category
Documents
-
view
214 -
download
0
Transcript of Fracture risk assessment Norwich, John A Kanis SCOOP Launch, November 07.

Fracture risk assessment
Norwich, John A Kanis
SCOOP Launch, November 07

03ca011
Common sites of fracture
Spine
Hip
Wrist
Definition
a systemic skeletal diseasecharacterised by low bone mass
and microarchitecturaldeterioration of bone tissue,with a consequent increase
in bone fragility andsusceptibility to
fracture
Consensus Development Conference, 1993
03 Osteoporosis

-4 -3 -2 -1 0 1 2 3 4
Bone mineral density (SD units or T-score)
Osteoporosis Low bone Normal
0.6 15 50 85 >99
Percent of population
mass
Diagnostic thresholds for women99ca160 ex94ca117 from 91ca129

- Presence of strong risk factors
oestrogen deficiency
corticosteroid therapy (>7.5 mg >1 year)
maternal history of hip fracture
low BMI (<19 kg/m )
- Radiographic osteopenia
- Previous fragility fracture
- Height loss/ thoracic kyphosis (after radiography)
Indications for the diagnostic use of BMD
99ca021

04ca226Case finding strategies
CRFs
BMD
T-score< -2.5
Treat
Age >65y?
yes
CRFs
yes no
BMDBMD
T-score < -1.5
Treat
T-score < -2.0
Treat
IOF NOF

05ca085
Osteoporotic fracture and BMD
Fractures/1,000 person-years Number of fractures
1.0 0.5 0.0 -0.5 -1.0 -1.5 -2.0 -2.5 -3.0 -3.5
Fracture rate
Women with fractures
0
10
20
30
40
50
0
100
200
300
400
Siris. Surgeon General’s Workshop on Osteoporosis and Bone Health, December 2002

T-score (SD)
-3 -2 -1 0 10
10
20
Fracture probability (%)
50
60
70
80
Age (years) Women
Ten year probability of hip fracture in Sweden
00ca104
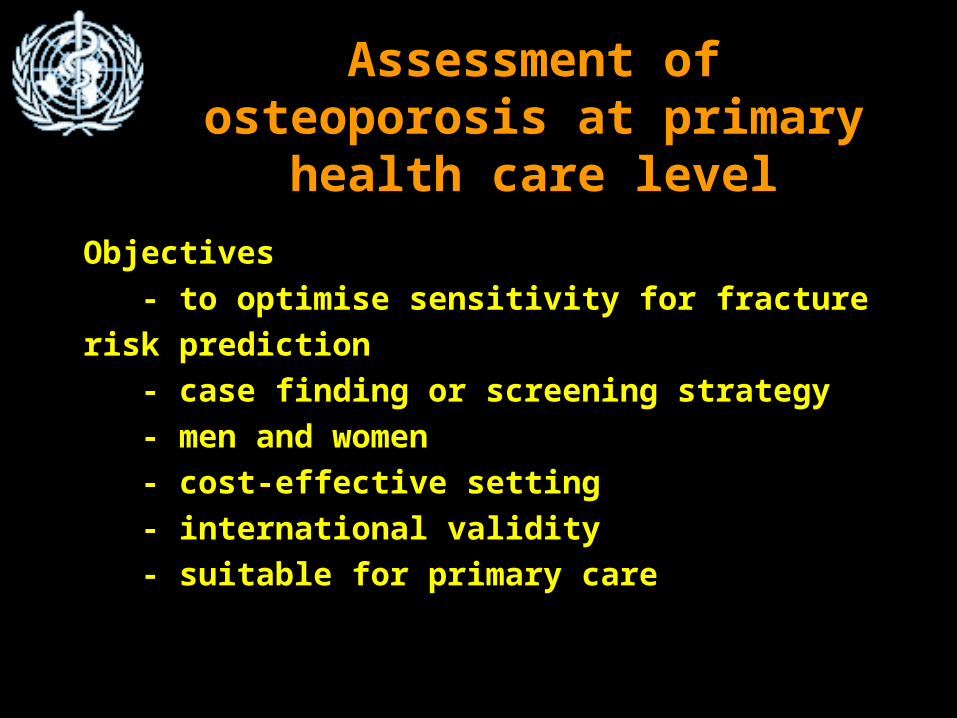
04ca148rev Assessment of osteoporosis at primary health care level
Objectives
- to optimise sensitivity for fracture risk
prediction
- case finding or screening strategy
- men and women
- cost-effective setting
- international validity
- suitable for primary care

• Validated in multiple populations
• Data for age, sex and type of fracture
• Readily assessable by primary care practitioners
• Be intuitive rather than counterintuitive to medical
care.
• Contribute to a risk that is amenable to the therapeutic
manipulation intended
Risk factors03ca175

04ca130Cohorts studied
CaMoS
Rotterdam
EVOS / EPOS
Rochester
Kuopio
Hiroshima
Sheffield
Gothenburg I Gothenberg II
DubboEPIDOS OFELY
n = 59,232 person-years = 249,898 % female = 74
Any fracture = 5,444 osteoporotic fractures = 3,495 hip fractures = 957

04ca138
0
1
2
3
4
5
50 55 60 65 70 75 80 85
Age (years)
Men and women
RR/SD
Femoral neck BMD and hip fracture prediction

05ca186 Prior fracture and hip fracture risk
0
2
4
6
50 55 60 65 70 75 80 85
Age (years)
RR

07ca080 BMI and fracture risk
0.0
1.0
2.0
3.0
Osteoporotic fracture Hip fracture
RR (20 v 25 kg/m2)
Without BMD
With BMD

04ca248 Risk factors for hip fracture in men and women
0.0
1.0
2.0
3.0
RR
Without BMD With BMD
Priorfracture
FH(hip)
Smokingcurrent
Alcohol>2u
Steroidsever
RA

10-year probability of hip fracture in Malmo
99ca094
0
5
10
15
20
Age (years)
Probability (%)
women
50 60 70 80 90
men

Age (years)50 55 60 65 70 75 80 85
0
10
20
30
40
50
60
70
10 year risk (%)
1.02.0
3.04.0
5.06.0
RR
Ten year probability of hip fracture - Swedish women
01ca048

06ca106 FRAX
Patient
65
65
165
-2.5
23.9
8.0
24

04ca014 Clinical risk factors and fracture probability
0
2
4
6
NoneSm
oking
Alcohol
2 o osteoporosis
FH Steroids
Prior Fx
10 year hip fracture probability (%)
Mrs X
Age = 65 y
Height =161cm
Weight = 61kg
BMI = 23.5 kg/m2

05ca106
0
10
20
30
40
50
60
70
0 -1 -2 -3
T-score
0 -1 -2 -3
NonePrior fracture+Glucocorticoids+Family history
Men Women
US Caucasian, no CRF, BMI=24 *Hip, spine, humerus, forearm
Probability of osteoporotic fracture* at age 65
10-year probability (%)

05ca092Case finding strategies
CRFs
Fractureprobability
High
Treat
Intermediate Low
BMD
Reassessprobability
High Low
Treat

05ca200Stratification of hip fracture
risk
No
NoNo
Woman aged 65, BMI=24
Yes
YesYes
YesNoYesNo Yes NoYesNo
3.7 12.93.1 5.46.42.67.51.5
Rheumatoid arthritis
Glucocorticoids
Prior fracture
10-year hip fractureprobability (%)

07ca027Gradient of risk for hip fracture prediction
1
2
3
4
5
6
RR/SD
50 60 70 80 90 50 60 70 80 90 50 60 70 80 90
Age (years)
CRFs BMD CRFs+BMD

07ca030 Gradient of risk and fracture prediction
0
2
4
6
8
10
-4 -3 -2 -1 0 1 2 3 4
Risk ratio (vs. general population)
GR=2.6
GR=1.6
Z-score
% 50.0100.0 97.799.9 84.1 15.9 2.3 0.1 0.0
4.93.5Mean RR
5.00.5% Population
1.632.57Z-score
2.61.6GR
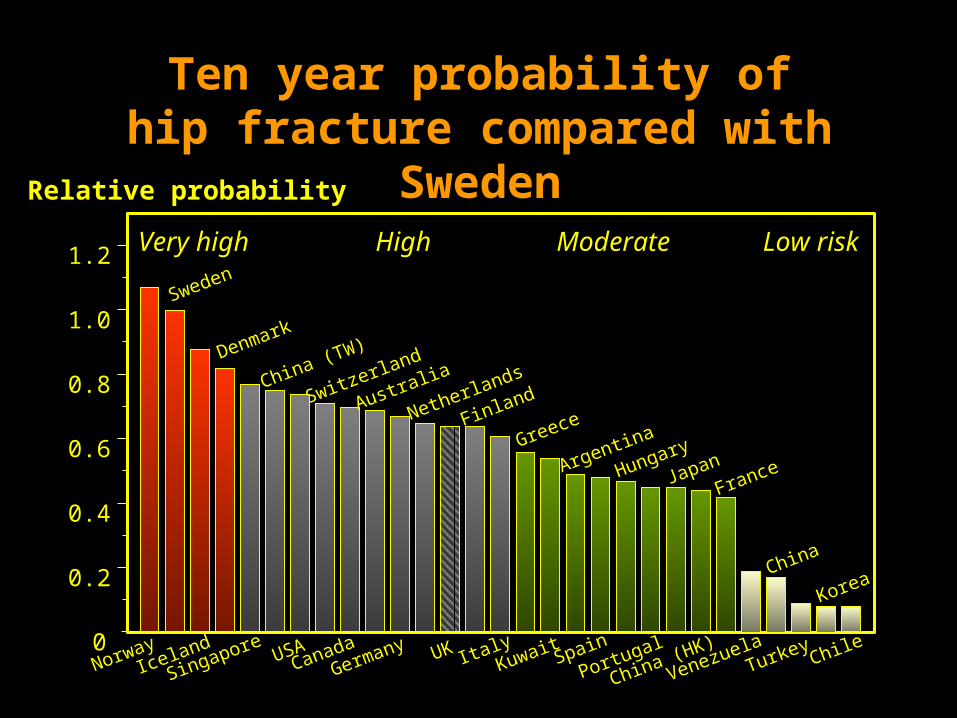
NorwayIceland
Singapore USACanada
Germany UK ItalyKuwait Spain
Portugal
China (HK)
VenezuelaTurkey Chile0
0.2
0.4
0.6
0.8
1.0
1.2
Relative probability
Sweden
Denmark
China (TW)
Switzerland
Australia
Netherlands
Finland
Greece
Argentina
Hungary
JapanFrance
China
Korea
Very high High Moderate Low risk
Ten year probability of hip fracture compared with Sweden
01ca025

00ca008
End

04ca191Identification of reversible risk
a. Risk amenable to intervention
Low BMD
Previous fracture
Use of glucocorticoids
b. Presence of risk factor does adversely affect therapeutic response
Age
Body mass index
Family history of fracture
Smoking and alcohol
Markers of bone turnover
c. Uncertain effects
Neuromuscular incompetence
Liability to falling