Fracture-induced softening for large-scale ice dynamics
19
The Cryosphere, 8, 587–605, 2014 www.the-cryosphere.net/8/587/2014/ doi:10.5194/tc-8-587-2014 © Author(s) 2014. CC Attribution 3.0 License. The Cryosphere Open Access Fracture-induced softening for large-scale ice dynamics T. Albrecht 1,2 and A. Levermann 1,2 1 Earth System Analysis, Potsdam Institute for Climate Impact Research, Potsdam, Germany 2 Institute of Physics and Astronomy, University of Potsdam, Potsdam, Germany Correspondence to: T. Albrecht ([email protected]) Received: 20 August 2013 – Published in The Cryosphere Discuss.: 9 September 2013 Revised: 31 January 2014 – Accepted: 26 February 2014 – Published: 8 April 2014 Abstract. Floating ice shelves can exert a retentive and hence stabilizing force onto the inland ice sheet of Antarctica. How- ever, this effect has been observed to diminish by the dy- namic effects of fracture processes within the protective ice shelves, leading to accelerated ice flow and hence to a sea- level contribution. In order to account for the macroscopic ef- fect of fracture processes on large-scale viscous ice dynamics (i.e., ice-shelf scale) we apply a continuum representation of fractures and related fracture growth into the prognostic Par- allel Ice Sheet Model (PISM) and compare the results to ob- servations. To this end we introduce a higher order accuracy advection scheme for the transport of the two-dimensional fracture density across the regular computational grid. Dy- namic coupling of fractures and ice flow is attained by a reduction of effective ice viscosity proportional to the in- ferred fracture density. This formulation implies the possi- bility of non-linear threshold behavior due to self-amplified fracturing in shear regions triggered by small variations in the fracture-initiation threshold. As a result of prognostic flow simulations, sharp across-flow velocity gradients appear in fracture-weakened regions. These modeled gradients com- pare well in magnitude and location with those in observed flow patterns. This model framework is in principle expand- able to grounded ice streams and provides simple means of investigating climate-induced effects on fracturing (e.g., hy- dro fracturing) and hence on the ice flow. It further consti- tutes a physically sound basis for an enhanced fracture-based calving parameterization. 1 Introduction The contemporarily observed sea-level change (Cazenave and Llovel, 2010; Church et al., 2011; Gregory et al., 2012) as well as the expected long-term sea-level commitment (Levermann et al., 2013) underpin the role of the contribu- tions of the large polar ice sheets of Greenland and Antarc- tica (Van den Broeke et al., 2011; Rignot et al., 2011b; Shep- herd et al., 2012; Hanna et al., 2013). Reliable and accu- rate process-based models are required to understand the in- volved complex processes and to provide confident projec- tions of future sea-level rise (Bamber and Aspinall, 2013). Certain aspects of ice flow need a better representation in these models to account for the potential destabilization of key regions, such as the West Antarctic ice sheet (Bamber et al., 2009; Joughin and Alley, 2011). The retentive force of floating ice shelves that retains the oceanward ice flow (Dupont and Alley, 2005; Winkelmann et al., 2012; Gud- mundsson, 2013) is of high relevance in this assessment. Most models neglect the feedback of fractures, which can repeal this buttressing effect of ice shelves (Borstad et al., 2013). Fracture processes play a fundamental role in the dynam- ics of ice streams and ice shelves, in addition to ocean melt (Pritchard et al. 2012; Rignot et al., 2013), but also in in- teraction with external drivers, such as surface melt induced by atmospheric warming (MacAyeal and Sergienko, 2013). Fractures are mostly found as elongated structures of frag- ments or sequences of troughs and open crevasses, visible at the ice surface. These fracture bands are aligned along the ice flow with origin in the wake of topographic features such as ice rises, ice rumples or along ice stream inlets and usu- ally extend the whole distance towards the calving front. On that journey along the stream, prevailing stresses can change Published by Copernicus Publications on behalf of the European Geosciences Union.
Transcript of Fracture-induced softening for large-scale ice dynamics

The Cryosphere, 8, 587–605, 2014www.the-cryosphere.net/8/587/2014/doi:10.5194/tc-8-587-2014© Author(s) 2014. CC Attribution 3.0 License.
The Cryosphere
Open A
ccess
Fracture-induced softening for large-scale ice dynamics
T. Albrecht 1,2 and A. Levermann1,2
1Earth System Analysis, Potsdam Institute for Climate Impact Research, Potsdam, Germany2Institute of Physics and Astronomy, University of Potsdam, Potsdam, Germany
Correspondence to:T. Albrecht ([email protected])
Received: 20 August 2013 – Published in The Cryosphere Discuss.: 9 September 2013Revised: 31 January 2014 – Accepted: 26 February 2014 – Published: 8 April 2014
Abstract. Floating ice shelves can exert a retentive and hencestabilizing force onto the inland ice sheet of Antarctica. How-ever, this effect has been observed to diminish by the dy-namic effects of fracture processes within the protective iceshelves, leading to accelerated ice flow and hence to a sea-level contribution. In order to account for the macroscopic ef-fect of fracture processes on large-scale viscous ice dynamics(i.e., ice-shelf scale) we apply a continuum representation offractures and related fracture growth into the prognostic Par-allel Ice Sheet Model (PISM) and compare the results to ob-servations. To this end we introduce a higher order accuracyadvection scheme for the transport of the two-dimensionalfracture density across the regular computational grid. Dy-namic coupling of fractures and ice flow is attained by areduction of effective ice viscosity proportional to the in-ferred fracture density. This formulation implies the possi-bility of non-linear threshold behavior due to self-amplifiedfracturing in shear regions triggered by small variations in thefracture-initiation threshold. As a result of prognostic flowsimulations, sharp across-flow velocity gradients appear infracture-weakened regions. These modeled gradients com-pare well in magnitude and location with those in observedflow patterns. This model framework is in principle expand-able to grounded ice streams and provides simple means ofinvestigating climate-induced effects on fracturing (e.g., hy-dro fracturing) and hence on the ice flow. It further consti-tutes a physically sound basis for an enhanced fracture-basedcalving parameterization.
1 Introduction
The contemporarily observed sea-level change (Cazenaveand Llovel, 2010; Church et al., 2011; Gregory et al., 2012)as well as the expected long-term sea-level commitment(Levermann et al., 2013) underpin the role of the contribu-tions of the large polar ice sheets of Greenland and Antarc-tica (Van den Broeke et al., 2011; Rignot et al., 2011b; Shep-herd et al., 2012; Hanna et al., 2013). Reliable and accu-rate process-based models are required to understand the in-volved complex processes and to provide confident projec-tions of future sea-level rise (Bamber and Aspinall, 2013).Certain aspects of ice flow need a better representation inthese models to account for the potential destabilization ofkey regions, such as the West Antarctic ice sheet (Bamberet al., 2009; Joughin and Alley, 2011). The retentive forceof floating ice shelves that retains the oceanward ice flow(Dupont and Alley, 2005; Winkelmann et al., 2012; Gud-mundsson, 2013) is of high relevance in this assessment.Most models neglect the feedback of fractures, which canrepeal this buttressing effect of ice shelves (Borstad et al.,2013).
Fracture processes play a fundamental role in the dynam-ics of ice streams and ice shelves, in addition to ocean melt(Pritchard et al. 2012; Rignot et al., 2013), but also in in-teraction with external drivers, such as surface melt inducedby atmospheric warming (MacAyeal and Sergienko, 2013).Fractures are mostly found as elongated structures of frag-ments or sequences of troughs and open crevasses, visible atthe ice surface. These fracture bands are aligned along theice flow with origin in the wake of topographic features suchas ice rises, ice rumples or along ice stream inlets and usu-ally extend the whole distance towards the calving front. Onthat journey along the stream, prevailing stresses can change
Published by Copernicus Publications on behalf of the European Geosciences Union.
588 T. Albrecht and A. Levermann: Fracture-induced softening in ice dynamics
and activate additional crevasse formation. While approach-ing the calving front, deep-reaching rifts were observed toinitiate from crevasses and propagate horizontally up to 100-km-long across flow units (Hulbe et al., 2010; Walker et al.,2013).
Fractures and ice flow interact in various ways. Consid-ering the effect of the ice flow on fracture formation first,we can state, that certain dynamic regimes promote the for-mation of fractures. More precisely, they form in regionsof strong shear or tensile flow for certain temperature andice conditions (Schulson and Duval, 2009). External forcessuch as seasonal meltwater drainage can enhance the verticalpropagation of existing surface fractures (Weertman, 1973;Van der Veen, 1998a), but snow drift, refreezing or recrystal-lization can cover and heal them. Similar effects underneaththe ice shelf influence the formation and propagation of basalcrevasses, which can reach far upward, producing a troughat the surface by viscous adjustment (Van der Veen, 1998b;McGrath et al., 2012b; Luckman et al., 2012; Vaughan et al.,2012). Generally, the ice-overburden pressure tends to closeopen crevasses as opposed to the tensile load (Nye, 1957) andto water pressure within the crevasse.
Considering the macroscopic feedback of fractures on theviscous ice flow, we can state that the abundance of fracturespotentially affect the flow regime since horizontal (mem-brane) stresses cannot be effectively transferred across highlyfractured regions due to the loss of mechanical integrity andthe reduction of its load-bearing capacity (Borstad et al.,2012, 2013). Inverse modeling provides a snapshot quantifi-cation of the dynamic activity of mechanically weakened ar-eas associated with fractures. Between those partly detachedflow units, strong velocity gradients and consequently in-tense shear is observed, which cannot be reproduced in stan-dard ice-flow models (discussed inSandhäger et al., 2005;Humbert et al., 2009). In addition to the effect of fractureson the flow, the accretion of marine ice underneath similarice shelf regions may play a relevant role explaining shearstrain concentrations (Jansen et al., 2013).
Observations of fracture features at the surface provide anincomplete picture. That is, dynamically active zones suchas highly fragmented shear zones are not necessarily visiblefor currently available resolutions and, vise versa, certain ob-servable surface features may be irrelevant for the dynamics.Furthermore, the active areas often act as precursor for vis-ible crevasse and rift formations (Bassis et al., 2008; Hulbeet al., 2010), which can be identified as mostly transversalstructures often reaching far into undamaged areas. Huge riftsystems can be completely deactivated (i.e., healed) whenfilled with mélange (Borstad et al., 2013). These compleximplications questions the robustness of validating the com-puted dynamic effect of fractures against observed surfacefeatures associated with fractures. Inverse control methodsprovide an intelligent validation tool by inferring such ac-tive zones for a given snapshot of observed surface velocities(Khazendar et al., 2007; Borstad et al., 2012, 2013; Haber-
mann et al., 2012, available as rheology inversion in PISM).Yet, controlling factors like ice fabric, marine ice or meltwa-ter are implicitly included in the inferred result. If runningthe forward model, PISM does not distinguish between me-teoric and marine ice, assuming constant density in the wholeice column.
Prognostic modeling is needed to understand the causali-ties and to reveal evolving characteristics of the interactionof flow and fracture dynamics, for example, investigatingself-amplifying feedback mechanisms that are susceptible tochanges in external conditions (Scambos et al., 2000, 2003;MacAyeal et al., 2003). Melting and hydro-fracturing causesenhanced structural weakening of the mechanical integrity infractured regions (Scambos et al., 2009; Glasser and Scam-bos, 2008; Vieli et al., 2007; Khazendar et al., 2007; Van derVeen, 2007; McGrath et al., 2012a). This reduces the lat-eral support of the confinement and consequently the but-tressing. Stronger shear and thinning in turn supports frac-turing, which ultimately can destabilize the entire ice shelf,as observed in several cases along the Antarctic Peninsula(Cook and Vaughan, 2010). The disintegration of large partsof the ice shelves provokes a more efficient drainage of theupstream glaciers (Rignot et al., 2004; Rott et al., 2011).
Fracturing of ice represents a key process in the descrip-tion of the complex ice-flow pattern and plays an importantrole in ice-shelf calving (Benn et al., 2007) and abrupt dis-integration. Particle-flow models may provide a novel andpromising representation of fracture formation and relatediceberg calving (Bassis and Jacobs, 2013). For the initiationof fractures, different theories have been discussed and ap-plied in several studies, considering ductile or brittle proper-ties of the ice on different scales (Schulson and Duval, 2009).According to the strength-of-material theory, fractures formif the stress exceeds a material-specific threshold. As an alter-native, fracture mechanics assume small cracks (of the orderof centimeters), from which fractures initiate, due to stressconcentrations at the crack tips. From there they propagateeither horizontally (Hulbe et al., 2010) or vertically on rathershort timescales (Van der Veen, 1998a, b). An accurate es-timate of the maximal fracture depth requires accurate dataof the vertical profiles of ice density and other physical pa-rameters (Rist et al., 2002; Plate et al., 2012), and will notbe further discussed in this study, though it might be part offuture studies.
In this study we present a simplified framework of contin-uum damage evolution based on ideas byPralong and Funk(2005) andBorstad et al.(2012), which we named “fracturedensity”, adapted to the finite-difference Parallel Ice SheetModel (Bueler and Brown, 2009; Winkelmann et al., 2011,based on PISM v.05; see documentation:www.pism-docs.org). In the first part we briefly resume the assumptions andmethods of identifying regions of fracture initiation and cor-responding fracture-density accumulation, which has beendescribed in detail inAlbrecht and Levermann(2012). Asimple coupling relationship between fracture density and
The Cryosphere, 8, 587–605, 2014 www.the-cryosphere.net/8/587/2014/
T. Albrecht and A. Levermann: Fracture-induced softening in ice dynamics 589
viscous-ice deformation is then presented and justified, fol-lowing the analytical formulation byBorstad et al.(2012).Inherent non-linear effects such as multi-stability are in-vestigated in a simplified model setup. Applying the pro-posed fracture coupling in simulations of several Antarcticice shelves and comparing the results to observations pro-vides a tool for calibrating employed parameters and thresh-olds and identifying qualitative differences in the flow field.A concluding discussion summarizes the findings and revealslimitations of the approach and also future applications, suchas a fracture-induced calving parameterization (Duddu et al.,2013).
2 The fracture-density concept
The basic idea of the continuous, dynamically evolvingfracture-density field, applied to ice shelves, has been intro-duced byAlbrecht and Levermann(2012). The scalar valueof the isotropic damage variable, 0≤ φ ≤ 1, called “fracturedensity”, has been interpreted as a measure for the density ofmacroscopic fracture features per ice-shelf surface area. Inthis study we considerφ to be a relative volume measure ofincluded voids as in the scalar damage interpretation. As afield variable,φ can be transported with the ice flowv as
∂φ
∂t+ v · ∇φ = fs+ fh . (1)
In this simple advection equationfs and fh indicate thesource and sink terms.
In areas, where a certain fracture-initiation thresholdσcr ismet,φ is assumed to grow with a rate that is proportional tothe local maximum spreading rate,ε+. This functional rela-tionship accounts for the formation of new fractures withina grid cell and hence for fracture accumulation. Since brit-tle fractures, for example, surface and bottom crevasses, arelikely produced in previously cracked regimes, we considerhere the aggregated effect, not distinguishing between indi-vidual fracture representations. Rift propagation across flowdomains is yet too complex to be modeled explicitly here.The presence of densely spaced fractures, however, restrictsthe rate of additional fracture formation by reducing the over-all stress in their proximity, which is expressed simply by areducing factor, 1−φ, in the fracture-density evolution func-tion
fs =
{γ · ε+ · (1− φ), σt ≥ σcr
0, σt < σcr. (2)
Contributions to fracture density are expected in regionswhere the “effective-stress” ellipse, defined in terms ofsurface-parallel principal stresses,σ+ andσ−, as
σt =
√σ 2
+ + σ 2− − σ+σ− , (3)
exceeds the von-Mises critical strengthσcr (von Mises, 1913;Vaughan, 1993). The fracture-density variable is then carried
downstream with the ice velocity (here following the ShallowShelf Approximation in Eq.1).
Existing fractures can experience deactivation by snowcover and refreezing of mélange at the surface, or closurein moderate stress environments by the ice overburden pres-sure in both surface and bottom crevasses. This is expressedin a healing rate:
fh =
{γh · (ε+ − εh), ε+ ≤ εh
0, ε+ > εh. (4)
Depending on the local tensile strain-rate condition,ε+ ≤ εh,the advected fracture density is then reduced with the con-stant rate factor,γh. Sensitivity of the fracture field to theseparameters and their role for the steady-state fracture den-sity have been evaluated inAlbrecht and Levermann(2012).However, the insights of this previous study are associatedwith a model setup, where the evolving fracture-density pat-tern is considered for a prescribed ice thickness. In the fol-lowing we take into account the macroscopic dynamic effectof the evolving fracture density on the ice viscosity to allowfor a feedback onto the flow field and the ice geometry.
3 Fracture-induced softening
In this section we build on recent efforts and investigatethe feedback mechanism of fracture formation and its cu-mulative imprint on the flow dynamics within a frameworkthat is based on a simplified version of continuum damagemechanics (Pralong and Funk, 2005; Duddu and Waisman,2012a, b). The fracture-density concept considers the first-order effects and adopts a simpler foundation in order toreduce the parameter space of the more generally defined(power-law) continuum damage model. Fractures can be as-sociated with voids in the ice body, that reduces the integrityof the ice body and stresses cannot be transferred properlyany more, hence the ice loses its “load-bearing capacity”(Borstad et al., 2012). We hence consider the influence offractures in the ice column on horizontal ice deformation. Asobserved in satellite images, bands of high fracture density,aligned along the flow, separate slow-moving areas from flowunits coming in from different inlets with different speeds.From a macroscopic point of view, this mechanical decou-pling along the suture zone corresponds to a softening ef-fect of the ice that can be expressed in the model as a modi-fied flow-enhancement factorEA (Humbert, 2006; Humbertet al., 2009). Assuming the strain-equivalence between phys-ical and effective spaces (Pralong and Funk, 2005; Dudduand Waisman, 2012a; Borstad et al., 2013), the stress-balanceequation changes using a modified effective viscosity defined
www.the-cryosphere.net/8/587/2014/ The Cryosphere, 8, 587–605, 2014

590 T. Albrecht and A. Levermann: Fracture-induced softening in ice dynamics
ESSA ESSA
b)a)
Fig. 1. Functional relationship of viscosity(a) and ice softening(b) with respect to fracture density as in Eq. (6) is shown for three SSA-enhancement factorsESSA (see legend). Base line forESSA= 1 is grey dashed.
as
ηφ = E−1n
A ·1
2· ε
1−nn
e ·
∫B(T )dz
= E−1n
φ ·
[E
−1n
SSA ·1
2· ε
1−nn
e ·
∫B(T )dz
]. (5)
Here,B(T ) denotes ice hardness (or rigidity), which dependson the vertical temperature distribution,T = T (z). PISM cal-culates temperature evolution using a semi-implicit schemefor the vertical diffusion and horizontal advection with theice flow, where strain heating comes in as heat source. Theeffective strain rate,εe, is the second invariant of the strain-rate tensor (equivalent to the effective stress in Eq.3), withn = 3 the Glen’s flow law parameter. The term in parenthe-ses on the right hand side represents the standard viscosityused in PISM, where the enhancement factor for the ShallowShelf Approximation,ESSA, is commonly used in ice shelfmodeling, comprising anisotropy and other softening or stiff-ening effects of the intact ice (Ma et al., 2010; Winkelmannet al., 2011). However,ESSA is taken to be constant in space
and time. In contrast,E−1n
φ represents an additional factorin Eq. (5) corresponding to the spatially varying fracture-induced softening.We assume a simple functional relationship for this softeningdue to fractures, adopted in its analytical form fromBorstadet al.(2012), written as
Eφ = [ 1− (1− ε) · φ ]−n ε=0−→ [ 1− φ ]−n . (6)
For its implementation in the numerical model we introducethe parameterε as a lower limit for the softening, avoidinga degeneration of the equations. In the simulations presentedhere epsilon isε = 0.001.
The combined influence of the two unitless enhancementfactors,EA = ESSA·Eφ , on the emerging non-linear couplingis shown in Fig.1. For a fracture density ofφ = 0.5, and
hence half the undamaged viscosity, ice is stiffened by a fac-tor EA = 0.4 for very low SSA-enhancement,ESSA = 0.05(right panel). In contrast, the flow is softened by a fac-tor EA = 8 if no SSA-enhancement is applied (ESSA = 1).Regarding anisotropy for tensional ice-shelf flow, values ofaboutESSA = 0.6− 0.7 seem realistic (Ma et al., 2010). Thelow value of ESSA = 0.05, as used in two applications toproduce realistic velocities, also comprises other effects inthe model setup (e.g., an overestimation of strain heatingalong the shearing margins). Due to the strong non-linearity,the total flow enhancement is almost an order of magnitudelarger (3≤ EA ≤ 59) for a fracture density ofφ = 0.75 anda quarter of the undistorted ice viscosity. Approaching van-ishing viscosity and hence infinite enhancement can be in-terpreted as pathway towards quasi-discontinuous model be-havior, where domains seem mechanically decoupled. In thisregime of fracture densities close to 1, the comparably smallresidual valueε limits ice softness to guarantee convergenceof the stress balance calculation. Its sensitivity will not bediscussed here.
The proposed model framework implies a potentially self-amplifying feedback mechanism: if fractures form in a cer-tain region, the ice will be softened according to Eq. (6),which allows for stress concentration. This applies also inregions downstream of the formation area where the frac-tures are transported to. Stronger shear or tension increasesthe effective stress and if the critical threshold is met, ad-ditional fractures can form leading to an increasing fracturedensity where fractures otherwise would not from. Healingand numerical diffusion counteract the accumulation of frac-ture density, which otherwise would tend to approach asymp-totically the upper bounding value 1.
The Cryosphere, 8, 587–605, 2014 www.the-cryosphere.net/8/587/2014/
T. Albrecht and A. Levermann: Fracture-induced softening in ice dynamics 591
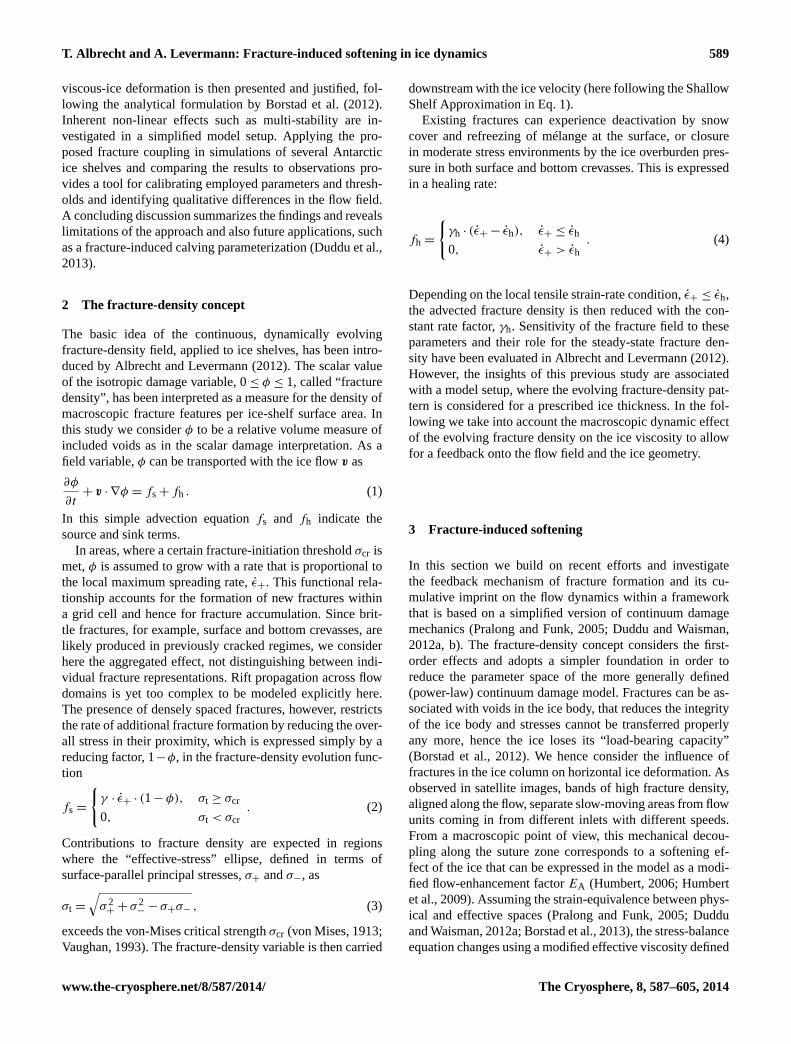
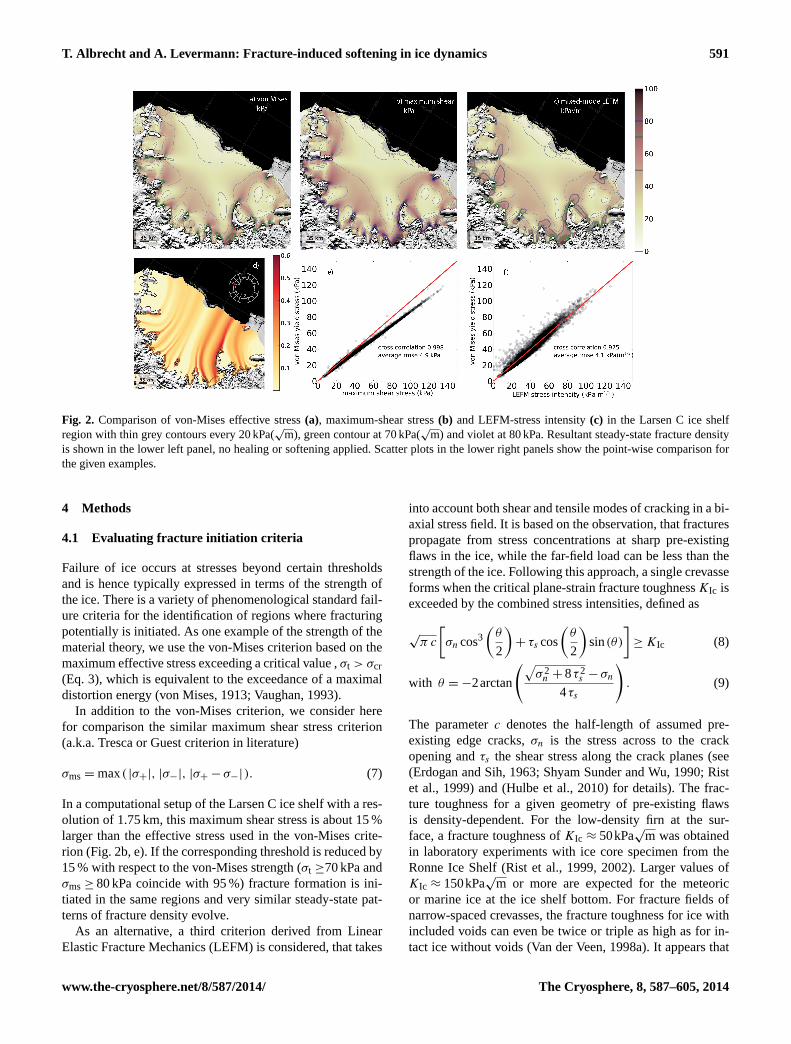
Fig. 2. Comparison of von-Mises effective stress(a), maximum-shear stress(b) and LEFM-stress intensity(c) in the Larsen C ice shelfregion with thin grey contours every 20 kPa(
√m), green contour at 70 kPa(
√m) and violet at 80 kPa. Resultant steady-state fracture density
is shown in the lower left panel, no healing or softening applied. Scatter plots in the lower right panels show the point-wise comparison forthe given examples.
4 Methods
4.1 Evaluating fracture initiation criteria
Failure of ice occurs at stresses beyond certain thresholdsand is hence typically expressed in terms of the strength ofthe ice. There is a variety of phenomenological standard fail-ure criteria for the identification of regions where fracturingpotentially is initiated. As one example of the strength of thematerial theory, we use the von-Mises criterion based on themaximum effective stress exceeding a critical value ,σt > σcr(Eq. 3), which is equivalent to the exceedance of a maximaldistortion energy (von Mises, 1913; Vaughan, 1993).
In addition to the von-Mises criterion, we consider herefor comparison the similar maximum shear stress criterion(a.k.a. Tresca or Guest criterion in literature)
σms = max( |σ+|, |σ−|, |σ+ − σ−|). (7)
In a computational setup of the Larsen C ice shelf with a res-olution of 1.75 km, this maximum shear stress is about 15 %larger than the effective stress used in the von-Mises crite-rion (Fig.2b, e). If the corresponding threshold is reduced by15 % with respect to the von-Mises strength (σt ≥70 kPa andσms ≥ 80 kPa coincide with 95 %) fracture formation is ini-tiated in the same regions and very similar steady-state pat-terns of fracture density evolve.
As an alternative, a third criterion derived from LinearElastic Fracture Mechanics (LEFM) is considered, that takes
into account both shear and tensile modes of cracking in a bi-axial stress field. It is based on the observation, that fracturespropagate from stress concentrations at sharp pre-existingflaws in the ice, while the far-field load can be less than thestrength of the ice. Following this approach, a single crevasseforms when the critical plane-strain fracture toughnessKIc isexceeded by the combined stress intensities, defined as
√π c
[σn cos3
(θ
2
)+ τs cos
(θ
2
)sin(θ)
]≥ KIc (8)
with θ = −2arctan
(√σ 2
n + 8τ2s − σn
4τs
). (9)
The parameterc denotes the half-length of assumed pre-existing edge cracks,σn is the stress across to the crackopening andτs the shear stress along the crack planes (see(Erdogan and Sih, 1963; Shyam Sunder and Wu, 1990; Ristet al., 1999) and (Hulbe et al., 2010) for details). The frac-ture toughness for a given geometry of pre-existing flawsis density-dependent. For the low-density firn at the sur-face, a fracture toughness ofKIc ≈ 50kPa
√m was obtained
in laboratory experiments with ice core specimen from theRonne Ice Shelf (Rist et al., 1999, 2002). Larger values ofKIc ≈ 150kPa
√m or more are expected for the meteoric
or marine ice at the ice shelf bottom. For fracture fields ofnarrow-spaced crevasses, the fracture toughness for ice withincluded voids can even be twice or triple as high as for in-tact ice without voids (Van der Veen, 1998a). It appears that
www.the-cryosphere.net/8/587/2014/ The Cryosphere, 8, 587–605, 2014
592 T. Albrecht and A. Levermann: Fracture-induced softening in ice dynamics
the initial crack half-lengthc is a weakly confined parameter.Without making physically-based decisions about formulat-ing the LEFM criterion, we assigned a value ofc = 0.2 m,such that the root mean square error in comparison to thevon-Mises criterion becomes minimal within the computa-tional setup of the Larsen C region (Fig.2f). Jansen et al.(2010) indicate a unique pattern of potential crevasse open-ing for a given ratio of fracture toughness and half-length,which compares very well with Fig.2c, (compare grey con-tour lines of 50kPa
√m). Since the relevant formation areas
of brittle fractures coincide mostly with those identified withthe ductile von-Mises criterion (forKIc = 70 kPa
√m and
σt ≥ 70 kPa fracture-formation area have a 75 % match), thefracture-density pattern does not show major differences atthe resolutions applied here. LEFM may provide a differentpattern for better resolved geometries and physical choices ofthe parameterc. In the following study we use the von-Misescriterion only to identify regions of fracture initiation.
4.2 Feature-preserving two-dimensional numericaladvection scheme
Standard upstream differencing schemes of first-order accu-racy are a commonly applied and pragmatic choice to ap-proximate hyperbolic-type partial differential equations asthe advection equation in Eq. (1) (e.g.,Press et al., 2009).However, these schemes are known to be numerically dissi-pative, that is, they tend to smear out well-defined structures,such as shocks (discontinuities) along the flow. In contrast,we consider confined stripes of fracture density in the hori-zontal plane with sharp gradient across the main flow. For ourapplications it is important to maintain this flow-stripe struc-ture and to avoid a smearing effect transversally to the flow,which can be associated with fracture healing for unphysicalreasons. Figure4 shows three transects perpendicular to thesymmetry flow line in a simplified ice-shelf setup of 100 kmwidth and length. Fracture density as a tracer is initializedwith unity value within a small domain of 8 km× 8 km. The-oretically a narrow band of constant fracture density is ex-pected downstream in a steady state. In fact, if the flow di-rection coincides with one grid axis, numerical diffusion canbe neglected (Fig.4b). However, the smearing effect dependson the direction of the flow with respect to the underlyinggrid. For the standard upwind scheme, it is strongest for di-agonal transport (Fig.4d), where finite differences towardsthe direct upstream neighbors are calculated (Fig.3a), result-ing in a “zigzag” course from cell to cell. This correspondsto a wide domain of influence of 90◦, that is the triangle con-taining the two direct neighboring upstream grid cells, fromwhere flux contributions are received. In order to increasethe accuracy of the transport scheme, we split the domainof influence (45◦) and consider eight different cases (insteadof four in the standard case) depending on the flow direc-tion. Thus, we calculate finite differences involving all eight
neighboring grid cells,
φN+1 = φN − 1t · (10)
uφi,j −φi+1,j
1x+ v
φi+1,j −φi−1,j−11y
, 0 ≤ v 1x1y
<u
uφi,j−1−φi−1,j−1
1x+ v
φi,j −φi,j−11y
, 0<u1y1x
≤ v
−uφi,j−1−φi+1,j−1
1x+ v
φi,j −φi,j−11y
, 0 ≥ u1y1x
> − v
−uφi,j −φi+1,j
1x+ v
φi+1,j −φi+1,j−11y
, 0<v 1x1y
≤ −u
−uφi,j −φi+1,j
1x− v
φi+1,j −φi+1,j+11y
, 0 ≥ v 1x1y
>u
−uφi,j+1−φi+1,j+1
1x− v
φi,j −φi,j+11y
, 0>u1y1x
≥ v
uφi,j+1−φi+1,j+1
1x− v
φi,j −φi,j+11y
, 0 ≤ u1y1x
> − v
uφi,j −φi+1,j
1x− v
φi+1,j −φi+1,j+11y
, 0>v 1x1y
≥ −u ,
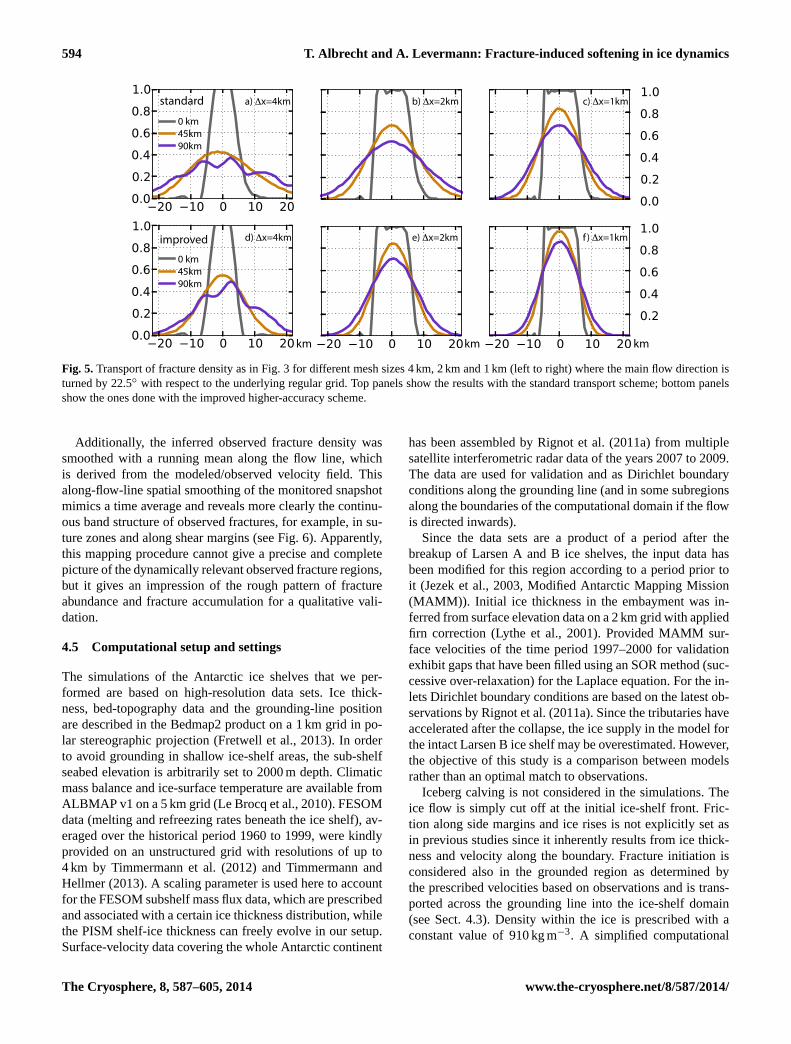
whereN indicates the time step, whilei andj are the co-ordinates on the regular rectangular grid, associated with thevelocity vector componentsu and v (see Fig.3b). The fi-nite difference that corresponds to the smaller component ofthe vector velocity is simply shifted upstream. This modi-fication exhibits less numerical diffusion for transport thatis oblique with respect to the grid axes and hence preservesbetter the shape of stripe-like structures for advection in twodimensions. When turning the main flow direction by 45◦,the higher order scheme reveals a much higher accuracy thanin the unturned case. In contrast, for the first order scheme,maximum values are reduced by 60 % of its initial value overa distance of 90 km (compare profile in Figs.4d and h). Forthe flow that is turned by intermediate angles (e.g., 22.5◦),both schemes show an unintended numerical diffusion with areduction of the maximum by about 50 % for the standard up-wind scheme and significantly less (30 %) for the improvedaccuracy scheme (Fig.4c and g). Although, both schemes arenot conservative, the integral along the considered cross sec-tions varies less than 5 % along the 90 km transport in a com-parably smooth velocity field. Higher resolution increases theaccuracy significantly for both schemes (Fig.5), which needsto be considered in the experiments.
4.3 Fracture formation along grounded ice streams
Fractures are often observed to be initiated in the rockyshear margins of the inlets upstream from the grounding line,where ice flow accelerates due to decreased basal friction.The boundary condition for the fracture-density evolution,φ0, is applied along the grounding line that confines the iceshelf domain. In this way,φ0 accounts for pre-existing frac-tures draining through the inlets. We assume that fractureprocesses in grounded but “shelfy” regions occur under sim-ilar conditions as within the ice shelf domain. In this way wecan calculate contributions to the fracture-density field fromobserved velocities in the grounded regions as prescribedboundary condition along the grounding line, yielding a morerealistic φ0 than in a previous study (Albrecht and Lever-mann, 2012).
The Cryosphere, 8, 587–605, 2014 www.the-cryosphere.net/8/587/2014/

T. Albrecht and A. Levermann: Fracture-induced softening in ice dynamics 593
i-1,j i, j
i-1,j+1 i,j+1 i+1,j+1
i+1,ji-1,j i, j
i-1,j+1 i,j+1 i+1,j+1
i+1,j
a) standard b) improved
Fig. 3. Two-dimensional view of grid celli,j with a brown velocity vector pointing to the lower right cell neighbors (0≥ vi,j1x/1y ≥
−ui,j ). The standard first-order upwind scheme takes into account the gradients along the two axes between the direct upstream neighboringcells (a). In order to gain a higher accuracy the second gradient is shifted upstream (violet arrow)(b). This improved scheme mimics avelocity-weighted gradient along the green-dashed flow line.
0 km45km90km
0 km45km90km
b) 0° d) 45°c) 22.5°
f ) 0° h) 45°g) 22.5°
km km km
22.5°
standard
improved
0 km
45km
90km
a)
e)
Fig. 4.Dissipation of fracture density during transport as studied in a simplified ice-shelf setup where the main flow direction is 0◦, 22.5◦ and45◦ and oblique with respect to the underlying regular grid of mesh width 2 km. The fracture band originates in a small spot with maximalfracture densityφ = 1. Results shown in the top-panels are produced with the standard first-order upstream transport scheme, in the lowerpanels with the improved scheme. The steady-state cross-profile of the fracture band is compared at three transects perpendicular to the mainflow direction at the source (grey), as well as with 45 km (brown) and 90 km (violet) distance, using bivariate interpolation for the plots.
4.4 Interpreting fracture density from satellite visibleimagery
In order to compare the modeled fracture density with ob-servations, we hand-digitized visible surface features thatseem to represent fracture phenomena of any kind. We iden-tified these features in MOA satellite spectroradiometer im-ages of the largest Antarctic ice shelves as snapshot of theyears 2003 to 2004 (Scambos et al., 2007, MODIS Mosaicof Antarctica). Recent observation have shown that observedsurface troughs in ice shelves often correspond to widelyspaced basal crevasses, which support surface fracturing byviscous-adjustment-induced bending effects (McGrath et al.,2012b; Luckman et al., 2012; Vaughan et al., 2012). How-ever, the smaller surface crevasses as well as the highlyfragmented shear zones are hard to identify from satellite
data for resolutions of 150 m, especially when snow-covered.Here we do not distinguish between the different representa-tions (Glasser and Scambos, 2008; Glasser et al., 2009) andassume that visible fractures features have enough verticalextent to affect the flow dynamics, even though we do notconsider the vertical distribution of voids in the ice column.Following Albrecht and Levermann(2012), we calculateda two-dimensional representation of the observed fracturefeatures,φobs, for each grid cell of a given resolution, as-suming a rectangular “zone of influence” of 1 km width. Thisassumption is motivated by the fact that, for crevasse openingperpendicular to the the main tensile stress axis, the appliedfar-field stress has to circumvent the discontinuity. This re-duces the effective stress to both sides of the crack, acting asa stress shadow cast.
www.the-cryosphere.net/8/587/2014/ The Cryosphere, 8, 587–605, 2014
594 T. Albrecht and A. Levermann: Fracture-induced softening in ice dynamics
0 km45km90km
0 km45km90km
a) Δx=4km
km km km
standard
improved
b) Δx=2km c) Δx=1km
d) Δx=4km e) Δx=2km f) Δx=1km
Fig. 5. Transport of fracture density as in Fig.3 for different mesh sizes 4 km, 2 km and 1 km (left to right) where the main flow direction isturned by 22.5◦ with respect to the underlying regular grid. Top panels show the results with the standard transport scheme; bottom panelsshow the ones done with the improved higher-accuracy scheme.
Additionally, the inferred observed fracture density wassmoothed with a running mean along the flow line, whichis derived from the modeled/observed velocity field. Thisalong-flow-line spatial smoothing of the monitored snapshotmimics a time average and reveals more clearly the continu-ous band structure of observed fractures, for example, in su-ture zones and along shear margins (see Fig.6). Apparently,this mapping procedure cannot give a precise and completepicture of the dynamically relevant observed fracture regions,but it gives an impression of the rough pattern of fractureabundance and fracture accumulation for a qualitative vali-dation.
4.5 Computational setup and settings
The simulations of the Antarctic ice shelves that we per-formed are based on high-resolution data sets. Ice thick-ness, bed-topography data and the grounding-line positionare described in the Bedmap2 product on a 1 km grid in po-lar stereographic projection (Fretwell et al., 2013). In orderto avoid grounding in shallow ice-shelf areas, the sub-shelfseabed elevation is arbitrarily set to 2000 m depth. Climaticmass balance and ice-surface temperature are available fromALBMAP v1 on a 5 km grid (Le Brocq et al., 2010). FESOMdata (melting and refreezing rates beneath the ice shelf), av-eraged over the historical period 1960 to 1999, were kindlyprovided on an unstructured grid with resolutions of up to4 km by Timmermann et al.(2012) and Timmermann andHellmer(2013). A scaling parameter is used here to accountfor the FESOM subshelf mass flux data, which are prescribedand associated with a certain ice thickness distribution, whilethe PISM shelf-ice thickness can freely evolve in our setup.Surface-velocity data covering the whole Antarctic continent
has been assembled byRignot et al.(2011a) from multiplesatellite interferometric radar data of the years 2007 to 2009.The data are used for validation and as Dirichlet boundaryconditions along the grounding line (and in some subregionsalong the boundaries of the computational domain if the flowis directed inwards).
Since the data sets are a product of a period after thebreakup of Larsen A and B ice shelves, the input data hasbeen modified for this region according to a period prior toit (Jezek et al., 2003, Modified Antarctic Mapping Mission(MAMM)). Initial ice thickness in the embayment was in-ferred from surface elevation data on a 2 km grid with appliedfirn correction (Lythe et al., 2001). Provided MAMM sur-face velocities of the time period 1997–2000 for validationexhibit gaps that have been filled using an SOR method (suc-cessive over-relaxation) for the Laplace equation. For the in-lets Dirichlet boundary conditions are based on the latest ob-servations byRignot et al.(2011a). Since the tributaries haveaccelerated after the collapse, the ice supply in the model forthe intact Larsen B ice shelf may be overestimated. However,the objective of this study is a comparison between modelsrather than an optimal match to observations.
Iceberg calving is not considered in the simulations. Theice flow is simply cut off at the initial ice-shelf front. Fric-tion along side margins and ice rises is not explicitly set asin previous studies since it inherently results from ice thick-ness and velocity along the boundary. Fracture initiation isconsidered also in the grounded region as determined bythe prescribed velocities based on observations and is trans-ported across the grounding line into the ice-shelf domain(see Sect.4.3). Density within the ice is prescribed with aconstant value of 910 kg m−3. A simplified computational
The Cryosphere, 8, 587–605, 2014 www.the-cryosphere.net/8/587/2014/

T. Albrecht and A. Levermann: Fracture-induced softening in ice dynamics 595
Fig. 6. Surface features in the largest and most important Antarctic ice shelves hand-digitized from MODIS data (Scambos et al., 2007,Mosaic of Antarctica). Positions of ice shelves are marked in the inset Antarctica map. Smoothed observed fracture densityφobs is shaded inorange/red colors across the ice shelf surrounded by MOA image map of grounded landscape and ice-free ocean. Colored rectangles showareas of investigated regional setups.
setup is used with an ice shelf confined in a rectangular bayof 100 km width and 2000 m depth. Constant ice inflow isdefined at the upper grounding line with 600 m thickness and300 m yr−1 speed while the friction along the side marginsis prescribed, such that the intensity of shear flow can becontrolled. Surface temperature is constantly−30◦ C and atpressure melting point at the base. Surface-mass balance isconstantly 0.1 m yr−1 on the ice shelf. The minimum reso-lution is 1 km in this simplified setup, which can be simplyrescaled to coarser multiples of that resolution.
5 Results
5.1 Self-amplified fracturing
Non-linear systems may exhibit bistable phenomena basedon a positive, that is, self-amplifying, feedback mechanismas considered previously in the text (Sect.3). On large cli-matic scales, systems that exhibit such behavior are some-times called “tipping elements” (Levermann et al., 2011).Here this characteristic threshold behavior is investigated ina simplified experiment, where fracture density ofφ = 0.7is prescribed within a confined ice shelf region (a few gridcells), which imitates a constantly active fracture source(similar to setup in Fig.4). The ice flow carries away dam-aged ice from this constant supply forming a fracture band
www.the-cryosphere.net/8/587/2014/ The Cryosphere, 8, 587–605, 2014
596 T. Albrecht and A. Levermann: Fracture-induced softening in ice dynamics
km kPa
fracture formation
viscosity/rigidity
+shear stress
a) b) c)
-+
-
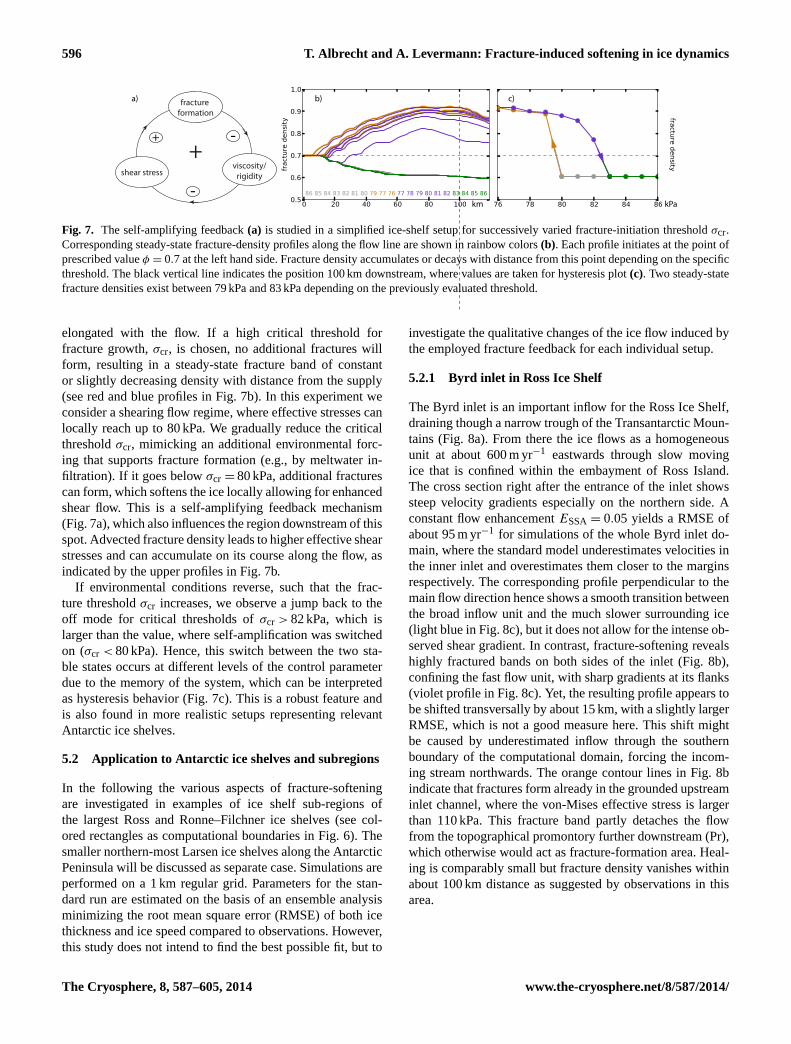
Fig. 7. The self-amplifying feedback(a) is studied in a simplified ice-shelf setup for successively varied fracture-initiation thresholdσcr.Corresponding steady-state fracture-density profiles along the flow line are shown in rainbow colors(b). Each profile initiates at the point ofprescribed valueφ = 0.7 at the left hand side. Fracture density accumulates or decays with distance from this point depending on the specificthreshold. The black vertical line indicates the position 100 km downstream, where values are taken for hysteresis plot(c). Two steady-statefracture densities exist between 79 kPa and 83 kPa depending on the previously evaluated threshold.
elongated with the flow. If a high critical threshold forfracture growth,σcr, is chosen, no additional fractures willform, resulting in a steady-state fracture band of constantor slightly decreasing density with distance from the supply(see red and blue profiles in Fig.7b). In this experiment weconsider a shearing flow regime, where effective stresses canlocally reach up to 80 kPa. We gradually reduce the criticalthresholdσcr, mimicking an additional environmental forc-ing that supports fracture formation (e.g., by meltwater in-filtration). If it goes belowσcr = 80 kPa, additional fracturescan form, which softens the ice locally allowing for enhancedshear flow. This is a self-amplifying feedback mechanism(Fig.7a), which also influences the region downstream of thisspot. Advected fracture density leads to higher effective shearstresses and can accumulate on its course along the flow, asindicated by the upper profiles in Fig.7b.
If environmental conditions reverse, such that the frac-ture thresholdσcr increases, we observe a jump back to theoff mode for critical thresholds ofσcr > 82 kPa, which islarger than the value, where self-amplification was switchedon (σcr < 80 kPa). Hence, this switch between the two sta-ble states occurs at different levels of the control parameterdue to the memory of the system, which can be interpretedas hysteresis behavior (Fig.7c). This is a robust feature andis also found in more realistic setups representing relevantAntarctic ice shelves.
5.2 Application to Antarctic ice shelves and subregions
In the following the various aspects of fracture-softeningare investigated in examples of ice shelf sub-regions ofthe largest Ross and Ronne–Filchner ice shelves (see col-ored rectangles as computational boundaries in Fig.6). Thesmaller northern-most Larsen ice shelves along the AntarcticPeninsula will be discussed as separate case. Simulations areperformed on a 1 km regular grid. Parameters for the stan-dard run are estimated on the basis of an ensemble analysisminimizing the root mean square error (RMSE) of both icethickness and ice speed compared to observations. However,this study does not intend to find the best possible fit, but to
investigate the qualitative changes of the ice flow induced bythe employed fracture feedback for each individual setup.
5.2.1 Byrd inlet in Ross Ice Shelf
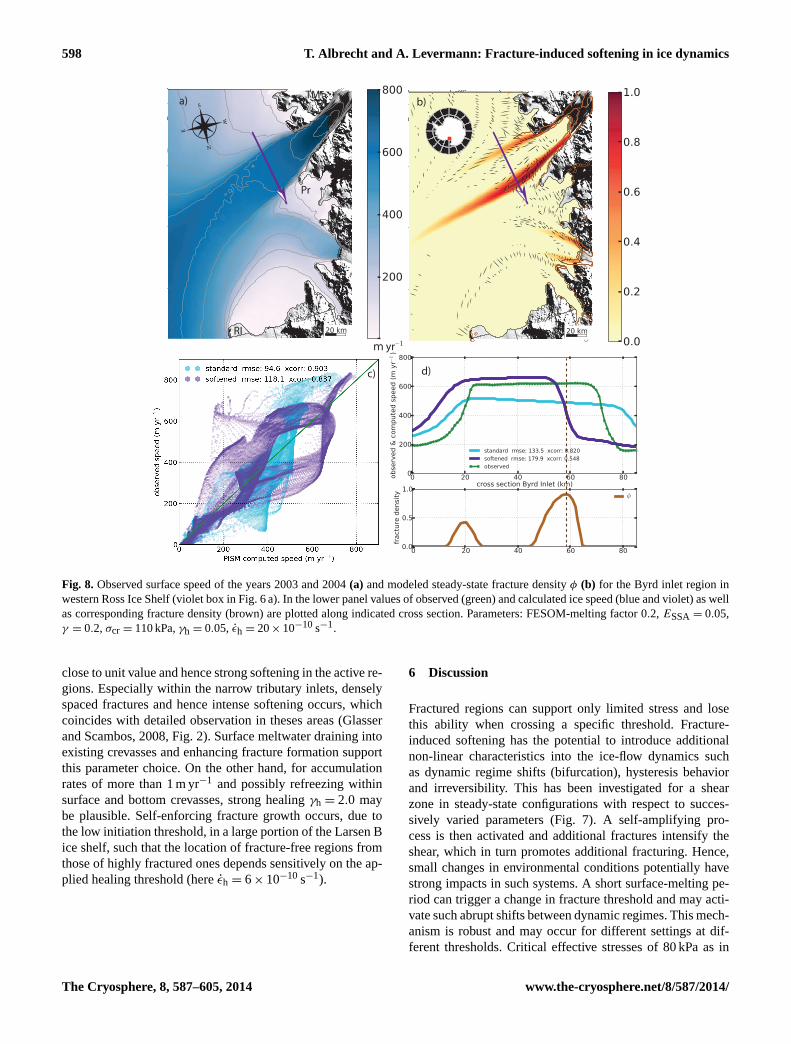
The Byrd inlet is an important inflow for the Ross Ice Shelf,draining though a narrow trough of the Transantarctic Moun-tains (Fig.8a). From there the ice flows as a homogeneousunit at about 600 m yr−1 eastwards through slow movingice that is confined within the embayment of Ross Island.The cross section right after the entrance of the inlet showssteep velocity gradients especially on the northern side. Aconstant flow enhancementESSA = 0.05 yields a RMSE ofabout 95 m yr−1 for simulations of the whole Byrd inlet do-main, where the standard model underestimates velocities inthe inner inlet and overestimates them closer to the marginsrespectively. The corresponding profile perpendicular to themain flow direction hence shows a smooth transition betweenthe broad inflow unit and the much slower surrounding ice(light blue in Fig.8c), but it does not allow for the intense ob-served shear gradient. In contrast, fracture-softening revealshighly fractured bands on both sides of the inlet (Fig.8b),confining the fast flow unit, with sharp gradients at its flanks(violet profile in Fig.8c). Yet, the resulting profile appears tobe shifted transversally by about 15 km, with a slightly largerRMSE, which is not a good measure here. This shift mightbe caused by underestimated inflow through the southernboundary of the computational domain, forcing the incom-ing stream northwards. The orange contour lines in Fig.8bindicate that fractures form already in the grounded upstreaminlet channel, where the von-Mises effective stress is largerthan 110 kPa. This fracture band partly detaches the flowfrom the topographical promontory further downstream (Pr),which otherwise would act as fracture-formation area. Heal-ing is comparably small but fracture density vanishes withinabout 100 km distance as suggested by observations in thisarea.
The Cryosphere, 8, 587–605, 2014 www.the-cryosphere.net/8/587/2014/

T. Albrecht and A. Levermann: Fracture-induced softening in ice dynamics 597
5.2.2 Evans inlet in Ronne Ice Shelf
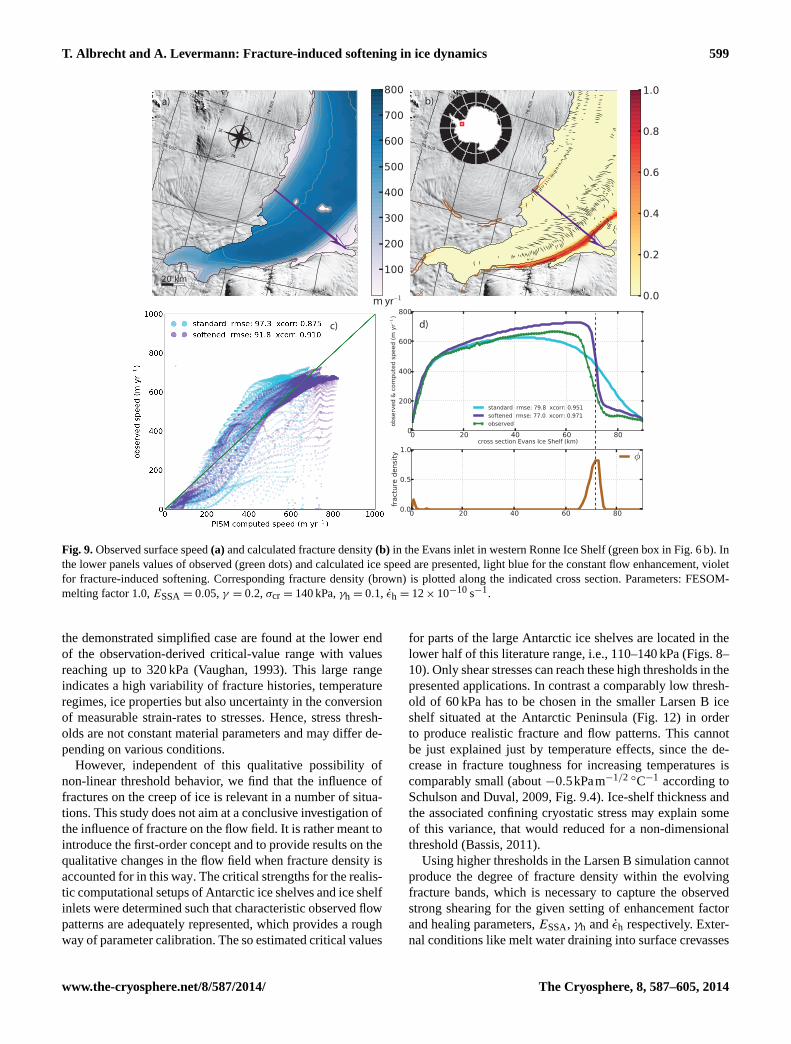
The ice stream of the Evans Glacier enters the secondlargest Ronne Ice Shelf in the west and turns north. Thismotion yields an inclined cross profile with a speed ofup to 700 m yr−1 at the souther margin jumping to al-most 100 m yr−1 in some minor side inlets (green profile inFig.9d). Simulations with the ordinary stress balance requirea small basic flow enhancementESSA = 0.05 (light blue inFig. 9c and d), in order to reproduce observed surface ve-locities in this region (RMSE: about 100 m yr−1). However,neither the gradual inclination of the main flow nor the stronggradient at the southern flank are well represented. Fracturesoftening instead exhibits these features and produces a thinfracture band along the rocky margin. From there the fracturezone continues with the main flow and separates the stagnantregions at the sides (right hand side in Fig.9d). A relativelyhigh critical threshold stress of 140 kPa and a comparablystrong healing in the main trunk of the inlet limits the extentof the fracture band and restricts the inflow in the observedrange. Observations confirm the presence of elongated frag-mental structures close to the margin from where crevassespropagate towards the center line of the inlet. On average icespeed in the ice shelf domain agrees much better with ob-servations (see RMSE reduced by 6 % and maps of velocityanomalies are provided as Supplement).
5.2.3 Filchner Ice Shelf
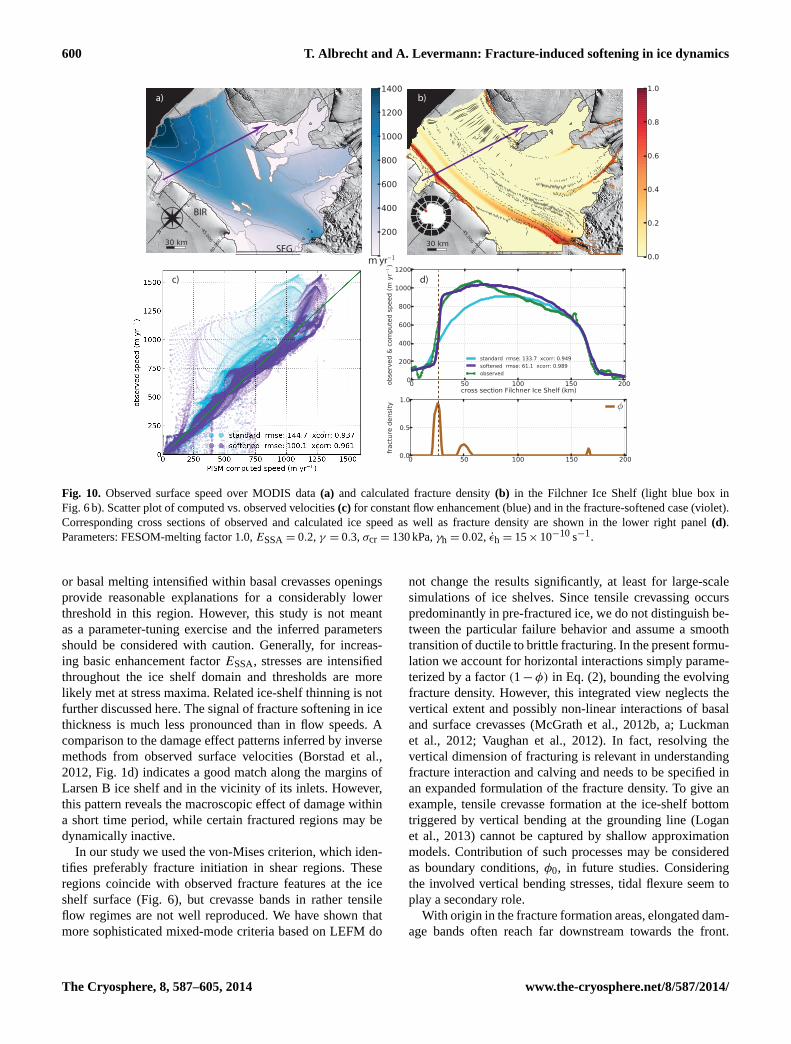
Filchner Ice Shelf is the fastest of the smaller Antarctic iceshelves with speeds up to 1400 m yr−1 close to the front(Fig. 10a). It shears along Berkner Ice Rise (BIR) at its west-ern margin and drains into the Weddell Sea in the north. Thecross section is located south of the rifted areas at the north-eastern margin (cf. Figs.6b and10c). The maximum speedis shifted from the center line towards the Berkner side witha small buckle at about 70 km distance. This feature likelyindicates the presence of a suture zone between the flow unitfed by the Recovery Glacier and the flow coming from theSupport Force Glacier farther west. The characteristic flowpattern in relation to observed surface crevasses was alreadydiagnostically studied bySaheicha et al.(2006), presuminga crevasse band with origin at Recovery Glacier inlet (seeoverlain structures in Fig.10b). Simulations with constantenhancement factorESSA = 0.2 produce a symmetric andsmooth velocity distribution (RMSE: 145 m yr−1) within theFilchner trough (light blue in Fig.10c). A much better rep-resentation of elongated structures such as the suture zonewithin the main trunk causing a small kink in the velocityprofile is provided by application of the fracture-softeningscheme with a relatively high critical stress threshold of130 kPa. For chosen parameters a better agreement with ob-servations is attained than in the standard model (RMSE:100 m yr−1), reproducing much of the inclination and thesteep gradient at the western margin. The straight inclined
part of the observed profile might be an effect of the rift sys-tem downstream, which is not accounted for in the model.
The characteristic fracture band pattern is also obtainedfor lower resolution of 2 km or even 5 km (Fig.11); however,much more damped for wider meshes (cf. Fig.5). Hence thesoftening effect is weaker and the typical shape of the acrossvelocity profile is less pronounced.
5.2.4 Larsen B region prior to its break-up
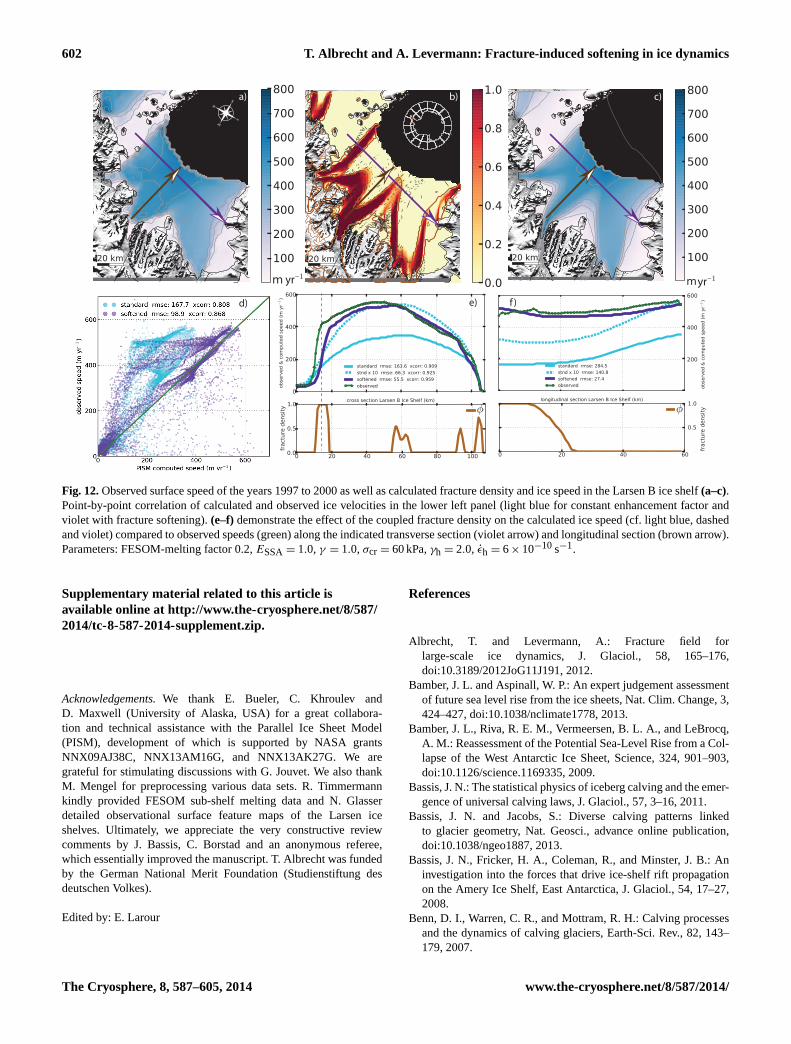
The Larsen B ice shelf is situated at the northeastern flankof the Antarctic Peninsula facing the Weddell Sea (Fig.12).The climatic conditions in this region are considerably dif-ferent from those in the more continental ice shelves far-ther south. Surface melting during summer can produce meltponds (Glasser and Scambos, 2008), which initiate a seriesof processes that can result in such large-scale events as thedisintegration of major parts of Larsen B in 2002 withina few weeks (Rack and Rott, 2004). Satellite observationsindicated a heavily crevassed ice-shelf surface prior to thecollapse (Fig.6c) and model studies confirmed the dynami-cally active role of those fractured regions (Sandhäger, 2003;Sandhäger et al., 2005; Vieli et al., 2006, 2007; Khazen-dar et al., 2007; Borstad et al., 2012). Since ordinary modelconfigurations with constant flow enhancement fail to accu-rately reproduce the characteristic pre-collapse flow patternwith sharp velocity gradients across weak shear zones alongthe side margins of the Larsen B regime (cf. green profilein Fig. 12), our fracture-density approach provides a physi-cally motivated tool to reduce this discrepancy. The velocityof the interior of the ice shelf appears plateau-shaped. Thiscan be explained by the partial mechanical decoupling fromthe confining side margins such that a large enhancement fac-tor of ESSA = 10 is needed to reach observed maximum ve-locity values of up to 560 m yr−1 along the central front (cf.dashed light blue in Fig.12e). Especially along inlets close tothe grounding line the computed velocities are far too small(Fig. 12f).
A fracture-density dependent and hence spatially varyingflow enhancement reproduces the observations much bet-ter (thick violet in Fig.12e and f), since the inferred frac-ture density identifies the dynamically relevant weak zonesand allows for intense located softening and hence strongflow gradients. In this example, fracture-density-induced iceweakening occurs not only along the side margins, but alsoalong a wide fracture band further downstream. Inversely in-ferred damage in Larsen B based on the short observationperiod identifies similar band structures (Borstad et al., 2012,Fig. 1d).
We used an enhancement factorESSA = 1.0 as base levelfor unfractured ice, which is more realistic for ice shelvesin tension than values larger than 1 (Ma et al., 2010). Acomparably high value for the fracture rateγ = 1.0 and alow value of the fracture-initiation thresholdσcr = 60 kPa isneeded in order to yield high fracture-density accumulation
www.the-cryosphere.net/8/587/2014/ The Cryosphere, 8, 587–605, 2014
598 T. Albrecht and A. Levermann: Fracture-induced softening in ice dynamics
yr
a) b)
c)
RI
TM
Pr
d)
Fig. 8. Observed surface speed of the years 2003 and 2004(a) and modeled steady-state fracture densityφ (b) for the Byrd inlet region inwestern Ross Ice Shelf (violet box in Fig.6a). In the lower panel values of observed (green) and calculated ice speed (blue and violet) as wellas corresponding fracture density (brown) are plotted along indicated cross section. Parameters: FESOM-melting factor 0.2, ESSA= 0.05,γ = 0.2, σcr = 110 kPa,γh = 0.05, εh = 20× 10−10s−1.
close to unit value and hence strong softening in the active re-gions. Especially within the narrow tributary inlets, denselyspaced fractures and hence intense softening occurs, whichcoincides with detailed observation in theses areas (Glasserand Scambos, 2008, Fig. 2). Surface meltwater draining intoexisting crevasses and enhancing fracture formation supportthis parameter choice. On the other hand, for accumulationrates of more than 1 m yr−1 and possibly refreezing withinsurface and bottom crevasses, strong healingγh = 2.0 maybe plausible. Self-enforcing fracture growth occurs, due tothe low initiation threshold, in a large portion of the Larsen Bice shelf, such that the location of fracture-free regions fromthose of highly fractured ones depends sensitively on the ap-plied healing threshold (hereεh = 6× 10⁻¹⁰ s−1).
6 Discussion
Fractured regions can support only limited stress and losethis ability when crossing a specific threshold. Fracture-induced softening has the potential to introduce additionalnon-linear characteristics into the ice-flow dynamics suchas dynamic regime shifts (bifurcation), hysteresis behaviorand irreversibility. This has been investigated for a shearzone in steady-state configurations with respect to succes-sively varied parameters (Fig.7). A self-amplifying pro-cess is then activated and additional fractures intensify theshear, which in turn promotes additional fracturing. Hence,small changes in environmental conditions potentially havestrong impacts in such systems. A short surface-melting pe-riod can trigger a change in fracture threshold and may acti-vate such abrupt shifts between dynamic regimes. This mech-anism is robust and may occur for different settings at dif-ferent thresholds. Critical effective stresses of 80 kPa as in
The Cryosphere, 8, 587–605, 2014 www.the-cryosphere.net/8/587/2014/
T. Albrecht and A. Levermann: Fracture-induced softening in ice dynamics 599
yr
a) b)
c) d)
Fig. 9.Observed surface speed(a) and calculated fracture density(b) in the Evans inlet in western Ronne Ice Shelf (green box in Fig.6b). Inthe lower panels values of observed (green dots) and calculated ice speed are presented, light blue for the constant flow enhancement, violetfor fracture-induced softening. Corresponding fracture density (brown) is plotted along the indicated cross section. Parameters: FESOM-melting factor 1.0,ESSA= 0.05,γ = 0.2, σcr = 140 kPa,γh = 0.1, εh = 12× 10−10s−1.
the demonstrated simplified case are found at the lower endof the observation-derived critical-value range with valuesreaching up to 320 kPa (Vaughan, 1993). This large rangeindicates a high variability of fracture histories, temperatureregimes, ice properties but also uncertainty in the conversionof measurable strain-rates to stresses. Hence, stress thresh-olds are not constant material parameters and may differ de-pending on various conditions.
However, independent of this qualitative possibility ofnon-linear threshold behavior, we find that the influence offractures on the creep of ice is relevant in a number of situa-tions. This study does not aim at a conclusive investigation ofthe influence of fracture on the flow field. It is rather meant tointroduce the first-order concept and to provide results on thequalitative changes in the flow field when fracture density isaccounted for in this way. The critical strengths for the realis-tic computational setups of Antarctic ice shelves and ice shelfinlets were determined such that characteristic observed flowpatterns are adequately represented, which provides a roughway of parameter calibration. The so estimated critical values
for parts of the large Antarctic ice shelves are located in thelower half of this literature range, i.e., 110–140 kPa (Figs.8–10). Only shear stresses can reach these high thresholds in thepresented applications. In contrast a comparably low thresh-old of 60 kPa has to be chosen in the smaller Larsen B iceshelf situated at the Antarctic Peninsula (Fig.12) in orderto produce realistic fracture and flow patterns. This cannotbe just explained just by temperature effects, since the de-crease in fracture toughness for increasing temperatures iscomparably small (about−0.5kPam−1/2 ◦C−1 according toSchulson and Duval, 2009, Fig. 9.4). Ice-shelf thickness andthe associated confining cryostatic stress may explain someof this variance, that would reduced for a non-dimensionalthreshold (Bassis, 2011).
Using higher thresholds in the Larsen B simulation cannotproduce the degree of fracture density within the evolvingfracture bands, which is necessary to capture the observedstrong shearing for the given setting of enhancement factorand healing parameters,ESSA, γh andεh respectively. Exter-nal conditions like melt water draining into surface crevasses
www.the-cryosphere.net/8/587/2014/ The Cryosphere, 8, 587–605, 2014
600 T. Albrecht and A. Levermann: Fracture-induced softening in ice dynamics
yr
a) b)
c) d)
BIR
RGSFG
Fig. 10. Observed surface speed over MODIS data(a) and calculated fracture density(b) in the Filchner Ice Shelf (light blue box inFig. 6b). Scatter plot of computed vs. observed velocities(c) for constant flow enhancement (blue) and in the fracture-softened case (violet).Corresponding cross sections of observed and calculated ice speed as well as fracture density are shown in the lower right panel(d).Parameters: FESOM-melting factor 1.0,ESSA= 0.2, γ = 0.3, σcr = 130 kPa,γh = 0.02, εh = 15× 10−10s−1.
or basal melting intensified within basal crevasses openingsprovide reasonable explanations for a considerably lowerthreshold in this region. However, this study is not meantas a parameter-tuning exercise and the inferred parametersshould be considered with caution. Generally, for increas-ing basic enhancement factorESSA, stresses are intensifiedthroughout the ice shelf domain and thresholds are morelikely met at stress maxima. Related ice-shelf thinning is notfurther discussed here. The signal of fracture softening in icethickness is much less pronounced than in flow speeds. Acomparison to the damage effect patterns inferred by inversemethods from observed surface velocities (Borstad et al.,2012, Fig. 1d) indicates a good match along the margins ofLarsen B ice shelf and in the vicinity of its inlets. However,this pattern reveals the macroscopic effect of damage withina short time period, while certain fractured regions may bedynamically inactive.
In our study we used the von-Mises criterion, which iden-tifies preferably fracture initiation in shear regions. Theseregions coincide with observed fracture features at the iceshelf surface (Fig. 6), but crevasse bands in rather tensileflow regimes are not well reproduced. We have shown thatmore sophisticated mixed-mode criteria based on LEFM do
not change the results significantly, at least for large-scalesimulations of ice shelves. Since tensile crevassing occurspredominantly in pre-fractured ice, we do not distinguish be-tween the particular failure behavior and assume a smoothtransition of ductile to brittle fracturing. In the present formu-lation we account for horizontal interactions simply parame-terized by a factor(1− φ) in Eq. (2), bounding the evolvingfracture density. However, this integrated view neglects thevertical extent and possibly non-linear interactions of basaland surface crevasses (McGrath et al., 2012b, a; Luckmanet al., 2012; Vaughan et al., 2012). In fact, resolving thevertical dimension of fracturing is relevant in understandingfracture interaction and calving and needs to be specified inan expanded formulation of the fracture density. To give anexample, tensile crevasse formation at the ice-shelf bottomtriggered by vertical bending at the grounding line (Loganet al., 2013) cannot be captured by shallow approximationmodels. Contribution of such processes may be consideredas boundary conditions,φ0, in future studies. Consideringthe involved vertical bending stresses, tidal flexure seem toplay a secondary role.
With origin in the fracture formation areas, elongated dam-age bands often reach far downstream towards the front.
The Cryosphere, 8, 587–605, 2014 www.the-cryosphere.net/8/587/2014/

T. Albrecht and A. Levermann: Fracture-induced softening in ice dynamics 601
a) 1km b) 2km c) 5km
Fig. 11. Calculated fracture density in the Filchner Ice Shelf for varied resolutions 1 km, 2 km and 5 km from left to right. In the lowerpanels values of observed and calculated ice speed as well as the corresponding fracture density are plotted along the indicated cross section.Parameters same as in Fig.10.
Viscosity is reduced along these confined fractured zones as-suming a linear relationship, comprising all relevant soften-ing processes. This procedure mimics a partial mechanicaldecoupling of the separated regions and reproduces a cou-ple of observed flow characteristics: fast-flowing units of theice shelf pass by stagnant ice shelf regions in minor sidebays (Figs.9 and 12) or get sutured together with neigh-boring flow units of different speed. This can be identifiedby jumps or kinks in ice-speed cross sections (Figs.8 and10). Ice-stream inlets shearing along the rocky fjord wallsaccelerate when the main flow gets partly detached from thesticky margins (Fig.9). Similar effects are observed withinsmall ice shelves shearing along islands or ice rises. Alongthese fractured zones of weakness transversal stresses cannotbe transferred effectively leading to increased speed and lessbuttressing.
This prognostic fracture-density approach might be ex-panded, especially regarding the application to grounded icestreams as well as to the coupling of the evolving fracturedensity in an enhanced calving scheme. A natural link ex-ists already in the given framework between fracture-inducedmodification of internal stresses and the strain-rate-basedcalving scheme (Levermann et al., 2012), but this is beyondthe scope of this study.
7 Conclusions
We developed a phenomenological scalar fracture-densityevolution model coupled to viscous-creep deformation inshallow approximation. This formulation, based on first-order assumptions as simplified version of the more generalcontinuum damage model, captures the gross interactionsof flow dynamics and fracture processes. The aim of thisstudy is to represent characteristic ice-flow behavior at themacroscale and to roughly constrain involved parameters us-ing satellite data. Its implementation into a conventional icesheet and ice shelf model is straight forward. An enhancedtransport scheme improves the representation of the fracture-density advection. This framework provides a basis for morerigorous formulations requiring more detailed experimentallaboratory and field data for model validation. Furthermorethe fracture-density approach provides a spatial and tempo-ral link between local fracture initiation and post-formationprocesses occurring on the large scale and eventually locatedelsewhere. Rift propagation and calving would be examplesof such phenomena. Hence, the structural integrity and sta-bility of key regions, buttressing the ice flow, can be evalu-ated in a more realistic manner and potential contributions toglobal sea level can be assessed with more confidence.
www.the-cryosphere.net/8/587/2014/ The Cryosphere, 8, 587–605, 2014
602 T. Albrecht and A. Levermann: Fracture-induced softening in ice dynamics
yryr
a) b) c)
d) e) f )
Fig. 12.Observed surface speed of the years 1997 to 2000 as well as calculated fracture density and ice speed in the Larsen B ice shelf(a–c).Point-by-point correlation of calculated and observed ice velocities in the lower left panel (light blue for constant enhancement factor andviolet with fracture softening).(e–f) demonstrate the effect of the coupled fracture density on the calculated ice speed (cf. light blue, dashedand violet) compared to observed speeds (green) along the indicated transverse section (violet arrow) and longitudinal section (brown arrow).Parameters: FESOM-melting factor 0.2,ESSA= 1.0, γ = 1.0, σcr = 60 kPa,γh = 2.0, εh = 6× 10⁻¹⁰s−1.
Supplementary material related to this article isavailable online athttp://www.the-cryosphere.net/8/587/2014/tc-8-587-2014-supplement.zip.
Acknowledgements.We thank E. Bueler, C. Khroulev andD. Maxwell (University of Alaska, USA) for a great collabora-tion and technical assistance with the Parallel Ice Sheet Model(PISM), development of which is supported by NASA grantsNNX09AJ38C, NNX13AM16G, and NNX13AK27G. We aregrateful for stimulating discussions with G. Jouvet. We also thankM. Mengel for preprocessing various data sets. R. Timmermannkindly provided FESOM sub-shelf melting data and N. Glasserdetailed observational surface feature maps of the Larsen iceshelves. Ultimately, we appreciate the very constructive reviewcomments by J. Bassis, C. Borstad and an anonymous referee,which essentially improved the manuscript. T. Albrecht was fundedby the German National Merit Foundation (Studienstiftung desdeutschen Volkes).
Edited by: E. Larour
References
Albrecht, T. and Levermann, A.: Fracture field forlarge-scale ice dynamics, J. Glaciol., 58, 165–176,doi:10.3189/2012JoG11J191, 2012.
Bamber, J. L. and Aspinall, W. P.: An expert judgement assessmentof future sea level rise from the ice sheets, Nat. Clim. Change, 3,424–427, doi:10.1038/nclimate1778, 2013.
Bamber, J. L., Riva, R. E. M., Vermeersen, B. L. A., and LeBrocq,A. M.: Reassessment of the Potential Sea-Level Rise from a Col-lapse of the West Antarctic Ice Sheet, Science, 324, 901–903,doi:10.1126/science.1169335, 2009.
Bassis, J. N.: The statistical physics of iceberg calving and the emer-gence of universal calving laws, J. Glaciol., 57, 3–16, 2011.
Bassis, J. N. and Jacobs, S.: Diverse calving patterns linkedto glacier geometry, Nat. Geosci., advance online publication,doi:10.1038/ngeo1887, 2013.
Bassis, J. N., Fricker, H. A., Coleman, R., and Minster, J. B.: Aninvestigation into the forces that drive ice-shelf rift propagationon the Amery Ice Shelf, East Antarctica, J. Glaciol., 54, 17–27,2008.
Benn, D. I., Warren, C. R., and Mottram, R. H.: Calving processesand the dynamics of calving glaciers, Earth-Sci. Rev., 82, 143–179, 2007.
The Cryosphere, 8, 587–605, 2014 www.the-cryosphere.net/8/587/2014/
T. Albrecht and A. Levermann: Fracture-induced softening in ice dynamics 603
Borstad, C. P., Khazendar, A., Larour, E., Morlighem, M., Rignot,E., Schodlok, M. P., and Seroussi, H.: A damage mechanics as-sessment of the Larsen B ice shelf prior to collapse: Toward aphysically-based calving law, Geophys. Res. Lett., 39, L18502,doi:10.1029/2012GL053317, 2012.
Borstad, C. P., Rignot, E., Mouginot, J., and Schodlok, M. P.: Creepdeformation and buttressing capacity of damaged ice shelves:theory and application to Larsen C ice shelf, The Cryosphere,7, 1931–1947, doi:10.5194/tc-7-1931-2013, 2013.
Bueler, E. and Brown, J.: Shallow shelf approximation as a “slidinglaw” in a thermomechanically coupled ice sheet model, J. Geo-phys. Res., 114, F03008, doi:10.1029/2008JF001179, 2009.
Cazenave, A. and Llovel, W.: Contemporary sea level rise, AnnualReview of Marine Science, 2, 145–173, 2010.
Church, J., White, N., Konikow, L., Domingues, C., Cogley, J.,Rignot, E., Gregory, J., van den Broeke, M., Monaghan, A.,and Velicogna, I.: Revisiting the Earth’s sea-level and energybudgets from 1961 to 2008, Geophys. Res. Lett., 38, L18601,doi:10.1029/2011GL048794, 2011.
Cook, A. J. and Vaughan, D. G.: Overview of areal changes of theice shelves on the Antarctic Peninsula over the past 50 years, TheCryosphere, 4, 77–98, doi:10.5194/tc-4-77-2010, 2010.
Duddu, R. and Waisman, H.: A temperature dependent creep dam-age model for polycrystalline ice, Mech. Mater., 46, 23–41,doi:10.1016/j.mechmat.2011.11.007, 2012a.
Duddu, R. and Waisman, H.: A nonlocal continuum damage me-chanics approach to simulation of creep fracture in ice sheets,Comput. Mech., 51, 961–974, doi:10.1007/s00466-012-0778-7,2012b.
Duddu, R., Bassis, J. N., and Waisman, H.: A numerical investi-gation of surface crevasse propagation in glaciers using nonlo-cal continuum damage mechanics: AN INVESTIGATION OFCREVASSE PROPAGATION, Geophys. Res. Lett., 40, 3064–3068, doi:10.1002/grl.50602, 2013.
Dupont, T. K. and Alley, R. B.: Assessment of the importance ofice-shelf buttressing to ice-sheet flow, Geophys. Res. Lett., 32,L04503, doi:10.1029/2004GL022024, 2005.
Erdogan, F. and Sih, G.: On the crack extension in plates underplane loading and transverse shear, J. Basic Eng., 85, 519–527,1963.
Fretwell, P., Pritchard, H. D., Vaughan, D. G., Bamber, J. L., Bar-rand, N. E., Bell, R., Bianchi, C., Bingham, R. G., Blankenship,D. D., Casassa, G., Catania, G., Callens, D., Conway, H., Cook,A. J., Corr, H. F. J., Damaske, D., Damm, V., Ferraccioli, F., Fors-berg, R., Fujita, S., Gim, Y., Gogineni, P., Griggs, J. A., Hind-marsh, R. C. A., Holmlund, P., Holt, J. W., Jacobel, R. W., Jenk-ins, A., Jokat, W., Jordan, T., King, E. C., Kohler, J., Krabill,W., Riger-Kusk, M., Langley, K. A., Leitchenkov, G., Leuschen,C., Luyendyk, B. P., Matsuoka, K., Mouginot, J., Nitsche, F. O.,Nogi, Y., Nost, O. A., Popov, S. V., Rignot, E., Rippin, D. M.,Rivera, A., Roberts, J., Ross, N., Siegert, M. J., Smith, A. M.,Steinhage, D., Studinger, M., Sun, B., Tinto, B. K., Welch, B.C., Wilson, D., Young, D. A., Xiangbin, C., and Zirizzotti, A.:Bedmap2: improved ice bed, surface and thickness datasets forAntarctica, The Cryosphere, 7, 375–393, doi:10.5194/tc-7-375-2013, 2013.
Glasser, N. F. and Scambos, T. A.: A structural glaciological analy-sis of the 2002 Larsen B ice-shelf collapse, J. Glaciol., 54, 3–16,2008.
Glasser, N. F., Kulessa, B., Luckman, A., Jansen, D., King, E. C.,Sammonds, P. R., Scambos, T. A., and Jezek, K. C.: Surfacestructure and stability of the Larsen C ice shelf, Antarctic Penin-sula, J. Glaciol., 55, 400–410, 2009.
Gregory, J. M., White, N. J., Church, J. A., Bierkens, M. F. P., Box,J. E., van den Broeke, M. R., Cogley, J. G., Fettweis, X., Hanna,E., Huybrechts, P., Konikow, L. F., Leclercq, P. W., Marzeion,B., Oerlemans, J., Tamisiea, M. E., Wada, Y., Wake, L. M., andvan de Wal, R. S.: Twentieth-century global-mean sea-level rise:is the whole greater than the sum of the parts?, J. Climate, 26,4467–4499, doi:10.1175/JCLI-D-12-00319.1, 2012.
Gudmundsson, G. H.: Ice-shelf buttressing and the stability of ma-rine ice sheets, The Cryosphere, 7, 647–655, doi:10.5194/tc-7-647-2013, 2013.
Habermann, M., Maxwell, D., and Truffer, M.: Reconstruction ofbasal properties in ice sheets using iterative inverse methods, J.Glaciol., 58, 795–807, doi:10.3189/2012JoG11J168, 2012.
Hanna, E., Navarro, F. J., Pattyn, F., Domingues, C. M., Fettweis,X., Ivins, E. R., Nicholls, R. J., Ritz, C., Smith, B., Tulaczyk, S.,Whitehouse, P. L., and Zwally, H. J.: Ice-sheet mass balance andclimate change, Nature, 498, 51–59, doi:10.1038/nature12238,2013.
Hulbe, C. L., LeDoux, C., and Cruikshank, K.: Propagation of longfractures in the Ronne Ice Shelf, Antarctica, investigated usinga numerical model of fracture propagation, J. Glaciol., 56, 459–472, 2010.
Humbert, A.: Numerical simulations of the ice flow dynamics ofFimbulisen, in: FRISP Report, Vol. 17, 2006.
Humbert, A., Kleiner, T., Mohrholz, C. O., Oelke, C., Greve, R.,and Lange, M. A.: A comparative modeling study of the BruntIce Shelf/Stancomb-Wills Ice Tongue system, East Antarctica, J.Glaciol., 55, 53–65, 2009.
Jansen, D., Kulessa, B., Sammonds, P. R., Luckman, A., King, E.,and Glasser, N. F.: Present stability of the Larsen C ice shelf,Antarctic Peninsula, J. Glaciol., 56, 593–600, 2010.
Jansen, D., Luckman, A., Kulessa, B., Holland, P. R., and King,E. C.: Marine ice formation in a suture zone on the Larsen C IceShelf and its influence on ice shelf dynamics: Marine Ice Impacton Ice Shelf Dynamics, J. Geophys. Res.-Earth, 118, 1628–1640,doi:10.1002/jgrf.20120, 2013.
Jezek, K. C., Farness, K., Carande, R., Wu, X., and Labelle-Hamer, N.: RADARSAT 1 synthetic aperture radar observationsof Antarctica: Modified Antarctic Mapping Mission, 2000, RadioSci., 38, 8067, doi:10.1029/2002RS002643, 2003.
Joughin, I. and Alley, R. B.: Stability of the West Antarc-tic ice sheet in a warming world, Nat. Geosci., 4, 506–513,doi:10.1038/ngeo1194, 2011.
Khazendar, A., Rignot, E., and Larour, E.: Larsen B Ice Shelf rhe-ology preceding its disintegration inferred by a control method,Geophys. Res. Lett., 34, L19503, doi:10.1029/2007GL030980,2007.
Le Brocq, A. M., Payne, A. J., and Vieli, A.: An improvedAntarctic dataset for high resolution numerical ice sheetmodels (ALBMAP v1), Earth Syst. Sci. Data, 2, 247–260,doi:10.5194/essd-2-247-2010, 2010.
Levermann, A., Bamber, J. L., Drijfhout, S., Ganopolski, A., Hae-berli, W., Harris, N. R. P., Huss, M., Krüger, K., Lenton, T. M.,Lindsay, R. W., Notz, D., Wadhams, P., and Weber, S.: Potential
www.the-cryosphere.net/8/587/2014/ The Cryosphere, 8, 587–605, 2014
604 T. Albrecht and A. Levermann: Fracture-induced softening in ice dynamics
climatic transitions with profound impact on Europe, Clim.Change, 110, 845–878 doi:10.1007/s10584-011-0126-5, 2011.
Levermann, A., Albrecht, T., Winkelmann, R., Martin, M. A.,Haseloff, M., and Joughin, I.: Kinematic first-order calving lawimplies potential for abrupt ice-shelf retreat, The Cryosphere, 6,273–286, doi:10.5194/tc-6-273-2012, 2012.
Levermann, A., Clark, P. U., Marzeion, B., Milne, G. A., Pol-lard, D., Radic, V., and Robinson, A.: The multimillennialsea-level commitment of global warming, P. Natl. Acad. Sci.,doi:10.1073/pnas.1219414110, 2013.
Logan, L., Catania, G., Lavier, L., and Choi, E.: A novel methodfor predicting fracture in floating ice, J. Glaciol., 59, 750–758,doi:10.3189/2013JoG12J210, 2013.
Luckman, A., Jansen, D., Kulessa, B., King, E. C., Sammonds, P.,and Benn, D. I.: Basal crevasses in Larsen C Ice Shelf and impli-cations for their global abundance, The Cryosphere, 6, 113–123,doi:10.5194/tc-6-113-2012, 2012.
Lythe, M. B., Vaughan, D. G., Lythe, M. B., Vaughan, D. G., andthe BEDMAP Consortium: BEDMAP: A new ice thickness andsubglacial topographic model of Antarctica, J. Geophys. Res.,106, 11335–11351, 2001.
Ma, Y., Gagliardini, O., Ritz, C., Gillet-Chaulet, F., Durand, G., andMontagnat, M.: Enhancement factors for grounded ice and iceshelves inferred from an anisotropic ice-flow model, J. Glaciol.,56, 805–812, doi:10.3189/002214310794457209, 2010.
MacAyeal, D. and Sergienko, O. V.: The flexural dynam-ics of melting ice shelves, Ann. Glaciol., 54, 1–10,doi:10.3189/2013AoG63A2562013.
MacAyeal, D. R., Scambos, T. A., Hulbe, C. L., and Fahnestock,M. A.: Catastrophic ice-shelf break-up by an ice-shelf-fragment-capsize mechanism, J. Glaciol., 49, 22–36, 2003.
McGrath, D., Steffen, K., Rajaram, H., Scambos, T., Ab-dalati, W., and Rignot, E.: Basal crevasses on the LarsenC Ice Shelf, Antarctica: Implications for meltwater pond-ing and hydrofracture, Geophys. Res. Lett., 39, L16504,doi:10.1029/2012GL052413, 2012a.
McGrath, D., Steffen, K., Scambos, T., Rajaram, H., Casassa,G., and Lagos, J.: Basal crevasses and associated sur-face crevassing on the Larsen C ice shelf, Antarctica, andtheir role in ice-shelf instability, Ann. Glaciol., 58, 10–18,doi:10.3189/2012AoG60A005, 2012b.
Nye, J. F.: The distribution of stress and velocity in glaciers andice-sheets, P. Roy. Soc. Lond. A Mat., 239, 113–133, 1957.
Plate, C., Müller, R., Humbert, A., and Gross, D.: Evaluation of thecriticality of cracks in ice shelves using finite element simula-tions, The Cryosphere, 6, 973–984, doi:10.5194/tc-6-973-2012,2012.
Pralong, A. and Funk, M.: Dynamic damage model of crevasseopening and application to glacier calving, J. Geophys. Res., 110,B01309, doi:10.1029/2004JB003104, 2005.
Press, W. H., Teukolsky, S. A., Vetterling, W. T., and Flannery, B. P.:Numerical recipes in C++: the art of scientific computing, Vol.994, Cambridge University Press Cambridge, 2009.
Pritchard, H. D., Ligtenberg, S. R. M., Fricker, H. A., Vaughan,D. G., van den Broeke, M. R., and Padman, L.: Antarctic ice-sheet loss driven by basal melting of ice shelves, Nature, 484,502–505, doi:10.1038/nature10968, 2012.
Rack, W. and Rott, H.: Pattern of retreat and disintegration of theLarsen B ice shelf, Antarctic Peninsula, Ann. Glaciol., 39, 505–510, 2004.
Rignot, E., Casassa, G., Gogineni, P., Krabill, W., Rivera, A., andThomas, R.: Accelerated ice discharge from the Antarctic Penin-sula following the collapse of Larsen B ice shelf, Geophys. Res.Lett, 31, L18401, doi:10.1029/2004GL020697, 2004.
Rignot, E., Mouginot, J., and Scheuchl, B.: Ice Flowof the Antarctic Ice Sheet, Science, 333, 1427–1430,doi:10.1126/science.1208336, 2011a.
Rignot, E., Velicogna, I., van den Broeke, M. R., Monaghan, A., andLenaerts, J.: Acceleration of the contribution of the Greenlandand Antarctic ice sheets to sea level rise, Geophys. Res. Lett., 38,L05503, doi:10.1029/2011GL046583, 2011b.
Rignot, E., Jacobs, S., Mouginot, J., and Scheuchl, B.: IceShelf Melting Around Antarctica, Science, 341, 266–270,doi:10.1126/science.1235798, 2013.
Rist, M. A., Sammonds, P. R., Murrell, S. A. F., Meredith, P. G.,Doake, C. S. M., Oerter, H., and Matsuki, K.: Experimental andtheoretical fracture mechanics applied to Antarctic ice fractureand surface crevassing, J. Geophys. Res., 104, 2973–2987, 1999.
Rist, M. A., Sammonds, P. R., Oerter, H., and Doake, C. S. M.:Fracture of Antarctic shelf ice, J. Geophys. Res., 107, ECV 2-1–ECV 2-13, doi:10.1029/2000JB000058, 2002.
Rott, H., Müller, F., Nagler, T., and Floricioiu, D.: The imbalanceof glaciers after disintegration of Larsen-B ice shelf, AntarcticPeninsula, The Cryosphere, 5, 125–134, doi:10.5194/tc-5-125-2011, 2011.
Saheicha, K., Sandhäger, H., and Lange, M. A.: Modelling theFlow Regime of Filchner-Schelfeis, in: FRISP Report, 14, 58–62, 2006.
Sandhäger, H.: Numerical study on the influence of fractures andzones of weakness on the flow regime of Larsen Ice Shelf, in:FRISP Report, vol. 14, 2003.
Sandhäger, H., Rack, W., and Jansen, D.: Model investigations ofLarsen B Ice Shelf dynamics prior to the breakup, in: FRISP Re-port, Vol. 16, 5–7, 2005.
Scambos, T. A., Hulbe, C., Fahnestock, M., and Bohlander, J.: Thelink between climate warming and break-up of ice shelves in theAntarctic Peninsula, J. Glaciol., 46, 516–530, 2000.
Scambos, T. A., Hulbe, C., and Fahnestock, M.: Climate-inducedice shelf disintegration in the Antarctic Peninsula, Antarct. Res.Ser., 79, 79–92, 2003.
Scambos, T. A., Haran, T., Fahnestock, M., Painter, T.,and Bohlander, J.: MODIS-based Mosaic of Antarctica(MOA) data sets: Continent-wide surface morphology andsnow grain size, Remote Sens. Environ., 111, 242–257,doi:10.1016/j.rse.2006.12.020, 2007.
Scambos, T. A., Fricker, H. A., Liu, C. C., Bohlander, J., Fastook,J., Sargent, A., Massom, R., and Wu, A. M.: Ice shelf disintegra-tion by plate bending and hydro-fracture: Satellite observationsand model results of the 2008 Wilkins ice shelf break-ups, EarthPlanet. Sc. Lett., 280, 51–60, 2009.
Schulson, E. M. and Duval, P.: Creep and Fracture of Ice, Cam-bridge University Press, The Edinburgh Building, CambridgeCB2 8RU, UK, 416 pp., 2009.
Shepherd, A., Ivins, E. R., A, G., Barletta, V. R., Bentley, M. J., Bet-tadpur, S., Briggs, K. H., Bromwich, D. H., Forsberg, R., Galin,N., Horwath, M., Jacobs, S., Joughin, I., King, M. A., Lenaerts, J.
The Cryosphere, 8, 587–605, 2014 www.the-cryosphere.net/8/587/2014/

T. Albrecht and A. Levermann: Fracture-induced softening in ice dynamics 605
T. M., Li, J., Ligtenberg, S. R. M., Luckman, A., Luthcke, S. B.,McMillan, M., Meister, R., Milne, G., Mouginot, J., Muir, A.,Nicolas, J. P., Paden, J., Payne, A. J., Pritchard, H., Rignot, E.,Rott, H., Sørensen, L. S., Scambos, T. A., Scheuchl, B., Schrama,E. J. O., Smith, B., Sundal, A. V., Angelen, J. H. v., Berg, W. J.v. d., Broeke, M. R. v. d., Vaughan, D. G., Velicogna, I., Wahr,J., Whitehouse, P. L., Wingham, D. J., Yi, D., Young, D., andZwally, H. J.: A Reconciled Estimate of Ice-Sheet Mass Balance,Science, 338, 1183–1189, doi:10.1126/science.1228102, 2012.
Shyam Sunder, S. and Wu, M. S.: Crack nucleation due to elasticanisotropy in polycrystalline ice, Cold Reg. Sci. Technol., 18,29–47, 1990.
Timmermann, R. and Hellmer, H. H.: Southern Ocean warming andincreased ice shelf basal melting in the twenty-first and twenty-second centuries based on coupled ice-ocean finite-element mod-elling, Ocean Dynam., 63, 1011–1026, doi:10.1007/s10236-013-0642-0, 2013.
Timmermann, R., Wang, Q., and Hellmer, H.: Ice shelf basal melt-ing in a global finite-element sea ice/ice shelf/ocean model, Ann.Glaciol., 53, 303–314, doi:10.3189/2012AoG60A156, 2012.
Van den Broeke, M. R., Bamber, J., Lenaerts, J., and Rignot, E.:Ice Sheets and Sea Level: Thinking Outside the Box, Surv. Geo-phys., 32, 495–505, doi:10.1007/s10712-011-9137-z, 2011.
Van der Veen, C. J.: Fracture mechanics approach to penetration ofsurface crevasses on glaciers, Cold Reg. Sci. Technol., 27, 31–47,1998a.
Van der Veen, C. J.: Fracture mechanics approach to penetration ofbottom crevasses on glaciers, Cold Reg. Sci. Technol., 27, 213–223, 1998b.
Van der Veen, C. J.: Fracture propagation as means of rapidly trans-ferring surface meltwater to the base of glaciers, Geophys. Res.Lett., 34, L01501, doi:10.1029/2006GL028385, 2007.
Vaughan, D. G.: Relating the occurrence of crevasses to surfacestrain rates, J. Glaciol., 39, 255–266, 1993.
Vaughan, D. G., Corr, H. F. J., Bindschadler, R. A., Dutrieux, P.,Gudmundsson, G. H., Jenkins, A., Newman, T., Vornberger, P.,and Wingham, D. J.: Subglacial melt channels and fracture in thefloating part of Pine Island Glacier, Antarctica, J. Geophys. Res.,117, F03012, doi:10.1029/2012JF002360, 2012.
Vieli, A., Payne, A. J., Du, Z., and Shepherd, A.: Numericalmodelling and data assimilation of the Larsen B ice shelf,Antarctic Peninsula, Philos. T. R. Soc. A, 364, 1815–1839,doi:10.1098/rsta.2006.1800, 2006.
Vieli, A., Payne, A. J., Shepherd, A., and Du, Z.: Causes of pre-collapse changes of the Larsen B ice shelf: Numerical modellingand assimilation of satellite observations, Earth Planet. Sc. Lett.,259, 297–306, 2007.
von Mises, R.: Mechanik der festen Körper im plastisch de-formablen Zustand, Göttin. Nachr. Math. Phys, 1, 582–592,1913.
Walker, C. C., Bassis, J. N., Fricker, H. A., and Czerwin-ski, R. J.: Structural and environmental controls on Antarc-tic ice shelf rift propagation inferred from satellite monitoring:Antarctic Ice Shelf Rifting, J. Geophys. Res.-Earth, 118, 1–11,doi:10.1002/2013JF002742, 2013.
Weertman, J.: Can a water-filled crevasse reach the bottom surfaceof a glacier, IASH Publ., 95, 139–145, 1973.
Winkelmann, R., Martin, M. A., Haseloff, M., Albrecht, T., Bueler,E., Khroulev, C., and Levermann, A.: The Potsdam ParallelIce Sheet Model (PISM-PIK) – Part 1: Model description, TheCryosphere, 5, 715–726, doi:10.5194/tc-5-715-2011, 2011.
Winkelmann, R., Levermann, A., Martin, M. A., and Frieler, K.:Increased future ice discharge from Antarctica owing to highersnowfall, Nature, 492, 239–242, doi:10.1038/nature11616, 2012.
www.the-cryosphere.net/8/587/2014/ The Cryosphere, 8, 587–605, 2014