FRACTOGRAPHIC - Defense Technical Information …dtic.mil/dtic/tr/fulltext/u2/715751.pdfagainst a...
48
ItS. t
Transcript of FRACTOGRAPHIC - Defense Technical Information …dtic.mil/dtic/tr/fulltext/u2/715751.pdfagainst a...
ItS.
t

A FRACTOGRAPHIC STUDY OF THE FATIGUE FAILURE
OF AIRCRAFT WHEELS
by
W. Wiebe
A. H. Hall, Head F. P. ThurstonStructures & Materials Laboratory Director

1.
SUMMARY
A survey of aircraft wheel failures, and a review
of the parameters involved in the qualification tests for
aircraft wheels, have indicated a need for accurate information
concerning wheel service loading conditions in order to
formulate realistic wheel fatigue test spectra. The fractographic
examination of three types of wheels from modern aircraft has
emphasized the significance of corrosion in the nucleation of
fatigue cracks, and has indicated that landing impact loads
and brake applications at high speeds may contribute to the
growth of the cracks.
Several types of macroscopic growth "bands" or "lines"
that are frequently observed on the fatigue fracture surfaces
of laboratory specimens and of comoonents that have failed in
service, have been cited and described. Those lines observed
on the fracture surfaces of the failed wheels were correlated
with crack growth during aircraft "landing cycles". The
derivation of fatigue crack growth rate information from these
lines has facilitated the revision of wheel inspection schedules
with the purpose of preventing the catastrophic failure of aircraft
wheels.

2.
TABLE OF CONTENTS
Summar~y
Tab les
Tilustrati ons
1.0 Introduction
..U -ta-oozrahic Fleatures of Fatigue Failures Resultingfrom Repetitive Sequential Loading.
2.1 Fracture Surface Topography of Bands Formed inLaboratory Specimens.
2.2.1 Aluminum Alloy Spar of a Light TransportAircraft.
2.1.2 Steel Bolt Fatigue Specimen.
2.2 Fracture Surface Topography of Bands Formed inService Fatigue Failures.
2.2.1 Helicopter Rotor Blade Cuff Assembly.
3.0 The Fractographic Analysis of Aircraft Wheels.
3.1 Fatigue Crack Initiation.
3.2 Crack Progression Lines.
3.2.1 Aircraft "Landing Cycle"
3.2.2 Interpretation of the Microscopic Aspectsof Crack Progression Line Topography.
3.3 Quantitative Crack Propagation Analysis of AircraftWheels.
3.3.1 Type "A" Wheel.
3.3.2 Type "B" Wheels.
3.3.3 Type "C" Wheel
4.0 Concluding Remarks.
5.0 Acknowledgements
6.0 References
TABLES
I Line Count Derivation - Type "A" Wheel.
, -l• | I i ° I UI

3.
ILLUSTRATIONS
Figure
Banded structure on fracture surf opc -f alaboratory specimen subjected to reiietifivesequential loading. l(a)
Cyclic loading sequence of wing load spectrum. l(b)
Electron micrograph of the fracture surfacetopography of one macroscopic band. 2
Fracture surface of a steel bolt subjected torepetitive sequential loading. 3(a)
Repetitive loading sequence applied to steel bolt. 3(b)
Fatigue striations on bright bands of steel boltfracture surface. 4
Microvoid coalescence on dull bands of steel boltfracture surface. 5
Crack propagation history - steel bolt. 6
Regularly spaced bands on fracture surface ofspar cap in laboratory fatigue test. 7(a)
Randomly spaced lines on fatigue fracture surfaceof spar cap crack formed In service. 7(b)
Transmitted light replica macrograph of thefracture surface of failed rotor-blade tine, 8(a)
Microscopic fatigue striations on bright bands ofrotor-blade tine. 8(b)
Microvoid coalescence on dull bands of
rotor-blade tine. 8(c)
Fatigue fracture surface - wheel type "A". 9
Fatigue fracture surface - wheel type "B". 10
Enlarged view of corrosion pit, and initial fatiguefracture surface area - wheel type "A". 11
Metallographic section through corrosion pit -wheel type "A". 12

4.
Figure4
.e<-,1r(,ular area exhibitin.- corrosion in theriititinn reoIon of fatigue crack - wheel type
"t" 13
T,4ult! ,*le fatigue cracks nucleated at corrosion
plts in bend seat radius of an aircraft wheel. 14
Fatigue fracture surface - wheel type "C". 15
('rack progression lines - wheel type "ci. 16
Line spacing dAsT,;,bu% tin - wheel type "C". 17
Microscopic bands in early stages of crack growth -
wheel type "A". 18
Microscopic fracture surface topography - wheeltype "C". 19
Microscopic fatigue striations and ductile dimples -
wheel type "B". 20
Striated area on fracture surface of wheel -Type "B". 21
Fluctuation in microscopic striation spacing onfracture surface of wheel type "B". 22
Fatigue crack nucleation adjacent to brakerotor drive-blocks. 23
Crack growth history - wheel type "A". 24
Crack growth history - wheel type "B", No.1. 25
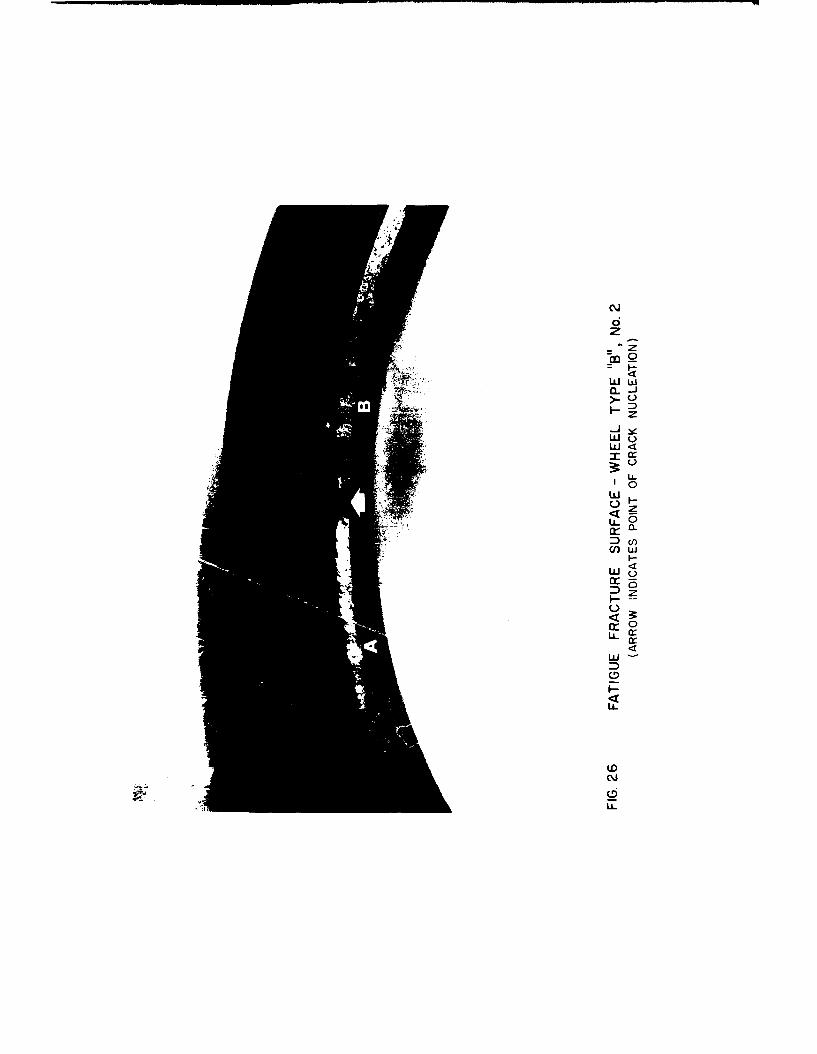
Fatigue fracture surface - wheel type "B", No.2. 26
Crack growth history -wheel type "B", No.2. 27
Crack growth history- wheel type "C". 28

5.
A FRACTOGRAPHIC STUDY
OF THE FATIGUE FAILURE OF AIRCRAFT WHEELS
1.0 INTRODUCTION
It is difficult to arrive at an accurate estimate of
the number of catastrophic wheel failures that occur on modern
aircraft, or of the number of aircraft wheels that are discarded
because excessivelv long fatigue cracks have been detected in
the wheel hubs. A recent survey t l ) of thirteen major world
airlines in which eight were able to provide information, indicated
a total of some 216 main landing gear aluminum alloy wheel
failures on one common type of commercial jet transport. Although
it was not possible to ascertain the exact period of service
covered by this survey, it is estimated that it would have
covered a period, not in excess of ten years. One of the airlines
was able to provide extremely detailed service information on
26 failed wheels, thereby presenting an informative sampling of
wheel service history for this type of aircraft. The failures
recorded over a period of approximately ten years, indicated an
average service life of 5.5 years for the failed wheels, with an
average endurance of 19,000 roll miles. The endurances ranged
from 1,835 to 39,000 roll miles. Failures occurred in both
inboard and outboard halves of the wheels, and in most instances
were attributed to fatigue. Corrosion was listed as a probable
cause of failure in five instances. The endurance ratio of 20 to 1
in roll miles to failure, suggests that in addition to the number
of roll miles, other factors probably contributed significantly
to the fatigue failure of the aircraft wheels. It is in part,
the purpose of this paper to determine, with the aid of
fractography, the nature of some of these parameters, and how
they may affect the life of the wheels.
There is an apparent dearth of information concerning
well-tailored, realistic fatigue qualification tests for aircraft
6.
., '," items in part, from the fact that
.. : ".t. c-,ndered to fall within the categoryS: :, r,!t tru(-ture. This Is understandable when it
1- . .. t -at;:i::1;ronhi c fal lure of a single wheel on a
i I r m.it n .e-wh<e1 undercarriage assemb]y does not, as a
,-.e :t thre-it to the safety of the pass;engers, crew, or
t1 ,- I ,-raft -is a whole. However, incidents of damage to jet
O,, Ine 'celles by flying pieces of metnl from shattered wheels,
,In.:t-ices of fatal injury to ground oersonnel in the vicinitys!: the aircraft when catastrophic wheel failure occurred, and
lnl,-ec tion of rubber from concurrent tire failures, into rear-
mounted jet engLnes, have proven to be costly and highly
undesirable. In addition, down-time of the aircraft as a result
of wheel failure, particularly if failure occurs at an airport
without ready repair facilities, - not to mention the cost of
replacement wheels and tires, all represent expense to the
airline operator. Therefore it seems prudent to examine the
circumstances surrounding wheel failures somewhat more closely
in order to determine if prescribed wheel qualification tests
for modern aircraft are adequately representative of service
conditions.
Available information suggests that current fatigue
qualificaLion tests for aircraft wheels consist essentially of
roll tests under maximum static load. The minimum requirements,
stipulated for the "Roll Test" in the Aerospace Standard (2) for
"Wheels and Brakes for Civil Aircraft Applications" state: "Wheel
with tire installed shall withstand, without failure or
development of cracks a roll life sp-cified, under a load not
less than the maximum static rating of the wheel". The specified
roll distance is 1000 miles. The requirements appear to be
somewhat flexible in that they further stipulate that where a
longer service life is required, a roll test of greater duration
7.
may be undertaken, and the exact conditions of test would be
determined b! agreement between the aircraf't nnd wheelmanufacturers. No apparent con-i (Ierato iri bueeJi. JLvC; ta
the adverse effects of such narameterrsat" landinr impnact loads,
stresses in the wheel hubs due to brake anr Ii etton, nrllni side
loads, and excess tire pressure to nsme a fe,. Rehr and
Campbell (1965) (3 ) state categoricall! that "Purrentl]g, no
satisfactory method is available for evalunting the influence
of metallurgical and environmental factors on the roll life of
aircraft wheels. Service experience cannot be used effectively
because necessary associated information is incomplete or
non-existent".
Other specifications (1967) (4 ) require a complete static
and dynamic analysis of wheel loads from which a loading spectrum
is to be prepared. A complete stress analysis for all fatigue
and static loads on all major components of the test wheel or
wheel-brake assembly is also required. However, the required"roll test", which is intended to be an "index of the anticinated
service fatigue life of the wheel", consists of a series of
landings, or a continuous roll of the tire and wheel assembly
against a rotating flywheel. No reference is made to the loading
spectrum culminating from the dynamic analysis referred to
earlier. The minimum requirements are stipulated as 1,500 miles
at a load not less than that encountered on the aircraft at
maximum taxi gross weight.
More recently (1968)( 5 )" efforts appear to have been
directed towards the establishment of more realistic wheel test
load spectra by instrumentation of a Comet undercarriage in
order to determine the nature of wheel, axle and undercarriage
stresses generated by the limits of ground manoeuvring. Theexamination of failed aircraft wheels in this laboratory

8.
•,"L.. !*,, . need for more realistic test load spectra
' i 'i,'i1t w.'heelI, n that the fractographic findings have
'i.*tr-ited that :substantial fatigue damage may result from
I -,liIin:-, I pact stresoes and brake application. To date,
!:,rameters such as those have not been adequately catered for under
the conventional "roll test" qualif:Teation requirements.
Modern jet airliners, having ground speeds of up to
250 miles per hour ( 5 ) are subjected to severe dynamic loads
on landing. The tires absorb much of the landing impact energy.
With tire inflation pressures ranging from 150 to 200 lb./in.2 ,
:ind tire deflections as high as 32 to 35 percent, due to landing
impact, fatigue failures of aircraft wheel hubs in or adjacent
to the tire bead seat radius appear to reflect the repeated
outward flange bending loads that result from these high tire
deflections. This view is substantiated to a considerable extent
by fieactographic studies of aircraft wheels that have failed in
service. Here, macroscopic growth bands, on the fracture surfaces,
frequently exhibit areas of ductile dimples amid regions of
conventional fatigue striations when viewed in the electron
microscope. Although the striations may be associated with
cyclic stresses originating from wheel rotation, it is believed
that the ductile dimples indicate short bursts of rapid crack
growth corresponding to landing impact loads.
Another critical parameter to be considered in the
endurance of aircraft wheels is the tire inflation pressure.
Available Information ( 1 ) suggests that on one common commercial
jet transport the estimated wheel endurance falls from 40,000
to 10,000 roll miles when the tire inflation pressure is
Increased from 170 lb./in.2 to 190 lb./in.
2
Perhaps one of the more critical factors in the service
failures of aircraft wheels is the initiation of the fatigue
crack. Exoerience In this laboratory, in the course of the
9.
fractographic examination of a number of aircraft wheels from
several types of military and civil aircraft, indicates that in
many instances corrosion plays a significant role in the
initiation and early growth stages of fatigue cracks in the
wheels. In some instances a well-defined corrosion pit can
unequivocally be cited as the stress-raiser responsible for the
initiation of the fatigue crack. When a corrosion oit is not
so well deftned, a small lightly discoloured semi-circular
area on the fracture surface, apparently associated with
corrosion, frequently defines the region of crack initiation.
Current activities by some aircraft operators, aimed at
minimizing the formation of corrosion pits on aircraft wheels
involve the investigation of the effectiveness of new types
of protective paints. In one instance, tests involving shot
peening of the wheels after paint stripping are being conducted
in an attempt to extend the life of the wheels by inducing
compressive surface stresses. Information concerning the effect
on the life extension ot the wheels as a result of such treatments
is not, as yet, available.
Meanwhile, aircraft operators appear to be increasing
the frequency of their visual, ultrasonic, and eddy current
inspection procedures of the wheels, as the service life of
the wheels increases. In spite of these safeguards, incidents
of catastrophic wheel failures are still being reported, because
some fatigue cracks are not being detected in the early stages
of their development. Under these circumstances this laboratory
was requested to undertake a programme of fractograohic
analysis of several types of failed aircraft wheels, in an
attempt to obtain information concerning fatigue crack
propagation rates, thereby to aid in the establishment of
acceptable wheel inspection schedules. The fractographic analysis
involved the microscopic examination of the fracture surface

10.
topo.raphy of three types of aircraft wheels that had failed
In service. Tt consisted essentially of deriving counts of
the crack progression "lines" or "bands" believed to be
associated with crack growth during aircraft "landing and take-off"
sequences or "cycles". The results indicated that crack growth
rates, in terms of "number of landings" varied for different
types of wheels, - and where catastrophic wheel failure had
occurred, a marked increase in crack growth per landing was
generally evident in the later stages of crack development.
2.0 FRACTOGRAPHIC FEATURES OF FATIGUE FAILURES RESULTINGFROM REPETITIVE SEQUENTIAL LOADING
Before dealing with the quantitative fractographic
analysis of the individual wheels, it might be advantageous
to consider the microscopic fracture surface features of the
various types of macroscopic growth bands, and how they can be
utilized to educe quantitative information concerning fatigue
crack growth rates. These bands are frequently encounteredon the fracture surfaces of laboratory fatigue specimens and
components failed in service, that have been subjected to
repetitive sequential loading. Examination of the band
topography in the electron microscope indicates that the
history of the sequential load spectrum is frequently clearly
defined on the fracture surface. Thus the microscopic content
of the macroscopic bands permits accurate interpretation of
their significance in terms of cyclic loading history. Although
it is not always clear precisely why the macroscopic crack
growth bands are visible, they have been known to represent
slight alternate changes in the plane of crack propagation
due to abrupt changes in load level. In other instances, a
periodic repetition of bright and dull bands has been shown
to represent alternate changes from the conventional fatigue
mechanism (whtch is frequently accompanied by fatigue striation
formation) to a rapid fracture mode accompanied by microvoid
coalescence.

11.
2.1 Fracture Surface Topography of Bands Formed inLab orat ory Spe cimens
Two examples of laboratory fatigue specimens that
have been subjected to repetitive load spectra, serve to
illustrate the appearance of crack growth bands formed on the
fracture surface of an aluminum alloy, and a steel specimen,
and demonstrate how fatigue crack growth rates can be obtained
from counts and spacing measurements of the bands.
2.1.1 Aluminum Alloy Spar of a Light Transport Aircraft.
Figure l(a) illustrates the banded structure of the fractur(
surface typical of macroscopic topography formed in the fatigue
failure of an aluminum alloy main spar web of the wing of a
single engine aircraft. The wing, fatigue tested in the
laboratory, was subjected to the load spectrum illustrated
graphicallyin Figure l(b). Each band was formed during the
application of one load block, and represented some 20 equivalent
hours of aircraft flying time.
The electron micrograph, Figure 2, illustrates at
relatively high magnification the fracture surface topography of
one macroscopic band. The variation in fatigue striation spacing
with changes in cyclic load levels is clearly evident, and follows
the cyclic loading sequence shown in Figure l(b). The three
lower load levels of the sequence did not produce fatigue
striations, but formed a cleavage-like band at either end of
the 20-hour spectrum. This the distance between the centres of
the cleavage-like bands represents a single macroscopically
visible band corresponding to a crack growth of some 35 microns
during the application of one load block. A quantitative
determination of fatigue crack growth rates in the spar, which
involved counts of the bands on the various crack segments,
has been reported in Reference 6.
2.1.2 Steel Bolt Fatigue Specimen
Although it is not possible to generalize on the nature

12.
,ud tht, fracture mechanisms involved in the formation of the
macroscopic crack growth lines on a fracture surface, they can
nevertheless frequently be useful in determining the relationship
between the periods of crack initiation and crack propagation in
laboratory fatigue specimens. Assuming that it has been
appropriately established that a given shift in mean load,
(without change in the cyclic load amplitude), does not affect
the fatigue life of a specimen to a significant degree, such a
repetitive shift may produce macroscopic crack growth bands on the
fracture surface that are amenable to counting and spacing
measurements. In this manner, a fairly accurate crack growth rate
history can be elicited, and variations in total specimen
endurance can be ascribed to variations in crack initiation
periods, or variations in crack propagation rates from specimen
to specimen, whatever the case may be.
An example of this type of crack growth band on the
fracture surface of a steel bolt is illustrated in Figure 3(a),
and the repetitive loading sequence is sketched in Figure 3(b).
The programme was such that the peak to peak tensile load amplitude
remained constant at 15,000 lb. throughout the test, while the
minimum and maximum loads shifted from 10,000 to 25,000 lb. to
20,000 and 35,000 lb. respectively. The 1,012 cycles per load
block were divided approximately equally between the two load
levels.
It is believed that the macroscopic hands observed on
the fracture surface are initiated at that point in the programme
where the load rises from 10,000 to 35,000 lb., or where it drops
from 35,000 to 10,000 lb., - and are considered to be due to
the effect on subsequent crack growth rate, of sudden changes in
load level in an otherwise uniform cyclic load programme. The
phenomenon has been ascribed to the process of crack tip blunting
in the case of an increasing load, and resharDening of the crack
tip by reversed plastic flow when the load is suddenly decreased7 )

13.
A further detailed treatment of the effect of mixed loads, and
of the order of application of stress on fatigue damage is given
by Forsyth in Reference 8.
In the earlier stages of fatigue crack growth the nature
of the fracture surface topography was somewhat obscure. Because
of the relatively low net section stresses, the bands on the
fracture surface of the bolt were poorly defined, and their
spacing was extremely fine. Therefore it was difficult to arrive
at a firm conclusion regarding the fracture mechanisms involved
in the formation of the banded structure. However, fractographic
examination of the wider bands in the later stages of the
fatigue crack growth (under conditions of increased net section
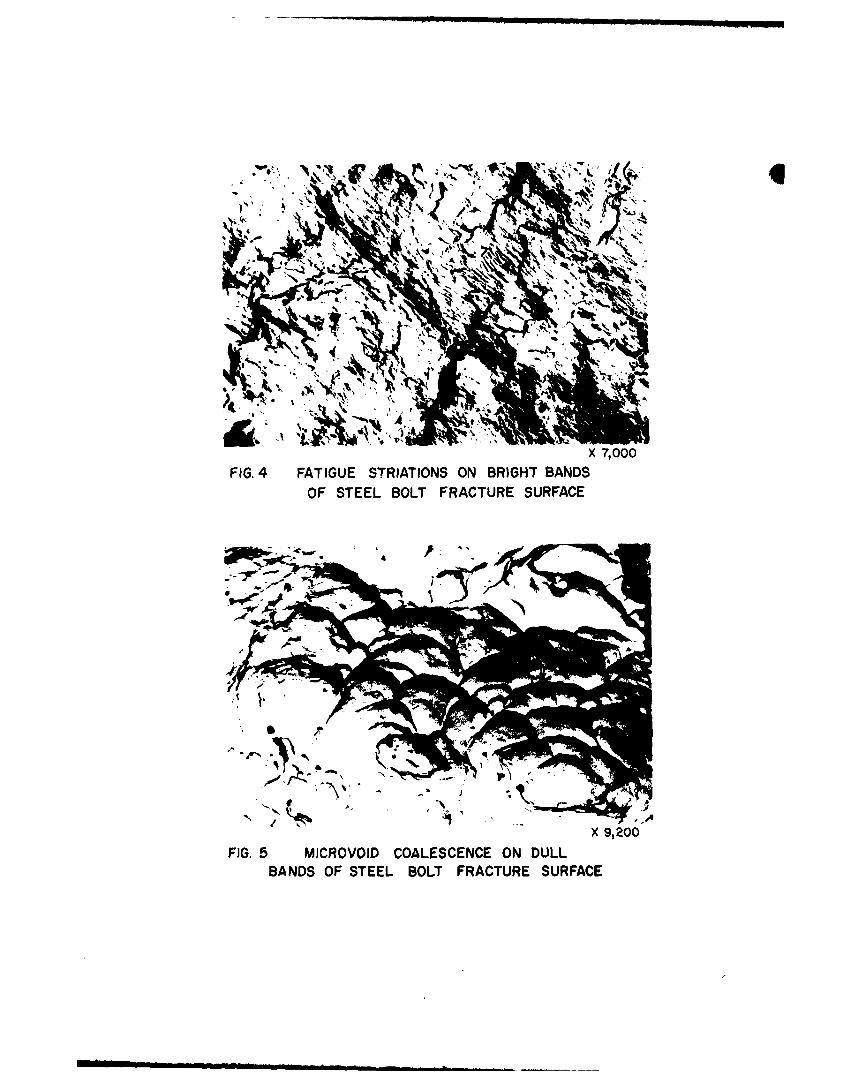
stresses), indicated that the bright bands (Figure 3(a)) were
formed by the mechanism of fatigue, as evidenced by the fatigue
striations illustrated in Figure 4.
The dull bands were formed by the mechanism of localized
ductile rupture, as indicated by the evidence of microvoid
coalescence in the electron micrograph, Figure 5. This leads
to the conclusion that as a result of the sudden change in
cyclic load level, a momentary stress state approaching the
ultimate stress level of the steel, must have existed at the
tip of the crack. Presumably, this resulted in rapid crack
growth over the width of the dull band during the short-transient
period of load level change, with subsequent reversion to the
fatigue mechanism upon re-establishment of the steady state
condition of cyclic loading.
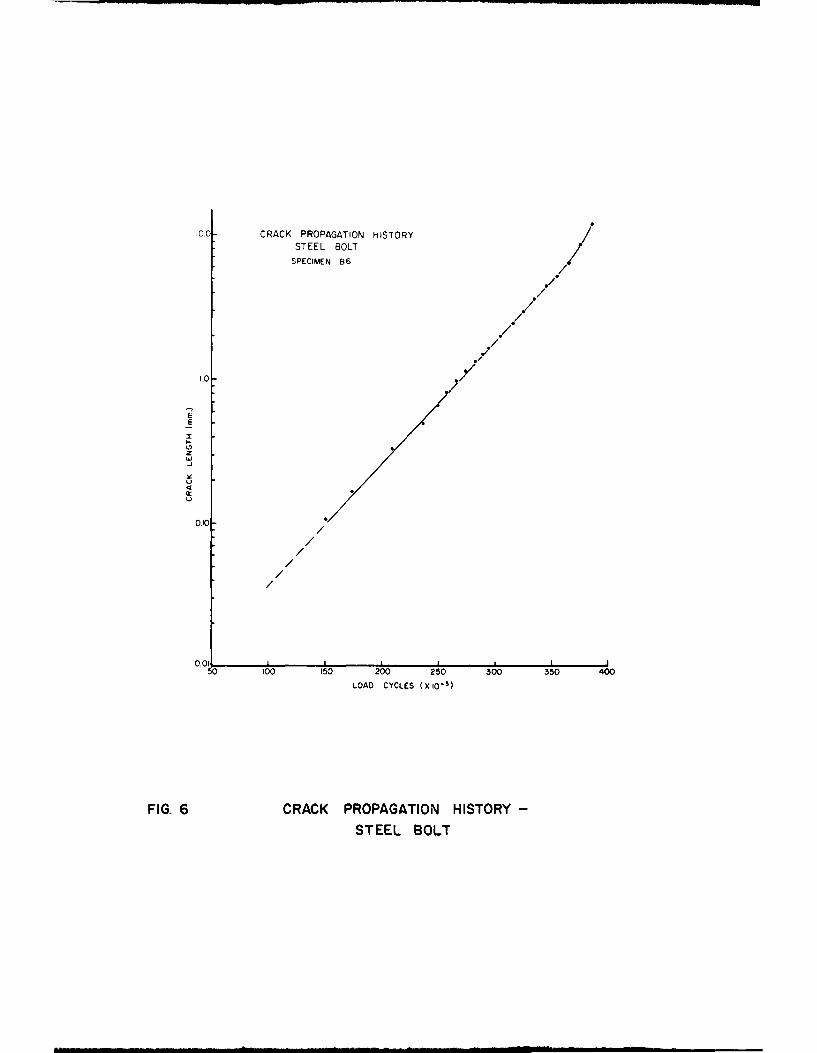
The plot of crack length as a function of the number
of load cycles shown in Figure 6, based on band counts and
spacing measurements, provides a graphic illustration of the
fatigue crack propagation history. Over the initial 0.1 mm. of
crack penetration the growth history, involving some 150,000
load cycles is somewhat obscure due to the lack of definition
of the fracture surface topography, - even at the higher levels

14.
of magnification of the electron microscope. Extrapolation of
the curve, however, suFggests that crack penetration at 50,000
cycles was probably not in excess of 0.015 mm.
2.2 Fracture Surface Topography of Bands Formedin Service Fatigue Failures.
When comparing the macroscopic aspects of the fracture
surface topography of service fatigue failures with those
observed on laboratory fatigue specimens, one of the most
striking differences is the random spacing of the bands or
"Imacroscopic striations" on the fracture surfaces of the service
failures. The low magnification light micrographs, Figures 7(a)
and (b), illustrate and permit comparison of the appearance of
the fracture surfaces of small fatigue cracks formed during a
laboratory fatigue test, and in service, respectively, in the
aluminum alloy spar caps of a single engine Jet trainer. Whereas,
the laboratory specimen exhibits more or less regularly spaced
bands that correspond to the load blocks in the repetitive
sequential cyclic loading programme, the macroscopic striations
on the fracture surface of the service crack reflect the
randomness in the magnitude of service loads experienced by
the spar during flight manoeuvres and gusts.
2.2.1 Helicopter Rotor Blade Cuff Assembly
The fracture surface of a failed tine of an aluminum
alloy main rotor-blade cuff assembly from a helicopter, illustrated
in Figure 8(a) exhibits clearly defined macroscopic growth lines.
Fractographic examination of the narrow bright bands indicated
the presence of microscopic fatigue striations, Figure 8(b). As
was the case in the laboratory steel bolt specimen (Section 2.1.2),
fractographs of th6 wider dull bands (Figure 8(c)) indicatedthat crack growth had occurred by the mechanism of localized
ductile rupture. This presumably occurred during high level
ioad transients experienced in certain flight manoeuvres, and was
followed by the reversion to the fatigue mechanism of crack
growth with return to relatively steady state flight conditions,
as evidenced by the numerous bright bands.

15.
In order to make a meaningful estimate of crack growth
rates from the analysis of the fracture surface topography in
service failures of this type, some knowledge of dynamic strain
or load magnitudes and sequences is essential, and it must be
possible to correlate this information with the fracture surface
topography. Since such information was not available in this
instance, no attempt was made to obtain crack growth rate
information.
3.0 THE FRACTOGRAPHIC ANALYSIS OF AIRCRAFT WHEELS
The fractographic analysis of thrce types of aluminum
alloy failed main wheel hubs was undertaken in order to:
(i) Assess the nature of crack initiation and
fracture mechanisms involved in the failures,
(ii) Determine the rates of crack propagation in
order to facilitate revision of wheel insnection
schedules, where necessary, to avoid the
occurrence of catastrophic wheel failures.
The results of the fractographic examinations illustrated
the variation in fatigue crack propagation rates in the different
types of aircraft wheels examined. The studies of the micro-
mechanisms of fracture operative during the formation of the
macroscopic crack progression lines or "bands" indicated that
landing impact loads and ground manoeuvres apnear to contribute
significantly to fatigue damage in aircraft wheels.
3.1 Fatigue Crack Initiation
Examination of the various wheel hubs that were submitted
for fractographic analysis, frequently indicated some evidence
of corrosion at or near the point of crack initiation. The
fracture surfaces from the cracked type "A" wheel and the
failed type "B" wheel, Figures 9 and 10 respectively, exhibited
fairly well-defined corrosion pits at the sites of crank
nucleation. An enlarged view of the pit in the type "A" wheel is
given in Figure 11. The micrograph of a polished and etched
section through the pit (Figure 12) clearly illustrates that
corrosion has played a significant part in the nucleation of the

16.
4fati'ue crack. In another instance a clearly defined pit was
not in evidence, but a small semi-circular area of discolouration,
FIgure 13, believed to be associated with corrosion, was
observed on the fracture surface of a failed type "B" wheel.
For purposes of comparison, Figure 14 shows a number of small
fatigue cracks that were nucleated from corrosion pits in the
bead seat radius of an aluminum alloy main landing gear wheel
of a Jet trainer. The fracture surface of a cracked type "C"
main landing gear wheel, Figure 15, exhibited no distinct
cvidcncc of corrosion, but the point of fatigue crack nucleation
corresponded to a radial ridge across the thickness of the flange.
3.2 Crack Pro ression Lines
Curved macroscopic fatigue crack progression lines
or "bands" emanating from the point of crack nucleation can
readily be resolved on the wheel fracture surface illustrated in
Figure 15. Since the validity of the following quantitative
crack propagation analyses rests upon the proper interpretation
of the nature of these bands in terms of the micro-mechanisms
of fracture, a closer examination of the microscopic topographical
features is warranted, and an attempt will be made to correlate
them with certain aspects of the "landing, take-off" sequence,
or "landing cycle" of the aircraft.
3.2.1 Aircraft "Landing Ccle"
The "landing cycle" of a typical jet transport could
probably best be thought of as the sum total of roll miles and
manoeuvres of the aircraft while on the ground, from time of
engine start at the terminal ramp to engine shut down at the
succeeding ramp. It is estimated that the average ground
distance covered by the aircraft during one "landing cycle" would
be of the order of 5 miles. An average ground sequence would
probably include the following:
(i) Engine start at ramp
Push-back of aircraft, 150 ft.
17.
(ii) Taxi to end of runway
Brakes and thrust reversal, as required.
(iii) Take-off roll, 0 to 170 mph, 5,000 ft.
(iv) Landing, 4,000 ft. roll.
(a) Touchdown of main wheels, at 1000 ft.
down runway, 180 mph.
(b) Nose-wheel touchdown at 1200 ft.,
2 second brake application, reducing
speed to 100 to 115 mph.
(c) Two-engine thrust reversal to reduce
speed to 70 mph., no brake application
between speed interval 115 to 70 mph.
(d) 70 mph. and below, brakes as required.
(v) Taxi to ramp, 25 to 30 mph.
- some four brake applications, and
3 or 4 turns are estimated for each
taxi to or from the ramp.
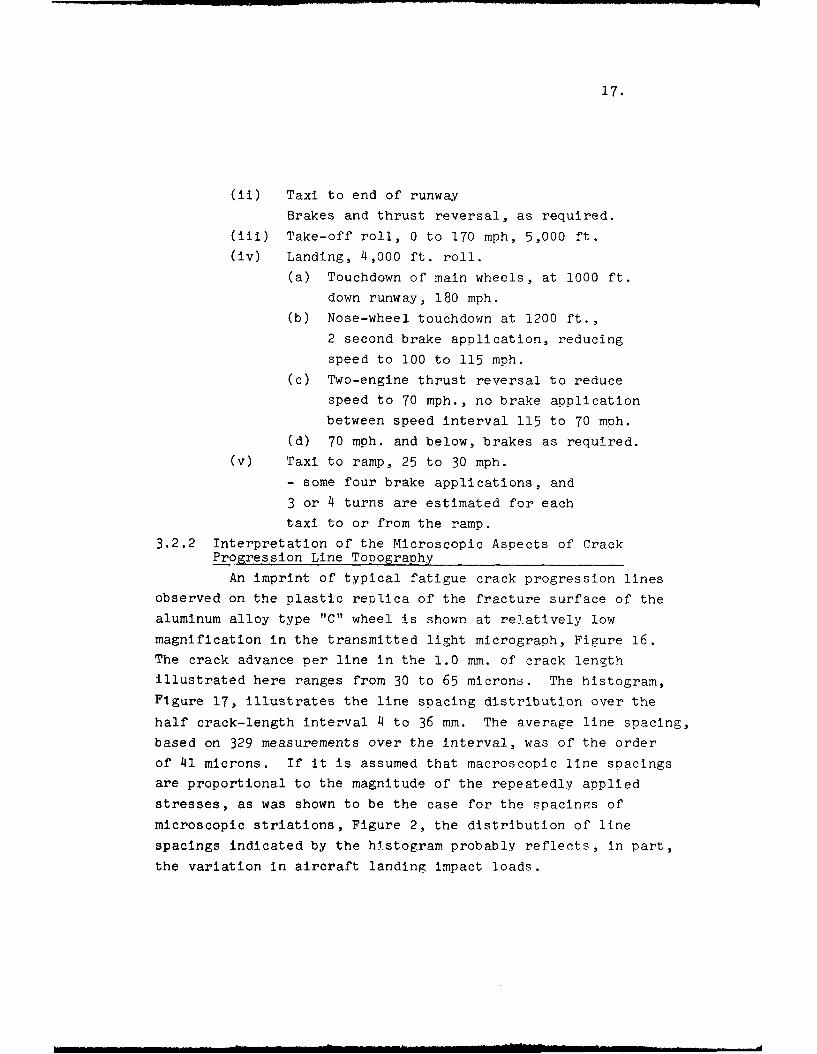
3.2.2 Interpretation of the Microscopic Aspects of CrackProgression Line Topography
An imprint of typical fatigue crack progression lines
observed on the plastic replica of the fracture surface of the
aluminum alloy type "C" wheel is shown at relatively low
magnification in the transmitted light micrograph, Figure 16.
The crack advance per line in the 1.0 mm. of crack lensth
illustrated here ranges from 30 to 65 microns. The histogram,
Figure 17, illustrates the line spacing distribution over the
half crack-length interval 4 to 36 mm. The average line spacing,
based on 329 measurements over the interval, was of the order
of 41 microns. If it is assumed that macroscopic line spacingsare proportional to the magnitude of the repeatedly appliedstresses, as was shown to be the case for the spacings ofmicroscopic striations, Figure 2, the distribution of linespacings indicated by the histogram probably reflects, in part,the variation in aircraft landing impact loads.

18.
e:!r, tiie cr'lk origin, in the early stages of crack
"r .. ith, the al rrx;ceie fracture surface topogranhy of the
v,,!u:i , t'ailed wheel: anpears In the form of "cleavoge-like"
b a,1. , i,-ure 18. The lines or ridges running parallel to
the J!- tion of crack rrowth resemble the "river patterns" on
olev-an.e ftracture surfaces, but it is more likely that they are
tear-ridges formed in a manner similar to those seen on
conventional fatigue fracture surfaces with well-formed fine
striatbns. Here the rldges were formed as the fatigue crack
advanced simultaneously on several levels, (small arrows,
Figure 2). Because of the relatively low net section cyclic
stress conditions in the early stages of crack growth, the flne
fatigue striations, if present, are probably not resolvable
on the bands shown in Figure 18. The lines running perpendicular
to the direction of crack growth represent successive positions
of the crack front, and in the case of the failed aircraft
wheels, their spacings are believed to represent the crack
growth per "landing cycle".
The fracture surface topography of the type "C" wheel,
illustrated in the electron micrograph of Figure 19, shows bands
(interspersed with areas of fine striations) that, on the basi6
of a sampling of band spacing measurements, are believed to
correspond to the macroscopic crack growth lines shown in
Figure 16. The poor definition of the fine striations over the
length of the fracture surface suggests corrosion or impacting
of the mating fracture surfaces, or a combination of the two,
and makes a quantitative interpretation of their significance
somewhat uncertain. However, an estimate of the number of fine
striations in the area illustrated in Figure 19, that was based
on spacing measurements of a few well-defined lines, suggested
a count of some 90 lines. Assuming a one to one correspondence
between wheel rotation and fine striation formation, and based
on an outside tire diameter of 44 in., an estimated roll
distance of 1000 ft. was covered by the aircraft during the
fatigue crack growth defined by this band of striations.

19.
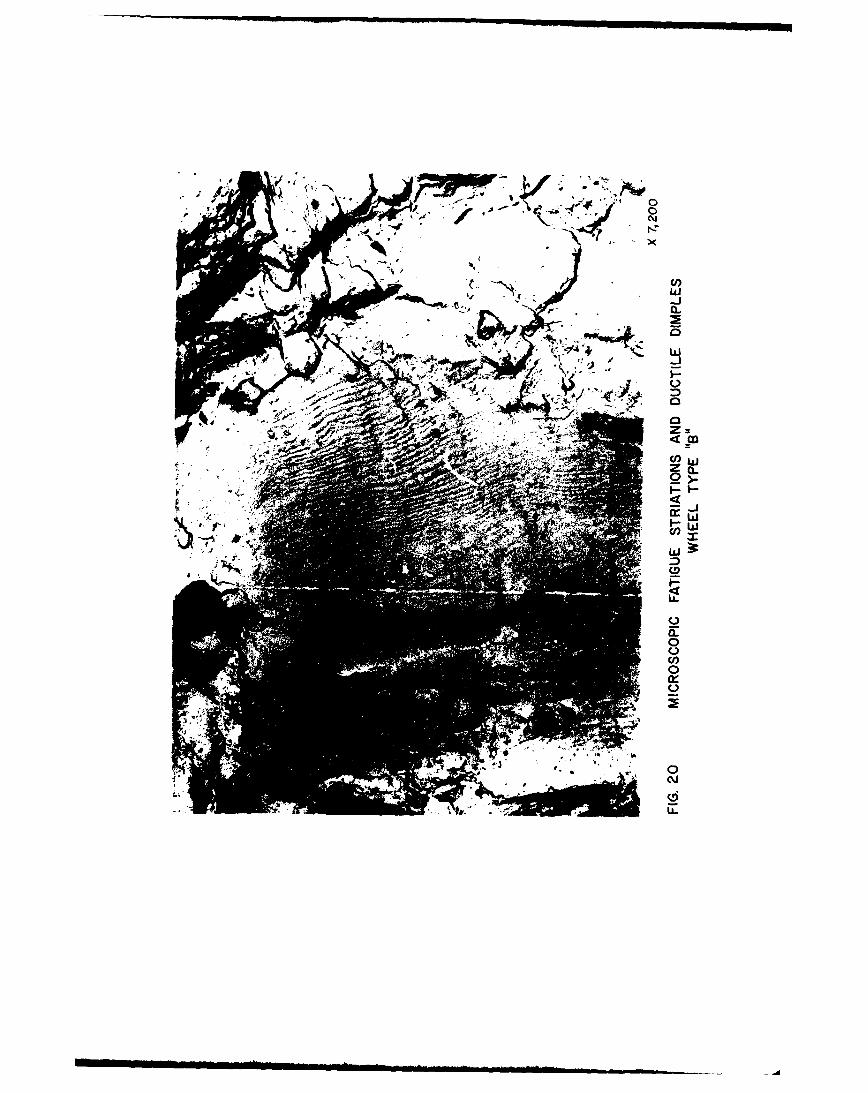
More clearly defined fracture surface topography
in the form of fatigue striations and ductile dimples is illustrated
in the micrograph, Figure 20, taken from a failed type "B" wheel.
If the wheel rotation-striation correspondence is assumed, the
count of 43 striations in this micrograph would represent an
aircraft roll distance of some 500 ft. Neither this distance
nor that previously estimated for the type "C" wheel would account
for the estimated 5 roll miles for a typical landing cycle of a
Jet transport. Therefore manoeuvers such as pivoting, and brake
application at high speed must be examined in an attempt to
account for the relatively small number of fine fatigue striations
on any one area of the various wheel fracture surfaces. Without
correlative strain measurements under service conditions, no
rational deductions can be made with respect D the pivoting
manoeuvres.
The landing cycle described previously indicates a
"2 second" brake application shortly after touchdown in order to
reduce the aircraft speed from 180 to 100 miles per hour. If an
average speed of 150 mph is assumed for the 2 second brake
application, the distance travelled by the aircraft would have
been of the order of 450 ft., which corresponds fairly closely
to the roll distance estimated from the 43 fatigue striations.
Thus, a cyclic stress condition in the wheel, favorable to crack
growth by the mechanism of striation formation due to wheel
rotation during brake application appears to be a plausible
explanation for the limited number of striations observed in
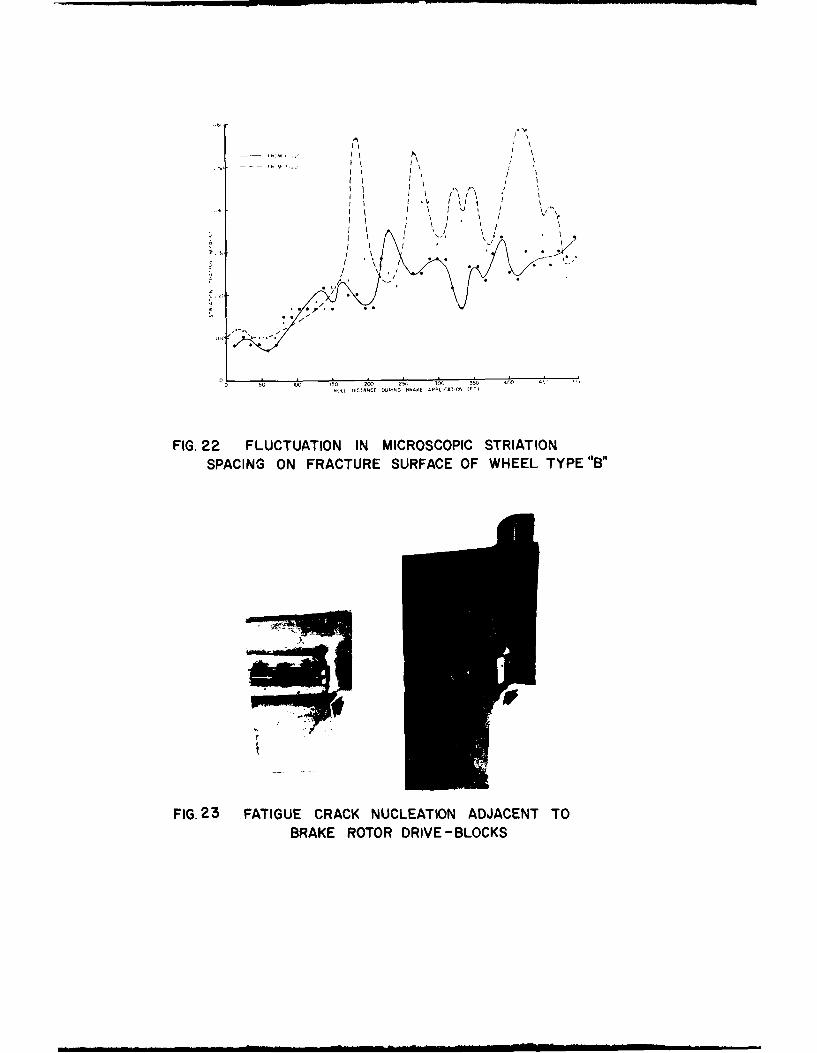
a given area of fracture surface. Figure 21 illustrates a second
striated area on the fracture surface of a type "B" wheel, with
some 60 striations visible. The fluctuation in striation spacing,
corresponding to Figures 20 and 21, and, illustrated graphically
in Figure 22, also reflects a gradual increase in striation
spacing with time, which suggests a build-up in cyclic stress
levels in the wheel hub as the application of brakes continues.
Further credibility is given to the suggestion that braking does
20.
inf' Let lnduce :',1nlflcant localized stresses in the wheel
r:, ' In.ur' 23, In which fatigue crack nucleation in two
, rC whels in an area adjacent to the brake rotor
d.! ,-Klck: I.- illustrated.
The abundance of ductile dimples observed on the
,'racture surfaces of thr type "B" wheels, even within a fewrilli1meters of the crack origin, indicates zones of rapid
'rictire, likely due, in part, to high stress levels associated
with landinn impact loads.
3.3 Quantitative Crack Propagation Analysis ofAircraft Wheels
Crack propagation histories in terms of crack length
and number of landings were determined for three different types
of aluminum alloy main landing gear aircraft wheel hubs.
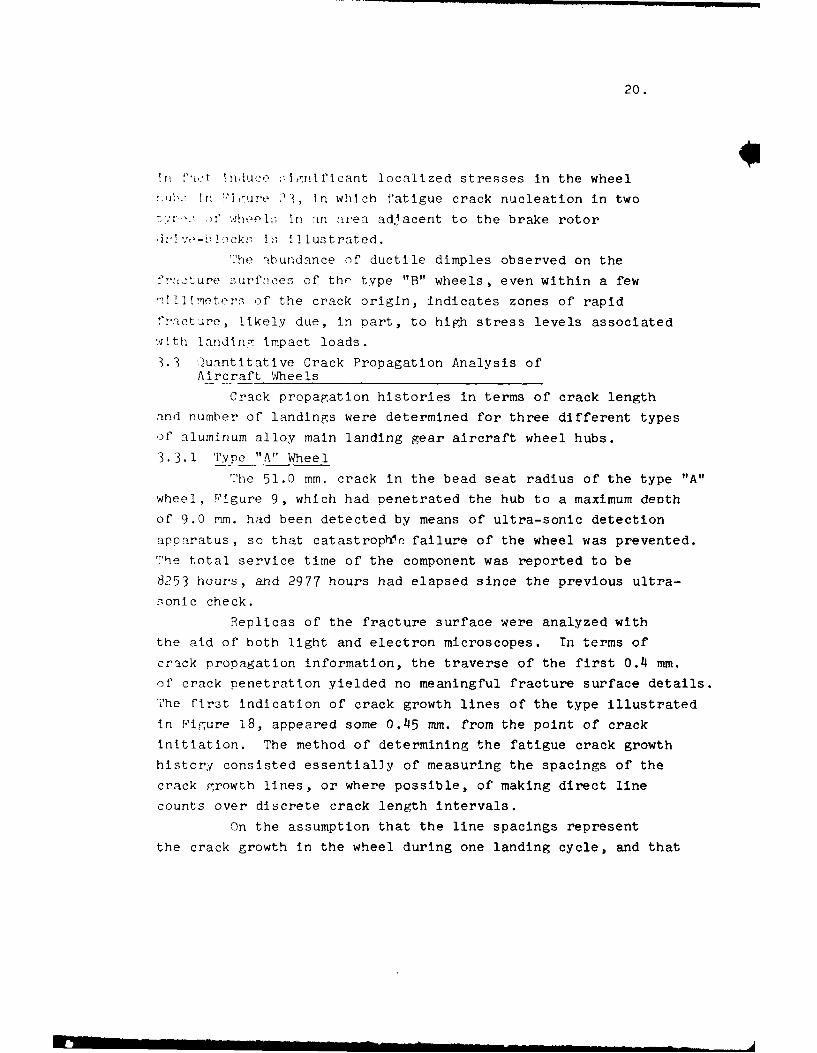
3.3.1 Type "A" Wheel
The 51.0 mm. crack in the bead seat radius of the type "A"
wheel, Figure 9, which had penetrated the hub to a maximum depth
of 9.0 mm. had been detected by means of ultra-sonic detection
apparatus, so that catastroph~i failure of the wheel was prevented.
The total service time of the component was reported to be
8253 hours, and 2977 hours had elapsed since the previous ultra-
sonic check.
Replicas of the fracture surface were analyzed with
the aid of both light and electron microscopes. In terms of
crack propagation information, the traverse of the first 0.4 mm.of crack penetration yielded no meaningful fracture surface details.
The first indication of crack growth lines of the type illustrated
in Figure 18, appeared some 0.45 mm. from the point of crack
initiation. The method of determining the fatigue crack growth
historj consisted essentially of measuring the spacings of the
crack rrowth lines, or where possible, of making direct line
counts over discrete crack length intervals.
On the assumption that the line spacings represent
the crack growth in the wheel during one landing cycle, and that

21.
the average flight time of this aircraft in service is approximately
one hour, the fatigue crack penetration during the final 1,064
landings was of the order of 8.8 mm. This radial crack penetration
into the rim corresponded to an overall circumferential crack
length of some 51 mm. The microscopic line count derivation for
the wheel is listed in Table 1, and the plot of the estimated
number of landings against fatigue crack length is illustrated
in Figure 24. From this information it was deduced that at a
total service time of some 7,190 hours, the crack would have
penetrated the hub to a depth of 0.5 mm. The total circumferential
crack length, as derived from the semi-circular initiation area,
Figure 11, would have been of the order of 1.0 mm. and it would
seem improbable that such a small crack would have been detected,
either by visual or ultra-sonic means.
3.3.2 Type "B" Wheels
For purposes of crack growth rate comparison, two
catastrophically failed wheels of this type were fractographically
analyzed.
Wheel Hub Type "B" - No.1
The point of crack initiation in this wheel was
apparently located in the small discoloured semi-circular area
shown in Figure 13. Although there was evidence of corrosion on
the fracture surface, a distinct corrosion pit was not visible.
When the crack had completely penetrated the rim in the radial
direction, at a half-crack length of 22 mm., fatigue crack growth
tended more towards the circumferential direction, and line
spacings on the outer and inner sides of the rim became approximately
equal. Once total penetration of the hub had occurred, the rate
of crack growth increased rapidly, probably because of a
significant increase in net section stress. This rapid increase
in crack growth rate is reflected by the rapidly increasing slope
of the curve, Figure 25, which norrelates half-crack length with
the number of landings.
22.
A total of some 405 landings were accounted for over
the fatigue crack interval 0.5 to 62 mm. Available information
suggests that tire changes on this type of wheel are made on
the average of every 125 landings. On this basis, it is
estimated that the full length of the fatigue crack in the
bead-seat radius at the time of the final tire change prior to
wheel failure, would have been of the order of 25 to 28 mm.
Wheel Hub Type "B" - No.2
The point of fatigue crack initiation in this wheel
hub, illustrated in Figure 26, appeared to be a corrosion pit
on the outer surface of the rim. The circumferential crack
penetrated the hub at a distance of approximately 40 mm. from
the bead seat radius. As illustrated by the corresponding pairs
of macroscopic growth lines (A,B, Figure 26), the rates of
fatigue crack growth differed on either side of the crack origin.
The final fatigue crack length on side A was 72 mm., and 58 mm. on
side B, when catastrophic failure of the wheel occurred. A total
of some 552 landings were accounted for over the half-crack
length interval 2 mm. to 72 mm. It is of interest to note that
notwithstanding the fact that this fatigue crack developed
some 40 mm. in from the bead-seat radius, the change in the rate
of fatigue crack growth as illustrated in Figure 27, is essentially
identical to that determined for the previous type "B" wheelhub, Figure 25 which failed in the bead-seat radius.
3.3.3 Typ.e "C" WheelFatigue crack growth information for this wheel was
determined over the 76 mm. crack interval identified in Figure 15.
Although the crack Vas initiated at a point adjacent to the bead-
seat radius, crack growth occurred primarily at an angle of
some 600 to the wheel radius, through the wheel flange.
The graph, illustrated in Figure 28, accounts for some
903 landings over the fatigue crack interval 4 to 76 mm. The
curve exhibited an approximately constant growth rate of 47 microns

23.
per landing, over the range 4 to 40 mm. Over the crack
interval 40 to 76 mm. the crack growth rate exhibited an
abrupt increase to some 650 microns per landing. This latter
interval corresponded to a clearly defined change in fracture
surface topography (Figure 15) that exhibited a considerably
coarser textire than the initial 40 mm. of fatigue crack length.
4.0 CONCLUDING REMARKS
The nature of the macroscopic growth lines on the
fracture surfaces of the failed aircraft wheels (Figure 16),
and the abundant evidence of the rapid fracture mode in the
form of ductile dimples (Figure 20) suggest that landing impact
stresses have played a significant role in crack growth in the
various wheels. The limited number of microscopic fatigue
striations observed on any one area of the fracture surfaces
(Figure 20) indicates that fatigue damage resulting from the
five roll miles per aircraft landing cycle may contribute less
to wheel fatigue damage than the application of the brakes at
high speed. It is clear that these parameters, among others
are not adequately catered for in the conventional "Roll Test"
qualification requirements for aircraft wheels.
The formulation of appropriate fatigue qualification
tests for aircraft wheels would seem to require accurate
information concerning the magnitudes of dynamic service stresses
in the critical regions of the wheels. Such information could
also be useful in the interpretation of the macroscopic crack
growth lines on the fracture surfaces of the failed wheels,
in terms of their microscopic content. In this way it might notonly be possible for example, to determine the reasons for the
variation in macroscopic line spacings (Figure 17), but fracture
surface topography such as the fine fatigue striations (Figures 20
and 21) that have been attributed to high speed brake application
could conceivably be specifically related to the cyclic operation
24.
)f' the anti-skid device during brake application.
The correlation of the macroscopic growth lines on
the fatiue fracture surfaces of laboratory specimens with
the cyclic load spectra to which the specimens were subjected
is relatively straightforward. This is not always so in the
case of service failures in the absence of correlative strain
measurements or some other dependable form of loading history
for the component, so that assumptions must be made when
interpreting the significance of the lines. Such assumptions
appear to be justified in the case of the aircraft wheels,
where the fairly regular spacings of the majority of the lines
over long crack segments strongly suggest repeated loading
sequences appropriate to aircraft landing cycles. In addition,
the curves illustrating crack growth histories of the various
wheels indicate reasonable values in terms of actual service
history, and in general the plots are fairly smooth. Abrupt
changes in the slope of a curve, such as that shown in Figure 28,
can usually be correlated with abrupt changes in fracture surface
topography, which in turn correspond to changes in dynamic
stress levels in the wheel hub due to the decreases in component
net section that result from increases in crack length.
5.0 ACKNOWLEDGEMENTS
The author wishes to thank Mr. J. A. Dunsby of this
laboratory for supplying fatigue specirnens fractured in the
laboratory, and Mr. E. C. Bell and Mr. J. Reeves of Air Canada
for supplying service failure specimens and for valuable
discussions.
6.0 REFERENCES
(1) Final Minutes - 1969 Commercial Wheel and Brake
Forum, Bendix Energy Controls Division, South Bend,
Indiana, U.S.A., Sept. 1969, p.44.
(2) Aerospace Standard AS 227 D "Wheels and Brakes -
Minimum Requirements for Civil Aircraft

25.
Applications", Society of Automotive
Engineers, 485 Lexington Ave., New York,
Revised 15 April, 1963.
(3) Behr, R. D. Roll Fatigue Tests on Forged ZK60A-T5Campbell, S. Magnesium and 2014-T6 Aluminum Wheels.
Paper presented at Fifth Pacific Area
Meeting, ASTM, Seattle Washington, 31 Oct.
to 5 Nov. 1965.
(4) Military Specification MIL-W-5013G, Wheel
and Brake Assemblies; Aircraft.
20 February, 1967.
(5) Landing Gear Ancillary Equipment -
A Survey of Aircraft Tyres, Wheels, Brakes
and the Research Facilities of the Dunlop
Co. Ltd.
Aircraft Engineering, Vol. XL, No.1,
January 1968, P.9.
(6) Wiebe, W. Quantitative Fatigue Crack Propagation
Analysis by Means of Electron Fractography.
Report LR-450, National Aeronautical
Establishment, National Research Council
of Canada, March 1966.
(7) McMillan, J.C. Application of Electron Fractography to
Hertzberg, R.W. Fatigue Studies.
Electron Fractography, ASTM STP 436,
American Society for Testing and Materials,
1968, pp.89-123.
(8) Forsyth, P.J.E. The Physical Basis of Metal Fatigue.
Blackie and Son Ltd., London and Glasgow,
1969, p.67.

VI
TABLE I
LINE COUNT DERIVATION - TYPE "A" WHEEL
Crack Length Interval Average Interpolated
Interval Width Line Spacing Line Count-(-(mm . (microns)
1.0 to 2.3 1.3 23.6 55
2.3 to 5.0 2.7 18.9 143
5.0 to 5.8 0.8 25.2 32
5.8 to 6.3 0.5 13.2 38
6.3 to 7.2 0.9 22.3 40
7.2 to 7.7 0.5 14.0 36
7.7 to 8.5 0.8 24.9 32
8.5 to 11.0 2.5 26.0 96
11.0 to 12.0 1.0 30.4 33
12.0 to 14.4 2.4 46.1 52
14.4 to 16.0 1.6 61.4 26
16.0 to 18.2 2.2 64.2 34
18.2 to 20.2 2.0 60.8 33
20.2 to 22.0 1.8 75.2 24
22.0 to 24.0 2.0 80.3 25
24.0 to 26.5 2.5 81.0 31
26.5 to 28.8 2.3 70.1 33
28.8 to 31.0 2.2 70.3 31
31.0 to 33.0 2.0 63.0 32
33.0 to 35.5 2.5 76.2 33
35.5 to 45.0 9.5 75.7 126
45.0 to 46.5 1.5 71.3 21
46.5 to 49.0 2.5 75.1 33
49.0 to 51.0 2.0 79.0 25
Total 1,064

. , '. . .. . . . I-I
-JA
FA
X 3
FIG. I() BANDED STRUCTURE ON FRACTURE SURFACESOF A LABORATORY SPECIMEN SUBJECTEDTO REPETITIVE SEQUENTIAL LOADING
16, 000-
tn 8,000i w lw I JI w
00
CYCLIC LOADING 5EOUENCE
FIG. I (b) CYCLIC LOADING SEQUENCE OFWING LOAD SPECTRUM

I- 0-
I L
LL. 0
#~~~0 .4 d4
'I 0.
10 0at

X 3.3FIG. 3(a) FRACTURE SURFACE OF A STEEL BOLT
SUBJECTED TO REPETITIVE SEQUENTIAL LOADING
BOLT B6
40,00C
0
CYCLIC LOADING SEQUENCE
FIG. 3(b) REPITITIVE LOADING SEQUENCEAPPLIED TO STEEL BOLT
,-. .I ,j.
.'i '4.= \ "
44X 7,00
FIG. 4 FATIGUE STRIATIONS ON BRIGHT BANDSOF STEEL BOLT FRACTURE SURFACE
X 9,200
FIG. 5 MICROVOID COALESCENCE ON DULL
BANDS OF STEEL BOLT FRACTURE SURFACE
100 CRACK PROPAGATION HISTORY /STEEL BOLT /
SPECIMEN B6
////
,/
.0
E
S
JO
/
0.01 * I I I
50 100 150 200 250 300 350 400LOAD CYCLES (XI0 - 3
)
FIG. 6 CRACK PROPAGATION HISTORY -STEEL BOLT

w
LL V
4w
wJm
*9L
4J cco
c4
L)0
0 m4a
in LL -
~LL

X 8FIG. 8(a) TRANSMITTED LIGHT REPLICA MACROGRAPHOF THE FRACTURE SURFACE OF FAILED ROTOR-BLADE TINE
N |I I N
. • ', ,
X 9,800FIG. 8(b) MICROSCOPIC FATIGUE STRIATIONS ON
BRIGHT BANDS OF ROTOR-BLADE TINE

bI
X 9,000
FIG. 8(c) MICROVOID COALESCENCE ON DULLBANDS OF ROTOR-BLADE TINE
X4
FIG. 9 FATIGUE FRACTURE SURFACE -WHEEL TYPE "A"(ARROW INDICATES CORROSION PIT)

W C
W -
I)0
4 L
Cfw z
0
LL

-N "r-1 it' pi
X 75
FIG. I I ENLARGED VIEW OF CORROSION PIT, ANDINITIAL FATIGUE FRACTURE SURFACE AREA-
WHEEL TYPE "A
X 1,000
FIG. 12 METALLOGRAPHIC SECTION THROUGHCORROSION PIT -WHEEL TYPE"A"
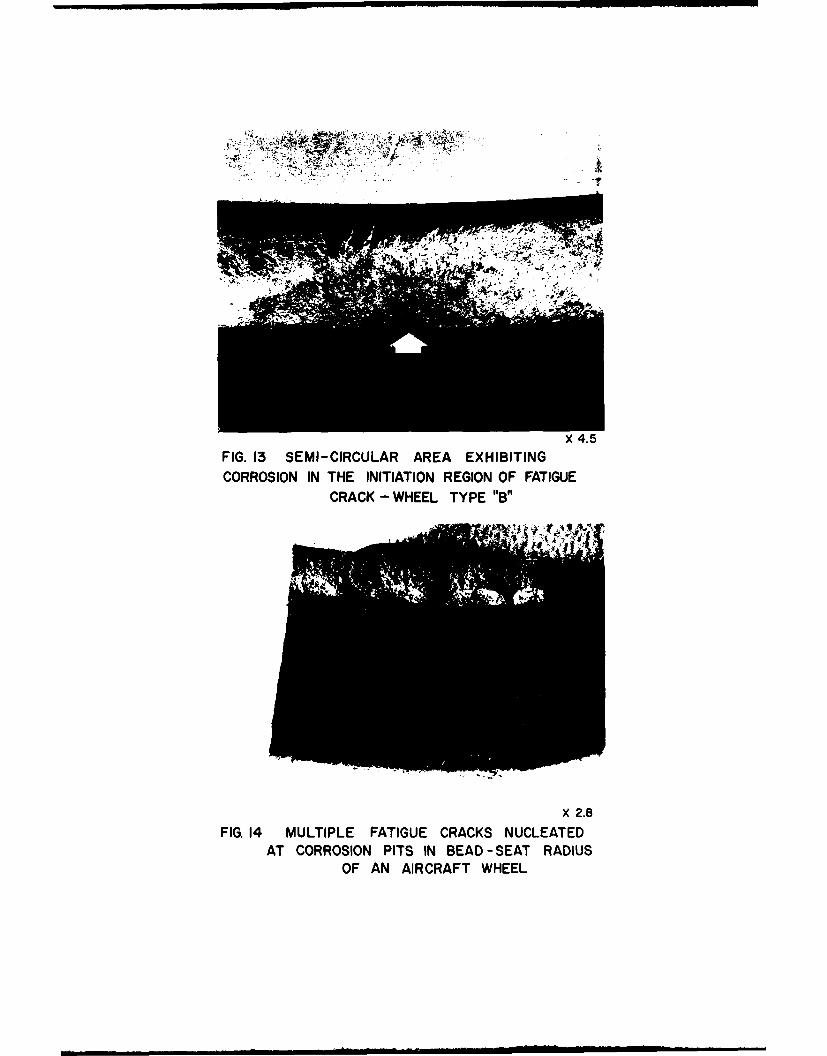
FIG. 13 SEMI-CIRCULAR AREA EXHIBITINGCORROSION IN THE INITIATION REGION OF FATIGUE
CRACK - WHEEL TYPE "B"
X 2.8
FIG. 14 MULTIPLE FATIGUE CRACKS NUCLEATEDAT CORROSION PITS IN BEAD-SEAT RADIUS
OF AN AIRCRAFT WHEEL

x
LL 2
w
-
=0
LL -
W 3,
0A

X 130FIG. 16 CRACK PROGRESSION LINES -
WHEEL TYPE "C"
.INE SPACING -4 TO 36-,, RALF CRACK LEV-'
70TAL POPULATION 329 LINE SPACING IREASUFFIVE%'S
FIG. 17 LINE SPACING DISTRIBUTION -
WHEEL TYPE "C"

'AeV
V,,
X 3,500
FIG. 18 MICROSCOPIC BANDS IN EARLY STAGESOF CRACK GROWTH -WHEEL TYPE "All
(ARROW INDICATES DIRECTION OF CRACK GROWTH)
A A
~~jX 4,300
TOORA- WHE YPAC
cmL
4, At,
je.
* (-r
4 U) . J

4-4
#Av
co
W.
~ -IC-
y&w
<U
w'1\j - -.
jej WAl>.-
I I
0 50 0C 20 OO 5 0 50 .r 4'
NCLI 0DVANCE DURNC, bh_,f AP,,cA _oN( 1
FIG. 22 FLUCTUATION IN MICROSCOPIC STRIATIONSPACING ON FRACTURE SURFACE OF WHEEL TYPE eIBn
FIG. 23 FATIGUE CRACK NUCLEATION ADJACENT TOBRAKE ROTOR DRIVE-BLOCKS

FI G 2 4 CRACK GROWTH HISTORY -WHEEL TYPE "A"
FAILJRE AT7R25 LANJDINGS
00
FIG 25 CRACK GROWTH HISTORY -WHEEL TYPE "Eo I
z
~0L w
z4-
LL.
U-0
CD
LI

CATASTROPHIC
FAILURE AT4051 LANDINGS
2L
.1 -
3500 3600 3700 3800 3900 4000 4tO0
ESTIMATED NUMBER OF LANDINGS
FIG. 27 CRACK GROWTH HISTORY -WHEEL TYPE"B",No.2
CRACK DETECTED
80r
- 60
S40
20C 400 600 Soo 900E',-lMATE') NUMBER OF LANDINGS (HALF-CRACK LENGTH 4.0 TO 7,0ram )
FIG. 28 CRACK GROWTH HISTORY-WHEEL TYPE "C"
I I i i il : - ' I ' i '- " i ii ' i' , , r -