FRACTAL SELF-ORGANIZATION OF BACTERIA-INSPIRED AGENTS
17
2nd Reading June 20, 2012 10:43 0218-348X 1250016 Fractals, Vol. 20, No. 2 (2012) 1–17 c World Scientific Publishing Company DOI: 10.1142/S0218348X12500168 FRACTAL SELF-ORGANIZATION OF BACTERIA-INSPIRED AGENTS YUFENG HUANG, IAN KRUMANOCKER and MARC-OLIVIER COPPENS ∗ Howard P. Isermann Department of Chemical and Biological Engineering, Rensselaer Polytechnic Institute 110 8th Street, Troy NY 12180, USA ∗ [email protected] Received Accepted Published In memoriam Benoit B. Mandelbrot, mentor and friend Abstract We develop an agent-based model as a preliminary theoretical basis to guide the synthesis of a new class of materials with dynamic properties similar to bacterial colonies. Each agent in the model is representative of an individual bacterium capable of: the uptake of chemicals (nutrients), which are metabolized; active movement (part viscous, part diffusive), consum- ing metabolic energy; and cellular division, when agents have doubled in size. The agents grow in number and self-organize into fractal structures, depending on the rules that define the actions of the agents and the parameter values. The environment of the agents includes chemicals responsible for their growth and is described by a diffusion-reaction equation with Michaelis-Menten kinetics. These rules are modeled mathematically by a set of equations with five dimensionless groups that are functions of physical parameters. Simulations are performed for different parameter values. The resulting structures are characterized by their fractal scaling regime, box-counting and mass-radius dimensions, and lacunarity. Each parameter influences the overall structure in a unique way, generating a wide spectrum of structures. For certain com- binations of parameter values, the model converges to a steady state, with a finite population of agents that no longer divide. Keywords : Fractal; Fractal Growth; Bacterial Colonies; Agent-Based Model; Dynamic Materials. ∗ Corresponding author. 1
Transcript of FRACTAL SELF-ORGANIZATION OF BACTERIA-INSPIRED AGENTS

2nd Reading
June 20, 2012 10:43 0218-348X 1250016
Fractals, Vol. 20, No. 2 (2012) 1–17c© World Scientific Publishing CompanyDOI: 10.1142/S0218348X12500168
FRACTAL SELF-ORGANIZATIONOF BACTERIA-INSPIRED AGENTS
YUFENG HUANG, IAN KRUMANOCKERand MARC-OLIVIER COPPENS∗
Howard P. Isermann Department of Chemicaland Biological Engineering, Rensselaer Polytechnic Institute
110 8th Street, Troy NY 12180, USA∗[email protected]
ReceivedAcceptedPublished
In memoriam Benoit B. Mandelbrot, mentor and friend
AbstractWe develop an agent-based model as a preliminary theoretical basis to guide the synthesisof a new class of materials with dynamic properties similar to bacterial colonies. Each agentin the model is representative of an individual bacterium capable of: the uptake of chemicals(nutrients), which are metabolized; active movement (part viscous, part diffusive), consum-ing metabolic energy; and cellular division, when agents have doubled in size. The agentsgrow in number and self-organize into fractal structures, depending on the rules that definethe actions of the agents and the parameter values. The environment of the agents includeschemicals responsible for their growth and is described by a diffusion-reaction equation withMichaelis-Menten kinetics. These rules are modeled mathematically by a set of equations withfive dimensionless groups that are functions of physical parameters. Simulations are performedfor different parameter values. The resulting structures are characterized by their fractal scalingregime, box-counting and mass-radius dimensions, and lacunarity. Each parameter influencesthe overall structure in a unique way, generating a wide spectrum of structures. For certain com-binations of parameter values, the model converges to a steady state, with a finite populationof agents that no longer divide.
Keywords : Fractal; Fractal Growth; Bacterial Colonies; Agent-Based Model; Dynamic Materials.
∗Corresponding author.
1

2nd Reading
June 20, 2012 10:43 0218-348X 1250016
2 Y. Huang, I. Krumanocker & M.-O. Coppens
1. INTRODUCTION
The complexity of many fractal structures emergesfrom the iteration of simple rules.1,2 Interest-ingly, fractals share this feature with self-replicatingmachines and cellular automata,3,4 introduced byvon Neumann, whom Benoit Mandelbrot creditedin many ways as an important influence and advi-sor in early days.5 In such self-replicating machines,simple rules that govern the actions of individualmobile elements or “agents” may lead to fractalstructures, with features that are invariant undermagnification, over a wide range of scales.
Similarly, randomly moving bacteria on a Petridish, partially starved from nutrients, assemble intocomplex organizations that are often fractal, some-times reminiscent of DLA (diffusion limited aggre-gation). In DLA,6 a central seed grows into anapproximately self-similar, fractal cluster when dif-fusing agents, following a random walk throughspace, hit and irreversibly attach to the growingcluster. However, bacteria are more complicated:they can divide (self-replicate); they absorb nutri-ents, which allows them to grow and change theirinternal state; they respond to their environment byreacting to chemical and mechanical actions, excret-ing chemicals themselves, to which other bacteriamay react (e.g., quorum sensing).7 Real bacteriahave complicated genetics and metabolism. Theyare not simple dots, but have a size, shape and con-tent that is species dependent. They perform ran-dom walks, but not according to classical Brownianmotion, because they are often self-propelled (usingflagella), are able to respond to chemical gradients(via chemotaxis), and interact with the surroundingfluid.8
Despite these complications, models that abst-ract the actions and reactions of bacteria in afashion similar to the DLA-model, using modi-fied but still much-simplified rules compared tothose of real bacteria, have been shown to pro-duce patterns that closely resemble bacterialcommunities.9–14 Also non-biological growth andaggregation phenomena occurring in colloidal sys-tems, electrochemistry, dielectric breakdown, fluidflow in porous media (viscous fingering), etc. . .frequently produce fractal structures with surpris-ingly universal features, despite the differences inmicroscopic physics or physical chemistry.10,15–18
Nevertheless, the more complicated features of bac-teria, including their ability to divide and act totheir environment in different ways, leads to more
complex dynamics and adaptability of a growingbacterial community, when compared to non-livingsystems.
A bacterial community, in many ways, behavesas a synergetic, multicellular organism.19,20 It ismuch more complex than the constituting microbes.A community could be manipulated in responseto certain actions, be it genetic or environmental.While these features are very important for biol-ogy and biochemical engineering,21 this paper doesnot seek a more sophisticated model to describethe organization of bacterial communities. Instead,we explore the organization of agent-based systemsthat are bacteria-inspired.
The “agents” and their rules of action are basedon the simplest, still physically and chemicallymeaningful representation of a complicated biolog-ical reality, in such a way that this representationmight be applied to the design and synthesis of non-biological elements or artificial cells. Like bacte-ria, these artificial cells develop into organizations.The question we raise is what organizations can beachieved based on these simple rules, with outcomesthat depend, for each agent, on the immediate envi-ronment of the agent (e.g., the local concentrationof nutrients), as is the case for a bacterium? Simi-lar to bacteria, we call the organizations “colonies”,and seek the structure of these colonies.
Our ultimate goal is to formulate nature-inspireddesign rules for new classes of adaptive materials,as part of our philosophy of nature-inspired chemi-cal engineering (NICE). The NICE approach learnsfrom the architecture and dynamics of natural sys-tems with desirable properties, such as robustness,efficiency, scalability or adaptability, and then usesthe underlying mechanisms that lead to these prop-erties in the design and synthesis of innovativematerials and reaction systems with properties sim-ilar to the natural systems.22–25
2. AGENT-BASED SIMULATIONS
2.1. Overview
Bacteria moving on a Petri dish may self-organizeinto fractal and other remarkable patterns, depend-ing on the growth conditions.9,11–13 The goal ofour simulations is to study the landscape of struc-tures emerging from individual elements or “agents”with functions inspired by those of bacteria. Eachagent performs a random walk on a two-dimensional

2nd Reading
June 20, 2012 10:43 0218-348X 1250016
Fractal Self-Organization of Bacteria-Inspired Agents 3
surface. While an agent moves, it takes up nutritionfrom the environment, which it converts and usesto prolong its movement or to replicate. As we willsee, this often results in fractal structures, like thoseobserved in bacterial communities.
The state of each agent is characterized by a sin-gle variable: its mass, m, similar to the mass ofa bacterial cell. Depending on the value of m, anagent can perform one of three actions. Below a cer-tain threshold, mmin, an agent remains immotile, asit contains insufficient mass that can be convertedinto metabolic energy to propel itself through theviscous medium. Above this minimum, but below amaximum mass, mmax, an agent is motile and pro-pels itself through the environment. When the massof an agent reaches mmax, it self-replicates, split-ting into two equally sized, separate agents. Eachof these agents has half the mass of the original,hence mmax = 2mmin.
The environment in which the agents carry outthese actions contains nutrition, which serves asa fuel to the individual agents. Hence, the two-dimensional environment is represented by a layerin which nutrients diffuse and are taken up by theagents. When an agent absorbs nutrients from thelayer, the concentration of nutrients in proximityto this agent decreases. Nutrients are metabolizedand partially converted into biomass that is storedinside the agent. As nutrients are depleted, a con-centration gradient develops, inducing the diffusionof nutrients from areas of high concentration to lowconcentration.
2.2. Agents
In the current model, all actions of an individualagent, i, are a function of its mass, mi, only. Thismass, mi, is determined by the amount of nutrientthat agent i absorbs and the actions it performs.In turn, the mass of an individual agent determinesthe actions it will perform. Absorption replenishesnutrients and therefore increases mi, while move-ment consumes energy, which decreases mi.
The size of an agent depends on its mass. Ashypothesized, the only variable characterizing eachagent is its mass. This assumption implies thatthe density of an agent, ρ, is the same for allagents, and is independent of the agent’s size. Allagents are modeled as circular, two-dimensionaldisks with a mass-dependent radius R(mi). Sinceρ is constant, the surface area of each two-dimensional agent, Si, is proportional to its mass,
mi : Si = mi/ρ = π[R(mi)]2. The size of an agentdetermines its total rate of absorption of nutrients,and its velocity, v(mi).
The mass mmin is the minimum allowed mass ofan agent in the simulation. This represents the min-imum amount of material an agent needs to sus-tain itself. When the mass of an agent drops tommin, it is still able to absorb nutrients, should theybecome available by diffusion, but it is unable tomove. Agents falling into this category are referredto as dormant, stationary or “immotile”. Theimmotile agents have a radius Rmin = R(mmin) =√
mmin/(ρπ).When an agent i has a mass mi between mmin
and 2mmin, it is able to move and is referred toas “motile”. Each agent performs a random walk.It moves a short distance in a straight line, thenchanges direction randomly, moves another distancein a straight line, and so on. The environment isassumed to be viscous and Newtonian, and motionis slow enough to apply Stokes’ law to the straightexcursions:
Fd = −4πµR(mi)v(mi), (1)
where Fd is the frictional or drag force acting ona disk-shaped agent i, µ is the viscosity of themedium, R(mi) is the radius of agent i, and v(mi)is its velocity. In this study we assume every agentto have the same, autonomous propulsion mecha-nism, which exerts a force Fp on its surroundings.In bacteria this might be via flagella. Newton’s thirdlaw dictates that Fp + Fd = 0, barring externalforces acting on the agent. In this study, we assumethat the propulsion force is independent of mass,an assumption that can be modified, depending onthe nature of the agents. Under this assumption,the magnitude of the drag force, |Fd|, is constant.We also assume that viscosity µ is uniform acrossthe surface. The differential of the work done bythe agents, moving an infinitesimal distance, ds, isderived as follows:
dW = Fpds = |Fd|ds ordW
dt= |Fd|v(m). (2)
The equation of motion of an agent’s random walkis written as follows:
d�ri
dt= v(mi)[�i cos θ(t) +�j sin θ(t)]. (3)
Here, �ri is the position of agent i at time t, �iand �j are unit vectors along the directions of twoorthogonal axes of the two-dimensional surface,

2nd Reading
June 20, 2012 10:43 0218-348X 1250016
4 Y. Huang, I. Krumanocker & M.-O. Coppens
θ is the angle at time t, randomly changed aftercertain time intervals. The velocity of agent idepends on its mass, mi, which, itself, depends ontime.
Finally, when the mass of an agent, mi = 2mmin,the agent divides. As division occurs, a new agentis added to the system, next to its parent. Due tothis condition, no agent has a mass greater than2mmin, because it will have divided before that. Themechanism of division is as follows:
m+
i =12m−
i
m+N+1 =
12m−
i
, m−i ≥ 2mmin. (4)
The subscripts denote the agents. N is the totalnumber of agents in the system prior to division;a new agent N + 1 is created when i divides. Thesuperscripts “−” and “+” denote the agents beforeand after division, respectively.
The overall mass balance for each agent is thusdetermined by the three actions: motion, division,and absorption of nutrition.
Absorption of nutrient by the agents is mod-eled by Michaelis-Menten kinetics, similar to manybacterial cells. According to the Michaelis-Mentenmechanism, the local rate of depletion of nutrientsper unit area, rn (would be volume in three dimen-sions), at position �r and time t, is:
rn =rmaxCn(�r, t)
KM + Cn(�r, t), (5)
where rmax is the maximum reaction rate, Cn(�r, t) isthe local concentration of nutrients at position �r andtime t, and KM is the Michaelis-Menten constant.This rate equation approximates first-order kineticsat low nutrition levels (Cn � KM ) and zeroth-orderkinetics at high nutrition levels (Cn � KM ). Viametabolic processes, absorbed nutrients are con-verted into added agent mass. Let p be the stoi-chiometric coefficient of the reaction of nutrients toagent mass (allowing for other excreted products,which do not affect the process), then prn is the rateof increase of agent mass per unit area of an agent.The total rate of absorption by agent i (change inmass per unit time) is obtained by integrating overthe area, Si, occupied by agent i, leading to Siprn,when the rate of absorption is assumed constantover this area.
Therefore, when mmin < mi < 2mmin, thechange in mass of an agent over time is described
by:
dmi
dt= prn[Cn(�r, t)]Si(mi) − 1
∆H
dWi
dt
∼= prn[Cn(�r, t)]mi
ρ− |Fd|vi(mi)
∆H, (6)
where Eq. (2) was used, the area occupied by anagent, Si = mi/ρ, and ∆H is the enthalpy changeassociated to the conversion of mass to metabolicenergy.
2.3. Nutrient Layer
Locally, nutrients are consumed by the agents. Thisprocess results in a concentration gradient in thenutrition layer. Because nutrients diffuse from highto low concentration, the nutrition layer is describedby the following diffusion-reaction equation for thenutrient concentration, Cn:
∂Cn(�r, t)∂t
= DC
(∂2
∂x2+
∂2
∂y2
)Cn(�r, t)
− δ(�r)rn[Cn(�r, t)], (7)
where rn is the rate of depletion of the nutrients,as described by Eq. (5), and δ(�r ) represents thepresence of agents at location �r : δ(�r ) = 1 if there isan agent i with mmin ≤ mi ≤ 2mmin at �r; otherwise,δ(�r ) = 0.
3. MODEL IMPLEMENTATIONAND ANALYSIS TOOLS
3.1. Dimensionless Formulation
To study this agent-based model in a more gen-eral way, the equations are cast in a dimension-less form. Thus, the dimensionless mass Xi(�r, τ),dimensionless nutrient concentration Y (�r, τ),dimensionless time τ , and dimensionless velocity v′are introduced, with the following relationships tothe corresponding non-dimensionless physical vari-ables and parameters:
mi = mmin(1 + Xi) 0 ≤ Xi < 1 (8)
Cn = CmaxY 0 ≤ Y ≤ 1 (9)
t =Rmin
vmaxτ 0 < τ (10)
vi = v′ivmax 0 ≤ v′i. (11)

2nd Reading
June 20, 2012 10:43 0218-348X 1250016
Fractal Self-Organization of Bacteria-Inspired Agents 5
The maximum velocity of an agent corre-sponds to its minimum mass; from Eq. (1):vmax = |Fd|/4πµRmin. The dimensionless Laplacianoperator is used, by normalizing the coordinates xand y to the minimum radius of the agents, which
is the radius when the agents are immotile:
∂2
∂x2+
∂2
∂y2=
1R2
min
∇2. (12)
Equation (7) for the diffusion of nutrients thusbecomes, after substituting Eq. (5):
∂Y
∂τ= D∇2Y − B
Y
Y + Ain the presence of agent i, with 0 ≤ Xi < 1 (13a)
∂Y
∂τ= D∇2Y in the absence of agents. (13b)
Depending on their state, each agent i is described by the following equations, where Eqs. (14a) and (14b)are the dimensionless forms of Eqs. (4) and (6):
dXi
dτ= C
Y
Y + A(1 + Xi) for Xi = 0 (14a)
dXi
dτ= C
Y
Y + A(1 + Xi) − E
1√1 + Xi
for 0 < Xi < 1 i = 1, . . . , N (14b)
X+i = 0;XN+1 = 0 for X−
i = 1. (14c)
The first equation, (14a), holds for immotile agents,which are still able to absorb nutrients (right-handside term), resulting in accumulation of mass, butdo not lose mass through motion, as in the last termof Eq. (14b). Here, the dimensionless velocity wasused, which follows from Eqs. (1) and (8):
v′i =1√
1 + Xi, i = 1, . . . , N. (15)
In these equations, dimensionless parameters A–Ewere introduced. Table 1 shows how they dependon physical parameters.
3.2. Implementation
The nutrition layer is discretized into a grid withunit box width a. Simulations were carried out fordifferent values of a to ensure that the results aregrid size independent. For the reported simulations,a is chosen to be 10Rmin, a value that is largeenough for the approximation in Eq. (6) to hold,and small enough for the value of Y within a grid
cell not to change appreciably. Time τ is discretizedinto small time steps ∆τ .
During each time step ∆τ , coarse-grained ver-sions of Eqs. (13) and (14) are solved. The diffu-sion equation for the nutrients is discretized usingthe Crank-Nicolson method. The trajectories of theagents are also coarse-grained over time steps ∆τ .An agent changes direction after a certain amountof time that is modeled by a Poisson distribution,such that the same direction is maintained for anaverage duration of λ∆τ , where λ is the mean ofthe Poisson distribution. λ = 10 for all simulations,because λ can be neither too small nor too large forthe assumptions behind the coarse-grained approx-imation to be valid. It was verified that changes ofλ around this average did not influence the results.
The initial conditions are set to: N = 50; Xi = 0and |�ri| ≤ 10Rmin for i = 1, 2, . . . , N ; Y (�r, 0)= 1,that is, nutrients are initially homogeneously, uni-formly distributed. The boundary of the nutri-tion layer is considered to be a rigid wall, that
Table 1 Expressions for the Parameters A, B, C, D, and E in Eqs. (13) and (14),in Terms of Physical Variables.
Dimensionless Parameter A B C D E
Relation to physical variablesKM
Cmax
rmax Rmin
Cmax vmax
Rmin prmax
vmaxρ
Dc
Rmin vmax
|Fd|Rmin
mmin ∆H

2nd Reading
June 20, 2012 10:43 0218-348X 1250016
6 Y. Huang, I. Krumanocker & M.-O. Coppens
is: ∇Y = ∂Y/∂n = 0 at the boundary. A simulationis ended when N ≥ 30,000 or after 300,000 timesteps ∆τ , whichever occurs first. The stopping con-dition is chosen such that the average simulationtime is less than two days.
All simulations were performed on a computercluster comprised of eight nodes of dual 6-core2.4 GHz processors with 16 Gb RAM per node. Theaverage time for a simulation to complete is lessthan 15 minutes.
3.3. Box-Counting Dimension
The standard procedure is used to estimate the box-counting dimension of the colony formed by theagents.1 First, the colony is covered by a squaregrid containing unit boxes of width R′ (in units ofRmin). The number of boxes with at least one agentis counted and is recorded as NB(R′). By chang-ing the value of R′, the corresponding NB(R′) isobtained. The box-counting dimension DB is esti-mated from the absolute value of the slope of thelinear region in a plot of log10[NB(R′)] vs. log10(R′).
3.4. Mass-Radius Dimension
The mass dimension is estimated in two differentways. The first way involves counting the number ofagents within concentric circles of radius R′ (againin units of Rmin) around a central point. This cen-ter is obtained by averaging the position of agentsin the vertical and horizontal directions. Then, thenumber of agents within a circle of radius R′ iscounted, and recorded as NM (R′), for different val-ues of R′. The mass-radius dimension is calculatedfrom the linear region in the plot of log10[NM (R′)]vs. log10(R′).
However, because the density of the colony islikely to be different at different radii, a coarse-grained mass-radius method is also employed. First,the colony is covered by a grid of small boxes. Sim-ilar to the box-counting method, each box in thegrid has a binary value, depending on the presenceof agents in the box. The number of occupied boxeswithin a circle of radius R′ is counted, and recordedas N ′
M (R′). A plot of log10[N ′M (R′)] vs. log10(R′) is
then used for a second estimate of the mass dimen-sion, DM .
3.5. Lacunarity
Fractal dimension(s) give an impression of thespace-filling capability of a set, but are insufficient
to fully characterize it, just like a dimension of 2for a Euclidean object does not tell us whether theobject is a circular disk or a rectangle. A valuablecomplementary characteristic is lacunarity, whichindicates how (non-)uniform the set is. Low lacu-narity corresponds to a uniform, homogeneous dis-tribution of holes (Latin lacunae).1 Fractals of thesame Hausdorff dimension may differ considerablyin their lacunarity. On occasion, different estimatorsfor fractal dimension, such as box-counting schemesand the mass-radius relation already suggest this,since the mass dimension depends on the choice ofa center around which the mass is measured as afunction of the distance from the center.
A fast gliding box algorithm is used to obtaina measure for the lacunarity of the colony ofagents.26,27 First, the colony is coarse-grained byemploying a grid of small box width, R′′ = 1 (inunits of Rmin). Unlike the box-counting method, thenumber of agents within each box is now counted.
Second, the standard gliding box algorithm isimplemented to calculate the lacunarity of thiscoarse-grained colony. The width of the gliding box,R′, is varied and chosen to be an integer multi-ple of R′′. The box is first placed at the upperleft corner of the coarse-graining grid and the num-ber of agents within the box is counted as S′. Thebox is then glided through the whole grid with dis-placement R′′ in each step. The number of occur-rences of a particular value of S′ is counted andrecorded as NR′(S′). This number is normalized bythe total number of gliding boxes of length R′, andthe result is denoted as QR′(S′). By choosing differ-ent integer multiples R′ of the width of the coarse-graining boxes, R′′, Q is obtained as a functionof S′ and R′: Q = QR′(S′) = Q(S′, R′). The firstand second moments of Q over S′ are calculated asZ1 =
∑S′ S′Q(S′, R′) and Z2 =
∑S′ S′2Q(S′, R′),
respectively. Gliding box lacunarity is defined asL(R′) ≡ Z2/Z
21 . The lacunarity plot is a graphical
representation of log10[L(R′)] vs. log10(R′).
4. NUMERICAL RESULTS ANDDISCUSSION
When different values of the parameters A, B, C,D and E are substituted into Eqs. (13) and (14),the agents self-organize into colonies with differentstructures. In Sec. 4.1 the case in which A = 0.25,B = 4, C = 0.5, D = 1 and E = 0.1 is discussed indetail. These values are chosen as the “base case”,because, as we will see, they generate an aggregate
2nd Reading
June 20, 2012 10:43 0218-348X 1250016
Fractal Self-Organization of Bacteria-Inspired Agents 7
similar to DLA, with features observed in real bac-terial colonies on a Petri dish. Then, in Sec. 4.2, wewill explore the large family of spatially structuredpatterns that is formed by changing one parameterat a time.
4.1. Base Case
4.1.1. Visual exploration of theoverall geometry
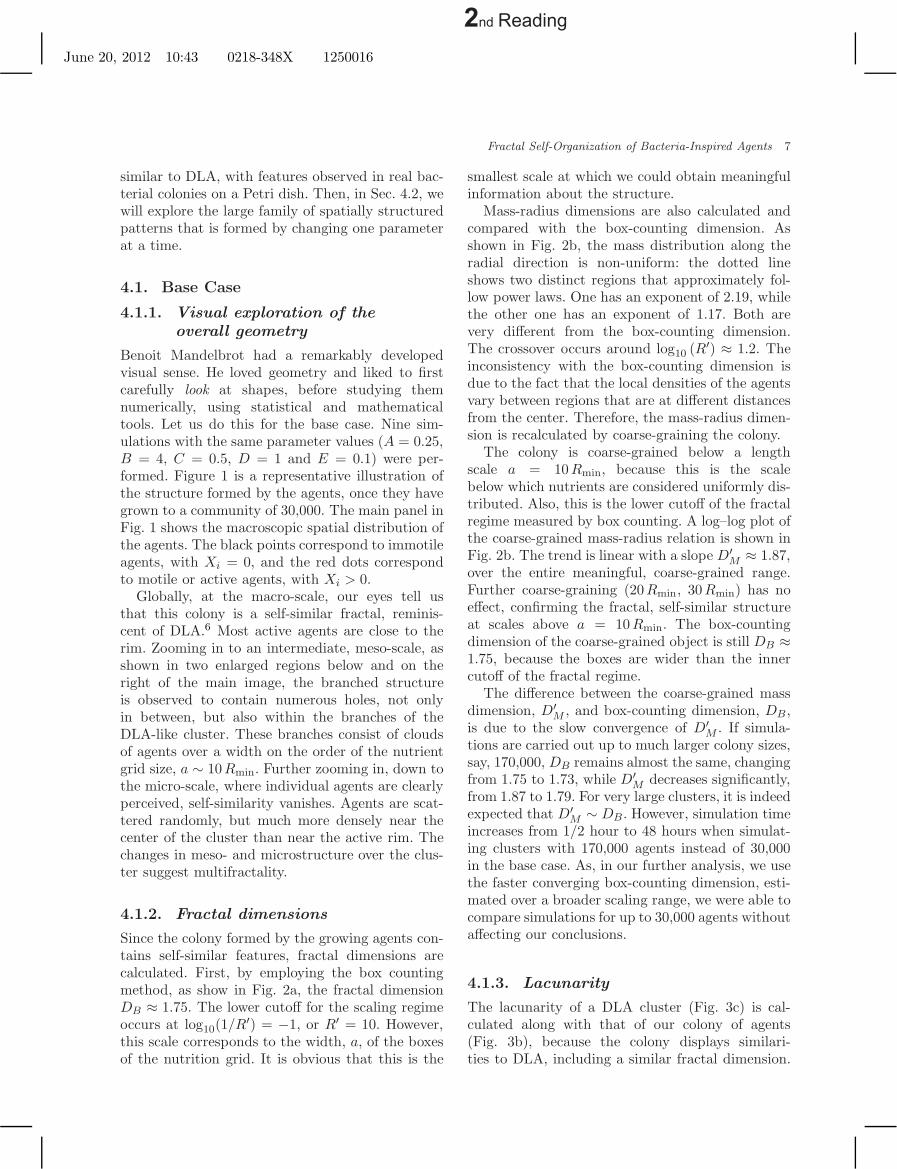
Benoit Mandelbrot had a remarkably developedvisual sense. He loved geometry and liked to firstcarefully look at shapes, before studying themnumerically, using statistical and mathematicaltools. Let us do this for the base case. Nine sim-ulations with the same parameter values (A = 0.25,B = 4, C = 0.5, D = 1 and E = 0.1) were per-formed. Figure 1 is a representative illustration ofthe structure formed by the agents, once they havegrown to a community of 30,000. The main panel inFig. 1 shows the macroscopic spatial distribution ofthe agents. The black points correspond to immotileagents, with Xi = 0, and the red dots correspondto motile or active agents, with Xi > 0.
Globally, at the macro-scale, our eyes tell usthat this colony is a self-similar fractal, reminis-cent of DLA.6 Most active agents are close to therim. Zooming in to an intermediate, meso-scale, asshown in two enlarged regions below and on theright of the main image, the branched structureis observed to contain numerous holes, not onlyin between, but also within the branches of theDLA-like cluster. These branches consist of cloudsof agents over a width on the order of the nutrientgrid size, a ∼ 10Rmin. Further zooming in, down tothe micro-scale, where individual agents are clearlyperceived, self-similarity vanishes. Agents are scat-tered randomly, but much more densely near thecenter of the cluster than near the active rim. Thechanges in meso- and microstructure over the clus-ter suggest multifractality.
4.1.2. Fractal dimensions
Since the colony formed by the growing agents con-tains self-similar features, fractal dimensions arecalculated. First, by employing the box countingmethod, as show in Fig. 2a, the fractal dimensionDB ≈ 1.75. The lower cutoff for the scaling regimeoccurs at log10(1/R′) = −1, or R′ = 10. However,this scale corresponds to the width, a, of the boxesof the nutrition grid. It is obvious that this is the
smallest scale at which we could obtain meaningfulinformation about the structure.
Mass-radius dimensions are also calculated andcompared with the box-counting dimension. Asshown in Fig. 2b, the mass distribution along theradial direction is non-uniform: the dotted lineshows two distinct regions that approximately fol-low power laws. One has an exponent of 2.19, whilethe other one has an exponent of 1.17. Both arevery different from the box-counting dimension.The crossover occurs around log10 (R′) ≈ 1.2. Theinconsistency with the box-counting dimension isdue to the fact that the local densities of the agentsvary between regions that are at different distancesfrom the center. Therefore, the mass-radius dimen-sion is recalculated by coarse-graining the colony.
The colony is coarse-grained below a lengthscale a = 10Rmin, because this is the scalebelow which nutrients are considered uniformly dis-tributed. Also, this is the lower cutoff of the fractalregime measured by box counting. A log–log plot ofthe coarse-grained mass-radius relation is shown inFig. 2b. The trend is linear with a slope D′
M ≈ 1.87,over the entire meaningful, coarse-grained range.Further coarse-graining (20Rmin, 30Rmin) has noeffect, confirming the fractal, self-similar structureat scales above a = 10Rmin. The box-countingdimension of the coarse-grained object is still DB ≈1.75, because the boxes are wider than the innercutoff of the fractal regime.
The difference between the coarse-grained massdimension, D′
M , and box-counting dimension, DB ,is due to the slow convergence of D′
M . If simula-tions are carried out up to much larger colony sizes,say, 170,000, DB remains almost the same, changingfrom 1.75 to 1.73, while D′
M decreases significantly,from 1.87 to 1.79. For very large clusters, it is indeedexpected that D′
M ∼ DB . However, simulation timeincreases from 1/2 hour to 48 hours when simulat-ing clusters with 170,000 agents instead of 30,000in the base case. As, in our further analysis, we usethe faster converging box-counting dimension, esti-mated over a broader scaling range, we were able tocompare simulations for up to 30,000 agents withoutaffecting our conclusions.
4.1.3. Lacunarity
The lacunarity of a DLA cluster (Fig. 3c) is cal-culated along with that of our colony of agents(Fig. 3b), because the colony displays similari-ties to DLA, including a similar fractal dimension.

2nd Reading
June 20, 2012 10:43 0218-348X 1250016
8 Y. Huang, I. Krumanocker & M.-O. Coppens
Fig. 1 Multi-scale structure of a colony formed by agents that propagate according to the “base case” scenario. Each agentis represented by an individual dot. The large central panel shows a macroscopic view of the entire colony. The figures on theright and bottom are enlarged regions of the colony, at two different levels of magnification, corresponding to a meso-scale(branches of finite width and variable density) and the micro-scale (individual branches). Red points represent active, motileagents (Xi > 0), while black points represent immotile agents (Xi = 0).
Figure 3a shows that the lacunarity curves of bothstructures almost coincide, but that the lacunar-ity of the colony is slightly larger across all scales.This means that the agents of the colony are lessuniformly spaced, on average, than the elements inDLA. At first, this seems to be a surprising result,because the colony consists of scattered agents at
the micro-scale (Fig. 1), unlike DLA, in which theindividual elements are attached to one another.An explanation for this result is that the branchesin the colony (meso-scale) are denser than thebranches in DLA. When Figs. 3b and 3c are coarse-grained to the meso-scale (above scale a), DLAand the colony are almost indistinguishable. The

2nd Reading
June 20, 2012 10:43 0218-348X 1250016
Fractal Self-Organization of Bacteria-Inspired Agents 9
(a) (b)
(c)
Fig. 2 Plots to estimate the fractal dimension of the colony in Fig. 1. The left graph is the box-counting plot with slopeDB ≈ 1.75. The middle graph includes the standard mass dimension plot (· · ·), and plots to estimate the mass dimension,D′
M , after coarse-graining with box widths of 10Rmin = a (∗∗∗), 20Rmin (◦ ◦ ◦) and 30Rmin(+++). The graph on the rightshows the resulting colony (in units of Rmin) after coarse-graining below scales 10Rmin = a.
lacunarity plot provides quantitative informationto both the similarity and the differences betweenDLA and the base case.
4.1.4. Mass distribution of theagents
The structure of the colony is a result of the activemotions and divisions of the agents. The dynamicsof the growing colony can be understood by exam-ining the masses of the agents, because the actionsperformed are determined by their masses.
As shown in Fig. 1, the active agents spreadsparsely at the tips of the growing branches. The
number of active agents is small compared to thetotal population of the colony. Only 1.15± 0.05%of the agents are active, but their role is crucial tothe growth of the colony.
Each active agent behaves differently. As shownin Fig. 4, there is a mass distribution. The averagemass of the active agents is X ≈ 0.5 (m = 1.5mmin),which also happens to be a peak in the distribution.This is due to the special conditions at both endsof the mass distribution. At X = 0 (m = mmin),agents are no longer able to move, because theirmass, and associated metabolism, is insufficient togenerate kinetic energy. If the agents are also in the

2nd Reading
June 20, 2012 10:43 0218-348X 1250016
10 Y. Huang, I. Krumanocker & M.-O. Coppens
(a) (b)
(c)
Fig. 3 Lacunarity plot (a) and comparison of the base case colony (b) and a DLA cluster (c), consisting of 30,000 agentseach. (a) In the lacunarity plot on the left, (∗∗∗) or — represents the lacunarity of the colony, and (◦ ◦ ◦) or — representsthe lacunarity of the DLA cluster. (c) The DLA cluster on the right is drawn at the same scale as the colony in the middlegraph, (b).
region less accessible to nutrition, it is very likelythat the agents will stay immotile indefinitely. AtX = 1 (m = 2mmin), agents divide, so that thenumber of agents of this mass is always 0, while anactive agent that has just grown to a mass X = 1divides into active agents of mass X = 0, which isone reason for the peak near X = 0+. The combi-nation of the conditions at X = 0 and X = 1 leadsto an average mass of X = 0.5 when a dynamicequilibrium has been reached. Scatter in the distri-bution is due to the small number of active agents(345 ± 14).
The peak at X = 0+ corresponds to starv-ing agents, entering the immotile state, or agentsresulting from division. It is also possible that someinactive agents become active again by absorbinga minor amount of nutrition that reaches them via
diffusion. X = 0− is the highest peak, by far, and isnot shown in the figure, because it is three orders ofmagnitude higher. It corresponds to inactive agents,which contribute to the main, quasi-static structureof the colony, because they are stationed at certainlocations.
4.2. Parametric Study
The colony discussed in the previous section is justone example of a large family of organizations gener-ated by the agent-based model. By changing the val-ues of the parameters, other organizations emerge.In order to understand the effects of each parame-ter, one parameter is changed at a time, while thevalues of the other parameters are kept the same asin the base case.

2nd Reading
June 20, 2012 10:43 0218-348X 1250016
Fractal Self-Organization of Bacteria-Inspired Agents 11
0 0.2 0.4 0.6 0.8 10
10
20
30
40
Fig. 4 Absolute frequencies of the dimensionless mass, X,of the active, motile agents in the base-case simulation. Mostagents are immotile, with X = 0−.
4.2.1. Effect of kinetics (A)
A is the most influential parameter in the model,because it is directly related to the kinetics ofabsorption of nutrients by the agents. Mathemat-ically, this parameter links the Eq. (13) for thenutrition layer to those for the system of agents,Eq. (14). Therefore, the structure of the colony isstrongly dependent on A = KM/Cmax, which isthe Michaelis-Menten constant made dimensionlessby division by the maximum (initial) concentra-tion of nutrients. As A approaches 0, the absorp-tion kinetics, which are proportional to Y/(Y +A), can be approximated as zeroth-order (con-stant). On the other hand, when A is large (A �Y ), the absorption of nutrition can be approxi-mated as first-order with reduced rate constant(∼ Y/A).
Numerical simulations were performed for A = 0to 4, with increments of 0.4. The structure of thecolony strongly depends on A. Figure 5a is a plotof the box-counting dimension, and Fig. 5b showsthe ratio of active agents to non-active agents, bothas a function of A. The graphs show similarities,namely: when A is close to 0, the slope is large andpositive; when A is high, the slope is large and neg-ative; and when A has an intermediate value, theslope is small and negative. It is obvious that thesethree regions correspond to different types of orga-nization, as shown in Fig. 5c.
The first region, where A → 0, represents organi-zations with zeroth-order absorption kinetics. Local
nutrition concentration is depleted to 0 at itsmaximum rate, according to Eq. (5), since it is lin-ear in time and does not depend on its current level.As a result, nutrition from outside of the colonyis not able to diffuse to the inside of the colony,because it is quickly absorbed by the agents atthe perimeter. The number of active agents is thusdecreasing as A → 0, as shown in Fig. 5b. Due tothe fast depletion rate of nutrients, agents movingin a radial direction are favored because it allowsthem to grow further. This selection of a particulardirection is responsible for the thin branches shownin the first colony in Fig. 5c, which reminds us of thelightning-like, fractal patterns formed by the dielec-tric breakdown model (DBM).10 As expected, thebox-counting dimension of these colonies is low, asshown in Fig. 5a.
The other extreme, for which A � 1 ≥ Y , corre-sponds to first-order absorption kinetics. Contrar-ily to the high absorption rate in the zeroth-orderreaction, nutrition is not depleted as quickly. How-ever, despite the presence of nutrients, the num-ber of active agents does not keep increasing. Thisis because agents consume their mass to generatekinetic energy, and they shrink when the absorptionrate is so low that it does not counter-balance therequired metabolic energy. Hence, the mass of eachagent tends to its minimum (X = 0), and the agentbecomes immotile. The result is a non-fractal colonywith few branches. A typical example, for A = 4,is shown in the rightmost panel of Fig. 5c. A box-counting dimension slightly above 1 is obtained, butthis non-integer value is biased by the small size ofthe colony.
For intermediate values of A, the agents self-organize into colonies with a fractal structure. Asharp maximum was obtained around the base case(A = 0.25), for which the box-counting dimen-sion of 1.75 is close to that of DLA. Coloniesfor higher values of A, but below 4, also havea self-similar structure of gradually decreasingbox-counting dimension. Interestingly, these orga-nizations keep growing up to and beyond the max-imum simulated size of 30,000 agents. For the basecase, a simulation up to 170,000 agents did notreveal differences in the general structure of thecolony.
The presence of three regimes demonstrates howstrongly the self-organization depends on the kinet-ics of absorption (0th order, Michaelis-Menten, 1storder kinetics), which is governed by the value of A.Interestingly, the transition between these “phases”

2nd Reading
June 20, 2012 10:43 0218-348X 1250016
12 Y. Huang, I. Krumanocker & M.-O. Coppens
(a) (b)
(c)
Fig. 5 Effects of A on the colony. (a) Relationship between the box-counting dimension of the colony and the parameter A.(b) Relationship between the ratio of the number of active agents to the number of non-active agents, and the parameter A.(c) Structures of colonies for A = 0, A = 1.6 and A = 4.
is due to the fact that the colonies reach a steadystate, consisting of a finite number of agents, belowand above critical values of A. We do not giveexplicit values for these critical thresholds, as longersimulations will need to be carried out to determinethem with sufficient precision, but Fig. 5b gives agood qualitative indication.
The general dynamics of the agent-based sys-tem are determined by the absorption of nutri-tion, which allows individual agents to move anddivide, expanding the colony. However, these twoactions — motion and division — have oppositeeffects on the total mass of the colony, becauseabsorption increases mass, while motion consumesmetabolic energy, hence decreases mass. When thecolony reaches a certain size, the effects of the twoactions cancel each other, leading to a steady state.
This happens both for 0th and 1st order kinetics,so that the colony reaches a finite size in both situ-ations, even though the steady-state morphology ofthe system is very different. For example, the num-ber of agents for A = 0 stops increasing when itreaches 7200± 190. It is expected that the interme-diate regime in Fig. 5 becomes narrower when thesimulations are carried out beyond an allowed max-imum of 30,000 agents, because some colonies forintermediate values of A begin to reach a steadystate. At this stage, it cannot be stated for cer-tain whether the colony will be able to maintainindefinite growth within a certain range of valuesof A. For nutrient layers that are not infinitelyextended, the boundary conditions for the nutri-ents (Dirichlet or Neumann) could play a role aswell.
2nd Reading
June 20, 2012 10:43 0218-348X 1250016
Fractal Self-Organization of Bacteria-Inspired Agents 13
4.2.2. Effects of parameters relatedto agent motion and theconsumption of nutrients(B, C and E)
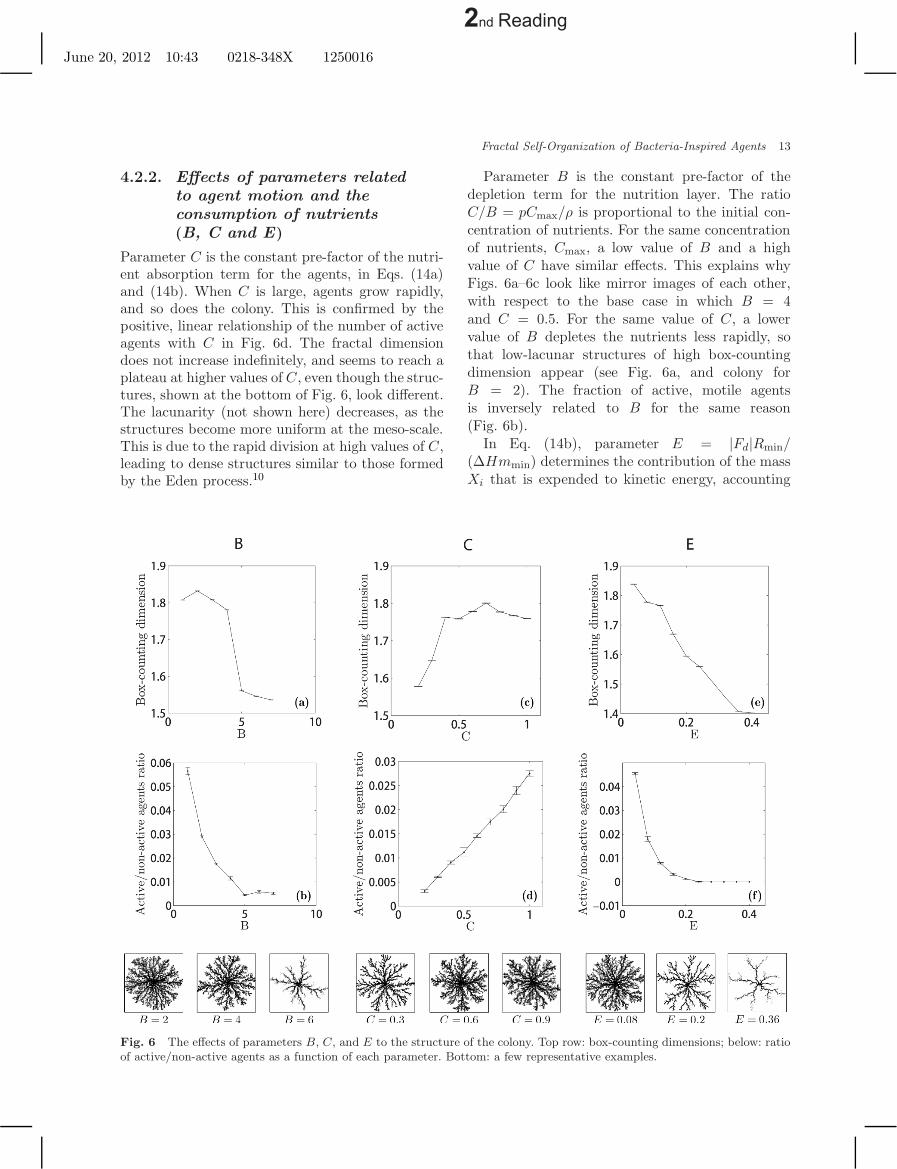
Parameter C is the constant pre-factor of the nutri-ent absorption term for the agents, in Eqs. (14a)and (14b). When C is large, agents grow rapidly,and so does the colony. This is confirmed by thepositive, linear relationship of the number of activeagents with C in Fig. 6d. The fractal dimensiondoes not increase indefinitely, and seems to reach aplateau at higher values of C, even though the struc-tures, shown at the bottom of Fig. 6, look different.The lacunarity (not shown here) decreases, as thestructures become more uniform at the meso-scale.This is due to the rapid division at high values of C,leading to dense structures similar to those formedby the Eden process.10
Fig. 6 The effects of parameters B, C, and E to the structure of the colony. Top row: box-counting dimensions; below: ratioof active/non-active agents as a function of each parameter. Bottom: a few representative examples.
Parameter B is the constant pre-factor of thedepletion term for the nutrition layer. The ratioC/B = pCmax/ρ is proportional to the initial con-centration of nutrients. For the same concentrationof nutrients, Cmax, a low value of B and a highvalue of C have similar effects. This explains whyFigs. 6a–6c look like mirror images of each other,with respect to the base case in which B = 4and C = 0.5. For the same value of C, a lowervalue of B depletes the nutrients less rapidly, sothat low-lacunar structures of high box-countingdimension appear (see Fig. 6a, and colony forB = 2). The fraction of active, motile agentsis inversely related to B for the same reason(Fig. 6b).
In Eq. (14b), parameter E = |Fd|Rmin/(∆Hmmin) determines the contribution of the massXi that is expended to kinetic energy, accounting

2nd Reading
June 20, 2012 10:43 0218-348X 1250016
14 Y. Huang, I. Krumanocker & M.-O. Coppens
for metabolic conversion (enthalpy change ∆H).Note that E = 0.1 corresponds to the base case. Eis the pre-factor of the negative term in Eq. (14b),while C is the pre-factor of the positive term.Therefore, it is logical that both the fraction ofactive agents and the fractal box-counting dimen-sion decrease with E. High values of E lead to aLichtenberg-like (DBM) pattern. At high values ofE the number of active agents tends to zero, so thata steady-state population is reached; E is thereforeanother important parameter to control the sys-tem properties. Furthermore, Fig. 6e shows that thefractal dimension is approximately linear in E overthe investigated range. This is a useful feature whennature-inspired systems are designed.
(a) (b)
(c)
Fig. 7 Effect of dimensionless diffusivity of the nutrients, D, on the structure of the colony. (a) Top left: Box-countingdimension vs. log10 (D). (b) Top right: Ratio of active/non-active agents as a function of D.
4.2.3. Effect of the diffusivityof the nutrients (D)
Parameter D is the dimensionless diffusivity ofnutrients in the nutrition layer. It only appears inEq. (13). The structures obtain their characteristicshapes mainly due to the limiting diffusion of nutri-ents to the agents, whose actions depend entirelyon how much nutrition they are able to absorb.Parameter D is, therefore, the main determinantof the branching process. Note that the scale inFig. 7a is logarithmic. The base case correspondsto log(D) = 0. A family of branching patterns isformed within a quite narrow range of D. When Dis very large (D > 10, log(D) > 1), agents have easy

2nd Reading
June 20, 2012 10:43 0218-348X 1250016
Fractal Self-Organization of Bacteria-Inspired Agents 15
access to nutrition, which leads to similar effects asa high value of parameter C, but even more pro-nounced: the box-counting dimension saturates toa high value, as the colony becomes close to space-filling, and a linear relationship between the numberof active agents and D is observed (Fig. 7b). At lowvalues of D, the organization is DLA-like.
5. CONCLUSIONS ANDOUTLOOK
Inspired by the adaptive behavior of bacterialcolonies, we wish to design adaptive materials shar-ing similar properties. This study serves as a the-oretical, exploratory basis for future experimentsto develop these types of materials. Already, thesimple agent-nutrient model in this study has beenable to generate a variety of fractal and non-fractal structures of widely different geometry. Theparametric study will be extended to include thesimultaneous variation of multiple parameters. Mul-tifractal formalisms, a deeper study of lacunar-ity, and a characterization of the dynamics shouldprovide more detailed information beyond what isdiscussed in this introductory paper.
Although this agent-based system shows similar-ities to models that have been used to describe bac-terial colonies, it is essentially different. First, thismodel could be used to design both biotic and non-biotic systems, while the bacterial colony modelsare targeted at bacterial systems, which they aim torepresent. Second, the model is based on physicallyrealizable assumptions in non-biological systems. Itis aimed less at being a reductionist approach for abiological system (for which it would be overly sim-plistic), than at offering a nature-inspired designmethodology for non-biological systems (for whichit contains as simple as possible ingredients to pro-duce highly complex dynamics and morphologies).
The diffusion-reaction equations and the equa-tions of motion are derived according to realis-tic physical laws. On the contrary, many bacterialcolony models in the literature are based onassumptions unique to bacterial colonies. Moreover,in many of the bacterial colony models, the activeand non-active states are defined as an assump-tion to the model to generate the desired branchingstructures. In our model, the active (motile) andnon-active (immotile) states are the consequence ofa mass-energy balance. Agents can be non-active atone moment and active at another moment, as longas nutrition is supplied.
Another remarkable result is that many of thesystems generated from the presented model reacha dynamic steady state with a finite, limit number ofagents. The values of the critical thresholds of theparameters, in terms of whether a system reachessuch a dynamic steady state, should be evaluatedas a function of system size and simulation time.The ability to control growth up to a certain size isuseful for the synthesis of real materials: as long asthe initial condition is set, the system is guaranteedto aggregate into a structure of a certain morphol-ogy when the steady state is reached. It would alsobe interesting to explore the consequences for bio-logical systems, e.g., tumor growth.
The agent-nutrition model discussed in this studyis simple, but easily extended to include the effectsof quorum sensing, additional transmitters andreceptors, as well as different agent dynamics orkinetics. Some of these extensions will be consid-ered in future work, especially when they allow usto realize qualitatively different behavior. Even so,we strive for the simplest nature-inspired represen-tation that could be realistically applied to designmaterials or systems with a desired, adaptive col-lective response by means of self-replicating agents.
REFERENCES
1. B. B. Mandelbrot, The Fractal Geometry of Nature(Freeman, San Francisco, 1983).
2. B. B. Mandelbrot, Fractals and Chaos : The Man-delbrot Set and Beyond (Springer, New York, 2004).
3. J. von Neumann, The general and logical theoryof automata, in: Collected Works, ed. A. H. Taub,Vol. 5 (Pergamon Press, UK, 1961), pp. 288–326.
4. J. von Neumann and A. W. Burks, Theory of Self-Reproducing Automata (University of Illinois Press,Urbana, 1966).
5. B. B. Mandelbrot, Private communication, see alsohttp://www.webofstories.com (2011).
6. T. A. Witten and L. M. Sander, Diffusion-limitedaggregation: A kinetic critical phenomenon, Phys.Rev. Lett. 47 (1981) 1400–1403.
7. B. L. Bassler, How bacteria talk to each other: Reg-ulation of gene expression by quorum sensing, Curr.Op. Microbiol. 2 (1999) 582–587.
8. Y. Bozorgi and P. T. Underhill, Effect of vis-coelasticity on the collective behavior of swimmingmicroorganisms, Phys. Rev. E 84(6) (2011) 061901.
9. M. Ohgiwari, M. Matsushita and T. Matsuyama,Morphological changes in growth phenomena of bac-terial colony patterns, J. Phys. Soc. Japan 61 (1992)816–822.

2nd Reading
June 20, 2012 10:43 0218-348X 1250016
16 Y. Huang, I. Krumanocker & M.-O. Coppens
10. T. Vicsek, Fractal Growth Phenomena, 2nd Edition(World Scientific, Singapore, 1992).
11. T. Matsuyama, R. M. Harshey and M. Matsushita,Self-similar colony morphogenesis by bacteria as theexperimental model of fractal growth by a cell pop-ulation, Fractals 1(3) (1993) 302–311.
12. E. Ben-Jacob, O. Schochet, A. Tenenbaum,I. Cohen, A. Czirok and T. Vicsek, Communication,regulation and control during complex patterning ofbacterial colonies, Fractals 2(1) (1994) 15–44.
13. M. Matsushita, J. Wakita, H. Itoh, I. Rafols, T. Mat-suyama, H. Sakaguchi and M. Mimura, Interfacegrowth and pattern formation in bacterial colonies,Physica A 249 (1998) 517–524.
14. C. I. Golding, Y. Kozlovsky and E. Ben-Jacob,Continuous and discrete models of cooperation incomplex bacterial colonies, Fractals 7(3) (1999)235–247.
15. M. Kolb, R. Botet and R. Jullien, Scaling of kinet-ically growing clusters, Phys. Rev. Lett. 51 (1983)1123–1126.
16. D. A. Kessler, J. Koplik and H. Levine, Patternselection in fingered growth phenomena, Adv. Phys.37 (1988) 255.
17. E. Ben-Jacob and P. Garik, The formation of pat-terns in non-equilibrium growth, Nature 343 (1990)523–530.
18. F. Family and T. Vicsek (eds.), Dynamics of FractalSurfaces (World Scientific, Singapore, 1991).
19. J. A. Shapiro and M. Dworkin, Bacteria as Multicel-lular Organisms (Oxford University Press, Oxford,1997).
20. E. Ben-Jacob, Social behavior of bacteria: Fromphysics to complex organization, Eur. Phys. J. B65 (2008) 315–322.
21. J. Shong, M. R. J. Diaz and C. H. Collins,Towards synthetic microbial consortia for bio-processing, Curr. Opin. Biotechnol., doi:10.1016/j.copbio.2012.02.001 (212).
22. M.-O. Coppens, Nature inspired chemical engi-neering — learning from the fractal geometryof nature in sustainable chemical engineering, inFractal Geometry and Applications : A Jubilee ofBenoit Mandelbrot, Vol. 72 of Proceedings of Sym-posia Pure Mathematics, eds. M. L. Lapidus andM. van Frankenhuijsen (American MathematicalSocity, 2004), pp. 507–532.
23. M.-O. Coppens, Scaling up and down in a natureinspired way, Ind. Engng Chem. Res. 44 (2005)5011–5019.
24. S. Kjelstrup, M.-O. Coppens, J. Pharoah andP. Pfeifer, Nature-inspired energy and material effi-cient design of a polymer electrolyte membrane fuelcell, Energ. Fuel 24(9) (2010) 5097–5108.
25. M.-O. Coppens, A nature-inspired approach to reac-tor and catalysis engineering, Curr. Opin. Chem.Eng., doi:10.1016/j.coche.2012.03.002 (2012).
26. R. E. Plotnick, R. H. Gardner, W. W. Hargrove,K. Prestegaard and M. Perlmutter, Lacunarity anal-ysis: A general technique for the analysis of spatialpatterns, Phys. Rev. E 53(5) (1996) 5461–5468.
27. C. R. Tolle, T. R. McJunkin and D. J. Gorsich, Anefficient implementation of the gliding box lacunar-ity algorithm, Physica D 237 (2008) 306–315.
APPENDIX
A.1 List of Variables
Variable Unit Description
Cn kg/m2 Concentration of nutrients
mi kg Mass of agent i
rn kg/(m2s) Depletion rate of nutrients per unit area
R(mi) m Radius of agent i
Si m2 Area of agent i
t s Time
vi m/s Velocity of agent i
v′i Dimensionless Dimensionless velocity of agent i
Wi J Amount of work done by agent i
Xi Dimensionless Dimensionless mass of agent i
Y Dimensionless Dimensionless nutrient concentration
τ Dimensionless Dimensionless time

2nd Reading
June 20, 2012 10:43 0218-348X 1250016
Fractal Self-Organization of Bacteria-Inspired Agents 17
A.2 List of Parameters
Parameter Units Description
a m Width of the unit boxes in the nutrition grid
Cmax kg/m2 Maximum concentration of food. Since food is being depletedby the agents, Cmax is also the initial concentration of food
DC m2/s Diffusion coefficient of nutrients
Fd N Drag force
∆H J/kg Enthalpy change in converting mass to metabolic energy
KM kg/m2 Constant in Michaelis-Menten kinetics
mmin kg Minimum mass of an agent
p Dimensionless Stoichiometric coefficient for the conversion of nutrientsto agent mass
rmax kg/(m2s) Maximum reaction rate in Michaelis-Menten kinetics
vmax m/s Maximum velocity of an agent
µ kg/(m s) Viscosity
ρ kg/m2 Density of an agent