FPO 100 Milverton Drive, Suite 700, Mississauga, Ontario ...€¦ · 100 Milverton Drive, Suite...
134
Chartwell Annual Report
Transcript of FPO 100 Milverton Drive, Suite 700, Mississauga, Ontario ...€¦ · 100 Milverton Drive, Suite...
C h a r t w e l l A n n u a l R e p o r t100 Milverton Drive, Suite 700, Mississauga, Ontario L5R 4H1 1-888-584-2386 www.chartwellreit.ca
Ch
ar
tw
ell A
nn
ua
l Re
po
rt
20
11
FPO

Table of contents
Corporate Overview 01
Our Vision, Our Values, Our Mission 06
Corporate Social Responsibility 07
Report to Unitholders 10
Strategic Look Ahead 14
Corporate and Unitholder Information 16
Year ended December 31 2011 2010Same property occupancy 90.6% 90.3%
Same property net operating income (“NOI”) 156,719 153,122
Adjusted funds from operations (“AFFO”) (1) 86,530 80,139
AFFO per unit diluted (1) 0.59 0.60
Funds from operations (“FFO”) (1) 96,447 89,282
FFO per unit diluted (1) 0.66 0.67
Distributions declared 78,446 72,133
Distributions declared per unit 0.54 0.54
Distributions declared as percentage of AFFO 90.7% 90.0%
Weighted average number of units outstanding, diluted (000s) 145,846 132,998
(1) Refer to the “Key Performance Indicators” section of the Management’s Discussion and Analysis (“MD&A”) for a discussion of the nature of various adjustments made in the calculation of AFFO, FFO and per unit amounts.
Highlights of Consolidated Results of Operations In thousands of
Canadian dollars, except per unit amounts and number of units.
01Corpo ra t e Ove r v i ew Annual Report 2011
Corporate Overview
Chartwell is a real estate investment trust that owns and operates seniors
housing communities. We are one of the largest participants in the seniors
housing business in North America. With a strong management team in
place, and now over 13,800 employees across Canada, Chartwell’s vision is
a singular and shared focus on “Making People’s Lives Better.” Our aim is
to deliver on that commitment by providing quality care and a wide range
of services to our residents, offering comfort and peace of mind to their
families and creating a rewarding work environment for our employees while
building long-term value for our investors.
ResidentsWe want our residents to know that the care and services they receive in a Chartwell home will make their lives happier, healthier and more meaningful.
• Commitmenttoprovidingthehighestqualityofcareandawiderangeofservicestoourresidents
• Offeringenrichinglifestyleprogrammingthroughoursignatureinitiativessuchas“LiveNow”
• Acompletecontinuumofseniorshousingfromindependentsupportivelivingthroughassistedlivingtolongtermcare
“ We want our residents and their families to know that the Chartwell name
stands for quality care and exceptional services in every home we operate.”
Karen Sullivan, Chief Operating Officer
“Who we are and what we do”

02 Annual Report 2011 Co rpo ra t e Ove r v i ew

03Corpo ra t e Ove r v i ew Annual Report 2011
Family MembersWe want family members to feel reassured that their loved ones are well, active and engaged in life while living in one of our retirement or long term care homes.
“Your team role models so well what care providers
for the geriatric population should be. As her
children, we have been able to carry on with our
jobs, meet the expectations of our employers
and our own family’s needs, all the time knowing
mom was in excellent hands and that she was
enjoying her stay and felt safe and comfortable.”
Family Member, Queen’s Square Terrace
• Weseeourresidents’familiesasanimportantpartoftheChartwellfamily
• Increasingly,adultchildrenaresupportingtheirparentsinthedecision-makingprocessregardingseniorshousing
• Chartwellbelievesdecisionmakingshouldbebasedonindividualneeds;weareheretohelpandguidefamiliesinthisprocess

04 Annual Report 2011 Co rpo ra t e Ove r v i ew
EmployeesAt Chartwell, we are people taking care of people, and we want our employees to know that their contributions are valued and appreciated.
• Chartwellisproudofthecommitment,dedicationanddiversityofitsemployees
• Togetherwestrive,notonlytotakecareofpeople,buttomakeadifferenceintheirlives
• WeareboundbyoursharedcommitmenttoourRESPECTvaluesandto“Making People’s Lives Better”
“ Everyone is different, but what we offer is a lifestyle that I truly believe can make people’s lives better.”
Victoria Jackson, Sales Manager, Crescent Gardens, Surrey, BC Victoria was featured in Chartwell’s third
annual People Making a Difference book.

05Corpo ra t e Ove r v i ew Annual Report 2011
UnitholdersWe want our unitholders to reap the benefit of their investment in us.
• Ourseniormanagementteamhasdecadesofexperienceinallaspectsofmanagementofseniorshousingcommunitiesaswellasinfinance,acquisitionsanddevelopment
• Chartwell’ssolidfinancialperformanceandpositionisgearedtobuildinglong-termvalueforourinvestors
• Wecontinuetoseeverypositivemarketfundamentals,includingstronglong-termdemographictrends,aswellasadiversifiedportfolioacrosskeyNorthAmericanmarkets
CommunityWe believe in building and sustaining strong community relationships. Our charitable giving partnerships and community initiatives are directed toward projects that support seniors in meaningful ways including lifestyle, health and safety.
• Chartwellisproudtohaveraised$100,000fortheCanadianDiabetesAssociationin2011
• $15,000hasbeenraisedtodatefortheWarAmps–OperationLegacythroughsalesofthe HONOURbook
• OurhomesacrossCanadavolunteeranddonatetoavarietyofcommunityinitiatives,raisingbothfundsandawareness
“ We are committed to building value through a focus on operational excellence, continuous investments in improvements and upgrades to our real estate assets, and prudent management of our financial resources.” Vlad Volodarski, Chief Financial Officer
“ We sincerely thank Chartwell for supporting our mission to help people with diabetes live healthy lives while we work to find a cure. Companies like Chartwell enable us to continue to provide valuable diabetes education and services in communities across Canada.”
Michael Cloutier, President and CEO, Canadian Diabetes Association

Our ValuesRespect We honour and celebrate seniors
Empathy We believe compassion is contagious
Service We believe in providing excellence Excellence in customer service
Performance We believe in delivering and rewarding results
Education We believe in lifelong learning
Commitment We value commitment to the Chartwell family
Trust We believe in keeping our promises and doing the right thing
Our MissionTo be the most trusted name in seniors housing
To provide accommodation, care and services in every home, reflective of our residents’ needs, preferences and interests, and to adapt as they evolve
To ease the transition through the various stages of aging by providing a full continuum of care in the markets we serve
To provide comfort and assurance to the families of our residents that their loved ones are treated with the highest level of care, compassion and respect
To attract and retain the best employees by providing a rewarding and fulfilling work environment
To generate reliable, sustainable and growing distributions for our unitholders
06 Annual Report 2011 Vi s i on , Va lues , M i ss i on
Ou
r V
isio
n
ChartwellSeniorsHousing

In our 2010 Annual Report, we launched our first annual Corporate Social Responsibility (“CSR”) report, entitled “Trust Through Accountability.” OurgoalincreatingandreportingonourCSRistoearnthetrustofourstakeholdersbycontinuingtoholdourselvesaccountableandby
continuallyseekingwaystomakeadifferenceinthelivesofthepeopleweserve.
Wehavefivekeyareasbywhichwebenchmarkbothourcommitmentsandprogressannually:EmployeeEngagement,ResidentExperience,
CorporateGovernance,CommunityInvestmentandEnvironmentalStewardship.Thesearetheareasinwhichwestrivetoliveuptoaspart
ofoursharedcommitmentto“Making People’s Lives Better.”
CSR Definition: “…the way firms integrate social, environmental and economic concerns into their values, culture, decision making, strategy and operations, in a transparent and accountable manner…” Industry Canada
Employee Engagement
CorporateGovernance
Community Investment
ResidentExperience
EnvironmentalStewardship
Corporate Social Responsibility
“Trust Through Accountability”
07Corpo ra t e Soc ia l Respons ib i l i t y Annual Report 2011

08 Annual Report 2011 Co rpo ra t e Soc ia l Respons ib i l i t y
Employee Engagement 2011 Objectives
- Expand internal training and education initiatives for employees
- Implement a coaching culture initiative
- Create and foster a culture of recognition for all employees
- Explore a strategy to recognize the cultural diversity of our employees
- Participate in Occupational Health & Safety groups
2011 Results
- Introduction of General Managers and Administrators training program (“GAP”) to prepare our future leaders from today’s internal candidates
- Orientation training for new General Managers and Administrators
- Over 80 General Managers and Administrators across Canada received six months of coaching
- Launch of “Connecting the Pieces” Recognition Guide and Toolkit
- Safety Group initiative launched in 2011; Health & Safety training and awareness sessions held across Canada
2012 Objectives
- Respectful integration of approximately 2,400 new employees through the Maestro portfolio acquisition
- Expand GAP program to mentor nurses to become Resident Services Managers and Directors of Care
- Develop internal customer service training programs
- Continue to improve orientation programs for all employees
- Increase Town Hall meetings with employees
- Continue to implement safety groups and support employee awareness of Occupational Health and Safety
- Develop an inclusivity communications initiative to recognize the cultural diversity of our employees
Resident Experience2011 Objectives
- Enhance resident quality of life
- Expand research to identify new initiatives to better meet resident needs
- Raise awareness of risk issues for seniors
- Explore tools to help with the decision-making process of choosing and transitioning to seniors housing
2011 Results
- “LiveNow” life enrichment programming launched in all our homes, themed around Learn, Move, Create
- Dedicated enhanced-care floors in two new retirement homes (Wynfield and Westmount)
- Expansion of our Advantage Plus program offering additional care and services to residents, as needed
- Participation of all our long term care homes in the Ministry of Health & Long Term Care’s “Resident’s First” quality initiative
- Construction started on four long term care rebuilds across Canada to modernize facilities for residents
- Resident surveys initiated for new residents after two months of residency
- Three external focus groups conducted
- Monitored risk issues (ie: fraud against seniors) on behalf of our residents
- Sponsored the first-ever Canadian Living “Elder-Care Guide” for adult children; copies available in our homes
2012 Objectives
- Promote resident-focused innovations in our homes through three key objectives: Standardized student volunteer program; Standardized vocational program to allow residents to give back to their communities; and Standardized physical fitness program
- Launch new resident contact program
- Enhance dining services program
- Implement an orientation program for new residents

09Corpo ra t e Soc ia l Respons ib i l i t y Annual Report 2011
Corporate Governance2011 Objectives
- Manage risk through quarterly reviews by the Board of Directors of risk-related issues
- Ensure privacy policies are known to residents and employees
- Ensure full compliance with all new and existing provincial legislation
- Maintain a leadership position for public disclosure and corporate governance standards
2011 Results
- Quarterly Risk Management reports received and reviewed by the Board of Directors
- Release of “National Privacy Toolkit” that includes brochures for residents and family members and training for staff on Resident Privacy Rights, Understanding and Protecting Personal Health Information and Preventing Spyware
- Preparation and training for the new Ontario Retirement Homes Act in place; compliance with all other government legislation governing retirement and long term care homes is regularly monitored
- Increased ranking in Globe & Mail’s “Board Games” to 19th place out of 253 companies reviewed; effectively 2nd place for Income Trusts with Internal Management (previously 4th)
2012 Objectives
- Provide information workshops for Board members
- Ensure full compliance with all new and existing provincial legislation including new Ontario Retirement Homes Act and regulations
- Continue to maintain a leadership position for public disclosure and corporate governance standards
Community Investment2011 Objectives
- Launch a new corporate giving partnership with the Canadian Diabetes Association (“CDA”)
- Continue sales of HONOUR, with net proceeds donated to veterans’ associations
- Continue to highlight and support important community-based initiatives of our employees across Canada
2011 Results
- Over $100,000 raised for the CDA in the first year of the partnership; “Recipes for Health” cooking and nutrition seminars launched as events in our homes to raise awareness of nutrition management for those at risk or living with diabetes
- The HONOUR book has sold over 5,000 copies across Canada and over $15,000 has been donated to the War Amps – Operation Legacy and $2,500 donated to the Royal Canadian Legion
- Released “HONOUR: Their Stories, Our History” a documentary featuring the veterans interviewed for the book
- Supported by our homes of many community initiatives including fundraising for the Alberta Diabetes Foundation, Calgary Veteran’s Food Bank, Heart & Stroke Association, Run for the Cure, CURE Foundation, Alzheimer Society Memory Walks, and the Peel Family Shelter
2012 Objectives
- Continue corporate giving partnership with the Canadian Diabetes Association; expand health information opportunities for employees and residents living with diabetes
- Strengthen connections with community organizations that support seniors health and wellness
- Seek new and innovative ways to help build relationships with health care influencers in the communities in which we operate
Environmental Stewardship2011 Objectives
- Explore and use efficient energy reduction measures for our existing homes
- Obtain Leadership in Energy and Environmental Design (“LEED”) certification for our three Ontario long term care home rebuilds
- Integrate LEED features into new developments
2011 Results
- U.S. properties have begun a lighting retrofit program with CFL’s and energy efficient ballasts; 85% complete resulting in decreased energy consumption for homes
- Boiler replacements in Canada to allow for the installation of more energy-efficient units
- Three Ontario long term care rebuilds currently under construction include green features such as water efficient landscaping, purchase of environmentally friendly refrigerants, construction waste management, low-emitting materials, low levels of VOC emissions with paints, thermal comfort monitoring. Expect to achieve LEED certification once completed
- Two new retirement residences currently under construction that utilize many features including solar-control low-E glass, energy efficient hybrid heat pumps, ventilation units equipped with heat recovery wheels, energy efficient lighting and electrical systems
2012 Objectives
- Conduct environmental assessments on acquisition properties
- Hire a dedicated resource to review and implement energy management strategies
- Research internal lighting retrofit program
- Continue to explore environmental features on new developments and rebuilds

Report to Unitholders 2011 Key Strategic Objectives
“ We have designed our key strategic objectives to help us deliver quality care and services to our residents while building long-term value for our investors.” Brent Binions, President and CEO
10 Annual Report 2011 Repo r t t o Un i tho lde r s

11Repo r t t o Un i tho lde r s Annual Report 2011
2011 HighlightsEnhance the quality of our cash flows and grow core property AFFOWe believe that by expanding service offerings, engaging in innovative marketing and sales programs and carefully managing operating costs, we will improve and maintain resident satisfaction, customer traffic and sales closing ratios. We will also continue to maintain our asset management program to ensure each asset is used to its highest potential.
• AFFOfromcorepropertyoperations(excludingcontributionfrommezzanineloansand feerevenue)was95%ofthetotalAFFOin2011comparedto88%in2010and79%in2009
• SamepropertyNOIimprovedby$3.6millionor2.3%in2011
• Samepropertyoccupancyimprovedto90.6%withstrongimprovementsintheU.S.
• Innovativemarketingandsalesstrategydevelopedandlaunchedtoincreasefirstcontacts andimprovesalesclosingratios
Streamline operating processes, improve research and information management We undertake market and customer research in order to better tailor service offerings to our residents and to guide our investments in new properties. We continue to invest in information technology solutions and review operating processes to continuously improve internal efficiencies and better support our employees.
• ThesecondphaseofthebudgetingandforecastingsystemimplementationwassuccessfullycompletedinJuly2011
• Operatingprocessreviewscompletedin2010and2011resultedinmeasurableexpensesavings
Build value through developmentOur objective is to commence up to five new development projects each year to further diversify and strengthen our portfolio.
• TworetirementresidencesinKitchenerandOshawa,Ontario,bothadjacenttoexistingChartwelllongtermcarehomes,openedinMarch2012
• ThreeClassClongtermcarehomeredevelopmentsinOntarioareunderway
• OnelongtermcarehomeredevelopmentinBritishColumbiaisinprogress
Core Property AFFO100%
50%
0%
79%
88%95%
20102009 2011

12 Annual Report 2011 Repo r t t o Un i tho lde r s

13Repo r t t o Un i tho lde r s Annual Report 2011
Carrying Amounts of Mezzanine Loans
60
50
40
30
20
10
0
$55.3
$20.8
$9.6
$ M
illio
ns
2009 20112010
2011 HighlightsAcquire newer properties in our existing marketsWe see good opportunity in our existing key geographic regions of Ontario, Québec, British Columbia and Alberta, and our objective is to expand our presence in these growth markets.
• Invested$197.2millioninacquisitionsofinterestsin17seniorshousingcommunitiesin2011
• InQ12012,weannouncedpartnershipwithHealthCareREITInc.(“HCN”)toacquirea42-propertyportfoliofor$931.0million
Reduce existing mezzanine loan exposureConverting our mezzanine loan investments into equity in the properties or collecting the remaining loans in cash will result in more stable, sustainable and growing AFFO.
• In2011,wereducedourmezzanineloanexposureby$10.3millionaswecollected $8.2millionofloansincashandconverted$2.1milliontoequityintwoproperties
Maintain a strong financial positionA strong balance sheet provides the resources and flexibility to achieve our strategic objectives. We will continue to stagger debt maturities while also gradually reducing our debt levels over time. We continue to finance our properties with long-term debt, while managing interest costs.
• In2011,werenewedoursecuredrevolvingoperatingcreditfacility,improvingtermsandincreasingthelimitto$85million
• InterestCoverageRatioimprovedto1.91xin2011from1.81xin2010
• InQ12012,wecompletedapublicofferingofsubscriptionreceiptsandconvertibledebenturesintheamountof$310.0million

14 Annual Report 2011 S t ra t eg i c L ook Ahead
Strategic Look Ahead
Ontario 36%
Quebec 29%
British Columbia 6%
Alberta 3%
Canada TOTAL 74%
Other US 10%
Florida 7%
Texas 4%
Colorado 4%
New York 1%
U.S. TOTAL 26%
Independent supportive living 56%
Assisted living 27%
Long term care 17%
Going forward, we will continue to build our offering of quality care and innovative services with the goal of “Making People’s Lives Better” for our residents, family members, employees and unitholders.
Lookingahead,webelieve2012willberememberedasayearofaccelerationforChartwell.OurexcitingnewpartnershipwithHCNand
theMaestroportfolioacquisitionconfirmourpositionasthedominantseniorshousingownerandmanagerinCanada.Wewillcontinue
tofocusonsuccessfullyintegratingthisportfolio,locatedinkeygeographicmarkets,whiledeliveringbenefitsbyincreasingoccupancies,
implementingourpurchasingprogramstoachieveexpensereductions,andprioritizinginvestmentsinourinformationtechnologyprojects
tomakeusmoreefficient.
Atthesametime,weremainfocusedonourplanstocompletethepreviouslyannouncedU.S.assetsales,repatriatingtheproceedsbackto
Canadaforfuturegrowthandreducingdebtlevelsinlinewithourexistingstrategy.
Ourexpandedsizeandscopeallowustocontinueourgoalofprovidingmoreservicestoourresidents.Plansarecurrentlyunderwayto
expandserviceofferingsincludingphysiotherapy,dentalservicesandinnovationsinmemorycareprograms.
Wecontinuetobuildonnationalbrandrecognitionwithinnovativemarketingstrategies,whichnowalsoincludeadultchildrenwhoare
increasinglybecomingourfirstpointofcontact.Thisincludestraditionalmediaandnewwebmarketinginitiatives.OurSalesandMarketing
professionalsacrossCanadahavebeentrainedonanadvice-basedsalesprogramtohelpbuildtrustandconnectionwithprospectsduringthe
decision-makingprocess.
Longerterm,wewillcontinuetolookforopportunitiestogrowthecompany,includingthroughourpartnershipwithHCN,withinthe
Canadianmarketastheindustryremainssignificantlyfragmented.Increasinglypositivedemographictrendsforeshadowgrowingdemand
thatwillsupportoccupancygrowthinthecomingyears.
Portfolio composition proforma, post-Maestro portfolio acquisition
Level of careGeographic
location

15St ra t eg i c L ook Ahead Annual Report 2011
Brent Binions President and Chief
Executive Officer
“Chartwell has never
had a stronger mandate
in its history than our
new vision: Making
People’s Lives Better.”
Vlad Volodarski Chief Financial Officer
“Our focus remains on
operational excellence,
continuous investments
in our assets and the
prudent management of
our financial resources.”
Phil McKenzie Executive Vice President,
Marketing & Public Relations
“We see our role as
helping seniors and their
family members find the
option that best suits
their own needs. It is
the right thing to do.”
Karen Sullivan Chief Operating Officer
“ The Chartwell name
stands for quality
care and exceptional
services in every
home we operate.”
Jonathan Boulakia Executive Vice President and General Counsel
“ We strive every day
to earn the trust of our
key stakeholders: our
residents, their family
members, our employees
and our unitholders.”
“ We’re making
strategic decisions
today to help ensure
we continue to be
positioned for success
in the coming years.”
Sheri Annable Executive Vice President, Finance & Administration
Senior Executive Committee

16 Annual Report 2011 Co rpo ra t e and Un i tho lde r I n f o rmat i on
Trustees and/ or Directors
Michael D. Harris, Chair (2) Corporate Director and Consultant Senior Business Advisor, Cassels Brock and Blackwell LLP
André R. Kuzmicki (3)
Executive Director, Program in Real Property, Schulich School of Business, York University
Charles Moses (1) Private Consultant and Chairman Canadian Depository for Securities Ltd.*Retires from the Board May 17, 2012
Huw Thomas (1) Corporate Director*Appointed to the Board February 29, 2012
Lise Bastarache (1) (3) Corporate Director
Sidney P.H. Robinson (1) (2) Corporate Director and Consultant
Sharon Sallows (3) Corporate Director and Consultant
Thomas Schwartz (2) (3) President and Chief Executive Officer Canadian Apartment Properties REIT
W. Brent Binions President and Chief Executive Officer of Chartwell
(1) Audit Committee
(2) Compensation, Governance and Nominating Committee
(3) Investment and Environmental Committee
Officers & Senior Management
W. Brent Binions President and Chief Executive Officer
Karen Sullivan Chief Operating Officer
Vlad Volodarski Chief Financial Officer
Jonathan Boulakia Executive Vice President, General Counsel and Secretary
Sheri Annable Executive Vice President, Finance and Administration
Phil McKenzie Executive Vice President, Marketing and Public Relations
Unitholder Information
Chartwell Seniors Housing Real Estate Investment Trust 100 Milverton Drive, Suite 700 Mississauga, Ontario L5R 4H1 Telephone: (905) 501-9219 Toll free: (888) 584-2386 Facsimile: (905) 501-0813 Website: www.chartwellreit.ca
Auditors - KPMG LLP, Toronto, Ontario
Legal Counsel Osler, Hoskin & Harcourt LLP, Toronto, Ontario
Transfer Agent & Registrar Computershare Investor Services Toronto, Ontario Telephone: (800) 564-6253 Facsimile: (866) 249-7775 Email: [email protected]
Stock Exchange Listing Toronto Stock Exchange (Symbol: CSH.UN)
Unitholder & Investor Contact Vlad Volodarski, Chief Financial Officer Website: www.chartwellreit.ca
Annual Meeting of Unitholders 4:30pm ET - Thursday, May 17, 2012 St. Andrew’s Club and Conference Centre 150 King Street West, Toronto, Ontario
Corporate and Unitholder Information
Distribution Reinvestment Plan
Chartwell’s Distribution Reinvestment Plan (“DRIP”)
allows unitholders to use their monthly cash distri-
butions to steadily increase ownership in Chartwell
without incurring any commission or brokerage fees.
To encourage participation, eligible investors
registered in the DRIP will receive additional
bonus units in an amount equal to 3% of their cash
distributions. The right to receive the bonus units is
being provided for no additional consideration.
Unitholders who are Canadian residents and
beneficial holders of 1,000 units or more are eligible
to participate. The DRIP became effective with
the March 2004 cash distribution. To register for
the DRIP, please contact your investment advisor.
More information is available atwww.chartwellreit.ca

2 0 1 1C h a r t w e l l F i n a n c i a l R e p o r t
Management ’s D iscuss ion & Ana lys is / Conso l idated F inanc ia l S ta tements
f o r t h e y e a r s e n d e d D e c e m b e r 3 1 , 2 0 1 1 a n d 2 0 1 0


C H A R T W E L L SE N IORS HOU S ING R E I T | F inanc ia l Repor t 2011
Contents MANAGEMENT’S DISCUSSION AND ANALYSIS OF RESULTS OF OPERATIONS AND FINANCIAL CONDITION For the Years Ended December 31, 2011 and 2010
Business Overview 02
Business Strategy 04
2012 Outlook 06
Significant Events 08
Highlights of Consolidated Results of Operations 12
Consolidated Results of Operations 15
Summary of Property Revenue 15
Summary of Direct Operating Expenses 15
General, Administrative and Trust Expenses 16
Management Fee Revenue 16
Mezzanine Loans and Mezzanine Loan Interest Income 17
Finance Costs 18
Other Expenses /Income 19
Other Items 20
Non-IFRS Measures 21
Quarterly Financial Information 23
Summary of Results of Operations by Division 24
Canadian Retirement Operations 24
Canadian Long Term Care Operations 26
U.S. Operations 27
Financial Position 29
Liquidity and Capital Commitments 30
Liquidity 30
Debt Strategy 30
Capital Expenditures 34
Contractual Obligations and Guarantees 34
Cash Flow Analysis 35
Distributions 35
Key Performance Indicators 37
Critical Accounting Policies and Estimates 39
New Accounting Standards 42
Controls and Procedures 44
Forward-Looking Information and Risks and Uncertainties 45
CONSOLIDATED FINANCIAL STATEMENTS
Independent Auditors’ Report 53
Consolidated Balance Sheets 54
Consolidated Statements of Comprehensive Income (Loss) 55
Consolidated Statements of Unitholders’ Equity 56
Consolidated Statements of Cash Flows 57
Notes to Consolidated Financial Statements 58
Tab le o f C on ten t s


C H A R T W E L L SE N IORS HOU S ING R E I T | F inanc ia l Repor t 2011 01
Management ’s D iscuss ion & A na lys is
1
Managementʼs Discussion and Analysis Of Results of Operations and Financial Condition For the Years Ended December 31, 2011 and 2010
Chartwell Seniors Housing Real Estate Investment Trust (“Chartwell” or the “Trust”) has prepared the following managementʼs discussion and analysis (the “MD&A”) to provide information to assist its current and prospective investorsʼ understanding of the financial results of Chartwell for the years ended December 31, 2011 and 2010. This MD&A should be read in conjunction with Chartwellʼs audited, consolidated financial statements for the years ended December 31, 2011 and 2010 and the notes thereto (the “Financial Statements”). This material is available on Chartwellʼs website at www.chartwellreit.ca. Additional information about Chartwell, including its Annual Information Form (“AIF”) for the year ended December 31, 2010, can be found on SEDAR at www.sedar.com. Chartwell intends to file its AIF for the year ended December 31, 2011 on SEDAR on or before March 30, 2012.
The discussion and analysis in this MD&A is based on information available to management as of March 1, 2012.
As of January 1, 2011, Chartwell adopted International Financial Reporting Standards (“IFRS”), and the following disclosures, as well as associated annual consolidated financial statements, have been prepared in accordance with IFRS. Chartwellʼs effective transition date was January 1, 2010 to accommodate 2010 IFRS comparative figures. The Trust has provided information throughout this document and other publicly filed documents to assist a reader in understanding Chartwellʼs transition from the previous Canadian Generally Accepted Accounting Principles (“CGAAP”) to IFRS. A comprehensive summary of all the significant changes and accounting policy choices, including the various reconciliations of the CGAAP financial statements to those prepared under IFRS, is included in notes 2 and 30 to the Financial Statements.
All references to “Chartwell”, “we”, “our”, “us” or “Trust”, unless the context indicates otherwise, refer to Chartwell Seniors Housing Real Estate Investment Trust and its subsidiaries. For ease of reference “Chartwell” and the “Trust” are used in reference to the ownership of the seniors housing communities and the operation of the seniors housing communities and the third-party management business of Chartwell. The direct ownership of such communities and operation of such business is conducted by subsidiaries of the Trust.
In this document, “Q1” refers to the three-month period ended March 31; “Q2” refers to the three-month period ended June 30; “Q3” refers to the three-month period ended September 30; “Q4” refers to the three-month period ended December 31; “2011” refers to the calendar year 2011; “2010” refers to the calendar year 2010 and “YTD” means year-to-date.
Unless otherwise indicated, all comparisons of results for 2011 are in comparison to results from 2010 and all comparisons of results for Q4 2011 are in comparison to Q4 2010.
In this document we use a number of key performance indicators for monitoring and analyzing our financial results such as Funds from Operations (“FFO”), Adjusted Funds from Operations (“AFFO”), Net Operating Income (“NOI”) and others. These key performance indicators are not defined by IFRS and may not be comparable to similar measures presented by other trusts or other companies. Please refer to the “Key Performance Indicators” section of this MD&A for details of each of these performance indicators.
All dollar references, unless otherwise stated, are in Canadian dollars. Amounts in United States dollars are identified as U.S.$.

C H A R T W EL L SEN IORS HOU S ING R E I T | F inanc ia l Repor t 2011
Management ’s D iscuss ion & A na lys is
02 2
Business Overview
Chartwell is an open-ended real estate investment trust established under the laws of the Province of Ontario. We indirectly own and manage a portfolio of seniors housing communities across the complete continuum of care, from independent supportive living (“ISL”) communities, through assisted living (“AL”) communities, to long term care (“LTC”) communities, all of which are located in Canada and the United States (“U.S.”).
Our Vision is… to create and operate seniors housing communities where our residents enjoy a lifestyle and quality of life exceeding their expectations.
Our Mission is…
• to be the most trusted name in seniors housing; • to provide accommodation, care and services in every home, reflective of our residentsʼ needs,
preferences and interests, and adapt as they evolve; • to ease the transition through the various stages of aging by providing a full continuum of care in the
markets we serve; • to provide comfort and assurance to the families of our residents that their loved ones are treated with
the highest level of care, compassion and respect; • to attract and retain the best employees by providing a rewarding and fulfilling work environment; and • to generate reliable, sustainable and growing distributions for our Unitholders.
Our Values are…
Respect – We honour and celebrate seniors Empathy – We believe compassion is contagious Service Excellence – We believe in providing excellence in customer service Performance – We believe in delivering and rewarding results Education – We believe in lifelong learning Commitment – We value commitment to the Chartwell family Trust – We believe in keeping our promises and doing the right thing
At December 31, 2011, our portfolio of seniors housing communities owned, leased or managed on behalf of others consisted of interests in 24,562 suites in 195 communities. At December 31, 2011, our portfolio of owned and leased communities consisted of interests in 23,114 suites in 184 communities.

C H A R T W E L L SE N IORS HOU S ING R E I T | F inanc ia l Repor t 2011 03
Management ’s D iscuss ion & A na lys is
3
The following is the composition of our owned, leased and managed portfolio of seniors housing communities in our three operating segments at December 31, 2011:
Canadian Retirement Operations
Canadian LongTerm Care Operations
United StatesOperations
Total
Communities Suites/Beds Communities Suites/Beds Communities Suites/Beds Communities Suites/Beds
Owned Properties: (1) 100% Owned Operating 102 11,415 24 3,116 44 6,246 170 20,777 Development suites in lease-up - 359 - - - 93 - 452 Total 100% Owned 102 11,774 24 3,116 44 6,339 170 21,229
Partially Owned (2) Operating 7 873 - - 5 768 12 1,641 Total Partially Owned 7 873 - - 5 768 12 1,641 Total Owned 109 12,647 24 3,116 49 7,107 182 22,870
Properties under Operating
Lease: 100% Interest - - - - 2 244 2 244 Total Leased - - - - 2 244 2 244 Total Owned and Leased 109 12,647 24 3,116 51 7,351 184 23,114
Managed Properties (3) 6 680 5 768 11 1,448
Total 115 13,327 29 3,884 51 7,351 195 24,562
(1) Where a community provides more than one level of care, it has been designated according to the predominant level of care provided, type of licensing and funding received and internal management responsibility.
(2) We have a 50% ownership interest in these properties with the exception of one property in which we have a 33.3% ownership interest.
(3) We hold purchase options on four of these communities. Subsequent to December 31, 2011, we acquired one of the managed retirement communities consisting of 70 suites.
Composition of Portfolio of Owned and Leased Suites at Chartwellʼs Share of Ownership or Leased Interest, at December 31, 2011 by:
Level of Care Geographic Location
Independent Supportive Living, 56%
Assisted Living, 27%
Long Term Care, 17%
Ontario, 38%
Quebec, 22%
Other USA, 11%
Colorado, 4%
Florida, 8%
New York, 3%
Texas, 5%
Alberta, 3%BC, 6%

C H A R T W EL L SEN IORS HOU S ING R E I T | F inanc ia l Repor t 2011
Management ’s D iscuss ion & A na lys is
04 4
Business StrategyOur business strategy is principally focused on providing quality care and services to our residents, which we believe will help us to grow AFFO from our core property portfolio over time. The following summarizes our key strategic objectives:
Enhance the quality of our cash flows and grow core property AFFO by:• Providing high quality and expanding service offerings to our residents to maintain and improve
resident satisfaction. • Investing in innovative marketing and sales programs to increase customer traffic and sales closing
ratios. • Managing rental rates to ensure our properties are competitively positioned in the marketplace and
realize rental-rate growth on suite turnover. • Mitigating inflationary pressures on our operating costs through specific vendor management and
cost-control initiatives. • Maintaining our asset management program to ensure each asset is used to its highest potential.
Streamline operating processes; improve research and information management by:• Investing in market and customer research in order to better tailor service offerings to our residents
and our investments in new properties. • Continuously reviewing our administrative and operating processes in order to increase efficiencies
and improve support services provided to our operating teams. • Implementing information technology (“IT”) solutions to improve operating efficiencies and better
communicate with our employees.
Build value through development program by:• Commencing up to five new development projects per year.
Reduce existing mezzanine loan exposure by:• Converting our mezzanine loan investments into equity in the properties, wherever possible, or
collecting the remaining mezzanine loans in cash.
Acquire newer properties in our existing markets by:• Sourcing accretive acquisitions of newer properties in our existing markets.
Maintain a strong financial position by:• Staggering debt maturities over time to reduce financing risks. • Financing our properties with long-term debt, while managing interest costs. • Gradually reducing our debt levels over time.

C H A R T W E L L SE N IORS HOU S ING R E I T | F inanc ia l Repor t 2011 05
Management ’s D iscuss ion & A na lys is
5
The following summarizes the progress we made in executing our strategy to date:
Enhance the quality of our cash flows and grow core property AFFO
• AFFO from core property operations (excluding contribution from mezzanine loans and fee revenue) was 95% of the total AFFO in 2011 compared to 88% in 2010 and 79% in 2009.
• Same property NOI improved by $3.6 million or 2.3% in 2011. • Same property occupancy improved to 90.6% with strong improvements in
the U.S. Streamline operating processes; improve research and information management
• The second phase of the budgeting and forecasting system implementation was successfully completed in July 2011.
• Operating process reviews completed in 2010 and 2011 resulted in measurable expense savings, which contributed to a 9.2% reduction in general, administrative and trust (“G&A”) expenses before non-recurring severance costs.
Build value through development program
• Construction of two retirement homes in Kitchener and Oshawa, Ontario and the redevelopment of one LTC community in Burnaby, British Columbia are progressing on schedule and within budget.
• Redevelopment of three LTC communities in Ontario have commenced.
Reduce existing mezzanine loan exposure
• In 2011, we reduced our mezzanine loan exposure by $10.3 million as we collected $8.2 million of mezzanine loans in cash and converted $2.1 million of loans to equity in two properties.
Acquire newer properties in our existing markets
• Invested $197.2 million in acquisitions of interests in 17 seniors housing communities.
• Announced partnership with Health Care REIT, Inc. (“HCN”) to acquire a 42-property portfolio of retirement communities located in Ontario, Quebec, British Columbia and Alberta (the “Maestro Portfolio”) for $931.0 million.
Maintain a strong financial position
• In Q2 2011, we renewed our secured revolving operating credit facility (“Credit Facility”) improving terms and increasing the limit by $10 million to $85 million.
• Interest Coverage Ratio improved to 1.91x in 2011 from 1.81x in 2010.• Announced public offering of subscription receipts and convertible
debentures (the “Offerings”) in the aggregate amount of $310.0 million.

C H A R T W EL L SEN IORS HOU S ING R E I T | F inanc ia l Repor t 2011
Management ’s D iscuss ion & A na lys is
06 6
2012 Outlook ♦♦♦♦ With an improved economic outlook both in Canada and the U.S., the significant decline in seniors housing construction starts in many of our markets, and the significant increase in our properties under management as a result of the expected Maestro Portfolio acquisition, we are optimistic about 2012.
The following summarizes our outlook for 2012 for the markets in which we operate:
Canadian Retirement Operations We anticipate generating moderate growth through rate and occupancy increases in our Canadian Retirement Operations segment, supported by improving market conditions and slower supply growth. We believe that our innovative sales and marketing programs will continue generating increased sales activities including an increased number of deposits on hand and increased occupancy. We will also continue our focus on generating additional revenues by offering more care and other services to our residents. The following summarizes our expectations:
• In Ontario, we anticipate average rental rates to increase by approximately 4.0% in 2012. In Q4 2011, same property portfolio occupancy was 90.5%, a meaningful 0.9 percentage point increase from 89.6% in Q3 2011, reversing negative trends in prior quarters of 2011. We expect to see continuing positive occupancy trends in Ontario in 2012, driven by a slower pace of growth in inventory of seniors housing units, stable economic conditions and our continuing focus on sales, marketing and branding initiatives as well as our respite programs. Certain markets in Ontario, particularly in Ottawa, Greater Toronto and Windsor, remain very competitive due to oversupply of product added in the past four years. These markets are likely to take longer to improve.
• In Alberta, we anticipate average rental rates to increase by approximately 4.5% in 2012 and occupancy levels are projected to continue to remain high.
• In British Columbia, we expect to achieve average rental rate increases of approximately 3.5% in 2012. In Q4 2011, our Western Canada same property portfolio occupancy was 90.9%, a 0.4 percentage point increase from Q3 2011, continuing previous positive trends. With the exception of five properties located in British Columbia, particularly in Chilliwack, Mission and Maple Ridge, our Western Canada platform operates at occupancies in excess of 95%. In 2012, we expect to begin seeing recovery in the above three markets as the supply of new product is being absorbed.
• In Quebec, we expect average rental rates to increase by approximately 2.5% in 2012. Throughout 2011, our Quebec same property occupancies were gradually improving and stood at 87.3% in Q4 2011. Even though competition remains strong in certain Quebec markets and particularly in Aylmer and Gatineau/Hull, where we have over 1,100 units, we expect to see continuing positive occupancy trends in 2012.
Canadian Long Term Care Operations In 2011, our Canadian LTC same property portfolio NOI declined by $0.4 million or 3.5%. However, excluding a one-time positive adjustment of $0.7 million of our estimates for vacation and sick-time accruals recorded in 2010, for which there was no comparable amount in 2011, same property portfolio NOI increased $0.3 million or 2.1%. This is in-line with our expectations for annual NOI growth for this portfolio. As the Ontario provincial government continues facing large budget deficits, we may see some funding pressures in this portfolio in 2012.
♦ This section contains forward-looking information. Please see the “Forward-Looking Information and Risks and Uncertainties” section in this MD&A.

C H A R T W E L L SE N IORS HOU S ING R E I T | F inanc ia l Repor t 2011 07
Management ’s D iscuss ion & A na lys is
7
U.S. Operations In the U.S., we anticipate average rental rates will increase between 3.0% and 5.0% in 2012. Continuing previous positive trends, occupancies in our U.S. same property portfolio improved in Q4 2011, to 93.3% from 92.4% in Q3 2011. We expect to see continued strengthening of our U.S. portfolio occupancies, driven by strong sales and marketing efforts of our new manager, Brookdale Senior Living Inc. (“Brookdale”), and by a significant reduction in the pace of new supply growth in most U.S. markets. We also expect to see a positive impact on NOI from Brookdaleʼs cost management initiatives and to benefit from their purchasing power and economies of scale.
General, Administrative and Trust Expenses In 2011, we incurred G&A expenses, before non-recurring severance costs, of $22.5 million, a $2.3 million reduction from 2010 levels, primarily due to lower professional and consulting costs and the benefits of reduced staff levels as a result of process optimization projects completed in 2010 and in 2011. We will continue our strict management of G&A costs in 2012, while continuing with our investments in technology and continuing education.
In 2012, we anticipate adding a number of management personnel and related costs as a result of our acquisition of the Maestro Portfolio with HCN. We believe that such increased costs will be more thanoffset by management fees from this acquired portfolio.
Development In Q1 2012, we plan to open two retirement residences adjacent to our existing LTC communities in Kitchener, Ontario and Oshawa, Ontario, adding 212 retirement suites to our operating property portfolio at the total budgeted cost of $52.5 million. Total budgeted costs include debt and equity financing costs and estimated lease-up losses expected to be incurred until properties achieve stabilized occupancy. Under IFRS, results of operations of lease-up properties are included in profit and loss from the time these properties are “available for use”, where, under the previous CGAAP, these lease-up losses would have been capitalized. We estimate that these lease-up losses will amount to approximately $2.8 million in 2012.
Redevelopment of 128 LTC beds at Carlton Gardens in Burnaby, British Columbia, is expected to be completed in Q4 2012, at an estimated total development cost of approximately $26.6 million.
The redevelopment of 35,000 LTC beds in Class B and Class C communities is required by the government of Ontario over the next 10 years, and capital funding is provided for this renewal initiative. We have 12 Class B and Class C communities in Ontario with a total of 1,166 LTC beds that will be able to access this redevelopment program. In 2011, we commenced redevelopment of three of these communities at a total budgeted cost of approximately $33.8 million. We intend to proceed with redevelopment of the remaining LTC communities subject to availability of sufficient funding to make such redevelopments economically viable.
Early in 2011 we acquired a parcel of land in Hamilton, Ontario for development of a 119-suite retirement residence. We expect to commence construction of this residence in Q1 2012 and estimate the total development costs to be $31.3 million. We continue to evaluate other opportunities for on-balance sheet development.
Acquisitions We are actively seeking opportunities to acquire newer properties on an accretive basis in geographic regions in which we already operate, with a preference for the properties currently under management.

C H A R T W EL L SEN IORS HOU S ING R E I T | F inanc ia l Repor t 2011
Management ’s D iscuss ion & A na lys is
08 8
Dispositions In 2011, we initiated the previously disclosed U.S. disposition program for approximately 3,200 suites in 11 states. We will continue to work to advance the program throughout 2012. As part of our asset review program, we may dispose of other select properties if we determine that such properties do not fit into our long-term strategy.
Taxation We currently qualify as a mutual fund trust for Canadian income tax purposes, and under legislation that became law on June 22, 2007 (the “SIFT Rules”), we became a specified investment flow-through trust (a“SIFT”).
Under the SIFT Rules, distributions paid by a SIFT as returns of capital will not be subject to tax. In 2011, 95.667% of our distributions were characterized as tax-deferred returns of capital with the remaining 4.333% being characterized as foreign-source interest income, which is not subject to SIFT tax. We believe that it is likely that a high return of capital component will continue for the next several years, mitigating the impact of the SIFT Rules on Trust Unitholders. Assuming closing of the Maestro Portfolio acquisition and closing of the Offerings, we forecast no material cash taxes in 2012, approximately $0.8 million of Alternative Minimum Tax (“AMT”) at our subsidiary Trust in 2013 and approximately $5.5 million of AMT and SIFT taxes in 2014.
Significant EventsThe following events have had a significant effect on our financial results in 2011 and may be expected to affect our results in the future.
Partnership with HCN and Maestro Portfolio Acquisition On February 15, 2012, we announced that a subsidiary of Chartwell entered into an agreement with a subsidiary of HCN to acquire the Maestro Portfolio (the “Maestro Transaction”). Under the terms of the agreement, each of Chartwell and HCN will acquire a 50% interest in 39 of the communities (the “Co-Owned properties”) and HCN will acquire a 100% interest in the other three communities (“HCN Properties”) for an aggregate purchase price of $931 million. We will manage all 42 communities. The purchase price for the Co-Owned Properties is approximately $850 million and is expected to be settled by the assumption of mortgage debt of approximately $471 million with the balance paid in cash. Closing costs for this acquisition are estimated at approximately $22 million. Closing of this transaction is subject to regulatory, lender and Canada Mortgage and Housing Corporation (“CMHC”) approvals and is expected on or about May 1, 2012.
Management agreements for the Co-Owned Properties are for the initial term of three years with automatic renewals for additional three-year terms as long as we remain co-owners of the properties with HCN. In respect of the HCN Properties, the management agreements will have an initial term of three years, with one-year renewal options at HCNʼs election. Both Chartwell and HCN can terminate these contracts on 180 daysʼ notice. HCN granted us an option to acquire a 50% interest in the HCN Properties at the higher of fair market value or HCNʼs initial investment in these properties as long as we remain JV partners and continue managing these HCN properties.
Under the terms of the management agreements, we will earn a base fee equal to 5% of revenues from each property and an incentive fee equal to 10% of outperformance (or a reduction of 10% for underperformance), relative to approved annual operating targets, provided that the total management fee does not exceed 6% and is not less than 4% of revenues from the properties.

C H A R T W E L L SE N IORS HOU S ING R E I T | F inanc ia l Repor t 2011 09
Management ’s D iscuss ion & A na lys is
9
Public Offering of Subscription Receipts and Convertible Debentures In conjunction with the announcement of the Maestro Transaction, we also announced that we entered into an underwriting agreement with a syndicate of underwriters to issue to the public in Canada, subject to regulatory approval, on a bought deal basis, 23,175,000 of subscription receipts at $8.20 per subscription receipt, representing approximately $190 million of gross proceeds. Each subscription receipt represents the right to receive one Trust Unit of Chartwell at no additional cost and without further action (“Subscription Receipt Offering”) upon closing of the Maestro Transaction.
We also agreed to issue $120 million aggregate principal amount of 5.7% convertible unsecured subordinated debentures (“Debentures”). The maturity date of the Debentures will be on March 31, 2018. The Debentures will be convertible into Trust Units, at the option of the holder in certain circumstances, at a price of $11.00 per Trust Unit (“Debenture Offering”).
We have granted to the underwriters, an over-allotment option exercisable at any time up to 30 days after closing of the Offerings, to acquire up to 1,738,125 additional subscription receipts, representing 7.5% of the Subscription Receipt Offering and up to $15 million of Debentures at the same offering price and the same offering terms, respectively.
We expect to use the proceeds from the Subscription Receipt Offering to finance, in part, the purchase price for the Co-Owned Properties.
We intend to use the net proceeds from the Debenture Offering to a) redeem in full our existing 5.9% convertible debentures, including accrued and unpaid interest thereon, totalling approximately $78 million, b) to repay approximately $37 million outstanding on our Credit Facility, and c) for general Trust purposes.
We also entered into a term sheet and commitment letter relating to a $210.4 million unsecured, floating-rate credit facility maturing on December 13, 2012, and which may be drawn by Chartwell at the time of the closing of the Maestro Transaction, subject to customary conditions, up to June 29, 2012 (“Bridge Facility”).
Acquisitions in 2011 On April 1, 2011, we acquired a 33.3% percent interest in Chartwell Classic Robert Speck from Spectrum Seniors Holdings LP (“Spectrum”). The purchase price before closing costs was $11.1 million and was settled through the assumption of debt of $7.6 million, settlement of an outstanding mezzanine loan of$1.0 million, settlement of outstanding accounts receivable of $0.8 million, with the remaining balance, net of working capital adjustments paid in cash.
In line with our strategy to increase our ownership in properties we operate, effective May 10, 2011, we also acquired a 50% interest in Chatsworth Retirement Suites and Bungalows (“Chatsworth”) from our joint venture partner to bring our total ownership in Chatsworth to 100%. The purchase price before closing costs was $10.4 million and was settled through the assumption of debt of $5.8 million, settlement of an outstanding mezzanine loan of $1.1 million, settlement of $0.3 million in other amounts due to Chartwell from the vendor, with the remaining balance, net of working capital adjustments, paid in cash. As a result of this step acquisition, we recognized a gain of $2.1 million related to remeasurement of our previously held interest in this asset.
On November 1, 2011, we completed the previously announced acquisition of a 50% interest in a 15-property portfolio (2,948 suites) in the U.S. from ING Real Estate Community Living Group (“ING”) which brought our ownership in these properties to 100%. The purchase price was U.S.$169.0 million and was partially settled by the assumption of debt with an outstanding balance of U.S.$135.2 million, not including mark-to-market adjustments, bearing a weighted average interest rate of 6.27% with a weighted average term to maturity of 4.5 years. The balance of the purchase price of approximately U.S.$34.7 million, net of working capital adjustments, was settled in cash utilizing our Credit Facility. As a result of this step

C H A R T W EL L SEN IORS HOU S ING R E I T | F inanc ia l Repor t 2011
Management ’s D iscuss ion & A na lys is
10 10
acquisition, we recognized a gain of U.S.$1.5 million related to remeasurement of our previously-held interest in these assets. We continue to be joint venture partners with ING on a five-property portfolio located in New York State.
The following tables summarize acquisitions completed in 2011:
($millions, except communities and suites/beds) Q1 2011 Q2 2011 Q3 2011 Q4 2011 2011Number of communities - 2 - 15 17 Number of suites/beds - 216 - 2,948 3,164 Purchase price (including closing costs) - 21.8 - 175.4 197.2
Financed as follows: Mortgage debt assumed - 13.4 - 139.8 153.2 Discharge of mezzanine loans receivable - 2.1 - - 2.1 Settlement of accounts receivable - 1.1 - - 1.1 Cash - 4.7 - 35.3 40.0 Acquisition costs (1) - 0.5 - 0.3 0.8 Total - 21.8 - 175.4 197.2
(1) Under IFRS, these costs are expensed as incurred.
# Community Location Type Effective Date of Acquisition
% Acquired
Beds/Suites
at 100%
2011 Acquisitions: 1. Chartwell Classic Robert Speck Mississauga, ON Retirement April 1, 2011 33.3% 113 2. Chatsworth Retirement Suites (1) Kelowna, BC Retirement May 10, 2011 50% 103 3. The Park at Trowbridge (1) Southfield, MI Retirement November 1, 2011 50% 3024. Pocasset Bay Manor (1) Johnston, RI Retirement November 1, 2011 50% 170 5. Amber Park (1) Cincinnati, OH Retirement November 1, 2011 50% 133 6. Bella Vita (1) Venice, FL Retirement November 1, 2011 50% 113 7. Gayton Terrace (1)` Richmond, VA Retirement November 1, 2011 50% 206 8. The Village at Lowry (1) Denver, CO Retirement November 1, 2011 50% 155 9. Aspen Waterford (1) Montgomery, OH Retirement November 1, 2011 50% 112 10. Willow Wood (1)` Fort Lauderdale, FL Retirement November 1, 2011 50% 286 11. Aspen Woodside Village (1) Bedford, OH Retirement November 1, 2011 50% 231 12. Wyndham Lakes (1) Jacksonville, FL Retirement November 1, 2011 50% 241 13. Town Village Audubon Park (1) Memphis, TN Retirement November 1, 2011 50% 179 14. Town Village Sterling Heights (1) Sterling Heights, MI Retirement November 1, 2011 50% 224 15. Town Village Vestavia Hills (1) Vestavia Hills, AL Retirement November 1, 2011 50% 226 16. Town Village Tulsa (1) Tulsa, OK Retirement November 1, 2011 50% 198 17. Lake Worth Gardens (1) Lake Worth, FL Retirement November 1, 2011 50% 172 Total 2011 Acquisitions 3,164 2010 Acquisitions: 1. Les Seigneuries du Carrefour Sherbrooke, QC Retirement March 9, 2010 100% 275 2. Les Appartements du Château de
Bordeaux Sillery, QC Retirement March 9, 2010 100% 150 3. Cite-jardin IV Gatineau, QC Retirement March 9, 2010 100% 173 4. Arvada Meridian (1) Arvada, CO Retirement May 14, 2010 50% 125 5. Boulder Meridian (1) Boulder, CO Retirement May 14, 2010 50% 96 6. Englewood Meridian (1) Englewood, CO Retirement May 14, 2010 50% 266 7. Lakewood Meridian (1) Lakewood, CO Retirement May 14, 2010 50% 173 8. Temple Meridian (1) Temple, TX Retirement May 14, 2010 50% 232 9. Westland Meridian (1) Lakewood, CO Retirement May 14, 2010 50% 153 10. Regency Care – The Waterford (1) Oakville, ON Long-term care June 1, 2010 50% 168 11. Regency Care – The Wenleigh (1) Mississauga, ON Long-term care June 1, 2010 50% 161 12. Regency Care – The Westbury (1) Etobicoke, ON Long-term care June 1, 2010 50% 187 13. Regency Care – The Woodhaven (1) Markham, ON Long-term care June 1, 2010 50% 192 14. Regency Care – The Wynfield (1) Oshawa, ON Long-term care June 1, 2010 50% 172 15. Regency Care – The Westmount (1) Kitchener, ON Long-term care June 1, 2010 50% 160 16. Regency Care – The Willowgrove (1) Ancaster, ON Long-term care June 1, 2010 50% 169 17. Regency Care – The Brant Centre (1) Burlington, ON Long-term care June 1, 2010 50% 17518. Valley Vista Retirement Residence Vaughan, ON Retirement June 1, 2010 50% 139 19. Chartwell Classic Oakville Oakville, ON Retirement September 1, 2010 50% 147 20. Chartwell Select Muskoka Traditions Huntsville, ON Retirement December 1, 2010 100% 106 Total 2010 Acquisitions 3,419
(1) We now own a 100% interest in these communities.
C H A R T W E L L SE N IORS HOU S ING R E I T | F inanc ia l Repor t 2011 11
Management ’s D iscuss ion & A na lys is
11
Subsequent to December 31, 2011, we purchased the 70-suite Chartwell Select Georgian Traditions Retirement Residence in Collingwood, Ontario from Spectrum and their JV partner. The purchase price was $15.5 million and was settled through the assumption of debt of $11.4 million, settlement of an outstanding mezzanine loan of $0.9 million, settlement of outstanding accounts receivable of $0.9 million, with the remaining balance, net of working capital adjustments, paid in cash.
Dispositions In July 2011, we sold one non-core, 810-suite property located in Quebec. The sale price was $70.0 million, of which $1.5 million was held back in escrow to provide the purchaser with income protection until the expiration of current resident incentives and the achievement of 97% occupancy or higher for a consecutive three-month period. The purchaser assumed the existing CMHC-insured mortgages of approximately $47.0 million, bearing a weighted average interest rate of 4.80% with a weighted average term to maturity of 12.5 years. We used the net cash proceeds of approximately $21.5 million to repay amounts outstanding under our Credit Facility. In Q3 2011, we recorded a gain on sale of $5.9 million.
In Q3 2011, we transferred the management of 45 of our communities in the U.S. to Brookdale as a result of Brookdaleʼs acquisition of Horizon Bay Realty LLC (“HBR”). Under the new agreements, the average terms of the management contracts have been reduced to approximately 10 years, with a new maturity date of December 31, 2021. The base management fee for the properties under contract is 5% of gross revenue. The new contracts include an incentive fee mechanism whereby Brookdale can earn an additional fee of up to 2% of gross revenue upon the achievement of specified annual operating targets. Management fees may also be reduced by up to 1% if such annual operating targets are not achieved. Under the terms of the new contracts, cost savings in property direct operating expenses will replace cash flows we had been receiving from our ownership interests in Horizon Bay Chartwell (“HBC”) and Horizon Bay Chartwell II (“HBCII”). Under IFRS, an intangible asset for this below-market management contract with a fair value of $2.9 million was recognized in exchange for the disposition of the ownership interest in HBC and HBCII, and as a result, we recorded a gain of $1.8 million in our income statement during Q3 2011.
As part of the restructuring of the management agreements, we have granted Brookdale a limited time option to acquire a 20% interest in the U.S. real estate assets managed by Brookdale at fair market value, which would be determined based on fully-stabilized occupancy. In addition, we have granted Brookdale a right of first offer should we decide to sell our interest in the U.S. properties being managed by Brookdale.
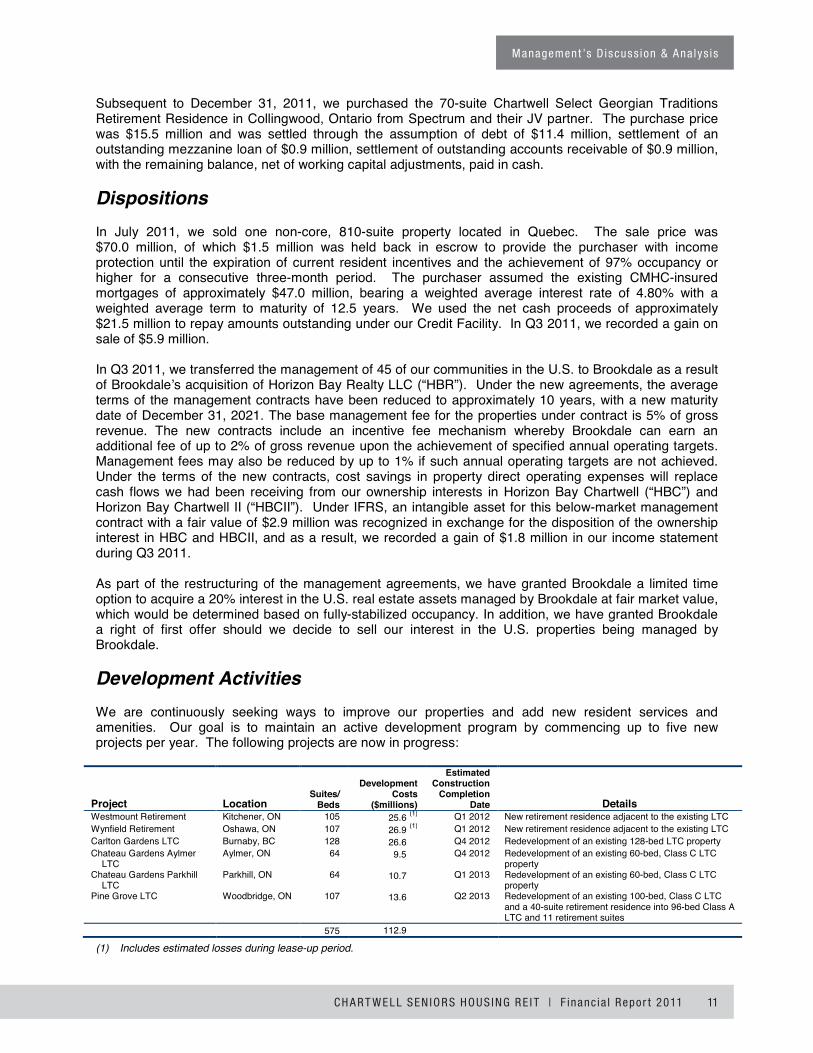
Development ActivitiesWe are continuously seeking ways to improve our properties and add new resident services and amenities. Our goal is to maintain an active development program by commencing up to five new projects per year. The following projects are now in progress:
Project Location Suites/
Beds
Development Costs
($millions)
Estimated Construction
Completion Date Details
Westmount Retirement Kitchener, ON 105 25.6 (1) Q1 2012 New retirement residence adjacent to the existing LTC Wynfield Retirement Oshawa, ON 107 26.9 (1) Q1 2012 New retirement residence adjacent to the existing LTC Carlton Gardens LTC Burnaby, BC 128 26.6 (1) Q4 2012 Redevelopment of an existing 128-bed LTC property Chateau Gardens Aylmer
LTC Aylmer, ON 64 9.5 (1) Q4 2012 Redevelopment of an existing 60-bed, Class C LTC
property Chateau Gardens Parkhill
LTC Parkhill, ON 64 10.7 (1) Q1 2013 Redevelopment of an existing 60-bed, Class C LTC
property Pine Grove LTC Woodbridge, ON 107 13.6 (1) Q2 2013 Redevelopment of an existing 100-bed, Class C LTC
and a 40-suite retirement residence into 96-bed Class A LTC and 11 retirement suites
575 112.9 (1)
(1) Includes estimated losses during lease-up period.

C H A R T W EL L SEN IORS HOU S ING R E I T | F inanc ia l Repor t 2011
Management ’s D iscuss ion & A na lys is
12 12
Highlights of Consolidated Results of Operations The following table summarizes selected financial and operating performance measures:
($000s, except occupancy rates, per unit amounts and number of units) Q4 2011 Q4 2010
Increase / (Decrease) 2011 2010
Increase / (Decrease)
Property revenue 198,274 187,059 11,215 750,634 707,166 43,468
Weighted average occupancy rate - same property portfolio 91.2% 91.0% 0.2pp 90.6% 90.3% 0.3pp(6)
Same property NOI (1) 38,888 37,980 908 156,719 153,122 3,597
AFFO (2) 22,036 18,848 3,188 86,530 80,139 6,391 AFFO per unit diluted (3) 0.15 0.13 0.02 0.59 0.60 (0.01)
FFO (4) 24,792 21,211 3,581 96,447 89,282 7,165 FFO per unit diluted (3) 0.17 0.15 0.02 0.66 0.67 (0.01)
Distributions declared 19,714 19,462 252 78,446 72,133 6,313 Distributions declared per unit (3) 0.14 0.14 - 0.54 0.54 -
Distributions declared as a
percentage of AFFO 89.5% 103.3% (13.8pp) 90.7% 90.0% 0.7pp
Net loss (25,249) (24,365) (884) (63,331) (61,948) (1,383)
Weighted average number of units outstanding, diluted (5)
(000s) 146,662 140,315 6,347 145,846 132,998 12,848
(1) Excludes the effects of foreign exchange on U.S. dollar revenue. (2) Refer to the “Non-IFRS Measures – Adjusted Funds from Operations” section of this MD&A for the details of the AFFO
calculation. (3) Refer to the “Key Performance Indicators – Per Unit Amounts” section of this MD&A for a discussion of the calculation of the
per unit amounts. (4) Refer to the “Non-IFRS Measures – Funds from Operations” section of this MD&A for the reconciliation of FFO to net loss. (5) Includes Class B Units of Chartwell Master Care LP (“Class B Units”) and units issued under the Long-Term Incentive Plan
(“LTIP”) and Deferred Trust Unit Plan (“DTU”). (6) pp = percentage points.
In 2011, AFFO was $86.5 million or $0.59 per unit diluted. Excluding severance costs related to the departures of our Chief Investment Officer (“CIO”) and Chief Operating Officer (“COO”), as well as severance costs incurred due to planned outsourcing of labour at one of our properties, which collectively amounted to $2.3 million, AFFO was $88.8 million or $0.61 per unit diluted. This represents an increase of $8.7 million or 10.8% compared to AFFO in 2010 of $80.1 million or $0.60 per unit diluted. The changes in AFFO include the following:
• Incremental contribution from the property portfolio, primarily due to acquisitions and same property NOI growth, increased AFFO by $4.8 million.
• Lower interest expense, due to redemption of convertible debentures in Q4 2010, resulted in an increase in AFFO of $6.9 million.
• Lower G&A expenses, resulting from improved operating efficiencies and lower professional and consulting costs, increased AFFO by $2.3 million.
• Lower mezzanine loan interest income reduced AFFO by $3.8 million. • Lower management fee income reduced AFFO by $1.5 million primarily due to lower asset
management fees from ING, as a result of our acquisition of INGʼs interest in the Regency and Meridian portfolios in 2010 and lower fees from Spectrum due to fewer assets under management.
• Per unit amounts were also affected by a 9.7% increase in the weighted average number of units outstanding.

C H A R T W E L L SE N IORS HOU S ING R E I T | F inanc ia l Repor t 2011 13
Management ’s D iscuss ion & A na lys is
13
Fourth Quarter: AFFO in Q4 2011 was $22.0 million or $0.15 per unit diluted. Excluding severance costs from the planned outsourcing of labour at one of our properties of $0.9 million, AFFO in Q4 2011 was $22.9 million or $0.16 per unit diluted. This represents an increase of $4.1 million or 21.5% compared to AFFO in Q4 2010 of $18.8 million or $0.13 per unit diluted. The following items contributed to the changes in AFFO: • Incremental contribution from the property portfolio, due to acquisitions and same property NOI
growth, increased AFFO by $2.1 million. • Lower interest expense, due to redemption of convertible debentures in Q4 2010, resulted in an
increase in AFFO of $1.3 million. • Lower G&A expenses, due to lower professional and consulting fees, increased AFFO by
$1.6 million. • Lower mezzanine loan interest income reduced AFFO by $0.9 million. • Per unit amounts were also affected by a 4.5% increase in the weighted average number of units
outstanding primarily due to the issuance of Trust Units in Q4 2010.
In 2011, FFO was $96.4 million or $0.66 per unit diluted compared to 2010 of $89.3 million or $0.67 per unit diluted.
In Q4 2011, FFO was $24.8 million or $0.17 per unit diluted compared to Q4 2010 FFO of $21.2 million or $0.15 per unit diluted. In addition to the items described above in the discussion of AFFO, FFO was also impacted by changes in amortization of financing costs and debt mark-to-market adjustments.
Net loss in 2011 and Q4 2011 was $63.3 million and $25.2 million, respectively, compared to a net loss in 2010 and Q4 2010 of $61.9 million and $24.4 million, respectively. In addition to items which impacted AFFO and FFO as discussed above, net loss amounts were also impacted by depreciation of properties, amortization of limited life intangibles, an impairment on properties of $13.1 million recorded in 2011, changes in future income tax expense/recovery and changes in fair values of convertible debentures, Class B Units and the LTIP option component liability.
Refer to the “Key Performance Indicators” section of this MD&A for a discussion of the calculation of AFFO, FFO and per unit amounts.

C H A R T W EL L SEN IORS HOU S ING R E I T | F inanc ia l Repor t 2011
Management ’s D iscuss ion & A na lys is
14 14
Same Property Portfolio Highlights
($000s, except occupancy rates) Q4 2011 Q4 2010Increase /
(Decrease) 2011 2010 Increase /
(Decrease)
Canadian retirement: NOI 27,998 26,777 1,221 112,826 110,239 2,587 Occupancy 89.4% 89.7% (0.3pp) 89.1% 89.3% (0.2pp)
Canadian LTC: NOI 2,971 3,647 (676) 11,993 12,432 (439) Occupancy 98.6% 97.9% 0.7pp 98.4% 98.1% 0.3pp
U.S.: NOI (U.S.$) 7,919 7,556 363 31,900 30,451 1,449 Occupancy 93.3% 91.4% 1.9pp 91.7% 89.7% 2.0pp
Combined: NOI (1) 38,888 37,980 908 156,719 153,122 3,597 Occupancy 91.2% 91.0% 0.2pp 90.6% 90.3% 0.3pp
(1) Excludes the effects of foreign exchange on the U.S. dollar.
For 2011, combined same property occupancy improved to 90.6% with same property NOI increasing $3.6 million or 2.3% as follows:
• In our Canadian retirement portfolio, same property NOI increased 2.3% for 2011 primarily as a result of regular annual rental rate increases, increased ancillary revenues and strong expense controls. 2011 occupancy declined slightly to 89.1% compared to 89.3% in 2010 primarily due to competitive pressures in certain Ontario markets.
• In our Canadian LTC portfolio, same property NOI decreased 3.5% primarily due to positive adjustment of our estimates for vacation and sick time costs of $0.7 million recorded in Q4 2010, for which there was no comparable amount in 2011. Excluding the effect of this adjustment, same property NOI increased $0.3 million or 2.1%. Occupancies improved slightly to 98.4% from 98.1% in 2010. In 2011, all of our Ontario LTC communities achieved the occupancy criteria to receive government funding as though fully occupied.
• In our U.S. portfolio, same property NOI increased 4.8% for 2011 primarily due to higher revenues as a result of improved occupancies. Occupancies improved significantly to 91.7% in 2011 from 89.7% in 2010.
Fourth Quarter: Combined same property occupancy improved slightly to 91.2% with same property NOI improving $0.9 million or 2.4% through positive contributions from our Canadian retirement and U.S. portfolios, which were partially offset by a decline in our Canadian LTC portfolio.
• In our Canadian retirement portfolio, same property NOI increased 4.6% in Q4 2011 primarily as a result of regular annual rental rate increases, increased ancillary revenues and strong expense controls. Q4 2011 occupancy declined slightly to 89.4% compared to 89.7% in Q4 2010.
• In our Canadian LTC portfolio, same property NOI decreased 18.5% in Q4 2011 primarily due the positive adjustment of our estimates for vacation and sick time costs in Q4 2010, as discussed above. Occupancies increased to 98.6% in Q4 2011 compared to 97.9% in Q4 2010.
• In our U.S. portfolio, same property NOI increased 4.8% in Q4 2011 primarily due to higher revenues as a result of improved occupancies. Occupancies increased to 93.3% in Q4 2011 from 91.4% in Q4 2010.

C H A R T W E L L SE N IORS HOU S ING R E I T | F inanc ia l Repor t 2011 15
Management ’s D iscuss ion & A na lys is
15
Consolidated Results of Operations Summary of Property Revenue
($000s, except occupancy rates) Q4 2011 Q4 2010Increase /
(Decrease) 2011 2010 Increase /
(Decrease)
Same property(1) 132,231 127,567 4,664 516,632 499,139 17,493 Acquisitions and other(1) 65,112 59,873 5,239 239,827 207,823 32,004 Eliminations (38) (1,057) 1,019 (3,712) (5,106) 1,394 Foreign exchange on U.S. dollar
revenue 969 676 293 (2,113) 5,310 (7,423) Total property revenue 198,274 187,059 11,215 750,634 707,166 43,468
Weighted average occupancy rate -
same property portfolio 91.2% 91.0% 0.2pp 90.6% 90.3% 0.3pp
(1) Excludes the effect of foreign exchange on U.S. dollar revenue.
Total property revenue grew 6.1% in 2011 as increased revenue from our same property and acquisitions portfolios was partially offset by lower foreign exchange translation on U.S. dollar revenue.
Same property revenue increased $17.5 million or 3.5% for 2011. We continue to drive revenue growth by adding new services for our residents and implementing regular annual rental rate increases that are competitive to local market conditions.
Fourth Quarter: Total property revenue grew 6.0% in Q4 2011 due to increased revenue from our same property and acquisitions portfolios along with a slight contribution from foreign exchange translation on U.S. dollar revenue.
Same property revenue increased $4.7 million or 3.7% in Q4 2011.
Summary of Direct Operating Expenses
($000s) Q4 2011 Q4 2010Increase /
(Decrease) 2011 2010 Increase /
(Decrease)
Same property (1) 93,343 89,587 3,756 359,913 346,017 13,896 Acquisitions and other (1) 47,530 4,811 2,719 177,161 152,117 25,044 Eliminations (38) (1,057) 1,019 (3,712) (5,106) 1,394 Foreign exchange on U.S. dollar
expenses 654 452 202 (1,399) 3,497 (4,896) Lease-up losses 122 - 122 169 - 169 Total direct operating expenses 141,611 133,793 7,818 532,132 496,525 35,607
(1) Excludes the effect of foreign exchange on U.S. dollar expenses.
Total direct operating expenses increased 7.2% in 2011 primarily due to additional expenses for acquisitions and modest growth in same property direct operating expenses, partially offset by the impact of foreign exchange translation.
Same property direct operating expenses increased $13.9 million or 4.0% for 2011 primarily due to additional staffing costs required to provide new services to our residents and to respond to new regulatory requirements in certain jurisdictions, combined with investments in targeted sales and marketing initiatives designed to drive occupancy, and incremental HST costs.
Lease-up losses represent certain costs incurred with respect to our development projects which are not eligible for capitalization under IFRS.

C H A R T W EL L SEN IORS HOU S ING R E I T | F inanc ia l Repor t 2011
Management ’s D iscuss ion & A na lys is
16 16
Fourth Quarter: Total direct operating expenses increased 5.8% in Q4 2011 primarily due to additional expenses for acquisitions and modest growth in same property direct operating expenses along with a slight increase due to foreign exchange translation. Same property direct operating expenses increased $3.8 million or 4.2% in Q4 2011.
General, Administrative and Trust Expenses
($000s, except percentage of revenue) Q4 2011 Q4 2010
Increase / (Decrease) 2011 2010
Increase / (Decrease)
G&A expenses 5,331 6,970 (1,639) 22,494 24,761 (2,267) Non-recurring severance costs 867 - 867 2,264 - 2,264 Total G&A 6,198 6,970 (772) 24,758 24,761 (3)
As % of revenue (excluding non-
recurring severance costs) 2.7% 3.6% (0.9pp) 3.0% 3.4% (0.4pp)
In 2011, G&A expenses, excluding non-recurring severance costs, decreased $2.3 million or 9.2%. In 2010, we incurred approximately $1.5 million consulting costs related to process efficiency and SIFT reviews, IFRS implementation and compensation reviews. There were no similar expenses in 2011. In addition, compensation costs were reduced due to staffing reductions as a result of process efficiency reviews and certain executive vacancies.
In 2011, we incurred non-recurring severance costs of $2.3 million related to the departure of two senior executives and as a result of our decision to contract out certain services in one of our properties.
G&A expenses, as a percentage of revenue, excluding non-recurring severance costs, decreased to 3.0% in 2011 compared to 3.4% in 2010.
Fourth Quarter: G&A expenses, excluding non-recurring severance costs, decreased $1.6 million or 23.5% due to savings in consulting costs as discussed above, and savings realized as a result of the process efficiency reviews.
In Q4 2011, we incurred severance costs of $0.9 million as a result of our decision to contract out certain services in one of our properties.
G&A expenses, as a percentage of revenue, excluding non-recurring severance costs, decreased to 2.7% in Q4 2011 compared to 3.6% in Q4 2010.
Management Fee Revenue
($000s) Q4 2011 Q4 2010Increase /
(Decrease) 2011 2010 Increase /
(Decrease)
Spectrum: Operations management 240 240 - 702 1,188 (486) Other - 5 (5) - 25 (25)
Total Spectrum 240 245 (5) 702 1,213 (511)
ING 23 66 (43) 234 941 (707) Other 546 515 31 2,201 2,521 (320) Total management fee revenue 809 826 (17) 3,137 4,675 (1,538)
Management fee revenue declined $1.5 million in 2011. Fees from Spectrum declined $0.5 million in 2011 as a result of sales of operating properties by Spectrum and due to the fact that revenue from Spectrum is only recognized when payments have been received. Asset management fees from ING

C H A R T W E L L SE N IORS HOU S ING R E I T | F inanc ia l Repor t 2011 17
Management ’s D iscuss ion & A na lys is
17
declined $0.7 million for 2011 due to our acquisition of INGʼs interest in the Meridian and Regency portfolios in Q2 2010 and our acquisition of INGʼs interest in 15 U.S. properties on November 1, 2011.
Fourth Quarter: Management fee revenue decreased slightly in Q4 2011 primarily due to our acquisition of INGʼs interest in 15 U.S. properties on November 1, 2011.
Mezzanine Loans and Mezzanine Loan Interest Income
The following table summarizes the changes in our investments in mezzanine loans for 2011 and 2010:
($millions) 2011 2010
Gross mezzanine loans outstanding (beginning of the year) 44.2 89.8 Discharge of mezzanine loans on acquisition of properties (2.1) (27.2) Repayments of mezzanine loans in cash (8.2) (14.4) Written off (10.7) (4.0) Gross mezzanine loans outstanding (end of the year) 23.2 44.2
In 2011, three projects, on which we previously advanced mezzanine loans, were sold pursuant to power of sale orders. As a result, mezzanine loans in the amount of $10.7 million were written off. These loans were fully provided for in prior periods, resulting in no impact on our 2011 earnings.
In 2011, we updated our assessment of the underlying value of the security for each mezzanine loan as well as the value of the corporate guarantees securing mezzanine loans, where applicable. The process of determining fair value requires us to exercise judgement in making valuation assumptions including revenue and expense projections, lease-up expectations, capitalization and discount rates. Based on our updated assessment, we believe no changes are required to the overall cumulative impairment provisions at this time.
The following table summarizes changes in the impairment provision in 2011:
($millions) Mezzanine
Loans Accounts
Receivable Total
Balance December 31, 2010 21.5 2.6 24.1 Reallocated on collection of certain accounts receivable 0.9 (0.9) - Offset against principal amount of the loan and costs recorded as a reduction of
mezzanine loan balances (9.3) - (9.3) Balance December 31, 2011 13.1 1.7 14.8
During 2011, we collected certain accounts receivable from mezzanine loan debtors against which an impairment provision was previously recorded. Accordingly, we reallocated $0.9 million of the impairment provision from accounts receivable to mezzanine loans.
The following table provides further details on mezzanine loans outstanding and related impairment provisions:
($millions, except number of projects)
Number of
Projects
Mezzanine Loans
Outstanding
Fees, net of costs recorded as a reduction of mezzanine
loan balances Impairment
Provision Net Balance Outstanding
Spectrum and Partners outside Quebec 7(a) 11.7 (0.1) (4.6) 7.0 Melior, Spectrum and Partners in Quebec 2(a) 8.9 (0.4) (8.5) - Seasons and Partners 1(a) 2.6 - - 2.6 Total 10(a) 23.2 (0.5) (13.1) 9.6

C H A R T W EL L SEN IORS HOU S ING R E I T | F inanc ia l Repor t 2011
Management ’s D iscuss ion & A na lys is
18 18
The following table summarizes interest income on our mezzanine loans:
($000s) Q4 2011 Q4 2010Increase /
(Decrease) 2011 2010 Increase /
(Decrease)
Mezzanine loan interest before effective yield adjustments 448 1,119 (671) 1,601 4,570 (2,969)
Effective yield adjustments for: Placement fees integral to lending
activities - 266 (266) - 901 (901) Legal costs integral to lending
activities - - - - (52) 52 Total mezzanine loan interest income 448 1,385 (937) 1,601 5,419 (3,818)
Mezzanine loan interest income decreased $3.8 million for 2011 primarily due to lower balances of loans outstanding. Mezzanine loan interest and related placement fees are recognized in income using the effective interest rate method. Under this method, we update our expectations for repayment dates of the loans and re-discount the expected cash flows for the life of the project over the revised expected time to complete using the effective interest rate. When the collectability of the amounts due is uncertain, we recognize interest income only when the payments are received.
Fourth Quarter: Mezzanine loan interest income decreased $0.9 million in Q4 2011 due to lower balances of loans outstanding.
Finance Costs
($000s) Q4 2011 Q4 2010Increase /
(Decrease) 2011 2010 Increase /
(Decrease)
Mortgages and loans payable Same property (1) 15,064 15,116 (52) 59,286 60,963 (1,677) Acquisitions (1) 9,835 8,984 851 35,909 31,598 4,311 Foreign exchange on U.S. dollar
expenses 181 177 4 (430) 1,225 (1,655) 25,080 24,277 803 94,765 93,786 979
Convertible debentures 1,106 2,397 (1,291) 4,425 11,337 (6,912) Credit Facility and other interest 397 160 237 1,499 160 1,339
26,583 26,834 (251) 100,689 105,283 (4,594) Amortization of financing costs and
debt mark-to-market adjustments 720 866 (146) 3,037 3,235 (198) 27,303 27,700 (397) 103,726 108,518 (4,792)
Interest capitalized to properties under development (336) (202) (134) (1,303) (522) (781)
Distributions on Class B Units recorded as interest expense 227 231 (4) 908 989 (81)
Total finance costs 27,194 27,729 (535) 103,331 108,985 (5,654)
(1) Excludes the effects of foreign exchange on U.S. dollar expenses.
Interest expense in the same property portfolio decreased in 2011 due to lower interest rates achieved on mortgage renewals as well as repayment of certain mortgages in 2010. Acquisitions added incremental interest expense of $4.3 million for 2011 primarily due to mortgages assumed on acquisitions completed in 2011 and 2010.
Interest expense on convertible debentures decreased $6.9 million in 2011 as we redeemed $125 million of convertible debentures in Q4 2010.
Credit Facility and other interest increased $1.3 million in 2011 due to increased usage of our Credit Facility during 2011. There were no balances outstanding on our Credit Facility for most of 2010 as a result of cash generated from the sale of Trust Units in late 2009 and 2010.

C H A R T W E L L SE N IORS HOU S ING R E I T | F inanc ia l Repor t 2011 19
Management ’s D iscuss ion & A na lys is
19
During 2011, we capitalized interest of $1.3 million which relates to our investment in development projects under construction. Under IFRS, interest capitalization stops once a development project becomes available for use.
Fourth Quarter: Interest expense decreased $0.5 million in Q4 2011 due to lower rates in the same property portfolio, lower interest on convertible debentures offset by higher interest expense in the acquisitions portfolio and on the Credit Facility.
Other Expenses /Income
($000s) Q4 2011 Q4 2010Increase /
(Decrease) 2011 2010 Increase /
(Decrease)
Gain on remeasurement of previously held equity interest on acquisition 1,505 - 1,505 3,595 9,639 (6,044)
Bargain purchase gain on acquisition - 1,031 (1,031) - 4,428 (4,428) Gain/(loss) on disposal of properties 228 (1,101) 1,329 7,556 (851) 8,407 Interest income on loans and
receivables 962 1,188 (226) 3,817 4,540 (723) Total other income 2,695 1,118 1,577 14,968 17,756 (2,788)
Impairment on non-current assets 4,580 - 4,580 13,080 - 13,080 Transaction costs arising on
business combinations 653 1,003 (350) 1,280 3,295 (2,015) Total other expenses 5,233 1,003 4,230 14,360 3,295 11,065
Total other income/(expense) (2,538) 115 (2,653) 608 14,461 (13,853)
Under IFRS, when control is acquired through step acquisitions, an entity is required to remeasure the previously held interest to the acquisition date fair value with any resulting gain or loss recorded in the income statement. Our acquisition of Chatsworth in Q2 2011 resulted in a gain of $2.1 million, and the purchase of INGʼs 50% interest in 15 U.S. properties resulted in a gain of $1.5 million, each related to remeasurements of previously held interests.
In 2010, we purchased from ING a 50% interest in the Regency and Meridian portfolios to bring our ownership to 100%, which resulted in a gain on remeasurement of the previously held interest, of $9.6 million. In addition, we recorded a bargain purchase gain on acquisition of $4.4 million relating to other acquisitions completed during 2010.
The gain on disposal of properties for 2011 primarily resulted from a gain realized on the disposition of one retirement property in Quebec of $5.9 million and the net gain arising from the disposal of ownership interest in HBC and HBCII, and the signing of new management contracts realized on the transition of the management of our U.S. properties to Brookdale of $1.8 million (please refer to the “Significant Events” section of this MD&A). For 2010, the loss on disposal of properties was primarily due to the disposition of one retirement property in British Columbia.
Interest income on loans and receivables decreased $0.7 million for 2011 primarily due to lower cash balances and a one-time fee of $0.3 million we received in Q1 2010 for waiving our option to acquire an LTC property adjacent to our retirement residence in Western Canada. There was no comparable amount in 2011.
On November 1, 2011, we purchased from ING the remaining 50% interest in 15 U.S. properties at a purchase price that was lower than the carrying value of our 50% interest. As a result, in Q2 2011, we recognized an impairment provision of $8.5 million related to our original 50% interest in these properties (refer to the “Significant Events” section of this MD&A).

C H A R T W EL L SEN IORS HOU S ING R E I T | F inanc ia l Repor t 2011
Management ’s D iscuss ion & A na lys is
20 21
Non-IFRS Measures
FFO and AFFO do not have a standardized meaning under IFRS and should not be construed as an alternative to net earnings or cash flows from operating activities as defined by IFRS.
Refer to the “Key Performance Indicators” section of this MD&A for a detailed discussion of the nature of various adjustments made in the calculation of FFO and AFFO, along with Managementʼs discussion of the usefulness of these measures in evaluating our performance.
Funds from Operations (FFO)
The following table provides a reconciliation of net income/(loss) to FFO:
($000s, except per unit amounts) Q4 2011 Q4 2010Increase /
(Decrease) 2011 2010 Increase /
(Decrease)
Net income/(loss) (25,249) (24,365) (884) (63,331) (61,948) (1,383)
Add (Subtract): Depreciation of properties 50,790 44,898 5,892 170,844 160,775 10,069 Amortization of limited life intangible
assets 1,242 503 739 2,555 2,344 211 Depreciation of leasehold
improvements and software costs included in depreciation and amortization above (201) (181) (20) (679) (628) (51)
Loss/(gain) on disposal of property (228) 1,101 (1,329) (7,556) 851 (8,407) Bargain purchase on acquisition - (1,031) 1,031 - (4,428) 4,428 Impairment on non-current assets 4,580 - 4,580 13,080 - 13,080 Loss/(gain) recorded on
remeasurement of previously held equity interest on acquisition (1,505) - (1,505) (3,595) (9,639) 6,044
Transaction costs arising on business acquisitions 653 1,003 (350) 1,280 3,295 (2,015)
Deferred income taxes (8,729) 745 (9,474) (14,127) (6,675) (7,452) Distributions on Class B Units
recorded as interest expense 227 231 (4) 908 989 (81) Changes in fair value of financial
instruments and unrealized foreign exchange loss/(gain) 3,212 (1,693) 4,905 (2,932) 4,346 (7,278)
FFO (1) 24,792 21,211 3,581 96,447 89,282 7,165
FFO per unit diluted 0.17 0.15 0.02 0.66 0.67 (0.01)
(1) Refer to the “Key Performance Indicators – Funds from Operations” section of this MD&A for a discussion of the nature of various adjustments made in FFO calculations.
FFO increased $7.2 million in 2011 and $3.6 million in Q4 2011, primarily due to increased contributions from the property portfolio and lower interest expense due to redemption of convertible debentures in Q4 2010. This was offset by lower mezzanine loan interest, management fee income and higher severance costs.
20
During Q4 2011, we recorded an impairment of approximately $4.6 million for two properties whose carrying value exceeded recoverable amount and for some development costs for projects that are not proceeding at this time.
Transaction costs incurred in Q4 2011 primarily relate to the purchase of the Maestro Portfolio (refer to the “Significant Events” section of this MD&A). Under IFRS, transaction costs arising on business combinations are expensed as incurred. Under CGAAP, these costs were capitalized as part of acquisition. These expenses will fluctuate from period to period based on volume of business combinations.
Other Items
($000s) Q4 2011 Q4 2010Increase /
(Decrease) 2011 2010 Increase /
(Decrease)
Property lease expense 644 769 (125) 2,420 2,327 93
Depreciation on property, plant and equipment 50,790 44,898 5,892 170,844 160,775 10,069
Amortization of limited life intangible
assets 1,242 503 739 2,555 2,344 211
Changes in fair value of financial instruments and unrealized foreign exchange loss/ (gain) 3,212 (1,693) 4,905 (2,932) 4,346 (7,278)
Current income tax expense/
(benefit) 79 35 44 330 281 49
Deferred income tax expense/ (benefit) (8,729) 745 (9,474) (14,127) (6,675) (7,452)
Depreciation on Property, Plant and Equipment: Depreciation increased due to acquisitions completed in 2010 and 2011.
Changes in Fair Value of Financial Instruments and Unrealized Foreign Exchange Loss/ (Gain): Result from changes in the market value of the underlying financial instruments and foreign exchange rate movements. These amounts are expected to fluctuate from period to period due to changes in financial markets.
Current and Deferred Income Tax Expense/ (Benefit): The provision for deferred tax expense relates to temporary differences between the carrying amounts and tax-basis of assets and liabilities. These temporary differences are tax-effected using the estimated tax rate applicable to undistributed income at the time that these differences are expected to reverse.

C H A R T W E L L SE N IORS HOU S ING R E I T | F inanc ia l Repor t 2011 21
Management ’s D iscuss ion & A na lys is
21
Non-IFRS Measures
FFO and AFFO do not have a standardized meaning under IFRS and should not be construed as an alternative to net earnings or cash flows from operating activities as defined by IFRS.
Refer to the “Key Performance Indicators” section of this MD&A for a detailed discussion of the nature of various adjustments made in the calculation of FFO and AFFO, along with Managementʼs discussion of the usefulness of these measures in evaluating our performance.
Funds from Operations (FFO)
The following table provides a reconciliation of net income/(loss) to FFO:
($000s, except per unit amounts) Q4 2011 Q4 2010Increase /
(Decrease) 2011 2010 Increase /
(Decrease)
Net income/(loss) (25,249) (24,365) (884) (63,331) (61,948) (1,383)
Add (Subtract): Depreciation of properties 50,790 44,898 5,892 170,844 160,775 10,069 Amortization of limited life intangible
assets 1,242 503 739 2,555 2,344 211 Depreciation of leasehold
improvements and software costs included in depreciation and amortization above (201) (181) (20) (679) (628) (51)
Loss/(gain) on disposal of property (228) 1,101 (1,329) (7,556) 851 (8,407) Bargain purchase on acquisition - (1,031) 1,031 - (4,428) 4,428 Impairment on non-current assets 4,580 - 4,580 13,080 - 13,080 Loss/(gain) recorded on
remeasurement of previously held equity interest on acquisition (1,505) - (1,505) (3,595) (9,639) 6,044
Transaction costs arising on business acquisitions 653 1,003 (350) 1,280 3,295 (2,015)
Deferred income taxes (8,729) 745 (9,474) (14,127) (6,675) (7,452) Distributions on Class B Units
recorded as interest expense 227 231 (4) 908 989 (81) Changes in fair value of financial
instruments and unrealized foreign exchange loss/(gain) 3,212 (1,693) 4,905 (2,932) 4,346 (7,278)
FFO (1) 24,792 21,211 3,581 96,447 89,282 7,165
FFO per unit diluted 0.17 0.15 0.02 0.66 0.67 (0.01)
(1) Refer to the “Key Performance Indicators – Funds from Operations” section of this MD&A for a discussion of the nature of various adjustments made in FFO calculations.
FFO increased $7.2 million in 2011 and $3.6 million in Q4 2011, primarily due to increased contributions from the property portfolio and lower interest expense due to redemption of convertible debentures in Q4 2010. This was offset by lower mezzanine loan interest, management fee income and higher severance costs.

C H A R T W EL L SEN IORS HOU S ING R E I T | F inanc ia l Repor t 2011
Management ’s D iscuss ion & A na lys is
22 22
Adjusted Funds from Operations (AFFO)
The following table provides the calculation of AFFO:
($000s, except per unit amounts) Q4 2011 Q4 2010Increase /
(Decrease) 2011 2010 Increase /
(Decrease)
FFO (1) 24,792 21,211 3,581 96,447 89,282 7,165 Add (Subtract): Principal portion of capital subsidy
receivable from Health Authorities 903 858 45 3,537 3,013 524 Amounts received under income
guarantees - - - - 133 (133) Amortization of financing costs and fair
value adjustments on mortgages payable 720 866 (146) 3,037 3,235 (198)
Financing cost reserve (2) (413) (346) (67) (1,478) (1,381) (97) AFFO before capex reserve 26,002 22,589 3,413 101,543 94,282 7,261 Maintenance capex reserve - 2% of
property revenue (3,966) (3,741) (225) (15,013) (14,143) (870) AFFO (3) 22,036 18,848 3,188 86,530 80,139 6,391
AFFO per unit diluted 0.15 0.13 0.02 0.59 0.60 (0.01)
(1) Refer to the “Key Performance Indicators – Funds from Operations” section of this MD&A for a discussion of the nature of various adjustments made in FFO calculations.
(2) Financing cost reserve is calculated quarterly as 60 basis points applied to our mortgages payable at the end of the quarter, pro-rated based on the weighted average term to maturity.
(3) Refer to the “Key Performance Indicators – Adjusted Funds from Operations” section of this MD&A for a discussion of the nature of various adjustments made in the AFFO calculations.
An analysis of AFFO is described under the “Highlights of Consolidated Results of Operations” section of this MD&A.
In 2011 and Q4 2011, AFFO was reduced by approximately $0.2 million and $0.1 million, respectively, of marketing costs relating to two of our development projects. We expect to incur additional marketing costs prior to opening these projects, scheduled for Q1 2012. These marketing costs and lease-up losses are expensed as incurred under IFRS. Under CGAAP, these costs were eligible for capitalization to the projects under development. There were no similar expenses in the same periods of 2010.
IFRS Impact on FFO and AFFO
The adoption of IFRS has had a material impact on the presentation of our financial results. However, our actual operating and financial performance has not been affected by this accounting change.
The following table provides reconciliations of Q4 2010 and 2010 FFO and AFFO as previously reported under CGAAP to FFO and AFFO reported under IFRS.
Q4 2010 2010 ($000s) FFO AFFO FFO AFFO
As previously reported under CGAAP 15,933 19,083 81,144 81,489
Amortization of financing costs and accretion adjustments on convertible debentures 3,242 - 6,788 -
Unrealized foreign exchange loss 2,617 - 3,794 - Amortization of below-market leases (180) - (732) - Capitalized interest and operating costs on development projects in
lease-up (241) (241) (1,307) (1,307) Other (160) 6 (405) (43) Reported under IFRS 21,211 18,848 89,282 80,139

C H A R T W E L L SE N IORS HOU S ING R E I T | F inanc ia l Repor t 2011 23
Management ’s D iscuss ion & A na lys is
23
Amortization of financing costs and accretion on convertible debentures have been eliminated on conversion to IFRS as convertible debentures are now carried at fair value.
Unrealized foreign exchange loss on cross-border intercompany loans is added back in our FFO calculations upon conversion to IFRS.
Amortization of below-market leases, under CGAAP, has been included in our FFO calculations and adjusted for in our AFFO calculations. We elected to exclude this item in our FFO calculations upon conversion to IFRS.
Under IFRS, capitalization of borrowing costs must cease upon a development property becoming available for use. Under CGAAP, borrowing costs and lease-up losses were capitalized during the lease-up of a property until it achieved a break-even level of cash flows. As a result, in 2010, our FFO and AFFO were reduced by approximately $1.3 million due to the reversal of previously capitalized interest and operating costs.
Quarterly Financial Information The following table summarizes our quarterly unaudited financial information:
2011 2010 ($000s) Q4 Q3 Q2 Q1 Q4 Q3 Q2 Q1
Revenues 199,530 187,293 185,047 183,502 189,269 186,790 175,673 165,528 Direct operating
expenses (141,611) (131,652) (129,406) (129,463) (133,793) (129,996) (119,825) (112,911) G&A expenses (6,198) (6,018) (6,381) (6,161) (6,970) (6,247) (5,966) (5,578)
51,721 49,623 49,260 47,878 48,506 50,547 49,882 47,039
Finance costs (27,194) (25,113) (25,561) (25,463) (27,729) (28,228) (26,786) (25,982) Property lease expense (644) (633) (492) (651) (769) (509) (490) (559) Other income/(expense) (2,538) 8,102 (5,896) 940 115 3,283 9,683 1,380 Depreciation and
amortization (52,032) (39,350) (41,244) (40,773) (45,401) (40,367) (39,928) (37,423) Changes in fair value of
financial instruments and unrealized foreign exchange gain/(loss) (3,212) 8,753 1,755 (4,364) 1,693 (7,131) 2,722 (1,630)
Current income tax (expense)/recovery (79) (80) (95) (76) (35) (84) (82) (80)
Deferred income tax (expense)/recovery 8,729 (2,072) 3,425 4,045 (745) 4,815 2,878 (273)
Net income/(loss) for the period (25,249) (770) (18,848) (18,464) (24,365) (17,934) (2,121) (17,528)
FFO 24,792 24,958 24,047 22,650 21,211 22,571 23,587 21,913 FFO per unit diluted 0.17 0.17 0.17 0.16 0.15 0.17 0.18 0.17
AFFO 22,036 22,368 21,876 20,250 18,848 20,287 21,216 19,788 AFFO per unit diluted 0.15 0.15 0.15 0.14 0.13 0.16 0.16 0.15
Our results for the past eight quarters have been affected by the contribution of acquisitions, the impact of the slow North American economy on occupancies, our decision in 2008 to reduce our exposure to third-party developers and related mezzanine loans which resulted in declining mezzanine loan interest and management fee income, changes in foreign exchange rates resulting in foreign exchange gains and losses on cross-border intercompany loans, and the issuance of Trust Units.

C H A R T W EL L SEN IORS HOU S ING R E I T | F inanc ia l Repor t 2011
Management ’s D iscuss ion & A na lys is
24 24
Selected Annual Financial Information
The following table summarizes selected annual financial information for each of the past three years ended December 31:
($000s, except per unit amounts) 2011 2010 2009 (2)
Property revenues (1) 750,634 707,166 646,806 Total revenues (1) 755,372 717,260 666,546 Direct operating expenses (1) 532,132 496,525 458,014 Net loss from continuing operations (63,331) (61,948) (61,001) Net loss (63,331) (61,948) (71,245) Total assets 2,706,521 2,679,096 2,598,674 Total liabilities 2,170,729 2,020,597 1,933,260
Distributions declared per unit 0.5400 0.5400 0.6569
(1) Excludes discontinued operations. (2) The 2009 amounts are reported under CGAAP and have not been restated to IFRS.
Our annual results for the past three years have been primarily affected by the acquisitions of new seniors housing communities and the impact of the slow North American economy on occupancies in 2009, 2010 and 2011.
Summary of Results of Operations by DivisionThe following section provides an analysis of the operating performance of each of our operating segments in 2011 and in Q4 2011.
Where a community provides more than one level of care, it has been designated to a segment according to the predominant level of care provided, type of licensing and funding provided and internal management responsibility.
Canadian Retirement Operations
The following table summarizes the composition of our Canadian Retirement Operations segment:
Composition of SuitesProperties ISL AL LTC Total
Same Property - Owned 100% 92 7,368 2,448 462 10,278 50% 3 376 - - 376 Total same property owned 95 7,744 2,448 462 10,654
Acquisitions & Development 100% owned: Operating 10 924 25 188 1,137 Development suites in lease-up - 202 157 - 359
10 1,126 182 188 1,496 Partially owned (1) 4 460 37 - 497 Total acquisitions & development 14 1,586 219 188 1,993
Total 109 9,330 2,667 650 12,647
(1) We have a 50% ownership interest in these properties with the exception of one property in which we have a 33.3% ownership interest.

C H A R T W E L L SE N IORS HOU S ING R E I T | F inanc ia l Repor t 2011 25
Management ’s D iscuss ion & A na lys is
25
The following table presents the results of operations of our Canadian Retirement Operations segment:
($000s) Q4 2011 Q4 2010Increase /
(Decrease) 2011 2010 Increase /
(Decrease)
Revenue Same property 78,957 76,233 2,724 309,780 300,308 9,472 Acquisitions and development 10,938 11,833 (895) 45,943 47,545 (1,602) Total revenue 89,895 88,066 1,829 355,723 347,853 7,870
Direct Operating Expenses Same property 50,959 49,456 1,503 196,954 190,069 6,885 Acquisitions and development 7,249 8,487 (1,238) 30,751 33,320 (2,569) Lease-up loss 122 - 122 169 - 169 Total direct operating expenses 58,330 57,943 387 227,874 223,389 4,485
Net Operating Income Same property 27,998 26,777 1,221 112,826 110,239 2,587 Acquisitions and development 3,689 3,346 343 15,192 14,225 967 Lease-up loss (122) - (122) (169) - (169) Total net operating income 31,565 30,123 1,442 127,849 124,464 3,385
Weighted average occupancy rate -
same property 89.4% 89.7% (0.3pp) 89.1% 89.3% (0.2pp)
Same property revenues increased 3.2% in 2011 primarily due to regular annual rental rate increases and higher ancillary services revenue.
Same property direct operating expenses increased 3.6% in 2011 primarily due to higher compensation expenses as a result of increased staffing required to provide additional services to our residents and increases in employee benefits costs.
Same property NOI increased $2.6 million or 2.1% in 2011 as follows: • Our Ontario retirement platform same property NOI decreased $0.2 million or 0.3% in 2011
primarily due to lower resident revenue as a result of decreased occupancy, offset by higher ancillary revenues and expense control initiatives.
• Our Western Canada platform same property NOI increased $1.5 million or 6.3% in 2011 primarily due to improved occupancies in our British Columbia properties.
• Our Quebec platform same property NOI increased $1.3 million or 5.7% in 2011 also due to continued occupancy improvements.
The following table summarizes our annual weighted average occupancy rates in our Canadian retirement same property portfolio:
2011 2010 Increase /
(Decrease) Ontario 90.1% 91.6% (1.5pp) Western Canada 90.5% 88.8% 1.7pp Quebec 87.0% 86.3% 0.7pp Total 89.1% 89.3% (0.2pp)
Fourth Quarter: Same property NOI increased $1.2 million or 4.6% in Q4 2011 as follows: • Our Ontario retirement platform same property NOI was consistent with Q4 2010 same property
NOI as the impact of lower occupancies was offset by higher ancillary revenues and lower administration, utilities and realty tax expenses.
• Our Western Canada platform same property NOI increased $0.5 million or 6.4% in Q4 2011 primarily due to improved occupancies.
• Our Quebec platform same property NOI increased $0.7 million or 13.8% in Q4 2011 due to higher occupancies, higher ancillary revenues and lower utility costs.

C H A R T W EL L SEN IORS HOU S ING R E I T | F inanc ia l Repor t 2011
Management ’s D iscuss ion & A na lys is
26 26
The following table summarizes our quarterly weighted average occupancy rates in our Canadian retirement same property portfolio:
Q4 2011 Q4 2010 Increase /
(Decrease) Q3 2011 Increase /
(Decrease) Ontario 90.5% 91.5% (1.0pp) 89.6% 0.9pp Western Canada 90.9% 90.4% 0.5pp 90.5% 0.4pp Quebec 87.3% 87.0% 0.3pp 87.1% 0.2pp Total 89.4% 89.7% (0.3pp) 88.9% 0.5pp
Our Q4 2011 occupancy improved 0.5 percentage points compared to Q3 2011 due to positive contributions from all of our market segments and particularly strong improvements in Ontario.
Canadian Long Term Care Operations
The following table summarizes the composition of our Canadian Long Term Care Operations segment:
Composition of SuitesProperties ISL AL LTC Total
Same property - 100% owned 15 - 115 1,516 1,631 Acquisitions - 100% owned 8 - - 1,385 1,385 Development - 100% owned (1) 1 - - 100 100 Total 24 - 115 3,001 3,116
(1) Represents one Ontario LTC community where we vacated certain retirement suites in preparation for re-development.
The following table presents the results of operations of our Canadian Long Term Care Operations segment:
($000s, except occupancy rates) Q4 2011 Q4 2010Increase /
(Decrease) 2011 2010 Increase /
(Decrease)
Revenue Same property 26,664 25,694 970 101,262 98,040 3,222 Acquisitions and development 25,676 25,502 174 98,959 78,522 20,437 Total revenue 52,340 51,196 1,144 200,221 176,562 23,659
Direct Operating Expenses Same property 23,693 22,047 1,646 89,269 85,608 3,661 Acquisitions and development 22,131 22,070 61 85,353 67,243 18,110 Total direct operating expenses 45,824 44,117 1,707 174,622 152,851 21,771
Net Operating Income Same property 2,971 3,647 (676) 11,993 12,432 (439) Acquisitions and development 3,545 3,432 113 13,606 11,279 2,327 Total net operating income 6,516 7,079 (563) 25,599 23,711 1,888
Weighted average occupancy rate -
same property 98.6% 97.9% 0.7pp 98.4% 98.1% 0.3pp
Same property revenues increased 3.3% in 2011 primarily due to higher government funding provided for direct resident care and services which are mainly staffing related. Direct operating expenses increased 4.3% in 2011 primarily due to additional staffing costs and increased administrative costs. In 2010, we had a one-time positive adjustment in our estimates of vacation and sick time accruals of approximately $0.7 million for which there was no comparable amount in 2011. As a result, same property NOI decreased $0.4 million or 3.5% in 2011.

C H A R T W E L L SE N IORS HOU S ING R E I T | F inanc ia l Repor t 2011 27
Management ’s D iscuss ion & A na lys is
27
Weighted average occupancies in the same property portfolio were at 98.4% in 2011, an increase of 0.3 percentage points. All of our Ontario LTC communities achieved the occupancy criteria to receive government funding as though fully occupied for 2011.
In Q2 2010, we completed the acquisition of INGʼs 50% interest in the Regency portfolio of eight Class A LTC communities in Ontario to bring our ownership of this portfolio to 100%. The operating results of these properties are reported under “Acquisitions” in the previous table.
Fourth Quarter: Same property NOI decreased $0.7 million or 18.5% in Q4 2011 primarily due to a one-time positive adjustment in Q4 2010 as discussed above. Excluding this adjustment, for which there was no comparable amount in Q4 2011, Q4 2011 same property NOI was in line with that in Q4 2010.
Weighted average occupancies in the same property portfolio were at 98.6% for Q4 2011 compared to 97.9% for Q4 2010.
U.S. Operations
The following table summarizes the composition of our U.S Operations segment:
Composition of SuitesProperties ISL AL LTC Total
Same Property - Owned 100% 23 721 1,613 - 2,334 50% 5 - 768 - 768 Total same property owned 28 721 2,381 - 3,102
Properties under Operating Lease 100% Interest 2 61 183 - 244 Total same property owned and leased 30 782 2,564 - 3,346
Acquisitions & Development Suites in Lease-up 100% owned - operating 21 2,761 962 189 3,912 Development suites in lease-up 93 - - 93 Total acquisitions & development suites in lease-up 21 2,854 962 189 4,005 Total 51 3,636 3,526 189 7,351

C H A R T W EL L SEN IORS HOU S ING R E I T | F inanc ia l Repor t 2011
Management ’s D iscuss ion & A na lys is
28 28
The following table presents the results of operations of our U.S. Operations segment:
(U.S.$000s, except as noted otherwise) Q4 2011 Q4 2010
Increase / (Decrease) 2011 2010
Increase / (Decrease)
Revenue Same property 26,610 25,640 970 105,590 100,791 4,799 Acquisitions, development and other (1) 28,498 22,538 5,960 94,932 81,758 13,174 Intercompany eliminations (38) (1,057) 1,019 (3,712) (5,106) 1,394 Total revenue 55,070 47,121 7,949 196,810 177,443 19,367
Direct Operating Expenses Same property 18,691 18,084 607 73,690 70,340 3,350 Acquisitions, development and other (1) 18,150 14,233 3,917 61,062 51,558 9,504 Intercompany eliminations (38) (1,057) 1,019 (3,712) (5,106) 1,394 Total direct operating expenses 36,803 31,260 5,543 131,040 116,792 14,248
Net Operating Income Same property 7,919 7,556 363 31,900 30,451 1,449 Acquisitions, development and other (1) 10,348 8,305 2,043 33,870 30,200 3,670 Total net operating income 18,267 15,861 2,406 65,770 60,651 5,119 Foreign exchange in CDN 315 224 91 (716) 1,815 (2,531) Total net operating income in CDN 18,582 16,085 2,497 65,054 62,466 2,588
Weighted average occupancy rate -
same property 93.3% 91.4% 1.9pp 91.7% 89.7% 2.0pp Weighted average occupancy rate –
total segment 90.2% 89.5% 0.7pp 89.1% 88.4% 0.7pp
(1) Includes the results of the Meridian portfolio, of which we acquired the remaining 50% interest that we did not own in Q2 2010, the 15-property ING portfolio, of which we acquired the remaining 50% interest that we did not own in Q4 2011, one property on which we completed an addition, as well as the results of our U.S. management operations.
Same property revenue increased 4.8% in 2011 primarily due to improved occupancies, regular annual rental rate increases and an increased number of residents purchasing assisted living and care services.
Weighted average occupancy rate in our U.S operating segment improved by 0.7 percentage points to 89.1% in 2011, driven primarily by strong growth in occupancies in our same property portfolio which improved by 2.0 percentage points to 91.7%.
Same property direct operating expenses increased U.S.$3.4 million or 4.8% in 2011 primarily due to higher operating costs in certain jurisdictions due to regulatory requirements, increased costs required to provide additional care and services to our residents offset by lower sales and marketing, utilities and administration costs.
As a result, same property NOI increased U.S.$1.4 million or 4.8% in 2011.
The operating results for our U.S. operating segment in Canadian dollars were also affected by fluctuations in foreign exchange rates. The average exchange rates were as follows:
Q4 2011 Q4 2010Increase /
(Decrease) 2011 2010 Increase /
(Decrease) Weighted average exchange rate for U.S.$1.00 to CDN 1.02 1.01 0.01 0.99 1.03 (0.04)
A $0.01 change in the exchange rate for one U.S. dollar to one Canadian dollar impacts AFFO from continuing operations by approximately $0.2 million.

C H A R T W E L L SE N IORS HOU S ING R E I T | F inanc ia l Repor t 2011 29
Management ’s D iscuss ion & A na lys is
29
Fourth Quarter: Same property NOI increased U.S.$0.4 million or 4.8% in Q4 2011.
Same property revenue increased 3.8% in Q4 2011 primarily due to improved occupancies, regular annual rental rate increases and an increased number of residents purchasing assisted living and care services.
Weighted average occupancy rate in our U.S operating segment improved by 0.7 percentage points to 90.2% in Q4 2011. The growth in the same property portfolio was 1.9 percentage points to 93.3%. Thisalso represents a 0.9 percentage point growth from Q3 2011 occupancy of 92.4%.
Same property direct operating expenses increased U.S.$0.6 million or 3.4% in Q4 2011 primarily due to higher operating costs in certain jurisdictions due to regulatory requirements, increased costs required to provide additional care and services to our residents offset by lower sales and marketing, utilities and administration costs. Upon transition of management of 45 of our U.S properties to Brookdale, we have benefited from Brookdaleʼs strong cost management practices and from their economies of scale.
Financial Position
Balance Sheet Analysis The following table summarizes the significant changes in our assets, liabilities and Unitholdersʼ equity for December 31, 2011 compared to December 31, 2010:
Increase / (Decrease) ($millions) Explanation
Total assets 27.4 The increase in total assets is primarily due to the following:
Property, plant and equipment
41.4 Property, plant and equipment increased due to acquisitions of $199.5 million, investments in development projects, building improvements and other capital expenditures of $73.2 million and foreign exchange translation of $14.3 million. These increases were offset by depreciation of $170.8 million, dispositions of $61.7 million and impairment provision of $13.1 million.
Mezzanine loans (11.2) Mezzanine loans outstanding decreased primarily due to the collection of three mezzanine loans in the amount of $8.1 million and the discharge of $2.1 million on acquisition of properties.
Other assets 6.0 Other assets increased primarily due to the deposit made on the Maestro Portfolio of $5.0 million and increases as a result of the ING transaction.
Capital funding receivable (3.5) During 2011, we received capital funding of $7.0 million, of which $3.5 million was recorded as interest income and $3.5 million was recorded as a reduction of the receivable.
Total liabilities 150.1 The increase in total liabilities is primarily due to the following:
Mortgages payable 146.4 Mortgages payable increased as a result of new mortgage financings of $67.7 million, assumed mortgages on acquired properties of $153.2 million and foreign exchange translation of $13.4 million. This was offset by regular amortizing principal repayments of $40.7 million, mortgages discharged on disposal of properties of $47.0 million and net financing costs and mark-to-market amortization of $0.2 million.
Accounts payable and other liabilities
18.1 Accounts payable and other liabilities increased due to increase of work-in-process accruals and increases due to acquisitions completed in 2011.
Unitholdersʼ equity (122.7) The decrease in Unitholdersʼ equity is primarily due to cash distributions and the allocation of net loss to the Trustʼs Unitholders.

C H A R T W EL L SEN IORS HOU S ING R E I T | F inanc ia l Repor t 2011
Management ’s D iscuss ion & A na lys is
30 30
Outstanding Units Data The following table summarizes changes in the number of outstanding units during 2011:
Trust Units
Trust Units issued under
LTIP Class B
Units Deferred
Trust Units Total
Balance December 31, 2010 140,598,132 2,244,858 1,714,652 208,834 144,766,476
Trust Units issued pursuant to the Dividend Reinvestment Plan (“DRIP”) 1,966,054 - - - 1,966,054
Trust Units issued under LTIP - 166,983 - - 166,983 Trust Units surrendered for cancellation
under LTIP - (124,683) - - (124,683) Trust Units released on settlement of LTIP
receivable 94,313 (94,313) - - - DTUs issued - - - 127,449 127,449 DTU distributions - - - 18,267 18,267 Exchange of Class B Units 33,127 - (33,127) - - Balance December 31, 2011 142,691,626 2,192,845 1,681,525 354,550 146,920,546
Liquidity and Capital Commitments Liquidity
Our cash commitments include interest and other payments related to long-term debt and convertible debentures, contractual deferred purchase obligations, obligations under operating leases as well as cash distributions to Unitholders.
Our principal source of liquidity is cash flow from operations. At December 31, 2011, we had cash on hand in the amount of $10.7 million. In order to provide for our operating and capital requirements, we also raise funds through the capital markets, arrange mortgage debt financing and have a Credit Facility in place. In Q2 2011, we renewed our Credit Facility until June 24, 2012. Under the renewed terms, our maximum borrowing capacity was increased from $75.0 million to $85.0 million with amounts outstanding under the Credit Facility bearing interest at the bankʼs prime rate plus 1.65% or at the applicable bankerʼs acceptance rate plus 2.65%. All other terms remained substantially unchanged. At December 31, 2011, the maximum available borrowing capacity under the Credit Facility was $85.0 million, of which $2.3 million was utilized to support outstanding letters of credit and $53.0 million was drawn, leaving available borrowing capacity at $29.7 million.
Debt Strategy
At the present time we employ the following sources of debt financing: property-specific secured mortgages; unsecured convertible subordinated debentures; and the Credit Facility. Our debt management objectives are to:
• access low-cost, long-term, fixed-rate debt and short-term, variable-rate construction financing; and• manage interest rate risk by spreading debt maturities over time with the target of having no more
than approximately 10% of our total debt maturing in any year.
Our Declaration of Trust limits the amount of overall indebtedness that we can incur to 60% of Adjusted Gross Book Value (“GBV”), excluding convertible debentures, or 65% of GBV including convertible debentures (“Indebtedness Ratio”).

C H A R T W E L L SE N IORS HOU S ING R E I T | F inanc ia l Repor t 2011 31
Management ’s D iscuss ion & A na lys is
31
Under the Declaration of Trust, total indebtedness includes any obligation for borrowed money, any obligation incurred in connection with the acquisition of property, assets or business, other than deferred income tax liability, any capital lease obligation and any guaranteed obligations of third parties to the extent included in our consolidated balance sheet.
At December 31, 2011, our Indebtedness Ratio was 57.0% and 59.3% excluding and including convertible debentures, respectively.
Effective January 1, 2011 Chartwellʼs Trustees approved an amendment to the GBV definition in the Declaration of Trust to add back: (a) the difference between the GBV of assets under CGAAP and IFRS on the Transition Date, and (b) related costs in respect of completed property acquisitions that were expensed in the period incurred.
Indebtedness Ratio: The following table presents the calculation of our Indebtedness Ratio as at December 31:
($000s) 2011 2010
Mortgages payable (contractual amount) 1,880,533 1,736,057Credit Facility 53,000 51,000 Convertible debentures (face value) 75,000 75,000 Total Indebtedness 2,008,533 1,862,057
Total assets 2,706,521 2,679,096 Accumulated depreciation and amortization 304,019 166,917 Cumulative transaction costs on business combinations 4,575 3,295 Change in GBV on transition to IFRS (1) 379,670 388,047 GBV of assets 3,394,785 3,237,355 Less: Assets financed by deferred purchase consideration on acquisition properties 5,328 7,512 GBV of assets (net of deferred consideration) 3,389,457 3,229,843
Indebtedness Ratio before convertible debentures 57.0% 55.3% Indebtedness Ratio including convertible debentures 59.3% 57.7%
(1) Adjusted in Q3 2011 to reflect the disposition of one property in Quebec.
In addition to the Indebtedness Ratio restrictions under our Declaration of Trust, we adopted a supplemental operating target for managing our debt portfolio and will be monitoring our Interest Coverage Ratio.
Interest Coverage Ratio: Effective December 31, 2010, we adopted an interest coverage guideline. The interest coverage guideline provides an indication of an entityʼs ability to service or pay the interest charges relating to the underlying debt and have generally been used by debt rating agencies to test an entityʼs ability to service its debt. Generally, the higher the ratio, the lower the risk of default on debt. We will target to maintain our Interest Coverage Ratio above 1.65 times. The following table summarizes our Interest Coverage Ratio:
($000s, except Interest Coverage Ratio) Q4 2011 Q4 2010 2011 2010
Interest expense including capitalized interest 27,303 27,700 103,726 108,518 Property lease expense 644 769 2,420 2,327
27,947 28,469 106,146 110,845
Adjusted earnings before interest, taxes, depreciation and amortization (“Adjusted EBITDA”) (1) 52,683 49,694 202,299 200,514
Interest Coverage Ratio 1.89x 1.75x 1.91x 1.81x Target Interest Coverage Ratio >1.65x
(1) Refer to the “Key Performance Indicators – Adjusted EBITDA” section of this MD&A for a discussion of Adjusted EBITDA.
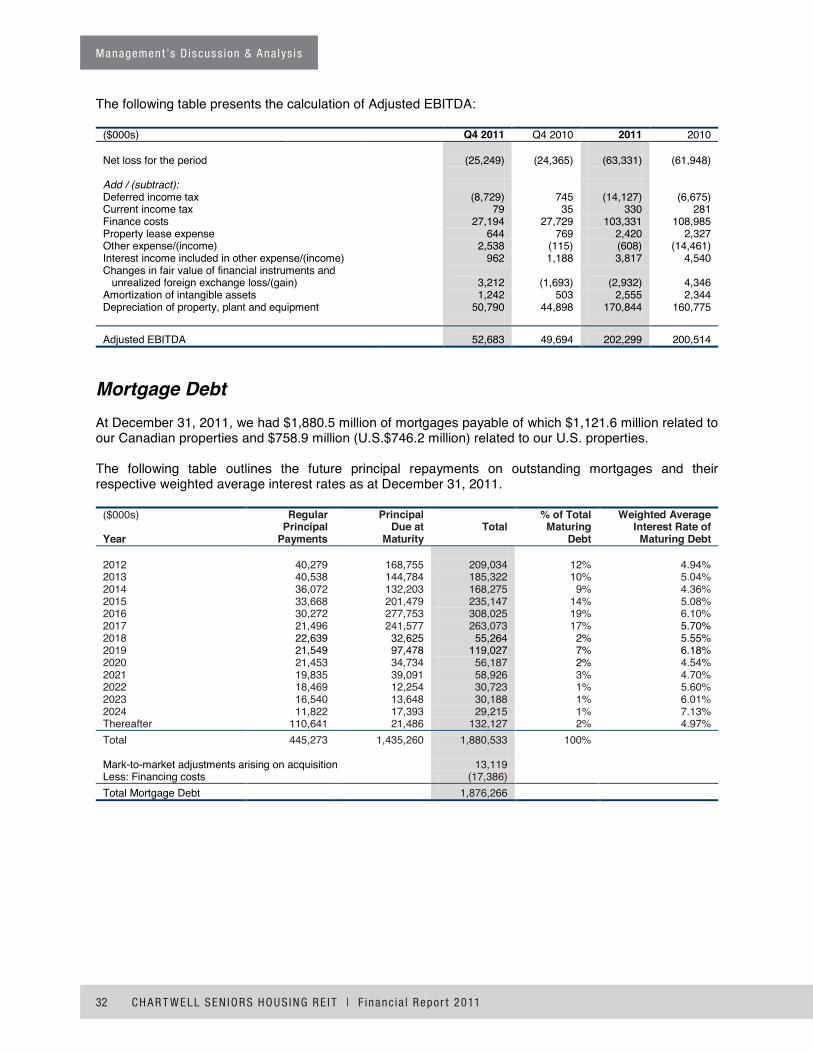
C H A R T W EL L SEN IORS HOU S ING R E I T | F inanc ia l Repor t 2011
Management ’s D iscuss ion & A na lys is
32 32
The following table presents the calculation of Adjusted EBITDA:
($000s) Q4 2011 Q4 2010 2011 2010
Net loss for the period (25,249) (24,365) (63,331) (61,948)
Add / (subtract): Deferred income tax (8,729) 745 (14,127) (6,675) Current income tax 79 35 330 281 Finance costs 27,194 27,729 103,331 108,985 Property lease expense 644 769 2,420 2,327 Other expense/(income) 2,538 (115) (608) (14,461) Interest income included in other expense/(income) 962 1,188 3,817 4,540 Changes in fair value of financial instruments and
unrealized foreign exchange loss/(gain) 3,212 (1,693) (2,932) 4,346 Amortization of intangible assets 1,242 503 2,555 2,344 Depreciation of property, plant and equipment 50,790 44,898 170,844 160,775
Adjusted EBITDA 52,683 49,694 202,299 200,514
Mortgage DebtAt December 31, 2011, we had $1,880.5 million of mortgages payable of which $1,121.6 million related to our Canadian properties and $758.9 million (U.S.$746.2 million) related to our U.S. properties.
The following table outlines the future principal repayments on outstanding mortgages and their respective weighted average interest rates as at December 31, 2011.
($000s)
Year
Regular Principal
Payments
PrincipalDue at
Maturity Total
% of Total Maturing
Debt
Weighted AverageInterest Rate of
Maturing Debt
2012 40,279 168,755 209,034 12% 4.94% 2013 40,538 144,784 185,322 10% 5.04% 2014 36,072 132,203 168,275 9% 4.36% 2015 33,668 201,479 235,147 14% 5.08% 2016 30,272 277,753 308,025 19% 6.10% 2017 21,496 241,577 263,073 17% 5.70% 2018 22,639 32,625 55,264 2% 5.55% 2019 21,549 97,478 119,027 7% 6.18% 2020 21,453 34,734 56,187 2% 4.54% 2021 19,835 39,091 58,926 3% 4.70% 2022 18,469 12,254 30,723 1% 5.60% 2023 16,540 13,648 30,188 1% 6.01% 2024 11,822 17,393 29,215 1% 7.13% Thereafter 110,641 21,486 132,127 2% 4.97% Total 445,273 1,435,260 1,880,533 100%
Mark-to-market adjustments arising on acquisition 13,119 Less: Financing costs (17,386) Total Mortgage Debt 1,876,266

C H A R T W E L L SE N IORS HOU S ING R E I T | F inanc ia l Repor t 2011 33
Management ’s D iscuss ion & A na lys is
33
The following table provides selected financial statistics for our mortgage debt portfolio:
At December 31, 2011 At December 31,
2010 Canadian Debt U.S. Debt Combined Combined
Fixed Rate Variable Rate Fixed Rate
Amount ($millions) 1,025.9 95.7 758.9 1,880.5 1,736.1 Weighted average rate 5.24% 4.37% 5.95% 5.48% 5.44% Average term to maturity (years) 8.8 1.2 4.8 6.8 7.5
Debt maturing through 2012 relates exclusively to mortgages on properties in our Canadian portfolio of assets. In Canada, we have access to low-cost, CMHC-insured debt. All our Canadian properties are eligible for CMHC financing and as of December 31, 2011, approximately 61% of our total Canadian mortgage debt was CMHC insured. We intend to continue financing our properties through this program, including converting conventional mortgages to CMHC-insured debt on renewal.∗
In the U.S., over 75% of our mortgages are with the Federal Home Loan Mortgage Corporation (“Freddie Mac”) and Federal National Mortgage Association (“Fannie Mae”). Both of these entities are government-sponsored enterprises which provide access to competitive financing for seniors housing properties. We have no U.S. debt maturities until 2013, when U.S.$37.5 million of mortgages (or 5.4% of our total U.S. debt) will mature. The remaining U.S. loans mature between 2015 and 2019.
Our variable-rate mortgages primarily relate to recently acquired communities in lease-up and our development projects in Canada. Variable-rate loans are expected to be refinanced with fixed-rate, CMHC-insured debt upon completion and stabilization of the development properties and acquired properties in lease-up.* The following charts provide the breakdown of our debt maturities in Canada and the U.S.:
Convertible DebenturesAt December 31, 2011, we had $75 million of 5.9% Convertible Debentures outstanding. The 5.9% Convertible Debentures are convertible at the holderʼs option into Trust Units at a conversion price of $16.25 per unit and mature on May 1, 2012.
As discussed under the “Significant Events” section of this MD&A, on February 15, 2012, we issued a redemption notice to the holders of our 5.9% convertible debentures and we expect to complete this redemption on or about March 16, 2012.*
∗ This paragraph contains forward-looking information. Please see the “Forward-Looking Information and Risks and Uncertainties” section of this MD&A.

C H A R T W EL L SEN IORS HOU S ING R E I T | F inanc ia l Repor t 2011
Management ’s D iscuss ion & A na lys is
34 34
Capital Expenditures
We classify our capital expenditures in the following main categories:
• Development – capital expenditures in respect of our development projects in progress. • Acquisition – capital expenditures which were identified during acquisition due diligence for newly
acquired assets. • Revenue enhancing and repositioning – capital expenditures that improve the revenue generating
potential of our properties. • Maintenance – capital expenditures incurred to maintain existing revenue generating potential of our
properties, such as routine replacement of building components, furniture, fixtures and equipment. We generally allocate 2% of our gross property revenue to maintenance capital expenditures annually; however, actual amounts spent may fluctuate from period to period.
The following table summarizes additions to properties during 2011:
($000s) 2011
Development 35,741 Acquisition 10,251 Revenue enhancing and repositioning 3,654 Maintenance (1) 21,727 Total 71,373
(1) Includes $1.8 million in assets acquired under capital lease.
Contractual Obligations and Guarantees
Contractual Obligations
The following table summarizes the major contractual obligations as at December 31, 2011:
($000s) Total 2012 2013 2014 2015 2016 Thereafter Mortgages payable 1,880,533 209,034 185,322 168,275 235,147 308,025 774,730 Accounts payable and other
liabilities 111,688 111,688 - - - - - Convertible debentures 75,000 75,000 - - - - - Credit Facility 53,000 53,000 - - - - - Purchase obligations 42,067 41,949 118 - - - - Property operating leases 9,744 1,624 1,624 1,624 1,624 1,624 1,624 Other operating leases 4,116 1,166 1,166 1,166 583 35 - Land leases 16,059 395 395 395 395 395 14,084 Total contractual obligations 2,192,207 493,856 188,625 171,460 237,749 310,079 790,438
Purchase obligations relate to the following:
• Deferred purchase obligations with respect to previously closed acquisitions in the amount of approximately $5.5 million payable generally on the earlier of the maturity date or the property achieving certain operating results as defined in the respective purchase and sale agreements.
• Commitments with respect to various construction contracts of approximately $35.8 million. • Fixed-price gas and electricity contracts of approximately $0.8 million.
Property operating leases relate to our 100% leased interests in two seniors housing communities.
C H A R T W E L L SE N IORS HOU S ING R E I T | F inanc ia l Repor t 2011 35
Management ’s D iscuss ion & A na lys is
35
Other operating leases relate to the agreements we entered into for office space in Ontario, Quebec, and British Columbia.
Land leases relates to an obligation we assumed in respect of the three leases which expire between 2044 and 2061 with annual payments of approximately $0.4 million.
Other Contracts
45 of our U.S. properties are managed by Brookdale. The management agreements are for a term of approximately 10 years, maturing on December 31, 2021, and call for payment of a base management fee of 5% of gross revenue. Such management agreements also provide for an incentive fee of up to 2% of gross revenue and for a reduction of fee of up to 1% of gross revenue based on achievement of certain operating targets.
Guarantees
As of December 31, 2011, together with our joint venture partners, we have jointly and severally guaranteed CMHC-insured loans on three properties totalling $52.3 million.
Cash Flow Analysis
The following table summarizes the significant changes in our operating, financing and investing cash flows between 2011 and 2010:
Cash Provided by (Used in):
Increase / (Decrease) ($millions)
Explanation
Operating activities 22.1 Cash flows from operating activities increased primarily due to positive changes in non-cash working capital items and increased contributions from property operations.
Financing activities 75.7 Cash flows from financing activities increased primarily due to new mortgage financings and a decrease in principal repayments, offset by decreased proceeds from our Credit Facility.
Investing activities (10.3) Cash flows from investing activities decreased primarily due to higher additions to property, plant and equipment offset by a reduction in acquisition activity and proceeds from the disposal of properties.
Distributions
The declaration and payment of future distributions is subject to the discretion of the board of trustees of Chartwell (the “Trustees”). The Trustees rely upon forward-looking cash flow information including forecasts and budgets, results of operations, requirements for capital expenditures and working capital, future financial prospects of the Trust, debt covenants and obligations, and any other factors deemed relevant by them in setting the distribution rate. Our monthly distributions are $0.0450 per unit, or $0.54 per unit on an annualized basis.
Unitholders who are Canadian residents and beneficial holders of 1,000 units or more are eligible to participate our Distribution Reinvestment Plan (“DRIP”), which allows Unitholders to use their monthly cash distributions to steadily increase ownership without incurring any commission or other transaction costs. Participating investors registered in the DRIP receive additional bonus units in an amount equal to 3% of their distributions which they have elected to reinvest. In 2011 and Q4 2011, our average DRIP participation was 19.8% and 17.9%, respectively compared to 6.7% participation in 2010 and 7.5% in 2009.

C H A R T W EL L SEN IORS HOU S ING R E I T | F inanc ia l Repor t 2011
Management ’s D iscuss ion & A na lys is
36 36
The following table summarizes distributions made in 2011, 2010 and 2009:
($000s) Q4 2011 2011 2010 2009 Distributions declared on Trust Units 19,487 77,538 71,144 67,711 Distributions on Class B Units 227 908 989 1,395 Distributions reinvested under DRIP (3,418) (15,075) (4,795) (5,074) Distributions applied against LTIP receivable (306) (1,230) (1,235) (1,771) Distributions paid or payable in cash 15,990 62,141 66,103 62,261
The following table summarizes cash distributions made in 2011, 2010 and 2009 in relation to net loss and cash flows from operating activities:
($000s) Q4 2011 2011 2010 2009(2)
Cash flows from operating activities 37,576 110,998 88,861 64,810 Net loss (25,249) (63,331) (61,948) (72,692) Distributions paid or payable in cash (1) 15,990 62,141 66,103 62,261 Excess of cash flows from operating activities over cash
distributions paid 21,586 48,857 22,758 2,549 (Shortfall) of net loss over cash distributions paid (41,239) (125,472) (128,051) (134,953)
(1) Cash distributions do not include distributions satisfied through issuance of units under DRIP or distributions applied against the LTIP receivable.
(2) 2009 amounts are reported under CGAAP and have not been restated to IFRS.
Cash flow from operating activities is affected by changes in non-cash working capital balances. Changes in non-cash working capital fluctuate from period to period. Changes in non-cash working capital increased cash flows from operating activities by $12.2 million in 2011.
Our distributions exceeded net loss in 2011, 2010 and 2009. We anticipate that this will continue. We do not use net loss in accordance with IFRS as the basis to establish the level of distributions to Unitholders as net loss includes, among other items, non-cash depreciation and amortization and changes in fair values of certain liabilities. We do not consider non-cash depreciation and amortization and fluctuations in fair values of certain liabilities in establishing our distribution levels as we believe that the value of our real estate investments generally does not diminish over time and as we give consideration to maintenance capital expenditures in establishing the level of annual distributions to Unitholders. We believe that our current distribution level is sustainable.∗
∗ This paragraph contains forward-looking information. Please see the “Forward-Looking Information and Risks and Uncertainties” section of this MD&A.

C H A R T W E L L SE N IORS HOU S ING R E I T | F inanc ia l Repor t 2011 37
Management ’s D iscuss ion & A na lys is
37
Key Performance Indicators We use a number of key performance indicators (“KPIs”) for monitoring and analyzing our financial results. These KPIs are not defined by IFRS and may not be comparable to similar measures presented by other income trusts or other companies. KPIs are described below:
Funds from Operations
FFO does not have a standardized meaning prescribed by IFRS and should not be construed as an alternative to net earnings or cash flow from operating activities as determined by IFRS. FFO as presented may not be comparable to similar measures presented by other real estate investment trusts. However, we present FFO substantially consistent with the definition adopted by the Real Property Association of Canada (“REALpac”) with the exception of the adjustment for the changes in fair value of LTIP. In June 2010, REALpac issued a White Paper on FFO for IFRS, which is effective upon adoption of IFRS. According to REALpac guidance, FFO is defined as follows: Profit or loss per IFRS Statement of Comprehensive Income adjusted for:
A. Unrealized changes in the fair value of investment properties B. Depreciation of depreciable real estate assets including depreciation for components relating to
capitalized leasing costs, capitalized tenant allowances treated as capital improvements and lease-related items ascribed in a business combination
C. Amortization of tenant allowances and landlordʼs work spent for the fit-out of tenant improvements and amortized as a reduction to revenue in accordance with SIC-15
D. Amortization of tenant/customer relationship intangibles or other intangibles arising from a business combination
E. Gains / losses from sales of investment properties and owner-occupied properties, including the gain or loss included within discontinued operations (if applicable)
F. Tax on profits or losses on disposals of properties G. Deferred taxes H. Impairment losses or reversals recognized on land and depreciable real estate properties, excluding
those relating to properties used exclusively for administrative purposes I. Revaluation gains or losses recognized in profit or loss on owner-occupied properties, excluding
those relating to properties used exclusively for administrative purposes J. Transaction costs expensed as a result of the purchase of a property being accounted for as a
business combination K. Foreign exchange gains or losses on monetary items not forming part of a net investment in a foreign
operation L. Gain or loss on the sale of an investment in a foreign operation M. Changes in the fair value of financial instruments which are economically effective hedges but do not
qualify for hedge accounting N. Negative goodwill or goodwill impairment O. Effects of redeemable units classified as financial liabilities
Other items:
P. Results of discontinued operations Q. Adjustments for equity accounted entities R. Non-controlling interests in respect of the above

C H A R T W EL L SEN IORS HOU S ING R E I T | F inanc ia l Repor t 2011
Management ’s D iscuss ion & A na lys is
38 38
In our opinion, the use of FFO, combined with the required primary IFRS presentations, is fundamentally beneficial to the users of the financial information, improving their understanding of our operating results. We generally consider FFO to be a meaningful measure for reviewing our operating and financial performance because, by excluding real estate asset depreciation and amortization (which can vary among owners of identical assets in similar condition based on historical cost accounting and useful life estimates), FFO can help one to compare the operating performance of the Trustʼs real estate portfolio between financial reporting periods.
The tables presented under the “Consolidated Results of Operations – Non-IFRS Measures” section of this MD&A provide a reconciliation of FFO to net income, as reported in our Financial Statements.
Adjusted Funds from Operations AFFO does not have a standardized meaning prescribed by IFRS and should not be construed as an alternative to net earnings or cash flow from operating activities as determined by IFRS. AFFO as presented may not be comparable to similar measures presented by other issuers. We believe AFFO is useful in the assessment of our operating performance and that this measure is also useful for valuation purposes and is a relevant and meaningful measure of our ability to earn and distribute cash to Unitholders. We calculate AFFO by adding or subtracting certain items to or from FFO as defined by REALpac, as follows:
Principal portion of capital subsidy receivable: This item represents a portion of the long-term (maximum 20-year) cash flow stream provided by the Ontario Ministry of Health and Long Term Care to communities which meet certain design criteria. We include this item in AFFO calculations.
Income guarantees: This item represents amounts due from vendors of acquired communities under the applicable purchase and sale agreement. It is generally applicable to communities in lease-up.
Amortization of debt mark-to-market adjustments and amortization of financing costs: Adjustments made in AFFO calculation to adjust for non-cash interest expense items and to account for interest expense based on the contractual terms of the underlying debt.
Financing cost reserve: In order to account for financing costs routinely incurred on re-financing of existing debt, we included this reserve in the calculation of AFFO. We calculate this reserve based on our estimate of normalized costs of re-financing (60 basis points) applied to the debt balances outstanding at the end of the reporting period taking into account weighted average term to maturity of our mortgage portfolio.
Capital maintenance reserve: Capital maintenance reserve is estimated at 2% of property revenue.
The tables presented under the “Consolidated Results of Operations – Non-IFRS Measures” section of this MD&A provide details of AFFO calculations.
Net Operating Income NOI does not have a standardized meaning prescribed by IFRS and should not be construed as an alternative to other IFRS metrics. We define NOI as the difference between property revenue and property direct operating expenses. We believe that the use of NOI combined with primary IFRS measures is beneficial to the users of the financial information in understanding operating performance of our operating segments and platforms.
Per Unit Amounts
In our calculations of FFO per unit and AFFO per unit, we include the Class B Units as the Class B Units are exchangeable into Trust Units at any time at the option of the Unitholder. In addition, we include units issued under DTU and LTIP.

C H A R T W E L L SE N IORS HOU S ING R E I T | F inanc ia l Repor t 2011 39
Management ’s D iscuss ion & A na lys is
39
Same Property Performance We evaluate our financial performance by analyzing our same property portfolio. Generally, our same property portfolio excludes properties that have not been owned or leased continuously since the beginning of the previous fiscal year. In addition, to improve comparability, we designate properties where we have added significant capacity or expect in the current year to open new suites to be excluded from the same property portfolio. The following table summarizes the same property portfolio for 2011:
Properties Suites/Beds
Canadian Retirement Operations 95 10,654 Canadian Long Term Care Operations 15 1,631 U.S. Operations (owned and leased) 30 3,346 Total Same Property Portfolio 140 15,631
Adjusted EBITDA EBITDA is a generally accepted proxy for operating cash flow and represents earnings before interest expense and excludes gains/losses on disposition of properties and non-recurring items such as asset impairment provisions or unrealized gains and losses. In addition, in our calculation of the Adjusted EBITDA, we exclude transaction costs arising on business combinations. These costs were previously capitalized as part of acquisitions under CGAAP. Under IFRS, these costs are expensed as incurred.
Critical Accounting Policies and Estimates Under IFRS, it is necessary to make estimates when preparing the financial statements and then to re-evaluate the original estimates used on an ongoing basis. Managementʼs estimates are based on past experience and other factors that it believes are reasonable under the circumstances. As this involves varying degrees of judgment and uncertainty, the amounts currently reported in the financial statements could, in the future, prove to be inaccurate.
Valuation of Property, Plant and Equipment (“PP&E”)PP&E makes up approximately 93% of our assets. On an annual basis, and when indicators of impairment exist, we evaluate whether the recoverable amount of a cash generating unit (“CGU”) exceeds its carrying amount. Factors which could indicate that an impairment exists include significant underperformance relative to historical or projected operating results, significant changes in the manner or use of the assets, significant negative industry or economic trends, or a change in the strategy for our overall business. In some cases, these events are clear, however, in many cases, a clearly identifiable event indicating possible impairment does not occur. Instead, a series of individually insignificant events may occur over a period of time leading to an indication that an asset may be impaired. As a result, events occurring in these situations may not be known until a date subsequent to their occurrence.
Our business, markets and business environment are continually monitored, and judgments and assessments are made to determine whether an event has occurred that indicates possible impairment. If such an indication exists, then the assetʼs recoverable amount is estimated and an impairment loss is recognized immediately in profit and loss for the amount by which the assetʼs carrying amount exceeds its recoverable amount. The recoverable amount is the higher of a) fair value less costs to sell, and b) the value in use calculated on a discounted cash flow basis. Fair value is the amount at which an item could be bought or sold in a current transaction between willing parties. Both the identification of events that may trigger an impairment and the estimates of future cash flows and the fair value of the asset require considerable judgment.
C H A R T W EL L SEN IORS HOU S ING R E I T | F inanc ia l Repor t 2011
Management ’s D iscuss ion & A na lys is
40 40
The assessment of asset impairment requires management to make significant assumptions about future revenues including assumptions about rates and occupancies, labour and other supply rates, and utility costs over the life of the PP&E. Actual results can, and often do, differ from these estimates, and can have either a positive or negative impact on the estimate and whether an impairment situation exists. In addition, when impairment tests are performed, the estimated useful lives of the properties are reassessed, with any change accounted for prospectively.
Useful Life of PP&E PP&E is depreciated over the estimated useful life of their components. Estimated useful lives are determined based on current facts and past experience, and take into consideration the anticipated physical life of the asset components. A component is a tangible asset that can be separately identified as an asset, and is expected to provide a benefit of greater than one year. The rates used are reviewed on an ongoing basis to ensure they continue to be appropriate, and are also reviewed in conjunction with impairment testing, as discussed previously.
Guarantees We continually review our contingent liabilities relating to guarantees we have provided on behalf of third parties. Our guarantees remain in place for certain debts assumed by purchasers in connection with property dispositions, and will remain until such debts are extinguished or lenders agree to release our covenants. Recourse would be available to us under these guarantees in the event of a default by the borrowers, in which case we would have a claim against the underlying real estate investments. We would record a provision for a liability when the carrying values of the related real estate investments are not recovered either as a result of the inability of the underlying assetsʼ performance to meet the contractual debt service terms of the underlying debt and/or the fair value of the collateral assets are insufficient to cover the obligations and encumbrances in a sale between unrelated parties in the normal course of business. Our estimates of future cash flow (which amongst others, involve assumptions of estimated occupancy, rental rates and residual value) and fair value could vary and result in a significantly different assessment of such contingent liability.
Income taxes In accordance with IFRS, we use the asset and liability method of accounting for deferred income taxes and provide for deferred income taxes for all significant temporary differences between the carrying amounts of associated liabilities for financial reporting purposes and the amounts used for taxation purposes.
Preparation of the financial statements requires an estimate of income taxes in the jurisdictions in which we operate. The process involves an estimate of our actual current tax exposure and an assessment of temporary differences resulting from differing treatment of items, such as depreciation and amortization, for tax and accounting purposes along with the expected reversal pattern of these temporary differences. These differences result in deferred tax assets and liabilities which are included in our balance sheet, calculated based on the estimated tax rate in effect at the time these differences reverse.
Judgment is required to assess tax interpretations, regulations and legislation, which are continually changing to ensure liabilities are complete and to ensure assets are realizable. The impact of different interpretations and applications could potentially be material.
An assessment must also be made to determine the likelihood that the Trustʼs deferred tax assets will be recovered from future taxable income. To the extent that recovery is considered less rather than more likely, deferred tax assets are not recognized. Judgment is required in determining the provision for income taxes, and deferred income tax assets and liabilities. To the extent the recognition of deferred tax assets is revised, current period earnings would be affected.

C H A R T W E L L SE N IORS HOU S ING R E I T | F inanc ia l Repor t 2011 41
Management ’s D iscuss ion & A na lys is
41
Fair value Fair value is the amount at which an item could be bought or sold in a current transaction between independent, knowledgeable willing parties (that is, other than in a forced or liquidation sale) in an armʼs length transaction under no compulsion to act. Quoted market prices in active markets are the best evidence of fair value and are used as the basis for fair value measurement, when available. When quoted market prices are not available, estimates of fair value are based on the best information available, including prices for similar items and the results of other valuation techniques. Valuation techniques used would be consistent with the objective of measuring fair value.
The techniques used to estimate future cash flows will vary from one situation to another depending on the circumstances surrounding the asset or liability in question. We assess fair value based on estimated discounted cash flow projections and available market information. Cash flow estimates incorporate assumptions that marketplace participants would use in their estimates (including the historical operating results and anticipated trends, local markets and economic conditions).
Our financial statements are affected by fair value measures, the most significant areas affected are as follows:
• Upon acquisition of properties we estimate the fair value of acquired tangible assets (land, building and furniture, fixtures and equipment) and identifiable intangible assets and liabilities (above and below-market leases representing the value of the differential between contractual and market rents, in-place leases, customer relationships, and licenses) and the value of the differential between stated and market interest rates on long term liabilities assumed at acquisition.
• Fair value forms the basis for allocating consideration to each unit of accounting for revenues from contracts with multiple deliverables that meet the criteria for separate unit of accounting revenue recognition.
• As discussed in valuation of properties above, an impairment loss is recognized when the carrying amount of an asset is not recoverable. The impairment loss is determined as the excess of carrying value over its recoverable amount.
• Intangible assets with indefinite lives are also required to be assessed at a minimum annually, comparing the recoverable amount to carrying value to determine if an impairment loss is required to be recognized.
• In assessing our potential exposure relating to third party guarantees we evaluate the fair value of the borrowerʼs interests in the underlying real estate investments compared to the liability for which we have provided a guarantee.
• All financial instruments are required to be measured at fair value on initial recognition. Measurement in subsequent periods may be at fair value depending on whether the financial instrument has been classified as held-for-trading, available-for-sale, held-to-maturity, loans and receivables, or other liabilities.
• We disclose in our financial statements the fair value of our mortgages based upon discounted future cash flows using discount rates that reflect current market conditions for instruments with similar terms and risks, or market quotes where applicable.
• Class B Units of Master LP and convertible debentures are recorded at fair value based on listed prices of the debentures and of Trust Units.
Property Revenue Revenue is recognized when services are provided to residents. In Canada, the provinces regulate fees charged to residents of long term care homes and provincial or regional programs fund a substantial portion of these fees. We receive reimbursements from these funding authorities for services rendered to residents covered by these programs. Preparation of the financial statements requires an estimate of the amounts recoverable and earned from the various funding authorities in the jurisdictions in which we

C H A R T W EL L SEN IORS HOU S ING R E I T | F inanc ia l Repor t 2011
Management ’s D iscuss ion & A na lys is
42 42
operate. Judgment is required to assess amounts recoverable under the various funding agreements, and related regulations and legislation, which are continually changing. The impact of different interpretations and applications of these agreements could change revenues.
New Accounting Standards
Recent Accounting Pronouncements
Financial Instruments
In October 2010, the International Accounting Standards Board (“IASB”) issued IFRS 9 – Financial Instruments (“IFRS 9”). IFRS 9, which replaces IAS 39 – Financial Instruments: Recognition and Measurement, establishes principles for the financial reporting of financial assets and financial liabilities that will present relevant and useful information to users of financial statements for their assessment of the amounts, timing and uncertainty of an entityʼs future cash flows. This new standard is effective for the interim and annual consolidated financial statements commencing January 1, 2013. We are assessing the impact of this new standard on our consolidated financial statements.
Consolidated Financial Statements
On May 12, 2011, IASB issued IFRS 10 – Consolidated Financial Statements (“IFRS 10”). IFRS 10 replaces portions of IAS 27 – Consolidated and Separate Financial Statements (“IAS 27”) that addresses consolidation, and supersedes SIC-12 in its entirety. The objective of IFRS 10 is to define the principles of control and establish the basis of determining when and how an entity should be included within a set of consolidated financial statements. IAS 27 has been amended for the issuance of IFRS 10 and retains guidance only for separate financial statements.
Joint Arrangements
On May 12, 2011, the IASB issued IFRS 11 – Joint Ventures (“IFRS 11”). IFRS 11 supersedes IAS 31 – Interest in Joint Ventures and SIC-13 – Jointly Controlled Entities – Non-Monetary Contributions by Venturers. Through an assessment of the rights and obligations in an arrangement, IFRS 11 establishes principles to determine the type of joint arrangement and guidance for financial reporting activities required by the entities that have an interest in arrangements that are controlled jointly. Furthermore, IFRS 11 eliminates the option to proportionately consolidate interests in jointly-controlled entities; these entities must now use the equity method. As a result of the issuance of IFRS 10 and IFRS 11, IAS 28 – Investments in Associates and Joint Ventures (“IAS 28”) has been amended to correspond to the guidance provided in IFRS 10 and IFRS 11. This would impact 7 of our jointly-controlled properties which are currently proportionately consolidated under IFRS and will not have an impact on Unitholderʼs equity, net income or FFO going forward as it only has a presentation impact on the financial statements.
Disclosure of Interests in Other Entities
On May 12, 2011, the IASB issued IFRS 12 – Disclosure of Interests in Other Entities (“IFRS 12”). IFRS 12 requires extensive disclosures relating to a Trustʼs interests in subsidiaries, joint arrangements, associates, and unconsolidated structured entities. IFRS 12 enables users of the financial statements to evaluate the nature and risks associated with its interests in other entities and the effects of those interests on its financial position and performance.
IFRS 10, 11 and 12, and the amendments to IAS 27 and 28 are all effective for annual periods beginning on or after January 1, 2013. Early adoption is permitted, so long as IFRS 10, 11 and 12, and the amendments to IAS 27 and 28 are adopted at the same time. However, entities are permitted to

C H A R T W E L L SE N IORS HOU S ING R E I T | F inanc ia l Repor t 2011 43
Management ’s D iscuss ion & A na lys is
43
incorporate any of the disclosure requirements in IFRS 12 into their financial statements without early adopting IFRS 12. We are currently assessing the impact of these new standards and amendments on our consolidated financial statements.
Fair Value Measurement
On May 12, 2011, the IASB issued IFRS 13 – Fair Value Measurement (“IFRS 13”), which defines fair value, provides guidance in a single IFRS framework for measuring fair value and identifies the required disclosures pertaining to fair value measurement. This standard is effective for annual periods beginning on or after January 1, 2013, and early adoption is permitted. We are currently assessing the impact of the new standard on our consolidated financial statements.
Employee Benefits
On June 16, 2011 the IASB revised IAS 19 – Employee Benefits. The revisions include the elimination of the option to defer the recognition of gains and losses, enhancing the guidance around measurement of plan assets and defined benefit obligations, streamlining the presentation of changes in assets and liabilities arising from defined benefit plans and introduction of enhanced disclosures for defined benefit plans. The amendments are effective for annual periods beginning on or after January 1, 2013. We are assessing the impact of the amendments on our consolidated financial statements.
Presentation of Financial Statements
On June 16, 2011 the IASB issued amendments to IAS 1 – Presentation of Financial Statements. The amendments enhance the presentation of Other Comprehensive Income (“OCI”) in the financial statements, primarily by requiring the components of OCI to be presented separately for items that may be reclassified to the statement of earnings from those that remain in equity. The amendments are effective for annual periods beginning on or after July 1, 2012. We are currently assessing the impact of the amendments on our consolidated financial statements.
Disclosure of Transfers of Financial Assets
In October 2010, the IASB issued IFRS 7. This amendment enhances disclosure requirements to aid financial statement users in evaluating the nature of, and risks associated with an entity's continuing involvement in derecognized financial assets. This amendment is effective for our interim and annual consolidated financial statements commencing January 1, 2012. We are currently assessing the impact of the new standard on our consolidated financial statements.
Deferred Tax – Recovery of Underlying Assets
In December 2010, the IASB amended IAS 12. IAS 12 will now introduce an exception to the measurement principles for deferred tax assets and liabilities related to the depreciable component of investment properties that are measured at fair value under IAS 40, Investment Property, and to the depreciable component of investment properties acquired in a business combination that will subsequently be measured using the fair value model. This amendment is effective for our interim and annual consolidated financial statements commencing January 1, 2012. We do not expect the amendments to IAS 12 to have a material impact on our financial statements.
Investments in Associates and Joint Ventures
In May 2011, the IASB issued IAS 28. IAS 28 requires any retained portion of an investment in an associate or joint venture that has not been classified as held for sale to be measured using the equity method, until deposal. After disposal, if the retained interest continues to be an associate or joint venture, the amendment requires for it to be continued to be accounted for under the equity method. The amendment also disallows the remeasurement of any retained interest in an investment upon the cessation of significant influence or joint control. This amended standard is effective for our interim and

C H A R T W EL L SEN IORS HOU S ING R E I T | F inanc ia l Repor t 2011
Management ’s D iscuss ion & A na lys is
44 44
annual consolidated financial statements commencing January 1, 2013. We are currently assessing the impact of the amendment on our consolidated financial statements.
Controls and ProceduresWe are committed to maintaining effective disclosure controls and procedures and internal control over financial reporting. We continue to make significant investments in improvements to our information systems and financial processes to further strengthen our internal controls. A control system, no matter how well conceived and operated, can provide only reasonable, and not absolute, assurance that its objectives are met. As a result of the inherent limitations in all control systems, no evaluation of controls can provide absolute assurance that all control issues, including instances of fraud, if any, have been detected. These inherent limitations include, among other items: (i) that managementʼs assumptions and judgments could ultimately prove to be incorrect under varying conditions and circumstances; and (ii) the impact of isolated errors. Additionally, controls may be circumvented by the unauthorized acts of individuals, by the collusion of two or more people or by management override. The design of any system of controls is also based, in part, upon certain assumptions about the likelihood of future events, and there can be no assurance that any design will succeed in achieving its stated goals under all potential conditions.
Evaluation of Disclosure Controls and Procedures and Internal Control over Financial Reporting The President and Chief Executive Officer and the Chief Financial Officer of the Trust have evaluated, or caused an evaluation under their direct supervision of, the design of the Trust's disclosure controls and procedures and internal control over financial reporting (as defined in National Instrument 52-109, Certification of Disclosure in Issuersʼ Annual and Interim Filings) as at December 31, 2011. Based on this evaluation, we have concluded that we have a) designed disclosure controls and procedures to provide reasonable assurance that (i) material information relating to Chartwell is made known to the President and Chief Executive Officer and the Chief Financial Officer by others, particularly during the period in which the interim filings are being prepared and (ii) information required to be disclosed by Chartwell in its various reports filed or submitted under securities legislation is recorded, processed, summarized and reported within time periods specified in securities legislation; and b) designed internal controls over financial reporting to provide reasonable assurance regarding the reliability of financial reporting and the preparation of financial statements for external purposes in accordance with IFRS. There were no changes in the Trustʼs internal controls over financial reporting that occurred during the year ended December 31, 2011 that have significantly affected, or are reasonably likely to significantly affect the Trustʼs internal control over financial reporting except as discussed below.
On September 1, 2011, Brookdale assumed management of 45 of our U.S. properties. Brookdale acquired HBR, which had previously been managing these properties. We performed appropriate review procedures to ensure internal controls were in place during and after the transition of management of these properties to Brookdale.

C H A R T W E L L SE N IORS HOU S ING R E I T | F inanc ia l Repor t 2011 45
Management ’s D iscuss ion & A na lys is
45
Forward-Looking Information and Risks and Uncertainties
Forward-Looking Information This MD&A contains forward-looking information that reflects the current expectations, estimates and projections of management about the future results, performance, achievements, prospects or opportunities for Chartwell and the seniors housing industry. The words “plans”, “expects”, “does not expect”, “is expected”, “budget”, “scheduled”, “estimates”, “intends”, “anticipates”, “does not anticipate”, “projects”, “believes” or variations of such words and phrases or statements to the effect that certain actions, events or results “may”, “will”, “could”, “would”, “might”, “occur”, “be achieved” or “continue” and similar expressions identify forward-looking statements. Forward-looking statements are based upon a number of assumptions and are subject to a number of known and unknown risks and uncertainties, many of which are beyond our control, and that could cause actual results to differ materially from those that are disclosed in or implied by such forward-looking statements.
Examples of such forward-looking information in this document include but are not limited to the following, each of which is subject to significant risks and uncertainties and is based on a number of assumptions which may prove to be incorrect:
• information related to the stabilization of seniors housing communities in lease-up, which is subject to the risk and uncertainty that local factors affecting occupancy levels or resident fees may result in certain communities not achieving stabilization at the times expected and is based on the assumptions that the local markets in which such communities are located remain stable and our operations in such communities are consistent with historical performance;
• information related to the expected completion date of communities under construction, which is subject to the risk and uncertainty that, due to weather conditions, availability of labour and other factors, construction may be delayed, and is subject to the assumption that there is not a significant change to the typical construction timelines for our communities;
• possible benefits from the implementation of new supply chain management programs, which is subject to the risk and uncertainty that economic conditions result in increased costs of goods that offset any benefits from our purchasing power and is subject to the assumption that we are able to negotiate favourable terms with our vendors in the future;
• growth, or lack thereof, of G&A expenses, which is subject to the risk and uncertainty that economic conditions may result in increased costs of goods and services and management expense and is subject to the assumption that our need for corporate overhead does not substantially decrease or increase;
• our expectations regarding cash distributions and cash flow from operating activities, which are subject to the risk and uncertainty that our operating performance does not meet our expectations due to occupancy levels dropping, labour and operating costs increasing or due to other general business risks;
• our ability to predict seasonal increases in occupancy rates due to uncertain economic conditions; • the decline in anticipated development and operations management fees due to reduced third-party
development activities;
• our ability to renew maturing debt, including our Credit Facility and to obtain new financings, in due course;
• the impact surrounding the implementation of the expected new regulations affecting retirement homes in Ontario;
• timing of closing of acquisitions which are subject to legal, regulatory and lendersʼ approvals which may not be received as currently expected;
• our expectations regarding achievement of certain occupancy levels at our LTC and retirement communities;

C H A R T W EL L SEN IORS HOU S ING R E I T | F inanc ia l Repor t 2011
Management ’s D iscuss ion & A na lys is
46 46
• the expected completion of the acquisition of the Maestro Portfolio; • the expected return to be realized by Chartwell as a result of the acquisition of the Maestro Portfolio,
including the degree to which such acquisition may be accretive; • the effect of the acquisition of the Maestro Portfolio on the financial performance of Chartwell; • our ability to successfully complete announced acquisitions, dispositions and assume the associated
secured debt in the manner currently contemplated, including those acquisitions and dispositions described in this MD&A;
• certain assumptions relating to the Debentures, including, credit risk in respect of the Debentures, prior ranking indebtedness and absence of covenant protection, structural subordination of Debentures, conversion of Debentures following certain transactions, value of conversion privilege of the Debentures, Debentures redemption prior to maturity, inability of Chartwell to purchase Debentures on a change of control and dilution; and
• Chartwell will maintain good relations with HCN and receive the expected benefits associated with the co-ownership of the Co-Owned Properties.
While we anticipate that subsequent events and developments may cause our views to change, we do not intend to update forward-looking information, except as required by applicable securities laws. This forward-looking information represents our views as of the date of this MD&A and such information should not be relied upon as representing our views as of any date subsequent to the date of this document. We have attempted to identify important factors that could cause actual results, performance or achievements to vary from those current expectations or estimated expressed or implied by the forward-looking information. However, there may be other factors that cause results, performance or achievements not to be as expected or estimated and that could cause actual results, performance or achievements to differ materially from current expectations. There can be no assurance that forward-looking information will prove to be accurate, as actual results and future events could differ materially from those expected or estimated in such statements. Accordingly, readers should not place undue reliance on forward-looking information. These factors are not intended to represent a complete list of the factors that could affect us. See risk factors highlighted in materials filed with the securities regulatory authorities in Canada from time to time, including but not limited to our most recent Annual Information Form.
Risks and Uncertainties ♦♦♦♦
(a) Business Risks: Chartwell is subject to general business risks and to risks inherent in the seniors housing industry and in the ownership of real property. These risks include fluctuations in occupancy levels, the inability to achieve economically viable residency fees (including anticipated increases in such fees), rent control regulations, increases in labour costs and other operating costs, possible future changes in labour relations, competition from or the oversupply of other similar properties, changes in neighbourhood or location conditions and general economic conditions, health-related risks, disease outbreaks and control risks, the imposition of increased taxes or new taxes, capital expenditures requirements, changes in interest rates and changes in the availability and cost of money for long-term financing which may render refinancing of mortgages difficult or unattractive. Moreover, there is no assurance that the occupancy levels achieved to date and expected in the future will continue or be achieved. Any one of, or a combination of, these factors may adversely affect the cash available to Chartwell.
(b) Taxation: We currently qualify as a mutual fund trust for Canadian income tax purposes.
With the enactment of the SIFT Rules and the issuance of equity capital in excess of the normal growth guidelines established by the Department of Finance, we were subject to SIFT tax effective January 1, 2007.
♦ For a complete description of the Risks and Uncertainties, please refer to our most recent AIF

C H A R T W E L L SE N IORS HOU S ING R E I T | F inanc ia l Repor t 2011 47
Management ’s D iscuss ion & A na lys is
47
Under the SIFT Rules, distributions paid by a SIFT as returns of capital will not be subject to the tax. Such distributions are not currently taxable to Unitholders but serve to reduce the adjusted cost base of a Unitholderʼs units. In 2011, 95.667% of our distributions were characterized as tax-deferred return of capital with the remaining 4.333% characterized as foreign-source interest income which is not subject to SIFT tax. We believe it is likely that a high return of capital component would continue in the reasonably foreseeable future and that any impact of the SIFT Rules on Unitholders will be mitigated due to the large proportion of distributions which are expected to be a return of capital. Assuming closing of the Maestro Portfolio acquisition and closing of the Offering, we forecast to incur approximately $0.8 million of Alternative Minimum Tax (“AMT”) at our subsidiary Trust in 2013 and approximately $5.5 million of AMT and SIFT taxes in 2014.
(c) Geographic Concentration: Our business and operations are conducted in the United States and Canada, and within Canada primarily in Ontario and Quebec. A geographic concentration of our owned and leased suites, at our percentage share of ownership or leasehold interest, is described under the “Business Overview” section of this MD&A. The market value of these properties and the income generated from them could be negatively affected by changes in local, regional or national economic conditions or legislative/regulatory changes in the respective jurisdictions.
(d) Maintenance of Assets: We are committed to keep our communities in a good state of repair. We fundamentally believe that by investing back into our communities we increase resident and staff satisfaction which ultimately results in better profitability of the business. We estimate that based on the average age, market position and state of repairs of our existing portfolio, the annual capital maintenance requirements are approximately 2% of annual gross property revenues. In addition to recurring maintenance capital projects, we invest in revenue enhancement and internal growth programs. The amount of these investments varies from time to time based on the volume of specific projects in progress. We take into account the recurring maintenance capital requirements of our communities in our determination of future cash flows available for distributions to Unitholders. A significant increase in recurring maintenance capital requirements of our communities could adversely impact cash available to us. The details of our actual capital asset spending for 2011 can be found in the “Capital Expenditures” section of this MD&A.
(e) Acquisition, Development: Our external growth prospects depend in part on identifying suitable acquisition and development opportunities, pursuing such opportunities, consummating acquisitions, and effectively operating the seniors housing communities acquired by the Trust. If we are unable to manage our growth, integrate our acquisitions effectively and achieve expected returns on acquisitions and development projects, our business, operating results and financial condition could be adversely affected.
Dispositions: From time to time we may dispose certain assets which are considered non-strategic or non-core to our portfolio. Failure to dispose of such assets at a reasonable price may negatively impact our ability to deliver on our corporate strategies.
(f) Competition: Numerous other owners, managers and developers of seniors housing communities compete with us in seeking residents. The existence of competing owners, managers and developers and competition for our residents could have an adverse effect on the Trustʼs ability to find residents for its seniors housing communities and on the rents which may be charged, and could adversely affect our revenues and, consequently, our ability to meet debt obligations. An increased supply of suites in the regions in which we own seniors housing may have an impact on the demand for retirement community suites.
(g) Government Regulation: Healthcare in Canada and in the U.S. is subject to extensive regulation and regulatory changes. As a result, there can be no assurance that future regulatory changes in healthcare, particularly those changes affecting the seniors housing industry, will not adversely affect us. In addition, new regulatory standards and requirements are being

C H A R T W EL L SEN IORS HOU S ING R E I T | F inanc ia l Repor t 2011
Management ’s D iscuss ion & A na lys is
48 48
considered in a number of jurisdictions which may affect all types of seniors housing communities. Further, aspects of new legislation that was proclaimed into force in Ontario on July 1, 2010, have affected our LTC communities, including: new licensing procedures based on more rigorous standards for license review, the granting of licenses for fixed-terms of up to 25 years, depending on bed classifications; the granting of replacement licenses to be based on a homeʼs structural classification that will be issued for a maximum of 25 years; more onerous duties imposed on licensees; defined expectations and requirements for key services to be provided in communities, including the requirement that a registered nurse be on-site 24 hours a day, seven days a week; requirements for the qualification, training and orientation of community staff, volunteers and persons who provide direct services to residents; and unannounced annual inspections of homes.
(h) Personnel Costs: We compete with other healthcare providers with respect to attracting and retaining qualified personnel. We are also dependent upon the available labour pool of employees. A shortage of trained or other personnel may require the Trust to enhance its wage and benefits packages in order to compete. No assurance can be given that labour costs will not increase, or that if they do increase, they can be matched by corresponding increases in rental or management revenue.
(i) Labour Relations: In Canada we employ or supervise over 12,000 persons, of whom approximately 55% are represented by labour unions. Labour relations with the unions are governed by collective bargaining agreements with many different unions. There can be no assurance that we will not at any time, whether in connection with the renegotiation process or otherwise, experience strikes, labour stoppages or any other type of conflict with unions or employees which could have a material adverse effect on our business, operating results and financial condition. Most seniors housing communities in the Province of Ontario are governed by the Hospital Labour Disputes Arbitration Act which prohibits strikes and lockouts in the seniors housing sector and therefore collective bargaining disputes are more likely to be resolved through compulsory third-party arbitration.
In jurisdictions where strikes and lockouts may be permitted, certain essential services regulations apply which ensure the continuation of resident care and most services. Non-unionized seniors housing communities may become unionized in the event they are targeted for certification by a trade union. There can be no assurance that the seniors housing communities we own that are not currently unionized will not, in the future, be subject to unionization efforts or that any such efforts will not result in the unionization of such seniors housing communitiesʼ employees.
(j) Debt Financing: We have and will continue to have substantial outstanding consolidated indebtedness comprised primarily of mortgages on our retirement and LTC communities.
We may not be able to renegotiate the terms of renewal of our debt at favourable rates. To the extent that any financing requiring CMHC consent or approval is not obtained, or such consent or approval is only available on unfavourable terms, we may be required to finance a conventional mortgage which may be less favourable to us than a CMHC-insured mortgage. In addition, the terms of our indebtedness generally contain customary provisions that, upon an event of default, result in the acceleration of repayment of amounts owed and that restrict the distributions that may be made by the Trust. Therefore, upon an event of default under such indebtedness, our ability to make distributions will be adversely affected.
A portion of our cash flow is devoted to servicing our debt, and there can be no assurance that we will continue to generate sufficient cash flow from operations to meet required interest and principal payments. If we were unable to meet interest or principal payments, we could be required to seek renegotiation of such payments or obtain additional equity, debt or other financing. We are also subject to the risk that any of our existing indebtedness may not be able to be refinanced upon maturity or that the terms of such refinancing may not be as favourable as the terms of our existing indebtedness.

C H A R T W E L L SE N IORS HOU S ING R E I T | F inanc ia l Repor t 2011 49
Management ’s D iscuss ion & A na lys is
49
(k) Mezzanine Financing: The mezzanine financing that we have provided to borrowers is generally secured by second charges or pledges of the borrowersʼ interests in development projects and ranks behind construction financing. While we generally seek to obtain security for advances against real property, in some circumstances it is only possible to obtain security in a joint venture interest. Consequently, if our borrowers face financial difficulty and are not able to meet their commitments to their lenders, the Trust could suffer a loss of management fees and of either interest or principal or both on the mezzanine loans it has advanced since lenders under the construction financing will rank ahead of us in any recovery from the assets of mezzanine loan borrowers. Further, we may not, at the applicable time, have the financial capacity to acquire all communities that we are entitled to acquire from mezzanine loan borrowers. In the event that we do not exercise our purchase options, we would expect to have the principal and any unpaid interest relating to our mezzanine financing returned to us at which time we would cease to receive mezzanine loan interest income, and/or may cease to receive our management fees when mezzanine loan borrowers sell the property to a third party.
(l) U.S./Canadian Exchange Rate Fluctuations: We have interests in seniors housing communities located in the U.S. We will, therefore, be subject to foreign currency fluctuations which may, from time to time, have an impact upon our financial position and results. We may enter into hedging arrangements to mitigate a portion of this risk; however, there can be no assurance that such hedging agreements, if any, would be sufficient to protect against currency exchange rate losses that could adversely affect cash available to us.
(m) Environmental Liabilities: Under various environmental laws and regulations, we, as either owner or manager, could become liable for the costs of removal or remediation of certain hazardous, toxic or regulated substances released on or in our properties or disposed of at other locations sometimes regardless of whether or not we knew of or were responsible for their presence. The failure to remove, remediate or otherwise address such substances, if any, may adversely affect an ownerʼs ability to sell such properties or to borrow using such properties as collateral and could potentially result in claims against the owner by private plaintiffs. Notwithstanding the above, our management is not aware of any material non-compliance, liability or other claim in connection with any of our owned properties and properties in respect of which mezzanine financing has been provided, nor is management aware of any environmental condition with respect to any of the properties that it believes would involve material expenditure by the Trust. It is our operating policy to obtain a Phase I environmental site assessment, conducted by an independent and experienced environmental consultant, prior to acquiring or financing any property. Where Phase I environmental site assessments identify sufficient environmental concerns or recommend further assessments, Phase II or Phase III environmental site assessments are conducted. They are intrusive investigations that involve soil, groundwater or other sampling to confirm the absence or presence and extent of an environmental concern.
Environmental laws and regulation may change and we may become subject to more stringent environmental laws and regulations in the future. Compliance with more stringent environmental laws and regulations could have a material adverse effect on our business, financial condition or results of operation and distributions.
(n) Liability and Insurance: The businesses, which are carried on, directly or indirectly, by us, entail an inherent risk of liability. Management expects that from time to time we may be subject to such lawsuits as a result of the nature of its businesses. The Trust maintains business and property insurance policies in amounts and with such coverage and deductibles as deemed appropriate, based on the nature and risks of the businesses, historical experience and industry standards. There can be no assurance, however, that claims in excess of the insurance coverage or claims not covered by the insurance coverage will not arise or that the liability coverage will continue to be available on acceptable terms. A successful claim against us not covered by, or in excess of, our insurance could have a material adverse effect on our business, operating results and financial condition. Claims against us, regardless of their merit or eventual outcome, also may have a material adverse effect on our ability to attract residents or expand
C H A R T W EL L SEN IORS HOU S ING R E I T | F inanc ia l Repor t 2011
Management ’s D iscuss ion & A na lys is
50 50
their businesses, and will require management to devote time to matters unrelated to the operation of the business.
(o) Joint Venture Interests: We have entered into joint venture arrangements in respect of certain of our seniors housing operations. These joint venture arrangements have the benefit of sharing the risks associated with ownership and management of such seniors housing facilities including those risks described above. However, we may be exposed to adverse developments, including a possible change in control, in the business and affairs of our joint venture partners which could have a significant impact on, or termination of, our interests in our joint ventures and could affect the value of the joint ventures to us and/or cause us to incur additional costs if we were to solely undertake the operations of the joint venture. In addition, there are risks which arise from the joint venture arrangements themselves, including: the risk that the other joint venture partner may exercise buy-sell, put or other sale or purchase rights which could obligate us to sell our interest or buy the other joint venture partnerʼs interest at a price which may not be favourable to us or at a time which may not be advantageous to us, the effect of which could be materially adverse to our financial position or resources.
(p) Economic and Financial Conditions: Adverse changes to the economic and financial conditions in Canada, the U.S. and globally could impact our ability to execute upon our operating, investing and financing strategies which, in turn, could have a material adverse impact on our business, sales, profitability and financial position. General uncertainty on the timing of a recovery from recent financial market volatility may continue to create a challenging operating environment for us.
(q) Growth: The ability to grow may require the issuance of additional units and the ability to do so may not always be a viable capital-raising option. Furthermore, timing differences may occur between the issuance of additional units and the time the proceeds may be used to invest in new properties. Depending on the duration of this timing difference, this may be dilutive. Additionally, growth may be limited by the properties being owned in a different structure (i.e., a real estate investment trust compared with a corporation) and possibly a different economic environment. We expect that we will have opportunities to acquire properties which will be accretive and enable us to increase cash flow through improved management, but there can be no assurance that will be the case.
(r) Distributions: Currently, our distributions are determined in relation to AFFO. While we intend for such distributions to be at least equal to 70% of our AFFO for a specified year, items such as principal repayments, capital expenditures, variances in operating results and redemption of units, if any, or the failure of CSH Trust or Master LP to make distributions may affect AFFO and, therefore, distributions. We may be required to decrease our distributions in order to accommodate such items. Under the terms of our Credit Facility, distributions to Unitholders are limited to 100% of our AFFO.
(s) Closing of the Subscription Receipt Offering and Debenture Offering: The closing of the Subscription Receipt Offering and the Debenture Offering are not mutually conditional. Therefore, we may proceed with closing one or both of the Subscription Receipt Offering or the Debenture Offering. Purchasers of Subscription Receipts should not assume that the Debenture Offering will be completed. Purchasers of Debentures should not assume that the acquisition of the Maestro Properties will be completed and that all of the conditions that are necessary in order for the Subscription Receipts to be automatically exchanged for Units will be satisfied.
(t) U.S. Disposition Program: As part of our previously announced property disposition program in the United States, we are considering the disposition of certain of our properties located in the United States (the “U.S. Disposition Program”). The U.S. Disposition Program consists of the potential disposition of approximately 3,200 suites in 11 states. We believe our increased focus on Canadian markets will enhance the stability of our earnings, provide further economies of scale and operating synergies and reduce the operating and foreign exchange risks associated with our U.S. portfolio. There can be no assurance that we will be able to complete a disposition

C H A R T W E L L SE N IORS HOU S ING R E I T | F inanc ia l Repor t 2011 51
Management ’s D iscuss ion & A na lys is
51
of any of our properties in the United States, or that if completed, the anticipated benefits of the U.S. Disposition Program will be realized in a manner consistent with our current expectations. Accordingly, there should be no assumption that we will be able to successfully complete the U.S. Disposition Program or that we will be able to realize the anticipated benefits associated with the U.S. Disposition Program.
(u) Completion of the Acquisition of the Maestro Portfolio: Completion of the acquisition of the Maestro Portfolio is subject to the satisfaction of certain closing conditions, including the requirement to obtain clearance under the Competition Act (Canada) and, if required, approval under the Investment Canada Act. With respect to the assumption of the mortgage debt relating to the Co-Owned Properties, the receipt of lender approvals relating to the assumption of such mortgage debt is necessary but it is not a condition to the closing of the acquisition of the Maestro Portfolio. If such approvals are not obtained, we may be required to refinance existing debt in place on the Co-Owned Properties, and possibly be required to pay certain penalties associated therewith. Accordingly, there is no assurance that the acquisition of the Maestro Portfolio will be completed or, if completed, will be on terms that are exactly the same as disclosed in this MD&A. Chartwell may be required to sell or otherwise dispose of one or more of the Co-Owned Properties in order to satisfy regulatory requirements or otherwise waive conditions to closing. If completion of the acquisition of the Maestro Portfolio does not occur as contemplated, we will not realize the benefits described in this MD&A and could suffer adverse consequences, including loss of investor confidence. The Debenture Offering is not conditional upon the completion of the acquisition of the Maestro Portfolio.
(v) Integration of Maestro Portfolio: In order to achieve the benefits of the acquisition of the Maestro Portfolio described in this MD&A, we will rely upon our ability to successfully retain staff, consolidate functions and integrate operations, procedures and personnel in a timely and efficient manner and to realize the anticipated growth opportunities from combining the Maestro Portfolio and related operations with our properties. The integration of the Maestro Portfolio and related operations requires the dedication of our effort, time and resources, which may divert our focus and resources from other strategic opportunities and from operational matters during this process. The integration process may result in the disruption of ongoing business and customer relationships that may adversely affect our ability to achieve the anticipated benefits of the acquisition.
(w) Expected Returns on the Acquisition of the Maestro Portfolio: The Declaration of Trust provides that Chartwell shall not purchase any interest in real property from an entity that is not controlled by us unless the Trustees consider such purchase not to be dilutive to our AFFO per unit on a fully diluted basis, determined by the Trustees in their sole discretion. While the Trustees, based on analysis provided by management and professional advisors (as well as other information deemed appropriate and sufficient for such purposes), consider the acquisition of the Maestro Portfolio not to be dilutive to our AFFO per unit on a fully diluted basis, such determination should not be regarded as a guarantee of future performance or results. If the acquisition fails to realize the results that we expect, the acquisition of the Maestro Portfolio could materially and adversely affect our business plan and could have a material adverse effect on us and our financial results.
C H A R T W EL L SEN IORS HOU S ING R E I T | F inanc ia l Repor t 201151

C H A R T W EL L SEN IORS HOU S ING R E I T | F inanc ia l Repor t 201152
Management’s Responsibility for Financial Statements To the Unitholders of Chartwell Seniors Housing Real Estate Investment Trust
The accompanying consolidated financial statements of Chartwell Seniors Housing Real Estate Investment Trust and the information included in the Annual Report have been prepared by management, which is responsible for their consistency, integrity and objectivity. Management is also responsible for ensuring that the consolidated financial statements are prepared and presented in accordance with International Financial Reporting Standards. To fulfill these responsibilities, management maintains appropriate systems of internal control, policies and procedures to ensure its reporting practices and accounting and administrative procedures are of high quality.
KPMG LLP, the independent auditor, is responsible for auditing the consolidated financial statements in accordance with Canadian generally accepted auditing standards, to enable the expression of their opinion on the consolidated financial statements to the Unitholders. Their report, as auditors, is set forth herein.
The Board of Trustees is responsible for ensuring that management fulfills its responsibilities for financial reporting and internal controls and engaging the independent auditors. The Board of Trustees carries out this responsibility through its Audit Committee, which meets regularly with management and the independent auditors. The Audit Committee is composed of three members who are independent of management. The consolidated financial statements have been reviewed and approved by the Board of Trustees and its Audit Committee. The independent auditors have direct and full access to the Audit Committee and Board of Trustees.
W. Brent Binions Vlad VolodarskiPresident and Chief Executive Officer Chief Financial Officer

C H A R T W E L L SE N IORS HOU S ING R E I T | F inanc ia l Repor t 2011 53C H A R T W E L L SE N IORS HOU S ING R E I T | F inanc ia l Repor t 2011 53
1
Independent Auditors' Report To the Unitholders of Chartwell Seniors Housing Real Estate Investment Trust
We have audited the accompanying consolidated financial statements of Chartwell Seniors Housing Real Estate Investment Trust, which comprise the consolidated balance sheets as at December 31, 2011, December 31, 2010 and January 1, 2010, the consolidated statements of comprehensive income (loss), unitholders' equity and cash flows for the years ended December 31, 2011 and December 31, 2010, and notes, comprising a summary of significant accounting policies and other explanatory information. Management's Responsibility for the Consolidated Financial Statements Management is responsible for the preparation and fair presentation of these consolidated financial statements in accordance with International Financial Reporting Standards, and for such internal control as management determines is necessary to enable the preparation of consolidated financial statements that are free from material misstatement, whether due to fraud or error.Auditors' Responsibility Our responsibility is to express an opinion on these consolidated financial statements based on our audits. We conducted our audits in accordance with Canadian generally accepted auditing standards. Those standards require that we comply with ethical requirements and plan and perform the audit to obtain reasonable assurance about whether the consolidated financial statements are free from material misstatement. An audit involves performing procedures to obtain audit evidence about the amounts and disclosures in the consolidated financial statements. The procedures selected depend on our judgment, including the assessment of the risks of material misstatement of the consolidated financial statements, whether due to fraud or error. In making those risk assessments, we consider internal control relevant to the entity's preparation and fair presentation of the consolidated financial statements in order to design audit procedures that are appropriate in the circumstances, but not for the purpose of expressing an opinion on the effectiveness of the entity's internal control. An audit also includes evaluating the appropriateness of accounting policies used and the reasonableness of accounting estimates made by management, as well as evaluating the overall presentation of the consolidated financial statements. We believe that the audit evidence we have obtained in our audits is sufficient and appropriate to provide a basis for our audit opinion. Opinion In our opinion, the consolidated financial statements present fairly, in all material respects, the consolidated financial position of Chartwell Seniors Housing Real Estate Investment Trust as at December 31, 2011, December 31, 2010 and January 1, 2010, and its consolidated financial performance and its consolidated cash flows for the years ended December 31, 2011 and December 31, 2010 in accordance with International Financial Reporting Standards.
Chartered Accountants, Licensed Public Accountants
March 1, 2012 Toronto, Canada
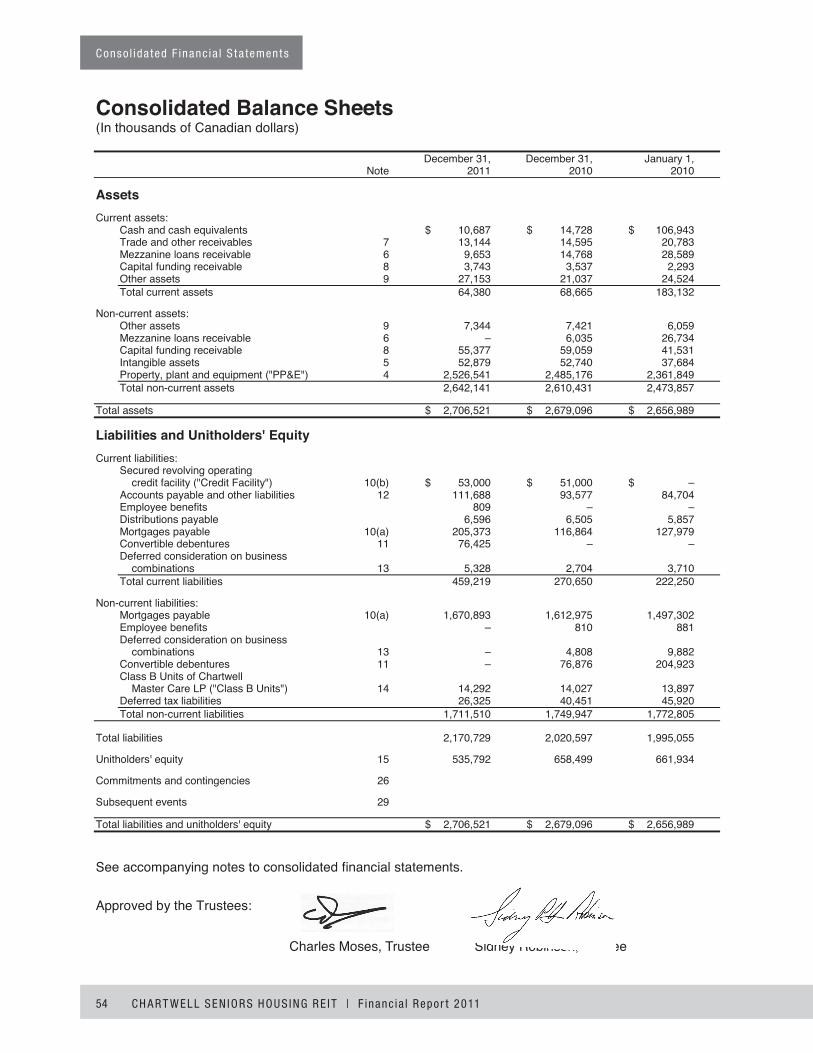
C H A R T W EL L SEN IORS HOU S ING R E I T | F inanc ia l Repor t 2011
C onso l ida ted F inanc ia l S t a tement s
54 1
Consolidated Balance Sheets (In thousands of Canadian dollars)
December 31, December 31, January 1, Note 2011 2010 2010
Assets Current assets:
Cash and cash equivalents $ 10,687 $ 14,728 $ 106,943 Trade and other receivables 7 13,144 14,595 20,783 Mezzanine loans receivable 6 9,653 14,768 28,589 Capital funding receivable 8 3,743 3,537 2,293 Other assets 9 27,153 21,037 24,524 Total current assets 64,380 68,665 183,132
Non-current assets: Other assets 9 7,344 7,421 6,059 Mezzanine loans receivable 6 – 6,035 26,734 Capital funding receivable 8 55,377 59,059 41,531 Intangible assets 5 52,879 52,740 37,684 Property, plant and equipment ("PP&E") 4 2,526,541 2,485,176 2,361,849 Total non-current assets 2,642,141 2,610,431 2,473,857
Total assets $ 2,706,521 $ 2,679,096 $ 2,656,989
Liabilities and Unitholders' Equity Current liabilities:
Secured revolving operating credit facility ("Credit Facility") 10(b) $ 53,000 $ 51,000 $ –
Accounts payable and other liabilities 12 111,688 93,577 84,704 Employee benefits 809 – – Distributions payable 6,596 6,505 5,857 Mortgages payable 10(a) 205,373 116,864 127,979 Convertible debentures 11 76,425 – – Deferred consideration on business
combinations 13 5,328 2,704 3,710 Total current liabilities 459,219 270,650 222,250
Non-current liabilities: Mortgages payable 10(a) 1,670,893 1,612,975 1,497,302 Employee benefits – 810 881 Deferred consideration on business
combinations 13 – 4,808 9,882 Convertible debentures 11 – 76,876 204,923 Class B Units of Chartwell
Master Care LP ("Class B Units") 14 14,292 14,027 13,897 Deferred tax liabilities 26,325 40,451 45,920 Total non-current liabilities 1,711,510 1,749,947 1,772,805
Total liabilities 2,170,729 2,020,597 1,995,055
Unitholders' equity 15 535,792 658,499 661,934
Commitments and contingencies 26
Subsequent events 29
Total liabilities and unitholders' equity $ 2,706,521 $ 2,679,096 $ 2,656,989
See accompanying notes to consolidated financial statements.
Approved by the Trustees: "Charles Moses" Trustee "Sidney Robinson" Trustee
Charles Moses, Trustee Sidney Robinson, Trustee

C H A R T W E L L SE N IORS HOU S ING R E I T | F inanc ia l Repor t 2011 55
C onso l ida ted F inanc ia l S t a tement s
2
Consolidated Statements of Comprehensive Income (Loss) (In thousands of Canadian dollars)
Years ended December 31, Note 2011 2010
Revenue: Resident $ 750,634 $ 707,166 Management and other fees 3,137 4,675 Mezzanine loan interest 1,601 5,419 755,372 717,260
Expenses: Direct operating 532,132 496,525 General, administrative and trust 24,758 24,761 556,890 521,286
Income before finance costs, property lease expense, other income, depreciation of PP&E, amortization of intangible assets and changes in fair values of financial instruments and unrealized foreign exchange losses (gains) 198,482 195,974
Finance costs 23 103,331 108,985 Property lease expense 2,420 2,327 Other income 22 (608) (14,461) Depreciation of PP&E 4 170,844 160,775 Amortization of intangible assets 5 2,555 2,344 Changes in fair values of financial
instruments and unrealized foreign exchange losses (gains) 24 (2,932) 4,346
Loss before income taxes (77,128) (68,342)
Income tax expense (benefit): 25 Current 330 281 Deferred (14,127) (6,675) (13,797) (6,394)
Loss for the year (63,331) (61,948)
Other comprehensive income (loss): Unrealized foreign currency gain (loss)
on translation of foreign operations 1,184 (5,156)
Total comprehensive income (loss) $ (62,147) $ (67,104)
See accompanying notes to consolidated financial statements.

C H A R T W EL L SEN IORS HOU S ING R E I T | F inanc ia l Repor t 2011
C onso l ida ted F inanc ia l S t a tement s
56
3
Con
solid
ated
Sta
tem
ents
of U
nith
olde
rs' E
quity
(In
thou
sand
s of
Can
adia
n do
llars
)
Trus
t Tr
ust U
nits
Fo
reig
n
Units
iss
ued
curre
ncy
issue
d in
un
der
LTIP
Acc
umul
ated
tra
nsla
tion
O
ther
equ
ity
Year
end
ed D
ecem
ber 3
1, 2
011
dolla
rs, n
et
LTIP
re
ceiva
ble
loss
es
rese
rve
Dist
ribut
ions
co
mpo
nent
s To
tal
Unith
olde
rs' e
quity
, Jan
uary
1, 2
011
$ 1
,439
,961
$
26,4
17
$ (2
1,03
3)
$(33
4,46
9)
$ (5
,156
) $(
451,
638)
$
4,41
7 $
658,
499
Lo
ss fo
r the
yea
r
–
– –
(63,
331)
–
– –
(63,
331)
O
ther
com
preh
ensi
ve in
com
e
–
– –
– 1,
184
– –
1,18
4 Di
strib
utio
ns to
Uni
thol
ders
–
– –
– –
(77,
538)
–
(77,
538)
Is
suan
ce o
f Tru
st U
nits
und
er th
e Di
strib
utio
n
Rein
vest
men
t Pro
gram
("DR
IP")
15,0
75
– –
– –
– –
15,0
75
Trus
t Uni
ts is
sued
on
exch
ange
of C
lass
B U
nits
27
2 –
– –
– –
– 27
2 Tr
ust U
nits
issu
ed u
nder
the
Long
-Ter
m In
cent
ive
Plan
("LT
IP"),
net
of u
nits
tran
sfer
red
to
Tre
asur
y
93
0 (9
41)
146
– –
– 47
4 60
9In
tere
st o
n LT
IP re
ceiva
ble
– –
(208
) –
– –
– (2
08)
Dist
ribut
ions
app
lied
agai
nst L
TIP
rece
ivabl
e
–
– 1,
230
–
– –
– 1
,230
Un
ithol
ders
' equ
ity, D
ecem
ber 3
1, 2
011
$ 1
,456
,238
$
25,4
76
$ (1
9,86
5)
$(39
7,80
0)
$ (3
,972
) $(
529,
176)
$
4,89
1 $
535,
792
Dur
ing
the
year
end
ed D
ecem
ber 3
1, 2
011,
dis
tribu
tions
wer
e de
clar
ed a
nd p
aid
at $
0.04
5 pe
r uni
t per
mon
th.
In th
e fir
st tw
o m
onth
s of
201
2,
dist
ribut
ions
wer
e de
clar
ed a
t $0.
045
per u
nit p
er m
onth
tota
lling
$13,
046.
Trus
t Tr
ust U
nits
Fo
reig
n
Units
iss
ued
curre
ncy
issue
d in
un
der
LTIP
Acc
umul
ated
tra
nsla
tion
O
ther
equ
ity
Year
end
ed D
ecem
ber 3
1, 2
010
dolla
rs, n
et
LTIP
re
ceiva
ble
loss
es
rese
rve
Dist
ribut
ions
co
mpo
nent
s To
tal
Unith
olde
rs' e
quity
, Jan
uary
1, 2
010
$ 1
,307
,016
$
28,7
28
$ (2
3,46
0)
$(27
2,52
1)
$ –
$(38
0,49
4)
$ 2,
665
$ 66
1,93
4 Lo
ss fo
r the
yea
r
–
– –
(61,
948)
–
– –
(61,
948)
O
ther
com
preh
ensi
ve lo
ss
– –
– –
(5,1
56)
– –
(5,1
56)
Dist
ribut
ions
to U
nith
olde
rs
– –
– –
– (7
1,14
4)
– (7
1,14
4)
Issu
ance
of T
rust
Uni
ts p
ursu
ant t
o pu
blic
offe
ring
124,
217
– –
– –
-- 1,
592
125,
809
Issu
ance
of T
rust
Uni
ts u
nder
the
DRIP
4,
795
– –
– –
– –
4,79
5 Tr
ust U
nits
issu
ed o
n ex
chan
ge o
f Cla
ss B
Uni
ts
2,23
9 –
– –
– –
– 2,
239
Trus
t Uni
ts is
sued
und
er th
e LT
IP, n
et o
f uni
ts
trans
ferre
d to
Tre
asur
y
1,
694
(2,3
11)
1,37
3 –
– –
160
916
Inte
rest
on
LTIP
rece
ivabl
e
–
– (1
81)
– –
– –
(181
) Di
strib
utio
ns a
pplie
d ag
ains
t LTI
P re
ceiva
ble
– –
1,23
5
– –
– –
1,23
5
Unith
olde
rs' e
quity
, Dec
embe
r 31,
201
0
$ 1,4
39,9
61
$ 26
,417
$
(21,
033)
$(
334,
469)
$
(5,1
56)
$(45
1,63
8)
$ 4,
417
$ 65
8,49
9
Dur
ing
the
year
end
ed D
ecem
ber 3
1, 2
010,
dis
tribu
tions
wer
e de
clar
ed a
nd p
aid
at $
0.04
5 pe
r uni
t per
mon
th.
See
acco
mpa
nyin
g no
tes
to c
onso
lidat
ed fi
nanc
ial s
tate
men
ts.
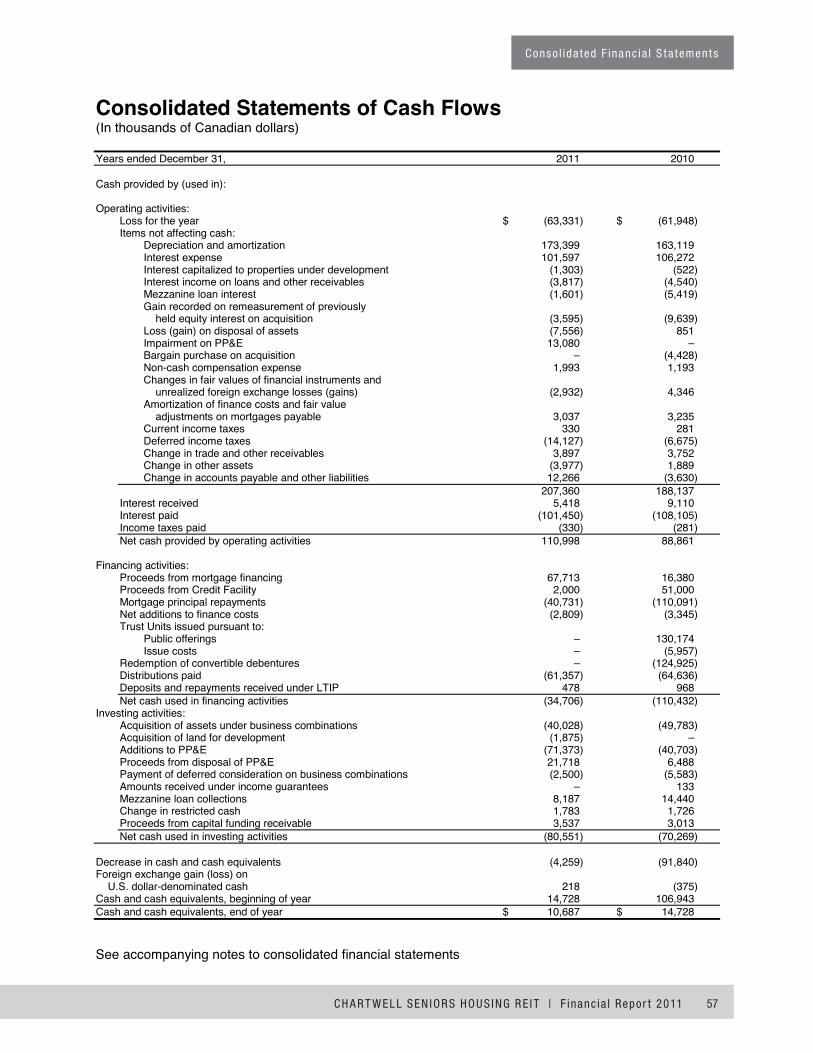
C H A R T W E L L SE N IORS HOU S ING R E I T | F inanc ia l Repor t 2011 57
C onso l ida ted F inanc ia l S t a tement s
4
Consolidated Statements of Cash Flows (In thousands of Canadian dollars)
Years ended December 31, 2011 2010
Cash provided by (used in):
Operating activities: Loss for the year $ (63,331) $ (61,948) Items not affecting cash:
Depreciation and amortization 173,399 163,119 Interest expense 101,597 106,272 Interest capitalized to properties under development (1,303) (522) Interest income on loans and other receivables (3,817) (4,540) Mezzanine loan interest (1,601) (5,419) Gain recorded on remeasurement of previously
held equity interest on acquisition (3,595) (9,639) Loss (gain) on disposal of assets (7,556) 851 Impairment on PP&E 13,080 – Bargain purchase on acquisition – (4,428) Non-cash compensation expense 1,993 1,193 Changes in fair values of financial instruments and
unrealized foreign exchange losses (gains) (2,932) 4,346 Amortization of finance costs and fair value
adjustments on mortgages payable 3,037 3,235 Current income taxes 330 281 Deferred income taxes (14,127) (6,675) Change in trade and other receivables 3,897 3,752 Change in other assets (3,977) 1,889 Change in accounts payable and other liabilities 12,266 (3,630)
207,360 188,137 Interest received 5,418 9,110 Interest paid (101,450) (108,105) Income taxes paid (330) (281) Net cash provided by operating activities 110,998 88,861
Financing activities: Proceeds from mortgage financing 67,713 16,380 Proceeds from Credit Facility 2,000 51,000 Mortgage principal repayments (40,731) (110,091) Net additions to finance costs (2,809) (3,345) Trust Units issued pursuant to:
Public offerings – 130,174 Issue costs – (5,957)
Redemption of convertible debentures – (124,925) Distributions paid (61,357) (64,636) Deposits and repayments received under LTIP 478 968 Net cash used in financing activities (34,706) (110,432)
Investing activities: Acquisition of assets under business combinations (40,028) (49,783) Acquisition of land for development (1,875) – Additions to PP&E (71,373) (40,703) Proceeds from disposal of PP&E 21,718 6,488 Payment of deferred consideration on business combinations (2,500) (5,583) Amounts received under income guarantees – 133 Mezzanine loan collections 8,187 14,440 Change in restricted cash 1,783 1,726 Proceeds from capital funding receivable 3,537 3,013 Net cash used in investing activities (80,551) (70,269)
Decrease in cash and cash equivalents (4,259) (91,840) Foreign exchange gain (loss) on
U.S. dollar-denominated cash 218 (375) Cash and cash equivalents, beginning of year 14,728 106,943 Cash and cash equivalents, end of year $ 10,687 $ 14,728
See accompanying notes to consolidated financial statements

C H A R T W EL L SEN IORS HOU S ING R E I T | F inanc ia l Repor t 2011
Notes to C onso l ida ted F inanc ia l S t a tement s
58 C H A R T W EL L SEN IORS HOU S ING R E I T | F inanc ia l Repor t 201158 5
Notes to Consolidated Financial Statements (In thousands of Canadian dollars, except per unit amounts)
Chartwell Seniors Housing Real Estate Investment Trust ("Chartwell" or the "Trust") is an open ended, unincorporated investment trust whose registered head office is located in Mississauga, Ontario and is governed by the laws of the Province of Ontario, Canada and was created pursuant to the Declaration of Trust dated July 7, 2003, as amended ("Declaration of Trust"), when one Trust Unit was issued for cash. Chartwell began operations on November 14, 2003. Chartwell's main business is ownership, operations and management of retirement and long-term care communities in Canada and the United States.
Chartwell owns 100% of the outstanding Trust Units and Series 1 Trust Notes of CSH Trust, an unincorporated open-ended trust established under the laws of the Province of Ontario, Canada, which in turn owns 100% of the outstanding Class A Units of Chartwell Master Care LP ("Master LP"), a limited partnership created under the laws of the Province of Manitoba, Canada. Class B Units of Master LP are held by non-controlling investors.
The Canadian assets of Chartwell are held by Master LP, which carries out the business of the Trust. Its activities are financed through equity contributed by CSH Trust, Class B Unitholders and third-party lenders, including mortgages.
The United States assets of Chartwell are also owned indirectly by Master LP, through its wholly owned United States subsidiary corporation, CSH Master Care USA Inc.
Chartwell's Declaration of Trust, as amended, provides that distributions will be within the discretion of the Trustees. The Trustees will continue to rely upon forward-looking cash flow information, including internal forecasts and budgets to establish the level of cash distributions.
1. Basis of preparation: (a) Statement of compliance:
These consolidated financial statements represent the first annual financial statements of the Trust prepared in accordance with International Financial Reporting Standards ("IFRS") as issued by the International Accounting Standards Board ("IASB"). The Trust adopted IFRS in accordance with IFRS 1, First-time Adoption of International Financial Reporting Standards ("IFRS 1"), as discussed in note 30.
The policies applied in these consolidated financial statements are based on IFRS issued and effective as of December 31, 2011. On March 1, 2012, the Board of Trustees authorized the financial statements for issue.
In preparing these consolidated financial statements, management has amended certain accounting, valuation and consolidation methods previously applied in the financial statements prepared in accordance with Canadian Generally Accepted Accounting Principles ("CGAAP") to comply with IFRS. The comparative figures for 2010 were restated to reflect these amendments. Note 30 contains reconciliations and descriptions of the effect of the transition from CGAAP to IFRS on equity and total comprehensive loss along with line-by-line reconciliations of the consolidated statements of comprehensive income (loss) and consolidated balance sheet for the year ended December 31, 2010.
(b) Functional currency:
These consolidated financial statements are presented in thousands of Canadian dollars, the Trust's functional currency, unless otherwise indicated.

C H A R T W E L L SE N IORS HOU S ING R E I T | F inanc ia l Repor t 2011 59
Notes to C onso l ida ted F inanc ia l S t a tement s
6
(c) Basis of measurement:
The consolidated financial statements have been prepared on the historical cost basis, except for the following material items:
(i) derivative financial instruments are measured at fair value;
(ii) financial instruments classified as fair value through profit and loss ("FVTPL") are measured at fair value;
(iii) financial instruments classified as available-for-sale are measured at fair value; and
(iv) liabilities for cash-settled, unit-based payment arrangements are measured at fair value.
(d) Use of estimates and judgments:
The preparation of the consolidated financial statements in conformity with IFRS requires management to make judgments, estimates and assumptions that affect the application of accounting policies and the reported amounts of assets and liabilities, revenue and expenses during the year. Actual results may differ from those estimates.
Estimates and underlying assumptions are reviewed on an ongoing basis. Revisions to accounting estimates are recognized in the period in which the estimates are revised and in any future periods affected. Information about assumptions and estimation uncertainties that have a significant risk of resulting in a material adjustment within future financial year are included in the following notes:
(i) Note 2(c) - PP&E;
(ii) Note 2(m)(iii) - Revenue recognition - allowance for doubtful accounts;
(iii) Note 3 - Acquisitions;
(iv) Note 12(c) - LTIP; and
(v) Note 30(d)(i) - Fair value as deemed cost.
In the process of applying the accounting policies, Chartwell makes various judgments, apart from those involving estimations, that can significantly affect the amounts it recognizes in the financial statements. Information about critical judgments in applying accounting policies that have the most significant effect on the amounts recognized in the consolidated financial statements is included in the following notes:
(i) Note 2(d)(i) - Intangible assets - licenses;
(ii) Note 2(e) - Impairment; and
(iii) Note 25 - Income taxes.
2. Significant accounting policies: (a) Basis of consolidation:
(i) Transactions eliminated on consolidation:
The consolidated financial statements include the accounts of Chartwell and its subsidiaries, as well as the proportionate share of the accounts of its joint ventures. All intercompany transactions have been eliminated on consolidation.

C H A R T W EL L SEN IORS HOU S ING R E I T | F inanc ia l Repor t 2011
Notes to C onso l ida ted F inanc ia l S t a tement s
60 C H A R T W EL L SEN IORS HOU S ING R E I T | F inanc ia l Repor t 201160 7
(ii) Jointly controlled entities:
Joint ventures are those entities over which activities Chartwell has joint control, established by contractual agreement.
These consolidated financial statements include Chartwell's proportionate share of each of the assets, liabilities, income and expenses of the jointly controlled entities on a line-by-line basis.
(iii) Business combinations:
As part of the transition to IFRS, Chartwell elected not to restate business combinations that occurred prior to January 1, 2010.
All acquisitions occurring on and after January 1, 2010 are accounted for under the acquisition method under which all identifiable assets acquired and liabilities assumed are measured at fair value as of the acquisition date. Goodwill represents the cost of acquired net assets in excess of their fair value. If the fair value of the net identifiable assets acquired exceeds the fair value of consideration transferred, a bargain purchase gain is recognized immediately in profit or loss.
Transaction costs, other than those associated with the issue of debt or equity securities, (finder's fees, legal fees, due diligence fees, and other professional and consulting fees) incurred in connection with the acquisition are expensed as incurred.
If a business combination is achieved in stages, the fair value on the acquisition date of the Trust's previously held equity interest in the acquiree is remeasured to fair value through profit or loss.
(b) Foreign currency:
(i) Foreign currency transactions:
Transactions in foreign currencies are translated to the respective functional currencies of Chartwell's United States Operations at exchange rates at the dates of the transactions. Monetary assets and liabilities denominated in foreign currencies are translated to the functional currency at the exchange rate at the reporting date. The foreign currency gain or loss on monetary items is the difference between amortized cost in the functional currency at the beginning of the year, adjusted for effective interest and payments during the year, and the amortized cost in foreign currency translated at the exchange rate at the end of the reporting year.
Non-monetary assets and liabilities denominated in foreign currencies that are measured at fair value are retranslated to the functional currency at the exchange rate at the date that the fair value was determined. Foreign currency differences arising on retranslation are recognized in profit or loss.
Non-monetary items that are measured in terms of historical cost in a foreign currency are translated using the exchange rate at the date of the transaction.
(ii) Foreign operations:
The assets and liabilities of foreign operations, including fair value adjustments arising on acquisition, are translated to Canadian dollars at exchange rates in effect as at the consolidated balance sheet dates.
Revenue and expenses of foreign operations are translated to Canadian dollars at exchange rates in effect on the dates on which such items are reported in income during the year.

C H A R T W E L L SE N IORS HOU S ING R E I T | F inanc ia l Repor t 2011 61
Notes to C onso l ida ted F inanc ia l S t a tement s
8
Exchange gains and losses arising from translation of the financial statements of Chartwell's foreign operations are deferred and included in other comprehensive income (loss).
(c) PP&E:
Chartwell considers its properties to be owner-occupied properties under International Accounting Standards ("IAS") 16, Property, Plant and Equipment.
PP&E includes land, buildings, furniture, fixtures and equipment, which are measured at cost less accumulated depreciation and accumulated impairment losses. The Trust elected to apply the optional exemption to use fair values as deemed cost at January 1, 2010, the date of transition to IFRS.
Properties under development and land held for development are carried at cost and are not subject to depreciation. Cost includes initial acquisition costs, other direct costs, realty taxes and interest related to their financing during the development period. The development period ends when the asset is available for use and construction is complete. Upon completion, properties under development are transferred to the appropriate asset class.
Significant parts of the buildings have different useful lives and are accounted for as separate components of the property. The cost of replacing a major component of a building is recognized in the carrying amount of the building if it is probable that the future economic benefits embodied within the component will flow to the Trust, and its cost can be measured reliably. The carrying amount of the replaced component is derecognized. The costs of ongoing repairs and maintenance of the properties are recognized in profit and loss as incurred.
Depreciation is recorded in profit or loss on the straight-line basis over the estimated useful lives of the assets. The following are the estimated useful lives of existing PP&E:
Building components: Structure 36 - 40 years Mechanical, electrical and elevators 10 - 20 years Roof, windows and doors 5 - 15 years Interior upgrades 3 - 5 years Resident contracts and above- and below-market leases 1 - 3 years Payment in lieu of taxes ("PILOT") Term of agreement Furniture, fixtures and equipment 3 - 5 years
Estimated useful lives were determined based on current facts and past experience, and take into consideration the anticipated physical life of the asset and current and forecasted demand. The rates used are reviewed on an ongoing basis to ensure they continue to be appropriate, and are also reviewed in conjunction with impairment testing.
Depreciation methods, useful lives and residual values are reviewed at each financial year-end and adjusted if appropriate.
Gains/losses on disposition of PP&E are recognized in profit or loss when the Trust has transferred to the purchaser the significant risk and rewards of ownership of the PP&E and the purchaser has made a substantial commitment demonstrating its intent to honour its obligation.
(i) Resident contracts:
The value associated with in-place resident contracts, which represents the avoided cost of originating the acquired resident contracts plus the value of lost net resident revenue over the estimated lease-up period of the property, is amortized over the expected term of the resident occupancy. Resident contracts are recorded as a component of buildings.

C H A R T W EL L SEN IORS HOU S ING R E I T | F inanc ia l Repor t 2011
Notes to C onso l ida ted F inanc ia l S t a tement s
62 C H A R T W EL L SEN IORS HOU S ING R E I T | F inanc ia l Repor t 201162 9
(ii) Above- and below-market leases:
The values of the above- and below-market resident contracts are amortized and recorded as either an increase, in the case of below-market resident contracts, or decrease, in the case of above-market resident contracts, to depreciation over the expected term of the associated resident occupancy, estimated at an average of three years for retirement properties and one year for long-term care ("LTC") properties.
Above- and below-market leases are recorded as a component of buildings.
(iii) PILOT:
PILOT consists of arrangements with municipal governments in the United States, which require the participant to incur certain expenses in lieu of municipal property taxes. They are amortized over the life of the specific agreements. PILOT is recorded as a component of buildings.
(d) Intangible assets:
Intangible assets include licenses, management contracts and other intangibles, which are measured at cost less accumulated amortization and accumulated impairment losses, except in the case of licenses with an indefinite life, which are measured at cost less accumulated impairment losses and are not amortized.
(i) Licenses:
Licenses for the operation of LTC properties are considered to have indefinite lives. The licences are recorded at cost and are not amortized. Given the current demographic of the Canadian markets, as well as the fact that the demand for licensed beds is expected to increase beyond its current supply, management has determined that the licenses have an indefinite life.
(ii) Management contracts:
Management contracts represent the acquired value of contractual agreements to provide management and advisory services for the operations of senior residences and long-term care properties owned by third parties. Management contracts are amortized on a straight-line basis over the term of the contract or if no term is specified, over its estimated life not to exceed five years.
(iii) Other intangible assets:
Other intangible assets consist of the allocated cost of acquired operating leases of senior housing properties, software costs and below-market management contracts.
The allocated cost of the operating leases is amortized on a straight-line basis over the initial lease term of the underlying operating leases.
Software costs, which include externally purchased software licenses, are amortized over one to three years on a straight-line basis.
Below-market management contracts represent the value of contractual agreements with third parties to provide management services for the operations of senior residences owned by Chartwell. Below-market management contracts are amortized over the period in which the benefit will be realized.

C H A R T W E L L SE N IORS HOU S ING R E I T | F inanc ia l Repor t 2011 63
Notes to C onso l ida ted F inanc ia l S t a tement s
10
(e) Impairment:
(i) Financial assets, excluding trade receivables:
Financial assets carried at amortized cost are assessed at each reporting date to determine whether there is objective evidence indicating the assets might be impaired. Objective evidence can include default or delinquency by a debtor, restructuring of an amount due to the Trust on terms that the Trust would not consider otherwise or indications that a debtor or issuer will enter bankruptcy.
The Trust considers evidence of impairment for receivables at both a specific asset and collective level. All receivables are assessed for specific impairment. All receivables found not to be specifically impaired are then collectively assessed for any impairment that has been incurred but not yet identified.
An impairment loss in respect of a financial asset measured at amortized cost is calculated as the difference between its carrying amount and the present value of the estimated future cash flows discounted at the asset's original effective interest rate. Losses are recognized in profit or loss and reflected in an allowance against the associated account receivable. When a subsequent event causes the amount of impairment loss to decrease, the decrease in impairment loss is reversed through profit or loss.
(ii) Non-financial assets, excluding inventories and deferred tax assets:
The carrying amounts of the Trust's PP&E are assessed at each reporting date to determine if any events have incurred that would indicate the PP&E may be impaired. If any such indication exists, then the asset's recoverable amount is estimated and an impairment loss is recognized immediately in profit and loss for the amount by which the asset's carrying amount exceeds its recoverable amount. The recoverable amount of an asset or cash generating unit ("CGU") is the higher of (a) fair value less costs to sell and (b) value in use.
Intangible assets that have indefinite useful lives are tested for impairment annually, or more frequently, if events or circumstances indicate that the assets might be impaired.
Intangible assets with finite useful lives are tested for impairment if events or changes in circumstances, assessed at each reporting date, indicate the carrying amount may not be recoverable.
Chartwell's corporate assets do not generate separated cash flows. If there is an indication that a corporate asset, intangible asset that has an indefinite useful life, or intangible asset with a finite useful life may be impaired, then the recoverable amount is determined for the CGU to which the asset belongs.
Impairment losses recognized in prior periods are assessed at each reporting date for any indications that the loss has decreased or no longer exists. An impairment loss is reversed (excluding for goodwill) if there has been a change in the estimates used to determine the recoverable amount. An impairment loss is reversed only to the extent that the asset's carrying amount does not exceed the carrying amount that would have been determined, net of depreciation or amortization, if no impairment loss had been recognized.
(f) Capital funding:
Capital funding are grants received from the Government of Ontario for the construction costs of long-term care properties. These grants are financial instruments that are initially recorded at fair value on acquisition and carried at amortized cost. The interest accretion on the grants is recognized in profit or loss as other income over the life of the grant.

C H A R T W EL L SEN IORS HOU S ING R E I T | F inanc ia l Repor t 2011
Notes to C onso l ida ted F inanc ia l S t a tement s
64 C H A R T W EL L SEN IORS HOU S ING R E I T | F inanc ia l Repor t 201164 11
(g) Non-current assets held-for-sale:
Non-current assets, or disposal groups comprising assets and liabilities are categorized as held-for-sale where the asset or disposal group is available for sale in its present condition, and the sale is highly probable. For this purpose, a sale is highly probable if management is committed to a plan to achieve the sale; there is an active program to dispose of the assets of the disposal group; the non-current asset or disposal group is being actively marketed at a reasonable price; the sale is anticipated to be completed within one year from the date of classification; and it is unlikely there will be changes to the plan. Immediately before classification as held-for-sale, the assets, or components of the disposal group, are remeasured in accordance with the Trust's accounting policies, at the lower of their carrying amount and fair value less costs to sell. Impairment losses on initial classification as held-for-sale and subsequent gains or losses on remeasurement are recognized in profit or loss. Gains are not recognized in excess of any cumulative impairment loss.
(h) Financial instruments:
(i) Non-derivative financial assets:
Trade and other receivable, capital funding receivable and mezzanine loans receivable are non-derivative financial assets with fixed or determinable payments that are not quoted in an active market. They are initially recognized on the date that they are originated at fair value plus any directly attributable transaction costs. Subsequent to initial recognition, loans and receivables are measured at amortized cost using the effective interest method, less any impairment losses.
A financial asset is derecognized when the contractual rights to the cash flows from the asset expire or the rights to receive the contractual cash flows are transferred in a transaction in which substantially all the risks and rewards of ownership of the financial asset are transferred. Any interest in transferred financial assets that is created or retained by the Trust is recognized as a separate asset or liability.
Financial assets and liabilities are offset and the net amount presented in the consolidated balance sheets when Chartwell has a legal right to offset the amounts and intends either to settle on a net basis or to realize the asset and settle the liability simultaneously.
Non-derivative financial assets are presented as current assets on the consolidated balance sheets, except for those with maturities greater than 12-months after the balance sheet date, which are classified as non-current assets.
(ii) Non-derivative financial liabilities:
Non-derivative financial liabilities primarily consist of accounts payables, distributions payable, mortgages payable, deferred consideration on business combinations and revolving Credit Facility. They are initially measured at fair value plus any directly attributable transaction costs. Subsequent to initial recognition, they are measured at amortized cost using the effective interest method.
The effective interest method is a method of calculating the amortized cost of a financial liability and of allocating interest expense over the relevant period. The effective interest rate is the rate that exactly discounts estimated future cash payments through the expected life of the financial liability, or (where appropriate) a shorter period, to the net carrying amount on initial recognition.
A financial liability is derecognized when the Trust's contractual obligations are discharged, cancelled or expired.

C H A R T W E L L SE N IORS HOU S ING R E I T | F inanc ia l Repor t 2011 65
Notes to C onso l ida ted F inanc ia l S t a tement s
12
(iii) Derivative financial instruments:
Derivative financial instruments are recognized initially at fair value. Attributable transaction costs are recognized in profit or loss as incurred and are subsequently remeasured to their fair value at the end of each reporting period. Any resulting gain or loss is recognized in profit or loss immediately.
Chartwell entered into an interest rate swap arrangement in order to reduce the impact of fluctuating interest rates on long-term debt. This swap agreement requires periodic exchange of payments without the exchange of the notional principal amount on which the payments are based. In such cases, interest expense on the debt is adjusted to include the payments made or received under the interest rate swap arrangements. This swap arrangement is not designated as a hedging instrument under IFRS.
(iv) Financial liabilities measured at fair value:
Financial liabilities are measured at fair value when the financial liability is either held for trading or it is designated as FVTPL.
A financial liability may be designated as FVTPL upon initial recognition if it forms part of a contract containing one or more embedded derivatives, and IAS 39, Financial Instruments - Recognition and Measurement ("IAS 39"), permits the entire combined contract, asset or liability, to be designated as FVTPL.
The convertible debentures and Class B Units are designated as FVTPL. Any gains or losses arising on remeasurement are recognized in profit or loss. Distributions paid to Class B Unitholders are recognized as interest expense under finance costs in profit or loss.
(i) Cash and cash equivalents:
Cash and cash equivalents include cash and short-term investments. Short-term investments, comprising money market instruments, have a maturity of 90 days or less from their date of purchase and are stated at cost, which approximates fair value.
(j) Employee benefits:
(i) Short-term benefits:
Short-term employee benefit obligations, including vacation and bonus payments, are measured on an undiscounted basis and are expensed as the related service is provided. Liabilities are recognized for the amounts expected to be paid within 12 months as the Trust has an obligation to pay this amount as a result of past service provided by the employee, and the obligation can be estimated reliably. Short-term employee benefits are recorded in accounts payable and other liabilities.
Employee health benefits:
Chartwell self-insures the cost of certain employee health plans. These plans are administered by an independent third party. Accruals for self-insured liabilities include estimates of costs of both reported claims and claims incurred but not reported and are based on estimates of loss based on assumptions made by management, including consideration of projections provided by the independent third party administrator of the plan.
(ii) Long-term employee benefits:
Chartwell accrues its obligations related to accumulated sick pay and post-employment benefits and the related costs. The cost of post-employment benefits is actuarially

C H A R T W EL L SEN IORS HOU S ING R E I T | F inanc ia l Repor t 2011
Notes to C onso l ida ted F inanc ia l S t a tement s
66 C H A R T W EL L SEN IORS HOU S ING R E I T | F inanc ia l Repor t 201166 13
determined using the projected unit credit method using management assumptions. Any net actuarial gain (loss) is recognized in profit or loss.
Chartwell provides certain pension benefits to eligible participants upon retirement. These benefits are provided on a defined contribution basis. A defined contribution plan is a post-employment benefit plan, whereby Chartwell contributes fixed amounts into a separate entity and will have no legal or constructive obligation to pay further amounts. Obligations for contributions to defined contribution pension plans are recognized as an employee benefit expense in profit or loss in the periods during which services are rendered by employees.
(iii) Unit-based payment plans:
Chartwell maintains LTIPs, Deferred Trust Units Plans, and Restricted Unit Plans for its employees, directors and trustees. These plans are considered cash-settled and the fair value of the amount payable is recognized as an expense with a corresponding increase in liabilities, over the employees' service period. The liability is remeasured at each reporting date and at settlement date. Any changes in the fair value of the liability are recognized in profit or loss.
(k) Income taxes:
Income tax expense (benefit) comprises current and deferred taxes. Current tax and deferred tax are recognized in profit or loss, except to the extent that it relates to a business combination or items recognized directly in equity or in other comprehensive income.
Current tax is the expected taxes payable or receivable on the taxable income or loss for the year, using tax rates enacted or substantively enacted at the reporting date, and any adjustment to taxes payable or receivable in respect of previous years.
The Trust is a mutual fund trust and a specified investment flow-through trust ("SIFT") pursuant to the Income Tax Act (Canada) and became subject to SIFT tax commencing in fiscal 2007. Under the SIFT rules, certain distributions from a SIFT are not deductible in computing taxable income, and the SIFT is subject to tax on such distributions at a rate that is substantially equivalent to the general income tax rate applicable to a Canadian corporation. Distributions paid by a SIFT as returns of capital are not subject to the SIFT tax.
The Trust uses the asset and liability method of accounting for income taxes. Under this method, deferred tax is recognized in respect of temporary differences between the carrying amounts of assets and liabilities for financial reporting purposes and the amounts used for taxation purposes. Deferred tax is not recognized for the following temporary differences: the initial recognition of assets or liabilities in a transaction that is not a business combination and that affects neither accounting nor taxable profit or loss, and differences relating to investments in subsidiaries and jointly controlled entities to the extent that is probable that they will not reverse in the foreseeable future. In addition, deferred tax is not recognized for taxable temporary differences arising on the initial recognition of goodwill. Deferred tax is measured at the tax rates that are expected to be applied to temporary differences when they reverse, based on the laws that have been enacted or substantively enacted by the reporting date. Deferred tax assets and liabilities are offset if there is a legally enforceable right to offset current tax assets and liabilities, and they relate to income taxes levied by the same tax authority on the same taxable entity, or on different tax entities, but they intend to settle current tax assets and liabilities on a net basis or their tax assets and liabilities will be realized simultaneously.
A deferred tax asset is recognized for unused tax losses, tax credits and deductible temporary differences, to the extent that it is probable that future taxable profits will be available against which they can be utilized. Deferred tax assets are reviewed at each reporting date and are reduced to the extent that it is no longer probable that the related tax benefit will be realized.
C H A R T W E L L SE N IORS HOU S ING R E I T | F inanc ia l Repor t 2011 67
Notes to C onso l ida ted F inanc ia l S t a tement s
14
(l) Finance costs:
Finance costs comprise interest expense on borrowings, distributions classified as interest expense under IFRS on Class B Units and mark-to-market adjustments on mortgages payable.
(m) Revenue recognition:
The Trust derives most of its revenue from rental income, care services to residents and management services.
(i) Retirement community resident revenue:
Revenue in respect of accommodation and care services fees provided to residents of retirement communities is recognized when services, both rental and care are provided. In certain jurisdictions, residents of retirement communities are eligible for government subsidies and the rates of these subsidies are regulated. In Canada, in some jurisdictions, rent control regulations affect the rates that can be charged for rental accommodation.
(ii) Long-term care community resident revenue:
Revenue in respect of accommodation fees and ancillary services provided to residents of Canadian long-term care communities is recognized when the rental or ancillary services are provided.
In Canada, the provinces or regional health authorities (collectively, the "funding agency") regulate the amounts charged to residents of long-term care communities, a substantial portion of which are funded by provincial or regional programs. Such resident revenue earned is exclusively on actual census and is recognized as services are rendered. Certain revenue is earned only when the Trust has achieved actual census and has met additional criteria, which may include achieving certain levels of expenditure or levels of labour hours. Revenue is recognized when these criteria are achieved.
In certain cases, the funding agency provides additional funding in excess of the amounts due for actual census if certain minimum occupancy levels are achieved over the funding agency's annual cycle. Revenue for funding in excess of amounts due for actual census is recognized when the Trust has achieved the required occupancy criteria, on a proportionate basis, to earn such funding and where management expects to continue to achieve the occupancy criteria through to the completion of the funding agency's annual cycle.
(iii) Allowance for doubtful accounts:
An allowance for doubtful accounts is maintained for estimated losses resulting from the inability of residents to meet the contractual obligations under their lease agreements. Such allowances are reviewed periodically based on the recovery experience of the Trust and the creditworthiness of the residents.
(iv) Fee revenue:
(a) The Trust provides property management services for both third party and owned real estate properties. Property management services revenue relates to providing certain operations management and asset management services and is recognized in the month in which services are performed in accordance with the terms of the management contract.
(b) Fee revenue integral to Chartwell's lending activities is recognized as revenue over the estimated term of the related mezzanine loan, on an effective yield basis. Related costs are expensed over the same period using the effective interest rate method.

C H A R T W EL L SEN IORS HOU S ING R E I T | F inanc ia l Repor t 2011
Notes to C onso l ida ted F inanc ia l S t a tement s
68 C H A R T W EL L SEN IORS HOU S ING R E I T | F inanc ia l Repor t 201168 15
(c) To the extent that ultimate collection of revenue is not reasonably assured, Chartwell will recognize revenue only as cash received.
(n) Segment reporting:
Chartwell monitors and operates its Canadian Retirement, Canadian Long-Term Care and United States Operations separately.
Segment results that are reported to the senior executive committee include items directly attributable to a segment, as well as those that can be allocated on a reasonable basis. Unallocated items comprise mainly general, administrative and trust expenses, fair value adjustments to financial instruments and deferred income taxes. The accounting policies applied by the segments are the same as those applied by the Trust.
(o) Lease payments:
Chartwell maintains some properties in the United States that are classified as operating leases. These leased assets are not recognized in the Trust's consolidated balance sheets, but payments made are recognized in profit or loss on a straight-line basis over the term of the lease.
(p) IFRS pronouncements:
(i) IFRS 9, Financial Instruments ("IFRS 9"):
In November 2009, the IASB issued IFRS 9. IFRS 9 replaces the guidance in IAS 39 and establishes principles for the financial reporting of financial assets and financial liabilities that will present relevant and useful information to users of financial statements for their assessment of the amounts, timing and uncertainty of an entity's future cash flow. This new standard is effective for the Trust's interim and annual consolidated financial statements commencing January 1, 2015. The extent of the impact of adoption of IFRS 9 has not yet been determined.
(ii) IFRS 10, Consolidated Financial Statements ("IFRS 10"):
In May 2011, the IASB issued IFRS 10. IFRS 10 replaces the guidance in IAS 27, Consolidated and Separate Financial Statements, and SIC-12, Consolidation - Special Purpose Entities ("SIC-12"). IFRS 10 provides a single model to be applied in the control analysis for all investees, including entities that currently are special purpose entities in the scope of SIC-12. This new standard is effective for the Trust's interim and annual consolidated financial statements commencing January 1, 2013. The extent of the impact of adoption of IFRS 10 has not yet been determined.
(iii) IFRS 11, Joint Arrangements ("IFRS 11"):
In May 2011, the IASB issued IFRS 11. IFRS 11, which replaces the guidance in IAS 31, Interests in Joint Ventures, provides for a more realistic reflection of joint arrangements by focusing on the rights and obligations of the arrangement, rather than its legal form (as is currently the case). The standard addresses inconsistencies in the reporting of joint arrangements by requiring interests in jointly controlled entities to be accounted for under the equity method. Upon application of IFRS 11, entities which had previously accounted for joint ventures using proportionate consolidation shall collapse the proportionately consolidated net asset value (including any allocation of goodwill) into a single investment balance at the beginning of the earliest period presented. This new standard is effective for the Trust's interim and annual consolidated financial statements commencing January 1, 2013. The extent of the impact of adoption of IFRS 11 has not yet been determined.

C H A R T W E L L SE N IORS HOU S ING R E I T | F inanc ia l Repor t 2011 69
Notes to C onso l ida ted F inanc ia l S t a tement s
16
(iv) IFRS 12, Disclosure of Interests in Other Entities ("IFRS 12"):
In May 2011, the IASB issued IFRS 12. IFRS 12 contains the disclosure requirements for entities that have interests in subsidiaries, joint arrangements, associates and unconsolidated structured entities. This new standard is effective for the Trust's interim and annual consolidated financial statements commencing January 1, 2013. The extent of the impact of adoption of IFRS 12 has not yet been determined.
(v) IFRS 13, Fair Value Measurement ("IFRS 13"):
In May 2011, the IASB published IFRS 13. IFRS 13 replaces the fair value measurement guidance contained in individual IFRS with a single source of fair value measurement guidance. The standard also requires disclosures which enable users to assess the methods and inputs used to develop fair value measurements. This new standard is effective for the Trust's interim and annual consolidated financial statements commencing January 1, 2013. The extent of the impact of adoption of IFRS 13 has not yet been determined.
(vi) Amendments to IFRS 7, Disclosures - Transfers of Financial Assets ("IFRS 7"):
In October 2010, the IASB issued IFRS 7. This amendment enhances disclosure requirements to aid financial statement users in evaluating the nature of, and risks associated with an entity's continuing involvement in derecognized financial assets. This amendment is effective for the Trust's interim and annual consolidated financial statements commencing January 1, 2012. The extent of the impact of adoption of IFRS 7 has not yet been determined.
(vii) Amendments to IAS 12, Deferred Tax: Recovery of Underlying Assets ("IAS 12"):
In December 2010, the IASB amended IAS 12. IAS 12 will now introduce an exception to the measurement principles for deferred tax assets and liabilities related to the depreciable component of investment properties that are measured at fair value under IAS 40, Investment Property, and to the depreciable component of investment properties acquired in a business combination that will subsequently be measured using the fair value model. This amendment is effective for the Trust's interim and annual consolidated financial statements commencing January 1, 2012. The Trust does not expect the amendments to IAS 12 to have a material impact on the financial statements.
(viii) Amendments to IAS 28, Investments in Associates and Joint Ventures ("IAS 28"):
In May 2011, the IASB issued IAS 28. IAS 28 requires any retained portion of an investment in an associate or joint venture that has not been classified as held for sale to be measured using the equity method, until disposal. After disposal, if the retained interest continues to be an associate or joint venture, the amendment requires for it to be continued to be accounted for under the equity method. The amendment also disallows the remeasurement of any retained interest in an investment upon the cessation of significant influence or joint control. This amended standard is effective for the Trust's interim and annual consolidated financial statements commencing January 1, 2013. The extent of the impact of adoption of the amendments has not yet been determined.
(ix) Amendments to IAS 1, Presentation of Financial Statements ("IAS 1"):
In June 2011, the IASB amended IAS 1. This amendment requires that an entity present separately the items of OCI that may be reclassified to profit or loss in the future from those that would never be reclassified to profit or loss. This amended standard is effective for the Trust's interim and annual consolidated financial statements commencing January 1, 2013. The extent of the impact of adoption of the amendments has not yet been determined.

C H A R T W EL L SEN IORS HOU S ING R E I T | F inanc ia l Repor t 2011
Notes to C onso l ida ted F inanc ia l S t a tement s
70 C H A R T W EL L SEN IORS HOU S ING R E I T | F inanc ia l Repor t 201170 17
(x) Amendments to IAS 19, Employee Benefits ("IAS 19"):
In June 2011, the IASB amended IAS 19. Adoption of the amendment is required for annual periods beginning on or after January 1, 2013, with early adoption permitted. This amendment eliminated the use of the 'corridor' approach and mandates that all remeasurement impacts be recognized in OCI. It also enhances the disclosure requirements, providing better information about the characteristics of defined benefit plans and the risk that entities are exposed to through participation in those plans. This amendment clarifies when a company should recognize a liability and an expense for termination benefits. This amended standard is effective for the Trust's interim and annual consolidated financial statements commencing January 1, 2013. The extent of the impact of adoption of the amendments has not yet been determined.
(xi) Amendments to IAS 32, Financial Instruments - Presentation ("IAS 32"), and IFRS 7:
In December 2011, the IASB amended IAS 32 to clarify that an entity currently has a legally enforceable right to offset if that right is not contingent on a future event and enforceable both in the normal course of business and in the event of default, insolvency or bankruptcy of the entity and all counterparties. The amendments to IAS 32 also clarify when a settlement mechanism provides for net settlement or gross settlement that is equivalent to net settlement. The IASB also amended IFRS 7 to include new disclosure requirements for financial assets and liabilities that are offset in the consolidated balance sheets or subject to master netting arrangements or similar arrangements.
The amendments to IAS 32 are effective for fiscal periods beginning on or after January 1, 2014 and the amendments to IFRS 7 are effective for fiscal periods beginning on or after January 1, 2013. These amendments are to be applied retrospectively. The extent of the impact of adoption of the amendments has not yet been determined.
3. Acquisitions: (a) Joint ventures:
On April 1, 2011, Chartwell acquired a 33.3% interest in Chartwell Classic Robert Speck Seniors Housing ("Robert Speck") from Spectrum. The purchase price before closing costs was $11,140 and was settled through the assumption of debt of $7,605, settlement of outstanding mezzanine loan of $1,050, settlement of outstanding accounts receivable of $807, with the remaining balance, net of working capital adjustments, settled in cash. Chartwell has accounted for this using the proportionate consolidation method with additional disclosures relating to this transaction found in note 3(b)(i).
(b) Business combinations:
On May 10, 2011, Chartwell acquired a 50% interest in Chatsworth Retirement Suites and Bungalows ("Chatsworth") from its joint venture partner. The purchase price before closing costs was $10,363 and was settled through the assumption of debt of $5,793, settlement of outstanding mezzanine loan of $1,063, settlement of $280 in other amounts due to Chartwell from the vendor, with the remaining balance net of working capital adjustments settled in cash. Upon completion of this transaction, Chartwell owns 100% interest in the property. Additional disclosures relating to this transaction are found in note 3(b)(ii) and 3(b)(iv).
On November 1, 2011, Chartwell acquired from ING Real Estate Community Living Group ("ING") the remaining 50% interest in 15 properties in the United States ("ING Portfolio"), which were jointly owned with Chartwell. The purchase price before closing costs was $172,346 (U.S. $169,000) and was settled through the assumption of debt of $137,846 (U.S. $135,170), not including mark-to-market adjustments, with the remaining balance, net of working capital

C H A R T W E L L SE N IORS HOU S ING R E I T | F inanc ia l Repor t 2011 71
Notes to C onso l ida ted F inanc ia l S t a tement s
18
adjustments settled in cash. Additional disclosures relating to this transaction are found in note 3(b)(iii) and 3(b)(iv).
The above transactions are in line with Chartwell's strategy to increase its ownership in existing properties it operates. Chartwell has accounted for these business combinations using the acquisition method.
The following table summarizes the allocation of the purchase to each major category of assets acquired and liabilities assumed at the date of acquisition:
April 1, May 10, November 1,Date of acquisition 2011 (i) 2011 (ii) 2011 (iii)
Canadian Retirement United States
Segment Operations Operations Province of Province of British Various Ontario Columbia states Location (113 suites) (103 suites) (2,948 suites) Total
PP&E $ 11,137 $ 12,453 $ 175,884 $ 199,474 Other assets (liabilities) (222) – 729 507 Mortgages assumed (7,605) (5,793) (139,760) (153,158) Net assets acquired $ 3,310 $ 6,660 $ 36,853 $ 46,823
Discharge of mezzanine loan receivable $ 1,050 $ 1,063 $ – $ 2,113
Settlement of accounts receivable 807 280 – 1,087
Cash consideration 1,453 3,227 35,348 40,028 Gain recorded on
remeasurement of previously held equity interest on acquisition – 2,090 1,505 3,595
Total consideration $ 3,310 $ 6,660 $ 36,853 $ 46,823
(i) The Trust incurred acquisition-related costs of $237 relating to external legal fees and due diligence costs. These costs have been recognized in other expense (income) in profit or loss.
Included in the consolidated financial statements are the following amounts relating to Chartwell's 33.3% interest in the Robert Speck joint venture at December 31, 2011:
Balance sheet:
Current assets $ 116 Non-current assets 10,892 $ 11,008
Current liabilities $ 125 Non-current liabilities 7,594 $ 7,719
Statement of comprehensive loss:
Revenue $ 573 Expenses 1,143 Loss before income taxes $ (570)

C H A R T W EL L SEN IORS HOU S ING R E I T | F inanc ia l Repor t 2011
Notes to C onso l ida ted F inanc ia l S t a tement s
72 C H A R T W EL L SEN IORS HOU S ING R E I T | F inanc ia l Repor t 201172 19
(ii) As the Chatsworth acquisition was completed in steps, under IFRS, Chartwell is required to remeasure its original 50% interest to fair value. This remeasurement has resulted in an increase in value of $2,090, which has been recognized as a gain in other expense (income) in profit or loss. The net book value of the original 50% interest prior to this acquisition was $8,010.
The Trust incurred acquisition-related costs of $282 relating to external legal fees and due diligence costs. These costs have been expensed in other expense (income) in profit or loss.
(iii) The remeasurement to fair value of the initial 50% interest in the 15 properties, resulted in a gain of $1,505 (U.S. $1,476), recognized in other expense (income) in profit or loss. The net book value, net of impairment provision of $8,500, on the original 50% interest as at November 1, 2011 was $170,841.
Acquisition-related costs of $312 relating to external legal fees and due diligence requirements have been incurred and are recognized in other expense (income) in profit or loss.
(iv) Chatsworth and the ING Portfolio have contributed revenue of $16,400 and net loss of $2,093 since their respective acquisition dates. If these acquisitions had occurred on January 1, 2011, the consolidated revenue for the Trust would have been $790,370 and the consolidated net loss for the year would have been $71,640.
(c) Acquisitions during the year ended December 31, 2010:
The following are the acquisitions that occurred during the year ended December 31, 2010:
Property Ownership interest Date acquired
The Québec Portfolio(1) 100% March 9, 2010 The Meridian Portfolio 50% May 14, 2010 The Regency Portfolio 50% June 1, 2010 Valley Vista Retirement Residence 50% June 1, 2010 Chartwell Classic Oakville 50% September 1, 2010 Chartwell Select Muskoka Traditions 100% December 1, 2010
(1) The Québec Portfolio represents Chartwell's acquisition, through foreclosure proceedings, of three retirement properties and one parcel of vacant land from Melior.

C H A R T W E L L SE N IORS HOU S ING R E I T | F inanc ia l Repor t 2011 73
Notes to C onso l ida ted F inanc ia l S t a tement s
20
The table below summarizes the acquisitions and the resulting changes from CGAAP to IFRS. Under CGAAP, the purchase price (including costs of acquisition) is allocated to each major class of assets acquired and liabilities assumed. Under IFRS, the fair value of the consideration transferred is allocated.
IFRS CGAAP adjustment IFRS
PP&E $ 290,814 $ 28,141 $ 318,955 Intangible assets 22,965 (22,965) – Capital funding receivable 23,054 (1,268) 21,786 Licenses 12,931 5,753 18,684 Deferred income tax liability (2,274) (911) (3,185)Mortgages assumed (261,051) 2,645 (258,406) Other liabilities (6,694) (2,651) (9,345)
Net assets acquired $ 79,745 $ 8,744 $ 88,489
Discharge of mezzanine loans receivable $ 17,366 $ – $ 17,366
Settlement of management contracts and accounts receivable 9,301 (2,028) 7,273
Cash consideration 49,783 – 49,783 Acquisition costs 3,295 (3,295) – Gain recorded on remeasurement
of previously held equity interest on acquisition – 9,639 9,639
Bargain purchase on acquisition – 4,428 4,428
Total consideration $ 79,745 $ 8,744 $ 88,489
As the acquisitions of The Meridian Portfolio and The Regency Portfolio were completed in steps, Chartwell was required to remeasure the original 50% interest to fair value. As a result, a gain of $9,639 was recorded in other expense (income). The combined net book value of the portfolios, prior to the purchase of the second 50% interest was $200,183. If these acquisitions had occurred on January 1, 2010, they would have contributed revenue of $142,806 and loss of $1,815 at 100% ownership interest.

C H A R T W EL L SEN IORS HOU S ING R E I T | F inanc ia l Repor t 2011
Notes to C onso l ida ted F inanc ia l S t a tement s
74 C H A R T W EL L SEN IORS HOU S ING R E I T | F inanc ia l Repor t 201174 21
4. Property, plant and equipment: Furniture, Properties Land fixtures and under held for Land Building equipment development development Total
Cost or deemed cost
Balance, January 1, 2010 $ 255,801 $ 2,049,739 $ 35,068 $ 11,006 $ 18,643 $ 2,370,257 Additions 836 18,187 5,307 15,012 1,889 41,231 Additions through business
combinations 29,382 262,981 14,208 420 8,297 315,288 Disposals (3,961) (28,051) (893) – (2,380) (35,285) Transfers 3,171 10,669 233 (9,608) (4,465) – Exchange differences
on translation of United States Operations (4,179) (38,742) (893) (182) (321) (44,317)
Balance, December 31, 2010 281,050 2,274,783 53,030 16,648 21,663 2,647,174 Additions – 27,437 8,099 35,741 1,875 73,152 Additions through business
combinations 23,419 136,800 5,275 – – 165,494 Disposals (6,600) (57,432) (1,457) – (5,400) (70,889) Derecognition – (8,636) (1,701) – – (10,337) Transfers (5,040) – – 4,775 265 – Exchange differences
on translation of United States Operations 1,661 16,085 381 113 137 18,377
Balance, December 31, 2011 $ 294,490 $ 2,389,037 $ 63,627 $ 57,277 $ 18,540 $ 2,822,971
Depreciation and impairment losses
Balance, January 1, 2010 $ – $ 5,062 $ 3,346 $ – $ – $ 8,408 Depreciation – 149,916 10,859 – – 160,775 Disposals due to step
acquisitions – (3,442) (225) – – (3,667) Disposals – (1,250) (79) – – (1,329) Exchange differences on
translation of United States Operations – (1,995) (194) – – (2,189)
Balance, December 31, 2010 – 148,291 13,707 – – 161,998 Depreciation – 155,480 15,364 – – 170,844 Disposals due to step
acquisitions – (32,318) (1,662) – – (33,980) Disposals – (8,756) (407) – – (9,163) Derecognition – (8,636) (1,701) – – (10,337) Impairment – 11,200 – 1,880 – 13,080 Exchange differences
on translation of United States Operations – 3,710 278 – – 3,988
Balance, December 31, 2011 $ – $ 268,971 $ 25,579 $ 1,880 $ – $ 296,430
Carrying amounts
Balance, January 1, 2010 $ 255,801 $ 2,044,677 $ 31,722 $ 11,006 $ 18,643 $ 2,361,849 Balance, December 31, 2010 281,050 2,126,492 39,323 16,648 21,663 2,485,176 Balance, December 31, 2011 294,490 2,120,066 38,048 55,397 18,540 2,526,541
The Trust capitalized $1,303 of borrowing costs related to development projects under construction at an average capitalization rate of 5.43%.
Included in PP&E are assets under finance leases with a carrying value as at December 31, 2011 of $99,020 (December 31, 2010 - $103,045). The properties are leased for a nominal amount and at the expiry date, Chartwell is obliged to purchase the right, title and interest in the properties for a nominal amount.

C H A R T W E L L SE N IORS HOU S ING R E I T | F inanc ia l Repor t 2011 75
Notes to C onso l ida ted F inanc ia l S t a tement s
22
The following are the transactions that occurred during the year ended December 31, 2011:
(a) The Trust purchased a parcel of development land in Hamilton, Ontario for cash consideration of $1,875.
(b) On July 31, 2011, the Trust disposed of one retirement community, assets and liabilities of which were included in the Canadian Retirement Operations segment. The sale price was $70,000, of which $1,500 was held in escrow to provide the purchaser with income protection until the expiration of current resident incentives and the achievement of 97% occupancy or higher for a consecutive three-month period. The purchaser assumed an existing debt of $47,026, with the balance, net of working capital adjustments, received in cash. As a result of this transaction, the Trust recorded a gain on sale of $5,926 included in other expense (income) (note 22).
5. Intangible assets: Management
contracts Licenses Other(1) Total
Cost
Balance, January 1, 2010 $ 5,486 $ 25,650 $ 11,754 $ 42,890 Additions – – 1,082 1,082 Additions through business
combinations – 18,684 – 18,684 Disposals (4,506) – – (4,506) Exchange differences
on translation of United States Operations – – (491) (491)
Balance, December 31, 2010 980 44,334 12,345 57,659 Additions – – 3,031 3,031 Disposals – – (524) (524) Exchange differences on
translation of United States Operations – – 302 302
Balance, December 31, 2011 $ 980 $ 44,334 $ 15,154 $ 60,468
Amortization and impairment losses
Balance, January 1, 2010 $ 2,412 $ – $ 2,794 $ 5,206 Amortization 289 – 2,055 2,344 Disposals (2,478) – – (2,478) Exchange differences
on translation of United States Operations – – (153) (153)
Balance, December 31, 2010 223 – 4,696 4,919 Amortization 63 – 2,492 2,555 Exchange differences on
translation of United States Operations – – 115 115
Balance, December 31, 2011 $ 286 $ – $ 7,303 $ 7,589
Carrying amounts
Balance, January 1, 2010 $ 3,074 $ 25,650 $ 8,960 $ 37,684 Balance, December 31, 2010 757 44,334 7,649 52,740 Balance, December 31, 2011 694 44,334 7,851 52,879
(1) Other intangibles consist of the allocated cost of acquired operating leases of senior housing properties, below-market management contracts and software costs.

C H A R T W EL L SEN IORS HOU S ING R E I T | F inanc ia l Repor t 2011
Notes to C onso l ida ted F inanc ia l S t a tement s
76 C H A R T W EL L SEN IORS HOU S ING R E I T | F inanc ia l Repor t 201176 23
During the year ended December 31, 2011, Chartwell disposed of its ownership interest in Horizon Bay Chartwell ("HBC") and Horizon Bay Chartwell II ("HBCII") to Horizon Bay Realty LLC with a carrying value of net assets of $524. In exchange, Chartwell entered into below-market management contracts with Brookdale Senior Living Inc. for 45 communities in the United States with a fair value of $2,935 (U.S. $3,000). A net gain of $1,848, net of disposition costs and working capital adjustments of $563, was recorded in other expense (income) (note 22).
6. Mezzanine loans receivable: The following table summarizes mezzanine loans receivable from Melior, Spectrum and Partners and other joint-venture partners:
Net balance (Principal amount less lending expenses) Contractual interest December 31, December 31, January 1, Note rate 2011 2010 2010
Spectrum and Partners, outside Québec (a) 10% - 14% $ 11,605 $ 17,603 $ 25,023
Melior, Spectrum and Partners, in Québec (b) 10% 8,551 22,128 47,376 Seasons and Partners (c) 10% 2,607 2,607 13,432 22,763 42,338 85,831
Provision, opening balance 21,535 30,508 30,508 Settlement of mezzanine loans – (12,535) – Additions to provision/reallocated
on collection of certain accounts receivable 851 3,562 –
Offset against principal amount of loans (b) (9,276) – –
Provision, closing balance 13,110 21,535 30,508 $ 9,653 $ 20,803 $ 55,323
Current $ 9,653 $ 14,768 $ 28,589 Non-current – 6,035 26,734
$ 9,653 $ 20,803 $ 55,323
(a) Spectrum and Partners, outside Québec:
The loans are secured by second charges or pledges over seven (December 31, 2010 - 10) senior housing development properties.
During the year ended December 31, 2011, two mezzanine loans in the amount of $3,886 were collected in cash and two other mezzanine loans totalling $2,113 were settled as part of the consideration on the acquisition of two properties.
Chartwell's settlement agreement with Spectrum expired on June 30, 2011. In October 2011, Chartwell amended and restated the terms of its settlement agreement to allow Spectrum to sell certain of its assets to Renaissance Lifestyle Communities Inc. ("Renaissance") pursuant to its Initial Public Offering. Subsequently, Chartwell was notified that the previously announced sale of certain Spectrum assets to Renaissance was not proceeding at that time. Chartwell retains all of its rights under the agreements with Spectrum, including mezzanine loan agreements and the development agreement, as amended. Chartwell continues to work with Spectrum to collect its accounts receivable and mezzanine loans and to manage certain of its operating properties.

C H A R T W E L L SE N IORS HOU S ING R E I T | F inanc ia l Repor t 2011 77
Notes to C onso l ida ted F inanc ia l S t a tement s
24
(b) Melior, Spectrum and Partners, in Québec:
The loans are secured by second mortgages over two (December 31, 2010 - six) senior housing development properties.
During the year ended December 31, 2011, three mezzanine loans in the amount of $9,276, which had previously been fully provided for, were deemed unrecoverable and were written off.
During the year ended December 31, 2011, one mezzanine loan in the amount of $4,301 was collected in cash.
(c) Seasons and Partners:
This loan is secured by a second charge over one (December 31, 2010 - one) operating long-term care community.
Each mezzanine loan matures on the earliest of: (i) the fifth anniversary of the initial advance of the funds; (ii) the date of sale of the related development property; or (iii) on the second anniversary of the date upon which the property achieves a stabilized occupancy, as defined in the Development and Loan Agreements with the Borrowers. No principal amounts are due prior to maturity of each loan.
7. Trade and other receivables: December 31, December 31, January 1, 2011 2010 2010
Trade receivables $ 12,586 $ 14,288 $ 13,955 Due from Spectrum 558 173 218 Due from ING – 134 6,610
$ 13,144 $ 14,595 $ 20,783
The Trust's exposure to credit and currency risk and impairment losses related to trade and other receivables is disclosed in note 19.
8. Capital funding receivable: The capital funding receivable of $59,120 (December 31, 2010 - $62,596) represents the discounted cash flows from the Government of Ontario over a remaining period of approximately 11 years in respect of construction costs of 12 long-term care properties. The receipt of funding for the remaining terms of the agreements is subject to the condition that the homes continue to operate as long-term care communities for the remaining period. The discount rate used is based upon long-term Ontario Government Bond rates.
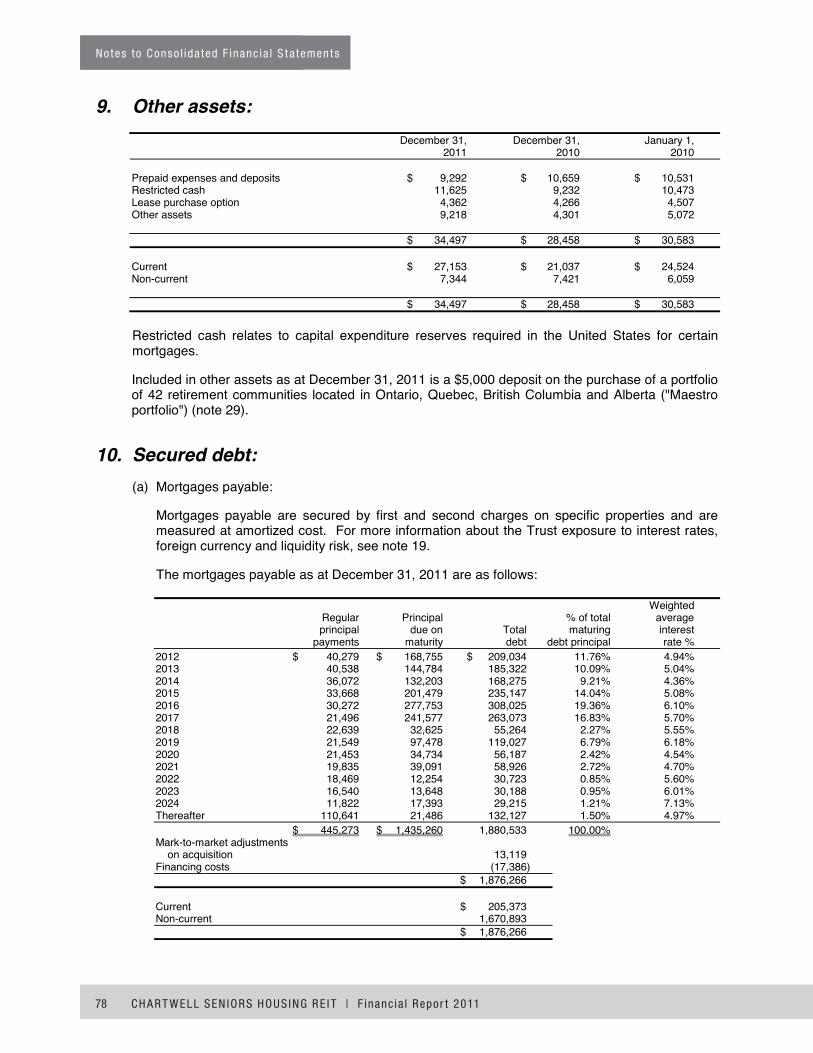
C H A R T W EL L SEN IORS HOU S ING R E I T | F inanc ia l Repor t 2011
Notes to C onso l ida ted F inanc ia l S t a tement s
78 C H A R T W EL L SEN IORS HOU S ING R E I T | F inanc ia l Repor t 201178 25
9. Other assets: December 31, December 31, January 1, 2011 2010 2010
Prepaid expenses and deposits $ 9,292 $ 10,659 $ 10,531 Restricted cash 11,625 9,232 10,473 Lease purchase option 4,362 4,266 4,507 Other assets 9,218 4,301 5,072
$ 34,497 $ 28,458 $ 30,583
Current $ 27,153 $ 21,037 $ 24,524 Non-current 7,344 7,421 6,059
$ 34,497 $ 28,458 $ 30,583
Restricted cash relates to capital expenditure reserves required in the United States for certain mortgages.
Included in other assets as at December 31, 2011 is a $5,000 deposit on the purchase of a portfolio of 42 retirement communities located in Ontario, Quebec, British Columbia and Alberta ("Maestro portfolio") (note 29).
10. Secured debt: (a) Mortgages payable:
Mortgages payable are secured by first and second charges on specific properties and are measured at amortized cost. For more information about the Trust exposure to interest rates, foreign currency and liquidity risk, see note 19.
The mortgages payable as at December 31, 2011 are as follows:
Weighted Regular Principal % of total average principal due on Total maturing interest payments maturity debt debt principal rate % 2012 $ 40,279 $ 168,755 $ 209,034 11.76% 4.94% 2013 40,538 144,784 185,322 10.09% 5.04% 2014 36,072 132,203 168,275 9.21% 4.36% 2015 33,668 201,479 235,147 14.04% 5.08% 2016 30,272 277,753 308,025 19.36% 6.10% 2017 21,496 241,577 263,073 16.83% 5.70% 2018 22,639 32,625 55,264 2.27% 5.55% 2019 21,549 97,478 119,027 6.79% 6.18% 2020 21,453 34,734 56,187 2.42% 4.54% 2021 19,835 39,091 58,926 2.72% 4.70% 2022 18,469 12,254 30,723 0.85% 5.60% 2023 16,540 13,648 30,188 0.95% 6.01% 2024 11,822 17,393 29,215 1.21% 7.13% Thereafter 110,641 21,486 132,127 1.50% 4.97% $ 445,273 $ 1,435,260 1,880,533 100.00% Mark-to-market adjustments
on acquisition 13,119 Financing costs (17,386) $ 1,876,266
Current $ 205,373 Non-current 1,670,893 $ 1,876,266

C H A R T W E L L SE N IORS HOU S ING R E I T | F inanc ia l Repor t 2011 79
Notes to C onso l ida ted F inanc ia l S t a tement s
26
December 31, December 31, January 1, 2011 2010 2010
Mortgages at fixed rates: Mortgages $ 1,784,835 $ 1,650,282 $ 1,578,454 Interest rates 2.50% - 10.00% 2.50% - 10.00% 2.03% - 10.00% Weighted average
interest rate 5.54% 5.48% 5.49%
Mortgages at variable rates:
Mortgages $ 95,698 $ 85,775 $ 53,747 Interest rates Lenders COF plus BA plus 300bps Lender COF plus 2.00% to prime to prime plus 2.00% to prime plus 2.50% 2.25% plus 4.75% Weighted average
interest rate 4.37% 4.73% 3.56%
Blended weighted average rate 5.48% 5.44% 5.42%
During the year ended December 31, 2011, interest expense on mortgages payable amounted to $97,385 (December 31, 2010 - $95,935).
(b) Credit Facility:
Chartwell has arranged for an $85,000 Credit Facility. At December 31, 2011, the maximum available borrowing capacity under the Credit Facility was $85,000 (December 31 2010 - $75,000; January 1, 2010 - $61,931) based on the security provided. Of this capacity, $2,253(December 31, 2010 - $2,116; January 1, 2010 - $1,950) has been allocated to support various letters of credit issued by Chartwell. During the three-month period ended June 30, 2011, the Credit Facility was renewed and now matures June 24, 2012. As part of the renewal, the Credit Facility was increased to $85,000 from the previous limit of $75,000. Under the terms and conditions, amounts outstanding under the Credit Facility bear interest at the bank's prime rate plus 1.65% or the applicable bankers' acceptance rate plus 2.65%. Additional terms include minimum equity requirements and covenants requiring limitations on the amount of cash distributions that can be paid to Unitholders. The Credit Facility is secured by charges on specific properties. As at December 31, 2011, $53,000 (December 31, 2010 - $51,000; January 1, 2010 - nil) was outstanding under the Credit Facility.
11. Convertible debentures: The Trust has elected to designate convertible debentures as FVTPL. Fair value is determined using the market prices for these listed convertible debentures. The market price of the 5.9% convertible debentures at December 31, 2011 was $101.90 (December 31, 2010 - $102.50).
The Trust has the following series of convertible debentures outstanding:
December 31, December 31, January 1, 2011 2010 2010
6.0% convertible debentures (a): Principal $ – $ – $ 124,925 Fair value – – 128,048
5.9% convertible debentures (b): Principal $ 75,000 $ 75,000 $ 75,000 Fair value 76,425 76,876 76,875

C H A R T W EL L SEN IORS HOU S ING R E I T | F inanc ia l Repor t 2011
Notes to C onso l ida ted F inanc ia l S t a tement s
80 C H A R T W EL L SEN IORS HOU S ING R E I T | F inanc ia l Repor t 201180 27
(a) 6.0% convertible debentures:
On December 3, 2010, the Trust settled the 6.0% convertible debentures totalling $124,925 for face value plus accrued interest of $3,789 for $128,714 in cash.
(b) 5.9% convertible debentures:
The 5.9% convertible debentures bear interest at an annual rate of 5.9% payable semi-annually in arrears on May 1 and November 1 in each year commencing May 1, 2007. Each 5.9% convertible debentures is convertible into freely tradable Trust Units of Chartwell at the option of the holder at any time prior to the earlier of May 1, 2012 and the last business day immediately preceding the date specified by Chartwell for redemption of the 5.9% convertible debentures, at a conversion price of $16.25 per Trust Unit. Holders converting their 5.9% convertible debentures will be entitled to receive in addition to the applicable number of Trust Units, accrued and unpaid interest thereon for the period from the last interest payment date on their 5.9% convertible debentures up to and including the last record date set by Chartwell prior to the date of conversion for determining the Unitholders entitled to receive a distribution on the Trust Units. In the event Chartwell has suspended regular distributions, then 5.9% convertible debentures holders, in addition to the applicable number of Trust Units to be received on conversion, will be entitled to receive accrued and unpaid interest for the period from the last payment date prior to the date of conversion.
The 5.9% convertible debentures were not redeemable by Chartwell before May 1, 2010, except in the event of satisfaction of certain conditions after a change in control has occurred. On and after May 1, 2010 but prior to May 1, 2011, the 5.9% convertible debentures may be redeemed by Chartwell in whole or in part at a price equal to the principal amount thereof plus accrued and unpaid interest provided that the volume -weighted average trading price, as defined in the Indenture is not less than 125% of the conversion price. On or after May 1, 2011, the 5.9% convertible debentures may be redeemed by Chartwell in whole at any time or in part from time to time, at a price equal to the principal amount thereof plus accrued and unpaid interest.
Subject to regulatory approval and provided no event of default has occurred, Chartwell may, at its option, elect to satisfy its obligation to pay the principal amount of the 5.9% convertible debentures on redemption or maturity through, in whole or in part, the issuance of freely tradable Trust Units. The number of Trust Units to be issued in respect of each debenture will be determined by dividing the principal amount of the debenture by 95% of the volume-weighted average trading price, as defined in the Trust Indenture relating to the debenture. In addition, subject to regulatory approval and provided no event of default has occurred, Trust Units may be issued with the proceeds used by the 5.9% convertible debentures Trustee to satisfy the obligations to pay interest on the 5.9% convertible debentures.
On February 15, 2012, Chartwell announced it would redeem these debentures in full on or about March 19, 2012, with cash (note 29).

C H A R T W E L L SE N IORS HOU S ING R E I T | F inanc ia l Repor t 2011 81
Notes to C onso l ida ted F inanc ia l S t a tement s
28
12. Accounts payable and other liabilities: December 31, December 31, January 1, Note 2011 2010 2010
Accounts payable and accrued liabilities $ 93,325 $ 76,244 $ 70,466
Resident deposits 4,014 3,973 4,348 Deferred revenue 6,897 5,637 4,004 Deferred Trust Units (a) 3,013 1,363 644 Restricted Trust Units (b) 676 238 – Fair value of LTIP
option component (c) 3,731 5,476 3,776 Other liabilities 32 646 1,466
$ 111,688 $ 93,577 $ 84,704
(a) Deferred Unit Plan:
The Trust provides a Deferred Unit Plan for its independent directors. The plan entitles directors, at their option, to receive all, 75%, 50% or 25% of their directors' fees in the form of Deferred Trust Units. The Trust matches on a one-on-one basis the number of Trust Units elected to be received by directors. The number awarded is based on the fair market value, as defined by the plan, of the Trust Units on the award date. The Deferred Trust Units earn additional Deferred Trust Units related to distributions that would otherwise have been paid if Trust Units, as opposed to Deferred Trust Units, had been issued on the date of the grant. The number of Deferred Trust Units issued in regard to distributions is based on the fair market value of the Trust's Units, as defined in the plan, on the date distributions are paid. Deferred Trust Units cannot be distributed to the directors until after they retire from the board.
As described in note 2(j)(iii), under IFRS, this plan is considered a cash-settled plan with the value of issued Units recorded as a liability on the consolidated balance sheets. The liability is released to equity after retirement of the director. The liability is revalued at each reporting date based on the trading value of Trust Units. Distributions on Deferred Trust Units are included in general, administrative and trust expenses in profit or loss.
The Trust has elected to designate Deferred Trust Units as FVTPL. Fair value is determined using the market prices for listed Trust Units since there is a one-for-one conversion feature. The market price of the Trust Units as at December 31, 2011 was $8.50.
The following table summarizes the Deferred Trust Unit activity since January 1, 2010:
Units outstanding Amount
Balance, January 1, 2010 120,592 $ 644 Units granted 78,306 641 Reinvested distributions 9,936 78
Balance, December 31, 2010 208,834 1,363 Units granted 127,449 1,054 Reinvested distributions 18,267 141 Change in fair value – 455
Balance, December 31, 2011 354,550 $ 3,013
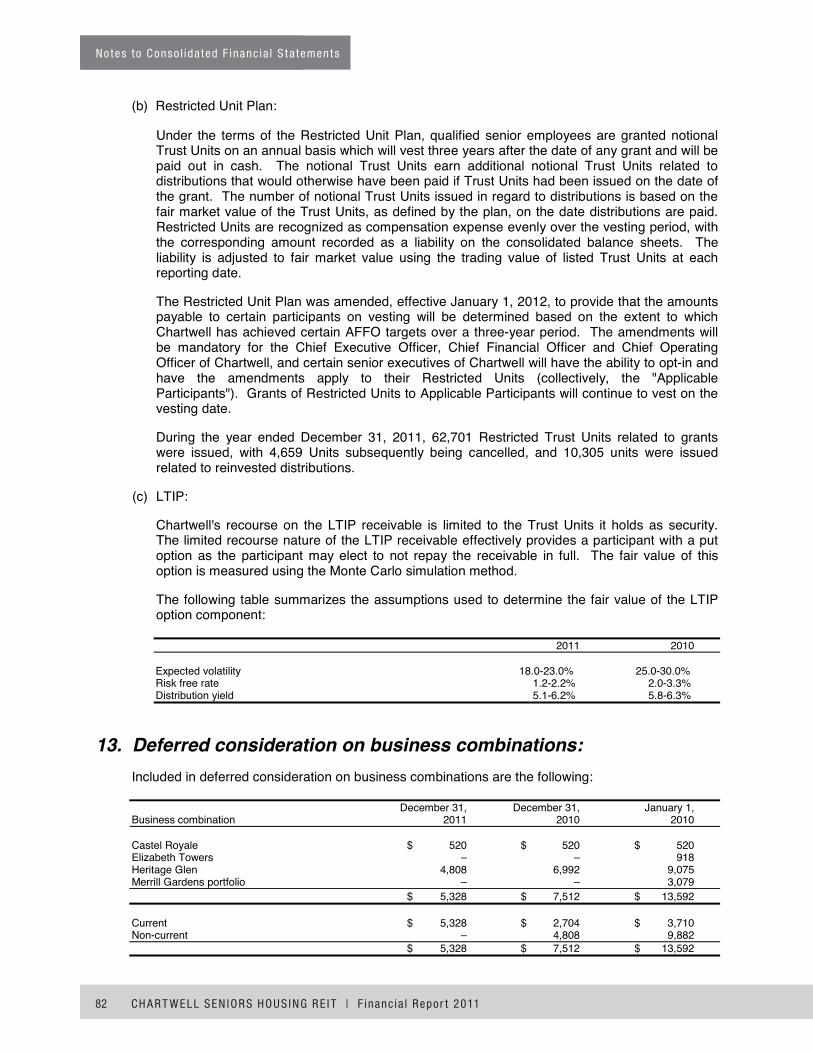
C H A R T W EL L SEN IORS HOU S ING R E I T | F inanc ia l Repor t 2011
Notes to C onso l ida ted F inanc ia l S t a tement s
82 C H A R T W EL L SEN IORS HOU S ING R E I T | F inanc ia l Repor t 201182 29
(b) Restricted Unit Plan:
Under the terms of the Restricted Unit Plan, qualified senior employees are granted notional Trust Units on an annual basis which will vest three years after the date of any grant and will be paid out in cash. The notional Trust Units earn additional notional Trust Units related to distributions that would otherwise have been paid if Trust Units had been issued on the date of the grant. The number of notional Trust Units issued in regard to distributions is based on the fair market value of the Trust Units, as defined by the plan, on the date distributions are paid. Restricted Units are recognized as compensation expense evenly over the vesting period, with the corresponding amount recorded as a liability on the consolidated balance sheets. The liability is adjusted to fair market value using the trading value of listed Trust Units at each reporting date.
The Restricted Unit Plan was amended, effective January 1, 2012, to provide that the amounts payable to certain participants on vesting will be determined based on the extent to which Chartwell has achieved certain AFFO targets over a three-year period. The amendments will be mandatory for the Chief Executive Officer, Chief Financial Officer and Chief Operating Officer of Chartwell, and certain senior executives of Chartwell will have the ability to opt-in and have the amendments apply to their Restricted Units (collectively, the "Applicable Participants"). Grants of Restricted Units to Applicable Participants will continue to vest on the vesting date.
During the year ended December 31, 2011, 62,701 Restricted Trust Units related to grants were issued, with 4,659 Units subsequently being cancelled, and 10,305 units were issued related to reinvested distributions.
(c) LTIP:
Chartwell's recourse on the LTIP receivable is limited to the Trust Units it holds as security. The limited recourse nature of the LTIP receivable effectively provides a participant with a put option as the participant may elect to not repay the receivable in full. The fair value of this option is measured using the Monte Carlo simulation method.
The following table summarizes the assumptions used to determine the fair value of the LTIP option component:
2011 2010
Expected volatility 18.0-23.0% 25.0-30.0% Risk free rate 1.2-2.2% 2.0-3.3% Distribution yield 5.1-6.2% 5.8-6.3%
13. Deferred consideration on business combinations: Included in deferred consideration on business combinations are the following:
December 31, December 31, January 1, Business combination 2011 2010 2010
Castel Royale $ 520 $ 520 $ 520 Elizabeth Towers – – 918 Heritage Glen 4,808 6,992 9,075 Merrill Gardens portfolio – – 3,079 $ 5,328 $ 7,512 $ 13,592
Current $ 5,328 $ 2,704 $ 3,710 Non-current – 4,808 9,882 $ 5,328 $ 7,512 $ 13,592

C H A R T W E L L SE N IORS HOU S ING R E I T | F inanc ia l Repor t 2011 83
Notes to C onso l ida ted F inanc ia l S t a tement s
30
The deferred purchase consideration on Castel Royale is payable upon conversion of the existing apartment units to retirement suites.
On November 1, 2011, Chartwell paid $2,500 in cash with respect to the Heritage Glen acquisition. The remaining balance is due on November 1, 2012.
14. Class B Units: Class B Units are exchangeable, at the option of the holder, into Trust Units. Such exchangeable instruments are presented as a liability under IFRS. The Trust has elected to designate Class B Units as FVTPL. Fair value is determined by using market prices for listed Trust Units since there is a one for one exchange feature for each Class B Unit into a Trust Unit. The market price of the Trust Units as at December 31, 2011 was $8.50 (December 31, 2010 - $8.18).
Holders of the Class B Units are entitled to receive distributions equal to those provided to holders of Trust Units. Under IFRS, these distributions are included in finance cost in profit or loss.
Units outstanding Amount
Balance, January 1, 2010 1,976,859 $ 13,897 Exchange of Class B Units into Trust Units (262,207) (2,239) Change in fair value – 2,369
Balance, December 31, 2010 1,714,652 14,027 Exchange of Class B Units into Trust Units (33,127) (272) Change in fair value – 537
Balance, December 31, 2011 1,681,525 $ 14,292
15. Unitholders' equity and LTIP: (a) Trust Units:
Chartwell is authorized to issue unlimited Trust Units.
Trust Units are redeemable at any time, in whole or in part, on demand by holders. Upon receipt of redemption notice by Chartwell, all rights to and under the Trust Units tendered for redemption shall be surrendered and the holder shall be entitled to receive a price per Trust Unit equal to the lesser of:
(i) 90% of the "market price" of the Units on the principal market on which the Units are quoted for trading during the 10-trading-day period ending immediately prior to the date on which the Units were surrendered for redemption; and
(ii) 100% of the "closing market price" on the principal market on which the Units are listed for trading on the redemption date.
The aggregate redemption price payable by Chartwell in respect of any Trust Units surrendered for redemption during any calendar month shall not exceed $50 unless waived at the discretion of the Trustees and satisfied by way of cash payment in Canadian dollars within 30 days after the end of the calendar month in which the Units were tendered for redemption. To the extent the redemption price payable in respect of Trust Units surrendered for redemption exceeds $50 in any given month, such excess will be satisfied by way of a distribution in species of assets held by Chartwell.
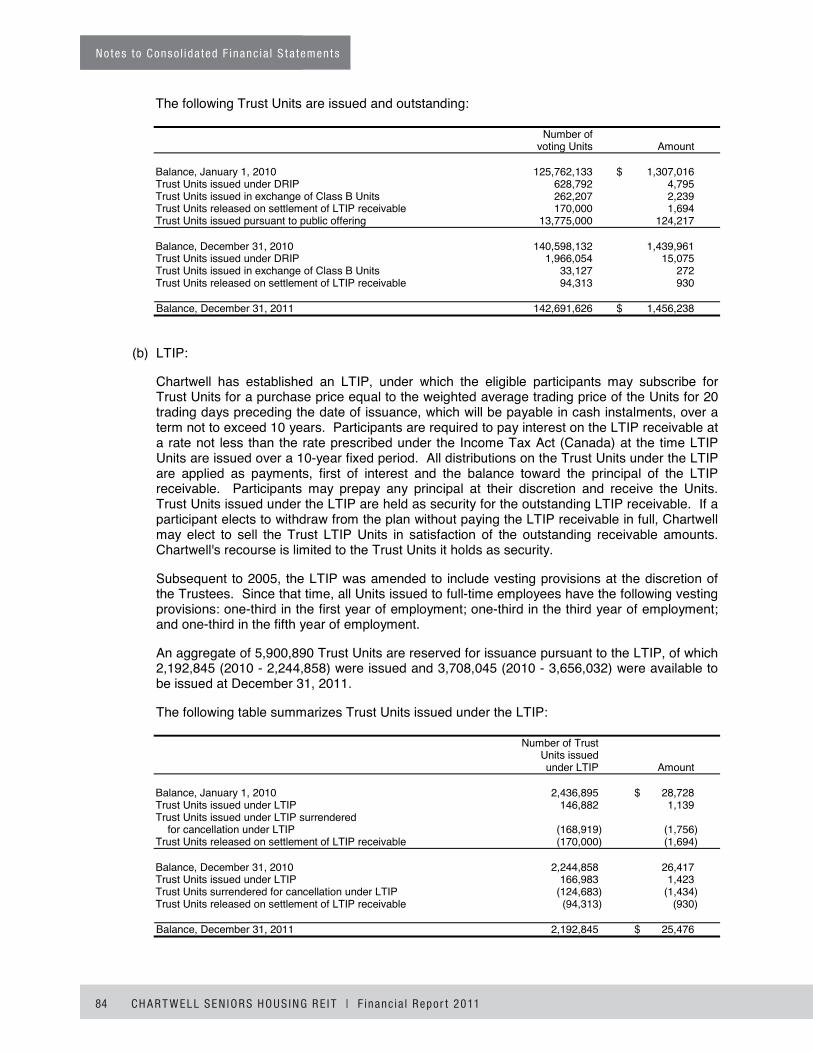
C H A R T W EL L SEN IORS HOU S ING R E I T | F inanc ia l Repor t 2011
Notes to C onso l ida ted F inanc ia l S t a tement s
84 C H A R T W EL L SEN IORS HOU S ING R E I T | F inanc ia l Repor t 201184 31
The following Trust Units are issued and outstanding:
Number of voting Units Amount
Balance, January 1, 2010 125,762,133 $ 1,307,016 Trust Units issued under DRIP 628,792 4,795 Trust Units issued in exchange of Class B Units 262,207 2,239 Trust Units released on settlement of LTIP receivable 170,000 1,694 Trust Units issued pursuant to public offering 13,775,000 124,217
Balance, December 31, 2010 140,598,132 1,439,961 Trust Units issued under DRIP 1,966,054 15,075 Trust Units issued in exchange of Class B Units 33,127 272 Trust Units released on settlement of LTIP receivable 94,313 930
Balance, December 31, 2011 142,691,626 $ 1,456,238
(b) LTIP:
Chartwell has established an LTIP, under which the eligible participants may subscribe for Trust Units for a purchase price equal to the weighted average trading price of the Units for 20 trading days preceding the date of issuance, which will be payable in cash instalments, over a term not to exceed 10 years. Participants are required to pay interest on the LTIP receivable at a rate not less than the rate prescribed under the Income Tax Act (Canada) at the time LTIP Units are issued over a 10-year fixed period. All distributions on the Trust Units under the LTIP are applied as payments, first of interest and the balance toward the principal of the LTIP receivable. Participants may prepay any principal at their discretion and receive the Units. Trust Units issued under the LTIP are held as security for the outstanding LTIP receivable. If a participant elects to withdraw from the plan without paying the LTIP receivable in full, Chartwell may elect to sell the Trust LTIP Units in satisfaction of the outstanding receivable amounts. Chartwell's recourse is limited to the Trust Units it holds as security.
Subsequent to 2005, the LTIP was amended to include vesting provisions at the discretion of the Trustees. Since that time, all Units issued to full-time employees have the following vesting provisions: one-third in the first year of employment; one-third in the third year of employment; and one-third in the fifth year of employment.
An aggregate of 5,900,890 Trust Units are reserved for issuance pursuant to the LTIP, of which 2,192,845 (2010 - 2,244,858) were issued and 3,708,045 (2010 - 3,656,032) were available to be issued at December 31, 2011.
The following table summarizes Trust Units issued under the LTIP:
Number of Trust Units issued under LTIP Amount
Balance, January 1, 2010 2,436,895 $ 28,728 Trust Units issued under LTIP 146,882 1,139 Trust Units issued under LTIP surrendered
for cancellation under LTIP (168,919) (1,756) Trust Units released on settlement of LTIP receivable (170,000) (1,694)
Balance, December 31, 2010 2,244,858 26,417 Trust Units issued under LTIP 166,983 1,423 Trust Units surrendered for cancellation under LTIP (124,683) (1,434) Trust Units released on settlement of LTIP receivable (94,313) (930)
Balance, December 31, 2011 2,192,845 $ 25,476
C H A R T W E L L SE N IORS HOU S ING R E I T | F inanc ia l Repor t 2011 85
Notes to C onso l ida ted F inanc ia l S t a tement s
32
The compensation expense attributable to the LTIP of $358 for the year ended December 31, 2011 (2010 - $314) is included in general, administrative and trust expenses with a corresponding amount included in accounts payable and other liabilities. The LTIP receivable is also recognized in Unitholders' equity. Distributions received on Trust Units issued under the LTIP are charged to Unitholders' equity while interest received on LTIP receivable is credited to distributions.
(c) DRIP:
Chartwell has established a DRIP for its unitholders, which allows participants to reinvest their monthly cash distributions in additional Trust Units at an effective discount of 3%.
16. Segmented information: Chartwell monitors and operates its Canadian Retirement, Canadian Long-Term Care and United States Operations separately. Subsequent to December 31, 2010, Chartwell has changed the composition of its reportable segments as management operations no longer satisfy the threshold of a reportable segment. Prior periods have been restated to accommodate this change.
The accounting policies of each of the segments are the same as those for Chartwell. Certain general, administrative and Trust expenses are managed centrally by Chartwell and are not allocable to reportable operating segments. Chartwell has no material intersegment revenue, transfers or expenses.

C H A R T W EL L SEN IORS HOU S ING R E I T | F inanc ia l Repor t 2011
Notes to C onso l ida ted F inanc ia l S t a tement s
86 C H A R T W EL L SEN IORS HOU S ING R E I T | F inanc ia l Repor t 201186 33
Canadian Canadian Long-Term United Retirement Care States Segment 2011 Operations Operations Operations Total Other Consolidated Revenue:
Resident $ 355,723 $ 200,221 $ 194,690 $ 750,634 $ – $ 750,634 Management and
other fees – – – – 3,137 3,137 Mezzanine loan interest – – – – 1,601 1,601 355,723 200,221 194,690 750,634 4,738 755,372
Expenses: Direct operating 227,874 174,622 129,636 532,132 – 532,132 General, administrative
and Trust – – – – 24,758 24,758 227,874 174,622 129,636 532,132 24,758 556,890
Income (loss) before the undernoted(1) 127,849 25,599 65,054 218,502 (20,020) 198,482
Finance costs (recovery): Contractual interest 43,159 13,965 37,624 94,748 5,941 100,689 Other 1,458 (1,689) 1,556 1,325 1,317 2,642 Property lease expense 126 269 2,025 2,420 – 2,420
Other expense (income): Interest – (3,480) – (3,480) (337) (3,817) Other (3,888) 1,514 5,583 3,209 – 3,209
Depreciation and amortization 98,539 9,064 64,437 172,040 1,359 173,399 Changes in fair value of
financial instruments and unrealized foreign exchange gains – – – – (2,932) (2,932)
139,394 19,643 111,225 270,262 5,348 275,610
Income (loss) before income taxes (11,545) 5,956 (46,171) (51,760) (25,368) (77,128)
Income tax benefit – – – – 13,797 13,797
Net income (loss) $ (11,545) $ 5,956 $ (46,171) $ (51,760) $ (11,571) $ (63,331)
Expenditures for non-current assets:
Acquisition - properties, land held for development,
limited life intangible assets, licenses and other
assets $ 23,590 $ – $ 175,884 $ 199,474 $ – $ 199,474 Capital additions 50,913 6,254 19,016 76,183 – 76,183
(1) Refers to income before finance costs, property lease expense, other income, depreciation of PP&E, amortization of intangible assets and changes in fair values of financial instruments and unrealized foreign exchange losses (gains).

C H A R T W E L L SE N IORS HOU S ING R E I T | F inanc ia l Repor t 2011 87
Notes to C onso l ida ted F inanc ia l S t a tement s
34
Canadian Canadian Long-Term United Retirement Care States Segment 2010 Operations Operations Operations Total Other Consolidated
Revenue: Resident $ 347,853 $ 176,562 $ 182,751 $ 707,166 $ – $ 707,166 Management and
other fees – – – – 4,675 4,675 Mezzanine loan interest – – – – 5,419 5,419 347,853 176,562 182,751 707,166 10,094 717,260
Expenses: Direct operating 223,389 152,851 120,285 496,525 – 496,525 General, administrative
and Trust – – – – 24,761 24,761 223,389 152,851 120,285 496,525 24,761 521,286
Income (loss) before the undernoted(1) 124,464 23,711 62,466 210,641 (14,667) 195,974
Finance costs (recovery): Contractual interest 43,834 12,403 40,096 96,333 8,950 105,283 Other 2,331 (1,203) 1,036 2,164 1,538 3,702 Property lease expense 126 197 2,004 2,327 – 2,327
Other income: Interest – (2,953) (125) (3,078) (1,462) (4,540) Other (1,794) (3,710) (4,417) (9,921) – (9,921)
Depreciation and amortization 97,769 8,806 55,876 162,451 668 163,119 Changes in fair value of financial
instruments and unrealized foreign exchange losses – – – – 4,346 4,346
142,266 13,540 94,470 250,276 14,040 264,316
Income (loss) before income taxes (17,802) 10,171 (32,004) (39,635) (28,707) (68,342)
Income tax benefit – – – – 6,394 6,394
Net income (loss) $ (17,802) $ 10,171 $ (32,004) $ (39,635) $ (22,313) $ (61,948) Expenditures for non-current
assets: Acquisition - properties,
land held for development, limited life intangible assets,
licenses and other assets $ 150,580 $ 95,621 $ 113,224 $ 359,425 $ – $ 359,425 Capital additions 22,520 11,376 6,807 40,703 – 40,703
(1) Refers to income before finance costs, property lease expense, other income, depreciation of PP&E, amortization of intangible assets and changes in fair values of financial instruments and unrealized foreign exchange losses (gains).

C H A R T W EL L SEN IORS HOU S ING R E I T | F inanc ia l Repor t 2011
Notes to C onso l ida ted F inanc ia l S t a tement s
88 C H A R T W EL L SEN IORS HOU S ING R E I T | F inanc ia l Repor t 201188 35
Canadian Canadian Long-Term United Retirement Care States Segment December 31, 2011 Operations Operations Operations Total Other Consolidated
Operating assets $ 1,417,988 $ 333,934 $ 928,801 $ 2,680,723 $ 25,798 $ 2,706,521
Operating liabilities $ 958,046 $ 243,848 $ 789,681 $ 1,991,575 $ 179,154 $ 2,170,729
Canadian Canadian Long-Term United Retirement Care States Segment December 31, 2010 Operations Operations Operations Total Other Consolidated
Operating assets $ 1,506,185 $ 334,104 $ 802,073 $ 2,642,362 $ 36,734 $ 2,679,096
Operating liabilities $ 947,029 $ 252,143 $ 630,393 $ 1,829,565 $ 191,032 $ 2,020,597
Canadian Canadian Long-Term United Retirement Care States Segment January 1, 2010 Operations Operations Operations Total Other Consolidated
Operating assets $ 1,459,761 $ 251,806 $ 773,070 $ 2,484,637 $ 172,352 $ 2,656,989
Operating liabilities $ 949,130 $ 180,933 $ 594,879 $ 1,724,942 $ 270,113 $ 1,995,055
17. Joint venture operations: At December 31, 2011, the Trust has an interest in a number of jointly controlled entities, which have been accounted for under the proportionate consolidation method. The following table presents Chartwell's ownership interests in the significant jointly controlled entities:
December 31, December 31, January 1, 2011 2010 2010
CSH-ING (CAD)(1) – – 50% CSH-INGRE LLC (US)(2) 50% 50% 50% Other Canadian joint ventures(3) various 50% 50%
(1) On June 1, 2010, Chartwell acquired it's partner's 50% interest and owns 100% in this joint venture, which owns eight long term care properties in Ontario.
(2) On May 14, 2010, Chartwell acquired it's partner's 50% interest and owns 100% in six properties located in Colorado and Texas. On November 1, 2011, Chartwell acquired it's partner's 50% interest and owns 100% in 15 properties located in various U.S. States. At December 31, 2011, this joint venture owns 100% interest in five properties located in New York State.
(3) Includes interests in six separate joint ventures at January 1, 2010, seven joint ventures as of December 31, 2010 and seven joint ventures at December 31, 2011. At December 31, 2011, Chartwell holds a 50% interest in six of these joint ventures and a 33% interest in one joint venture.

C H A R T W E L L SE N IORS HOU S ING R E I T | F inanc ia l Repor t 2011 89
Notes to C onso l ida ted F inanc ia l S t a tement s
36
The following is the summarized financial information in respect of the interests in these significant jointly controlled entities at Chartwell's share:
As at and for the year ended As at December 31, December 31, January 1, 2011 2010 2010
CSH-ING (CAD) $ – $ – $ 5,359 CSH-INGRE LLC (US) 2,726 9,542 2,493 Other Canadian joint ventures 1,620 1,049 1,614
Total current assets 4,346 10,591 9,466
CSH-ING (CAD) – – 83,657 CSH-INGRE LLC (US) 100,908 291,051 448,496 Other Canadian joint ventures 100,624 102,407 84,947
Total non-current assets 201,532 393,458 617,100
Total assets $ 205,878 $ 404,049 $ 626,566
CSH-ING (CAD) $ – $ – $ 7,366 CSH-INGRE LLC (US) 3,673 9,579 12,180 Other Canadian joint ventures 30,074 2,721 3,484
Total current liabilities 33,747 12,300 23,030
CSH-ING (CAD) – – 72,881 CSH-INGRE LLC (US) 99,821 232,035 329,151 Other Canadian joint ventures 42,140 70,898 56,521
Total non-current liabilities 141,961 302,933 458,553
Total liabilities $ 175,708 $ 315,233 $ 481,583
CSH-ING (CAD) $ – $ 18,621 CSH-INGRE LLC (US) 58,089 81,014 Other Canadian joint ventures 13,820 13,017
Total revenue $ 71,909 $ 112,652
CSH-ING (CAD) $ – $ 18,655 CSH-INGRE LLC (US) 71,094 88,938 Other Canadian joint ventures 15,874 14,038
Total expenses $ 86,968 $ 121,631
18. Significant subsidiaries: The following subsidiaries represent significant operations of the Trust:
Equity interest
CSH MasterCare LP 100% CSH Master Care USA Inc. 100% CSH-INGRE LLC 100%

C H A R T W EL L SEN IORS HOU S ING R E I T | F inanc ia l Repor t 2011
Notes to C onso l ida ted F inanc ia l S t a tement s
90 C H A R T W EL L SEN IORS HOU S ING R E I T | F inanc ia l Repor t 201190 37
19. Financial instruments and financial risk management: (a) Classification, carrying values and fair values of financial instruments:
The classification of financial instruments, not otherwise disclosed in these consolidated financial statements, as well as their carrying amounts and fair values, as shown in the consolidated balance sheets, are shown in the table below:
2011 2010 Carrying Fair Carrying Fair Note value value value value
Financial assets: Loans and receivables
recorded at amortized cost:
Mezzanine loans receivable 6 $ 9,653 $ 9,653 $ 20,803 $ 20,062
Capital funding receivable 8 59,120 61,206 62,596 61,908
Financial liabilities: Financial liabilities
recorded at amortized cost:
Mortgages payable 10(a) 1,876,266 2,035,575 1,729,839 1,797,605 Credit Facility 10(b) 53,000 53,000 51,000 51,000
Fair value represents management's estimates of the market value at a given point in time, which may not reflect fair value in the future. These calculations are subjective in nature, involve uncertainties and are a matter of significant judgment and, therefore, cannot be determined with precision. Changes in assumptions could significantly affect the estimates.
Basis for determining fair values:
The following summarizes the significant methods and assumptions used in estimating the fair values of financial instruments reflected in the table above:
(i) The fair value of mezzanine loans receivable is estimated by discounting expected future cash flows using discount rates that reflect current market conditions for instruments with similar terms and risks. The entire balance of mezzanine loans receivable is current and is expected to be collected during the year ended December 31, 2012. Due to the short-term nature of these loans carrying value approximates fair value.
(ii) The fair value of capital funding receivable is estimated by discounting the expected future cash flows using the yield of the applicable bonds issued by the Province of Ontario plus a risk premium. The capital funding receivable was discounted using a rate of 5.10%.
(iii) The fair value of mortgages payable is estimated by discounting the expected future cash flows using the rates currently prevailing for similar instruments of similar maturities. At December 31, 2011, the mortgages payable were discounted using rates between 1.75% and 4.74%.

C H A R T W E L L SE N IORS HOU S ING R E I T | F inanc ia l Repor t 2011 91
Notes to C onso l ida ted F inanc ia l S t a tement s
38
Fair value hierarchy:
The table below analyzes financial instruments carried at fair value categorized into one of the three hierarchy levels. Each level is based on the transparency of the inputs used to measure the fair values of assets and liabilities:
• Level 1 - inputs are unadjusted quoted prices of identical instruments in active markets;
• Level 2 - inputs other than quoted prices included in Level 1 that are observable for the asset or liability, either directly or indirectly; and
• Level 3 - one or more significant inputs used in a valuation technique are unobservable in determining fair values of the instruments.
Fair December 31, 2011 value Level 1 Level 2 Level 3
Financial liabilities: Financial liabilities
recorded at FVTPL $ 98,137 $ 94,406 $ – $ 3,731 Derivatives 917 – 917 – $ 99,054 $ 94,406 $ 917 $ 3,731
Fair December 31, 2010 value Level 1 Level 2 Level 3
Financial liabilities: Financial liabilities
recorded at FVTPL $ 97,980 $ 92,504 $ – $ 5,476 Derivatives 1,088 – 1,088 – $ 99,068 $ 92,504 $ 1,088 $ 5,476
Fair January 1, 2010 value Level 1 Level 2 Level 3
Financial liabilities: Financial liabilities
recorded at FVTPL $ 223,240 $ 219,464 $ – $ 3,776 Derivatives 1,441 – 1,441 – $ 224,681 $ 219,464 $ 1,441 $ 3,776
(b) Financial risk management objectives and policies:
In the normal course of business, Chartwell is exposed to risks of varying degrees of significance which could affect its ability to achieve its strategic objectives for Unitholder returns. Chartwell is exposed to financial risks that arise from the fluctuation of interest rates, the credit quality of its residents and borrowers pursuant to mezzanine loans, risks of changes in foreign exchange rates and rate regulation by provincial governments.
The Board of Trustees has overall responsibility for the establishment and oversight of the Trust's risk management framework. Management is responsible for developing and monitoring the Trust's risk management policies and reports regularly to the Board of Trustees on its activities.
There have been no significant changes to the Trust's risk management policies and strategies since December 31, 2010.
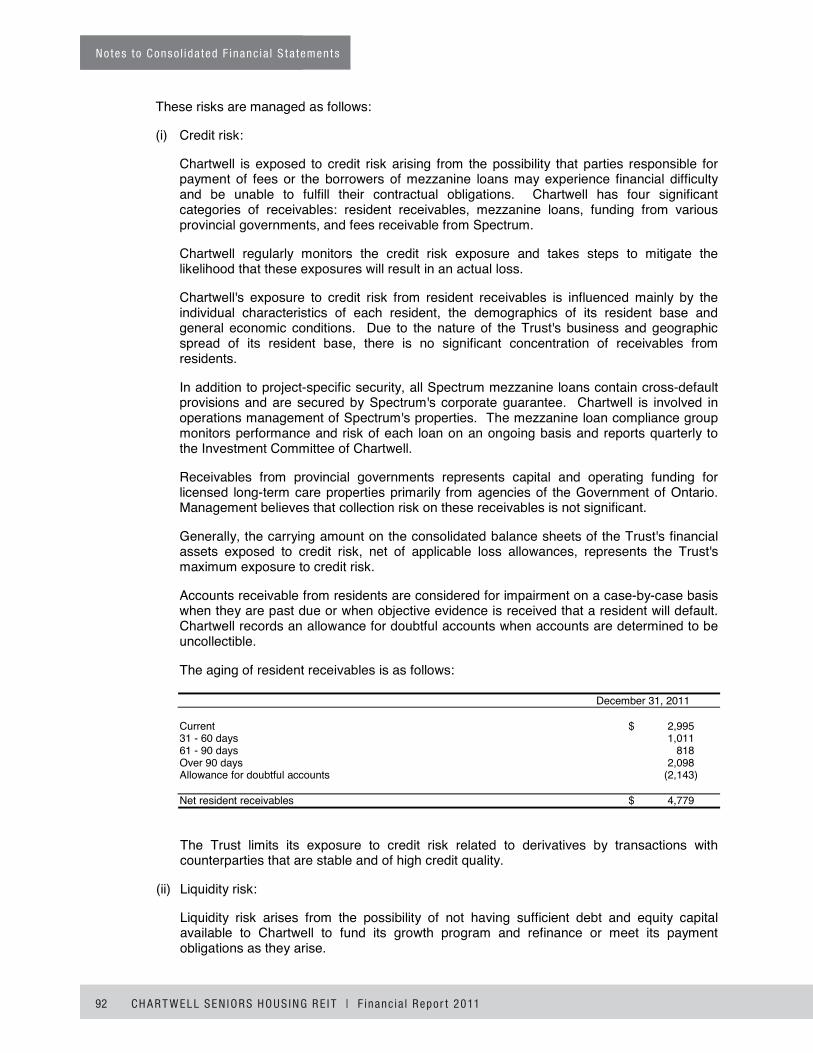
C H A R T W EL L SEN IORS HOU S ING R E I T | F inanc ia l Repor t 2011
Notes to C onso l ida ted F inanc ia l S t a tement s
92 C H A R T W EL L SEN IORS HOU S ING R E I T | F inanc ia l Repor t 20119239
These risks are managed as follows:
(i) Credit risk:
Chartwell is exposed to credit risk arising from the possibility that parties responsible for payment of fees or the borrowers of mezzanine loans may experience financial difficulty and be unable to fulfill their contractual obligations. Chartwell has four significant categories of receivables: resident receivables, mezzanine loans, funding from various provincial governments, and fees receivable from Spectrum.
Chartwell regularly monitors the credit risk exposure and takes steps to mitigate the likelihood that these exposures will result in an actual loss.
Chartwell's exposure to credit risk from resident receivables is influenced mainly by the individual characteristics of each resident, the demographics of its resident base and general economic conditions. Due to the nature of the Trust's business and geographic spread of its resident base, there is no significant concentration of receivables from residents.
In addition to project-specific security, all Spectrum mezzanine loans contain cross-default provisions and are secured by Spectrum's corporate guarantee. Chartwell is involved in operations management of Spectrum's properties. The mezzanine loan compliance group monitors performance and risk of each loan on an ongoing basis and reports quarterly to the Investment Committee of Chartwell.
Receivables from provincial governments represents capital and operating funding for licensed long-term care properties primarily from agencies of the Government of Ontario. Management believes that collection risk on these receivables is not significant.
Generally, the carrying amount on the consolidated balance sheets of the Trust's financial assets exposed to credit risk, net of applicable loss allowances, represents the Trust's maximum exposure to credit risk.
Accounts receivable from residents are considered for impairment on a case-by-case basis when they are past due or when objective evidence is received that a resident will default. Chartwell records an allowance for doubtful accounts when accounts are determined to be uncollectible.
The aging of resident receivables is as follows:
December 31, 2011
Current $ 2,995 31 - 60 days 1,011 61 - 90 days 818 Over 90 days 2,098 Allowance for doubtful accounts (2,143)
Net resident receivables $ 4,779
The Trust limits its exposure to credit risk related to derivatives by transactions with counterparties that are stable and of high credit quality.
(ii) Liquidity risk:
Liquidity risk arises from the possibility of not having sufficient debt and equity capital available to Chartwell to fund its growth program and refinance or meet its payment obligations as they arise.
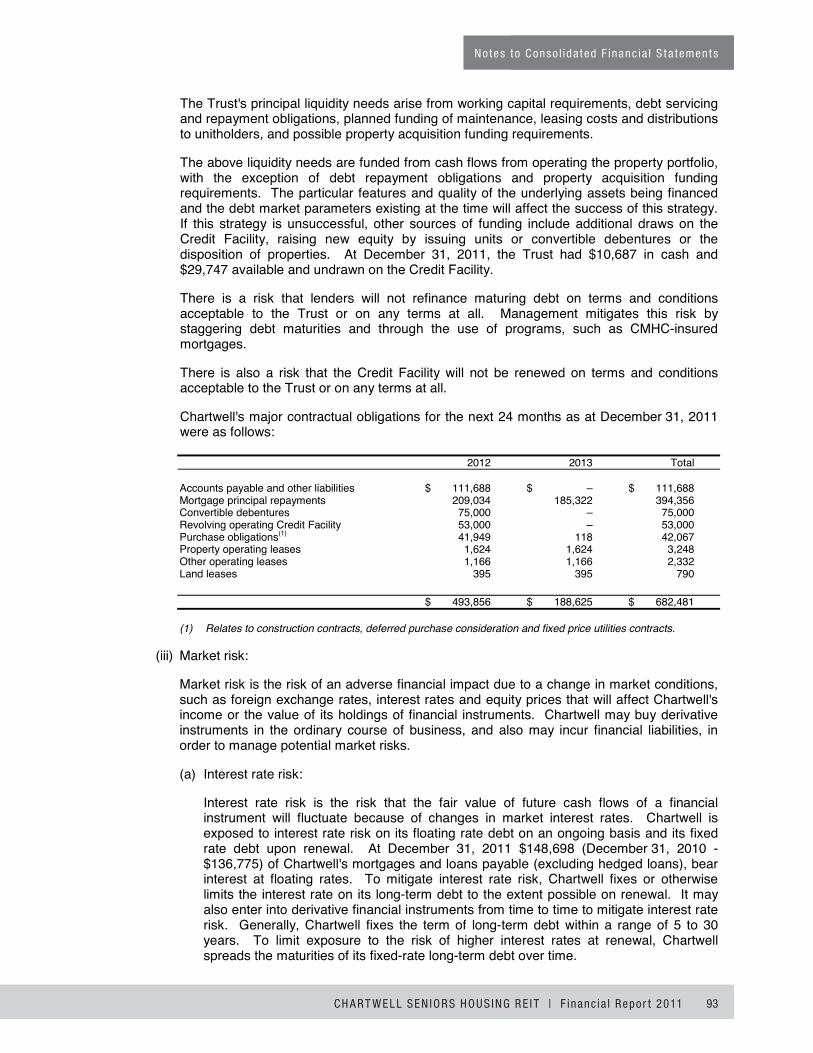
C H A R T W E L L SE N IORS HOU S ING R E I T | F inanc ia l Repor t 2011 93
Notes to C onso l ida ted F inanc ia l S t a tement s
40
The Trust's principal liquidity needs arise from working capital requirements, debt servicing and repayment obligations, planned funding of maintenance, leasing costs and distributions to unitholders, and possible property acquisition funding requirements.
The above liquidity needs are funded from cash flows from operating the property portfolio, with the exception of debt repayment obligations and property acquisition funding requirements. The particular features and quality of the underlying assets being financed and the debt market parameters existing at the time will affect the success of this strategy. If this strategy is unsuccessful, other sources of funding include additional draws on the Credit Facility, raising new equity by issuing units or convertible debentures or the disposition of properties. At December 31, 2011, the Trust had $10,687 in cash and $29,747 available and undrawn on the Credit Facility.
There is a risk that lenders will not refinance maturing debt on terms and conditions acceptable to the Trust or on any terms at all. Management mitigates this risk by staggering debt maturities and through the use of programs, such as CMHC-insured mortgages.
There is also a risk that the Credit Facility will not be renewed on terms and conditions acceptable to the Trust or on any terms at all.
Chartwell's major contractual obligations for the next 24 months as at December 31, 2011 were as follows:
2012 2013 Total
Accounts payable and other liabilities $ 111,688 $ – $ 111,688 Mortgage principal repayments 209,034 185,322 394,356 Convertible debentures 75,000 – 75,000 Revolving operating Credit Facility 53,000 – 53,000Purchase obligations(1) 41,949 118 42,067 Property operating leases 1,624 1,624 3,248 Other operating leases 1,166 1,166 2,332 Land leases 395 395 790
$ 493,856 $ 188,625 $ 682,481
(1) Relates to construction contracts, deferred purchase consideration and fixed price utilities contracts.
(iii) Market risk:
Market risk is the risk of an adverse financial impact due to a change in market conditions, such as foreign exchange rates, interest rates and equity prices that will affect Chartwell's income or the value of its holdings of financial instruments. Chartwell may buy derivative instruments in the ordinary course of business, and also may incur financial liabilities, in order to manage potential market risks.
(a) Interest rate risk:
Interest rate risk is the risk that the fair value of future cash flows of a financial instrument will fluctuate because of changes in market interest rates. Chartwell is exposed to interest rate risk on its floating rate debt on an ongoing basis and its fixed rate debt upon renewal. At December 31, 2011 $148,698 (December 31, 2010 - $136,775) of Chartwell's mortgages and loans payable (excluding hedged loans), bear interest at floating rates. To mitigate interest rate risk, Chartwell fixes or otherwise limits the interest rate on its long-term debt to the extent possible on renewal. It may also enter into derivative financial instruments from time to time to mitigate interest rate risk. Generally, Chartwell fixes the term of long-term debt within a range of 5 to 30 years. To limit exposure to the risk of higher interest rates at renewal, Chartwell spreads the maturities of its fixed-rate long-term debt over time.
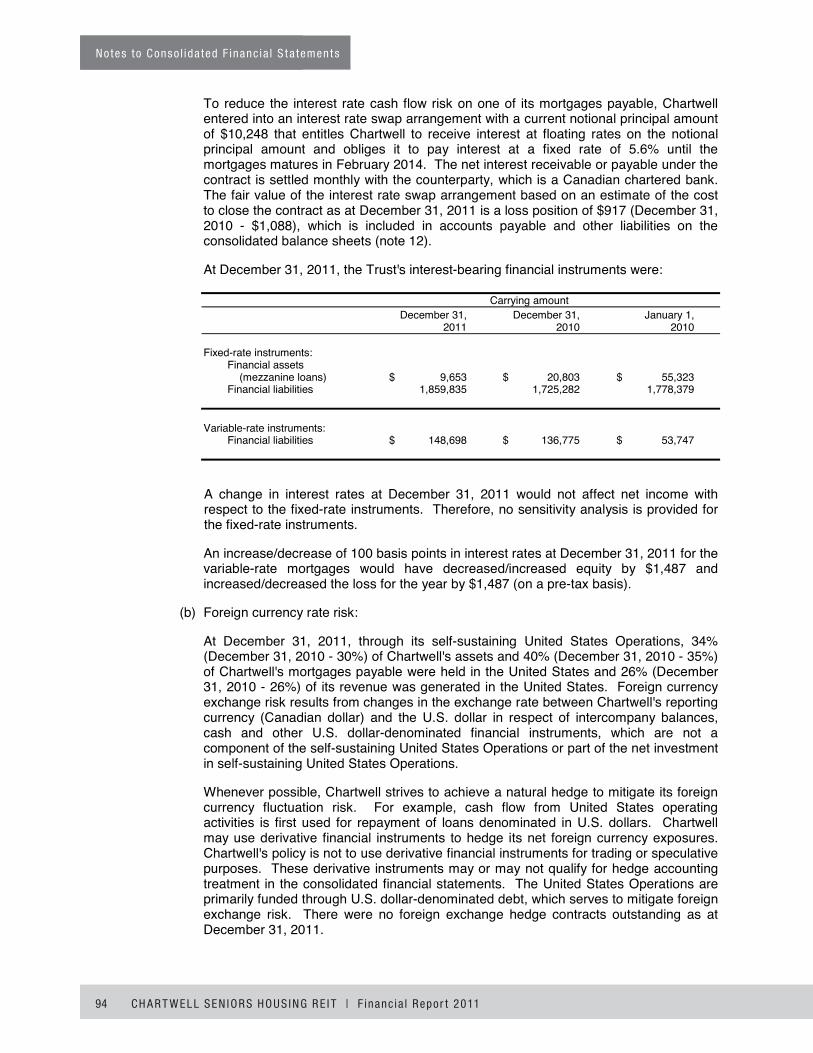
C H A R T W EL L SEN IORS HOU S ING R E I T | F inanc ia l Repor t 2011
Notes to C onso l ida ted F inanc ia l S t a tement s
94 C H A R T W EL L SEN IORS HOU S ING R E I T | F inanc ia l Repor t 201194 41
To reduce the interest rate cash flow risk on one of its mortgages payable, Chartwell entered into an interest rate swap arrangement with a current notional principal amount of $10,248 that entitles Chartwell to receive interest at floating rates on the notional principal amount and obliges it to pay interest at a fixed rate of 5.6% until the mortgages matures in February 2014. The net interest receivable or payable under the contract is settled monthly with the counterparty, which is a Canadian chartered bank. The fair value of the interest rate swap arrangement based on an estimate of the cost to close the contract as at December 31, 2011 is a loss position of $917 (December 31, 2010 - $1,088), which is included in accounts payable and other liabilities on the consolidated balance sheets (note 12).
At December 31, 2011, the Trust's interest-bearing financial instruments were:
Carrying amount December 31, December 31, January 1, 2011 2010 2010
Fixed-rate instruments: Financial assets
(mezzanine loans) $ 9,653 $ 20,803 $ 55,323 Financial liabilities 1,859,835 1,725,282 1,778,379
Variable-rate instruments: Financial liabilities $ 148,698 $ 136,775 $ 53,747
A change in interest rates at December 31, 2011 would not affect net income with respect to the fixed-rate instruments. Therefore, no sensitivity analysis is provided for the fixed-rate instruments.
An increase/decrease of 100 basis points in interest rates at December 31, 2011 for the variable-rate mortgages would have decreased/increased equity by $1,487 and increased/decreased the loss for the year by $1,487 (on a pre-tax basis).
(b) Foreign currency rate risk:
At December 31, 2011, through its self-sustaining United States Operations, 34% (December 31, 2010 - 30%) of Chartwell's assets and 40% (December 31, 2010 - 35%) of Chartwell's mortgages payable were held in the United States and 26% (December 31, 2010 - 26%) of its revenue was generated in the United States. Foreign currency exchange risk results from changes in the exchange rate between Chartwell's reporting currency (Canadian dollar) and the U.S. dollar in respect of intercompany balances, cash and other U.S. dollar-denominated financial instruments, which are not a component of the self-sustaining United States Operations or part of the net investment in self-sustaining United States Operations.
Whenever possible, Chartwell strives to achieve a natural hedge to mitigate its foreign currency fluctuation risk. For example, cash flow from United States operating activities is first used for repayment of loans denominated in U.S. dollars. Chartwell may use derivative financial instruments to hedge its net foreign currency exposures. Chartwell's policy is not to use derivative financial instruments for trading or speculative purposes. These derivative instruments may or may not qualify for hedge accounting treatment in the consolidated financial statements. The United States Operations are primarily funded through U.S. dollar-denominated debt, which serves to mitigate foreign exchange risk. There were no foreign exchange hedge contracts outstanding as at December 31, 2011.
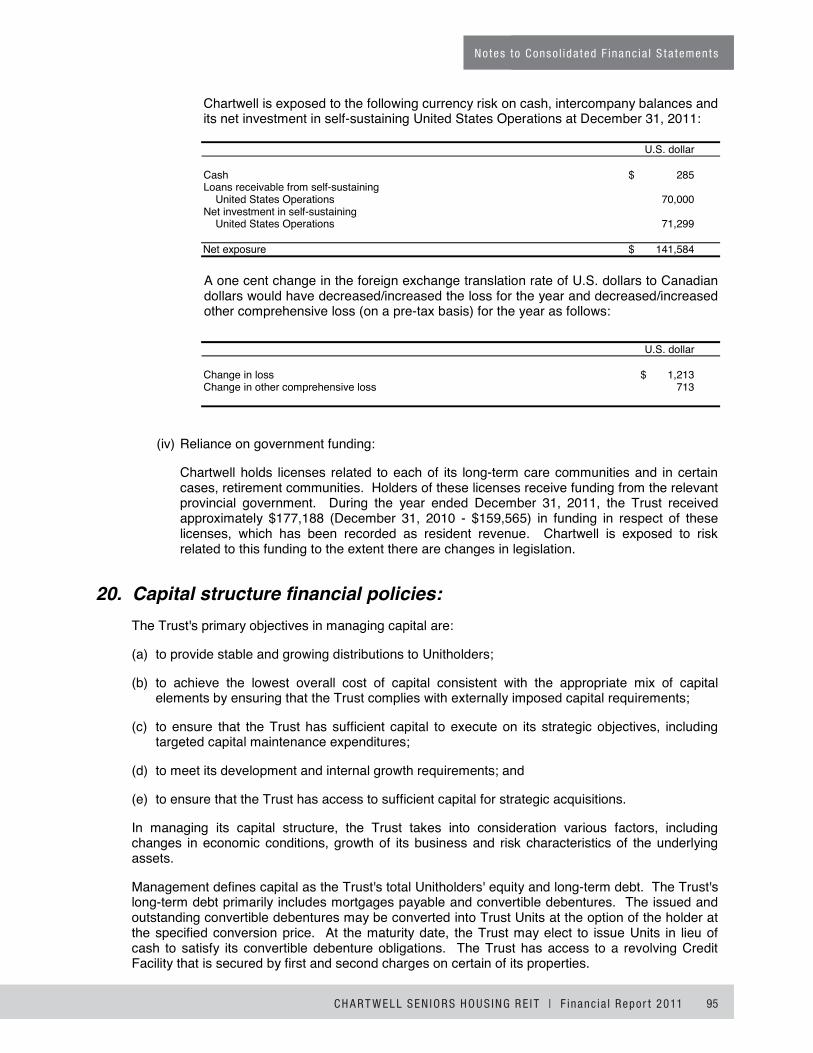
C H A R T W E L L SE N IORS HOU S ING R E I T | F inanc ia l Repor t 2011 95
Notes to C onso l ida ted F inanc ia l S t a tement s
42
Chartwell is exposed to the following currency risk on cash, intercompany balances and its net investment in self-sustaining United States Operations at December 31, 2011:
U.S. dollar
Cash $ 285 Loans receivable from self-sustaining
United States Operations 70,000 Net investment in self-sustaining
United States Operations 71,299
Net exposure $ 141,584
A one cent change in the foreign exchange translation rate of U.S. dollars to Canadian dollars would have decreased/increased the loss for the year and decreased/increased other comprehensive loss (on a pre-tax basis) for the year as follows:
U.S. dollar
Change in loss $ 1,213 Change in other comprehensive loss 713
(iv) Reliance on government funding:
Chartwell holds licenses related to each of its long-term care communities and in certain cases, retirement communities. Holders of these licenses receive funding from the relevant provincial government. During the year ended December 31, 2011, the Trust received approximately $177,188 (December 31, 2010 - $159,565) in funding in respect of these licenses, which has been recorded as resident revenue. Chartwell is exposed to risk related to this funding to the extent there are changes in legislation.
20. Capital structure financial policies: The Trust's primary objectives in managing capital are:
(a) to provide stable and growing distributions to Unitholders;
(b) to achieve the lowest overall cost of capital consistent with the appropriate mix of capital elements by ensuring that the Trust complies with externally imposed capital requirements;
(c) to ensure that the Trust has sufficient capital to execute on its strategic objectives, including targeted capital maintenance expenditures;
(d) to meet its development and internal growth requirements; and
(e) to ensure that the Trust has access to sufficient capital for strategic acquisitions.
In managing its capital structure, the Trust takes into consideration various factors, including changes in economic conditions, growth of its business and risk characteristics of the underlying assets.
Management defines capital as the Trust's total Unitholders' equity and long-term debt. The Trust's long-term debt primarily includes mortgages payable and convertible debentures. The issued and outstanding convertible debentures may be converted into Trust Units at the option of the holder at the specified conversion price. At the maturity date, the Trust may elect to issue Units in lieu of cash to satisfy its convertible debenture obligations. The Trust has access to a revolving Credit Facility that is secured by first and second charges on certain of its properties.

C H A R T W EL L SEN IORS HOU S ING R E I T | F inanc ia l Repor t 2011
Notes to C onso l ida ted F inanc ia l S t a tement s
96 C H A R T W EL L SEN IORS HOU S ING R E I T | F inanc ia l Repor t 201196 43
The Board of Trustees is responsible for overseeing the Trust's capital management and does so through quarterly Trustees' meetings, review of financial information and regular communication with officers and senior management of the Trust. The Board of Trustees also reviews the level of any distributions that should be made.
In order to maintain or adjust the capital structure, the Trust may issue new Units, buy back Units, issue new debt or issue new debt to replace existing debt with different characteristics, adjust the amount of distributions paid to Unitholders or by undertaking other activities as deemed appropriate under specific circumstances.
The Trust monitors capital based on the debt to adjusted gross book value ("GBV") ratio. It also monitors its interest coverage ratio. Chartwell's Declaration of Trust limits the amount of indebtedness that the Trust can incur to 60% of GBV excluding convertible debentures, or 65% of GBV including convertible debentures.
The Trust's strategy for capital management is driven by policies stated under the Declaration of Trust and external requirements from certain of its lenders. There have been no changes in the Trust's capital management strategy during the year.
The following are the debt leverage ratios at December 31, 2011 and 2010:
Increase 2011 2010 (decrease)
Debt to GBV, excluding convertible debentures 57.0% 55.3% 1.7pp
Debt to GBV, including convertible debentures 59.3% 57.7% 1.6pp
Interest coverage ratio 1.91x 1.81x 0.10x
pp = percentage points
Debt includes any obligation for borrowed money, any obligation incurred in connection with the acquisition of property, assets or business, other than deferred income tax liability, any capital lease obligation and any guaranteed obligations of third parties to the extent included in the consolidated balance sheets. Debt is determined on a consolidated basis for the Trust and its consolidated subsidiaries.
GBV means, at any time, the consolidated book value of the assets of the Trust, as shown on the Trust's most recent consolidated balance sheets (or if approved by a majority of the Independent Directors of the General Partner at any time, the appraised value thereof), plus the amount of accumulated depreciation and amortization shown thereon or in the notes thereto less the carrying value of any deferred consideration on business combinations in the notes thereto, plus the difference between the GBV of assets under CGAAP and IFRS at January 1, 2010, Chartwell's effective transition date ("Transition Date"), and the related costs in respect of completed property acquisitions that were expensed in the period incurred.
The debt to GBV ratio at December 31, 2011 increased primarily due to the acquisition of the ING portfolio on November 1, 2011.

C H A R T W E L L SE N IORS HOU S ING R E I T | F inanc ia l Repor t 2011 97
Notes to C onso l ida ted F inanc ia l S t a tement s
44
21. Personnel expenses: The analysis of employee benefits expense for the year ended December 31, 2011, included in the statements of comprehensive income (loss) under direct operating expenses and general, administration and Trust expenses, are as follows:
2011 2010
Salaries and wages $ 355,531 $ 330,506 Post-employment benefits
(defined contribution plans) 4,029 3,423 Unit-based compensation 1,993 1,193
$ 361,553 $ 335,122
22. Other expense (income):
2011 2010
Gain recorded on remeasurement of previously held equity interest on acquisition $ (3,595) $ (9,639)
Bargain purchase gain on acquisition – (4,428) (Gain) loss on disposal of assets (7,556) 851 Interest income on loans and receivables (3,817) (4,540) Other income (14,968) (17,756)
Impairment of PP&E 13,080 – Transaction costs arising on
business acquisitions 1,280 3,295 Other expense 14,360 3,295
Other expense (income) $ (608) $ (14,461)
Gain recorded on remeasurement of previously held equity interest on acquisition relates to Chartwell's step acquisitions of one property in British Columbia in May 2011 and the 15 properties in the United States in November 2011 and The Meridian and The Regency portfolios in 2010.
Included in the gain on disposal of assets are:
(a) $1,848 on divestiture of Chartwell's interests in HBC and HBCII (note 5); and
(b) $5,926 on disposal of Canadian retirement community (note 4).
On November 1, 2011, Chartwell acquired the remaining 50% interest in a 15-property portfolio in the United States from ING at a purchase price that was lower than the carrying value of the existing 50% interest. As a result, during the year ended December 31, 2011, Chartwell recorded an impairment provision of $8,500. Also in the year ended December 31, 2011, Chartwell recorded an impairment of $4,580 for two properties whose estimated recoverable amount exceeded their carrying value and for some development costs for projects that are not proceeding at this time.
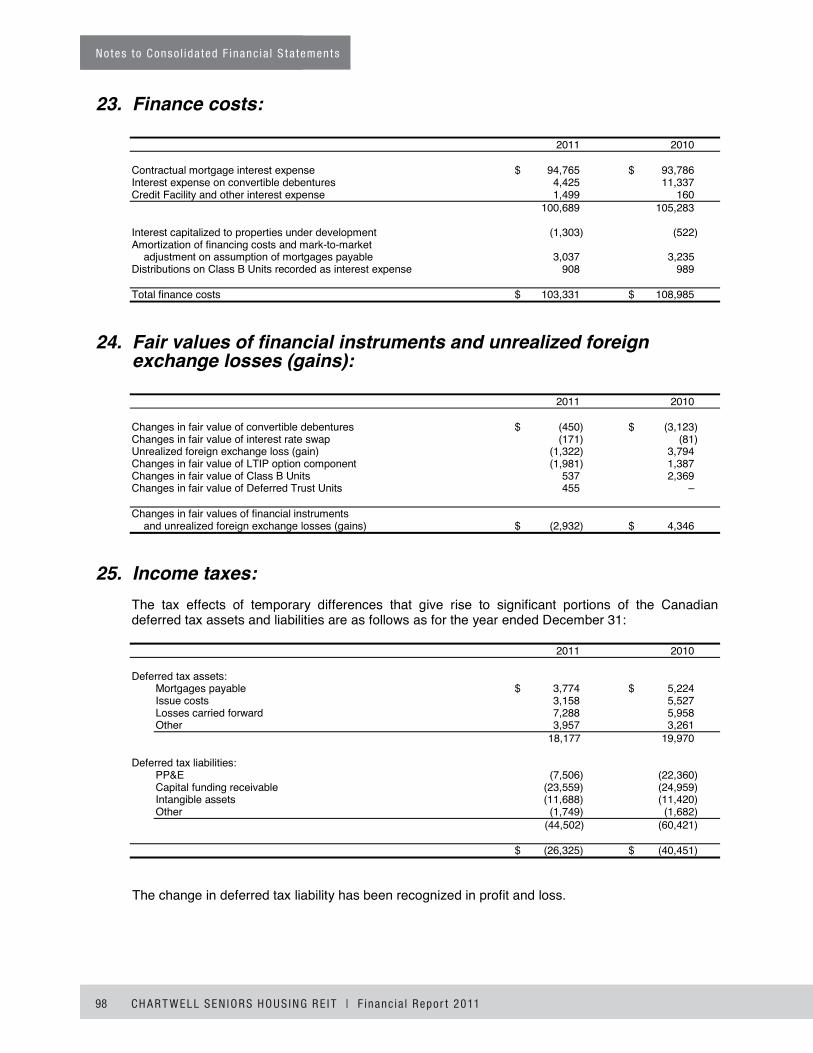
C H A R T W EL L SEN IORS HOU S ING R E I T | F inanc ia l Repor t 2011
Notes to C onso l ida ted F inanc ia l S t a tement s
98 C H A R T W EL L SEN IORS HOU S ING R E I T | F inanc ia l Repor t 201198 45
23. Finance costs:
2011 2010
Contractual mortgage interest expense $ 94,765 $ 93,786 Interest expense on convertible debentures 4,425 11,337 Credit Facility and other interest expense 1,499 160 100,689 105,283
Interest capitalized to properties under development (1,303) (522) Amortization of financing costs and mark-to-market
adjustment on assumption of mortgages payable 3,037 3,235 Distributions on Class B Units recorded as interest expense 908 989
Total finance costs $ 103,331 $ 108,985
24. Fair values of financial instruments and unrealized foreign exchange losses (gains):
2011 2010
Changes in fair value of convertible debentures $ (450) $ (3,123) Changes in fair value of interest rate swap (171) (81) Unrealized foreign exchange loss (gain) (1,322) 3,794 Changes in fair value of LTIP option component (1,981) 1,387 Changes in fair value of Class B Units 537 2,369 Changes in fair value of Deferred Trust Units 455 –
Changes in fair values of financial instruments and unrealized foreign exchange losses (gains) $ (2,932) $ 4,346
25. Income taxes: The tax effects of temporary differences that give rise to significant portions of the Canadian deferred tax assets and liabilities are as follows as for the year ended December 31:
2011 2010
Deferred tax assets: Mortgages payable $ 3,774 $ 5,224 Issue costs 3,158 5,527 Losses carried forward 7,288 5,958 Other 3,957 3,261 18,177 19,970
Deferred tax liabilities: PP&E (7,506) (22,360) Capital funding receivable (23,559) (24,959) Intangible assets (11,688) (11,420) Other (1,749) (1,682) (44,502) (60,421)
$ (26,325) $ (40,451)
The change in deferred tax liability has been recognized in profit and loss.

C H A R T W E L L SE N IORS HOU S ING R E I T | F inanc ia l Repor t 2011 99
Notes to C onso l ida ted F inanc ia l S t a tement s
46
Chartwell has certain subsidiaries in the United States that are subject to tax on their taxable income at a rate of approximately 38%. Deferred tax assets have not been recognized for these subsidiaries in respect of the following items:
2011 2010
Deductible temporary differences $ 92,903 $ 85,607 Net operating losses 73,700 53,921 Capital losses 26,597 –
Total $ 193,200 $ 139,528
Net operating losses will expire between 2025 and 2031 and capital losses expire in 2016. The deductible temporary differences do not expire under current tax legislation. Deferred tax assets have not been recognized in respect of these items because it is not probable that future taxable profit will be available against which these U.S. corporate subsidiaries can utilize these tax benefits.
The provision for income taxes in the consolidated statements of comprehensive loss represents an effective tax rate different than the Canadian SIFT tax rate of 46.41% (2010 - 46.41%) The differences for the years ended December 31 are as follows:
2011 2010
Loss before income taxes $ (77,128) $ (68,342)
Income tax recovery at Canadian SIFT tax rates $ (35,795) $ (31,717) Effect of permanent differences 301 724 Tax benefits not recognized 18,961 15,882 International income tax rate differences 4,285 1,497 Prior period adjustments (1,565) 7,280 Other 16 (60)
$ (13,797) $ (6,394)
26. Commitments and contingencies: (a) Non-cancellable operating lease rentals are payable as follows:
(i) Chartwell has leasehold interests in two properties acquired with the Merrill Gardens portfolio. The terms of these leases expire on December 31, 2017 and the leases have one renewal option for 10 years each. Minimum lease payments under these leases are $1,624 (U.S. $1,597) per annum and a total of $9,746 (U.S. $9,583) for the remaining term of the leases.
The lease provides Chartwell with the option to purchase the two properties at the end of the original lease term or at the end of the extension based on a formula contained in the lease.
(ii) Chartwell owns one property in Alberta, Canada subject to a land lease. This lease expires on July 17, 2061 with annual payments of $126.
(iii) Pursuant to the Regency Care Portfolio acquisition, the Trust assumed one land lease expiring August 31, 2044 with annual payments of $113 through to August 31, 2024 and $136 for the remainder of the term, and one land lease expiring May 31, 2048 with annual payments of $156, negotiated to market every 15 years thereafter.

C H A R T W EL L SEN IORS HOU S ING R E I T | F inanc ia l Repor t 2011
Notes to C onso l ida ted F inanc ia l S t a tement s
100 C H A R T W EL L SEN IORS HOU S ING R E I T | F inanc ia l Repor t 2011100 47
(iv) In addition, Chartwell has operating leases on office space in Canada that expire on various dates up to April 30, 2016. Annual payments in aggregate on these leases vary from $583 to $1,166 over the remaining term of the leases.
For the above leases, legal title does not pass to Chartwell, the rent paid is increased to market rent at regular intervals, and for the property leases, the option to purchase the properties is not at a bargain price. Chartwell has determined that substantially all of the risks and rewards incidental to ownership are still with the lessor and, as such, these leases are operating leases.
(b) Purchase obligations:
Chartwell has entered into various construction contracts related to various development and asset improvement projects. As at December 31, 2011, the remaining commitments under these contracts amounted to approximately $35,789.
Chartwell has also entered in fixed price electricity and natural gas contracts with local utilities in the United States for $758 (U.S. $746) for its own use at its properties.
(c) Letters of credit:
As at December 31, 2011, Chartwell was contingently liable for letters of credit in the amount of $2,263 (December 31, 2010 - $2,348).
(d) Other contracts:
On September 1, 2011, Chartwell transferred the management of 45 communities in the United States to Brookdale Senior Living ("Brookdale") as a result of Brookdale's acquisition of Horizon Bay Realty LLC ("HBR"). Under the new agreements, the average terms of the management contracts have been reduced to approximately 10 years, with a new maturity date of December 31, 2021. The base management fee for the properties under contract is 5% of gross revenue. The new contracts include an incentive fee mechanism whereby Brookdale can earn an additional fee of up to 2% of gross revenue upon the achievement of specified annual operating targets. Management fees may also be reduced by up to 1% if such annual operating targets are not achieved.
(e) Litigation and claims:
In the ordinary course of business activities, Chartwell may be contingently liable for litigation and claims from, among others, residents, partners and former employees. Management believes that adequate provisions have been recorded in the accounts, where required. Although it is not possible to accurately estimate the extent of potential costs and losses, if any, management believes, but can provide no assurance, that the ultimate resolution of such contingencies would not have a material adverse effect on the financial position of Chartwell.
27. Guarantees: Chartwell and its joint venture partners have jointly and severally guaranteed CMHC-insured loans on three properties to a maximum amount of $52,315.
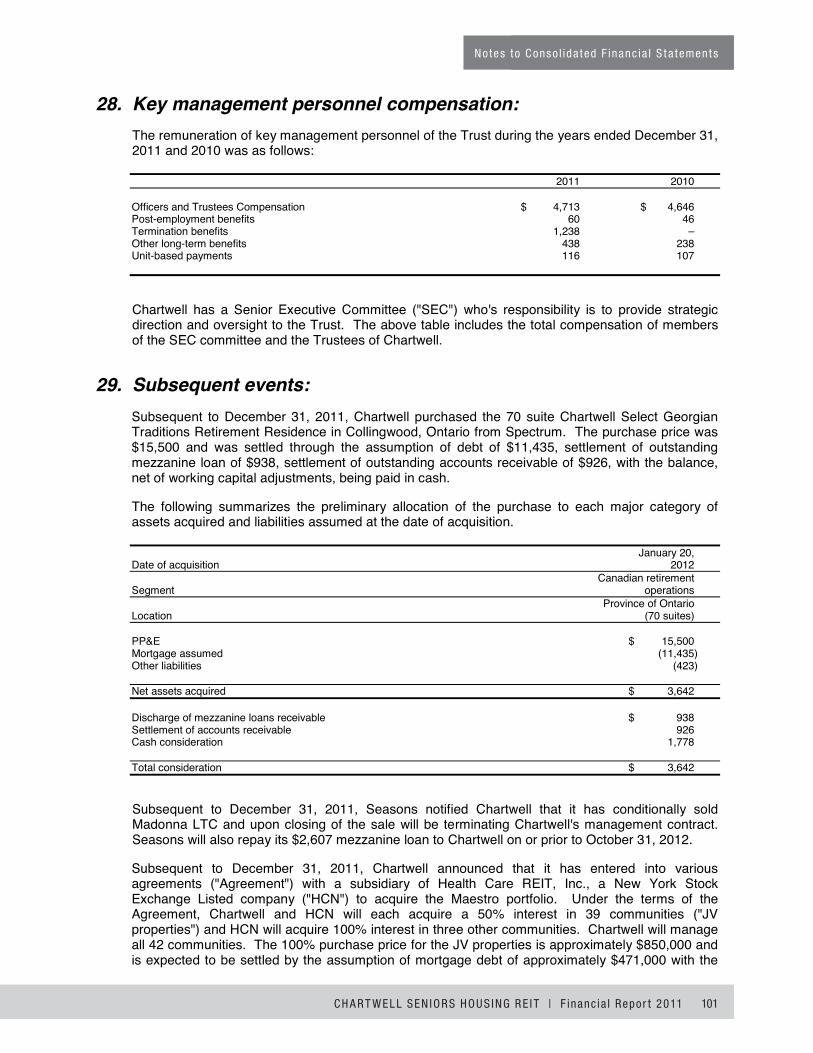
C H A R T W E L L SE N IORS HOU S ING R E I T | F inanc ia l Repor t 2011 101
Notes to C onso l ida ted F inanc ia l S t a tement s
48
28. Key management personnel compensation: The remuneration of key management personnel of the Trust during the years ended December 31, 2011 and 2010 was as follows:
2011 2010
Officers and Trustees Compensation $ 4,713 $ 4,646 Post-employment benefits 60 46 Termination benefits 1,238 – Other long-term benefits 438 238 Unit-based payments 116 107
Chartwell has a Senior Executive Committee ("SEC") who's responsibility is to provide strategic direction and oversight to the Trust. The above table includes the total compensation of members of the SEC committee and the Trustees of Chartwell.
29. Subsequent events: Subsequent to December 31, 2011, Chartwell purchased the 70 suite Chartwell Select Georgian Traditions Retirement Residence in Collingwood, Ontario from Spectrum. The purchase price was $15,500 and was settled through the assumption of debt of $11,435, settlement of outstanding mezzanine loan of $938, settlement of outstanding accounts receivable of $926, with the balance, net of working capital adjustments, being paid in cash.
The following summarizes the preliminary allocation of the purchase to each major category of assets acquired and liabilities assumed at the date of acquisition.
January 20, Date of acquisition 2012 Canadian retirement Segment operations Province of Ontario Location (70 suites)
PP&E $ 15,500 Mortgage assumed (11,435) Other liabilities (423)
Net assets acquired $ 3,642
Discharge of mezzanine loans receivable $ 938 Settlement of accounts receivable 926 Cash consideration 1,778
Total consideration $ 3,642
Subsequent to December 31, 2011, Seasons notified Chartwell that it has conditionally sold Madonna LTC and upon closing of the sale will be terminating Chartwell's management contract. Seasons will also repay its $2,607 mezzanine loan to Chartwell on or prior to October 31, 2012.
Subsequent to December 31, 2011, Chartwell announced that it has entered into various agreements ("Agreement") with a subsidiary of Health Care REIT, Inc., a New York Stock Exchange Listed company ("HCN") to acquire the Maestro portfolio. Under the terms of the Agreement, Chartwell and HCN will each acquire a 50% interest in 39 communities ("JV properties") and HCN will acquire 100% interest in three other communities. Chartwell will manage all 42 communities. The 100% purchase price for the JV properties is approximately $850,000 and is expected to be settled by the assumption of mortgage debt of approximately $471,000 with the

C H A R T W EL L SEN IORS HOU S ING R E I T | F inanc ia l Repor t 2011
Notes to C onso l ida ted F inanc ia l S t a tement s
102 C H A R T W EL L SEN IORS HOU S ING R E I T | F inanc ia l Repor t 2011102 49
balance in cash. Chartwell estimates that closing costs for these acquisitions to be approximately $22,000.
Chartwell also announced that it entered into an underwriting agreement with a syndicate of underwriters to issue to the public in Canada, subject to regulatory approval, on a bought deal basis, 23,175,000 of subscription receipts at $8.20 per subscription receipt, representing $190,035 of gross proceeds. Each subscription receipt represents the right to receive one Trust Unit of Chartwell at no additional cost and without further action. Chartwell also agreed to issue $120,000 aggregate principal amount of 5.7% convertible unsecured subordinated debentures ("Debentures"). The maturity date of the Debentures will be on March 31, 2018. The Debentures will be convertible at the option of the holder in certain circumstances into Trust Units at a price of $11.00 per Trust Unit. A portion of the proceeds from the new debentures will be used to redeem the existing $75,000, 5.9% convertible debentures.
Chartwell has granted to the underwriters an over-allotment option exercisable at any time up to 30 days after closing of the offering, to acquire up to 1,738,125 additional subscription receipts, representing 7.5% of the subscription receipts offering (or, in certain circumstances, units) and up to $15 million of debentures at the same offering price and the same offering terms, respectively.
30. Explanation of transition to IFRS: As of January 1, 2011, the Trust has adopted IFRS. Prior to January 1, 2011, the Trust prepared its financial statements in accordance with CGAAP.
In preparing its opening IFRS balance sheet as at January 1, 2010 (the "transition date") and comparative consolidated financial statements for 2010, the Trust has adjusted amounts reported previously in financial statements prepared in accordance with CGAAP.
The reconciliation of equity between CGAAP to IFRS as at January 1, 2010 and December 31, 2010 and the reconciliation of loss for the year and comprehensive income (loss) for the year ended December 31, 2010 as reported in the consolidated financial statements for the periods ended March 31, 2011 and 2010 has been restated below to reflect changes in the valuation methodology used to determine the LTIP liability.

C H A R T W E L L SE N IORS HOU S ING R E I T | F inanc ia l Repor t 2011 103
Notes to C onso l ida ted F inanc ia l S t a tement s
50
An explanation of how the transition from CGAAP to IFRS has affected the Trust's financial position, financial performance and cash flows is set out in the following tables and notes that accompany the tables:
(a) The following is a reconciliation of the Trust's total equity reported in accordance with CGAAP to its total equity in accordance with IFRS as at January 1, 2010:
CGAAP, IFRS January 1, January 1, Note 30(d) 2010 Reclassifications(1) Adjustments(2) 2010
Assets Current assets:
Cash and cash equivalents $ 106,943 $ – $ – $ 106,943 Trade and other receivables 51,366 (30,583) – 20,783 Mezzanine loans receivable – 28,589 – 28,589 Capital funding receivable – 2,293 – 2,293 Other assets – 24,524 – 24,524 Total current assets 158,309 24,823 – 183,132
Non-current assets: Other assets – 6,059 – 6,059 Mezzanine loans receivable 55,323 (28,589) – 26,734 Capital funding receivable 43,824 (2,293) – 41,531 Intangible assets (iii) 32,047 25,650 (20,013) 37,684 Licenses 25,650 (25,650) – – PP&E (i), (iii) 2,283,521 – 78,328 2,361,849 Total non-current assets 2,440,365 (24,823) 58,315 2,473,857
Total assets $ 2,598,674 $ – $ 58,315 $ 2,656,989
Liabilities and Unitholders' Equity Current liabilities:
Accounts payable and other liabilities (vii) $ 81,367 $ (1,083) $ 4,420 $ 84,704 Distributions payable 5,857 – – 5,857 Mortgages payable – 127,979 – 127,979 Deferred consideration on
business combinations – 3,710 – 3,710 Total current liabilities 87,224 130,606 4,420 222,250
Non-current liabilities: Mortgages payable 1,625,281 (127,979) – 1,497,302Employee benefits (v) – 1,083 (202) 881 Deferred consideration on
business combinations 13,592 (3,710) – 9,882 Convertible debentures (viii) 188,996 – 15,927 204,923 Class B Units (ix) – – 13,897 13,897 Deferred tax liabilities (xi) 18,167 – 27,753 45,920 Total non-current liabilities 1,846,036 (130,606) 57,375 1,772,805
Total liabilities 1,933,260 – 61,795 1,995,055 Non-controlling interests (ix) 7,813 – (7,813) – Unitholders' equity 657,601 – 4,333 661,934 Total liabilities and unitholders' equity $ 2,598,674 $ – $ 58,315 $ 2,656,989
(1) Reclassifications are recorded as a result of a classified balance sheet presentation under IFRS. (2) Upon finalizing the IFRS adjustments, the amounts previously reported in the March 31, 2011 condensed
consolidated interim financial statements were adjusted. The Unitholders' equity adjustment was increased from $3,658 to $4,333.

C H A R T W EL L SEN IORS HOU S ING R E I T | F inanc ia l Repor t 2011
Notes to C onso l ida ted F inanc ia l S t a tement s
104 C H A R T W EL L SEN IORS HOU S ING R E I T | F inanc ia l Repor t 2011104 51
(b) The following is a reconciliation of the Trust's total equity reported in accordance with CGAAP to its total equity in accordance with IFRS as at December 31, 2010:
CGAAP, IFRS December 31, December 31, Note 30(d) 2010 Reclassifications(1) Adjustments(2) 2010
Assets
Current assets: Cash and cash equivalents $ 14,728 $ – $ – $ 14,728 Trade and other receivables 43,578 (28,983) – 14,595 Mezzanine loans receivable – 14,768 – 14,768 Capital funding receivable – 3,537 – 3,537 Other assets – 21,037 – 21,037 Total current assets 58,306 10,359 – 68,665
Non-current assets: Other assets (iv) – 7,946 (525) 7,421 Mezzanine loans receivable 20,803 (14,768) – 6,035 Capital funding receivable (iv) 63,865 (3,537) (1,269) 59,059 Intangible assets (iii) 36,523 38,581 (22,364) 52,740 Licenses 38,581 (38,581) – – PP&E (i), (ii) (iii) 2,458,689 – 26,487 2,485,176 Total non-current assets 2,618,461 (10,359) 2,329 2,610,431
Total assets $ 2,676,767 $ – $ 2,329 $ 2,679,096
Liabilities and Unitholders' Equity
Current liabilities: Credit Facility $ 51,000 $ – $ – $ 51,000 Accounts payable and other liabilities (vii) 87,735 (995) 6,837 93,577 Distributions payable 6,505 – – 6,505 Mortgages payable – 116,864 – 116,864 Deferred consideration on
business combinations – 2,704 – 2,704 Total current liabilities 145,240 118,573 6,837 270,650
Non-current liabilities:
Mortgages payable (iv) 1,732,438 (116,864) (2,599) 1,612,975 Employee benefits (v) – 995 (185) 810 Deferred consideration on
business combinations 7,512 (2,704) – 4,808 Convertible debentures (viii) 70,859 – 6,017 76,876Class B Units (ix) – – 14,027 14,027 Deferred tax liabilities (xi) 25,310 – 15,141 40,451 Total non-current liabilities 1,836,119 (118,573) 32,401 1,749,947
Total liabilities 1,981,359 – 39,238 2,020,597
Non-controlling interests (ix) 5,429 – (5,429) –
Unitholders' equity 689,979 – (31,480) 658,499
Total liabilities and unitholders' equity $ 2,676,767 $ – $ 2,329 $ 2,679,096
(1) Reclassifications are recorded as a result of a classified balance sheet presentation under IFRS. (2) Upon finalizing the IFRS adjustments, the amounts previously reported in the March 31, 2011 condensed
consolidated interim financial statements were adjusted. The Unitholders' equity adjustment was reduced from $33,625 to 31,480.

C H A R T W E L L SE N IORS HOU S ING R E I T | F inanc ia l Repor t 2011 105
Notes to C onso l ida ted F inanc ia l S t a tement s
52
(c) The following is a reconciliation of net loss as reported in accordance with CGAAP to net loss in accordance with IFRS for the year ended December 31, 2010:
Year ended December 31, Note 30(d) 2010(1)
Loss for the year, as reported under CGAAP $ (26,337)
Decreases to reported amount: Reversal of non-controlling interest (ix) (371) Depreciation and amortization (i), (iii) (65,730) (66,101)
Finance costs: Accretion and deferred financing on debentures (viii) 6,788 Interest distributions on Class B Units (ix) (989) Borrowing costs (ii) (1,209) Changes in fair value remeasurement of mortgages (iv) (45) 4,545
Other income (expense): Remeasurement of previously held
equity interest on acquisition (iv) 9,639 Bargain purchase on acquisitions (iv) 4,428 Reversal of impairment on PP&E under CGAAP (i) 8,600 Remeasurement of gain on sale of assets (i) (5,691) Transaction costs on acquisition (iv) (3,295) 13,681
Changes in fair value of financial instruments: Changes in fair value of convertible debentures (viii) 3,123 Changes in fair value of interest rate swap (x) 81 Changes in fair value of LTIP option component (vii) (1,387) Changes in fair value of Class B Units (ix) (2,369) (552)
Direct operating, general, administrative and trust expenses (ii) (323)
Deferred taxes (xi) 13,139
Loss for the year, as reported under IFRS (61,948)
Other comprehensive loss, as reported under CGAAP (4,631)
Decreases to reported amount: Reversal of non-controlling interest (ix) (65) Changes in fair value of interest rate swap (x) (81) Unrealized foreign exchange loss on
translation of foreign operations (i), (iii) (379) Other comprehensive loss, as reported under IFRS (5,156)
Total comprehensive income (loss) $ (67,104)
(1) Upon finalizing the IFRS adjustments, the amounts previously reported in the March 31, 2011 condensed consolidated interim financial statements were adjusted. The loss for the year was reduced from $63,419 to $61,948 and total comprehensive loss was reduced from $68,575 to $67,104.
(d) Notes to the reconciliations:
(i) Fair value as deemed cost:
At the Transition Date, the Trust has elected to apply the fair value as deemed cost election to PP&E. The fair value of PP&E, as at January 1, 2010, is assessed at $2,361,849, which resulted in an increase to the CGAAP carrying value on the Transition Date of $78,328.

C H A R T W EL L SEN IORS HOU S ING R E I T | F inanc ia l Repor t 2011
Notes to C onso l ida ted F inanc ia l S t a tement s
106 C H A R T W EL L SEN IORS HOU S ING R E I T | F inanc ia l Repor t 2011106 53
Fair values were determined by the following approaches:
• Consideration of recent prices of similar properties within similar market areas;
• Discounted cash flow analysis which is based upon, among other things, rental income from current leases and assumptions about rental income from future leases reflecting market conditions on the valuation date less future cash outflows in respect of such leases discounted generally over a term of 15 years for long-term care properties and 25 years for retirement homes; and
• The direct capitalization method, which is based on the conversion of normalized earnings into an expression of market value. The normalized net income for the year is divided by an overall capitalization rate (inverse of an earnings multiplier).
Overall, the capitalization rates ranged from 7.5% to 12.3% with an average rate for the portfolio of approximately 8.9%.
The table below provides details of the average capitalization rates for Retirement and Long Term Care segments as at January 1, 2010:
Internal External valuations valuations
Canadian Retirement Operations: Weighted average capitalization rate 9.2% 8.8% Range 8.2% - 12.3% 7.5% - 10.3%
Canadian Long Term Care Operations: Weighted average capitalization rate 8.5% 8.4% Range 8.5% 8.3% - 8.5%
United States Operations: Weighted average capitalization rate 8.6% 8.7% Range 7.5% - 9.3% 8.5% - 9.3%
In the valuation process of our PP&E assets, external appraisals were used for approximately 20% of the properties with the remaining 80% being valued internally.
The internal valuation process included the combination of a direct capitalization income approach and discounted cash flow calculations.
• The direct capitalization income approach determined fair value by applying a capitalized rate to the stabilized net operating income, which incorporates allowances for vacancies and management fees. The resulting capitalized value was further adjusted, where appropriate, for extraordinary costs to stabilize the income and capital expenditures.
• The discounted cash flow approach was used to determine the fair value of Ontario Class B and Class C LTC properties due to the redevelopment requirements under the new LTC legislation; certain properties subject to realty tax abatement contracts and properties in lease-up. The discounted cash flow methodology was used to derive the value of the capital funding subsidy related to our Class A LTC properties in Ontario.
C H A R T W E L L SE N IORS HOU S ING R E I T | F inanc ia l Repor t 2011 107
Notes to C onso l ida ted F inanc ia l S t a tement s
54
Qualified independent valuators were used for the external valuation process. Property values were based on:
• available market evidence of prices of similar properties within similar market areas; and
• rental income from current leases and assumptions about rental income from future leases reflecting market conditions at the applicable balance sheet date, less future cash outflows in respect of such leases.
As a result of this election, depreciation and amortization adjustments (with respective foreign exchange impact on assets held in United States Operations) to the carrying values of PP&E and intangible assets, reversal of impairment under CGAAP and remeasurement of gain on sale of assets are also reflected in the tables under notes 30(a), 30(b) and 30(c).
(ii) Borrowing cost and pre-operating losses:
Under CGAAP, the Trust's policy was to capitalize borrowing costs and pre-operating losses to the date the property is stabilized. Under IFRS, Chartwell's policy is only to capitalize borrowing costs directly associated with the construction of qualifying assets during the development period.
At the Transition Date, there is no impact of the change in policy as the deemed cost election was applied to properties. Subsequent to January 1, 2010, Chartwell has derecognized only the borrowing costs on qualifying assets and pre-operating losses that were capitalized under CGAAP subsequent to properties becoming available for use, as reflected in the table under note 30(c).
(iii) Resident contracts, below-market land leases and PILOT:
Under CGAAP resident contracts, below-market land leases and PILOT were recognized as separate intangible assets. As a result of transitioning to IFRS, they are now accounted for as components of the building asset. The value of these components transferred from intangibles to properties at the Transition Date is $22,127.
This reclassification is also reflected in the table under note 30(b) as at December 31, 2010.
(iv) Business combinations:
The Trust has applied the business combination exemption in IFRS 1 to not apply IFRS 3 (revised), Business Combination ("IFRS 3"), retrospectively to past business combinations. Accordingly, the Trust has not restated business combinations that took place prior to the Transition Date and no adjustments have been required to exclude the recognition of assets or liabilities under CGAAP that do not qualify for recognition under IFRS.
Under CGAAP, if an investment in a subsidiary is acquired through two or more acquisitions (step acquisition), the interest in the identifiable assets and liabilities are determined separately at each acquisition date and are not subsequently revalued.
Under IFRS 3, if the business combination is achieved in steps, the previously held equity interest is remeasured to the acquisition date fair value and any resulting gain or loss is recognized in profit or loss. Transaction costs incurred in a business combination (previously capitalized under CGAAP) are now expensed through profit or loss under IFRS.
Adjustments to all acquisitions that occurred as at December 31, 2010 are reflected in the tables under notes 30(b) and 30(c).

C H A R T W EL L SEN IORS HOU S ING R E I T | F inanc ia l Repor t 2011
Notes to C onso l ida ted F inanc ia l S t a tement s
108 C H A R T W EL L SEN IORS HOU S ING R E I T | F inanc ia l Repor t 2011108 55
(v) Employee benefits:
The Trust has elected to recognize all cumulative unrecognized actuarial gains and losses that existed at the Transition Date in opening retained earnings for all its employee benefit plans. The impact of this election is shown in table 30(a).
The Trust has also elected to recognize all actuarial gains and losses immediately in other comprehensive income without recycling to profit or loss in subsequent periods. As a result, actuarial gains and losses are not amortized to profit or loss but rather are recorded directly to other comprehensive loss at the end of each period and reported in accumulated losses.
(vi) Cumulative translation differences:
The Trust has elected to set the cumulative translation amount of $13,825 under CGAAP, which is included in accumulated other comprehensive income, to zero upon transition to IFRS. This has been reflected as a reclassification between accumulated other comprehensive income and accumulated losses and does not affect reported net equity.
Gains and losses on any subsequent disposals of U.S. operations would exclude translation differences that arose before the Transition Date to IFRS and the cumulative translation account would only include translation differences arising after the Transition Date.
(vii) Unit-based payment transactions:
The Trust has elected to apply IFRS 2, Share-based Payments, to equity instruments granted after November 7, 2002 which have not vested by the Transition Date.
Unit-based compensation cost under the LTIP and the Deferred Unit Plan have been reclassified from equity under CGAAP to a liability under IFRS as they are considered cash-settled plans. Under CGAAP, compensation cost was only measured once at grant date whereas under IFRS, the LTIP and the Deferred Unit Plan are required to be remeasured each reporting period until settled. As a result, at Transition Date Unitholders' equity under CGAAP has been adjusted for:
LTIP:
• $2,605 reclassification of the historical compensation cost previously recorded in equity; and
• $1,171 for the impact on accumulated losses from the cumulative fair value adjustment of the liability.
Deferred Unit Plan:
• The compensation expense of $644 has been adjusted from equity to liability.
Subsequent reclassifications of the LTIP option component and Deferred Trust Units from equity to liability and the fair value remeasurement of these financial instruments are reflected in the tables under notes 30(b) and 30(c).
(viii) Convertible debentures:
IAS 32, Financial Instruments - Presentation ("IAS 32"), requires that options over puttable instruments be classified as a liability. As a result, at Transition Date, the equity portion of the convertible debenture of $14,878 recorded under CGAAP has been classified as a liability through a debit to equity under IFRS. The liability has been remeasured at fair
C H A R T W E L L SE N IORS HOU S ING R E I T | F inanc ia l Repor t 2011 109
Notes to C onso l ida ted F inanc ia l S t a tement s
56
value as the Trust has elected to designate the financial instrument at FVTPL under IFRS. The fair value measurement on January 1, 2010 has reduced the liability by $200.
Subsequent reversals of accretion and deferred financing costs recorded under CGAAP to fair value remeasurement of the financial instrument under IFRS are reflected in the tables under notes 30(b) and 30(c).
(ix) Class B Units:
Under IAS 32, Class B Units are considered puttable instruments and are classified as financial liabilities in the consolidated financial statements of the Trust. This has resulted in a movement from non-controlling interest under CGAAP to liability under IFRS of $7,813 at the Transition Date and $5,429 at December 31, 2010.
As the Trust has elected to designate this financial instrument at FVTPL under IFRS, the fair value measurement of the liability is reflected in the tables under notes 30(b) and 30(c). Distributions of Class B Units are now reclassified as interest expense recorded in finance costs under IFRS.
(x) Cash flow hedges:
IFRS requires that only hedging relationships that satisfy the hedge accounting criteria under IAS 39 as of the Transition Date be reflected as hedges.
The Trust's current interest rate swap agreement does not qualify for hedge accounting under IFRS. As at the Transition Date, the swap has been de-designated for hedge accounting. This has resulted in a transfer of $1,218 to accumulated losses from accumulated other comprehensive income and thus, does not affect net reported equity.
The effective portion of the swap contract is also reclassified from other comprehensive loss to profit or loss as reflected in the tables under notes 30(b) and 30(c).
(xi) Deferred tax:
The increase in deferred tax liability under IFRS compared with CGAAP primarily relates to the increased carrying values of Chartwell's PP&E and the increase in the tax rate being applied to temporary differences of 46.4%, the applicable tax rate of the Trust, excluding the impact of future distributions.
The tables under notes 30(b) and 30(c) reflect the deferred tax impact of items described in (i) to (x) above.
(xii) Discontinued operations:
Under IFRS, a discontinued operation represents a separate major line of business or geographical area of operations or subsidiaries acquired exclusively with a view to resale.
The discontinued operations presented in 2010 under CGAAP represented either an individual property or group of properties. As a result, there are reclassifications to present these operations within continuing operations in our 2010 statements of comprehensive income (loss) under IFRS. The impact of this change is reflected in the table under note 30(c).
(e) Estimates:
Hindsight was not used to create or revise estimates and, accordingly, the estimates previously made by the Trust under CGAAP are consistent with their application under IFRS.

C H A R T W EL L SEN IORS HOU S ING R E I T | F inanc ia l Repor t 2011
Notes to C onso l ida ted F inanc ia l S t a tement s
110 C H A R T W EL L SEN IORS HOU S ING R E I T | F inanc ia l Repor t 2011110 57
(f) Loss per unit:
The Trust Units are considered puttable instruments that can be presented within equity under IAS 32. However, under IAS 33, Earnings Per Share, the Trust Units are not considered ordinary units and, therefore, an income/loss per unit calculation may not be presented.
(g) IFRS impact on the consolidated statements of cash flows:
The IFRS adjustments made to the comparative consolidated statement of comprehensive income (loss) for the year ended December 31, 2010 (as described above) have also been made to the consolidated statements of cash flows as at the same date. There were no other significant IFRS transition differences noted.


100 Milverton Drive, Suite 700, Mississauga, Ontario L5R 4H1 1-888-584-2386 www.chartwellreit.ca