FPL-012 COMPARATIVE ASSESSMENT OF HUMAN AND …
278
COMPARATIVE ASSESSMENT OF HUMAN AND ECOLOGICAL IMPACTS FROM MUNICIPAL WASTEWATER DISPOSAL METHODS IN SOUTHEAST FLORIDA James D. Englehardt, Principal Investigator 1 Vincent P. Amy 2 Frederick Bloetscher 3 David A. Chin 1 Lora E. Fleming 1 Sinem Gokgoz 1 Joan B. Rose 4 Helena Solo-Gabriele 1 George Tchobanoglous 5 Submitted to the: Florida Water Environment Association Utility Council 12 July 2001 1 University of Miami, Coral Gables, FL 2 Consulting Geologist Tequesta, FL 3 Consulting Professional Engineer, Dania, FL 4 University of South Florida, St. Petersburg, FL 5 University of California, Davis, CA FPL-012 FPL-012-001
Transcript of FPL-012 COMPARATIVE ASSESSMENT OF HUMAN AND …
COMPARATIVE ASSESSMENT OF HUMAN AND ECOLOGICAL IMPACTSFROM MUNICIPAL WASTEWATER DISPOSAL METHODS IN SOUTHEAST
FLORIDA
James D. Englehardt, Principal Investigator1
Vincent P. Amy2
Frederick Bloetscher3
David A. Chin1
Lora E. Fleming1
Sinem Gokgoz1
Joan B. Rose4
Helena Solo-Gabriele1
George Tchobanoglous5
Submitted to the: Florida Water Environment Association Utility Council
12 July 2001
1University of Miami, Coral Gables, FL2Consulting Geologist Tequesta, FL
3Consulting Professional Engineer, Dania, FL4University of South Florida, St. Petersburg, FL
5University of California, Davis, CA
FPL-012
FPL-012-001
2
1. EXECUTIVE SUMMARY
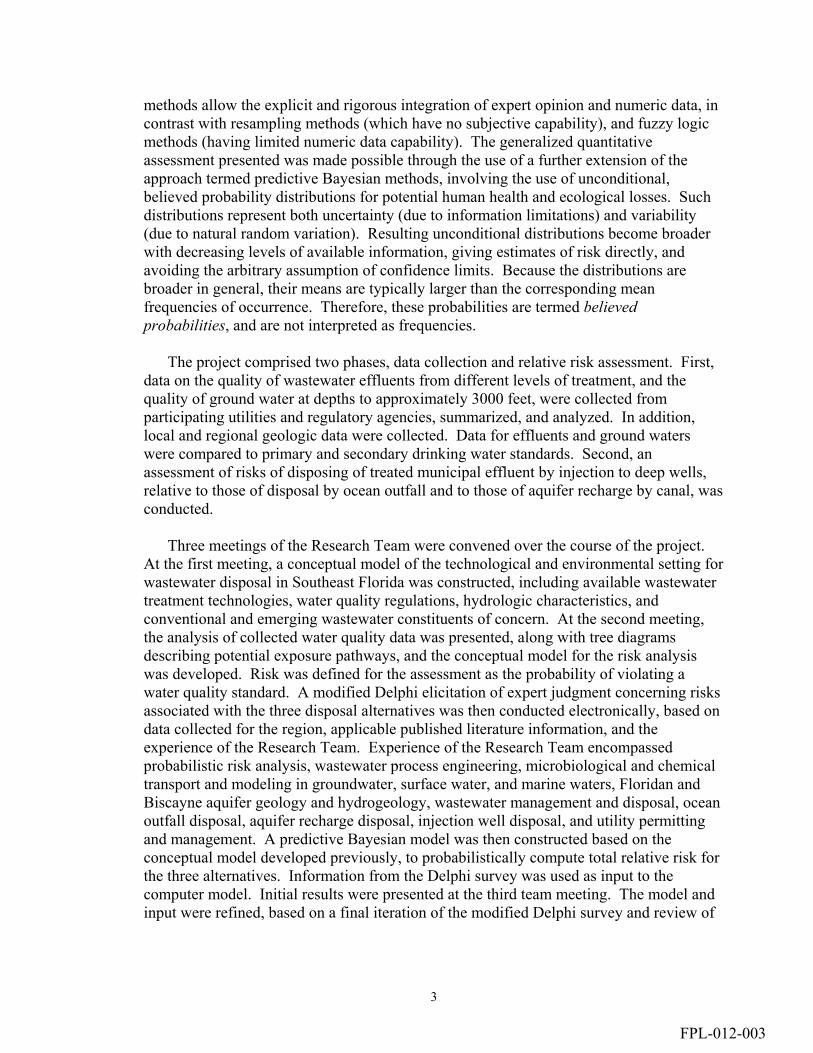
Injection to deep wells is currently one alternative for disposing municipal wastewatereffluent in Southeast Florida. In the past several years, elevated concentrations ofammonia and total Kjeldahl nitrogen, and depressed salinity, relative to native water in theFloridan Aquifer, have been reported in monitoring wells in zones overlying the injectionzone in Miami-Dade County. This finding has raised concerns of the U.S. EPA and othersregarding the extent of migration of injected water.
In this research, indicators of the human health and ecological risks of availablealternatives for disposal of treated municipal wastewater effluent in Southeast Floridawere evaluated on a relative basis. Prior to the study, little was known regarding therelative risks of such alternatives. Municipal wastewater effluent disposal alternatives inSoutheast Florida and considered in this proposal include (a) injection wells, (b) oceanoutfalls and (c) surficial aquifer recharge via canal discharge. Assessment of risks ofreuse of treated effluent for irrigation of golf courses, residential lawns, and parks wasoutside of the scope of this study. Because of the seasonal rainfall and shallow watertables in South Florida, irrigation reuse is frequently impossible during the rainy season(June through November), and therefore a backup disposal system of similar capacity isrequired. That is, wastewater utilities utilizing reclaimed water for irrigation still requireone of the effluent disposal alternatives listed above, for use during wet periods. Surficialaquifer recharge via shallow wells would require full treatment (typically reverse osmosis)under current regulations, a higher level of treatment than was assumed by the study Teamfor aquifer recharge. Therefore, surficial aquifer recharge by shallow well injection wasalso not considered.
Objectives of the research were to:
1. Compile and summarize water quality data on treated wastewater effluents and groundwaters, related to or in proximity with large deep well injection systems and otherdisposal systems in Southeast Florida,
2. Develop a conceptual model of the operating environment for each disposal option,including regulatory constraints, hydrogeological and hydrological considerations, andpotential pathways of health and ecological exposure,
3. Develop a probabilistic assessment of risks of injection well disposal, based on (a)published literature, (b) available data, and (c) expert opinion, relative to those ofocean outfall and surficial aquifer recharge methods of treated-effluent disposal,
4. Prepare a report addressing the relative risks of the three wastewater treatmentdisposal alternatives, and
5. Recommend additional data and research needs, if appropriate, to refine conclusionsreached in the project report.
Because of the complexity of potential exposure paths, time scales, and populationcharacteristics, and the need to avoid site-specificity in the assessment, a predictiveBayesian assessment of relative risks of the various alternatives was undertaken. Bayesian
FPL-012-002
3
methods allow the explicit and rigorous integration of expert opinion and numeric data, incontrast with resampling methods (which have no subjective capability), and fuzzy logicmethods (having limited numeric data capability). The generalized quantitativeassessment presented was made possible through the use of a further extension of theapproach termed predictive Bayesian methods, involving the use of unconditional,believed probability distributions for potential human health and ecological losses. Suchdistributions represent both uncertainty (due to information limitations) and variability(due to natural random variation). Resulting unconditional distributions become broaderwith decreasing levels of available information, giving estimates of risk directly, andavoiding the arbitrary assumption of confidence limits. Because the distributions arebroader in general, their means are typically larger than the corresponding meanfrequencies of occurrence. Therefore, these probabilities are termed believedprobabilities, and are not interpreted as frequencies.
The project comprised two phases, data collection and relative risk assessment. First,data on the quality of wastewater effluents from different levels of treatment, and thequality of ground water at depths to approximately 3000 feet, were collected fromparticipating utilities and regulatory agencies, summarized, and analyzed. In addition,local and regional geologic data were collected. Data for effluents and ground waterswere compared to primary and secondary drinking water standards. Second, anassessment of risks of disposing of treated municipal effluent by injection to deep wells,relative to those of disposal by ocean outfall and to those of aquifer recharge by canal, wasconducted.
Three meetings of the Research Team were convened over the course of the project.At the first meeting, a conceptual model of the technological and environmental setting forwastewater disposal in Southeast Florida was constructed, including available wastewatertreatment technologies, water quality regulations, hydrologic characteristics, andconventional and emerging wastewater constituents of concern. At the second meeting,the analysis of collected water quality data was presented, along with tree diagramsdescribing potential exposure pathways, and the conceptual model for the risk analysiswas developed. Risk was defined for the assessment as the probability of violating awater quality standard. A modified Delphi elicitation of expert judgment concerning risksassociated with the three disposal alternatives was then conducted electronically, based ondata collected for the region, applicable published literature information, and theexperience of the Research Team. Experience of the Research Team encompassedprobabilistic risk analysis, wastewater process engineering, microbiological and chemicaltransport and modeling in groundwater, surface water, and marine waters, Floridan andBiscayne aquifer geology and hydrogeology, wastewater management and disposal, oceanoutfall disposal, aquifer recharge disposal, injection well disposal, and utility permittingand management. A predictive Bayesian model was then constructed based on theconceptual model developed previously, to probabilistically compute total relative risk forthe three alternatives. Information from the Delphi survey was used as input to thecomputer model. Initial results were presented at the third team meeting. The model andinput were refined, based on a final iteration of the modified Delphi survey and review of
FPL-012-003

4
results by the Team, to develop final relative risk estimates. Risks were thencharacterized, in a discussion of the tradeoffs involved.
Output of the probabilistic analysis included the believed number of days duringwhich one or more violations of existing or assumed water quality standards for arsenic,microbes, n-nitrosodimethylamine (NDMA), and total Kjeldahl nitrogen (TKN) wouldoccur, for comparative purposes. Arsenic, microbes (Cryptosporidium parvum for surfacewater, rotavirus for ground water), and NDMA were used as indicators of human healthrisks, and TKN was used as an ecological risk indicator. The compound NDMA wasselected to represent nitrosamines, an emerging class of toxins that has been found inwastewater effluent. NDMA is considered carcinogenic at extremely low doses. Believedviolation days are shown in Table 1 (a) and 1 (b). These numbers were larger than theexpected number of days on which violations would be expected to occur, because theyreflected uncertainty in addition to inherent variability. In addition, they were based uponmultiple assumptions, as detailed in Section 5. In particular, the following assumptionswere considered important to the results obtained:
1. Rapid vertical migration to the Upper Floridan Aquifer from deep injection wells inthe Lower Floridan Aquifer was assumed, although evidence of effluent in the UpperFloridan near injection wells in Miami-Dade County could have been related toconstruction problems. This assumption is equivalent to assuming that the FloridanAquifer will be "impacted" with water of generally much lower dissolved solids andinorganics, yet higher organics and nutrients, than native water of the aquifer.Constituents found in higher concentrations in effluent included cyanide, nitrogen,phosphorous, color, odor, foaming agents, total trihalomethanes (THMs), biochemicaloxygen demand (BOD), and total coliform count. In addition, treated effluents weresomewhat higher in temperature and lower in pH, on average. Of note and based onwastewater effluent analyses obtained, on average, treated effluents met both primaryand secondary standards for drinking water, with the exceptions of primary standardsfor antimony and total coliform, and secondary standards for color, odor, TDS, andfoaming agents. The assumption of rapid vertical migration to the upper Floridan wasequivalent to assuming a violation of the USDW with 100% probability;
2. Aquifer storage and recovery (ASR) wells were assumed located one mile fromeffluent injection wells. It was further assumed that, as water is withdrawn frompotable and non-potable ASR wells, salinity would be monitored, and withdrawalswould stop if elevated levels were detected. However, the Team assessed the risksassociated with the discharge of non-potable ASR water (to canals without treatment)to be higher than those associated with discharge of water from potable ASR wells (todistribution systems following chlorination and blending). Assumptions of Teammembers regarding the future levels of operational control and treatment to berequired before and after ASR withdrawals undoubtedly affected these judgments, andare considered to affect the risks associated with contamination of ASR wells frominjection wells. In addition, actual risks will be related to the distance betweeninjection and ASR wells;
FPL-012-004
5
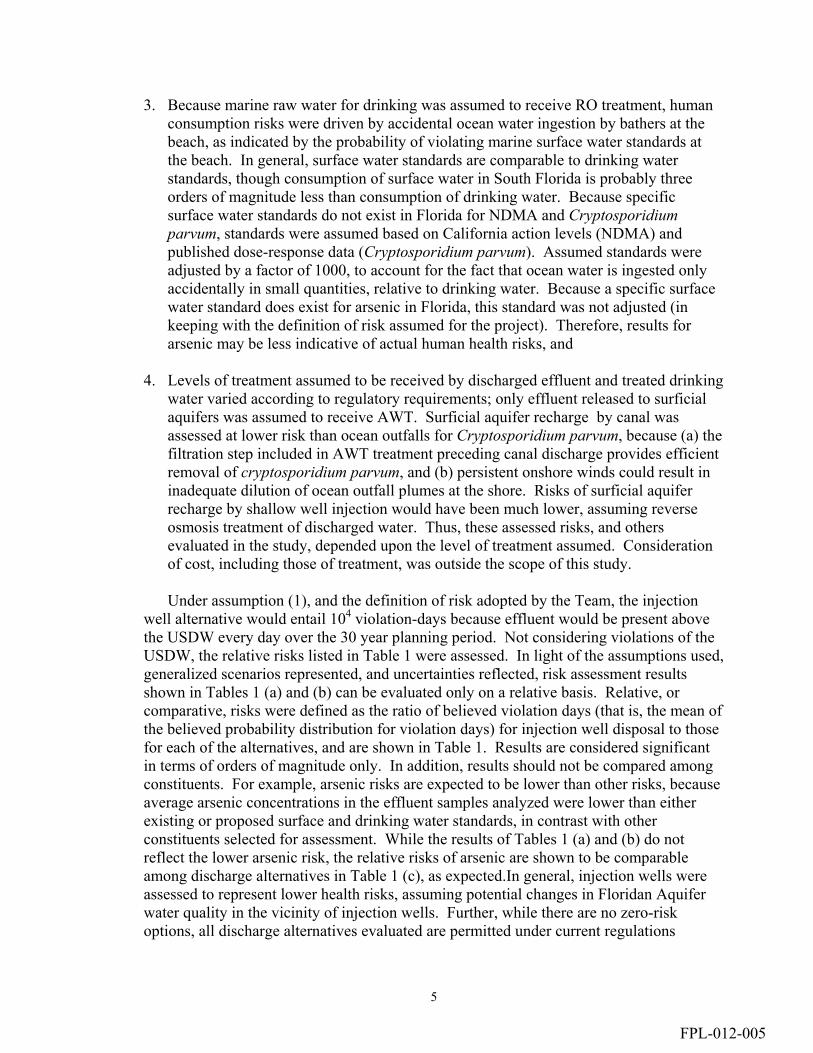
3. Because marine raw water for drinking was assumed to receive RO treatment, humanconsumption risks were driven by accidental ocean water ingestion by bathers at thebeach, as indicated by the probability of violating marine surface water standards atthe beach. In general, surface water standards are comparable to drinking waterstandards, though consumption of surface water in South Florida is probably threeorders of magnitude less than consumption of drinking water. Because specificsurface water standards do not exist in Florida for NDMA and Cryptosporidiumparvum, standards were assumed based on California action levels (NDMA) andpublished dose-response data (Cryptosporidium parvum). Assumed standards wereadjusted by a factor of 1000, to account for the fact that ocean water is ingested onlyaccidentally in small quantities, relative to drinking water. Because a specific surfacewater standard does exist for arsenic in Florida, this standard was not adjusted (inkeeping with the definition of risk assumed for the project). Therefore, results forarsenic may be less indicative of actual human health risks, and
4. Levels of treatment assumed to be received by discharged effluent and treated drinkingwater varied according to regulatory requirements; only effluent released to surficialaquifers was assumed to receive AWT. Surficial aquifer recharge by canal wasassessed at lower risk than ocean outfalls for Cryptosporidium parvum, because (a) thefiltration step included in AWT treatment preceding canal discharge provides efficientremoval of cryptosporidium parvum, and (b) persistent onshore winds could result ininadequate dilution of ocean outfall plumes at the shore. Risks of surficial aquiferrecharge by shallow well injection would have been much lower, assuming reverseosmosis treatment of discharged water. Thus, these assessed risks, and othersevaluated in the study, depended upon the level of treatment assumed. Considerationof cost, including those of treatment, was outside the scope of this study.
Under assumption (1), and the definition of risk adopted by the Team, the injectionwell alternative would entail 104 violation-days because effluent would be present abovethe USDW every day over the 30 year planning period. Not considering violations of theUSDW, the relative risks listed in Table 1 were assessed. In light of the assumptions used,generalized scenarios represented, and uncertainties reflected, risk assessment resultsshown in Tables 1 (a) and (b) can be evaluated only on a relative basis. Relative, orcomparative, risks were defined as the ratio of believed violation days (that is, the mean ofthe believed probability distribution for violation days) for injection well disposal to thosefor each of the alternatives, and are shown in Table 1. Results are considered significantin terms of orders of magnitude only. In addition, results should not be compared amongconstituents. For example, arsenic risks are expected to be lower than other risks, becauseaverage arsenic concentrations in the effluent samples analyzed were lower than eitherexisting or proposed surface and drinking water standards, in contrast with otherconstituents selected for assessment. While the results of Tables 1 (a) and (b) do notreflect the lower arsenic risk, the relative risks of arsenic are shown to be comparableamong discharge alternatives in Table 1 (c), as expected.In general, injection wells wereassessed to represent lower health risks, assuming potential changes in Floridan Aquiferwater quality in the vicinity of injection wells. Further, while there are no zero-riskoptions, all discharge alternatives evaluated are permitted under current regulations
FPL-012-005

6
(though revised rules have been proposed for injection well disposal). Ecological riskswithin the three urban counties studied were also lower. However, impacts to theEverglades system associated with urban water use/reuse were not evaluated as part of thisstudy. Assessed risks were low because of the geologic isolation and lack of ecologicalfeatures within the aquifer, and because it was assumed that any contamination of ASRwells would be detected during operational withdrawals and that withdrawals would thenstop.
It was not possible to conduct a quantitative assessment of risks associated withpharmaceutically active substances (PASs), because such compounds are still beingidentified chemically, concentrations in treated and natural waters are largely unknown,and environmental fates are uncertain. Currently these substances are not monitored.However, such chemicals are being found in concentrations not recognized previously.Because of the widespread use of birth control and other hormonally active drugs, and thelack of removal of PASs in conventional wastewater treatment, the potential risksassociated with these compounds require significant further study. Most direct evidenceof toxicity is in the form of animal data; evidence in humans is limited at the present time.Additional data regarding effects of exposure in animals and humans are needed.Statistical pilot monitoring programs should be implemented on a broad scale as a basisfor future policy development. Further questions include treatment technologies forremoval, and the effects of natural processes including microbial degradation, adsorption,dilution, and photochemical reactivity on the fate of PASs in the surface and subsurfaceenvironment. Estrogens may be useful as an indicator in future risk assessments, becausethe compounds and their health effects are measurable.
In addition to PASs, the Team felt that potential risks of blue-green algae and theirtoxins related to the discharge of treated wastewater effluent, also outside the scope of thecurrent project, also deserve further study. Information on blue-green algae toxicity inFlorida is limited at present. However, several species of freshwater or freshwater-estuarine cyanobacteria, or blue-green algae, that produce cyanotoxins occur in Floridawaters. Of samples collected in recent monitoring studies of recreational and surfacedrinking water supplies in Florida with algal blooms, approximately half showedsignificant levels of blue green algae, all of which were positively identified to containblue green algal toxins found lethal in mice. Because such algae are nitrogen-fixing,growth rate is independent of TKN levels. However, growth is enhanced with phosphorusconcentration. Even following AWT treatment, concentrations of phosphorus inwastewater effluent are two orders of magnitude greater than in natural South Floridasurface waters. Further, cyanotoxins are not well removed in conventional flocculationand filtration. Therefore, blue-green algae may be a factor to consider in evaluating anddetermining the level of treatment associated with surface discharge alternatives.
Benefits and costs were not considered as part of this study. In particular, benefits andcosts of wastewater reuse were not considered. Wastewater flows disposed in Miami-Dade, Broward and Palm Beach Counties are on the order of 0.5 billion gallons per day(bgd), and are significant when compared with the 1.6 bgd to be recovered for Evergladesrestoration through use of ASR technology. Reuse of portions of these flows for surficial
FPL-012-006
7
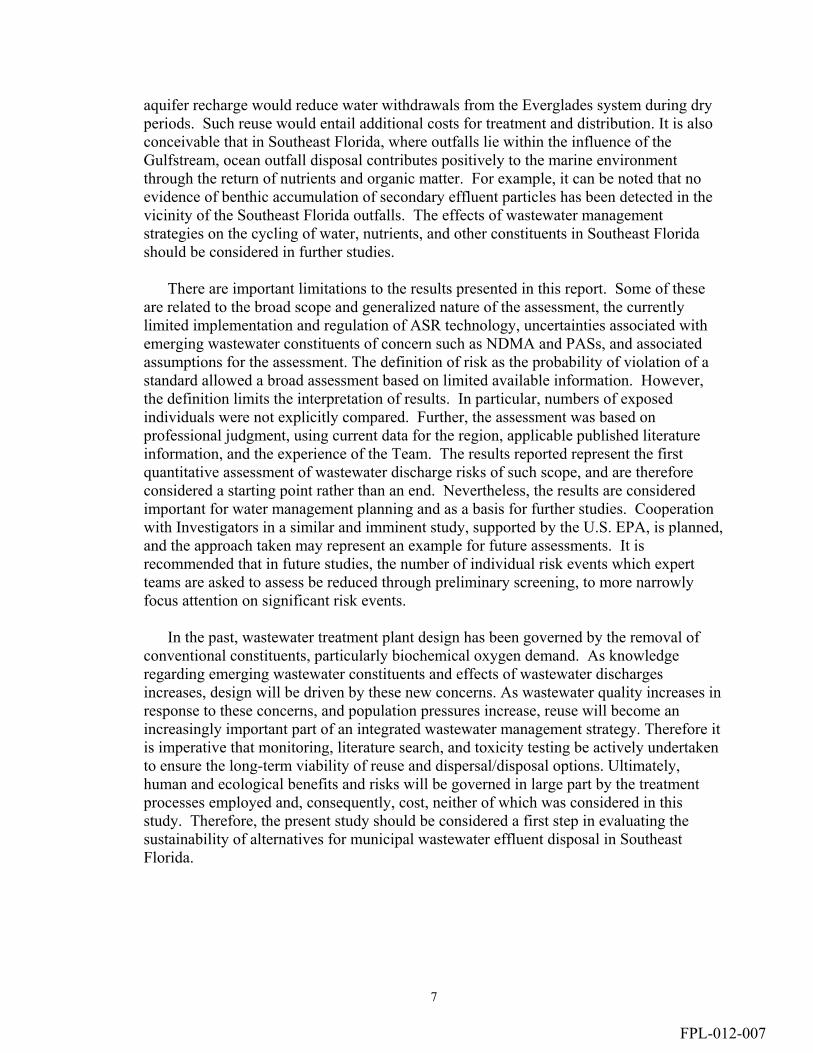
aquifer recharge would reduce water withdrawals from the Everglades system during dryperiods. Such reuse would entail additional costs for treatment and distribution. It is alsoconceivable that in Southeast Florida, where outfalls lie within the influence of theGulfstream, ocean outfall disposal contributes positively to the marine environmentthrough the return of nutrients and organic matter. For example, it can be noted that noevidence of benthic accumulation of secondary effluent particles has been detected in thevicinity of the Southeast Florida outfalls. The effects of wastewater managementstrategies on the cycling of water, nutrients, and other constituents in Southeast Floridashould be considered in further studies.
There are important limitations to the results presented in this report. Some of theseare related to the broad scope and generalized nature of the assessment, the currentlylimited implementation and regulation of ASR technology, uncertainties associated withemerging wastewater constituents of concern such as NDMA and PASs, and associatedassumptions for the assessment. The definition of risk as the probability of violation of astandard allowed a broad assessment based on limited available information. However,the definition limits the interpretation of results. In particular, numbers of exposedindividuals were not explicitly compared. Further, the assessment was based onprofessional judgment, using current data for the region, applicable published literatureinformation, and the experience of the Team. The results reported represent the firstquantitative assessment of wastewater discharge risks of such scope, and are thereforeconsidered a starting point rather than an end. Nevertheless, the results are consideredimportant for water management planning and as a basis for further studies. Cooperationwith Investigators in a similar and imminent study, supported by the U.S. EPA, is planned,and the approach taken may represent an example for future assessments. It isrecommended that in future studies, the number of individual risk events which expertteams are asked to assess be reduced through preliminary screening, to more narrowlyfocus attention on significant risk events.
In the past, wastewater treatment plant design has been governed by the removal ofconventional constituents, particularly biochemical oxygen demand. As knowledgeregarding emerging wastewater constituents and effects of wastewater dischargesincreases, design will be driven by these new concerns. As wastewater quality increases inresponse to these concerns, and population pressures increase, reuse will become anincreasingly important part of an integrated wastewater management strategy. Therefore itis imperative that monitoring, literature search, and toxicity testing be actively undertakento ensure the long-term viability of reuse and dispersal/disposal options. Ultimately,human and ecological benefits and risks will be governed in large part by the treatmentprocesses employed and, consequently, cost, neither of which was considered in thisstudy. Therefore, the present study should be considered a first step in evaluating thesustainability of alternatives for municipal wastewater effluent disposal in SoutheastFlorida.
FPL-012-007
8
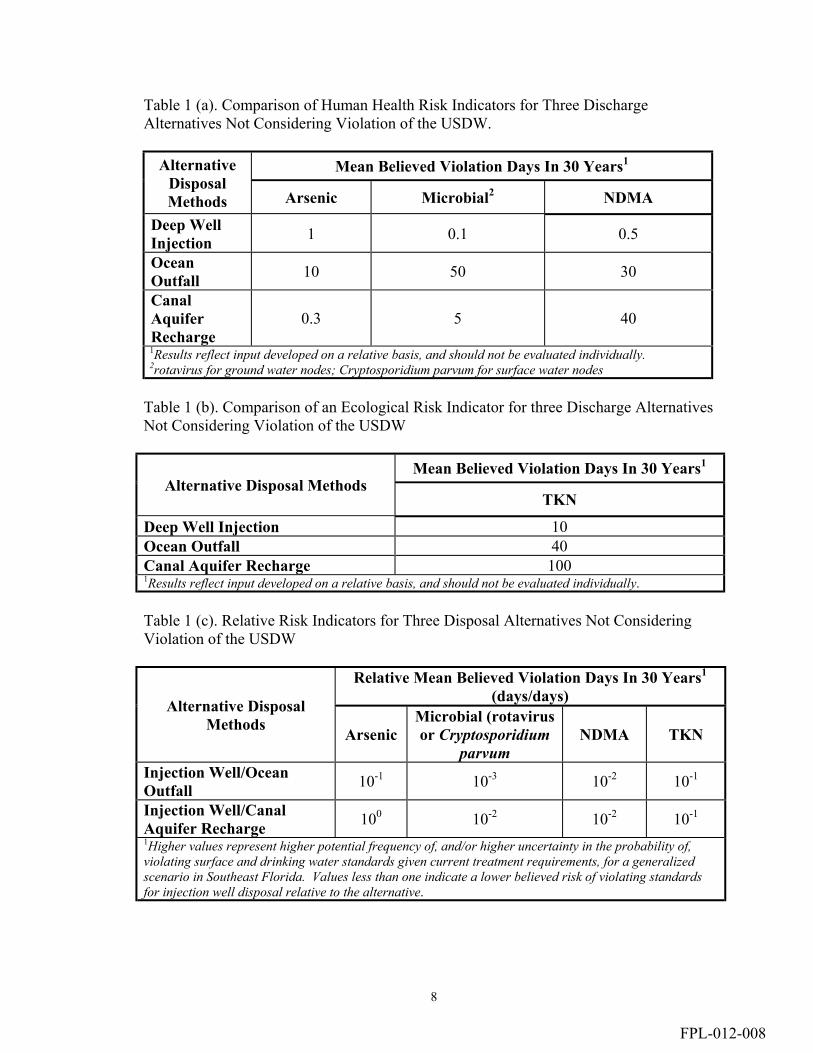
Table 1 (a). Comparison of Human Health Risk Indicators for Three DischargeAlternatives Not Considering Violation of the USDW.
Mean Believed Violation Days In 30 Years1AlternativeDisposalMethods Arsenic Microbial2 NDMA
Deep WellInjection 1 0.1 0.5
OceanOutfall 10 50 30
CanalAquiferRecharge
0.3 5 40
1Results reflect input developed on a relative basis, and should not be evaluated individually.2rotavirus for ground water nodes; Cryptosporidium parvum for surface water nodes
Table 1 (b). Comparison of an Ecological Risk Indicator for three Discharge AlternativesNot Considering Violation of the USDW
Mean Believed Violation Days In 30 Years1
Alternative Disposal MethodsTKN
Deep Well Injection 10Ocean Outfall 40Canal Aquifer Recharge 1001Results reflect input developed on a relative basis, and should not be evaluated individually.
Table 1 (c). Relative Risk Indicators for Three Disposal Alternatives Not ConsideringViolation of the USDW
Relative Mean Believed Violation Days In 30 Years1
(days/days)Alternative DisposalMethods Arsenic
Microbial (rotavirusor Cryptosporidium
parvumNDMA TKN
Injection Well/OceanOutfall 10-1 10-3 10-2 10-1
Injection Well/CanalAquifer Recharge 100 10-2 10-2 10-1
1Higher values represent higher potential frequency of, and/or higher uncertainty in the probability of,violating surface and drinking water standards given current treatment requirements, for a generalizedscenario in Southeast Florida. Values less than one indicate a lower believed risk of violating standardsfor injection well disposal relative to the alternative.
FPL-012-008

9
2. INTRODUCTION In this research, indicators of the human health and ecological risks of available alternatives for disposal of treated municipal wastewater effluent in Southeast Florida were evaluated on a relative basis. Injection to deep wells is currently one alternative for disposing municipal wastewater effluent in Southeast Florida. However, elevated concentrations of ammonia and total Kjeldahl nitrogen, and depressed salinity, relative to native water in the Floridan Aquifer, have been reported in monitoring wells in zones overlying the injection zone in Miami-Dade County. This finding has raised concerns of the U.S. EPA and others regarding the extent of migration of injected water. At the time of study, little was known regarding the relative risks of such alternatives. Municipal wastewater effluent disposal alternatives in Southeast Florida and considered in this proposal include (a) injection wells, (b) ocean outfalls, and (c) surficial aquifer recharge via canals and shallow wells. Reuse of treated effluent for irrigation of golf courses, residential lawns, and parks was outside of the scope of this study. Because of the seasonal nature of rainfall and shallow water tables in South Florida, such reuse is not always possible during the rainy season (June through November), and therefore a backup disposal systems of similar capacity is required. That is, wastewater utilities utilizing reclaimed water for irrigation still require one of the effluent disposal alternatives listed above, for use during wet periods. The Research Team assumed advanced wastewater treatment to be required prior to surficial aquifer recharge, and aquifer recharge by shallow well injection would require full treatment (typically reverse osmosis). Therefore, surficial aquifer recharge by shallow well injection was also outside the scope of study. Objectives of the research were to: 1. Compile and summarize water quality data on treated wastewaster effluents and
ground waters, related to or in proximity with large deep well injection systems and other disposal systems in Southeast Florida,
2. Develop a conceptual model of the operating environment for each disposal option, including regulatory constraints, hydrogeological and hydrological considerations, and potential pathways of health and ecological exposure,
3. Develop a probabilistic assessment of risks of injection well disposal, based on (a) published literature, (b) available data, and (c) expert opinion, relative to those of ocean outfall and surficial aquifer recharge methods of treated-effluent disposal,
4. Develop a report addressing the relative risks of the three wastewater treatment disposal alternatives, and
5. Recommend additional data and research needs, if appropriate, to refine conclusions reached in the project report.
2.1. Project Approach
The project comprised two phases, data collection and relative risk assessment. First, data on the quality of wastewater effluents from different levels of treatment, and the quality of ground water at depths to approximately 3000 feet, were collected from participating utilities and regulatory agencies, summarized, and analyzed. In addition,
FPL-012-009

10
local and regional geologic data were collected. Data for effluents and ground waters were compared to primary and secondary drinking water standards. Second, an assessment of risks of disposing of treated municipal effluent by injection to deep wells, relative to those of disposal by ocean outfall and to those of surficial aquifer recharge, was performed. Three meetings of the Research Team were convened over the course of the project. At the first meeting, a conceptual model of the technological and environmental setting for wastewater disposal in Southeast Florida was constructed, including available wastewater treatment technologies, water quality regulations, hydrologic characteristics, and conventional and emerging wastewater constituents of concern. At the second meeting, the analysis of collected water quality data was presented, along with tree diagrams describing potential exposure pathways, and the conceptual model for the risk analysis was developed. A modified Delphi elicitation of expert judgment concerning risks associated with the three disposal alternatives was conducted electronically, based on data collected for the region, applicable published literature information, and the experience of the Research Team. Experience of the Research Team encompassed probabilistic risk analysis, wastewater process engineering, microbiological and chemical transport and modeling in groundwater, surface water, and marine waters, Floridan and Biscayne aquifer geology and hydrogeology, wastewater management and disposal, ocean outfall disposal, aquifer recharge disposal, injection well disposal, and utility permitting and management. A predictive Bayesian model was then constructed based on the conceptual model developed previously, to probabilistically compute total relative risk for the three alternatives. Information from the Delphi survey was used as input to the computer model. Initial results were presented at the third team meeting. The model and input were refined, based on a final iteration of the modified Delphi survey and review of results by the Team, to develop final relative risk estimates. Risks were then characterized in a discussion of the tradeoffs involved.
FPL-012-010

11
3. COLLECTED EFFLUENT AND WATER QUALITY DATA AND ANALYSIS A summary of data on water quality, relative to disposal of wastewater treatment plant effluent by deep well injection in Southeast Florida, is presented in this section. Water quality data for the Biscayne aquifer, upper and lower Floridan aquifer, secondary effluent, advanced wastewater treatment (AWT) effluent, and reclaimed water were collected and analyzed. Data were obtained from utilities, hydrogeologists, consulting engineers and the files of the Florida Department of Environmental Protection in West Palm Beach. Based on these data, initial comparisons and conclusions regarding potential health concerns associated with disposal of treated wastewater effluent to injection wells were drawn. 3.1. Data Collection and Analysis Methods Data were collected from utilities, hydrogeologists, consulting engineers, and the files of the Florida Department of Environmental Protection in West Palm Beach for wastewater treatment plant effluent, water quality for the Biscayne, Upper and Lower Floridan aquifer formations, and advanced treated wastewater. The utilities from which one or more of these analyses were derived included: • City of Hollywood • City of Boca Raton • City of Fort Lauderdale • City of Sunrise • City of Plantation • City of Boynton Beach • City of West Palm Beach • Palm Beach County • Broward County, North Regional Wastewater Treatment Plant • Miami-Dade County, North and South District Wastewater Treatment Plants • Seacoast Utilities • South Central Regional Wastewater Plant • Collier County Water-Sewer District • Florida Governmental Utility Authority (FGUA), Sarasota plant • FGUA, Golden Gate plant The last three utilities are located in southwest Florida, and were included to supplement information not completely available for Southeast Florida. Much of the data for injection wells was taken from injection well completion reports sent to FDEP. These reports include the initial water quality for the Upper and Lower Floridan Aquifer (the injection zone) system, and Biscayne aquifer wells, along with representative water quality for the secondary wastewater and data collected during facility operation. All samples were grab samples except for samples of wastewater effluent, which are generally composites. Water sample sources, sampling methods, and dates are listed in detail in Appendix F.
FPL-012-011

12
3.2. Data Description Water quality data were collected for three types of treated wastewater effluent, four monitoring zones in the Floridan aquifer, and from the Biscayne aquifer, as described in the following sections. Data shown in Table 2 and Appendices A through F include only data collected prior to effluent injection, and therefore represent native water. Data for the post-injection period was used to develop Figures 1 through 8, for the five largest injection well systems in Southeast Florida. Secondary Effluent
All treated effluent currently disposed by deep well injection and ocean outfalls in Southeast Florida is secondary effluent. Secondary effluent data were obtained from FGUA-Golden Gate plant, Seacoast, City of Hollywood, City of Fort Lauderdale, Broward County North Regional Wastewater Treatment Plant, South Central Regional Wastewater Treatment Plant, City of Sunrise, and the Miami-Dade Water and Sewer Department South and North District Plants. Reclaimed Water Data for reclaimed water were collected from the City of Boca Raton and the City of Hollywood, for comparative analysis. Several semi-annual results were obtained from each utility. Reclaimed water samples are grab or composite samples, as detailed in Appendix F. AWT To receive regulatory approval to discharge treated effluent to surficial aquifers, wastewater treatment facilities would be required to upgrade the currently employed secondary treatment facilities to “advanced wastewater treatment” (AWT). Here AWT refers to standard treatment with the addition of tertiary treatment for nutrient removal, and filtration. Currently, all wastewater treatment plants in the tri-county area employ secondary, or advanced secondary (reuse), treatment only. Therefore, AWT water quality analyses were obtained from two FGUA-Sarasota AWT plants. AWT water samples were 24-hour composites, with the exception that certain parameters including pH, TRC, and coliforms, can be measured only in grab samples. Effluent Injection Zone During injection well construction, all injection zones were sampled for native water quality. One water quality report each was obtained from City of Boynton Beach, Seacoast Utilities, the City of West Palm Beach, Broward County North Regional Wastewater Treatment Plant, and the City of Ft. Lauderdale, and 20 reports were obtained from Miami-Dade South and North District Plants. In general, the water analyses appeared to reflect native water quality. However, the reports from West Palm Beach and Ft. Lauderdale, and four from Miami-Dade County, showed TDS values of 10,000 mg/L or
FPL-012-012
13
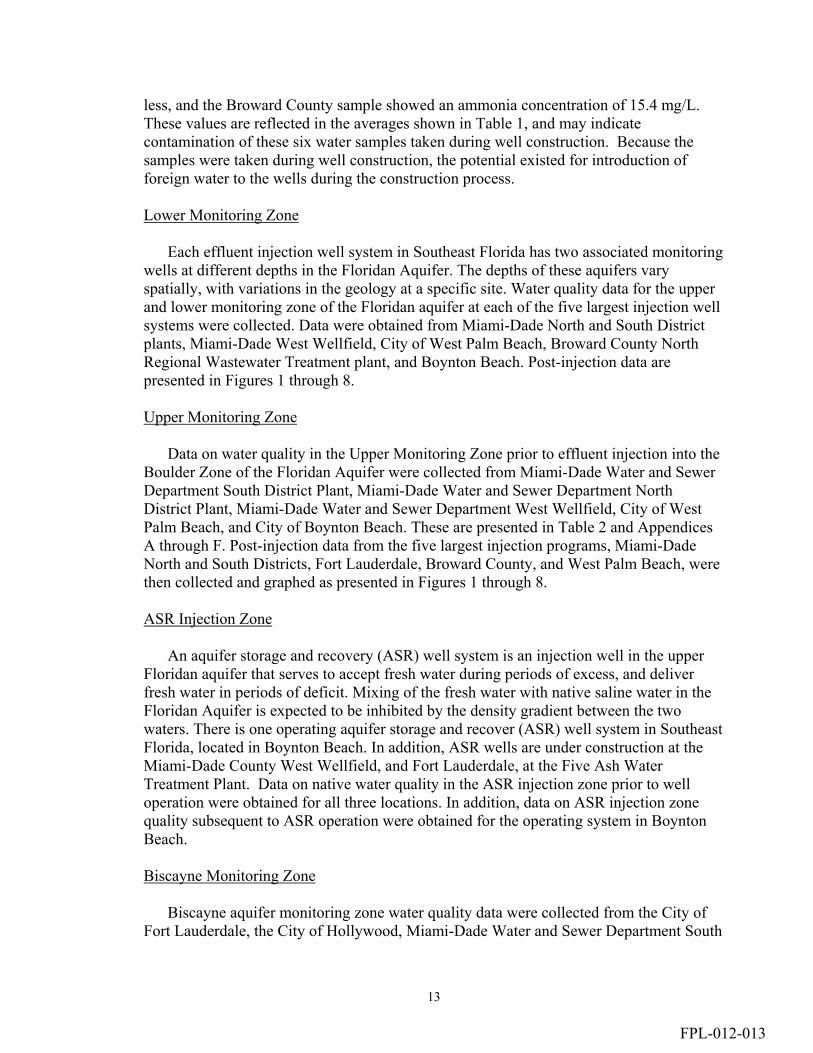
less, and the Broward County sample showed an ammonia concentration of 15.4 mg/L. These values are reflected in the averages shown in Table 1, and may indicate contamination of these six water samples taken during well construction. Because the samples were taken during well construction, the potential existed for introduction of foreign water to the wells during the construction process. Lower Monitoring Zone Each effluent injection well system in Southeast Florida has two associated monitoring wells at different depths in the Floridan Aquifer. The depths of these aquifers vary spatially, with variations in the geology at a specific site. Water quality data for the upper and lower monitoring zone of the Floridan aquifer at each of the five largest injection well systems were collected. Data were obtained from Miami-Dade North and South District plants, Miami-Dade West Wellfield, City of West Palm Beach, Broward County North Regional Wastewater Treatment plant, and Boynton Beach. Post-injection data are presented in Figures 1 through 8. Upper Monitoring Zone Data on water quality in the Upper Monitoring Zone prior to effluent injection into the Boulder Zone of the Floridan Aquifer were collected from Miami-Dade Water and Sewer Department South District Plant, Miami-Dade Water and Sewer Department North District Plant, Miami-Dade Water and Sewer Department West Wellfield, City of West Palm Beach, and City of Boynton Beach. These are presented in Table 2 and Appendices A through F. Post-injection data from the five largest injection programs, Miami-Dade North and South Districts, Fort Lauderdale, Broward County, and West Palm Beach, were then collected and graphed as presented in Figures 1 through 8. ASR Injection Zone An aquifer storage and recovery (ASR) well system is an injection well in the upper Floridan aquifer that serves to accept fresh water during periods of excess, and deliver fresh water in periods of deficit. Mixing of the fresh water with native saline water in the Floridan Aquifer is expected to be inhibited by the density gradient between the two waters. There is one operating aquifer storage and recover (ASR) well system in Southeast Florida, located in Boynton Beach. In addition, ASR wells are under construction at the Miami-Dade County West Wellfield, and Fort Lauderdale, at the Five Ash Water Treatment Plant. Data on native water quality in the ASR injection zone prior to well operation were obtained for all three locations. In addition, data on ASR injection zone quality subsequent to ASR operation were obtained for the operating system in Boynton Beach. Biscayne Monitoring Zone Biscayne aquifer monitoring zone water quality data were collected from the City of Fort Lauderdale, the City of Hollywood, Miami-Dade Water and Sewer Department South
FPL-012-013

14
District Plant, and City of West Palm Beach (technically, not the Biscayne Aquifer in the West Palm Beach area). These water samples represent Biscayne Aquifer groundwater, the main source of water supply in the tri-county area. A distinction has been drawn between this water and surface water of the canals of the area. While interconnections between Biscayne aquifer water and canal water exist, the two water sources are covered under different regulations. 3.3. Results of Data Analysis A summary of data averages for treated secondary effluent, reclaimed water, ambient waters from the effluent injection zone, Floridan Aquifer lower and upper monitoring zones, the Biscayne Aquifer monitoring zone, aquifer storage and recovery (ASR) injection zone (Upper Floridan), and AWT effluent, is shown in Table 2. Data are from locations in Southeast Florida, except that AWT samples were obtained from Southwest Florida, because no AWT facilities exist in the project area. All data shown in Table 2 represent measurements taken prior to the injection of treated wastewater effluent. Therefore, the aquifer and injection zone data presented should represent native waters. Averages of all available data are shown. The data were not weighted according to time or wastewater utility. Concentrations shown in Table 2 for the effluent injection zone appear to reflect the influence of non-native water. In particular, six of the 25 reports obtained indicated TDS values of 10,000 mg/L or less, and one reported an ammonia concentration of 15.4 mg/L. These samples are reflected in the averages shown, and may indicate contamination of these six water samples during well construction. More detailed data summaries appear in Appendices A through C. Data and analysis of volatile organic compounds (VOCs) and synthetic organic compounds (SOCs) are shown in Appendix D. Plots of the data are presented in Appendix E. Because detection limits for VOCs and SOCs varied widely among laboratories, concentrations were assumed equal to one half of the detection limit. Sources, sampling methods, and dates of all water samples are listed in Appendix F.
FPL-012-014

15
Table 2. Averages of Data Collected for Treated Wastewaters and Ground Waters
Parameter Name Drinking Water MCL
AWT Reclaimed Water Analysis
Secondary Effluent
Effluent Injection Zone
Lower Monitoring Zone
Upper Monitoring Zone
ASR Injection Zone
Biscayne Monitoring Zone
Inorganic Analysis Arsenic (mg/L) 0.050 0.001 0.003 0.003 0.010 0.007 0.005 0.002 0.015 Barium (mg/L) 2.000 0.094 0.023 0.184 0.363 0.089 0.404 0.244 Cadmium (mg/L) 0.005 0.000 0.001 0.001 0.004 0.012 0.065 0.003 0.001 Chromium (mg/L) 0.100 0.001 0.003 0.005 0.014 0.023 0.006 0.010 0.004 Cyanide (mg/L) 0.200 0.002 0.015 0.006 0.009 0.004 0.002 0.004 Fluoride (mg/L) 4.000 0.940 0.420 0.790 0.700 0.860 1.470 1.580 0.190 Lead (mg/L) 0.015 0.000 0.001 0.004 0.069 0.108 0.022 0.002 0.009 Mercury (mg/L) 0.002 0.000 0.000 0.000 0.000 0.001 0.001 0.000 0.000 Nickel (mg/L) 0.100 0.002 0.005 0.011 0.023 0.036 0.025 0.004 0.003 Nitrate (mg/L) 10.00 3.690 3.820 0.420 0.070 0.040 0.030 0.190 Nitrite (mg/L) 1.000 0.013 0.575 0.009 0.025 0.012 0.006 0.005 Selenium (mg/L) 0.050 0.001 0.004 0.004 0.637 0.007 0.004 0.005 0.001 Sodium (mg/L) 160.0 64.00 75.00 114.0 8062 5514 1357 1215 80.0 Antimony (mg/L) 0.006 0.142 0.013 0.003 0.019 0.010 0.004 0.001 Beryllium (mg/L) 0.004 0.004 0.001 0.008 0.010 0.005 0.001 0.000 Thallium (mg/L) 0.002 0.001 0.002 0.305 0.013 0.007 0.001 0.001 Secondary Analysis Aluminum (mg/L) 0.200 0.050 0.074 0.20 0.917 0.744 0.163 0.823 Chloride (mg/L) 250.0 82.20 116.9 151.85 15302.5 9897.0 2203.3 2448.4 176.2 Copper (mg/L) 1.000 0.003 0.021 0.004 0.21 0.032 0.132 0.010 0.005 Iron (mg/L) 0.300 0.000 0.177 0.183 3.151 4.450 19.294 1.079 0.420 Manganese (mg/L) 0.050 0.024 0.018 0.038 0.046 0.027 0.043 0.013 Silver (mg/L) 0.100 0.001 0.002 0.037 0.008 0.005 0.004 0.003 Sulfate (mg/L) 250.0 179.5 76.20 56.623 2379.2 1117.9 401.0 521.8 38.80 Zinc (mg/L) 5.000 0.000 0.023 0.014 0.008 0.015 0.059 0.082 0.025 Color (PtCo units) 15.00 33.00 43.91 7.400 6.300 12.60 12.00 21.90 Odor (TON) 3.000 2.500 10.95 1.200 3.300 2.100 13.50 0.700 pH 6.5-8.5 7.000 6.863 7.700 7.900 7.700 7.500 8.100 TDS (mg/L) 500.0 528.0 550.71 28682 18328 4128 5240 533.0 Foaming Agents (mg/L) 1.500 0.143 2.518 0.080 0.253 0.118 0.074 0.193 Trihalomethane Analysis Total THMs (ug/L) 80.00 26.850 61.584 0.167 0.650 0.500 2.607 0.026 Radiological Analysis Gross Alpha (pCi/L) 15 3.167 0.400 9.675 7.300 4.100 24.660 5.550 Miscellaneous Analysis Ammonia-N (mg/L) - 8.753 3.766 0.561 0.644 0.575 Nitrogen, total (mg/L) - 13.30 17.000 9.350 0.881 1.330 Nitrogen, organic (mg/L) - 1.584 0.998 0.374 0.432 0.307 Nitrogen, total Kjeldahl (mg/L) - 4.075 9.783 5.528 0.474 0.678 0.830 Ortho-phosphate (mg/L) - 1.431 0.234 0.045 0.023 0.133 Phosphorus, total (mg/L) - 1.375 1.327 0.271 0.261 0.129 0.255 BOD (mg/L) - 8.300 4.300 5.400 7.000 1.400 Total Coliform (col/100ml) - 394.071 33.50 7.000 0.500 6.000 Water Temperature (°C) - 25.333 22.80 23.50 24.30 24.40
Numbers are the average of the means of the measurements calculated with non-detects as zero and non-detects at their detection limit values
FPL-012-015
16
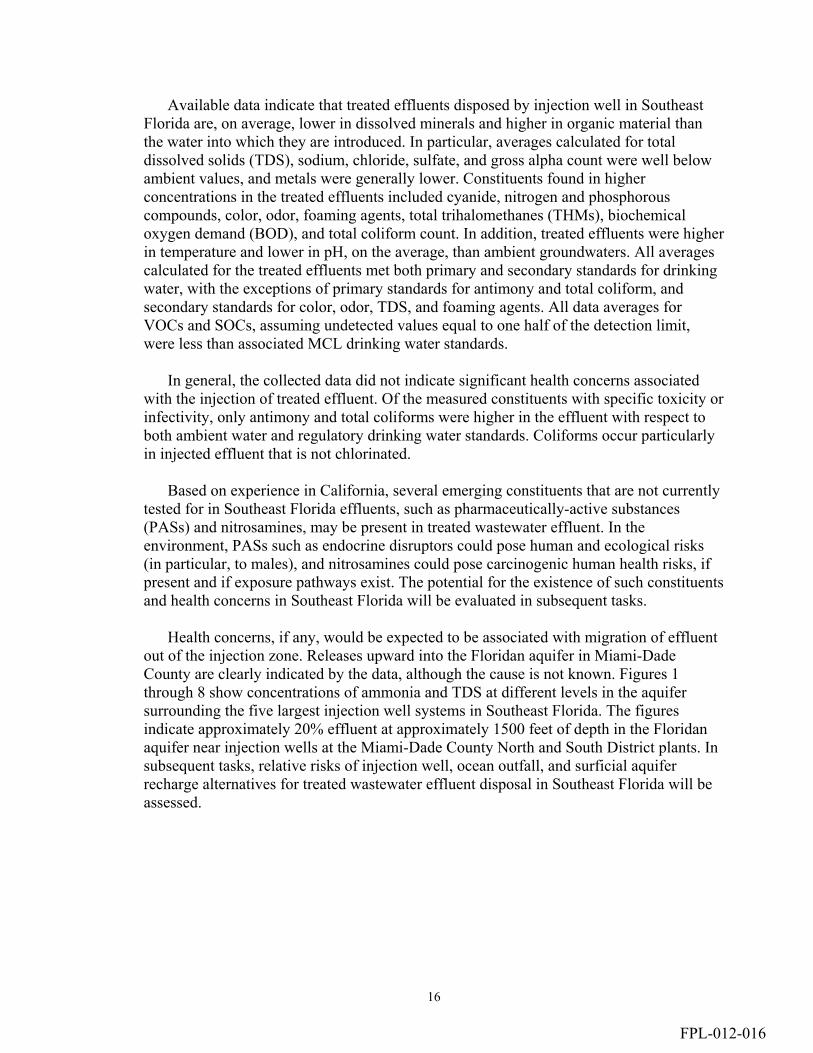
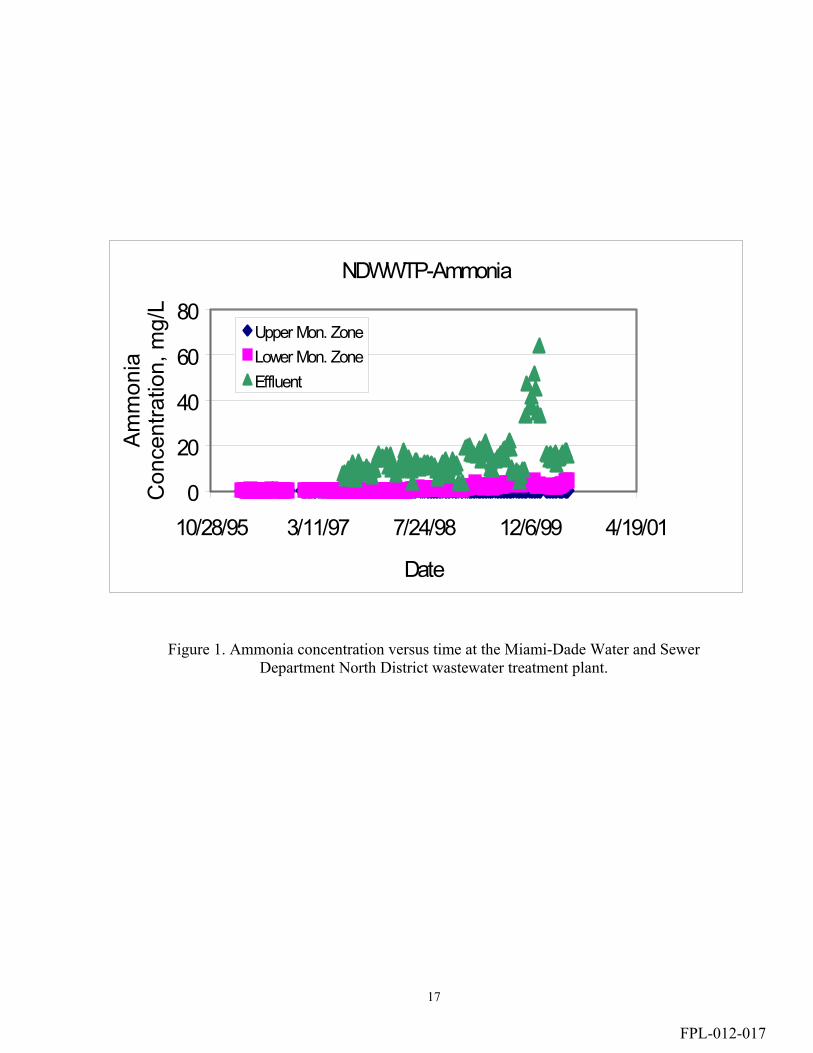
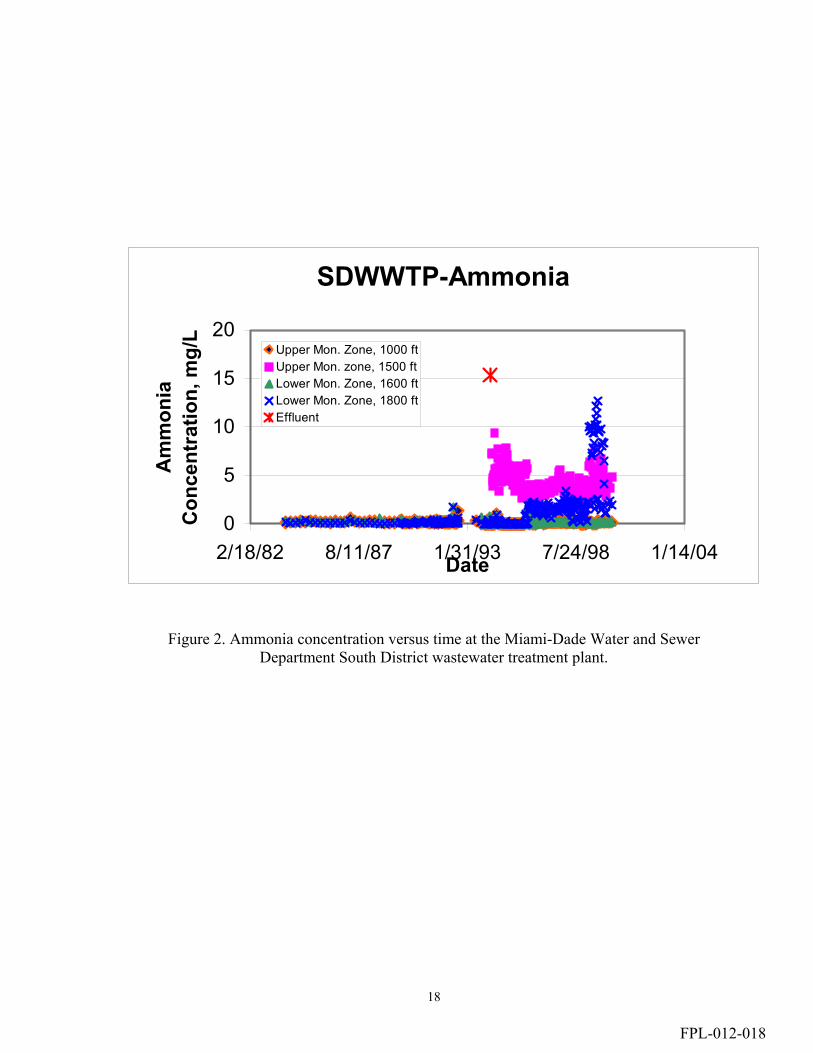
Available data indicate that treated effluents disposed by injection well in Southeast Florida are, on average, lower in dissolved minerals and higher in organic material than the water into which they are introduced. In particular, averages calculated for total dissolved solids (TDS), sodium, chloride, sulfate, and gross alpha count were well below ambient values, and metals were generally lower. Constituents found in higher concentrations in the treated effluents included cyanide, nitrogen and phosphorous compounds, color, odor, foaming agents, total trihalomethanes (THMs), biochemical oxygen demand (BOD), and total coliform count. In addition, treated effluents were higher in temperature and lower in pH, on the average, than ambient groundwaters. All averages calculated for the treated effluents met both primary and secondary standards for drinking water, with the exceptions of primary standards for antimony and total coliform, and secondary standards for color, odor, TDS, and foaming agents. All data averages for VOCs and SOCs, assuming undetected values equal to one half of the detection limit, were less than associated MCL drinking water standards. In general, the collected data did not indicate significant health concerns associated with the injection of treated effluent. Of the measured constituents with specific toxicity or infectivity, only antimony and total coliforms were higher in the effluent with respect to both ambient water and regulatory drinking water standards. Coliforms occur particularly in injected effluent that is not chlorinated. Based on experience in California, several emerging constituents that are not currently tested for in Southeast Florida effluents, such as pharmaceutically-active substances (PASs) and nitrosamines, may be present in treated wastewater effluent. In the environment, PASs such as endocrine disruptors could pose human and ecological risks (in particular, to males), and nitrosamines could pose carcinogenic human health risks, if present and if exposure pathways exist. The potential for the existence of such constituents and health concerns in Southeast Florida will be evaluated in subsequent tasks. Health concerns, if any, would be expected to be associated with migration of effluent out of the injection zone. Releases upward into the Floridan aquifer in Miami-Dade County are clearly indicated by the data, although the cause is not known. Figures 1 through 8 show concentrations of ammonia and TDS at different levels in the aquifer surrounding the five largest injection well systems in Southeast Florida. The figures indicate approximately 20% effluent at approximately 1500 feet of depth in the Floridan aquifer near injection wells at the Miami-Dade County North and South District plants. In subsequent tasks, relative risks of injection well, ocean outfall, and surficial aquifer recharge alternatives for treated wastewater effluent disposal in Southeast Florida will be assessed.
FPL-012-016
17
Figure 1. Ammonia concentration versus time at the Miami-Dade Water and Sewer Department North District wastewater treatment plant.
NDWWTP-Ammonia
0
20
40
60
80
10/28/95 3/11/97 7/24/98 12/6/99 4/19/01
Date
Amm
onia
C
once
ntra
tion,
mg/
L
Upper Mon. ZoneLower Mon. ZoneEffluent
FPL-012-017
18
Figure 2. Ammonia concentration versus time at the Miami-Dade Water and Sewer Department South District wastewater treatment plant.
SDWWTP-Ammonia
0
5
10
15
20
2/18/82 8/11/87 1/31/93 7/24/98 1/14/04Date
Am
mon
ia
Con
cent
ratio
n, m
g/L
Upper Mon. Zone, 1000 ftUpper Mon. zone, 1500 ftLower Mon. Zone, 1600 ftLower Mon. Zone, 1800 ftEffluent
FPL-012-018

19
Figure 3. Ammonia concentration versus time at the Broward County wastewater treatment plant.
Broward County - Ammonia
00.10.20.30.40.50.60.70.8
11/6/97 11/16/97 11/26/97 12/6/97 12/16/97 12/26/97 1/5/98
Date
Am
mon
ia C
once
ntra
tion,
m
g/L
Upper Mon. Zone
FPL-012-019

20
Figure 4. Ammonia concentration versus time at the Fort Lauderdale wastewater treatment
plant.
Fort Lauderdale - Ammonia
0
2
4
6
8
10
12
6/15/94 10/28/95 3/11/97 7/24/98 12/6/99 4/19/01
Date
Am
mon
ia
Con
cent
ratio
n,
mg/
L
Lower Mon. Zone, 1500 ftLower Mon. Zone, 2000 ftUpper Mon. Zone
FPL-012-020

21
Figure 5. TDS concentration versus time at Miami-Dade Water and Sewer Department
North District wastewater treatment plant.
NDWWTP - TDS
0
5000
10000
15000
20000
25000
30000
35000
10/28/95 3/11/97 7/24/98 12/6/99 4/19/01Date
TDS
Con
cent
ratio
n,
mg/
L
Upper Monitoring Zone
Lower Monitoring Zone
Effluent
FPL-012-021
22
Figure 6. TDS concentration versus time at Miami-Dade Water and Sewer Department South District wastewater treatment plant.
SDWWTP - TDS
0
5000
10000
15000
20000
25000
30000
35000
40000
45000
50000
2/18/82 11/14/84 8/11/87 5/7/90 1/31/93 10/28/95 7/24/98 4/19/01Date
TDS
Con
cent
ratio
n, m
g/L
Upper Mon. Zone, 1000ftUpper Mon. Zone, 1500 ftLower Mon. Zone, 1600 ftLower Mon Zon, 1800 ftEffluent
FPL-012-022

23
Figure 7. TDS concentration versus time at the Broward County wastewater treatment
plant.
Broward County - TDS
0100020003000400050006000700080009000
1/20/97 3/11/97 4/30/97 6/19/97 8/8/97 9/27/97 11/16/97 1/5/98 2/24/98
Date
TDS
CO
ncen
trat
ion,
mg/
L
Upper Monitoring Zone
Effluent
FPL-012-023

24
Figure 8. TDS concentration versus time at the Fort Lauderdale wastewater treatment plant.
Fort Lauderdale - TDS
0
5000
10000
15000
20000
25000
30000
35000
40000
45000
50000
6/15/94 10/28/95 3/11/97 7/24/98 12/6/99 4/19/01
Date
TDS
Con
cent
ratio
n, m
g/L
Surfacial Mon. zone, 8 ft
Upper Mon. Zone, 1000 ft
Lower Mon. Zone, 1500 ft
Lower Mon. Zone, 2000
FPL-012-024
25
4. SYSTEM DESCRIPTION
This section summarizes the treatment and disposal alternatives, and applicable regulatory standards, in Southeast Florida. As part of the description of injection well disposal systems, the geological setting of the region as it pertains to injection well effluent disposal is summarized. 4.1. Wastewater Treatment Unit Processes and Regulations in Southeast Florida The findings, intent and anti-degradation policy for surface water quality are found in Chapter 62-302.300 Florida Administrative Code (F.A.C.), and are in conformance with Article II, Section 7 of the Florida Constitution which requires abatement of water pollution, and conservation and protection of the natural resources and scenic beauty of Florida. In addition, Section 101(a)(2) of the Federal Water Pollution Control Act, as amended, declares the intention to achieve water quality sufficient for the protection and propagation of fish, shellfish, and wildlife, as well as for recreation in and on the water by July 1, 1983. Congress further stated in Section 101(a)(3), that it is the national policy that the discharge of pollutants in toxic amounts be prohibited. In Florida, all domestic wastewater treatment plants must be operated and maintained in accordance with the applicable provisions of 62-600.410 Florida Administrative Code (F.A.C.) so as to attain, at a minimum, the effluent quality required by the applicable discharge option. The following effluent requirements apply: • All reuse and land application systems must be operated and maintained in accordance
with the applicable provisions of Chapter 62-610, F.A.C. • All underground injection effluent disposal systems must be operated and maintained
in accordance with the applicable provisions of Chapter 62-528, F.A.C. • All surface water discharge systems must be operated and maintained in accordance
with the applicable provisions of Chapter 62-4, F.A.C. To achieve the statutory provisions for wastewater quality, different degrees of treatment are required. The following paragraphs outline the treatment required to meet the effluent quality requirements of the State. Process schematics are shown in Appendix G. Primary Treatment Primary treatment is defined as the use of treatment trains to accomplish the removal of a portion of the suspended solids and organic matter prior to discharge into the receiving water (Figure G-1). Typically the treatment consists of settling basins (or primary clarifiers) and macro-scale screening (i.e., bar racks or screens). These processes remove only the largest constituents (and those most likely to clog pumps and pipes). Thus the effluent will have a high concentration of biological oxygen demand (BOD) and organics (typically over 40 percent of the incoming amount). Primary clarifiers are
FPL-012-025
26
designed to remove 50 to 70 percent of the suspended solids and 25-40 percent of the BOD. They typically precede biological processes and can be used for flow equalization in secondary treatment facilities. These clarifiers have a detention time from 10 to 30 minutes, hence the low removal rates compared to secondary treatment. No biological processes are used. Most primary facilities are being phased out and replaced with secondary systems nation-wide. Boston has one of the largest primary systems and the expenses being incurred there to improve effluent quality. In Florida, there are no current, large primary facilities. Secondary Treatment Secondary treatment is directed principally toward the removal of biodegradable organics and suspended solids. Biological processes are activated sludge, fixed film reactors, extended aeration systems, or lagoons, and employ secondary clarifiers after the biological process. During the biological process, air is introduced into the wastewater in order to increase the food:air ratio to a point where the optimum number of bacteria will consume the incoming organics and use up the air. As the organisms pass the optimum lifetime, they die. During the secondary clarification process, the dead/dying bacteria, along with non-consumed organics and metals, will settle to the bottom. They are removed as sludge and disposed of via the sludge rules. Disinfection via chlorination or ultra-violet is preferred. Typically a secondary treatment facility will have a bar screen, and may have a primary clarifiers ahead of the biological treatment process (Figure G-2). Secondary plants are designed to achieve an effluent prior to discharge containing not more than 30 mg/L CBOD5 and 30 mg/L TSS, or 85% removal of these pollutants from the wastewater influent, whichever is more stringent. The requirement is 20 mg/L CBOD5 for injection wells. Appropriate disinfection and pH control of the effluents is normally required. Coastal waters have more stringent effluent limits. Reclaimed Water (Advanced Secondary) Advanced secondary treatment in Florida is also termed reuse quality water (Figure G-3). It requires the employment of all secondary processes, plus filtration and high level disinfection, (residual over 1.0 after a given period of time). Typically the filtration step uses gravity sand/anthracite filters. Land application or ground water discharge systems (excluding underground injection) are designed to achieve an effluent quality (after disinfection) containing not more than 5 mg/L total suspended solids (TSS). Advanced secondary treatment is often confused with tertiary treatment. However, the latter assumes nutrient removal, which does not occur with filtration. The nutrients are generally preferred by the reuse recipient.
FPL-012-026
27
Principal Treatment (More Advanced Secondary) Principal treatment is a term in Florida Rule 62-610 F.A.C. For reclaimed water projects to be applied to ground water recharge and indirect potable reuse projects, primary treatment standards have been developed in Florida, to include: • Water quality that meets secondary treatment quality with high-level disinfection. The
reclaimed water cannot contain more than 5.0 mg/L of total suspended solids before application of the disinfectant;
• Filtration for total suspended solids control. By removing TSS before disinfection, filtration serves to increase the ability of the disinfection process to inactivate virus and other pathogens. Filtration also serves as the primary barrier for removal of protozoan pathogens (Cryptosporidium, Giardia, and others). Addition of chemical coagulants generally increases the effectiveness of pathogen removal. Chemical feed facilities include coagulants, coagulant aids, or poly-electrolytes. Chemical feed facilities may be idle (on stand-by) if the water quality limitations are being achieved without chemical addition; and
• Total nitrogen is limited to 10 mg/L of nitrogen as a maximum annual average limitation. Monthly average and single sample permit limitations are established using the multipliers in Rule 62-600.740 (1) (b) 2, F.A.C. For surface water discharges, Water Quality Based Effluent Limits (WQBELs) established under Chapter 62-650, F.A.C., may place additional limitations on nitrogen or other parameters.
The principal treatment requirement applies where nitrogen is thought to be a problem. If nitrogen creates a discharge problem, chemical processes such as those described under advanced wastewater treatment are employed. Advanced Wastewater Treatment (AWT) The term advanced wastewater treatment (AWT) is generally used in Southeast Florida to include treatment necessary to raise wastewater quality beyond that produced by secondary treatment, including reduction of nutrients, toxicity, suspended solids, and organics. Typically, AWT includes secondary treatment, plus nutrient removal (nitrification, de-nitrification and phosphorous removal) and may not contain more, on an annual average basis, than the following concentrations (see Figure G-5): • Carbonaceous Biochemical Oxygen Demand CBOD5 5 mg/l • Total Suspended Solids 5 mg/l • Total Nitrogen (as N) 3 mg/l • Total Phosphorus (as P) 1 mg/l • Reclaimed water discharged to a treatment or a receiving wetland may not exceed 2.0
milligrams per liter total ammonia (as N) as a monthly average. TSS removal can be accomplished via the filtration step in advanced secondary treatment. Thus every process included in advanced secondary treatment is included in AWT. In addition, nitrification/denitrification is commonly accomplished in Florida with methanol
FPL-012-027

28
and bio-reactors or rotating biological disks. Phosphorus is commonly removed by the addition of alum coagulants (which increases sludge volume significantly). This level of treatment and disinfection, or specific components of these levels of treatment and disinfection, shall be applied to ground water recharge and indirect potable reuse projects. Full Treatment And Disinfection Requirements Florida Rule 62-610.563, F.A.C., defines “full treatment and disinfection.” This concept is employed in groundwater recharge programs in California. Full treatment systems include all the treatment steps contemplated under AWT, plus reverse osmosis and/or activated carbon for removal of the remaining organics to reduce TOC and TOX, and some pathogen removal (see Figure G-6). Dechlorination is often required. The requirements in Florida are as follows: • The parameters listed as primary drinking water standards are applied as maximum
single sample permit limits, except for asbestos. The primary drinking water standards for bacteriological parameters are applied via the disinfection standard. The primary drinking water standard for sodium is applied as a maximum annual average permit limitation. Multipliers are established in Rule 62-600.740(1)(b) 2, F.A.C. as maximum monthly and single sample maximum permit limits for sodium.
• Except for pH, the parameters listed as secondary drinking water standards shall be applied as maximum annual average permit limits, with the multipliers
• All pH observations must fall within the pH range established in the secondary drinking water standards.
• Additional reductions are required of pollutants which otherwise would be discharged in quantities which would reasonably be anticipated to pose risk to public health because of acute or chronic toxicity.
• Total organic carbon (TOC) cannot exceed 3.0 mg/L as the monthly average limitation; no single sample shall exceed 5.0 mg/L.
• Total organic halogen (TOX) cannot exceed 0.2 mg/L as the monthly average limitation; no single sample can exceed 0.3 mg/L.
• The treatment processes must include processes that serve as multiple barriers for control of organic compounds and pathogens.
• Treatment and disinfection requirements are additive to other effluent or reclaimed water limitations imposed by other rules (such as WQBEL limits designed to protect surface water quality, which are imposed by Chapter 62-650, F.A.C.).
Membrane Treatment Options And Resulting Concentrate Membrane treatment is a viable technology for salinity reduction and desalination in regions with significant amounts of saltwater and variable amounts of freshwater, water supplies of critical environmental concern, and drought-prone areas with saltwater sources. Membranes may be required for full treatment of wastewater. In practice, the disposal of concentrate is an issue. Figure G-7 shows a typical process flow diagram for membrane processes. These processes include pretreatment, membrane treatment and
FPL-012-028
29
post-treatment. The process recovery rate for reverse osmosis systems is estimated to produce a 60 to 90 percent recovery, depending on the quality of the feedwater. Pretreatment to precede membrane treatment includes both physical and chemical processes. A scale inhibitor and sulfuric acid are injected into the water to stabilize the water before it flows into the cartridge filters. The design pH for a reverse osmosis system is between 5.5 and 6.5. Cartridge filtration is essential for removal of suspended particulates larger than five microns from the raw water. Once the feedwater is chemically conditioned and suspended solids are removed, it is delivered to the feed pumps. Typically a dedicated feed pump supplying each skid increases the feedwater pressure prior to applying the feedwater to the membrane process. The configuration of the membrane skids generally accommodates two stages of reverse osmosis membranes with pressures between 100 and 400 psi depending on water quality. A membrane system shut-down flush is required every time a membrane skid is taken out of operation. The raw water in the membrane elements is replaced with permeate water from the permeate flushing tank. The permeate is pumped through the membrane elements using the feed pump at low pressure. After passage through the membrane skids, the residual pressure allows the water to move to the post-treatment processes, which may include degasification and chemical addition. These are required for stabilization of the water to reduce corrosivity. Post-treatment chemicals typically are sodium hydroxide, zinc orthophosphate, sodium silicofluoride, ammonia, and chlorine.
The membrane cleaning/flushing system consists of cleaning and flushing solution tanks, 5-micron cartridge filters, and cleaning pumps. The cleaning pumps are constructed to handle high and low pH cleaning chemicals.
Most facilities include a central supervised computer system that allows operations staff to operate and monitor the membrane treatment process from one location. The computer system will also allow the operators to monitor the entire water distribution system, including the wellfields and tanks, and to monitor the wastewater system during storm events. Membrane treatment facilities produce a waste stream commonly referred to as “reject water” or “concentrate.” The United States Environmental Protection Agency (USEPA) has classified this waste stream as an industrial waste, thereby requiring an industrial wastewater discharge permit from the Florida Department of Environmental Protection (FDEP). To permit this discharge, the utility must conduct a series of tests to demonstrate that the concentrate is not toxic to the receiving environment. Ion imbalances are typically a surface water discharge problem.
FPL-012-029
30
4.2. Wastewater Disposal Alternatives and Regulations in Southeast Florida The three principal alternatives for disposing of treated wastewater effluent in Southeast Florida are described in this section. Surface Water and Surficial Discharges Surface water discharge is one of the oldest methods of wastewater disposal. Mechanisms of public health protection include dilution and natural degradation processes, given sufficient treatment prior to discharge. In the U.S., the discharge point is usually a pipe on the side of the stream (for small systems) or a pipe into the bottom of the water body with one or more holes (or diffusers). Each diffuser in the pipe has a percentage of the total flow going through it. The pipe is generally comes from the effluent wet well or chlorination chamber to the discharge point. Dechlorination (if required) is often performed in the pipe. Smaller systems often use gravity flow, while larger system have larger pipes and generally require pumping from a wet well to get peak flows out of the plant. Figure G-8 shows the typical layout for a surface discharge (excluding ocean outfalls). The most important potential environmental impact of discharge of wastewater effluent to a surface water body is a decrease in dissolved oxygen levels in the surface water downstream of the discharge, due to consumption of oxygen in the oxidation of organics in the wastewater. For this reason, secondary treatment is generally required in the U.S. prior to discharge of wastewater effluent to surface water. Secondary treatment is designed to remove oxygen demand, such that oxygen levels return to levels necessary to support life through turbulence, wind, rain, and photosynthetic activity. In smaller or more sensitive water bodies, advanced (AWT) treatment is often required. This is especially true in South Florida where the delineation between the surficial groundwater system and the canal system is less clear. Other potential environmental impacts of surface discharge arise from the precipitation of metals and other heavy compounds on the bottom of the receiving water body, downstream of discharge. Heavy metal accumulation among benthic populations, and the recycling of these metals through the food chain, is a subject of current research. Currently, mercury is the metal receiving the most scrutiny in South Florida. Natural drainage in Southeast Florida is by “sheetflow,” or shallow surface flooding during the wet season with gradual movement either through the Everglades towards the Gulf of Mexico and Florida Bay, or across the coastal ridge into Biscayne Bay. Surface water drainage in Southeast Florida is currently controlled by a series of canals. Because canals represent the only significant surface flows outside of the Everglades, discharges of wastewater effluent would be via the canal system. However, due to the flat topography and long periods with minimal rainfall, DO levels typically decrease in canals during the spring. In some areas where organic loading is high, canal water can turn septic. Ecological concerns spawned a move in the 1960's and 1970's away from surface discharges in South Florida, though they are still used in North Florida. A few west coast
FPL-012-030

31
surface discharges, where no other discharge option was available, have been converted to AWT. Canal discharge of wastewater in Southeast Florida could also affect groundwater levels and quality. The Biscayne Aquifer is exposed to the surface with little in the way of horizontal geological confinement, and water levels fluctuate in response to rainfall, drainage and withdrawal for irrigation and potable use. The principal source of recharge is rainfall, occurring mainly between June and October. During winter months, water level continues to decline in the aquifer without some form of supplemental recharge. The canal system operated by the South Florida Water Management District provides drainage,as well as recharge (e.g., in the vicinity of wellfields) from water stored in Lake Okeechobee. The Biscayne Aquifer System is wedge-shaped, and approximately 10 feet thick at the western boundaries of the urban area. The aquifer dips eastward to its thickest section, approximately 250 to 300 feet thick, at the coast. The increased thickness and generally higher transmissivity to the east account for the greater productivity of wells drilled in this section of the aquifer. Regional trends of the Biscayne Aquifer System show that both water quality and groundwater productivity (the transmissivity of the aquifer system) improve in eastward and southward directions. Transmissivity in the City of Hollywood area is approximately 300,000 square feet per day. Storage coefficients are reported to be 1 × 10⁻³ to 1 × 10⁻⁴, and specific yields, 0.20 to 0.30, with a vertical to horizontal ratio of 1 to 100. The natural groundwater flow direction in the Biscayne Aquifer System is to the east/southeast. Groundwater quality in the Biscayne aquifer typically decreases with aquifer depth. In some areas the water is high in hardness, iron, and TDS concentrations. Water in certain areas may also be high in concentrations of chlorides, hydrogen sulfide, and/or may have poor color quality. High chlorides and sulfates are typically attributed to connate (ancient sea) water that exists in isolated areas within the aquifer. High color originates from tannins and other compounds dissolving in the water from decomposing vegetation and organic matter (e.g., in the eastern Everglades). The water is also correspondingly high in other organic matter, which can react with chlorine to form trihalomethanes in treated drinking water.
Potential Pathways of Human Exposure to Wastewater Constituents due to Surface Discharge Discharge of municipal wastewater effluent to canals in South Florida could be assumed to fill canals, particularly during the winter dry season when canals are stagnant. Therefore, it can be assumed that AWT would be required to reduce nutrient loading. Exposure of humans to wastewater constituents could occur via the canal, or via shallow wells in the Biscayne aquifer. Swimmers, fish consumers, benthic and water column species, consumers of water from wells and canals, and those exposed to irrigation water aerosol drift could be exposed.
FPL-012-031
32
Regulatory Environment for Surface Water Discharge In keeping with the anti-degradation policy of the State of Florida, the most beneficial present and future uses of all waters of the State have been classified as follows: • Class I Potable Water Supplies • Class II Shellfish Propagation or Harvesting • Class III Recreation, Propagation and Maintenance of a Healthy, Well-Balanced
Population of Fish and Wildlife • Class IV Agricultural Water Supplies • Class V Navigation, Utility and Industrial Use Water quality standards are established by FDEP to protect these designated uses. Classification of a water body according to a particular designated use or uses does not preclude use of the water for other purposes. US EPA has delegated the surface water program FDEP. The rules state that outfalls for all facilities must not discharge effluent which does not meet the applicable secondary treatment, basic disinfection, and pH levels, prior to discharge to receiving surface waters. New facilities and modifications of existing facilities must be designed to achieve an effluent after disinfection containing not more than 20 mg/L CBOD5 and 20 mg/L TSS, or 90% removal of each of these pollutants from the wastewater influent, whichever is more stringent. No discharge of reclaimed waters or effluents to Class I waters can be made unless the reclaimed water or effluent meets the appropriate additional treatment standards (beyond secondary) and high-level disinfection criteria, to give reasonable assurance of providing equivalent protection from pathogens. Florida rule 62-302.500 F.A.C. details the surface water discharge Minimum and General Criteria. For the Minimum Criteria, all surface waters of the State must at all places and at all times be free from: • Domestic, industrial, agricultural, or other man-induced non-thermal components of
discharges which, alone or in combination with other substances or in combination with other components of discharges (whether thermal or non-thermal);
• Putrescent deposits or other nuisances; • Floating debris, scum, oil, or other matter in such amounts as to form nuisances; • Color, odor, taste, turbidity, or other conditions in such degree as to create a nuisance; • Acute toxins; • Concentrations which are carcinogenic, mutagenic, or teratogenic to human beings or
to significant, locally occurring, wildlife or aquatic species; • Dangers to the public health, safety, or welfare; • Thermal components of discharges which, alone, or in combination with other
discharges or components of discharges (whether thermal or non-thermal); and • Silver in concentrations above 2.3 micrograms/liter in predominately marine waters.
FPL-012-032
33
The surface water quality criteria apply to all surface waters outside of zones of mixing, except where inconsistent with the limitations of Section 403.061(7) F.S. An evaluation of the impact of a proposed or continued discharge on the water quality of the receiving water body must be conducted by FDEP for all proposed surface water discharges. The appropriate district office determines whether technology based effluent limits (TBELs) are adequate to maintain water quality standards in the receiving water body. If TBELs are not sufficient, or if additional information or analysis is determined to be necessary to ensure that the effluent will not violate water quality standards in the receiving water body, a water quality based effluent limit (WQBEL) must be determined. If FDEP finds that a proposed new discharge or expansion of an existing discharge will not reduce the quality of the receiving waters below the classification established for them, it may permit the discharge. In addition, FDEP cannot issue a discharge permit unless FDEP has established an effluent limit for those pollutants in the discharge that are present in quantities or concentrations which can reasonably be expected to cause or contribute, directly or indirectly, to a violation of any water quality standard established in Rule 62-302, F.A.C. For outfalls potentially discharging to waters contiguous to Class I waters, the necessity for treatment, in addition to that required, must be dependent upon the extent of travel time between the point of discharge and the effluent arrival at the boundary of Class I waters, or at the 500 foot no discharge zone surrounding potable water intakes (if any). Travel time determinations must be based upon the expected flow of the receiving water during the typically wettest month of the year. Ocean Outfall Disposal Ocean outfall discharge of wastewater effluent also has a long history throughout the world. Mechanisms of public health protection include dilution, advection away from shore, and natural environmental degradation processes. Secondary treatment is required prior to discharge in South Florida. Ocean discharge has two primary differences from other surface water discharge, those relating to the higher density (due principally to salinity) and much greater volume of receiving waters. Hence, the dilution is immediate and considerable, and effluent plumes rise. The buoyancy of the plume, and marine currents and turbulence, result in three distinct phases of dilution: • Initial plume dilution takes place from the time the effluent leaves the outfall until it
reaches the surface of the ocean. The initial dilution phase is a rapid process, taking less than two minutes. The freshwater effluent creates a turbulent, rising plume with buoyant forces exceeding the horizontal velocity forces. The result creates excellent mixing. The mixing is further improved by the horizontal movement of the Florida Current. The plume rises to the surface downstream of the outlet, by at least 10
FPL-012-033

34
meters. The initial dilution can be defined as a ratio of the constituent in the effluent and the maximum concentration at the boil;
• Near-field dilution occurs when the effluent reaches the surface. At this point, the vertical momentum of the plume is translated to horizontal momentum, and the plume is radially dispersed the plume within 3 meters of the surface. The interaction of the rising plume and the vertical movement creates the characteristic “boil.” Near-field dilution takes place within the water column, the boil and areas adjacent to the boil; and
• Far-field dilution results from the interaction of the mixing plume and surface convective processes. For highly diluted plumes, after the initial mixing processes, the subsequent dilution will be dominated by oceanic turbulence. The effects of buoyant spreading are negligible in the farfield.
There are six open ocean outfalls in Southeast Florida. All are owned by public agencies. Field investigations revealed that surfacing plumes were present at all outfalls throughout a year, even in summer months when the water column density stratification was present. This was because the density stratifications were weak enough to allow the surfacing of plumes. However, some trapping of portions of rising plumes was detected by the acoustic system during a few strong stratification conditions. Table 3 outlines the characteristics for each of the outfalls. Two of the outfalls, Miami-Central and Miami-North outfalls, have multi-port diffusers. All are in at least 28 meters of water, and 2 miles offshore. As a result, all the outfall sites are located in the westerly boundary of the Florida Current, a tributary of the Gulf Stream. The Florida Current is strong. Maximum current speeds often occur in the Florida Strait between Southeast Florida and the Bahamas, in the vicinity of Southeast Florida outfalls, advecting and dispersing outfall plumes rapidly. Ocean Outfall Monitoring Projects Previous efforts to characterize impacts of ocean outfall disposal of treated wastewater effluent in Southeast Florida include the Southeast Florida Ocean Outfall Experiments, initiated by Broward County, Miami-Dade County, and the City of Hollywood, Florida. In the first phase (SEFLOE I), field dye and salinity data were processed to obtain initial dilutions and subsequent dilutions. Initial dilution data together with current meter data and effluent discharge data were analyzed using dimensional analysis and regression to establish semi-empirical relations. Total physical dilutions, as a function of distance from the surface boil, were generated from dye concentration data and from salinity data. It was found that within the 100-meter range, the Broward and Hollywood outfall plumes undergo an enhanced dilution. This rapid dilution may be attributed to an internal hydraulic jump. Subsequent mixing of plumes may be dominated by buoyant spreading for several hundred meters from the boil, because the positive buoyancy of effluent plumes has not been dissipated even after the internal hydraulic jump. For the Miami-North and Miami-Central outfalls, effluent was initially distributed over a wide area because of multi-port diffuser discharges. However, the dilutions of these outfall plumes did not increase as rapidly as did
FPL-012-034
35
Hollywood and Broward outfall plumes. Both buoyant spreading and oceanic turbulence were expected to be dominant mixing mechanisms for subsequent mixing of these plumes. The Southeast Florida Ocean Outfall Experiment II (SEFLOE II, 1991-1994) project was a cooperative effort of state, federal and local government agencies, and Hazen and Sawyer, P.C. The project was designed to satisfy bio-monitoring concerns and provide site specific information to allow the USEPA Regional Administrator to evaluate the southern-most four open ocean outfalls. During the field studies of the project, significant efforts were made to collect physical, chemical, and biological data. These data were analyzed to characterize outfall plumes and associated environmental conditions. The objectives of the SEFLOE II project were as follows: • Scientifically characterize the physical oceanographic conditions associated with each of
the four open ocean outfalls on a year-around basis in order to identify critical oceanographic conditions;
• Characterize and define the area of rapid dilution and the mixing zones; • Determine the characteristics of the receiving water/effluent mixture both with and
without chlorination using bioassay techniques; • Examine the dilution properties and natural disinfection capability of the open ocean
upon secondary effluents dispersed through open ocean outfalls; • Determine the nutrient concentrations in the discharged effluent, background and outfall
plumes; and • Collect samples to analyze for priority pollutant and oil and grease concentrations. To achieve the project objectives, field investigations were designed to include three components: 1. Current Monitoring was accomplished using current meter mooring systems, each of
which contained two Aanderaa RCM-4 or RCM-5 current meters. Systems were deployed near each outfall discharge site during several periods within a one year span (from August 1991 to October 1992). These measurements provided long-term records of current speeds and directions. dIn addition to the mooring systems, an Acoustic Doppler Current Profiler (ADCP) was deployed near the Miami-Central outfall diffuser from July 10 to August 15, 1992. The ADCP data indicated that three current regimes are found present at the outfall sites: • Northerly-directed flows that are thought to be associated with western meanders of
the Florida Current, • Southerly flows that are expected parts of an extensive eddy current, and • Rotary-like flow that consists of groups of rotations interspersed between northerly
and southerly flows. The rotations are irregular with periods of rotation as short as three hours.
Although the three current regimes are present, the entire regional currents
continue to be from the south to the North. Easterly and westerly currents are
FPL-012-035
36
infrequent and of short duration. Therefore, the potential for the highly diluted effluent plumes reaching the shore is extremely remote. The continued northerly flow greatly reduces the superposition effect often encountered in tidal rivers where effluent concentrations are additive over time. The ADCP data revealed non-linear profiles of current speeds through the water column. In general, the current magnitude is greater near the water surface (where the plume goes) than near the bottom. Although current speed measured at a curtain depth could be zero, the vertically averaged current speed was not zero any time during the measurement period.
2. Intensive cruises by NOAA research vessels to each outfall during extreme
oceanographic conditions (one winter and one summer cruise), included:
a. Acoustic measurements during the SEFLOE II field investigations, using a high-frequency back scattering acoustic system, 200 kHz Raytheon Model DE719B Echosounder, to aid in initial plume detection, to guide plume sampling, and to provide two-dimensional acoustic images of outfall plumes; and
b. Salinity measurements made in semi-monthly small boat operations at each outfall from July 1991 to October 1992 (except the months when intensive cruises were underway). During each operation, a boat towed a CDT at 1 m or less beneath the water surface through surface plumes. The CDT data were later processed to obtain salinity distributions in surface plumes, and therefore characterizations of the plumes. Both initial dilution and subsequent dilution of plumes were estimated using salinity deficit as a tracer.
3. Water quality sampling included:
a. Bacteriological measurements, including tests for total coliforms, fecal coliforms, and enterococcus bacteria;
b. Nutrient measurements, including tests for ammonia, TKN, total phosphorous, and nitrates;
c. Measurements for oil and grease, priority pollutants (such as silver, zinc, and phenols), and total suspended solids (TSS); and
d. Analysis of effluent samples collected in treatment plants, for salinity, bacteria, nutrients, priority pollutants, oil and grease, BOD5, and TSS.
FPL-012-036
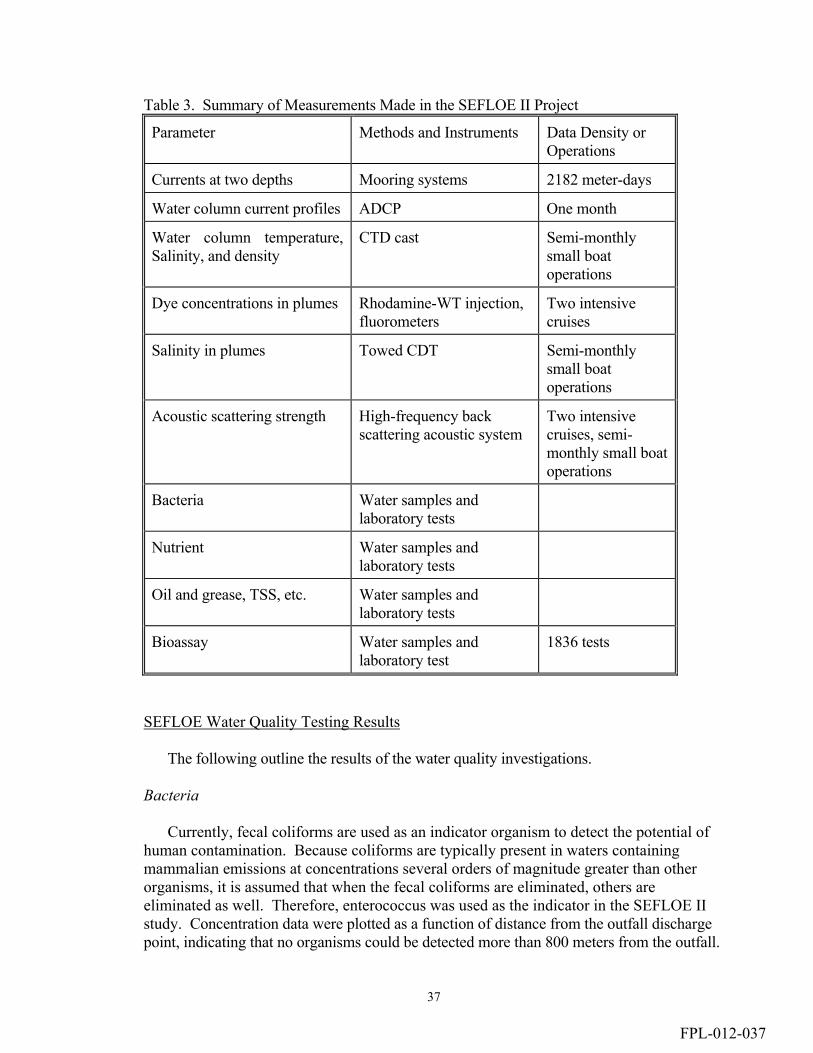
37
Table 3. Summary of Measurements Made in the SEFLOE II Project
Parameter Methods and Instruments Data Density or Operations
Currents at two depths Mooring systems 2182 meter-days
Water column current profiles ADCP One month
Water column temperature, Salinity, and density
CTD cast Semi-monthly small boat operations
Dye concentrations in plumes Rhodamine-WT injection, fluorometers
Two intensive cruises
Salinity in plumes Towed CDT Semi-monthly small boat operations
Acoustic scattering strength High-frequency back scattering acoustic system
Two intensive cruises, semi-monthly small boat operations
Bacteria Water samples and laboratory tests
Nutrient Water samples and laboratory tests
Oil and grease, TSS, etc. Water samples and laboratory tests
Bioassay Water samples and laboratory test
1836 tests
SEFLOE Water Quality Testing Results The following outline the results of the water quality investigations. Bacteria Currently, fecal coliforms are used as an indicator organism to detect the potential of human contamination. Because coliforms are typically present in waters containing mammalian emissions at concentrations several orders of magnitude greater than other organisms, it is assumed that when the fecal coliforms are eliminated, others are eliminated as well. Therefore, enterococcus was used as the indicator in the SEFLOE II study. Concentration data were plotted as a function of distance from the outfall discharge point, indicating that no organisms could be detected more than 800 meters from the outfall.
FPL-012-037
38
Nutrients Concentrations of ammonia, TKN, total phosphorous, nitrate as a function of distance from the outfall discharge point were found to reach background levels within 400 meters from the discharge points. This finding suggested that the outfall nutrients were not involved with the presence of Codium algae outbreaks on the coral reefs, as indicated by a report by Brian LaPoint several years prior. Oil and grease In general, oil and grease data did not show a correlation with other measured parameters. The accuracy of this data was questioned, because during many of the sampling days the background concentration were higher than those measured within surface plumes. Visual field observations indicated no oil or grease sheens within plumes at the surface. It was concluded that neither oil nor grease discharges from ocean outfalls were of concern. Priority pollutants The wastewater plant effluents were analyzed for all 126 priority pollutants. None of these pollutants detected exceeded the acute toxicity criteria listed as State of Florida Maximum Allowable Effluent Levels. It was concluded that any chronic toxicity associated with the pollutants detected could be addressed through suitable dilution and mixing zones. Bioassays Bioassays were conducted to characterize the acute and chronic potential toxicity of the effluent/receiving water mixture in the zone of initial dilution and the mixing zones and to evaluate the exposure potential of the effluent to the indigenous ocean population. A total of 1727 acute static bioassay tests and 109 short-term chronic bioassay tests were performed. The bioassay test results indicated that the treated effluent was not toxic. It was believed that the bioassay test was conservative, because the receiving water criteria were based on a concentration one-half of the concentration causing observed response in the laboratory. In addition, the required test procedure assumed Eulerian exposure of the organisms, while outfall conditions exhibit only Lagrangian exposures. Potential Pathways of Human Exposure to Wastewater Constituents due to Ocean Outfall Disposal Figure G-11 depicts the basic ocean outfall discharge in South Florida. The effluent disposed experiences significant mixing in the intermediate vicinity of the outfall, and dilution with the ambient seawater (Chin, 2000). This dilution is related to depth and current speed in the vicinity of the effluent port. All are subject to the significant effects of the Gulfstream current, which moves northward. An advantage of ocean outfalls is that this current speed increases dilution speed, while moving the wastewater away from the outfall port. It should also be noted that the buoyancy of the plume causes it to rise
FPL-012-038
39
immediately to the surface. The velocity and force of this movement are significant enough that marine organisms and humans cannot penetrate the plume. Therefore, impacts, if any, are expected to occur outside the plume. That is, impacts were considered to occur in the farfield region, where a minimum dilution of 20:1 is conservatively assumed to be achieved. Potential pathways of human exposure include through the consumption of seafood, through ingestion and inhalation by swimmers and divers, and by consumption of seawater desalinated by reverse osmosis treatment (see Figure 12). Seafood consumption exposures are affected by such variables as bioconcentration in the food chain and cooking, and apply to principally to fish, shellfish, and invertebrates. Ecological impacts may be related to increases in levels of nutrients, metals, and hormone-disrupting agents in the farfield zone. Regulatory Environment for Ocean Outfall Disposal Waters within three miles of the coast are considered waters of the State of Florida. Therefore, the federal government has delegated responsibility for regulation of the open ocean outfall program to FDEP. Chapter 62-600.520 F.A.C. states that no permittee may discharge effluent to coastal or open ocean waters that does not meet applicable secondary treatment and pH criteria, as well as basic disinfection. All domestic wastewater treatment plants discharging to open ocean waters are required, at a minimum, to provide secondary treatment designed to achieve an effluent prior to discharge containing not more than 30 mg/L CBOD5 and 30 mg/L TSS, or 85% removal of these pollutants from the wastewater influent, whichever is more stringent. Outfalls must be designed to ensure structural integrity so as to minimize potential damage from natural occurrences (e.g., wave action) or human activities (e.g., anchorage). Ocean action during storms are the most significant potential impact to the integrity of the outfall. Outfalls must be designed, with respect to depth and location, so as to minimize adverse effects on public health and environmental quality. The SEFLOE study was designed to meet this goal, and gather scientific information relevant to the issue. The design must address the initial dilution, dispersion, and decay rates of the effluent wastes in surrounding waters in order to accomplish these objectives. To receive an ocean outfall permit, the following must be demonstrated: • That granting the permit is in the public interest; and • That minimum treatment standards and requirements to insure adequate protection of
public health and the marine environment are complied with; and • That granting the of the permit will not interfere with existing uses or the designated
uses of the receiving waters or contiguous waters, or otherwise impair the recreational use, bathing waters, or economic values associated with the area potentially affected by the discharge; and
FPL-012-039

40
• That there is no reasonable relationship between the economic, social, and environmental costs of compliance with the treatment requirements and the benefits associated therewith; and
• That oceanographic features influencing the effects of the proposed discharge support the proposed level of treatment and any proposed extent of the mixing zone; and
• That the facility will be constructed (where applicable) and operated so that there is no occurrence of inadequately treated wastewater reaching contiguous coastal waters; and
• That an acceptable monitoring program for the discharge has been proposed and would be implemented by the permittee.
Many of the surface water discharge rules apply to ocean outfalls, except where otherwise noted. Injection Well Disposal More than twenty years ago municipalities in South Florida began disposing of treated wastewater effluent by injection to deep wells. These wells penetrate geological formations that are highly transmissive, saline, and geologically isolated from surficial drinking water aquifers. Southeast Florida is underlain by a series of interspersed rock and clay formations with vastly varying permeability. The uppermost formation generally encountered along the southeast coast includes the Biscayne Aquifer. This surficial deposit occurs throughout most of South Florida and consists of a series of fossiliferous, sandy limestones. Thickness of the aquifer increases approaching the coast, where it can be as much as 300 feet deep. Underlying the Biscayne Aquifer is the Hawthorn formation, comprising approximately 500 feet of clay. The Floridan Aquifer occurs below that, and the injection horizon even further down. Thus, the injection zone into the Oldsmar formation (or Boulder zone) occurs below 2500, and usually 2900 feet below land surface. The exact location of the injection horizon is found when drilling an exploratory pilot hole. Well construction is shown in Figure 13. Four casings are placed, in ever decreasing diameter, and increasing depth, to seal off upper rock formations. Each casing is grouted in place with cement, to minimize potential for casing leaks and resulting migration of injectate into an upper formation. Surface equipment for all injection well facilities includes manual backup capability for monitoring wellhead pressure. Flow is recorded in systems utilizing automatic and continuous recording equipment, allowing monitoring of the system to detect leakage should it occur. Mechanical integrity tests are conducted every five years, as well. Secondary treatment is required in Florida prior to deep well injection, and injectate may be chlorinated as well. Without chlorination, there is the potential for enhanced microbial growth and fouling in the wells and surrounding formation, and resulting long term damage to well casings.
FPL-012-040
41
Regulatory Environment for Deep Well Injection Underground injection programs are regulated under the Underground Injection Control (UIC) regulations (40 CFR 146) as Class I municipal wells. These regulations were established under the authority of Safe Drinking Water Act approved in 1974 and amended in 1986 and 1996, setting forth standards for underground injection control programs. Florida received national primary enforcement responsibility for the UIC program for Class I, III, IV and V wells on March 9, 1983. However, significant issues have required continued involvement of U.S. EPA into the underground injection program in Florida. Florida Chapter 62-528 F.A.C. governs underground injection. Florida regulations are similar to federal rules, with minor variances which are stricter than the federal criteria, as outlined in Appendix H. After groundwater monitoring revealed migration of injected or native formation fluids into underground sources of drinking water (USDW), violating current Federal UIC regulations, U.S. EPA proposed changes to federal rules. Proposed changes would “allow for continued injection by existing Class I municipal wells that have caused or may cause such fluid movement into USDWs in specific areas of Florida if certain requirements are met which provide adequate protection for underground sources of drinking water” (Federal Register, July 7, 2000, Vol. 65, No. 131, pp. 42233-42245). Federal rules define five classes of injection wells in Sec. 144.6. Class I wells are defined as wells which inject fluids beneath the lowermost formation containing, within one quarter mile of the well bore, a USDW. Class I wells can be hazardous, industrial or municipal waste disposal wells. Thus, injection wells used for disposal of treated municipal wastewater are regulated as Class I wells. Class II wells are those used to inject fluids that are brought to the surface in connection with oil and natural gas production or the enhancement of recovery of oil and natural gas and the storage of hydrocarbons that are at liquid temperature. Class III wells are utilized for the extraction of the minerals. Class IV wells are used by generators of hazardous radioactive waste which inject water below the lower most drinking water zone. Class V wells are all wells that are not included in Class I, II, III or IV. Class V wells include air conditioning return wells, cooling water return wells, drainage wells, dry wells for injection of wastes, recharge wells for replenishing water wells, saltwater intrusion barrier wells, wells to inject water into fresh water aquifer wells, aquifer storage and recovery wells, sand backfill wells, and other wells to inject mixtures of water and sand, and septic system wells. Federal regulations contain formulas and descriptions of test methods for determining well operations, corrective actions in cases of well failure, and requirements for mechanical integrity tests to ensure detection of leaks in the casing, tubing, or packer (when used), and ensure that is there is no significant fluid movement into an underground source of drinking water through vertical channels adjacent to the well. Subparts B, C, D and F set up construction requirements, operating, monitoring and reporting requirements, and information that is to be considered in permitting wells. This may include information on the proposed operation of the well (such as maximum daily rate of flow and volume of fluids to be injected in the average injection pressure), the source of the water, analysis of the characteristics of the injected fluids, appropriate geological data and the construction details of the well. The regulations require that an applicant include a certificate that the
FPL-012-041
42
applicant has assured, through performance bond or other appropriate means, that the permittee has the resources necessary to close, plug and abandon the well as required by the federal regulations. Geologic Setting for Injection Well Disposal in South Florida
The purpose of this section is to provide an overview and to acquaint the reader with the basic geologic setting of the area (and to describe those physical properties that influence the movement of fluids). A detailed description of the geology is beyond the scope of the project; a considerable body of material on the subject is available from the literature in the form of publications from various public agencies, the scientific literature and from consulting reports. A bibliography is provided at the end of this section.
Information contained in this section was derived from data and consultants’ reports from the five largest disposal-well facilities in the area, Miami Dade (North and South Plants), North Broward Regional, Fort Lauderdale, and West Palm Beach Regional. Additional information was obtained from seven other facilities (disposal well or ASR sites located in the three counties). Data from core and pumping/injection tests, and geologic and geophysical logs were used to determine characteristics of the various components of the Floridan aquifer system. Additionally, information was derived from the published reports listed in the bibliography.
Floridan Aquifer System
Southeastern Florida is underlain by a thick sequence of carbonate rocks, limestone and dolomite, and lesser amounts of unconsolidated clastics consisting of sand silt and clay and minor amounts of evaporites (gypsum and anhydrite). By far the carbonate rocks are the principal rock types. Total thickness of the sequence is in excess of 5000 feet; the section in the depth interval between 200+/- and 3500+/- feet is the focus of this discussion. The evaporites are present in the lower (deeper) part and the clastics are present in the upper (shallow) part. The movement of ground water occurs principally through the carbonate rocks.
Ranging from the oldest to youngest in age the various geologic formations comprising the sequence are: Cedar Keys, Oldsmar and Avon Park Formations, the Ocala and Suwanee Limestones, the Tampa Limestone and the Hawthorn Formation (Group). These formations constitute the various elements of the so-called Floridan aquifer system. Evaporite deposits present in the Cedar Keys Formation constitute a lower confining unit marking the base of the active ground water flow system (Meyer, 1989). The Floridan aquifer is comprised of permeable limestones and dolomites of the various formations noted above; they are hydraulically interconnected. The degree of interconnection varies as does the permeability. In general, the rocks comprising the Floridan aquifer resemble a layer cake composed of numerous zones of alternating high and low permeability (Meyer 1989).
FPL-012-042

43
In southeastern coastal Florida, the base of the Floridan aquifer system occurs at an approximate depth of 3500 feet; its top is present at a depth of 900 feet +/-. The top occurs in the Suwanee Limestone. Clay, marl and claystone present in the Hawthorn Formation (Group) constitute the confining sequence for the Floridan aquifer system, which isolates the Floridan from the beds forming the Biscayne and shallow aquifers in Southeast Florida (Miller 1986).
These relationships are shown in the cross section given on on Figure 9, which has been reproduced from U.S. Geological Survey Professional Paper 1403-G (Meyer, 1989). The line of the cross section is east-west through the City of Fort Lauderdale.
Figure 9. Hydrogeologic Cross Section through South Florida (Meyer, 1989)
FPL-012-043

44
Hydraulic Properties of the Floridan Aquifer System, from samples at depths of 1360 to 2993 feet (Appendix I), can be summarized as follows: 1. Upper Floridan Aquifer:
a. Transmissivity: 10,000 to 60,000 feet squared per day (Meyer1989)
2. Middle Confining Unit (from Consultants’ reports listed at the end of this section):
a. Vertical Hydraulic Conductivity (cm/sec) • Mean: 2.83E-4 • Maximum: 5E-3 • Minimum: 9.6E-10 • Standard Deviation: 7.15E-4 • Median: 4.6E-5 • Number of Samples: 131
b. Horizontal Hydraulic Conductivity (cm/sec) • Mean: 2.56E-4 • Maximum: 4E-3 • Minimum: 2.5E-9 • Standard Deviation: 5.82E-4 • Median: 7.4E-5 • Number of Samples: 83
c. Porosity (fraction) • Mean: 0.317 • Maximum: 0.45 • Minimum: 0.034 • Standard Deviation: 0.091 • Median: 0.33 • Number of Samples: 127
3. Lower Floridan Aquifer (Boulder Zone)
a. Transmissivity (feet squared per day) • 3.2E6 to 24.6E6 (Meyer 1989) • 13E6 (Geraghty & Miller, Inc 1984)
At one time, the Floridan aquifer was defined as being formed by some of the
formations noted above, (Parker, 1955); it was later referred to as the Tertiary limestone aquifer system; and more recently has been designated as the Floridan Aquifer system. As knowledge of the geology of the area improved, it became apparent that the various formations underlying the area formed a single system, and that the designation “aquifer system” was appropriate.
FPL-012-044
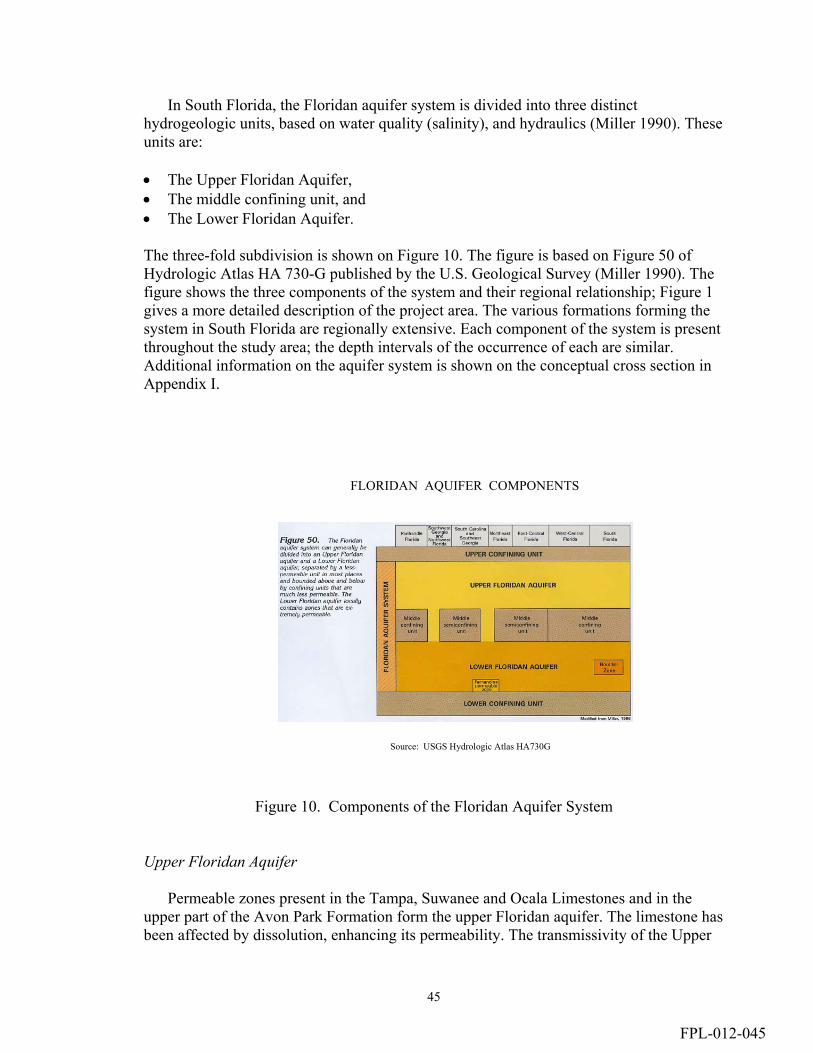
45
In South Florida, the Floridan aquifer system is divided into three distinct hydrogeologic units, based on water quality (salinity), and hydraulics (Miller 1990). These units are: • The Upper Floridan Aquifer, • The middle confining unit, and • The Lower Floridan Aquifer.
The three-fold subdivision is shown on Figure 10. The figure is based on Figure 50 of Hydrologic Atlas HA 730-G published by the U.S. Geological Survey (Miller 1990). The figure shows the three components of the system and their regional relationship; Figure 1 gives a more detailed description of the project area. The various formations forming the system in South Florida are regionally extensive. Each component of the system is present throughout the study area; the depth intervals of the occurrence of each are similar. Additional information on the aquifer system is shown on the conceptual cross section in Appendix I.
Figure 10. Components of the Floridan Aquifer System Upper Floridan Aquifer
Permeable zones present in the Tampa, Suwanee and Ocala Limestones and in the upper part of the Avon Park Formation form the upper Floridan aquifer. The limestone has been affected by dissolution, enhancing its permeability. The transmissivity of the Upper
FLORIDAN AQUIFER COMPONENTS
Source: USGS Hydrologic Atlas HA730G
FPL-012-045

46
Floridan aquifer ranges from 10,000 to 60,000 feet squared per day or 74,800 to 448,000 gallons per day per foot (Meyer, 1989).In general the Upper Floridan occurs in the depth interval between approximately 900 feet+/-(the top) and 1500 feet +/-. Water in the Upper Floridan is under pressure; that is to say a well tapping the aquifer will flow at land surface; heads or water level elevations in the Upper Floridan are well above sea level throughout the area. Some idea of the distribution of water levels is seen on Figure 11, which is derived from U.S. Geological Survey Professional Paper 1403-G (Meyer 1989). The data on which Figure 11 is based are from the year 1980 and depict regional relations. Little development of the aquifer (in South Florida) has occurred since then and it is reasonable to state that Figure 11 presents a reasonably accurate description of regional water-level relations. Examination of Figure 11 shows that water-level elevations along the coast are 40 feet or greater (relative to sea level) from West Palm Beach to south of Miami. Elevations increase in a westerly direction away from the coast; consequently the movement of ground water in the Upper Floridan in southeast Florida is roughly to the east or towards the coast. Ground water is moving from west to east and is discharging into the Atlantic Ocean offshore in those area where the rocks forming the Upper Floridan crop out (are exposed) at depths on the order of 1000 feet or so (Figure 9). The hydraulic gradient is about 0.5 feet per mile.
FPL-012-046
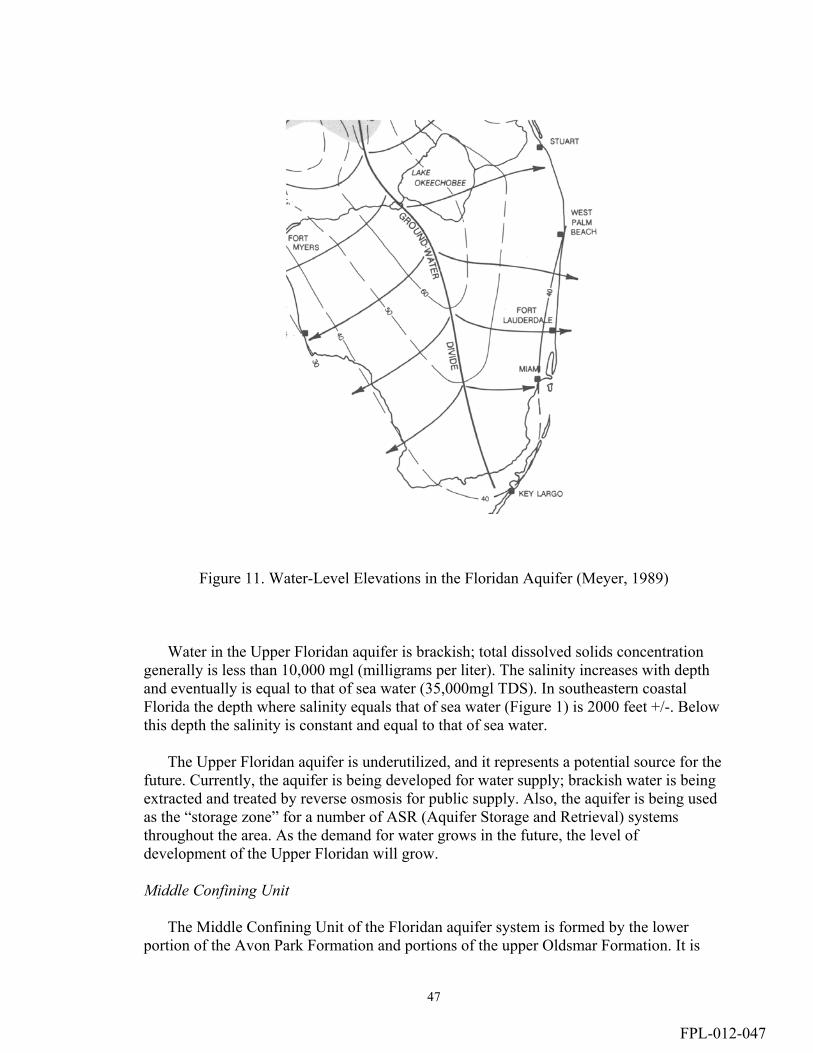
47
Figure 11. Water-Level Elevations in the Floridan Aquifer (Meyer, 1989)
Water in the Upper Floridan aquifer is brackish; total dissolved solids concentration
generally is less than 10,000 mgl (milligrams per liter). The salinity increases with depth and eventually is equal to that of sea water (35,000mgl TDS). In southeastern coastal Florida the depth where salinity equals that of sea water (Figure 1) is 2000 feet +/-. Below this depth the salinity is constant and equal to that of sea water.
The Upper Floridan aquifer is underutilized, and it represents a potential source for the future. Currently, the aquifer is being developed for water supply; brackish water is being extracted and treated by reverse osmosis for public supply. Also, the aquifer is being used as the “storage zone” for a number of ASR (Aquifer Storage and Retrieval) systems throughout the area. As the demand for water grows in the future, the level of development of the Upper Floridan will grow. Middle Confining Unit
The Middle Confining Unit of the Floridan aquifer system is formed by the lower portion of the Avon Park Formation and portions of the upper Oldsmar Formation. It is
FPL-012-047

48
present in the project area in the approximate depth interval between 1500 and 3000 feet below land surface (Miller 1990). The unit is formed of limestone and dolomite, with the latter being a secondary feature created by the alteration of the original limestone. The term “confining unit” is a misnomer. In general it has an overall lower permeability than the overlying Upper Floridan aquifer and the underlying Lower Floridan aquifer and serves to confine fluids present in the Lower Floridan aquifer, but it does contain beds having high and low permeabilities. Higher permeability beds present in the Middle Confining Unit serve as locations for monitoring wells associated with injection well facilities tapping the Lower Floridan aquifer. For the most part, the salinity of water present in this section is equal to that of seawater, except perhaps in those portions of the unit above approximately 2000 feet.
Properties of the Middle Confining Unit in the project area are the best known of the three subdivisions of the Floridan aquifer system in the project area. Because it serves as the confining unit for the underlying Lower Floridan Aquifer, the zone of wastewater effluent injection, its properties (horizontal and vertical permeability, porosity and composition) are the best known of the three units comprising the Floridan aquifer system. Permits for the construction, testing and operation of disposal wells include specific requirements for identifying the nature of the confining sequence and collecting information on the nature of these beds.
Information on the vertical and horizontal permeability of cores taken from the Middle Confining unit was collected and evaluated to determine variations in the permeability of the unit. Information was collected from facilities ranging from West Palm Beach in the northern part of the project area to the Miami-Dade South Wastewater Treatment plant located south of the city of Miami. Data from 131 cores were examined. The depth interval between 1360 and 2993 feet was covered. The mean value for vertical permeability is 2.83E-4 cm/sec; the median is 4.60E-5 cm/sec; and a standard deviation of 7.146E-4 cm/sec. A minimum value of 9.66E-10 cm/sec and a maximum of 5.00E-3 cm/sec were found.. Horizontal permeability for 83 cores was found to be a mean of 2.56E-4 cm/sec; the median is 7.40E-5 cm/sec; with a standard deviation of 5.82E-4 cm/sec. The maximum value is 4.00E-3 cm/sec and the minimum is 2.5E-9 cm/sec. Porosity ranges from a minimum of 0.034 to a maximum of 0.45 (expressed as a fraction of 1). The mean porosity is 0.317 and a standard deviation of 0.091. Lower Floridan Aquifer
The Lower Floridan aquifer is formed by the Oldsmar Formation. In the project area, the Oldsmar is predominantly composed of dense dolomite that ranges in nature from massive to cavernous. It was given the name “Boulder Zone” by oil-well drillers in the southwest part of the state, who found that it tended to collapse when penetrated by the drill bit, acting as if it were composed of boulders. It is present throughout the southern part of the State as shown on Figure 12.
FPL-012-048

49
Figure 12. Structure Contours on top of the Boulder Zone. Source: U.S. Geological Survey Hydrologic Atlas HA730G
In general the Lower Floridan Aquifer occurs at an approximate depth of 3000+/- feet. Its top is generally taken to be the first occurrence of dense, microcrystalline dolomite; and it usually tends to collapse when first penetrated by the drill bit, causing drilling problems such as lost circulation and loss of cutting returns. Knowledge of potential problems and the use of specialized drilling techniques minimize drilling problems. The base of the zone occurs at a depth of approximately 3500 feet, marking the base of the Floridan Aquifer System.
FPL-012-049

50
The Boulder Zone consists of a vast system of interconnected cavities and fractures, giving rise to its exceptionally high transmissivity. Its transmissivity is so high that the drawdown caused by pumping or pressure buildup associated with injection are extremely small and masked by outside influences such as tidal change (tidal changes of as much as 0.8 feet have been observed at West Palm Beach) and loading and barometric effects (Geraghty & Miller 1975). Consequently, it is difficult to determine accurate values for the transmissivity of the zone. Estimates of Boulder Zone transmissivity vary from 3 to 25 million gallons per day per foot. At the Fort Lauderdale Port Everglades treatment plant, an average transmissivity value of 13 million feet squared per day was derived from pumping and injection tests (Geraghty & Miller 1984).
Owing to its extraordinarily high transmissivity and areal extent, the Boulder Zone is
capable of accepting large quantities of injected fluids at comparatively low injection pressures. The writer has observed tests were injection rates in excess of 10,000 gpm (gallons per minute) were sustained at low injection pressures. It is common for an injection well to be designed to be equipped with a pump capable of injecting at an average rate of 7000 gpm. Water in the Boulder Zone is salty, having the same chemical composition as sea water. Additionally it is cold. Temperatures of 50 degrees F have been observed at the City of Fort Lauderdale injection-well facility (Geraghty & Miller 1984). With increasing distance inland from the coast, the temperature increases (Kohout et al. 1988). Figure 9 shows contours of water temperature. The comparatively cool temperature of Boulder Zone water is taken as an indication of a hydraulic connection between the Boulder Zone and the Atlantic Ocean at some distance offshore at a depth where the sea water is cold and the Boulder Zone crops out and is in contact with the ocean. There is no other explanation as to the source of cold ground water in a tropical setting.
It is believed water in the Boulder Zone is moving slowly (in South Florida) towards
the west. Age dating of water from the Boulder Zone based on uranium ratios (Meyer, 1989) suggests water inland is older than that present at the coast. Because of the cavernous and fractured nature of the Boulder Zone, ground-water flow is best described as fracture or conduit flow as opposed the typical flow of ground water through porous media. It is likely that in an injection well operation, considerable mixing with native water and dispersion occurs as injected fluid moves outward from an injection well.
In the past 20 years or so, the Boulder Zone has been used increasingly for the disposal of treated sewage effluent. Large scale regional treatment facilities in Miami, Fort Lauderdale, Broward and Palm Beach Counties and a number of smaller plants routinely dispose in excess of several hundred million gallons per day. The presence of the highly transmissive Boulder Zone in the Lower Floridan Aquifer, overlain by the Middle Confining Sequence, and containing saline water, have been the bases for this practice. Hawthorn Formation The Hawthorn Formation is a complex sequence of sediments deposited in a variety of marine environments. Consequently, its character or composition varies depending on
FPL-012-050

51
geographic location. This can be seen on Figure 13, reproduced from Snyder (1985). Depending on location, the Hawthorn can be composed of limestone, dolomite, clay, silt, and sand. Phosphate minerals are common. In fact, the Hawthorn is a major source of phosphate in the central part of the state. In southwest Florida, the Hawthorn contains beds of permeable materials, which are tapped for water supply. In that area, permeable beds are called the Intermediate Artesian aquifer. Typically, the Hawthorn Group is divided into two formations, the Peace River and Arcadia Formations.
Figure 13. Structural Features of the Florida Peninsula (Snyder, 1985)
In the project area, the Hawthorn is predominantly composed of silt and clay. As shown on Figure 13, the thickness of these materials is in excess of 300 feet . Throughout most of South Florida, the Hawthorn serves as the confining sequence for the Floridan aquifer System. In the project area, the Hawthorn is predominantly clay/marl and confines
FPL-012-051
52
brackish water under pressure from migrating upward and influencing the quality of the fresh ground water present in the Biscayne and other shallow aquifers in the area . For example, at the West Palm Beach injection well facility, the clay of the Hawthorn is almost 700 feet thick; core data from this interval have vertical permeabilities ranging from 3.15E-5 to 3.10E-8 cm/sec (Geraghty & Miller 1975). Examination of large fragments of the clay retrieved during drilling shows it has the consistency of heavy modeling clay. At the City of Fort Lauderdale, Port Everglades plant, the Hawthorn was found to be approximately 500 feet thick. At the City of Hollywood water treatment plant, the Arcadia Formation was found to be present from 480 to 926 feet, and is formed by soft, poorly lithified sandy, phosphatic marls. Floridan Aquifer Selected Readings Kohout, F.A. (deceased) et al., (1988) “Hydrogeology of the Atlantic continental margin, Chapter 23, Vol 1-2, The Atlantic Continental Margin,” The Geology of North America, The Geological Society of America., Boulder, Colorado. Meyer, Frederick W., (1989) “Hydrogeology, Ground-Water Movement and Subsurface Storage in the Floridan Aquifer System in Southern Florida, Regional Aquifer-System Analysis – Floridan Aquifer System,” United States Geological Survey Professional Paper 1403-G. Snyder, Scott, editor (1985) “Project 156-Phosphorites, Chapter 2, The International Geological Correlation Program, Guidebook, Eighth Symposium Southeastern United States”. Miller, J.A. (1986) “Hydrogeologic Framework of the Floridan Aquifer System in Florida,and in parts of Georgia, Alabama, and South Carolina,” United States Geological Survey Professional Paper 1403-B. Miller, James A. (1990) “Ground Water Atlas of the United States, Hydrologic Atlas HA-730G, Alabama, Florida, Georgia and South Carolina,” United States Geological Survey. Parker, G.G., Ferguson, G.E., Love, S.K., and others, (1955) “Water Resources of Southeastern Florida, with Special Reference to Geology and Ground Water of the Miami Area,” United States Geological Survey Water Supply Paper 1255. Geraghty & Miller, Inc. (1980) “Construction and Testing, Disposal Wells 4 and 5, Regional Pollution Control Facility, West Palm Beach, Florida,” Consultant’s Report. Geraghty & Miller, Inc. (1979) “Construction and Testing, Disposal Wells 1R, 2 and 3, Regional Pollution Control Facility, West Palm Beach, Florida,” Consultant’s Report. Geraghty & Miller, Environmental Services, Inc. (1995) “Construction and Testing of Injection Well 2, City of Pembroke Pines, Florida”, Consultant’s Report
FPL-012-052
53
Geraghty & Miller, Inc. (1986) “Construction and Testing of an Injection Well, Coral Springs Improvement District, Broward County, Florida”, Consultant’s Report. Geraghty & Miller Environmental Services, Inc. (1990) “Construction and Testing of Injection Well 2, Coral Springs Improvement District, Broward County, Florida”, Consultant’s Report. Geraghty & Miller, Inc., Ground Water Consultants (1984) “Construction and Testing of Disposal Wells 1, 2 and 3 at the George T. Lohmeyer Plant, Fort Lauderdale, Florida”, Consultant’s Report. Geraghty & Miller Environmental Services, Inc. (1991) “Construction and Testing of Injection Wells 1 and 2 and Associated Deep Monitor Well – Solid Waste Authority, North County Resource Recovery Facility, Palm Beach County, Florida,” Consultant’s Report. Geraghty & Miller, Environmental Services, Inc. (1990) “Construction and Testing of Injection Wells 1 and 2 with Associated Deep Monitor Well 1, Broward County North District, Regional Wastewater Treatment Plant, Pompano Beach, Florida,” Consultant’s Report. Missimer International, Inc.(1998) “Confinement Analysis, Injection well System, Broward County North Regional Wastewater Treatment Plant, Pompano Beach, Florida”, Consultant’s Report. Gerhardt M. Witt Associates, Inc. (1990) “Appendices B, D, and E of a report prepared by CDM Inc. on the drilling and testing of an RO reject water disposal well at Plantation, Florida”, Consultant’s Report. CH2MHill (1992) “Drilling and Testing of the Concentrate Injection and Dual Zone Monitor Wells for the Disposal of Concentrate Reject form the Low Pressure Membrane Water Softening Facilities at the City of Boynton Beach West Water Treatment Plant, Boynton Beach, Florida”, Consultant’s Report. McLoughlin, Eugene V., P.E., and Causaras, Carmen R., P.G. (1996) “Construction and Testing of 7 Upper Floridan Monitor Wells FA – 10 through FA – 16, Report A – Floridan Aquifer Monitor Well FA – 10”, Miami – Dade Water and Sewer Department CDM (1996) “Engineering Report Supporting Operational Testing of IW3 at Sunrise, Florida, FDEP Permit No. UC-06-212792, Volume 1”, Consultant’s Report. CH2Mhill (1999) “Construction and Testing of Injection Well IW-4 at the City of Fort Lauderdale, G. T. Lohmeyer Wastewater Treatment Plant, Fort Lauderdale, Florida”, Consultant’s Report.
FPL-012-053

54
Geraghty & Miller, Inc. (1975) “Feasibility of Deep Well Disposal of Treated Sewage Effluent, City of West Palm Beach, Florida”, Consultant’s Report. Pathways of Human and Ecological Exposure due to Injection Well Disposal Buoyancy of the injected effluent due to its lower salinity is a driving force for vertical migration, and indicators of effluent have been found at middle elevations within the Floridan Aquifer, as noted in Section 3. Horizontal dispersion within the Floridan Aquifer and Boulder Zone are uncertain. However, migration through the Hawthorne Layer to the Biscayne Aquifer is considered unlikely. Reverse osmosis is generally required to treat the brackish water of the Floridan Aquifer prior to use for drinking. One route by which treated wastewater effluent could potentially reach surface waters from injection wells could include migration to a potable or non-potable aquifer storage and recovery (ASR). ASR wells store fresh water in a bubble within the brackish Floridan aquifer. Potable ASR water is treated prior to injection, and typically receives only chlorination upon withdrawal prior to distribution. However, withdrawals from the well are monitored for salinity, and ceased if elevated salinity is detected. Non-potable ASR water, on the other hand, is intended to be released in large volumes to receiving canals during the dry season, as part of the Everglades restoration effort. Regulations regarding monitoring and operation of such releases have not been determined at the time of study. Potentially exposed populations include potable water consumers, users of non-potable water for irrigation, consumers of vegetables irrigated with non-potable water, and consumers of fish caught in canals receiving water from non-potable ASR wells. Wastewater Reuse The State of Florida has encouraged utilities to consider the use of reclaimed water in several ways. In particular, the Florida Department of Environmental Protection enforces the Anti-Degradation Rule, prohibiting discharges that increase the pollutant loading on a body of water. FDEP also requires an evaluation of reclaimed water for all requested wastewater treatment plant expansions, and for all plants existing in a water resource caution area. Cost is considered in these evaluations, which are intended to identify areas or users that would benefit from the use of reclaimed water. Typically, identified potential recipients have been golf courses and other large irrigation areas. Throughout Florida, reclaimed water has been used for agricultural irrigation, wetlands restoration, and dual residential water supply systems, as well as for golf course irrigation. Section 62-610 of the Florida Administrative Code establishes reclaimed water guidelines, currently under review. Reuse is not considered a stand-alone disposal alternative, because during the wet season high water levels may prevent such reuse, and therefore a backup system of equivalent capacity is required. Systems of such capacity available currently in South Florida are surficial aquifer recharge, ocean outfall, or injection well disposal systems.
FPL-012-054

55
Aquifer Storage and Recovery Wells Aquifer Storage and Recovery (ASR) wells have been recently proposed and employed as an alternative for management of water supplies in Florida. Such wells are formed by injection of fresh water into the upper Floridan Aquifer during wet or low-demand seasons, with subsequent withdrawal to meet demand for potable water, natural system flows, or aquifer level maintenance, at other times of the year. Figures 14 and 15 depict the process. Use for storage of raw groundwater has also been investigated. In Southeast Florida, it is intended that injected fresh water will not mix with the native brackish water, due to the density gradient. Thus, a bubble of fresh water is formed. Experience with such systems is limited. However, use on a large scale is planned as a foundation of the Everglades restoration effort.
INJ E C T E D P O T A B L EW A T E R
DEP
TH
(Fee
t Bel
ow L
and
Surfa
ce)
W A T E R T A B L E A Q UIF E RC O NF I NING B E D
T A M IA M I AQ UIF E R
C O NF I NING B E D S
C O NF I NE D S Y S T E M
M IXING Z O NE
A S R W E L LD UR I NG INJ E C T IO N
0
1 0 0
2 0 0
3 0 0
4 0 0
5 0 0
6 0 0
L A N D S U R F A C ET R E A T M E N T P L A NT
Figure 14. Schematic Diagram of Aquifer Storage and Recovery System for Brackish
Water Aquifers.
FPL-012-055
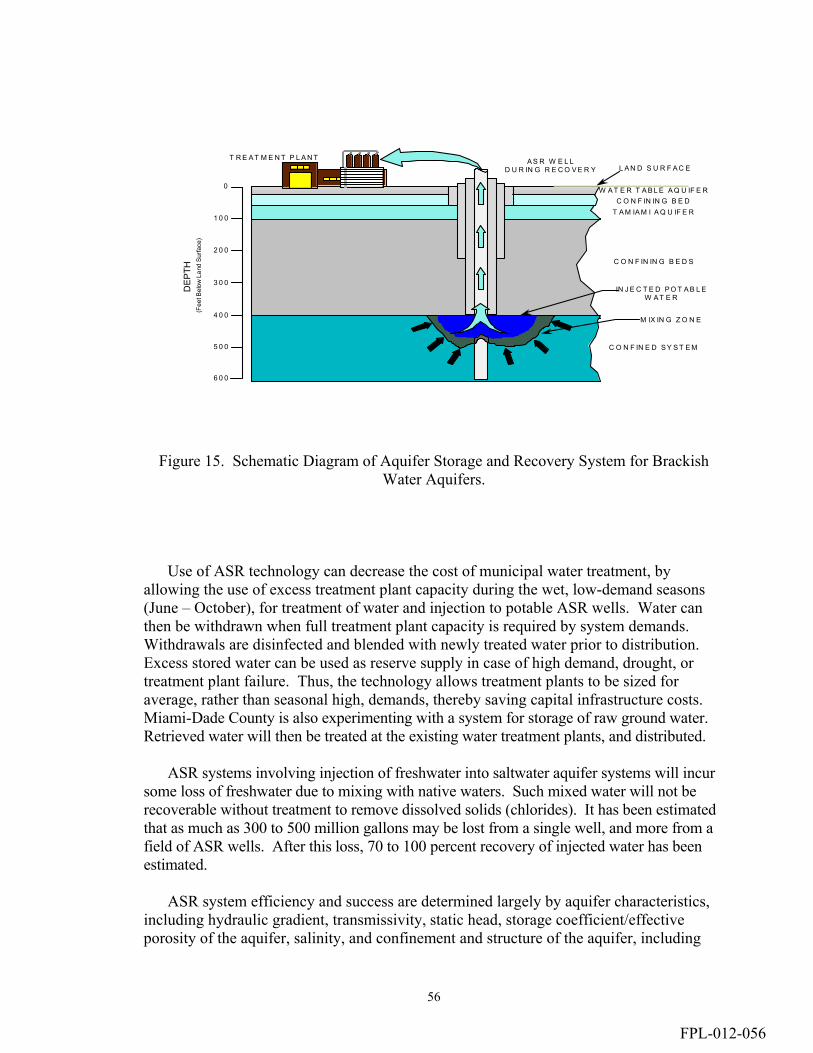
56
IN J E C T E D P O T A B L EW A T E R
DEP
TH
(Fee
t Bel
ow L
and
Surfa
ce)
W A T E R T A B L E A Q U IF E RC O N F IN IN G B E D
T A M IA M I A Q U IF E R
C O N F IN IN G B E D S
C O N F IN E D S Y S T E M
M IX IN G Z O N E
0
1 0 0
2 0 0
3 0 0
5 0 0
6 0 0
L A N D S U R F A C EA S R W E L L
D U R IN G R E C O V E R Y
4 0 0
T R E A T M E N T P L A N T
Figure 15. Schematic Diagram of Aquifer Storage and Recovery System for Brackish Water Aquifers.
Use of ASR technology can decrease the cost of municipal water treatment, by allowing the use of excess treatment plant capacity during the wet, low-demand seasons (June – October), for treatment of water and injection to potable ASR wells. Water can then be withdrawn when full treatment plant capacity is required by system demands. Withdrawals are disinfected and blended with newly treated water prior to distribution. Excess stored water can be used as reserve supply in case of high demand, drought, or treatment plant failure. Thus, the technology allows treatment plants to be sized for average, rather than seasonal high, demands, thereby saving capital infrastructure costs. Miami-Dade County is also experimenting with a system for storage of raw ground water. Retrieved water will then be treated at the existing water treatment plants, and distributed. ASR systems involving injection of freshwater into saltwater aquifer systems will incur some loss of freshwater due to mixing with native waters. Such mixed water will not be recoverable without treatment to remove dissolved solids (chlorides). It has been estimated that as much as 300 to 500 million gallons may be lost from a single well, and more from a field of ASR wells. After this loss, 70 to 100 percent recovery of injected water has been estimated. ASR system efficiency and success are determined largely by aquifer characteristics, including hydraulic gradient, transmissivity, static head, storage coefficient/effective porosity of the aquifer, salinity, and confinement and structure of the aquifer, including
FPL-012-056

57
fractures, facies changes and stratigraphy of the system. Hydraulic gradient, transmissivity, and structure of the aquifer affect speed and direction of movement of the bubble. High transmissivity and gradient favor migration of the bubble. Incomplete confinement, or intersecting fractures, may allow injected water to migrate away from the well. The differential density of the waters will also affect separation of the bubble from native waters.
FPL-012-057
58
5. RELATIVE RISK ASSESSMENT Disposal of wastes by living things to the environment has many and varied effects on the ecosystem, both beneficial and harmful to various populations. Disposal of treated municipal wastewater effluent in Southeast Florida often involves flows of water in excess of 100 million gallons per day (MGD) per plant, and associated mass loadings of other constituents. These loadings alter the flow of water, carbon, oxygen, nutrients, and other constituents through the ecosphere. In considering the sustainability of alternatives for disposal of effluent, one important consideration is human and ecological health. Because of the complexity of potential exposure paths, time scales, and population variations, and the desire to avoid a site-specific assessment, a predictive Bayesian assessment of relative risks of the various alternatives was undertaken. Input to the analysis was principally professional judgment drawn from academic and industrial experts, and based upon available site-specific data, literature information, and experience. Bayesian methods allow the explicit and rigorous use of expert opinion and numeric data, in any combination. This advantage was considered to make them the method of choice in decision making, in contrast with resampling plans (e.g., the Jackknife and Bootstrap), which have no subjective capability, and fuzzy logic methods, which have little capability to use numeric data. While Bayesian methods are useful, the generalized quantitative assessment developed in this project was made possible only through the use of predictive Bayesian methods. Predictive methods are an extension of traditional Bayesian approaches, in which unconditional distributions for the quantity of interest are found by integrating over probabilities of parameters of the distribution for the quantity of interest. The result is a distribution that becomes broader with decreasing levels of available information. These probabilities then incorporate both uncertainty and variability in the quantity of interest, and have been termed believed probabilities. The method requires no arbitrary assumption of confidence limits in interpretation. Results are more sensitive to the form of the distribution for the quantity of interest, and typically no account is taken of uncertainty in this form. However, this is a powerful advantage when there is theoretical or empirical basis for the form of the distribution, as it allows risk to be assessed from any level of available information. Only when information is so limited that a model cannot be developed, is the predictive Bayesian assessment impossible, as was the case for pharmaceutically active substances in this study. 5.1. Methods of Probabilistic Relative Risk Assessment An initial assessment of health risks associated with the deep well injection disposal, ocean outfall, and surficial aquifer recharge by canal discharge was conducted. Because risks of discharge alternatives can be highly specific to geologic/hydrologic/environmental setting, population distribution, loading rates, and other factors, modeling of exposure rates was not possible or appropriate for a generalized assessment. Therefore, a Bayesian analysis based on available information for the region, including expert opinion assembled by the research team, was performed.
FPL-012-058
59
First, a meeting of Team members was convened to assemble conceptual diagrams of the wastewater discharge and environmental systems, showing pathways of potential exposure. Both pictorial and tree diagrams were developed, as shown in Appendix J. following this meeting, data on wastewater effluent, surface and ground water quality, and regulatory standards, were collected and analyzed for the Southeast Florida region, as presented in Section 2. A second Team meeting was convened to review the data, and develop a conceptual model for the risk analysis. At this meeting, two key assumptions for the assessment were agreed upon: 1. Based on available data for Miami-Dade County injection well systems, it was agreed
that relative risks would be assessed for injection well systems assuming rapid vertical migration of effluent from the injection point to the upper Floridan aquifer, as the worst-case, and
2. Risk was defined, for the assessment, as the probability of being in violation of a regulatory water quality standard over a 30-year period. In the analysis, a violation day was defined as a day during which one or more water quality violations occurred.
It was further agreed at the meeting that expert judgment would be solicited for the assessment using a modification of the Delphi technique for eliciting expert opinion. Following Meeting 2, tree diagrams showing all potential exposure pathways were modified to show nodes for which regulatory standards exist. Original and modified tree diagrams are shown in Appendix J. Tabular questionnaires were then developed for electronic circulation. These surveys requested estimates of the risk of violating water quality standards, for each discharge alternative for each node of a modified tree diagram. Questionnaires were electronically circulated in three iterations, and initial results were used as input to compute believed risks. A probabilistic computer model was developed using the programming software package Matlab©, for computation of believed days of violation in 30 years. These initial results were presented at a third meeting of the team, and discussed for revision of both input and model form. Final input was then collected, and results computed for review by Team members. All Team members were interviewed regarding the final results, which were included in the final report and circulated all members for final review. 5.2. Wastewater Constituents Selected for Assessment of Health and Ecological Risk Based on discussion at the first two Team meetings, four wastewater constituents were selected as indicators of human health risks, and one as an indicator of ecological risk, were selected for quantitative assessment. In addition, an emerging class of constituents of concern was selected as an indicator of both human and ecological risk. Constituents were selected based on the following considerations: • Typical concentrations in wastewater effluents, • Typical concentrations in potential receiving waters, • Potential for migration in receiving environments, and • Human health and ecological toxicity.
FPL-012-059

60
Specifically, arsenic, Cryptosporidium parvum, rotavirus, and n-nitrosodimethylamine (NDMA) were selected as indicators of human health risks. Arsenic was selected based on current concerns regarding toxicity and presence in the environment. Cryptosporidium parvum was used to indicate human health risk in surface and marine waters, based on previous experience and concern in such waters. Rotavirus was used as an indicator of microbial risk in ground waters, due to its mobility and because it is excreted in large numbers in the feces of infected individuals. The compound NDMA was selected to represent nitrosamines, an emerging class of toxins that have been found in wastewater effluent. NDMA is considered carcinogenic at extremely low doses (USEPA 1993). Total Kjeldahl nitrogen (TKN) was selected as an indicator of ecological risks, as it is the principal nutrient contained in wastewater, and therefore has the potential to cause eutrophication and ecological imbalance. Such eutrophication is thought related to the growth of pfisteria, blue-green algae, and other toxic microorganisms in the environment. Finally, pharmaceutically-active substances (PASs) were considered for qualitative assessment of human health and ecological risks. Such substances include endocrine-disrupting chemicals that have caused feminization of males and females of many species, and that have been found in wastewater effluent. Arsenic, often considered a metal though it resides in the periodic table on the border between metal and non-metal, is often found naturally in groundwater. Arsenic has been the subject of current research and concern regarding toxicity, and may enter wastewater as a result of historical use as a pesticide, from use as a wood preservative, or from other industrial sources. Chronic effects at low concentrations include: • Cancer, including skin, bladder, lung, and prostate cancer, • Non-cancer effects on skin pigmentation and keratosis (often callus-like skin growths),
and gastrointestinal, cardiovascular, hormonal (e.g., diabetes), hematological (e.g., anemia), pulmonary, neurological, immunological, reproductive/developmental functions, and
• Endocrine disruption. Total Kjeldahl nitrogen (TKN) is an indicator of the excess nutrient present in wastewater, as noted. In addition, it is present in much higher concentrations than in receiving waters, and was used as a tracer to indicate the presence of effluent. Nitrogen compounds present may include nitrate, nitrite, and ammonia. Long term exposure to nitrates and nitrites at levels above the MCL in drinking water have the potential to cause diuresis, increased starchy deposits, and hemorrhaging of the spleen. In addition, nitrites may react with amines to form nitrosamines, to be discussed subsequently. Excessive levels of nitrate in drinking water can cause serious illness and death in infants due to the conversion of nitrate to nitrite in the body, which can interfere with the oxygen-carrying capacity in the blood of the children (methemoglobinemia, or “blue baby syndrome”). Nitrogen compounds are removed only via advanced wastewater treatment, not currently in use in Southeast Florida. Nitrates and nitrites are highly mobile in ground water due to their high solubility and low affinity for soils and minerals in the subsurface.
FPL-012-060
61
Microbiological Agents There are over 100 micro-organisms that are human pathogens (Feacham, et al, 1981). Exposure pathways include ingestion, inhalation, dermal contact, and entry through wounds or body orifices (Hurst, 1996). Infected persons excrete large numbers of these pathogens, which often enter ground and surface waste systems. Each organism has a particular dose response relationship. Threshold doses for infection are vastly different among organisms (Gerba and Bitton, 1984). Typically, many bacteria are required to cause infection, whereas, for certain viruses, one organism may be sufficient. Available studies indicate that removal of bacteria during wastewater treatment and disinfection is generally high, but depending on the treatment process employed, viruses may undergo only 50 percent removal (Yates, et al, 1987). Indicator organisms relative to human health risks were chosen for modeling based on consideration of the following characteristics: • Number of organisms excreted, • Fate of the organisms in the environment, • Minimum infectious dose, and • Severity of human health response. Cryptosporidium parvum was selected to indicate risk in surface waters, and rotavirus was selected as the indicator in ground water, as mentioned. While polio-, echo-, and ep-viruses have been extensively studied, rotaviruses have been shown most virulent. In addition, large quantities of rotaviruses are excreted in the feces of infected individuals. Rotaviruses have been recognized as a major cause of severe intestinal and gastro-enteritis in all temperate, tropical and sub-tropical climates. Nitrosomines (NDMA)
Nitrosamines are an emerging contaminant of concern throughout North America, and have been found in polluted air and water (Bolton, 2000). The major concern has been the occurrence of N-Nitrosodimethylamine (NDMA) in potable water systems, first noted in California in 1998, but found throughout the United States and Canada at levels significantly higher than in the past (Yoo, et al, 2000). Industrial contamination was initially investigated as an NDMA source in Canada, leading to investigation of potential formation of NDMA in the drinking water treatment process. NDMA is also being found in ground waters, and current research is expanding to include other nitrosamines (Andrews and Taguchi, 2000). NDMA is not currently regulated under U.S. EPA drinking water rules. NDMA is classified as a Class I carcinogen in Canada, and a Class B2 probable human carcinogen in the United States. The compound has been known to cause carcinomas and tumors, primarily in the liver, kidney, and lungs (Andrews and Taguchi, 2000). Due to its carcinogenocity, the Ontario Drinking Water Objective has been set at 9 ng/L, based on a 5x10⁻⁶ risk factor estimated by the US EPA (Andrews and Taguchi, 2000). In California,
FPL-012-061

62
the original action level was for NDMA at 2 ng/L based on a 10-6 lifetime cancer risk develop by the State, similar to the federal MCLs (CDHS, 2000). However, the State action level was changed to 20 ng/L to allow utilities to study the problem, because many sites sampled exceeded the 2 ng/L action level (Davis, et al, 2000). The target set by U.S. EPA for an estimated 10-6 risk level is 0.7 ng/L (CDHS, 2000). This risk was assessed assuming an average ingestion of two liters per day for 70 years (Kruger, 2000). The existence of NDMA in the environment is generally attributed to human activity. NDMA has not been manufactured in the United States since 1976, when it was manufactured primarily as an intermediate in the electrolytic production of 1,1 –dimethylhydrazine for liquid rocket fuel (USEPA, 2000). NDMA was a 0.1% impurity in storable rocket fuel. Current use is primarily in research (CDHS, 2000). While not manufactured in the United States, NDMA may be formed in manufacturing processes in which alkylamines are used or generated. Man-made and naturally occurring alkylamines are widely distributed in the environment (Liang, 2000). NDMA is a by-product of the manufacture of rubber, pesticides, lubricants, polymers, copolymers, high energy batteries, solvents and liquid rocket fuel. Other uses include inhibition of nitrification of soil and for nematode control for crops. NDMA is commonly found in household products, including cosmetics, canned fruit, fish, cheese, milk, cured meats (ham, frankfurters, bacon), tobacco smoke and beer (Davis, et al, 2000). NDMA concentrations in food range from 90 to 100 ng/L for pasteurized milk, 600 to 1000 ng/kg of bacon, and 50 to 59000 ng/kg in beer (Gloria, 1997 (1) and (2)). Exposure is generally via inhalation, ingestion and dermal contact. Potential exposure depends on the ability of the nitrosamine to migrate from the product to the body (U.S. EPA, 2000) Nitrosamines are generally resistant to air stripping, biodegradation, and granular activated carbon (Andrews and Taguchi, 2000). Reverse osmosis is not considered effective as a treatment method as a result of the polar nature of the molecule (Liang, 2000). Research into low-pressure ultra-violet irradiation treatment has shown mixed results. In addition, NDMA can be reformed or regenerated if chlorination occurs after UV treatment (Liang, 2000). Advanced oxidation/irradiation processes have also been promoted as alternative treatment technologies, though these processes tend to be expensive. Sunlight was found to cause the rapid decay of nitrosamines in a Canadian study (Yoo, et al, 2000). NDMA concentrations as high as 10 ppb have been found in groundwater (Bolton, 2000). The more persistent problem has been the detection of NDMA in potable drinking water systems. Metropolitan Water District has reported raw water samples as high as 24 ng/L at a residence, and consistent values of 3 to 7 ng/L throughout their member agencies (Davis, et al, 2000). NDMA was found in Sacramento County drinking water wells at 140 and 150 ng/L, and in wells in the San Gabriel Basin in California at 70 to 300 ng/L (Liang, 2000). Other research indicates that NDMA is present in wastewater after chlorination and in potable drinking water supplies (Liang, 2000). Several studies found NDMA in treated water, though the raw water had no detectable NDMA, indicating NDMA formation during treatment (Davis, et al, 2000; Andrews and Taguchi, 2000). Polymers and alum were identified as likely sources of NDMA precursors (Davis, et al, 2000).
FPL-012-062

63
Andrews and Taguchi (2000) concluded that the use of polymers other than alum, such as ferric chloride, might reduce NDMA formation. Other precursors that have been identified are nitrate, nitrites and ammonia. Other tests showed that removal of organic precursors via GAC prior to disinfection helped to reduce NDMA formation potential, but that the use of chloramines for disinfection increased the amount of NDMA formed (Njam, 2000). However free residual chorine did not form NDMA even in the presence of large quantities of organics (Njam, 2000). In wastewater, NDMA has been reported in both sludge and wastewater effluent. Mumma et al. (1984) reported NDMA levels ranging from .6 to 45 ug/L in dried sludge in a survey of 14 American wastewater plants. Analysis of effluent samples in California indicates that NDMA formation is related to the presence of thiram in the effluent and its reaction with chlorine, and/or the amount of nitrite and ammonia in the effluent (Njam, 2000). At Water Factory 21, where tertiary or full treatment and disinfection is practiced, levels of NDMA over 100 ng/L have been found (Njam, 2000). As a result, testing for NDMA is required at all new wastewater reclamation facilities in California. Njam (2000) found levels of 97 ng/L of NDMA in the effluent of an advanced secondary treatment facility. Split samples from this facility were used to evaluate the impact of chloramines, a common wastewater by-product on the formation of NDMA. NDMA amounts were high at common chlorination dosage levels. Typically wastewater plants in South Florida apply doses of 10 to 15 mg/L free chlorine, which are converted to chloramines within seconds (Fergen, 1997, unpublished notes). Based on the results of Njam (2000) and typical chloramine dosages used in South Florida wastewater treatment plants, effluent concentrations on the order of 500 ng/L may be assumed. Pharmaceutically Active Substances It has been estimated that 70% of pharmaceuticals consumed pass through the body unchanged. Further, because concentrations of these substances are typically less than 1 µg/L, the microorganisms in wastewater treatment facilities are not induced to metabolize these substances as an energy source. As a result, current research indicates that many of these substances survive the biodegradation process and are discharged into receiving waters. Those that are altered can revert to their original form in the environment (Daughton and Ternes, 1999). Recent research also indicates the presence of chemicals in water and wastewater that may disrupt the endocrine system of many species, including humans. Endocrines are chemicals used by organisms to regulate important metabolic activities, such as ion balance, reproduction, basal metabolism and fight or flight responses, through changes in hormones secreted by the thyroid, parathyroid, pituitary, adrenal, sex, and other glands. Because endocrine systems are interconnected, effects on one will affect others as well. Chemicals, whether derived from pharmaceuticals, industrial emissions, or natural sources, that interfere with endocrine systems of humans and wildlife are termed endocrine disruptors. Chemicals and pharmaceuticals in general that elicit a pharmaceutical response in humans are termed pharmaceutically active substances (PASs). Research has identified more than 60 PASs that impact the endocrine system of animals and humans in ng/L or lower concentrations in the ecosystem.
FPL-012-063

64
The first regulations requiring eco-toxicity testing for the registration of pharmaceuticals were established in Germany in 1995. As a result, most research involving the identification and characterization of PASs in wastewater effluents and receiving waters has occurred in Germany. In the United States, the 1996 Safe Drinking Water Act Amendments and the Food Quality Protection Act of 1996 mandate comprehensive screening for estrogenic and anti- estrogenic chemicals. Research initiatives by the American Water Works Association Research Foundation and the Water Environment Federation Research foundation address the problem. Effects of endocrine disruptors in the environment can be startling. While both natural and synthetic chemicals may have disrupting effects, most observations involve species feminization and have been attributed to estrogenic compounds found in wastewater effluents (Lutz, 1999). The reverse also occasionally occurs as in North Florida, wastewater effluent from a paper mill is suspected in the masculinization of fish through the development of androgenic compounds in the process (Raloff, 2001). In both cases, the sex change effect results in radically reduced resident fish populations, sexually shifted remaining populations, and potential loss of sustainability of the resident population. Also in Florida, alligator populations have been found to have greatly reduced fertility, traced to a feminization and lack of development of reproductive organs in the male (Guillette, et al, 1994). Nationally, many species have reportedly been affected (Colburn, et al, 1997). Until recently, the problem of PASs in the environment was not noticed due to the low concentrations and difficulty in tracing the compounds. Tracing drug residues is problematic because many potential endocrine disrupting chemicals have little in common structurally or in terms of chemical properties (Depledge, 1999). Analytical methods for detecting the trace levels of PASs found in the environment are not well-developed. In addition, often lists of active ingredients in pharmaceutical products are not made available due to patent limitations, hindering the development of spectral signatures needed for analysis by gas chromatography-mass spectroscopy (Daughton and Ternes, 1999). Furthermore, current effluent toxicity screening tests are not designed to detect endocrine disrupting and other effects of PASs, the effects of chronic exposure, or prenatal effects realized in offspring. Limited research has been conducted on the eco-toxicity of PASs, and subtle changes in the behavior and development of aquatic organisms may be the greatest concern. Pharmaceutically active substances and their ecological effects can be categorized (Daughton and Ternes, 1999; Hirsch, et al., 1999; Raloff, 2001; Buser, 1998; Ternes, 1998) as shown in Table 4.
FPL-012-064

65
Table 4. Summary of Pharmaceutically Active Substance Occurrence
Substance Uses Quantity Impacts
1 Estrogenic Compounds Contraceptive 1-5 ug/L Feminization2 Steroids (non estrogens like Muscle development, various above 1 ug/L Masculinization
androgen, testosterone, etc)3 Anti-biotics Reduce bacterial infection varies Resistant pathogens4 Blood Lipid Regulatos Cholesterol control to .165 ug/L Unknown5 Non-lipid analgesics Anti-inflamatory .5-1 ug/L Unknown6 Beta Blockers .2 ug/L Stimulate reproduction 7 Antidepressents Increase seratonin, control varies Stimulate reproduction
behaviour (Prozac, ritalin)8 Anti-epileptics Epilepsy control to 6.3 ug/L Unknown9 Anti-neoplastics Chemotherapy .017 ug/L Toxicity, birth defects10 Impotence Drugs Erectile dysfunction,blood stimulant unknown Unknown11 Retinoids Skin diseases, anti-aging, cancer unknown Birth deformaties12 Contrast Media chemicals X-rays, CAT scans,diagnostics 15 ug/L None13 Fragrances and Musks Perfumes, colognes to .4 ug/L Toxicity14 Preservatives Anti-microbial unknown Feminization15 Disinfectants Bacteriocides .05-.15 ug/L16 Herbal Remedies Various varies Various17 Sunscreens Protect skin from UV light unknown Unknown
Secondary wastewater treatment plants are designed principally to remove the oxygen demand of influent wastewater, through the degradative action of a series of resident microorganisms. Wastewater facilities that have received PASs in the influent for years may support resident organisms that have adapted to the metabolization of PASs. However, marketed pharmaceuticals evolve continuously, and therefore may escape treatment in typical biological reactors. In addition, PAS concentrations may be below that needed to initiate the enzyme affinity of the organisms (Daughton and Ternes, 1999). Reverse osmosis and granular activate carbon have been suggested for removal of PASs. However, it appears that neither process completely removes the low levels of PASs found in wastewater, and further study is needed. Chemical oxidation has also been proposed for study. Future regulations addressing both sources and sinks of PASs in the environment are needed. Ultimately, the utility community can expect additional regulation concerning PASs, especially estrogenic and androgenic compounds. Because the potential costs may be high, further research into prevention and treatment is needed. 5.3. Elicitation of Expert Judgment and Assumptions of the Assessment The Delphi method is a technique for achieving consensus among a group systematically. The method was developed in the early 1950s for the purpose of estimating the probable effects of an atomic bomb attack on the United States, and has since been used in technological forecasting and many other applications (Linstone and Turoff, 1975). The approach involves iterative questionnaires, which protect the anonymity of respondents. Analysis of responses after each iteration involves successive elimination of opinions at the extremes, to achieve convergence of opinion. At the end of the procedure consensus among experts is attained (Sackman, 1975).
FPL-012-065
66
The traditional Delphi process involves a group of expert respondents in the field of study. The principal investigator designs a questionnaire and sends it to the larger respondent group. After the questionnaire is returned, the principal investigator summarizes the results and sends the questionnaire back to the respondents, preserving anonymity. The respondent group is given multiple opportunities to reevaluate their original answers based on their review of the group response (Linstone and Turoff, 1975). In a true Delphi process, responses outside the range of the central 50 percent of responses are eliminated prior to each iteration, with the ultimate goal of reaching a consensus likelihood of the group response. Significant commitment of time from the response group, and extensive study review, may be required. Modification of the full Delphi process is common. The Delphi method avoids some of the pitfalls of group polarization, by preserving anonymity in the process. Group polarization is the term used to describe the shifting of group opinion in response to the interactive dynamics of the group (El-Shinnawy and Vinze 1998). Group decisions have been found to shift in either the direction of lower or higher risk, and can tend to coalesce around the opinions of dominant members or otherwise change without a corresponding change in the underlying facts. While polarization can be a positive force for agreement when value or preference-based choices are made, it can have a negative influence on the reduction of uncertainty. Because of the generalized nature of the assessment, there was an inherent uncertainty associated with all modes of effluent discharge. That is, different disposal methods have different risks in different settings, given different loadings, population distributions, and geology, for example. In addition, uncertainty was increased due to the lack of data available regarding some of the alternatives. Thus, the Bayesian approach was used to account for these uncertainties, and consensus was not a prime objective. Therefore, the Delphi method was modified as follows. A modified Delphi questionnaire was prepared as a Microsoft Excel Workbook, consisting of three sheets. Appendix K shows the form, with final Team responses and comments entered. Each sheet was dedicated to a method of disposal, corresponding to the three modified tree diagrams of Appendix J. The questionnaire posed a series of questions that followed exposure pathways from the point of discharge through to each point in the environment or water management system where a water quality standard existed. Each of these points represented a point of potential water quality violation due to the discharge alternative, and was represented by a node in the corresponding decision tree. For each node and each discharge alternative, the Team was asked four principal questions, worded as follows: 1. How many times in 30 years will the regulatory standard be exceeded at the receiving
node? (One such exceedance event may last any number of days.) 2. What is your confidence in the numbers of exceedance events you entered? Please
select low (L), medium (M) or high (H). 3. How many days will exceedence events last (min., mean, max.)?
FPL-012-066

67
4. What is your confidence in the event sizes you entered? Please select from low (L), medium (M) or high (H).
For each node, the following three types of information were provided to the team members, for use in answering the questions posed: 1. Applicable effluent concentrations found in Southeast Florida effluent, as collected
during the project and presented in Section 2, 2. Applicable actual or assumed regulatory standard, and 3. Relevant assumptions and supporting information were provided in the questionnaire. Principal assumptions of the analysis for injection well disposal were: 1. Injected effluent has migrated vertically to the upper Floridan Aquifer (however, it
must pass approximately 500 ft. of Hawthorn clays to reach the Biscayne Aquifer), 2. Each injection well has four casings in the Biscayne Aquifer, and three in the
Hawthorn, as shown in supporting information (Appendix L); 3. ASR potable and non-potable wells are located one mile from the effluent injection
well system (conservative); 4. Drinking water derived from source wells in the Biscayne Aquifer Lime receives lime
softening and chlorination; 5. Biscayne aquifer water drains continually into canals (relative to exceedence of
surface water standards in canals due to contamination in the Biscayne aquifer); 6. Non-potable ASR water will be discharged directly to canals without treatment,
dilution will be minimal, and discharges will be monitored and ceased if elevated salinity is detected;
7. Lime softening and chlorination of treated drinking water derived from canals in the Biscayne Aquifer, with: four logs removal of viruses required (Surface Water Treatment Rule); two logs removal Cryptosporidium required (Interim Enhanced Surface Water Treatment Rule); one log typical removal of arsenic by lime softening (AWWA 1999); no removal of TKN; and no removal or formation of NDMA (Tchobanoglous 2000);
8. Chlorination and blending only, prior to consumption, of drinking water treated, stored, and withdrawn from potable ASR wells: one log removal of viruses (based on Rose and Carnahan 1992), no removal of Cryptosporidium (based on Rose and Carnahan 1992), no removal of Arsenic or TKN, and no removal or formation of NDMA (Tchobanoglous 2000); when ASR monitoring system detects elevated salinity, withdrawals should stop; and
9. Reverse osmosis treatment of marine water withdrawn for potable water production. Principal assumptions of the analysis for ocean outfall disposal were: 1. Secondary treatment and chlorination of discharged effluent; 2. A minimum of 20:1 dilution in boil required to be maintained more than 9 days in 90;
violations of this rate may be related to movement of the Gulfstream current;
FPL-012-067
68
3. Relative to breaks in the outfall pipeline (upstream of the diffuser), leakage released to the Biscayne Aquifer in an area of minimal current, outside the influence of the Gulfstream; and
4. Reverse osmosis treatment of ocean water withdrawn for drinking water production. Principal assumptions of the analysis for disposal by surficial aquifer recharge were: 1. AWT preceding discharge; 2. Minimal dilution in canals; 3. Relative to exceedance of MCL drinking water standards in Biscayne aquifer well
water due to leakage from canals to well: canal levels higher than the ground water table, not the typical condition (Bloetscher 2000); and
4. Lime softening and chlorination of treated potable water derived from Biscayne aquifer wells.
The questionnaire set was circulated electronically three times to develop input for the initial assessment presented at Meeting 3. A final iteration was conducted to refine input based on group discussion at Meeting 3, to develop input for the final assessment. After each iterative circulation of the questionnaires, results were analyzed. After each iteration, geometric mean, weighted geometric mean, maximum, and minimum answers were tabulated and reported to the group for each question anonymously, along with reasons given for individual answers, if any. Reasons were particularly requested for answers outside the range of the group in general. Team members were asked to review and refine their individual opinions, based on the opinions and reasons of other members. The Principal Investigator did not remove extreme answers, and differences in opinion were allowed. 5.4. Predictive Bayesian Assessment Model A predictive Bayesian model of health risks associated with injection well, ocean outfall, and surficial aquifer recharge by canal discharge was constructed, based on available data and other information, including expert opinion assembled by the Research Team. The approach involved the assignment of probability distributions, termed sampling distributions, to (a) the number of water quality standard violations expected in 30 years due to a discharge alternative, and (b) the expected magnitude (number of days) of individual violations. The Poisson distribution can be theoretically and empirically shown to predict the number of incidents, or infrequent events, over a period, and is widely used for this purpose. Therefore, the Poisson distribution was chosen as the sampling distribution for the number of violations in 30 years. The Pareto distribution is known to predict the size of individual incidents [Englehardt, 1995]. Sampling distributions describe the natural variability in, for example, the number of violations. That is, they describe the variability in the number of violations experienced among several imagined, repeated 30-year periods. The parameters of these distributions determine the location and scale (roughly, the mean and standard deviation) of the distributions. When little or no data are available to specify the parameters of these
FPL-012-068

69
distributions, probability distributions, termed prior distributions, can then be assigned to the parameters themselves. Priors can be determined based on any combination of subjective or numeric information using Bayes Theorem. For the site-general assessment to be conducted, data could not be used. Therefore, model input consisted of professional judgment based on available data (e.g., effluent and water quality, hydraulic conductivity, and dispersion data collected during SEFLOE) and other local knowledge. An extension of Bayesian methods was applied in this project, termed predictive Bayesian assessment. Predictive methods involve finding the unconditional probability of the numbers and sizes of violations, given the forms of the sampling distributions, and the specified distributions for sampling distribution parameters. That is, uncertainty in the parameters was integrated into the sampling distributions, resulting in predictive distributions for the numbers and sizes of violations. Predictive Bayesian distributions evolve in shape systematically in response to information content. As predicted by information theory, predictive distributions are broader when less is known, becoming narrower as information increases, converging on the underlying sampling distribution of variability. The increased breadth of a predictive distribution given limited information accounts for uncertainty due to information limitations. For example, because an ocean outfall in one location may have one expected number of violations and the same outfall in another setting may have another, the distribution in the number of violations is broader for the alternative to account for this range (essentially, uncertainty in location). Predictive distributions were then used to compute distributions for total losses over the period. The model used to compute cumulative risks over a planning period is the compound Poisson model, in which the number of incidents over the period are described by a Poisson distribution, and the severity of individual incidents is described by a Pareto distribution. An example predictive Bayesian, compound Poisson risk assessment is diagramed in Figure 16. Dotted lines portray distributions with varying information content. Broader distributions represent less available information. In Figure 16, N is the number of injury or disease incidents of a particular type over the planning period, Z is the magnitude of the health impairment for individual incidents of that type, and X is the total (uncertain) health loss accumulated over the period. Incident number Incident magnitude Total loss
ln z
ln f(z)
risk
Loss x
f(x)
2 3 4 5 60 1n
p (n) X =
Figure 16. Schematic of the predictive Bayesian risk assessment model for probabilities
of total violation-days, X, from distributions for number of violation events over the period, N, and individual violation magnitude, Z, based on available information.
FPL-012-069
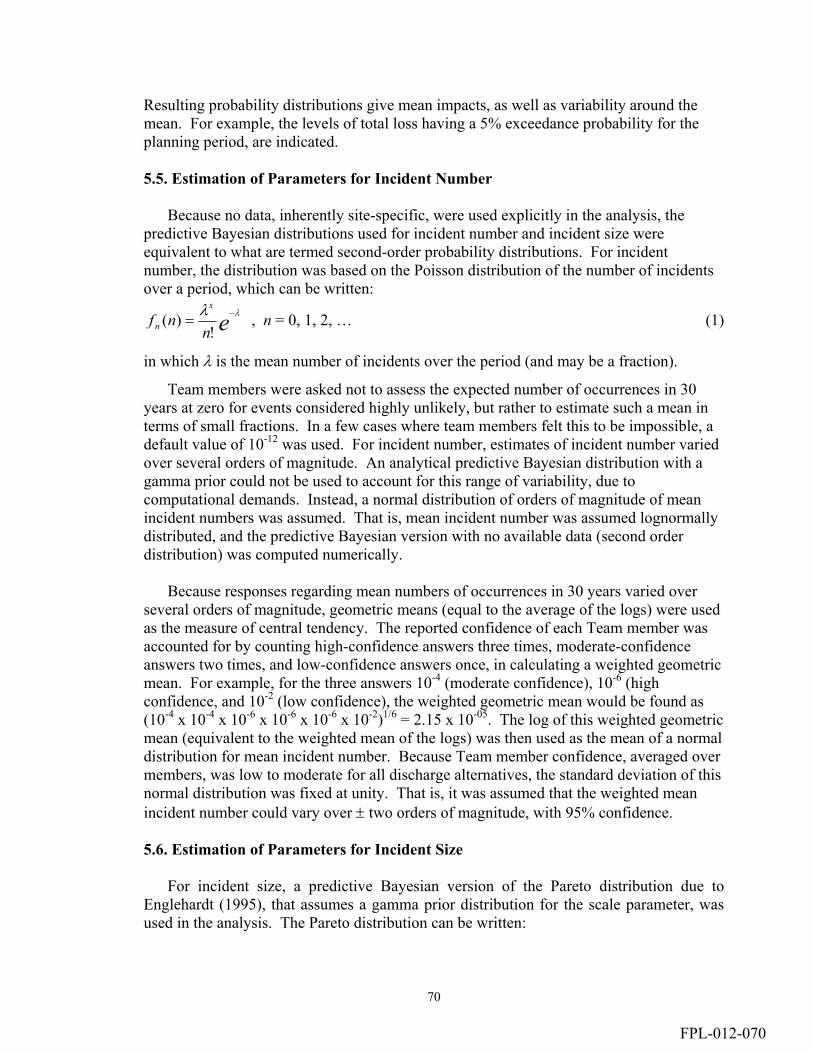
70
Resulting probability distributions give mean impacts, as well as variability around the mean. For example, the levels of total loss having a 5% exceedance probability for the planning period, are indicated. 5.5. Estimation of Parameters for Incident Number Because no data, inherently site-specific, were used explicitly in the analysis, the predictive Bayesian distributions used for incident number and incident size were equivalent to what are termed second-order probability distributions. For incident number, the distribution was based on the Poisson distribution of the number of incidents over a period, which can be written:
ennf
x
nλλ −=
!)( , n = 0, 1, 2, … (1)
in which λ is the mean number of incidents over the period (and may be a fraction).
Team members were asked not to assess the expected number of occurrences in 30 years at zero for events considered highly unlikely, but rather to estimate such a mean in terms of small fractions. In a few cases where team members felt this to be impossible, a default value of 10-12 was used. For incident number, estimates of incident number varied over several orders of magnitude. An analytical predictive Bayesian distribution with a gamma prior could not be used to account for this range of variability, due to computational demands. Instead, a normal distribution of orders of magnitude of mean incident numbers was assumed. That is, mean incident number was assumed lognormally distributed, and the predictive Bayesian version with no available data (second order distribution) was computed numerically. Because responses regarding mean numbers of occurrences in 30 years varied over several orders of magnitude, geometric means (equal to the average of the logs) were used as the measure of central tendency. The reported confidence of each Team member was accounted for by counting high-confidence answers three times, moderate-confidence answers two times, and low-confidence answers once, in calculating a weighted geometric mean. For example, for the three answers 10-4 (moderate confidence), 10-6 (high confidence, and 10-2 (low confidence), the weighted geometric mean would be found as (10-4 x 10-4 x 10-6 x 10-6 x 10-6 x 10⁻²)1/6 = 2.15 x 10-05. The log of this weighted geometric mean (equivalent to the weighted mean of the logs) was then used as the mean of a normal distribution for mean incident number. Because Team member confidence, averaged over members, was low to moderate for all discharge alternatives, the standard deviation of this normal distribution was fixed at unity. That is, it was assumed that the weighted mean incident number could vary over ± two orders of magnitude, with 95% confidence. 5.6. Estimation of Parameters for Incident Size For incident size, a predictive Bayesian version of the Pareto distribution due to Englehardt (1995), that assumes a gamma prior distribution for the scale parameter, was used in the analysis. The Pareto distribution can be written:
FPL-012-070
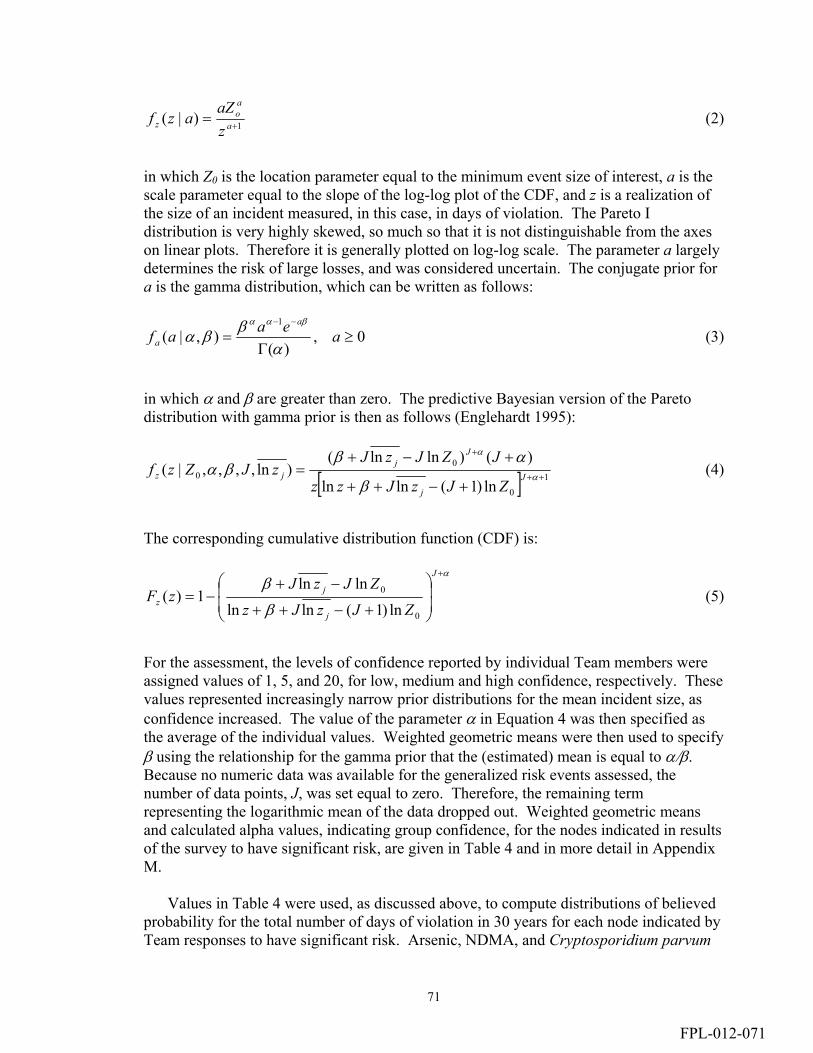
71
1)|( += a
ao
z zaZ
azf (2)
in which Z0 is the location parameter equal to the minimum event size of interest, a is the scale parameter equal to the slope of the log-log plot of the CDF, and z is a realization of the size of an incident measured, in this case, in days of violation. The Pareto I distribution is very highly skewed, so much so that it is not distinguishable from the axes on linear plots. Therefore it is generally plotted on log-log scale. The parameter a largely determines the risk of large losses, and was considered uncertain. The conjugate prior for a is the gamma distribution, which can be written as follows:
0,)(
),|(1
≥Γ
=−−
aeaafa
a αββα
βαα
(3)
in which α and β are greater than zero. The predictive Bayesian version of the Pareto distribution with gamma prior is then as follows (Englehardt 1995):
[ ] 1
0
00
ln)1(lnln
)()lnln()ln,,,,|( ++
+
+−++
+−+= α
α
β
αββα J
j
Jj
jzZJzJzz
JZJzJzJZzf (4)
The corresponding cumulative distribution function (CDF) is:
α
β
β+
+−++
−+−=
J
j
jz ZJzJz
ZJzJzF
0
0
ln)1(lnln
lnln1)( (5)
For the assessment, the levels of confidence reported by individual Team members were assigned values of 1, 5, and 20, for low, medium and high confidence, respectively. These values represented increasingly narrow prior distributions for the mean incident size, as confidence increased. The value of the parameter α in Equation 4 was then specified as the average of the individual values. Weighted geometric means were then used to specify β using the relationship for the gamma prior that the (estimated) mean is equal to α/β. Because no numeric data was available for the generalized risk events assessed, the number of data points, J, was set equal to zero. Therefore, the remaining term representing the logarithmic mean of the data dropped out. Weighted geometric means and calculated alpha values, indicating group confidence, for the nodes indicated in results of the survey to have significant risk, are given in Table 4 and in more detail in Appendix M. Values in Table 4 were used, as discussed above, to compute distributions of believed probability for the total number of days of violation in 30 years for each node indicated by Team responses to have significant risk. Arsenic, NDMA, and Cryptosporidium parvum
FPL-012-071
72
(for surface water) or rotavirus (for ground water) were used as indicators of human health risk, and were therefore computed at drinking water nodes. In the case of ocean outfall disposal, the drinking water node assumed RO treatment and therefore was considered to have negligible risk. Therefore, human health risk for ocean outfall disposal was based on violation of surface water standards at the beach, assuming accidental ingestion of ocean water by bathers at the beach. TKN was used as an indicator of ecological risk, and was computed at surface water nodes. Where more than one node contributed significantly to either health or ecological risk for a discharge alternative, a distribution for the total believed violation days was computed by Monte Carlo simulation. Distributions for the number of violations, and for the total violation days, were truncated at 10,950, the total number of days in 30 years. That is, a violation day was defined as a day during which one or more water quality violations occurred.
FPL-012-072
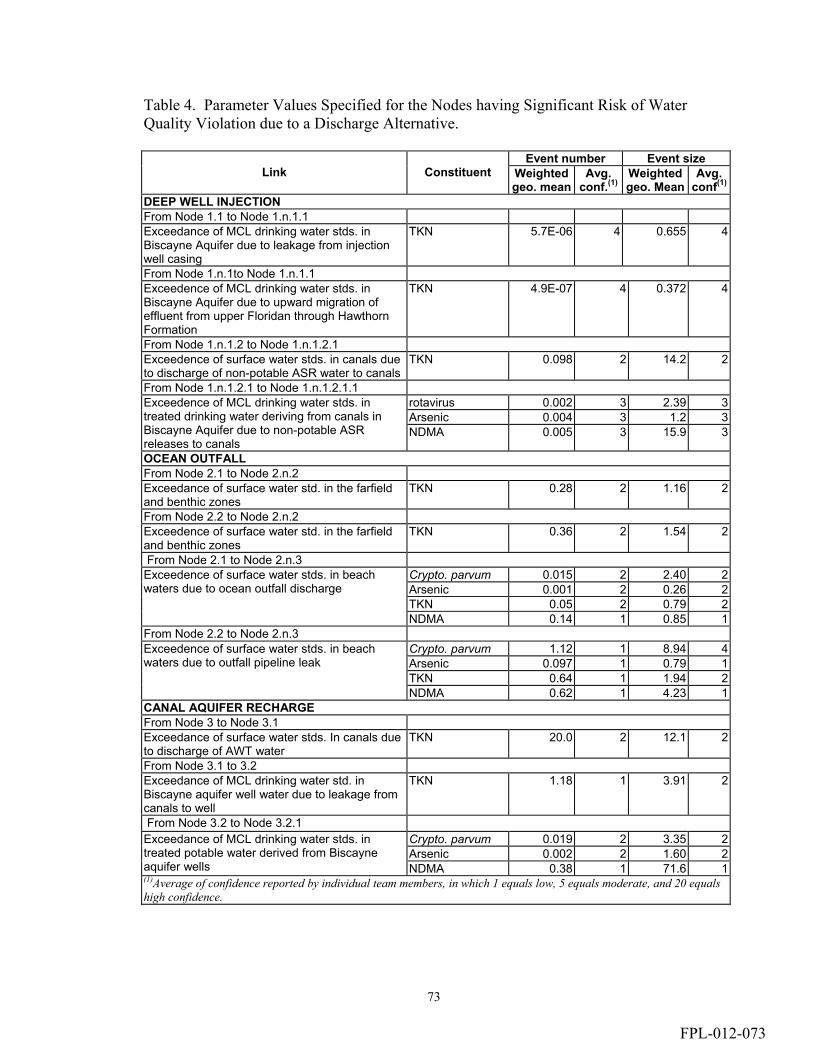
73
Table 4. Parameter Values Specified for the Nodes having Significant Risk of Water Quality Violation due to a Discharge Alternative.
Event number Event size Link Constituent Weighted
geo. mean Avg.
conf.(1) Weighted geo. Mean
Avg. conf(1)
DEEP WELL INJECTION From Node 1.1 to Node 1.n.1.1 Exceedance of MCL drinking water stds. in Biscayne Aquifer due to leakage from injection well casing
TKN 5.7E-06 4 0.655 4
From Node 1.n.1to Node 1.n.1.1 Exceedence of MCL drinking water stds. in Biscayne Aquifer due to upward migration of effluent from upper Floridan through Hawthorn Formation
TKN 4.9E-07 4 0.372 4
From Node 1.n.1.2 to Node 1.n.1.2.1 Exceedence of surface water stds. in canals due to discharge of non-potable ASR water to canals
TKN 0.098 2 14.2 2
From Node 1.n.1.2.1 to Node 1.n.1.2.1.1 rotavirus 0.002 3 2.39 3Arsenic 0.004 3 1.2 3
Exceedence of MCL drinking water stds. in treated drinking water deriving from canals in Biscayne Aquifer due to non-potable ASR releases to canals
NDMA 0.005 3 15.9 3
OCEAN OUTFALL From Node 2.1 to Node 2.n.2 Exceedance of surface water std. in the farfield and benthic zones
TKN 0.28 2 1.16 2
From Node 2.2 to Node 2.n.2 Exceedence of surface water std. in the farfield and benthic zones
TKN 0.36 2 1.54 2
From Node 2.1 to Node 2.n.3 Crypto. parvum 0.015 2 2.40 2Arsenic 0.001 2 0.26 2TKN 0.05 2 0.79 2
Exceedence of surface water stds. in beach waters due to ocean outfall discharge
NDMA 0.14 1 0.85 1From Node 2.2 to Node 2.n.3
Crypto. parvum 1.12 1 8.94 4Arsenic 0.097 1 0.79 1TKN 0.64 1 1.94 2
Exceedence of surface water stds. in beach waters due to outfall pipeline leak
NDMA 0.62 1 4.23 1CANAL AQUIFER RECHARGE From Node 3 to Node 3.1 Exceedance of surface water stds. In canals due to discharge of AWT water
TKN 20.0 2 12.1 2
From Node 3.1 to 3.2 Exceedance of MCL drinking water std. in Biscayne aquifer well water due to leakage from canals to well
TKN 1.18 1 3.91 2
From Node 3.2 to Node 3.2.1 Crypto. parvum 0.019 2 3.35 2Arsenic 0.002 2 1.60 2
Exceedance of MCL drinking water stds. in treated potable water derived from Biscayne aquifer wells NDMA 0.38 1 71.6 1(1)Average of confidence reported by individual team members, in which 1 equals low, 5 equals moderate, and 20 equals high confidence.
FPL-012-073

74
6. RESULTS AND DISCUSSION Results of all computed believed probability distributions for numbers and durations of water quality violations, and total believed violation days, computed for each constituent at all nodes and for all discharge alternatives, are shown in Appendix M. Mean, standard deviation, 5% exceedance values, and full distributions, for believed probabilities, and weighted geometric means computed from expert judgment elicitation, are given. The values of total believed violation days for which there was a 5% risk of exceedance were generally lower (or zero) than the mean values. This was attributed to the high skew of the distributions, and the extremely low mean values, rather than to differences among alternatives, and were not considered in the evaluation of relative risk. Summarized results of the probabilistic assessment are shown in Tables 5 through 7. In Table 5, the believed number of days during which one or more violations were assessed to occur are shown for human health indicators arsenic, microbes, and NDMA. In Table 6, the believed number of days during which one or more violations were assessed to occur are shown for the ecological health indicator TKN. These numbers are larger than the expected number of days on which violations would occur, because they reflect uncertainty in addition to inherent variability. In addition, they are based upon multiple assumptions, as detailed in Sections 5.1 and 5.3. In particular, the following assumptions were considered important to the results obtained: 1. Rapid vertical migration to the Upper Floridan Aquifer from deep injection wells in
the Lower Floridan Aquifer was assumed. This assumption is equivalent to assuming that the Floridan Aquifer will be "impacted" with water of generally much lower dissolved solids and inorganics than native water of the aquifer, as discussed in Section 3.3. However, concentrations of organics and nutrients, including cyanide, nitrogen and phosphorous compounds, color, odor, foaming agents, total trihalomethanes (THMs), biochemical oxygen demand (BOD), and total coliform count, were found in higher concentrations in the treated effluents than in Floridan water. In addition, treated effluents were somewhat higher in temperature and lower in pH, on average. Of note based on wastewater effluent analyses obtained, on average, treated effluents met both primary and secondary standards for drinking water, with the exceptions of primary standards for antimony and total coliform, and secondary standards for color, odor, TDS, and foaming agents. The assumption of rapid vertical migration to the upper Floridan was equivalent to assuming a violation of the USDW with 100% probability. This probability of violation was therefore not computed and is not reflected in the numbers in Table 1;
2. ASR wells were assumed located one mile from effluent injection wells. It was further assumed that, as water is withdrawn from potable and non-potable ASR wells, salinity would be monitored, and withdrawals would stop if elevated levels were detected. However, the Team assessed the risks associated with the discharge of non-potable ASR water (to canals without treatment) to be higher than those associated with discharge of water from potable ASR wells (to distribution systems following chlorination and blending). Assumptions of Team members regarding the future
FPL-012-074
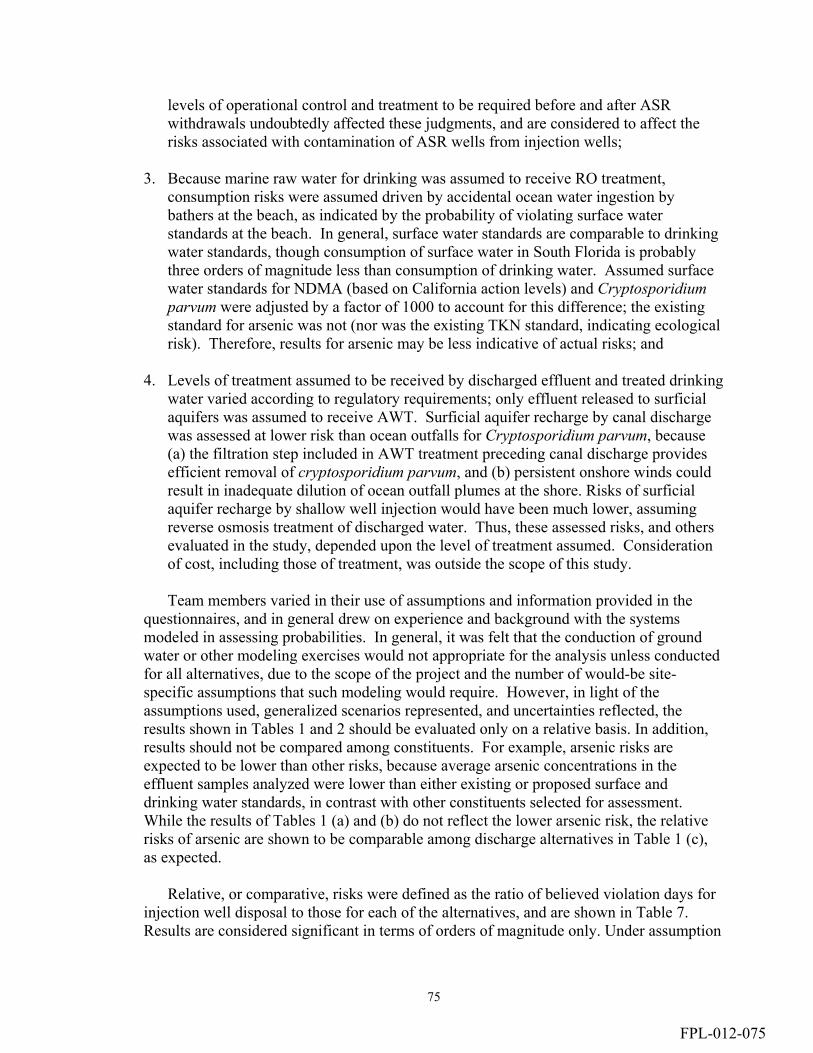
75
levels of operational control and treatment to be required before and after ASR withdrawals undoubtedly affected these judgments, and are considered to affect the risks associated with contamination of ASR wells from injection wells;
3. Because marine raw water for drinking was assumed to receive RO treatment, consumption risks were assumed driven by accidental ocean water ingestion by bathers at the beach, as indicated by the probability of violating surface water standards at the beach. In general, surface water standards are comparable to drinking water standards, though consumption of surface water in South Florida is probably three orders of magnitude less than consumption of drinking water. Assumed surface water standards for NDMA (based on California action levels) and Cryptosporidium parvum were adjusted by a factor of 1000 to account for this difference; the existing standard for arsenic was not (nor was the existing TKN standard, indicating ecological risk). Therefore, results for arsenic may be less indicative of actual risks; and
4. Levels of treatment assumed to be received by discharged effluent and treated drinking water varied according to regulatory requirements; only effluent released to surficial aquifers was assumed to receive AWT. Surficial aquifer recharge by canal discharge was assessed at lower risk than ocean outfalls for Cryptosporidium parvum, because (a) the filtration step included in AWT treatment preceding canal discharge provides efficient removal of cryptosporidium parvum, and (b) persistent onshore winds could result in inadequate dilution of ocean outfall plumes at the shore. Risks of surficial aquifer recharge by shallow well injection would have been much lower, assuming reverse osmosis treatment of discharged water. Thus, these assessed risks, and others evaluated in the study, depended upon the level of treatment assumed. Consideration of cost, including those of treatment, was outside the scope of this study.
Team members varied in their use of assumptions and information provided in the questionnaires, and in general drew on experience and background with the systems modeled in assessing probabilities. In general, it was felt that the conduction of ground water or other modeling exercises would not appropriate for the analysis unless conducted for all alternatives, due to the scope of the project and the number of would-be site-specific assumptions that such modeling would require. However, in light of the assumptions used, generalized scenarios represented, and uncertainties reflected, the results shown in Tables 1 and 2 should be evaluated only on a relative basis. In addition, results should not be compared among constituents. For example, arsenic risks are expected to be lower than other risks, because average arsenic concentrations in the effluent samples analyzed were lower than either existing or proposed surface and drinking water standards, in contrast with other constituents selected for assessment. While the results of Tables 1 (a) and (b) do not reflect the lower arsenic risk, the relative risks of arsenic are shown to be comparable among discharge alternatives in Table 1 (c), as expected. Relative, or comparative, risks were defined as the ratio of believed violation days for injection well disposal to those for each of the alternatives, and are shown in Table 7. Results are considered significant in terms of orders of magnitude only. Under assumption
FPL-012-075
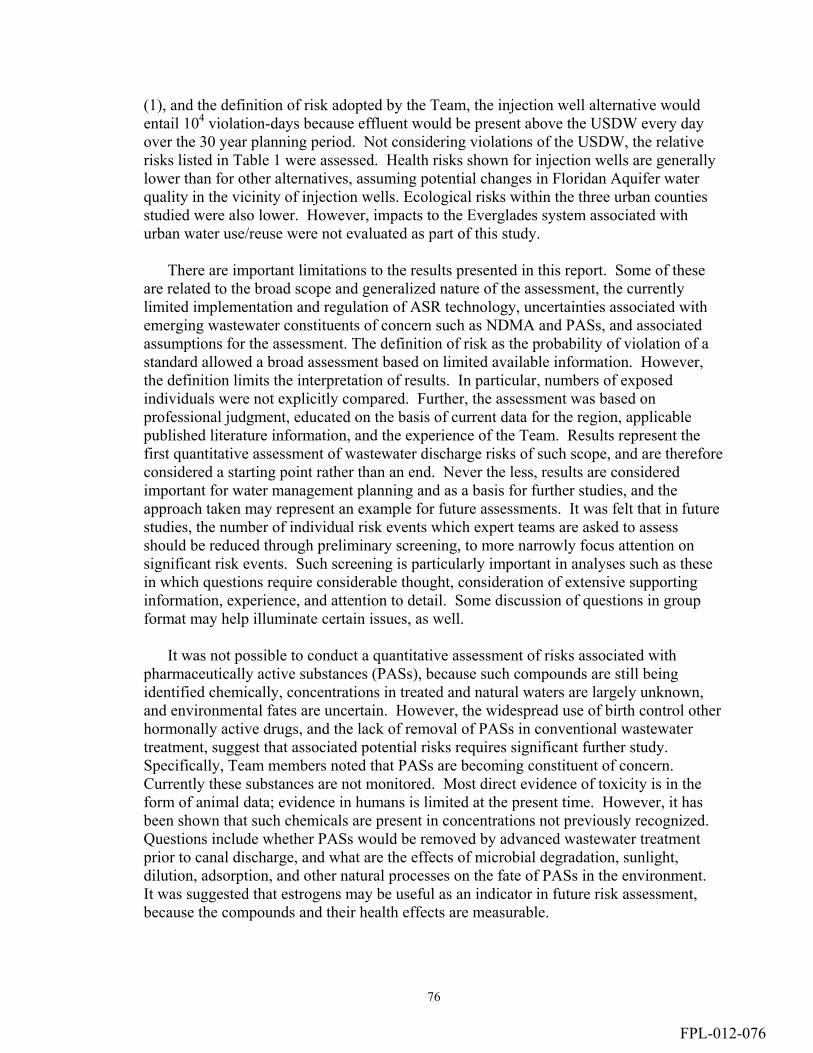
76
(1), and the definition of risk adopted by the Team, the injection well alternative would entail 104 violation-days because effluent would be present above the USDW every day over the 30 year planning period. Not considering violations of the USDW, the relative risks listed in Table 1 were assessed. Health risks shown for injection wells are generally lower than for other alternatives, assuming potential changes in Floridan Aquifer water quality in the vicinity of injection wells. Ecological risks within the three urban counties studied were also lower. However, impacts to the Everglades system associated with urban water use/reuse were not evaluated as part of this study. There are important limitations to the results presented in this report. Some of these are related to the broad scope and generalized nature of the assessment, the currently limited implementation and regulation of ASR technology, uncertainties associated with emerging wastewater constituents of concern such as NDMA and PASs, and associated assumptions for the assessment. The definition of risk as the probability of violation of a standard allowed a broad assessment based on limited available information. However, the definition limits the interpretation of results. In particular, numbers of exposed individuals were not explicitly compared. Further, the assessment was based on professional judgment, educated on the basis of current data for the region, applicable published literature information, and the experience of the Team. Results represent the first quantitative assessment of wastewater discharge risks of such scope, and are therefore considered a starting point rather than an end. Never the less, results are considered important for water management planning and as a basis for further studies, and the approach taken may represent an example for future assessments. It was felt that in future studies, the number of individual risk events which expert teams are asked to assess should be reduced through preliminary screening, to more narrowly focus attention on significant risk events. Such screening is particularly important in analyses such as these in which questions require considerable thought, consideration of extensive supporting information, experience, and attention to detail. Some discussion of questions in group format may help illuminate certain issues, as well. It was not possible to conduct a quantitative assessment of risks associated with pharmaceutically active substances (PASs), because such compounds are still being identified chemically, concentrations in treated and natural waters are largely unknown, and environmental fates are uncertain. However, the widespread use of birth control other hormonally active drugs, and the lack of removal of PASs in conventional wastewater treatment, suggest that associated potential risks requires significant further study. Specifically, Team members noted that PASs are becoming constituent of concern. Currently these substances are not monitored. Most direct evidence of toxicity is in the form of animal data; evidence in humans is limited at the present time. However, it has been shown that such chemicals are present in concentrations not previously recognized. Questions include whether PASs would be removed by advanced wastewater treatment prior to canal discharge, and what are the effects of microbial degradation, sunlight, dilution, adsorption, and other natural processes on the fate of PASs in the environment. It was suggested that estrogens may be useful as an indicator in future risk assessment, because the compounds and their health effects are measurable.
FPL-012-076
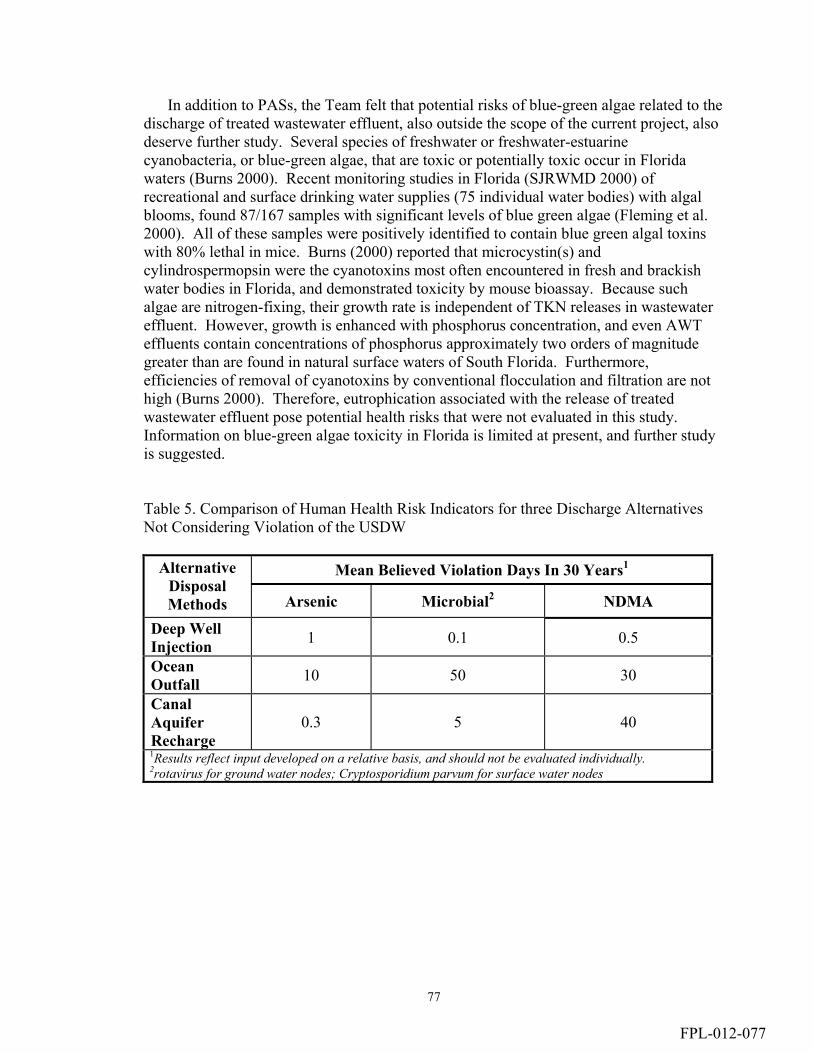
77
In addition to PASs, the Team felt that potential risks of blue-green algae related to the discharge of treated wastewater effluent, also outside the scope of the current project, also deserve further study. Several species of freshwater or freshwater-estuarine cyanobacteria, or blue-green algae, that are toxic or potentially toxic occur in Florida waters (Burns 2000). Recent monitoring studies in Florida (SJRWMD 2000) of recreational and surface drinking water supplies (75 individual water bodies) with algal blooms, found 87/167 samples with significant levels of blue green algae (Fleming et al. 2000). All of these samples were positively identified to contain blue green algal toxins with 80% lethal in mice. Burns (2000) reported that microcystin(s) and cylindrospermopsin were the cyanotoxins most often encountered in fresh and brackish water bodies in Florida, and demonstrated toxicity by mouse bioassay. Because such algae are nitrogen-fixing, their growth rate is independent of TKN releases in wastewater effluent. However, growth is enhanced with phosphorus concentration, and even AWT effluents contain concentrations of phosphorus approximately two orders of magnitude greater than are found in natural surface waters of South Florida. Furthermore, efficiencies of removal of cyanotoxins by conventional flocculation and filtration are not high (Burns 2000). Therefore, eutrophication associated with the release of treated wastewater effluent pose potential health risks that were not evaluated in this study. Information on blue-green algae toxicity in Florida is limited at present, and further study is suggested. Table 5. Comparison of Human Health Risk Indicators for three Discharge Alternatives Not Considering Violation of the USDW
Mean Believed Violation Days In 30 Years1 Alternative Disposal Methods Arsenic Microbial2 NDMA
Deep Well Injection 1 0.1 0.5
Ocean Outfall 10 50 30
Canal Aquifer Recharge
0.3 5 40
1Results reflect input developed on a relative basis, and should not be evaluated individually. 2rotavirus for ground water nodes; Cryptosporidium parvum for surface water nodes
FPL-012-077

78
Table 6. Comparison of an Ecological Risk Indicator for three Discharge Alternatives Not Considering Violation of the USDW
Mean Believed Violation Days In 30 Years1 Alternative Disposal Methods
TKN
Deep Well Injection 10 Ocean Outfall 40 Canal Aquifer Recharge 100 1Results reflect input developed on a relative basis, and should not be evaluated individually. Table 7. Relative Risk Indicators for Three Disposal Alternatives Not Considering Violation of the USDW
Relative Mean Believed Violation Days In 30 Years1 (days/days) Alternative Disposal
Methods Arsenic
Microbial (rotavirus or Cryptosporidium
parvum NDMA TKN
Injection Well/Ocean Outfall 10-1 10-3 10-2 10-1
Injection Well/Canal Aquifer Recharge 100 10-2 10-2 10-1 1Higher values represent higher potential frequency of, and/or higher uncertainty in the probability of, violating surface and drinking water standards given current treatment requirements, for a generalized scenario in Southeast Florida. Values less than one indicate a lower believed risk of violating standards for injection well disposal relative to the alternative.
FPL-012-078
79
7. REFERENCES Andrews, S.A., and Taguchi, V.Y. (2000), “NDMA – Canadian Issues,” Water Quality
Technical Conference Proceedings, AWWA, Denver, CO. American Water Works Association (AWWA), Water Quality and Treatment A Handbook
of Community Water Supplies McGraw-Hill Inc, 1999 New York Block, J.C. (1989), Viruses in Water Supplies – Detection and Identification, VCH Press,
New York, New York, 1989. Bloetscher, Frederick, “Aquifer Storage and Recovery to Meet Peak Water Demands in
Southwest Florida,” CONSERV96 Conference Proceedings, AWWA, Denver, CO, 1996.
Bolton, James R., and Stefan, Nihaela I. (2000), “UV Photodegradation as a Treatment Technology for N-Nitrosodimethylamine (NDMA),” Water Quality Technical Conference Proceedings, AWWA, Denver, CO.
Burns, J. (2000) “A Review of Reports and Meetings Regarding Cyanotoxins in Australian Drinking Water Supplies, Human Health Guidelines and Water Treatment Practices,” Final Report to the NIEHS Marine and Freshwater Biomedical Sciences Center, University of Miami Rosensteil School of Marine and Atmospheric Studies, Miami, FL, October.
Buser, H.R.; Muller, M.D.; and Theobald, N. (1998), “Occurrence of the Pharmaceutical Drug Clofibric Acid and the Herbicide Mecoprop in Various Swiss Lakes and in the North Sea,” Environmental Science Technology, Vol. 32, pp. 188-192.
California Code of Regulations Title 22 (1993), State of California, Division 4, Chapter 3. CDHS (2000), California Department of Health Services web-site on NDMA as of
9/7/2000, www.dhs.ca.gov/ps/ddwem/chemicals/NDMA/NDMAinde. Causaras, C. R., 1985, Geology of the surficial aquifer system, Broward County, Florida,
U.S. Geological Survey Water-Resources Investigations Report 84-4068, 167 p., 2 sheets.
Chin, David A. (2000), Water-Resources Engineering, Prentice Hall, Upper Saddle River, NJ.
Cloburn, T; Dumanski, D.; and Myers, J.P. (1997), Our Stolen Future: Are We Threatening Our Fertility, Intelligence and Survival? A Scientific Detective Story, Plume/Penguin, New York, NY.
Daughton, Christian G. and Ternes, Thomas A., “Pharmaceuticals and Personal Care Products in the Environment: Agents of Subtle Change?” Environmental Health Perspectives, Vol. 107, Suppl. 6 (1999), pp. 907-938.
Davis, Marshall K.; Barrett, Sylvia E.; Hwang, Cordelia J.; Gou, Y.; and Liang, Sun. (2000), “N-Nitrosodimethylamine (NDMA) in Surface Water,” Water Quality Technical Conference Proceedings, AWWA, Denver, CO.
Davis, P. (2000) Vice President, Hazen and Sawyer, presentation, meeting to present initial proposal, Broward County Office of Environmental Services, Pompano Beach, FL, 24 February.
Depledge, M.H., and Billinghurst, Z. (1999), “Ecological Significance of Endocrine Disruption in Marine Invertebrates,” Marine Pollution Bulletin, Vol., 39, Nos. 1-12, pp. 32-38.
FPL-012-079

80
Englehardt, J. (1995) "Predicting Incident Size from Limited Information," Journal of Environmental Engineering, American Society of Civil Engineers, vol. 121, no. 6, pp. 455-464.
Englehardt, J. (1997) "Bayesian Benefit-Risk Analysis for Sustainable Process Design," Journal of Environmental Engineering, American Society of Civil Engineers, vol. 123, no. 1, pp. 71-79 (profiled in Valuing Potential Environmental Liabilities for Managerial Decision-Making: A Review of Available Techniques, U.S. Environmental Protection Agency publication no. EPA742-R-96-003, December, 1996).
Englehardt, J., and J. Lund (1992) "Information Theory in Risk Analysis." Journal of Environmental Engineering, American Society of Civil Engineers, vol. 118, no. 6, pp. 890-904.
Falconer IR. (1989) “Effects on human health of some toxic cyanobacteria (blue green algae) in reservoirs, lakes and rivers,” Tox. Assessment, vol. 4, pp.175-184.
Feachem, Richard; Garelick, Henda; and Slade, John (1981), “Enteroviruses in the Environment,” Tropical Diseases Bulletin, Vol. 28, No. 3, pp. 185-230.
Federal Register (2000), Vol. 65, No. 131, pp. 42233-42245. Fergen, Robert E., unpublished notes from City of Hollywood Chorine Decay study,
1995-1997. Fish, J. E., 1988, Hydrogeology aquifer characteristics and ground-water flow of the
surficial aquifer system. Broward County, Florida, U.S. Geological Survey Water-Resources Investigations Report 87-4034, 92 p., 10 pp.
Florida Administrative Code, Chapters 62-302, 62-600, 62-610, 62-528, and 62-4, www.dep.state.fl.us/ogc/documents/rules/mainrule.htm.
Gerba, Charles P. and Bitton, Gabriel, Groundwater Pollution and Microbiology, John Wiley and Sons, 1984.
Gloria, M.B.A.; Barbour, J.F.; and Scanlan, R.A., “N-Nitrosodimethylamine in Brazilian, US Domestic and US Imported Beers,” Journal of Agric. Food Chem., Vol. 45: 814, (1997).
Gloria, M.B.A.; Barbour, J.F.; and Scanlan, R.A., “Volatile Nitrosamines in Fried Bacon,” Journal of Agric. Food Chem., Vol. 45: 1816, (1997)
Hirsch, R; Ternes, T; Haberer, K.; and Kratz, K-L (1999) “Occurrence of Antibiotics in the Aquatic Environment,” Sci. Total Environment, Vol. 225, No. 1-2, pp. 109-118.
Hurst, Christian J., Modeling Disease Transmission and its Prevention by Disinfection, Cambridge University Press, 1996.
Kruger, Denise and Gedney, William (2000), “Case Studies of N-Nitrosodimethylamine in Groundwater Supplies,” Water Quality Technical Conference Proceedings, AWWA, Denver, CO.
Liang, Sun; Min, Joon H.; Davis, Marshall K.; Green, James F.; and Remer, Donald (2000), Treatment of N-Nitrosodimthylamine (NDMA) by Pulsed-Ultra-Violet Irradiation and Pulsed-UV/Hydrogen Peroxide Processes,” Water Quality Technical Conference Proceedings, AWWA, Denver, CO.
Linstone, H.A. and Turoff, M. The Delphi Method Techniques and Applications. Addison Wesley Publishing Co. 1975, London
Lutz, Ilka and Kloas, Werner, “Amphibians as a Model to Study Endocrine Disruptors: I. Environmental Pollution and Estrogen Receptor Binding,” The Science of the Total Environment, Vol. 225 (1999), pp. 49-57.
FPL-012-080
81
Mumma, R.O.; Raupach, Dale C.; Waldman, J.P.; Tong, S. S.; Jacobs, M.L.; Babish, J.G.; Hotchkisss, J.H.; Wszolek, P.C.; Gutenman, W.H.; Bache, C.A.; and Lick, D.J., (1984), “National Survey of Elements and Other Constituents in Municipal Sludge,” Arch., Env. Contaminant Toxicology, Vol. 13, pp. 75-83.
Njam, Issam (2000), “NDMA Formation in Water and Wastewater,” Water Quality and Technology Conference Proceedings, AWWA, Denver, CO.
Raloff, Janet (2001), “Macho Water: Some River Pollution Spawns Body-altering Steroids,” Science News, Vol. 159, pp. 8 –10.
Rose, Joan B. and Carnahan, Robert P., Pathogen Removal by Full Scale Wastewater Treatment, University of South Florida, Tampa, FL, Dec 15, 1992.
Sackman, H. Delphi Critique. Lexington Books, 1975. Lexington, Massachusetts Snyder, Shane A.; Keith, Timothy L.; Verbrugge, David A.; Snyder, Erin M.; Gross,
Timothy S.; Kannan, Kurunthachalam; and Giesy, John P. (1999), “Analytical Methods for Detection of Selected Estrogenic Compounds in Aqueous Mixtures,” Environmental Science & Technology, Vol. 33, pp. 2814-2820.
St Johns River Water Management District (SJRWMD). Cyanobacteria Survey Project. SJRWMD. Jacksonville, FL: 2000.
Tchobanoglous, G. and Burton, F. Wastewater Engineering Treatment Disposal and Reuse. McGraw Hill Inc, 1991. New York. Third Ed.
Ternes, Thomas A. (1998), “Occurrence of Drugs in German Sewage Treatment Plants and Rivers,” Water Resources, Vol., 32, No. 11, pp. 3245-3260.
USEPA (1993) “n-nitrosodimethylamine, II. Carcinogenicity Assessment for Lifetime Exposure,” Integrated Risk Information System (IRIS) HTTP://WWW.EPA.GOV/IRIS/SUBST/0045.HTM, last revised 1 July 1993.
USEPA, Ninth Report on Carcinogens (date unknown). Yoo, Lee J; Fitzsimmons, Steve; and Shen, Yvonne (2000), “Determination of N-
Nitrosodimethylamine at Part-per-trillion levels using positive chemical Ionization from Aqueous Samples,” Water Quality Technical Conference Proceedings, AWWA, Denver, CO.
Yates, Marylynn V, Gerba, Charles P., and Kelley, Lee M. (1985), “Virus Resistance in Groundwater,” Applied and Environmental Microbiology, Vol. 49, No. 4, pp. 778-781.
Yates, M.V., Yates, S.R., Wagner, J.M., and Gerba, C.P. (1987), “Modeling Virus Survival and Transport in the Subsurface,” Journal of Contaminant Hydrology, Vol. 1, pp. 329-345.
FPL-012-081
82
APPENDIX A. SUMMARY DATA TABLES FOR ADVANCED WASTEWATER TREATMENT EFFLUENT, RECLAIMED WATER, SECONDARY EFFLUENT, EFFLUENT INJECTION ZONE, LOWER MONITORING ZONE, UPPER MONITORING ZONE, ASR INJECTION ZONE, AND BISCAYNE MONITORING ZONE
FPL-012-082
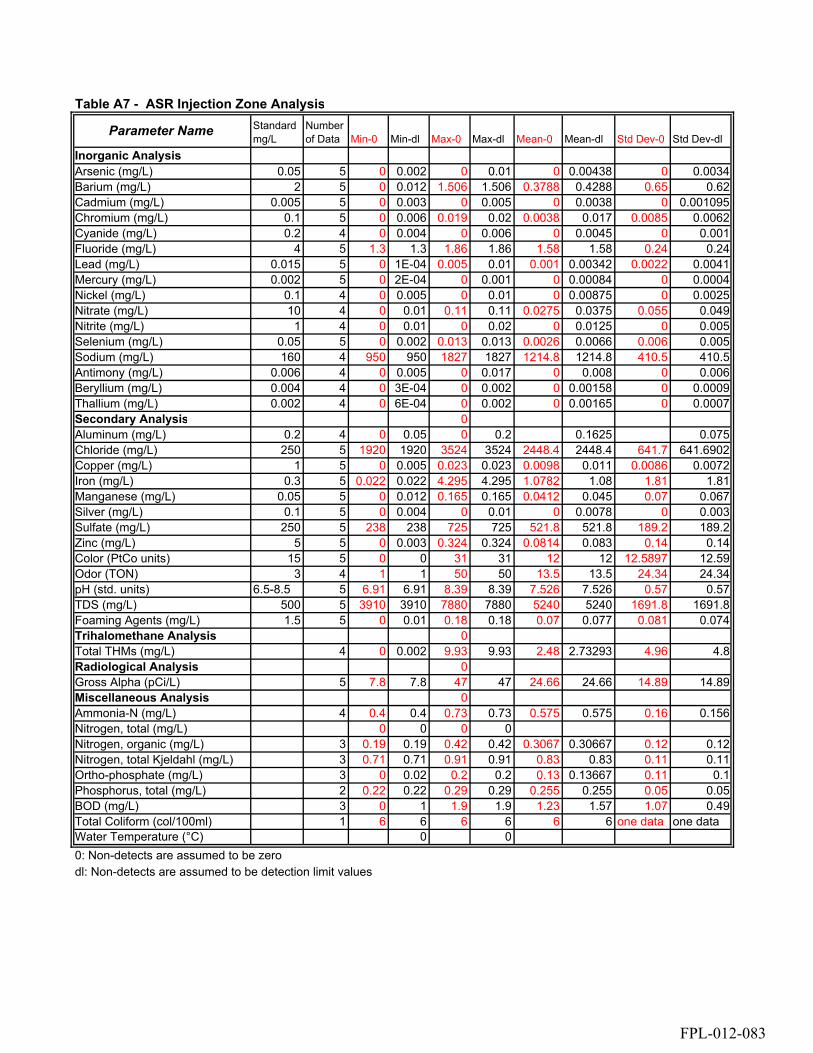
Table A7 - ASR Injection Zone Analysis
Parameter Name Standard mg/L
Number of Data Min-0 Min-dl Max-0 Max-dl Mean-0 Mean-dl Std Dev-0 Std Dev-dl
Inorganic AnalysisArsenic (mg/L) 0.05 5 0 0.002 0 0.01 0 0.00438 0 0.0034Barium (mg/L) 2 5 0 0.012 1.506 1.506 0.3788 0.4288 0.65 0.62Cadmium (mg/L) 0.005 5 0 0.003 0 0.005 0 0.0038 0 0.001095Chromium (mg/L) 0.1 5 0 0.006 0.019 0.02 0.0038 0.017 0.0085 0.0062Cyanide (mg/L) 0.2 4 0 0.004 0 0.006 0 0.0045 0 0.001Fluoride (mg/L) 4 5 1.3 1.3 1.86 1.86 1.58 1.58 0.24 0.24Lead (mg/L) 0.015 5 0 1E-04 0.005 0.01 0.001 0.00342 0.0022 0.0041Mercury (mg/L) 0.002 5 0 2E-04 0 0.001 0 0.00084 0 0.0004Nickel (mg/L) 0.1 4 0 0.005 0 0.01 0 0.00875 0 0.0025Nitrate (mg/L) 10 4 0 0.01 0.11 0.11 0.0275 0.0375 0.055 0.049Nitrite (mg/L) 1 4 0 0.01 0 0.02 0 0.0125 0 0.005Selenium (mg/L) 0.05 5 0 0.002 0.013 0.013 0.0026 0.0066 0.006 0.005Sodium (mg/L) 160 4 950 950 1827 1827 1214.8 1214.8 410.5 410.5Antimony (mg/L) 0.006 4 0 0.005 0 0.017 0 0.008 0 0.006Beryllium (mg/L) 0.004 4 0 3E-04 0 0.002 0 0.00158 0 0.0009Thallium (mg/L) 0.002 4 0 6E-04 0 0.002 0 0.00165 0 0.0007Secondary Analysis 0Aluminum (mg/L) 0.2 4 0 0.05 0 0.2 0.1625 0.075Chloride (mg/L) 250 5 1920 1920 3524 3524 2448.4 2448.4 641.7 641.6902Copper (mg/L) 1 5 0 0.005 0.023 0.023 0.0098 0.011 0.0086 0.0072Iron (mg/L) 0.3 5 0.022 0.022 4.295 4.295 1.0782 1.08 1.81 1.81Manganese (mg/L) 0.05 5 0 0.012 0.165 0.165 0.0412 0.045 0.07 0.067Silver (mg/L) 0.1 5 0 0.004 0 0.01 0 0.0078 0 0.003Sulfate (mg/L) 250 5 238 238 725 725 521.8 521.8 189.2 189.2Zinc (mg/L) 5 5 0 0.003 0.324 0.324 0.0814 0.083 0.14 0.14Color (PtCo units) 15 5 0 0 31 31 12 12 12.5897 12.59Odor (TON) 3 4 1 1 50 50 13.5 13.5 24.34 24.34pH (std. units) 6.5-8.5 5 6.91 6.91 8.39 8.39 7.526 7.526 0.57 0.57TDS (mg/L) 500 5 3910 3910 7880 7880 5240 5240 1691.8 1691.8Foaming Agents (mg/L) 1.5 5 0 0.01 0.18 0.18 0.07 0.077 0.081 0.074Trihalomethane Analysis 0Total THMs (mg/L) 4 0 0.002 9.93 9.93 2.48 2.73293 4.96 4.8Radiological Analysis 0Gross Alpha (pCi/L) 5 7.8 7.8 47 47 24.66 24.66 14.89 14.89Miscellaneous Analysis 0Ammonia-N (mg/L) 4 0.4 0.4 0.73 0.73 0.575 0.575 0.16 0.156Nitrogen, total (mg/L) 0 0 0 0Nitrogen, organic (mg/L) 3 0.19 0.19 0.42 0.42 0.3067 0.30667 0.12 0.12Nitrogen, total Kjeldahl (mg/L) 3 0.71 0.71 0.91 0.91 0.83 0.83 0.11 0.11Ortho-phosphate (mg/L) 3 0 0.02 0.2 0.2 0.13 0.13667 0.11 0.1Phosphorus, total (mg/L) 2 0.22 0.22 0.29 0.29 0.255 0.255 0.05 0.05BOD (mg/L) 3 0 1 1.9 1.9 1.23 1.57 1.07 0.49Total Coliform (col/100ml) 1 6 6 6 6 6 6 one data one dataWater Temperature (°C) 0 00: Non-detects are assumed to be zerodl: Non-detects are assumed to be detection limit values
FPL-012-083
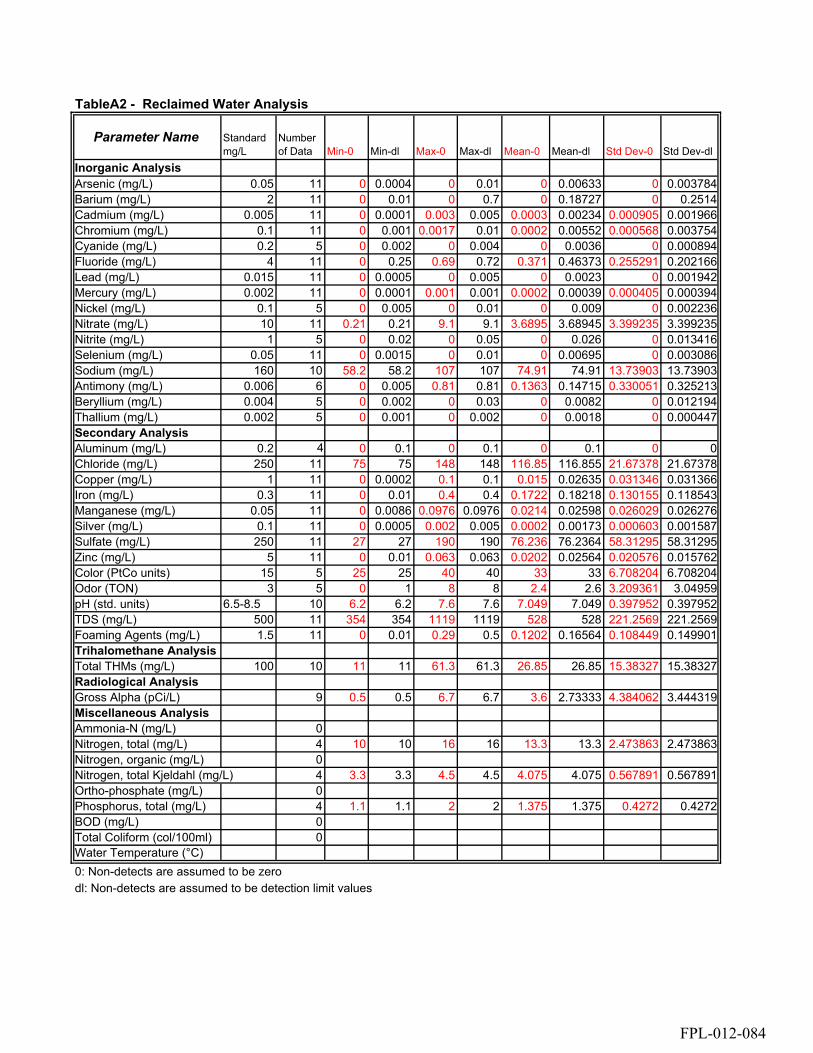
TableA2 - Reclaimed Water Analysis
Parameter Name Standard mg/L
Number of Data Min-0 Min-dl Max-0 Max-dl Mean-0 Mean-dl Std Dev-0 Std Dev-dl
Inorganic AnalysisArsenic (mg/L) 0.05 11 0 0.0004 0 0.01 0 0.00633 0 0.003784Barium (mg/L) 2 11 0 0.01 0 0.7 0 0.18727 0 0.2514Cadmium (mg/L) 0.005 11 0 0.0001 0.003 0.005 0.0003 0.00234 0.000905 0.001966Chromium (mg/L) 0.1 11 0 0.001 0.0017 0.01 0.0002 0.00552 0.000568 0.003754Cyanide (mg/L) 0.2 5 0 0.002 0 0.004 0 0.0036 0 0.000894Fluoride (mg/L) 4 11 0 0.25 0.69 0.72 0.371 0.46373 0.255291 0.202166Lead (mg/L) 0.015 11 0 0.0005 0 0.005 0 0.0023 0 0.001942Mercury (mg/L) 0.002 11 0 0.0001 0.001 0.001 0.0002 0.00039 0.000405 0.000394Nickel (mg/L) 0.1 5 0 0.005 0 0.01 0 0.009 0 0.002236Nitrate (mg/L) 10 11 0.21 0.21 9.1 9.1 3.6895 3.68945 3.399235 3.399235Nitrite (mg/L) 1 5 0 0.02 0 0.05 0 0.026 0 0.013416Selenium (mg/L) 0.05 11 0 0.0015 0 0.01 0 0.00695 0 0.003086Sodium (mg/L) 160 10 58.2 58.2 107 107 74.91 74.91 13.73903 13.73903Antimony (mg/L) 0.006 6 0 0.005 0.81 0.81 0.1363 0.14715 0.330051 0.325213Beryllium (mg/L) 0.004 5 0 0.002 0 0.03 0 0.0082 0 0.012194Thallium (mg/L) 0.002 5 0 0.001 0 0.002 0 0.0018 0 0.000447Secondary AnalysisAluminum (mg/L) 0.2 4 0 0.1 0 0.1 0 0.1 0 0Chloride (mg/L) 250 11 75 75 148 148 116.85 116.855 21.67378 21.67378Copper (mg/L) 1 11 0 0.0002 0.1 0.1 0.015 0.02635 0.031346 0.031366Iron (mg/L) 0.3 11 0 0.01 0.4 0.4 0.1722 0.18218 0.130155 0.118543Manganese (mg/L) 0.05 11 0 0.0086 0.0976 0.0976 0.0214 0.02598 0.026029 0.026276Silver (mg/L) 0.1 11 0 0.0005 0.002 0.005 0.0002 0.00173 0.000603 0.001587Sulfate (mg/L) 250 11 27 27 190 190 76.236 76.2364 58.31295 58.31295Zinc (mg/L) 5 11 0 0.01 0.063 0.063 0.0202 0.02564 0.020576 0.015762Color (PtCo units) 15 5 25 25 40 40 33 33 6.708204 6.708204Odor (TON) 3 5 0 1 8 8 2.4 2.6 3.209361 3.04959pH (std. units) 6.5-8.5 10 6.2 6.2 7.6 7.6 7.049 7.049 0.397952 0.397952TDS (mg/L) 500 11 354 354 1119 1119 528 528 221.2569 221.2569Foaming Agents (mg/L) 1.5 11 0 0.01 0.29 0.5 0.1202 0.16564 0.108449 0.149901Trihalomethane AnalysisTotal THMs (mg/L) 100 10 11 11 61.3 61.3 26.85 26.85 15.38327 15.38327Radiological AnalysisGross Alpha (pCi/L) 9 0.5 0.5 6.7 6.7 3.6 2.73333 4.384062 3.444319Miscellaneous AnalysisAmmonia-N (mg/L) 0Nitrogen, total (mg/L) 4 10 10 16 16 13.3 13.3 2.473863 2.473863Nitrogen, organic (mg/L) 0Nitrogen, total Kjeldahl (mg/L) 4 3.3 3.3 4.5 4.5 4.075 4.075 0.567891 0.567891Ortho-phosphate (mg/L) 0Phosphorus, total (mg/L) 4 1.1 1.1 2 2 1.375 1.375 0.4272 0.4272BOD (mg/L) 0Total Coliform (col/100ml) 0Water Temperature (°C)0: Non-detects are assumed to be zerodl: Non-detects are assumed to be detection limit values
FPL-012-084

Table A3 - Secondary Effluent Analysis
Parameter Name Standard mg/L
Number of Data Min-0 Min-dl Max-0 Max-dl Mean-0 Mean-dl Std Dev-0 Std Dev-dl
Inorganic AnalysisArsenic (mg/L) 0.05 29 0 0.0006 0.001 0.0102 8.2E-05 0.0053 0.000251 0.004269Barium (mg/L) 2 13 0 0.0053 0.008 0.2 0.00205 0.0447 0.003253 0.059476Cadmium (mg/L) 0.005 30 0 5E-05 0.0009 0.005 3.7E-05 0.002 0.000167 0.002122Chromium (mg/L) 0.1 29 0 0.0008 0.005 0.05 0.00025 0.009 0.000963 0.014684Cyanide (mg/L) 0.2 27 0 0.004 0.03 0.2 0.00349 0.0272 0.007952 0.05269Fluoride (mg/L) 4 12 0 0.289 2.37 2.37 0.73475 0.8381 0.576867 0.543375Lead (mg/L) 0.015 29 0 0.0003 0.0492 0.0492 0.00366 0.0051 0.009075 0.009886Mercury (mg/L) 0.002 29 0 6E-05 0.0009 0.0002 0.00005 0.0119 0.00026 0.052274Nickel (mg/L) 0.1 27 0 0.0021 0.038 0.038 0.00952 0.0115 0.008941 0.008017Nitrate (mg/L) 10 17 0.05 0.05 15.1 15.1 3.81869 3.8187 4.839476 4.839476Nitrite (mg/L) 1 10 0 0.015 2.12 2.12 0.5677 0.5812 0.726813 0.715296Selenium (mg/L) 0.05 28 0 0.0004 0.025 0.025 0.00129 0.0074 0.004757 0.00759Sodium (mg/L) 160 13 48.1 48.1 361 361 114.077 114.08 90.88082 90.88082Antimony (mg/L) 0.006 11 0 0.0002 0.0053 0.2 0.00044 0.0255 0.00153 one data Beryllium (mg/L) 0.004 27 0 0.0001 0.0005 0.003 3.3E-05 0.0012 0.000121 0.000962Thallium (mg/L) 0.002 25 0 0.0002 0.0133 0.0133 0.00054 0.0027 0.002559 0.004052Secondary AnalysisAluminum (mg/L) 0.2 17 0 0.0473 0.226 0.226 0.03926 0.1084 0.066301 0.056661Chloride (mg/L) 250 12 21.9 21.9 530 530 151.846 151.85 134.0317 134.0317Copper (mg/L) 1 29 0 0.0013 0.0206 0.0206 0.00259 0.0054 0.004005 0.005428Iron (mg/L) 0.3 13 0.03 0.03 0.459 0.459 0.183 0.183 0.143084 0.143084Manganese (mg/L) 0.05 12 0 0.0076 0.0321 0.05 0.01005 0.0256 0.011728 0.015478Silver (mg/L) 0.1 28 0 5E-05 0.0048 0.02 0.00018 0.0031 0.00089 0.006098Sulfate (mg/L) 250 13 23.2 23.2 160 160 56.6231 56.623 39.30592 39.30592Zinc (mg/L) 5 29 0 0.004 0.08 0.08 0.00883 0.0194 0.016222 0.017668Color (PtCo units) 15 11 10 10 133 133 43.9091 43.909 33.06193 33.06193Odor (TON) 3 9 0 1 75 75 10.6667 11.24 24.65766 24.40017pH (std. units) 6.5-8.5 16 6.1 6.1 7.81 7.81 6.8625 6.8625 0.5634 0.5634TDS (mg/L) 500 14 362 362 1260 1260 550.714 550.71 227.1639 227.1639Foaming Agents (mg/L) 1.5 11 0 0.02 26.6 26.6 2.49 2.5451 7.996706 7.979272Trihalomethane Analysis 0Total THMs (mg/L) 100 7 0 0.0063 222 222 56.8466 66.321 82.49571 86.09661Radiological Analysis 0Gross Alpha (pCi/L) 7 0 0.1 1 1 0.25 0.55 0.5 one dataMiscellaneous Analysis 0Ammonia-N (mg/L) 10 0 2.47 18.8 18.8 8.33636 9.17 5.386528 4.872855Nitrogen, total (mg/L) 1 17 17 17 17 17 17 one data one dataNitrogen, organic (mg/L) 5 0.13 0.13 2.94 2.94 1.584 1.584 1.328431 1.328431Nitrogen, total Kjeldahl (mg/L) 12 1.8 1.8 21.7 21.7 9.78333 9.7833 6.038319 6.038319Ortho-phosphate (mg/L) 11 0.23 0.23 4.08 4.08 1.43091 1.4309 1.175955 1.175955Phosphorus, total (mg/L) 17 0.46 0.46 2.54 2.54 1.32706 1.3271 0.578109 0.578109BOD (mg/L) 10 0.6 0.6 33 33 8.3 8.3 10.22937 10.22937Total Coliform (col/100ml) 8 -10 -10 2100 2100 425 363.14 829.114 774.3699Water Temperature (°C) 3 25 25 26 26 25.3333 25.333 0.57735 0.577350: Non-detects are assumed to be zerodl: Non-detects are assumed to be detection limit values
FPL-012-085

Table A4 - Injection Zone Analysis
Parameter Name Standard mg/L
Number of Data Min-0 Min-dl Max-0 Max-dl Mean-0 Mean-dl Std Dev-0
Std Dev-dl
Inorganic AnalysisArsenic (mg/L) 0.05 13 0 0.002 0.07 0.07 0.0068 0.0125 0.01918 0.01864Barium (mg/L) 2 7 0 0.004 0.91 0.91 0.1686 0.2003 0.34207 0.33175Cadmium (mg/L) 0.005 11 0 0.003 0.014 0.014 0.0027 0.0055 0.00451 0.00309Chromium (mg/L) 0.1 4 0 0.002 0.037 0.037 0.0098 0.0173 0.01819 0.01509Cyanide (mg/L) 0.2 3 0 0.006 0 0.02 0 0.012 0 0.00721Fluoride (mg/L) 4 14 0.51 0.51 1.31 1.31 0.7021 0.7021 0.22105 0.22105Lead (mg/L) 0.015 14 0 0.001 0.336 0.336 0.0673 0.0706 0.09334 0.09098Mercury (mg/L) 0.002 14 0 2E-04 0.0006 0.001 0.0001 0.0004 0.00021 0.0003Nickel (mg/L) 0.1 4 0 0.01 0.042 0.05 0.0105 0.0355 0.021 0.01754Nitrate (mg/L) 10 19 0 0.01 6 6 0.4224 0.4255 1.35584 1.35485Nitrite (mg/L) 1 4 0 0.004 0 0.05 0 0.0185 0 0.02119Selenium (mg/L) 0.05 4 0 0.007 5 0.05 1.2518 0.023 2.49884 0.01965Sodium (mg/L) 160 21 1920 1920 12629 12629 8061.8 8061.8 2854.66 2854.66Antimony (mg/L) 0.006 3 0 0.002 0 0.01 0 0.006 0 0.004Beryllium (mg/L) 0.004 4 0 1E-04 0.01 0.04 0.0025 0.0126 0.005 0.01886Thallium (mg/L) 0.002 4 0 0.009 1.2 1.2 0.3 0.3098 0.6 0.59352Secondary AnalysisAluminum (mg/L) 0.2 13 0 0.03 0.62 0.62 0.1731 0.2262 0.23286 0.2037Chloride (mg/L) 250 25 2080 2080 21884 21884 15302 15302 7006.64 7006.64Copper (mg/L) 1 14 0 0.002 5 0.16 0.3875 0.0323 1.32822 0.04152Iron (mg/L) 0.3 16 0.018 0.018 16.8 16.8 3.1507 3.1507 3.91199 3.91199Manganese (mg/L) 0.05 14 0 0.019 0.19 0.19 0.0256 0.0513 0.0532 0.04254Silver (mg/L) 0.1 4 0 0.01 0.068 0.068 0.0358 0.0383 0.03335 0.02998Sulfate (mg/L) 250 21 120 120 2884 2884 2379.2 2379.2 785.022 785.022Zinc (mg/L) 5 4 0 0.005 0.013 0.02 0.0033 0.012 0.0065 0.00627Color (PtCo units) 15 0 0 95 95 7.3889 7.3889 22.6408 22.6408Odor (TON) 3 3 0 1 2 2 1 1.3333 1 0.57735pH (std. units) 6.5-8.5 21 7.23 7.23 9.33 9.33 7.6976 7.6976 0.4425 0.4425TDS (mg/L) 500 25 4640 4640 39800 39800 28682 28682 13049.7 13049.7Foaming Agents (mg/L) 1.5 3 0 0.07 0.12 0.12 0.0633 0.0967 0.06028 0.02517Trihalomethane AnalysisTotal THMs (mg/L) 3 0 4E-04 0 0.001 0 0.0006 0 0.0004Radiological AnalysisGross Alpha (pCi/L) 3 0 8.7 8.7 21.3 4.35 15 6.15183 8.90955Miscellaneous AnalysisAmmonia-N (mg/L) 4 0 0.05 14.8 14.8 3.7475 3.785 7.36888 7.34356Nitrogen, total (mg/L) 2 0 6.66 15.37 15.37 7.685 11.015 10.8682 6.1589Nitrogen, organic (mg/L) 4 0.56 0.56 2.2 2.2 0.9975 0.9975 0.80218 0.80218Nitrogen, total Kjeldahl (mg/L) 3 0.39 0.39 15.37 15.37 5.5267 5.5267 8.52729 8.52729Ortho-phosphate (mg/L) 3 0.023 0.023 0.65 0.65 0.2337 0.2337 0.36056 0.36056Phosphorus, total (mg/L) 4 0 0.064 0.82 0.82 0.2458 0.2958 0.38502 0.35422BOD (mg/L) 3 0 1 2.5 20 0.8333 7.8333 1.44338 10.5633Total Coliform (col/100ml) 3 0 1 54 54 33.333 33.667 29.1433 28.5715Water Temperature (°C) 2 21.9 21.9 23.7 23.7 22.8 22.8 1.27279 1.272790: Non-detects are assumed to be zerodl: Non-detects are assumed to be detection limit values
FPL-012-086
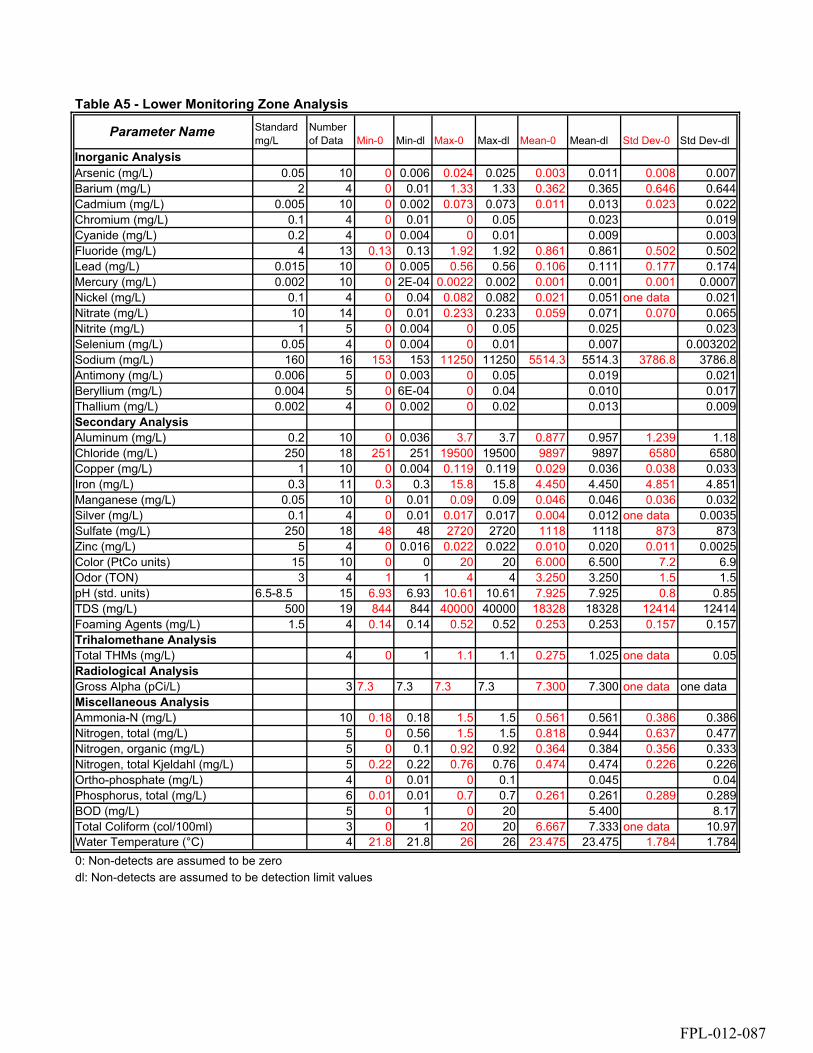
Table A5 - Lower Monitoring Zone Analysis
Parameter Name Standard mg/L
Number of Data Min-0 Min-dl Max-0 Max-dl Mean-0 Mean-dl Std Dev-0 Std Dev-dl
Inorganic AnalysisArsenic (mg/L) 0.05 10 0 0.006 0.024 0.025 0.003 0.011 0.008 0.007Barium (mg/L) 2 4 0 0.01 1.33 1.33 0.362 0.365 0.646 0.644Cadmium (mg/L) 0.005 10 0 0.002 0.073 0.073 0.011 0.013 0.023 0.022Chromium (mg/L) 0.1 4 0 0.01 0 0.05 0.023 0.019Cyanide (mg/L) 0.2 4 0 0.004 0 0.01 0.009 0.003Fluoride (mg/L) 4 13 0.13 0.13 1.92 1.92 0.861 0.861 0.502 0.502Lead (mg/L) 0.015 10 0 0.005 0.56 0.56 0.106 0.111 0.177 0.174Mercury (mg/L) 0.002 10 0 2E-04 0.0022 0.002 0.001 0.001 0.001 0.0007Nickel (mg/L) 0.1 4 0 0.04 0.082 0.082 0.021 0.051 one data 0.021Nitrate (mg/L) 10 14 0 0.01 0.233 0.233 0.059 0.071 0.070 0.065Nitrite (mg/L) 1 5 0 0.004 0 0.05 0.025 0.023Selenium (mg/L) 0.05 4 0 0.004 0 0.01 0.007 0.003202Sodium (mg/L) 160 16 153 153 11250 11250 5514.3 5514.3 3786.8 3786.8Antimony (mg/L) 0.006 5 0 0.003 0 0.05 0.019 0.021Beryllium (mg/L) 0.004 5 0 6E-04 0 0.04 0.010 0.017Thallium (mg/L) 0.002 4 0 0.002 0 0.02 0.013 0.009Secondary AnalysisAluminum (mg/L) 0.2 10 0 0.036 3.7 3.7 0.877 0.957 1.239 1.18Chloride (mg/L) 250 18 251 251 19500 19500 9897 9897 6580 6580Copper (mg/L) 1 10 0 0.004 0.119 0.119 0.029 0.036 0.038 0.033Iron (mg/L) 0.3 11 0.3 0.3 15.8 15.8 4.450 4.450 4.851 4.851Manganese (mg/L) 0.05 10 0 0.01 0.09 0.09 0.046 0.046 0.036 0.032Silver (mg/L) 0.1 4 0 0.01 0.017 0.017 0.004 0.012 one data 0.0035Sulfate (mg/L) 250 18 48 48 2720 2720 1118 1118 873 873Zinc (mg/L) 5 4 0 0.016 0.022 0.022 0.010 0.020 0.011 0.0025Color (PtCo units) 15 10 0 0 20 20 6.000 6.500 7.2 6.9Odor (TON) 3 4 1 1 4 4 3.250 3.250 1.5 1.5pH (std. units) 6.5-8.5 15 6.93 6.93 10.61 10.61 7.925 7.925 0.8 0.85TDS (mg/L) 500 19 844 844 40000 40000 18328 18328 12414 12414Foaming Agents (mg/L) 1.5 4 0.14 0.14 0.52 0.52 0.253 0.253 0.157 0.157Trihalomethane AnalysisTotal THMs (mg/L) 4 0 1 1.1 1.1 0.275 1.025 one data 0.05Radiological AnalysisGross Alpha (pCi/L) 3 7.3 7.3 7.3 7.3 7.300 7.300 one data one dataMiscellaneous AnalysisAmmonia-N (mg/L) 10 0.18 0.18 1.5 1.5 0.561 0.561 0.386 0.386Nitrogen, total (mg/L) 5 0 0.56 1.5 1.5 0.818 0.944 0.637 0.477Nitrogen, organic (mg/L) 5 0 0.1 0.92 0.92 0.364 0.384 0.356 0.333Nitrogen, total Kjeldahl (mg/L) 5 0.22 0.22 0.76 0.76 0.474 0.474 0.226 0.226Ortho-phosphate (mg/L) 4 0 0.01 0 0.1 0.045 0.04Phosphorus, total (mg/L) 6 0.01 0.01 0.7 0.7 0.261 0.261 0.289 0.289BOD (mg/L) 5 0 1 0 20 5.400 8.17Total Coliform (col/100ml) 3 0 1 20 20 6.667 7.333 one data 10.97Water Temperature (°C) 4 21.8 21.8 26 26 23.475 23.475 1.784 1.7840: Non-detects are assumed to be zerodl: Non-detects are assumed to be detection limit values
FPL-012-087

Table A6 - Upper Monitoring Zone Analysis
Parameter Name Standard mg/L
Number of Data Min-0 Min-dl Max-0 Max-dl Mean-0 Mean-dl Std Dev-0
Std Dev-dl
Inorganic AnalysisArsenic (mg/L) 0.05 8 0 0.003 0.0025 0.025 0.00031 0.00944 0.00088 0.00683Barium (mg/L) 2 4 0 0.01 0.275 0.275 0.08775 0.09025 0.12687 0.12465Cadmium (mg/L) 0.005 7 0 5E-04 0.44 0.44 0.06414 0.06664 0.16577 0.16465Chromium (mg/L) 0.1 4 0 0.01 0 0.02 0 0.0125 0 0.005Cyanide (mg/L) 0.2 4 0 0.004 0 0.01 0 0.0085 0 0.003Fluoride (mg/L) 4 7 0.76 0.76 2 2 1.46571 1.46571 0.57824 0.57824Lead (mg/L) 0.015 7 0 0.005 0.054 0.054 0.01771 0.02557 0.02316 0.02047Mercury (mg/L) 0.002 7 0 2E-04 0.005 0.005 0.0011 0.00136 0.00199 0.00185Nickel (mg/L) 0.1 4 0 0.039 0.039 0.04 0.00975 0.03975 0.0195 0.0005Nitrate (mg/L) 10 8 0 0.01 0.11 0.11 0.03125 0.0525 0.0398 0.03694Nitrite (mg/L) 1 5 0 0.004 0 0.05 0 0.0248 0 0.02313Selenium (mg/L) 0.05 4 0 0.004 0 0.01 0 0.00725 0 0.0032Sodium (mg/L) 160 7 702 702 2500 2500 1356.71 1356.71 604.651 604.651Antimony (mg/L) 0.006 5 0 0.005 0 0.05 0 0.0194 0 0.02009Beryllium (mg/L) 0.004 5 0 6E-04 0 0.04 0 0.00992 0 0.01689Thallium (mg/L) 0.002 4 0 0.002 0 0.02 0 0.013 0 0.00872Secondary AnalysisAluminum (mg/L) 0.2 7 0 0.09 3.76 3.76 0.68714 0.80143 1.40013 1.33737Chloride (mg/L) 250 8 663 663 3874 3874 2203.25 2203.25 1020.45 1020.45Copper (mg/L) 1 7 0 0.002 0.83 0.83 0.12629 0.13843 0.3109 0.30535Iron (mg/L) 0.3 8 0.501 0.501 140 140 19.2939 19.2939 48.8208 48.8208Manganese (mg/L) 0.05 7 0 0.011 0.055 0.055 0.02129 0.03271 0.02219 0.01748Silver (mg/L) 0.1 4 0 0.01 0 0.01 0 0.01 0 0Sulfate (mg/L) 250 8 260 260 680 680 401 401 172.143 172.143Zinc (mg/L) 5 4 0 0.02 0.19 0.19 0.054 0.064 0.09149 0.08405Color (PtCo units) 15 8 0 2 50 50 12.25 12.875 16.714 16.2783Odor (TON) 3 4 0 1 4 4 2 2.25 1.63299 1.25831pH (std. units) 6.5-8.5 9 5.88 5.88 8.94 8.94 7.73333 7.73333 0.8247 0.8247TDS (mg/L) 500 9 2396 2396 7388 7388 4128 4128 1585.91 1585.91Foaming Agents (mg/L) 1.5 5 0 0.03 0.2 0.2 0.108 0.128 0.08758 0.06535Trihalomethane AnalysisTotal THMs (mg/L) 4 0 0.5 0.5 1 0.125 0.875 0.25 0.25Radiological AnalysisGross Alpha (pCi/L) 3 4.1 4.1 4.1 4.1 4.1 4.1 #DIV/0! one dataMiscellaneous AnalysisAmmonia-N (mg/L) 6 0 0.05 2.28 2.28 0.64 0.64833 0.8282 0.82069Nitrogen, total (mg/L) 1 0 2.66 0 2.66 0 2.66 #DIV/0! one dataNitrogen, organic (mg/L) 5 0 0.1 1.13 1.13 0.422 0.442 0.44218 0.42002Nitrogen, total Kjeldahl (mg/L) 5 0.3 0.3 1.63 1.63 0.678 0.678 0.55306 0.55306Ortho-phosphate (mg/L) 4 0 0.01 0 0.1 0 0.045 0 0.04041Phosphorus, total (mg/L) 6 0 0.01 0.68 0.68 0.11833 0.14 0.27542 0.26683BOD (mg/L) 5 0 1 16 16 6.7 7.3 7.42967 6.77864Total Coliform (col/100ml) 3 0 1 0 1 0 1 0 0Water Temperature (°C) 4 22.9 22.9 27 27 24.275 24.275 1.89099 1.890990: Non-detects are assumed to be zerodl: Non-detects are assumed to be detection limit values
FPL-012-088

Table A7 - ASR Injection Zone Analysis
Parameter Name Standard mg/L
Number of Data Min-0 Min-dl Max-0 Max-dl Mean-0 Mean-dl Std Dev-0 Std Dev-dl
Inorganic AnalysisArsenic (mg/L) 0.05 5 0 0.002 0 0.01 0 0.00438 0 0.0034Barium (mg/L) 2 5 0 0.012 1.506 1.506 0.3788 0.4288 0.65 0.62Cadmium (mg/L) 0.005 5 0 0.003 0 0.005 0 0.0038 0 0.001095Chromium (mg/L) 0.1 5 0 0.006 0.019 0.02 0.0038 0.017 0.0085 0.0062Cyanide (mg/L) 0.2 4 0 0.004 0 0.006 0 0.0045 0 0.001Fluoride (mg/L) 4 5 1.3 1.3 1.86 1.86 1.58 1.58 0.24 0.24Lead (mg/L) 0.015 5 0 1E-04 0.005 0.01 0.001 0.00342 0.0022 0.0041Mercury (mg/L) 0.002 5 0 2E-04 0 0.001 0 0.00084 0 0.0004Nickel (mg/L) 0.1 4 0 0.005 0 0.01 0 0.00875 0 0.0025Nitrate (mg/L) 10 4 0 0.01 0.11 0.11 0.0275 0.0375 0.055 0.049Nitrite (mg/L) 1 4 0 0.01 0 0.02 0 0.0125 0 0.005Selenium (mg/L) 0.05 5 0 0.002 0.013 0.013 0.0026 0.0066 0.006 0.005Sodium (mg/L) 160 4 950 950 1827 1827 1214.8 1214.8 410.5 410.5Antimony (mg/L) 0.006 4 0 0.005 0 0.017 0 0.008 0 0.006Beryllium (mg/L) 0.004 4 0 3E-04 0 0.002 0 0.00158 0 0.0009Thallium (mg/L) 0.002 4 0 6E-04 0 0.002 0 0.00165 0 0.0007Secondary Analysis 0Aluminum (mg/L) 0.2 4 0 0.05 0 0.2 0.1625 0.075Chloride (mg/L) 250 5 1920 1920 3524 3524 2448.4 2448.4 641.7 641.6902Copper (mg/L) 1 5 0 0.005 0.023 0.023 0.0098 0.011 0.0086 0.0072Iron (mg/L) 0.3 5 0.022 0.022 4.295 4.295 1.0782 1.08 1.81 1.81Manganese (mg/L) 0.05 5 0 0.012 0.165 0.165 0.0412 0.045 0.07 0.067Silver (mg/L) 0.1 5 0 0.004 0 0.01 0 0.0078 0 0.003Sulfate (mg/L) 250 5 238 238 725 725 521.8 521.8 189.2 189.2Zinc (mg/L) 5 5 0 0.003 0.324 0.324 0.0814 0.083 0.14 0.14Color (PtCo units) 15 5 0 0 31 31 12 12 12.5897 12.59Odor (TON) 3 4 1 1 50 50 13.5 13.5 24.34 24.34pH (std. units) 6.5-8.5 5 6.91 6.91 8.39 8.39 7.526 7.526 0.57 0.57TDS (mg/L) 500 5 3910 3910 7880 7880 5240 5240 1691.8 1691.8Foaming Agents (mg/L) 1.5 5 0 0.01 0.18 0.18 0.07 0.077 0.081 0.074Trihalomethane Analysis 0Total THMs (mg/L) 4 0 0.002 9.93 9.93 2.48 2.73293 4.96 4.8Radiological Analysis 0Gross Alpha (pCi/L) 5 7.8 7.8 47 47 24.66 24.66 14.89 14.89Miscellaneous Analysis 0Ammonia-N (mg/L) 4 0.4 0.4 0.73 0.73 0.575 0.575 0.16 0.156Nitrogen, total (mg/L) 0 0 0 0Nitrogen, organic (mg/L) 3 0.19 0.19 0.42 0.42 0.3067 0.30667 0.12 0.12Nitrogen, total Kjeldahl (mg/L) 3 0.71 0.71 0.91 0.91 0.83 0.83 0.11 0.11Ortho-phosphate (mg/L) 3 0 0.02 0.2 0.2 0.13 0.13667 0.11 0.1Phosphorus, total (mg/L) 2 0.22 0.22 0.29 0.29 0.255 0.255 0.05 0.05BOD (mg/L) 3 0 1 1.9 1.9 1.23 1.57 1.07 0.49Total Coliform (col/100ml) 1 6 6 6 6 6 6 one data one dataWater Temperature (°C) 0 00: Non-detects are assumed to be zerodl: Non-detects are assumed to be detection limit values
FPL-012-089
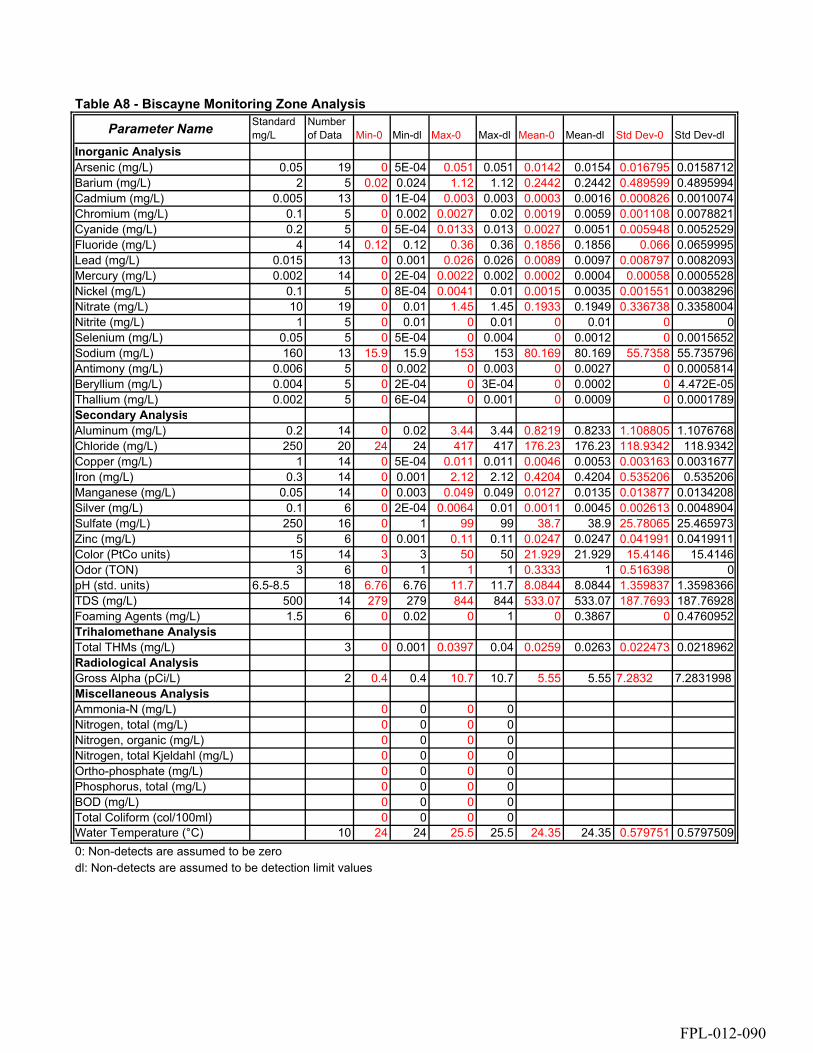
Table A8 - Biscayne Monitoring Zone Analysis
Parameter Name Standard mg/L
Number of Data Min-0 Min-dl Max-0 Max-dl Mean-0 Mean-dl Std Dev-0 Std Dev-dl
Inorganic AnalysisArsenic (mg/L) 0.05 19 0 5E-04 0.051 0.051 0.0142 0.0154 0.016795 0.0158712Barium (mg/L) 2 5 0.02 0.024 1.12 1.12 0.2442 0.2442 0.489599 0.4895994Cadmium (mg/L) 0.005 13 0 1E-04 0.003 0.003 0.0003 0.0016 0.000826 0.0010074Chromium (mg/L) 0.1 5 0 0.002 0.0027 0.02 0.0019 0.0059 0.001108 0.0078821Cyanide (mg/L) 0.2 5 0 5E-04 0.0133 0.013 0.0027 0.0051 0.005948 0.0052529Fluoride (mg/L) 4 14 0.12 0.12 0.36 0.36 0.1856 0.1856 0.066 0.0659995Lead (mg/L) 0.015 13 0 0.001 0.026 0.026 0.0089 0.0097 0.008797 0.0082093Mercury (mg/L) 0.002 14 0 2E-04 0.0022 0.002 0.0002 0.0004 0.00058 0.0005528Nickel (mg/L) 0.1 5 0 8E-04 0.0041 0.01 0.0015 0.0035 0.001551 0.0038296Nitrate (mg/L) 10 19 0 0.01 1.45 1.45 0.1933 0.1949 0.336738 0.3358004Nitrite (mg/L) 1 5 0 0.01 0 0.01 0 0.01 0 0Selenium (mg/L) 0.05 5 0 5E-04 0 0.004 0 0.0012 0 0.0015652Sodium (mg/L) 160 13 15.9 15.9 153 153 80.169 80.169 55.7358 55.735796Antimony (mg/L) 0.006 5 0 0.002 0 0.003 0 0.0027 0 0.0005814Beryllium (mg/L) 0.004 5 0 2E-04 0 3E-04 0 0.0002 0 4.472E-05Thallium (mg/L) 0.002 5 0 6E-04 0 0.001 0 0.0009 0 0.0001789Secondary AnalysisAluminum (mg/L) 0.2 14 0 0.02 3.44 3.44 0.8219 0.8233 1.108805 1.1076768Chloride (mg/L) 250 20 24 24 417 417 176.23 176.23 118.9342 118.9342Copper (mg/L) 1 14 0 5E-04 0.011 0.011 0.0046 0.0053 0.003163 0.0031677Iron (mg/L) 0.3 14 0 0.001 2.12 2.12 0.4204 0.4204 0.535206 0.535206Manganese (mg/L) 0.05 14 0 0.003 0.049 0.049 0.0127 0.0135 0.013877 0.0134208Silver (mg/L) 0.1 6 0 2E-04 0.0064 0.01 0.0011 0.0045 0.002613 0.0048904Sulfate (mg/L) 250 16 0 1 99 99 38.7 38.9 25.78065 25.465973Zinc (mg/L) 5 6 0 0.001 0.11 0.11 0.0247 0.0247 0.041991 0.0419911Color (PtCo units) 15 14 3 3 50 50 21.929 21.929 15.4146 15.4146Odor (TON) 3 6 0 1 1 1 0.3333 1 0.516398 0pH (std. units) 6.5-8.5 18 6.76 6.76 11.7 11.7 8.0844 8.0844 1.359837 1.3598366TDS (mg/L) 500 14 279 279 844 844 533.07 533.07 187.7693 187.76928Foaming Agents (mg/L) 1.5 6 0 0.02 0 1 0 0.3867 0 0.4760952Trihalomethane AnalysisTotal THMs (mg/L) 3 0 0.001 0.0397 0.04 0.0259 0.0263 0.022473 0.0218962Radiological AnalysisGross Alpha (pCi/L) 2 0.4 0.4 10.7 10.7 5.55 5.55 7.2832 7.2831998Miscellaneous AnalysisAmmonia-N (mg/L) 0 0 0 0Nitrogen, total (mg/L) 0 0 0 0Nitrogen, organic (mg/L) 0 0 0 0Nitrogen, total Kjeldahl (mg/L) 0 0 0 0Ortho-phosphate (mg/L) 0 0 0 0Phosphorus, total (mg/L) 0 0 0 0BOD (mg/L) 0 0 0 0Total Coliform (col/100ml) 0 0 0 0Water Temperature (°C) 10 24 24 25.5 25.5 24.35 24.35 0.579751 0.57975090: Non-detects are assumed to be zerodl: Non-detects are assumed to be detection limit values
FPL-012-090
83
APPENDIX B. TABLES OF DATA TOTALS AND STATISTICS, ASSUMING NON-DETECTED VALUES EQUAL TO ZERO
FPL-012-091

Table B1- AWT with Non-detects as zero
Parameter unitsDetection limit ####### ###### ####### ####### ######## ####### ######## ####### ######## ###### ####### ########
Number of Data Min Max Mean
Stadard Deviation
Arsenic ug/L 2.6 0 0 0 0 0 0 0 0 0 0 0 0 12 0 0 0.0000 0.0000Cadmium ug/L 0.18 0 0 0 0 0 0 0 0 0 0.29 10 0 0.29 0.0290 0.0917Calcium mg/L 0.009 38.5 40.4 38.3 39.8 34.7 34.3 38.9 39.1 38.8 30.8 28.4 28.3 12 28.3 40.4 35.8583 4.4684Chromium ug/L 1 0 0 2.73 0 0 0 0 0 0 0 0 0 12 0 2.73 0.2275 0.7881Copper ug/L 1 16.2 6.9 4.1 2.66 3.46 1.78 1.46 0 0 0 0 0 12 0 6.9 3.0467 4.6693Iron ug/L 16 40 80 0.12 0.16 0.085 0.09 0.09 0.11 0.12 0.15 0.16 0.12 12 0.085 80 10.1004 24.8192Lead ug/L 0.5 0 0 0 0 0 0 0 0 0 0 0 0 12 0 0 0.0000 0.0000Magnesium mg/L 0.001 31 23.6 23.7 18.7 20.9 20.6 23.9 24.4 25 25.5 23.3 23.4 12 18.7 25.5 23.6667 3.0368Mercury ug/L 0.2 0 0 0 0 0 0 0 0 0 0 0 0 12 0 0 0.0000 0.0000Molybdenum ug/L 1 0 0 0 0 0 0 1.02 1.36 1.01 0 0 0 12 0 1.36 0.2825 0.5181Nickel ug/L 3.3 0 3.45 4.7 0 0 0 0 0 0 0 0 0 12 0 4.7 0.6792 1.6084Potassium ug/L 0.2 15.7 15.9 15.3 15.6 15.2 15 14.9 15.7 15.3 13.4 13.6 13 12 13 15.9 14.8833 0.9880Selenium ug/L 1.7 0 0 0 0 0 0 0 0 0 0 0 0 12 0 0 0.0000 0.0000Sodium mg/L 0.5 63.7 57.9 58.3 57 54.4 55.6 60.5 57.8 58.2 82.6 77.6 81.1 12 54.4 82.6 63.7250 10.3935Zinc mg/L 0.003 0.02 0.02 0.02 0.02 0.02 0.02 0.02 0.02 0.02 0.03 0.03 0.02 12 0.02 0.03 0.0217 0.0039Bromide mg/L 0.1 0.1 0.2 0.1 0.2 0.2 0.1 0.1 0.2 0.2 0.1 0.1 0.1 12 0.1 0.2 0.1417 0.0515Fluoride mg/L 0.1 0.82 0.85 0.93 0.92 0.95 0.9 0.84 0.96 0.86 1.12 1.08 1.09 12 0.82 1.12 0.9433 0.1026Sulfate mg/L 1 172 204 200 180 200 190 164 171 167 170 168 168 12 164 204 179.5000 14.8661Strontium mg/L 0.03 2.93 3.61 3.32 2.94 3.76 3.64 3.79 4.05 4.08 2.59 2.55 2.62 12 2.55 4.08 3.3233 0.5740
Bicarbonate Alkalinity mg/L 0.6 60.4 57.6 55.2 65.6 57.2 58.9 67.2 57.8 70.4 92.9 84.2 79.3 12 55.2 92.9 67.2250 12.2413Chloride mg/L 0.25 80.6 75 72.7 78.1 75.8 69 81 79.2 78 103 95.2 99.1 12 69 103 82.2250 10.8376
Southgate Bioassay Composite Gulf Gate WWTP Composite
Inorganic Analysis
Secondary Analysis
FPL-012-092
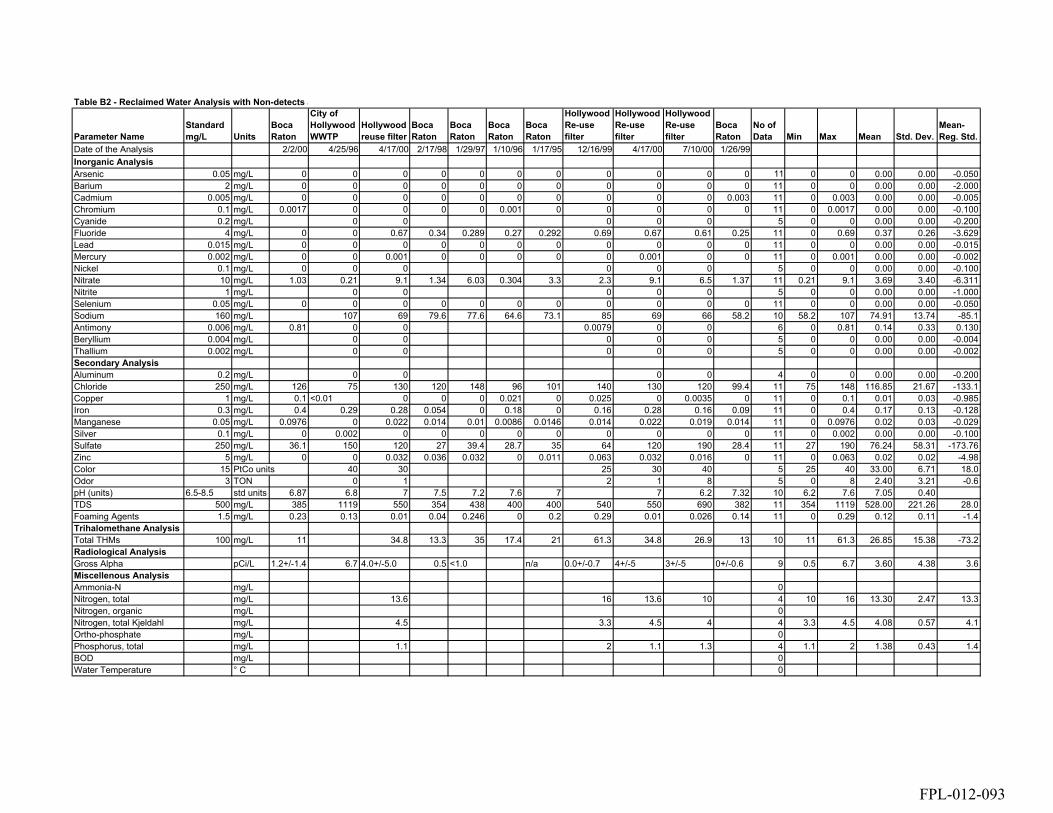
Parameter NameStandard mg/L Units
Boca Raton
City of Hollywood WWTP
Hollywood reuse filter
Boca Raton
Boca Raton
Boca Raton
Boca Raton
Hollywood Re-use filter
Hollywood Re-use filter
Hollywood Re-use filter
Boca Raton
No of Data Min Max Mean Std. Dev.
Mean-Reg. Std.
Date of the Analysis 2/2/00 4/25/96 4/17/00 2/17/98 1/29/97 1/10/96 1/17/95 12/16/99 4/17/00 7/10/00 1/26/99Inorganic AnalysisArsenic 0.05 mg/L 0 0 0 0 0 0 0 0 0 0 0 11 0 0 0.00 0.00 -0.050Barium 2 mg/L 0 0 0 0 0 0 0 0 0 0 0 11 0 0 0.00 0.00 -2.000Cadmium 0.005 mg/L 0 0 0 0 0 0 0 0 0 0 0.003 11 0 0.003 0.00 0.00 -0.005Chromium 0.1 mg/L 0.0017 0 0 0 0 0.001 0 0 0 0 0 11 0 0.0017 0.00 0.00 -0.100Cyanide 0.2 mg/L 0 0 0 0 0 5 0 0 0.00 0.00 -0.200Fluoride 4 mg/L 0 0 0.67 0.34 0.289 0.27 0.292 0.69 0.67 0.61 0.25 11 0 0.69 0.37 0.26 -3.629Lead 0.015 mg/L 0 0 0 0 0 0 0 0 0 0 0 11 0 0 0.00 0.00 -0.015Mercury 0.002 mg/L 0 0 0.001 0 0 0 0 0 0.001 0 0 11 0 0.001 0.00 0.00 -0.002Nickel 0.1 mg/L 0 0 0 0 0 0 5 0 0 0.00 0.00 -0.100Nitrate 10 mg/L 1.03 0.21 9.1 1.34 6.03 0.304 3.3 2.3 9.1 6.5 1.37 11 0.21 9.1 3.69 3.40 -6.311Nitrite 1 mg/L 0 0 0 0 0 5 0 0 0.00 0.00 -1.000Selenium 0.05 mg/L 0 0 0 0 0 0 0 0 0 0 0 11 0 0 0.00 0.00 -0.050Sodium 160 mg/L 107 69 79.6 77.6 64.6 73.1 85 69 66 58.2 10 58.2 107 74.91 13.74 -85.1Antimony 0.006 mg/L 0.81 0 0 0.0079 0 0 6 0 0.81 0.14 0.33 0.130Beryllium 0.004 mg/L 0 0 0 0 0 5 0 0 0.00 0.00 -0.004Thallium 0.002 mg/L 0 0 0 0 0 5 0 0 0.00 0.00 -0.002Secondary AnalysisAluminum 0.2 mg/L 0 0 0 0 4 0 0 0.00 0.00 -0.200Chloride 250 mg/L 126 75 130 120 148 96 101 140 130 120 99.4 11 75 148 116.85 21.67 -133.1Copper 1 mg/L 0.1 <0.01 0 0 0 0.021 0 0.025 0 0.0035 0 11 0 0.1 0.01 0.03 -0.985Iron 0.3 mg/L 0.4 0.29 0.28 0.054 0 0.18 0 0.16 0.28 0.16 0.09 11 0 0.4 0.17 0.13 -0.128Manganese 0.05 mg/L 0.0976 0 0.022 0.014 0.01 0.0086 0.0146 0.014 0.022 0.019 0.014 11 0 0.0976 0.02 0.03 -0.029Silver 0.1 mg/L 0 0.002 0 0 0 0 0 0 0 0 0 11 0 0.002 0.00 0.00 -0.100Sulfate 250 mg/L 36.1 150 120 27 39.4 28.7 35 64 120 190 28.4 11 27 190 76.24 58.31 -173.76Zinc 5 mg/L 0 0 0.032 0.036 0.032 0 0.011 0.063 0.032 0.016 0 11 0 0.063 0.02 0.02 -4.98Color 15 PtCo units 40 30 25 30 40 5 25 40 33.00 6.71 18.0Odor 3 TON 0 1 2 1 8 5 0 8 2.40 3.21 -0.6pH (units) 6.5-8.5 std units 6.87 6.8 7 7.5 7.2 7.6 7 7 6.2 7.32 10 6.2 7.6 7.05 0.40TDS 500 mg/L 385 1119 550 354 438 400 400 540 550 690 382 11 354 1119 528.00 221.26 28.0Foaming Agents 1.5 mg/L 0.23 0.13 0.01 0.04 0.246 0 0.2 0.29 0.01 0.026 0.14 11 0 0.29 0.12 0.11 -1.4Trihalomethane AnalysisTotal THMs 100 mg/L 11 34.8 13.3 35 17.4 21 61.3 34.8 26.9 13 10 11 61.3 26.85 15.38 -73.2Radiological AnalysisGross Alpha pCi/L 1.2+/-1.4 6.7 4.0+/-5.0 0.5 <1.0 n/a 0.0+/-0.7 4+/-5 3+/-5 0+/-0.6 9 0.5 6.7 3.60 4.38 3.6Miscellenous AnalysisAmmonia-N mg/L 0Nitrogen, total mg/L 13.6 16 13.6 10 4 10 16 13.30 2.47 13.3Nitrogen, organic mg/L 0Nitrogen, total Kjeldahl mg/L 4.5 3.3 4.5 4 4 3.3 4.5 4.08 0.57 4.1Ortho-phosphate mg/L 0Phosphorus, total mg/L 1.1 2 1.1 1.3 4 1.1 2 1.38 0.43 1.4BOD mg/L 0Water Temperature ° C 0
Table B2 - Reclaimed Water Analysis with Non-detects a
FPL-012-093
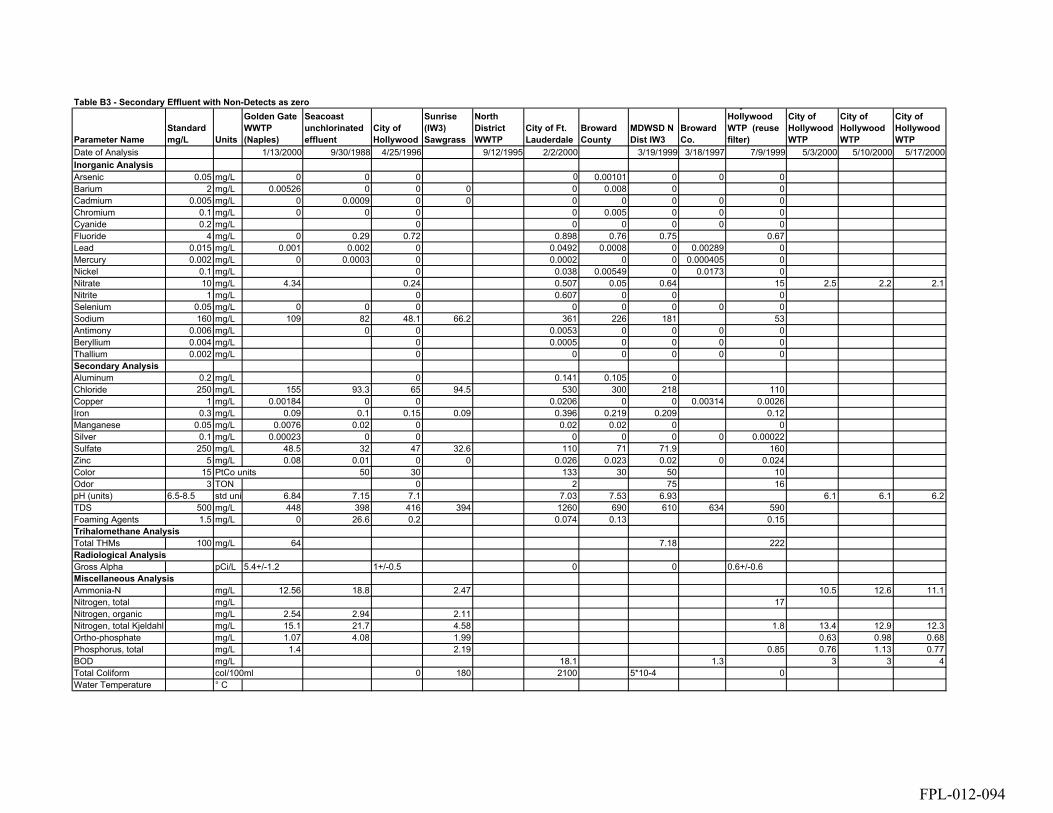
Table B3 - Secondary Effluent with Non-Detects as zero
Parameter NameStandard mg/L Units
Golden Gate WWTP (Naples)
Seacoast unchlorinated effluent
City of Hollywood
Sunrise (IW3) Sawgrass
North District WWTP
City of Ft. Lauderdale
Broward County
MDWSD N Dist IW3
Broward Co.
yHollywood WTP (reuse filter)
City of Hollywood WTP
City of Hollywood WTP
City of Hollywood WTP
Date of Analysis 1/13/2000 9/30/1988 4/25/1996 9/12/1995 2/2/2000 3/19/1999 3/18/1997 7/9/1999 5/3/2000 5/10/2000 5/17/2000Inorganic AnalysisArsenic 0.05 mg/L 0 0 0 0 0.00101 0 0 0Barium 2 mg/L 0.00526 0 0 0 0 0.008 0 0Cadmium 0.005 mg/L 0 0.0009 0 0 0 0 0 0 0Chromium 0.1 mg/L 0 0 0 0 0.005 0 0 0Cyanide 0.2 mg/L 0 0 0 0 0 0Fluoride 4 mg/L 0 0.29 0.72 0.898 0.76 0.75 0.67Lead 0.015 mg/L 0.001 0.002 0 0.0492 0.0008 0 0.00289 0Mercury 0.002 mg/L 0 0.0003 0 0.0002 0 0 0.000405 0Nickel 0.1 mg/L 0 0.038 0.00549 0 0.0173 0Nitrate 10 mg/L 4.34 0.24 0.507 0.05 0.64 15 2.5 2.2 2.1Nitrite 1 mg/L 0 0.607 0 0 0Selenium 0.05 mg/L 0 0 0 0 0 0 0 0Sodium 160 mg/L 109 82 48.1 66.2 361 226 181 53Antimony 0.006 mg/L 0 0 0.0053 0 0 0 0Beryllium 0.004 mg/L 0 0.0005 0 0 0 0Thallium 0.002 mg/L 0 0 0 0 0 0Secondary AnalysisAluminum 0.2 mg/L 0 0.141 0.105 0Chloride 250 mg/L 155 93.3 65 94.5 530 300 218 110Copper 1 mg/L 0.00184 0 0 0.0206 0 0 0.00314 0.0026Iron 0.3 mg/L 0.09 0.1 0.15 0.09 0.396 0.219 0.209 0.12Manganese 0.05 mg/L 0.0076 0.02 0 0.02 0.02 0 0Silver 0.1 mg/L 0.00023 0 0 0 0 0 0 0.00022Sulfate 250 mg/L 48.5 32 47 32.6 110 71 71.9 160Zinc 5 mg/L 0.08 0.01 0 0 0.026 0.023 0.02 0 0.024Color 15 PtCo units 50 30 133 30 50 10Odor 3 TON 0 2 75 16pH (units) 6.5-8.5 std unit 6.84 7.15 7.1 7.03 7.53 6.93 6.1 6.1 6.2TDS 500 mg/L 448 398 416 394 1260 690 610 634 590Foaming Agents 1.5 mg/L 0 26.6 0.2 0.074 0.13 0.15Trihalomethane AnalysisTotal THMs 100 mg/L 64 7.18 222Radiological AnalysisGross Alpha pCi/L 5.4+/-1.2 1+/-0.5 0 0 0.6+/-0.6Miscellaneous AnalysisAmmonia-N mg/L 12.56 18.8 2.47 10.5 12.6 11.1Nitrogen, total mg/L 17Nitrogen, organic mg/L 2.54 2.94 2.11Nitrogen, total Kjeldahl mg/L 15.1 21.7 4.58 1.8 13.4 12.9 12.3Ortho-phosphate mg/L 1.07 4.08 1.99 0.63 0.98 0.68Phosphorus, total mg/L 1.4 2.19 0.85 0.76 1.13 0.77BOD mg/L 18.1 1.3 3 3 4Total Coliform col/100ml 0 180 2100 5*10-4 0Water Temperature ° C
FPL-012-094

City of Hollywood WTP
City of Hollywood WTP
Palm Beach County
Sunrise (IW1 + IW2)
Sunrise (IW1 + IW2)
Sunrise (IW3)
5/24/2000 5/31/2000 1999 2/23/1999 2/11/2000 ######## 12/11/1996 3/18/1997 5/7/1997 6/17/1997 7/9/1997 11/4/1997 4/8/1998 6/24/1998 7/9/1998
0.00061 0 0 0 0 0 0 0 0 0 0 0 00.00606 0 0 0
0 0 0 0.0002 0 0 0 0 0 0 0 0 00.00146 0 0 0 0 0 0 0 0 0 0 0 0
0 0 0.03 0 0.00472 0 0 0 0 0.024 0.0145 0.00575 00.289 0.74 0.6 0.73
0.00027 0 0.004 0 0.00197 0.00289 0.00198 0.00424 0.00427 0.0046 0.0034 0.00322 00 0 0 0 0 0.000405 0 0.000865 0.000552 0.000378 0 0.000271 0.000428
0.00309 0 0 0 0.0135 0.0173 0.0094 0.0101 0.00819 0.0144 0.0169 0.0205 0.009561.7 1.5 2.03 5.69 15.1 7.41
0.73 2.12 0.06 0.730.00326 0.025 0 0.006 0 0 0 0 0 0 0 0 0
58.4 86.1 74.3 78.10 0 0 00 0.0004 0 0 0 0 0 0 0 0 0 0 0
0.00114 0 0 0 0 0 0 0.0133 0 0 0 0 0
0.0473 0.1 0 0 089.7 21.9 81.6 125
0.00298 0 0 0 0 0.00314 0.00276 0.00273 0.00229 0.0037 0.00609 0.00219 0.002380.386 0.08 0.03 0.05
0.0209 0 0 00 0 0 0 0 0 0 0 0 0 0 0 0
32 29.3 30.6 23.20.0126 0 0 0 0 0 0 0 0 0 0 0 0
35 40 15 600 1 1 1
6.2 6.2 6.67 7.26 7.1 7.58514 484 460 450
0.166 0.03 0.02 0.02
100 4.74 0
0
7.5 6.4 4.62 0 5.15
0.2 0.1313 10 5.32 2.02 5.28
0.4 0.8 2.54 0.23 2.340.94 0.94 2.54 2.2 1.81
3 5 12 0.6 33280 -10
25 26 25
Broward Co. Secondary Effluent
FPL-012-095
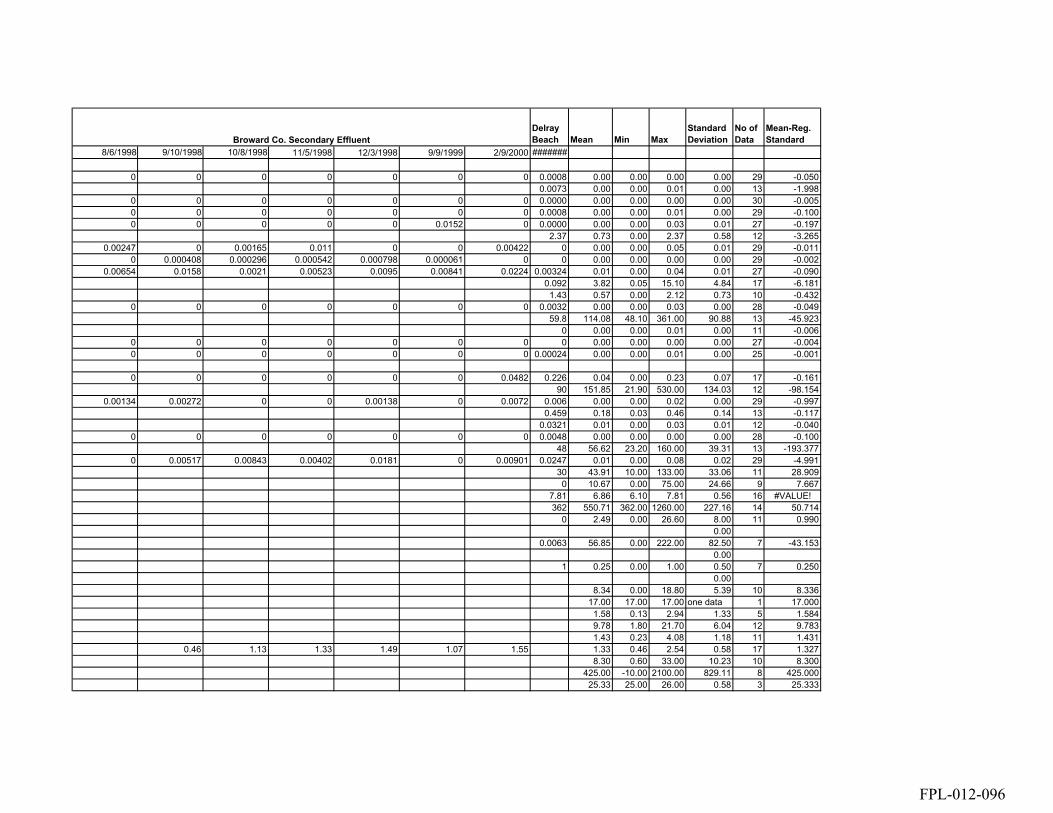
Delray Beach Mean Min Max
Standard Deviation
No of Data
Mean-Reg. Standard
8/6/1998 9/10/1998 10/8/1998 11/5/1998 12/3/1998 9/9/1999 2/9/2000 #######
0 0 0 0 0 0 0 0.0008 0.00 0.00 0.00 0.00 29 -0.0500.0073 0.00 0.00 0.01 0.00 13 -1.998
0 0 0 0 0 0 0 0.0000 0.00 0.00 0.00 0.00 30 -0.0050 0 0 0 0 0 0 0.0008 0.00 0.00 0.01 0.00 29 -0.1000 0 0 0 0 0.0152 0 0.0000 0.00 0.00 0.03 0.01 27 -0.197
2.37 0.73 0.00 2.37 0.58 12 -3.2650.00247 0 0.00165 0.011 0 0 0.00422 0 0.00 0.00 0.05 0.01 29 -0.011
0 0.000408 0.000296 0.000542 0.000798 0.000061 0 0 0.00 0.00 0.00 0.00 29 -0.0020.00654 0.0158 0.0021 0.00523 0.0095 0.00841 0.0224 0.00324 0.01 0.00 0.04 0.01 27 -0.090
0.092 3.82 0.05 15.10 4.84 17 -6.1811.43 0.57 0.00 2.12 0.73 10 -0.432
0 0 0 0 0 0 0 0.0032 0.00 0.00 0.03 0.00 28 -0.04959.8 114.08 48.10 361.00 90.88 13 -45.923
0 0.00 0.00 0.01 0.00 11 -0.0060 0 0 0 0 0 0 0 0.00 0.00 0.00 0.00 27 -0.0040 0 0 0 0 0 0 0.00024 0.00 0.00 0.01 0.00 25 -0.001
0 0 0 0 0 0 0.0482 0.226 0.04 0.00 0.23 0.07 17 -0.16190 151.85 21.90 530.00 134.03 12 -98.154
0.00134 0.00272 0 0 0.00138 0 0.0072 0.006 0.00 0.00 0.02 0.00 29 -0.9970.459 0.18 0.03 0.46 0.14 13 -0.117
0.0321 0.01 0.00 0.03 0.01 12 -0.0400 0 0 0 0 0 0 0.0048 0.00 0.00 0.00 0.00 28 -0.100
48 56.62 23.20 160.00 39.31 13 -193.3770 0.00517 0.00843 0.00402 0.0181 0 0.00901 0.0247 0.01 0.00 0.08 0.02 29 -4.991
30 43.91 10.00 133.00 33.06 11 28.9090 10.67 0.00 75.00 24.66 9 7.667
7.81 6.86 6.10 7.81 0.56 16 #VALUE!362 550.71 362.00 1260.00 227.16 14 50.714
0 2.49 0.00 26.60 8.00 11 0.9900.00
0.0063 56.85 0.00 222.00 82.50 7 -43.1530.00
1 0.25 0.00 1.00 0.50 7 0.2500.00
8.34 0.00 18.80 5.39 10 8.33617.00 17.00 17.00 one data 1 17.0001.58 0.13 2.94 1.33 5 1.5849.78 1.80 21.70 6.04 12 9.7831.43 0.23 4.08 1.18 11 1.431
0.46 1.13 1.33 1.49 1.07 1.55 1.33 0.46 2.54 0.58 17 1.3278.30 0.60 33.00 10.23 10 8.300
425.00 -10.00 2100.00 829.11 8 425.00025.33 25.00 26.00 0.58 3 25.333
Broward Co. Secondary Effluent
FPL-012-096

Table B4 - Injection Zone with Non-detects as zero
7946 7947 7948 8101 8102 8103 8105 8106 8107 8108 8109Inorganic AnalysisArsenic 0.05 mg/L 0 0 0 0 0 0.006 0.006 0.006 0.07Barium 2 mg/L 0 0.91 0.27 0Cadmium 0.005 mg/L 0.0037 0 0 0 0 0.007 0.005 0 0.014 0Chromium 0.1 mg/L 0.002 0.037 0 0Cyanide 0.2 mg/L 0 0 0Fluoride 4 mg/L 0.62 0.95 0.72 0.95 0.67 0.62 1.31 0.57 0.51 0.57Lead 0.015 mg/L 0.04 0 0 0 0.06 0.174 0.336 0.036 0.082 0.052Mercury 0.002 mg/L 0 0 0 0 0 0.0002 0.0002 0.0002 0.0002 0Nickel 0.1 mg/L 0 0 0.042 0Nitrate 10 mg/L 6 0.46 0 0 0.04 0.08 0.04 0.12 0.05 0.12 0.06 0.06Nitrite 1 mg/L 0 0 0 0Selenium 0.05 mg/L 5 0 0.007 0Sodium 160 mg/L 11400 1920 12629 2385 8100 7020 7668 3132 7506 7344 7992 7560 7560Antimony 0.006 mg/L 0 0 0Beryllium 0.004 mg/L 0.01 0 0 0Thallium 0.002 mg/L 1.2 0 0 0Secondary AnalysisAluminum 0.2 mg/L 0 0 0 0.55 0.39 0.62 0 0 0.07Chloride 250 mg/L 19400 3099 21884 4899 21000 17700 19300 5650 19400 19400 19600 5050 5050 19700 19200 2080Copper 1 mg/L 0.03 0.065 0.017 5 0.008 0.016 0.16 0.062 0.022 0.018Iron 0.3 mg/L 4 0.76 1 1.483 1.16 2.2 0.86 4.08 16.8 4.4 3.32 0.018Manganese 0.05 mg/L 0.19 0.032 0.019 0.03 0 0 0.087 0 0 0Silver 0.1 mg/L 0.06 0.068 0.015 0Sulfate 250 mg/L 2680 120 2884 679 2600 2360 2580 830 2620 2600 2760 2640 2740Zinc 5 mg/L 0 0 0.013 0Color 15 PtCo units 0 >70 6 95 25 2 0 0 0 0 0Odor 3 TON 0 1 2pH (units) 6.5-8.5 std units 7.35 8.26 7.63 7.23 9.33 7.75 7.7 7.65 7.4 7.4 7.4 7.5 7.45TDS 500 mg/L 38200 5093 30450 9130 31000 31874 37180 10884 36700 37000 36100 10200 9840 36200 36300 4640Foaming Agents 1.5 mg/L 0.07 0.12 0Trihalomethane AnalysisTotal THMs mg/L 0 0 0Radiological AnalysisGross Alpha pCi/L 8.7 0 210+/-390Miscellaneous AnalysisAmmonia-N mg/L 0 0.19 14.8 0Nitrogen, total mg/L 0 15.37Nitrogen, organic mg/L 0.56 0.63 0.6 2.2Nitrogen, total Kjeldahl mg/L 0.82 15.37 0.39Ortho-phosphate mg/L 0.028 0.65 0.023Phosphorus, total mg/L 0 0.064 0.82 0.099BOD mg/L 2.5 0 0Total Coliform col/100ml 0 54 46Water Temperature ° C 23.7 21.9
MDWASD S WWTP IW and MWMDWSD N Dist. IN-2
Seacost Pump test 2020-3320
City of WPB IW6
BCNRWWTP IW-5
Injection Zone IW-6Parameter Name
Standard mg/L Units
Boynton Beach
FPL-012-097
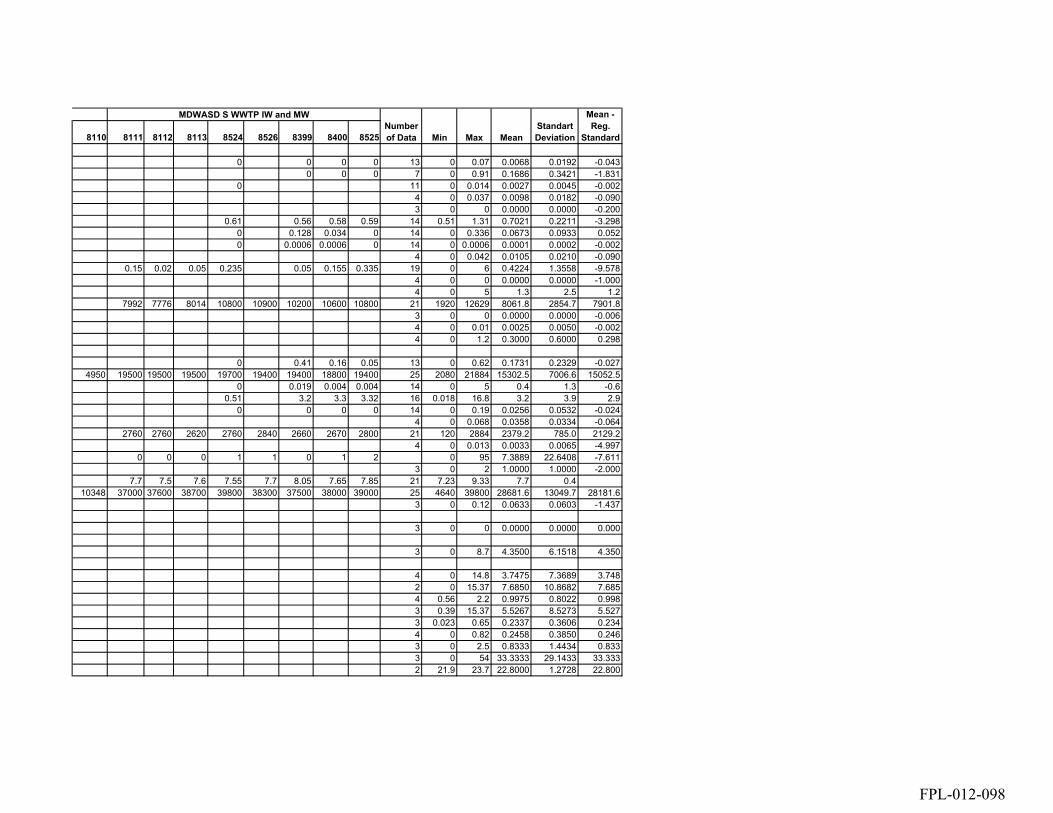
8110 8111 8112 8113 8524 8526 8399 8400 8525
0 0 0 0 13 0 0.07 0.0068 0.0192 -0.0430 0 0 7 0 0.91 0.1686 0.3421 -1.831
0 11 0 0.014 0.0027 0.0045 -0.0024 0 0.037 0.0098 0.0182 -0.0903 0 0 0.0000 0.0000 -0.200
0.61 0.56 0.58 0.59 14 0.51 1.31 0.7021 0.2211 -3.2980 0.128 0.034 0 14 0 0.336 0.0673 0.0933 0.0520 0.0006 0.0006 0 14 0 0.0006 0.0001 0.0002 -0.002
4 0 0.042 0.0105 0.0210 -0.0900.15 0.02 0.05 0.235 0.05 0.155 0.335 19 0 6 0.4224 1.3558 -9.578
4 0 0 0.0000 0.0000 -1.0004 0 5 1.3 2.5 1.2
7992 7776 8014 10800 10900 10200 10600 10800 21 1920 12629 8061.8 2854.7 7901.83 0 0 0.0000 0.0000 -0.0064 0 0.01 0.0025 0.0050 -0.0024 0 1.2 0.3000 0.6000 0.298
0 0.41 0.16 0.05 13 0 0.62 0.1731 0.2329 -0.0274950 19500 19500 19500 19700 19400 19400 18800 19400 25 2080 21884 15302.5 7006.6 15052.5
0 0.019 0.004 0.004 14 0 5 0.4 1.3 -0.60.51 3.2 3.3 3.32 16 0.018 16.8 3.2 3.9 2.9
0 0 0 0 14 0 0.19 0.0256 0.0532 -0.0244 0 0.068 0.0358 0.0334 -0.064
2760 2760 2620 2760 2840 2660 2670 2800 21 120 2884 2379.2 785.0 2129.24 0 0.013 0.0033 0.0065 -4.997
0 0 0 1 1 0 1 2 0 95 7.3889 22.6408 -7.6113 0 2 1.0000 1.0000 -2.000
7.7 7.5 7.6 7.55 7.7 8.05 7.65 7.85 21 7.23 9.33 7.7 0.410348 37000 37600 38700 39800 38300 37500 38000 39000 25 4640 39800 28681.6 13049.7 28181.6
3 0 0.12 0.0633 0.0603 -1.437
3 0 0 0.0000 0.0000 0.000
3 0 8.7 4.3500 6.1518 4.350
4 0 14.8 3.7475 7.3689 3.7482 0 15.37 7.6850 10.8682 7.6854 0.56 2.2 0.9975 0.8022 0.9983 0.39 15.37 5.5267 8.5273 5.5273 0.023 0.65 0.2337 0.3606 0.2344 0 0.82 0.2458 0.3850 0.2463 0 2.5 0.8333 1.4434 0.8333 0 54 33.3333 29.1433 33.3332 21.9 23.7 22.8000 1.2728 22.800
MDWASD S WWTP IW and MWStandart Deviation
Mean - Reg.
StandardNumber of Data Min Max Mean
FPL-012-098

Table B5 - Lower Monitoring Zone with non-detects as zero
MD-North District
Miami Dade North District
MDWASD South District
MDWASD-Westfield
City of WPB IW 6
Boynton Beach
70717-2 FA-2N Lower FA-4 Lower FA-10 Lower Lower
F2 Lower
Sanders Lab
Savannah Lab
Sanders Lab
Savannah Lab
110969 Lower Zone 7941 7942 7943 7944 7945
Arsenic 0.05 mg/L 0 0 0 0.024 0 0 0 0 0 0Barium 2 mg/L 0.042 0.076 0 1.33Cadmium 0.005 mg/L 0.073 0 0 0 0.023 0.008 0 0.006 0Chromium 0.1 mg/L 0 0 0 0Cyanide 0.2 mg/L 0 0 0 0Fluoride 4 mg/L 0.61 0.8 0.8 0.38 1.92 1.72 1.2 0.88 0.95Lead 0.015 mg/L 0 0.0052 0 0 0.028 0.216 0.076 0.56 0.16Mercury 0.002 mg/L 0 0 0 0 0.0022 0.0018 0.0008 0.0008 0.0003Nickel 0.1 mg/L 0 0 0 0.082Nitrate 10 mg/L 0.13 0 0 0 0 0.03 0.04 0.06 0.02 0.04Nitrite 1 mg/L 0 0 0 0 0Selenium 0.05 mg/L 0 0 0 0Sodium 160 mg/L 7600 7200 7900 2167 8200 1546 NA 2470 NA 972 2430 3726 5238 5076Antimony 0.006 mg/L 0 0 0 0 0Beryllium 0.004 mg/L 0 0 0 0 0Thallium 0.002 mg/L 0 0 0 0
Aluminum 0.2 mg/L 0 0 0 0 3.7 2.2 1.31 0.99 0.53Chloride 250 mg/L 17000 14000 14000 4649 14346 3949 4300 4949 5000 1080 4160 8260 12300 11500Copper 1 mg/L 0 0 0 0.02 0.119 0.066 0.03 0.033 0.013Iron 0.3 mg/L 2.9 1.4 0.78 0.443 10 15.8 6.6 2.95 6.1 1.68Manganese 0.05 mg/L 0.072 0.015 0 0.013 0.09 0.06 0.06 0.09 <0.040Silver 0.1 mg/L 0 0 0 0.017Sulfate 250 mg/L 1100 830 1700 466 660 481 350 548 500 324 535 1140 1700 1660Zinc 5 mg/L 0 0.022 0 0.016Color 15 PtCo un 10 0 20 12 >70 0 3Odor 3 TON 4 4 1 4pH (units) 6.5-8.5 std unit 7.83 8.57 6.93 10.61 8.13 7.45 7.7 7.8 8.2 7.6 7.9TDS 500 mg/L 21000 18000 31000 7220 24243 6000 7100 9320 10000 28300 3224 7528 15212 21900 21544Foaming Agents 1.5 mg/L 0.52 0.14 0.16 0.27 0.177
Total THMs mg/L 0 0 0 1.1
Gross Alpha pCi/L 180+/-280 350+/-210 7.3
Ammonia-N mg/L 0.22 0.18 1.5 0.42 0.4 0.75 0.61 0.53 0.73 0.27Nitrogen, total mg/L 0 1.43 0.6 1.5 0.56Nitrogen, organic mg/L 0.44 0.92 0 0.34 0.12Nitrogen, total Kjeldahl mg/L 0.22 0.65 0.42 0.76 0.32Ortho-phosphate mg/L 0 0 0 0Phosphorus, total mg/L 0.034 0.03 0.29 0.7 0.5 0.01BOD mg/L 0 0 0 0 0Total Coliform col/100 0 20 0Water Temperature ° C 23 21.8 23.1 26
MW-1 MW-2Parameter
NameStandard
mg/L Units
MDWASD S WWTP IW and MW
FPL-012-099
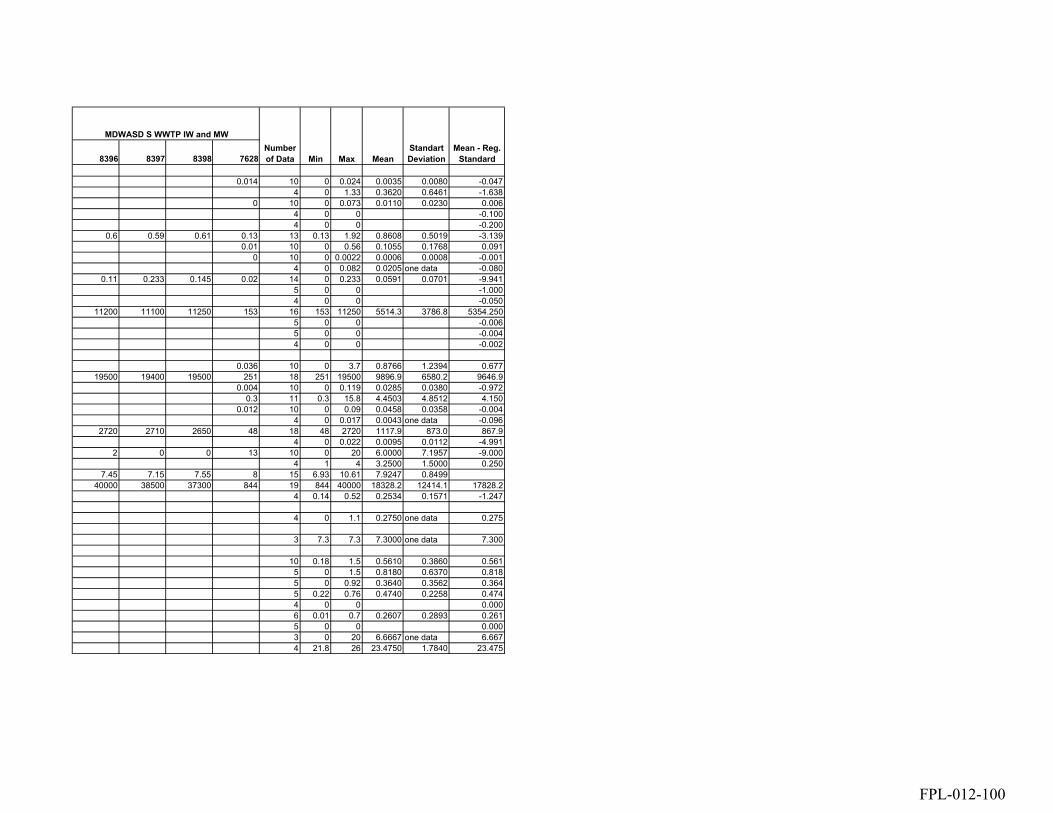
8396 8397 8398 7628
0.014 10 0 0.024 0.0035 0.0080 -0.0474 0 1.33 0.3620 0.6461 -1.638
0 10 0 0.073 0.0110 0.0230 0.0064 0 0 -0.1004 0 0 -0.200
0.6 0.59 0.61 0.13 13 0.13 1.92 0.8608 0.5019 -3.1390.01 10 0 0.56 0.1055 0.1768 0.091
0 10 0 0.0022 0.0006 0.0008 -0.0014 0 0.082 0.0205 one data -0.080
0.11 0.233 0.145 0.02 14 0 0.233 0.0591 0.0701 -9.9415 0 0 -1.0004 0 0 -0.050
11200 11100 11250 153 16 153 11250 5514.3 3786.8 5354.2505 0 0 -0.0065 0 0 -0.0044 0 0 -0.002
0.036 10 0 3.7 0.8766 1.2394 0.67719500 19400 19500 251 18 251 19500 9896.9 6580.2 9646.9
0.004 10 0 0.119 0.0285 0.0380 -0.9720.3 11 0.3 15.8 4.4503 4.8512 4.150
0.012 10 0 0.09 0.0458 0.0358 -0.0044 0 0.017 0.0043 one data -0.096
2720 2710 2650 48 18 48 2720 1117.9 873.0 867.94 0 0.022 0.0095 0.0112 -4.991
2 0 0 13 10 0 20 6.0000 7.1957 -9.0004 1 4 3.2500 1.5000 0.250
7.45 7.15 7.55 8 15 6.93 10.61 7.9247 0.849940000 38500 37300 844 19 844 40000 18328.2 12414.1 17828.2
4 0.14 0.52 0.2534 0.1571 -1.247
4 0 1.1 0.2750 one data 0.275
3 7.3 7.3 7.3000 one data 7.300
10 0.18 1.5 0.5610 0.3860 0.5615 0 1.5 0.8180 0.6370 0.8185 0 0.92 0.3640 0.3562 0.3645 0.22 0.76 0.4740 0.2258 0.4744 0 0 0.0006 0.01 0.7 0.2607 0.2893 0.2615 0 0 0.0003 0 20 6.6667 one data 6.6674 21.8 26 23.4750 1.7840 23.475
Standart Deviation
Mean - Reg. StandardMeanMaxMin
Number of Data
MDWASD S WWTP IW and MW
FPL-012-100

TableB6 - Upper Monitoring Zone with Non-detects as zero
MD-North District
Miami Dade North District
MDWASD South
DistrictMDWASD-Westfield
City of WPB IW 6
Boynton Beach MDWASD S WWTP IW and MW
70717-1 FA-1N Upper FA-4 Upper FA-10 Upper Upper
F1 Upper
Upper Zone 7938 7939 7940
Inorganic AnalysisArsenic 0.05 mg/L 0 0 0 0.0025 0 0 0 0 8 0 0.0025 0.0003 0.0009 -0.050Barium 2 mg/L 0.021 0.055 0 0.275 4 0 0.275 0.0878 0.1269 -1.912Cadmium 0.005 mg/L 0 0 0 0 0 0.44 0.009 7 0 0.44 0.0641 0.1658 0.059Chromium 0.1 mg/L 0 0 0 0 4 0 0 0.0000 0.0000 -0.100Cyanide 0.2 mg/L 0 0 0 0 4 0 0 0.0000 0.0000 -0.200Fluoride 4 mg/L 0.76 0.92 0.9 1.7 2 1.98 2 7 0.76 2 1.4657 0.5782 -2.534Lead 0.015 mg/L 0 0 0 0 0.04 0.03 0.054 7 0 0.054 0.0177 0.0232 0.003Mercury 0.002 mg/L 0 0 0 0 0 0.0027 0.005 7 0 0.005 0.0011 0.0020 -0.001Nickel 0.1 mg/L 0 0 0 0.039 4 0 0.039 0.0098 0.0195 -0.090Nitrate 10 mg/L 0.11 0 0 0 0 0.04 0.06 0.04 8 0 0.11 0.0313 0.0398 -9.969Nitrite 1 mg/L 0 0 0 0 0 5 0 0 0.0000 0.0000 -1.000Selenium 0.05 mg/L 0 0 0 0 4 0 0 0.0000 0.0000 -0.050Sodium 160 mg/L 1200 1200 1800 1150 2500 945 702 7 702 2500 1356.7 604.7 1196.7Antimony 0.006 mg/L 0 0 0 0 0 5 0 0 0.0000 0.0000 -0.006Beryllium 0.004 mg/L 0 0 0 0 0 5 0 0 0.0000 0.0000 -0.004Thallium 0.002 mg/L 0 0 0 0 4 0 0 0.0000 0.0000 -0.002Secondary AnalysisAluminum 0.2 mg/L 0 0 0 0 0.09 3.76 0.96 7 0 3.76 0.6871 1.4001 0.487Chloride 250 mg/L 2400 2200 3000 2499 3874 663 1920 1070 8 663 3874 2203.3 1020.5 1953.3Copper 1 mg/L 0 0 0 0 0.002 0.83 0.052 7 0 0.83 0.1 0.3 -0.9Iron 0.3 mg/L 0.58 0.7 0.71 0.501 5 0.96 140 5.9 8 0.501 140 19.3 48.8 19.0Manganese 0.05 mg/L 0.049 0.017 0.011 0.017 0 0 0.055 7 0 0.055 0.0213 0.0222 -0.029Silver 0.1 mg/L 0 0 0 0 4 0 0 0.0000 0.0000 -0.100Sulfate 250 mg/L 380 370 260 662 680 280 290 286 8 260 680 401.0 172.1 151.0Zinc 5 mg/L 0 0.026 0 0.19 4 0 0.19 0.0540 0.0915 -4.946Color 15 PtCo unit 10 0 20 12 50 2 2 2 8 0 50 12.2500 16.7140 -2.750Odor 3 TON 2 4 0 2 4 0 4 2.00 1.63 -1.00pH (units) 6.5-8.5 std units 8.25 8.94 7.72 7.36 5.88 7.8 8.1 7.75 7.8 9 5.88 8.94 7.73 0.82TDS 500 mg/L 3500 3500 5900 4300 7388 3800 2616 3752 2396 9 2396 7388 4128.0 1585.9 3628.0Foaming Agents 1.5 mg/L 0.16 0 0.15 0.2 0.03 5 0 0.2 0.11 0.09 -1.39Trihalomethane AnalysisTotal THMs mg/L 0 0 0 0.5 4 0 0.5 0.1250 0.2500 0.125Radiological AnalysisGross Alpha pCi/L 30+/-45 9.7+/-21 4.1 3 4.1 4.1 4.1000 one data 4.100Miscellaneous AnalysisAmmonia-N mg/L 0.24 0 0.26 0.5 2.28 0.56 6 0 2.28 0.6400 0.8282 0.640Nitrogen, total mg/L 0 1 0 0 0.0000 one data 0.000Nitrogen, organic mg/L 0.54 0 0.16 1.13 0.28 5 0 1.13 0.4220 0.4422 0.422Nitrogen, total Kjeldahl mg/L 0.3 0.35 0.42 1.63 0.69 5 0.3 1.63 0.6780 0.5531 0.678Ortho-phosphate mg/L 0 0 0 0 4 0 0 0.0000 0.0000 0.000Phosphorus, total mg/L 0 0 0 0.03 0.68 0 6 0 0.68 0.1183 0.2754 0.118BOD mg/L 13 16 0 0 4.5 5 0 16 6.7 7.4 6.7Total Coliform col/100m 0 0 0 3 0 0 0.0 0.0 0.0Water Temperature ° C 24.1 22.9 23.1 27 4 22.9 27 24.3 1.9 24.3
Parameter NameStandard
mg/L UnitsNumber of Data
Mean - Reg. StandardMin Max Mean
Standard Deviation
FPL-012-101

Table B7 - ASR with Non-detects as zero
ASR 1 ASR 2 ASR 3Inorganic AnalysisArsenic 0.05 mg/L 0 0 0 0 0 5 0 0 0.000 0.000 -0.050Barium 2 mg/L 1.506 0 0.376 0 0.012 5 0 1.506 0.379 0.650 -1.621Cadmium 0.005 mg/L 0 0 0 0 0 5 0 0 0.000 0.000 -0.005Chromium 0.1 mg/L 0 0.019 0 0 0 5 0 0.019 0.004 0.008 -0.096Cyanide 0.2 mg/L 0 0 0 0 4 0 0 0.000 0.000 -0.200Fluoride 4 mg/L 1.44 1.5 1.86 1.8 1.3 5 1.3 1.86 1.580 0.240 -2.420Lead 0.015 mg/L 0 0.005 0 0 0 5 0 0.005 0.001 0.002 -0.014Mercury 0.002 mg/L 0 0 0 0 0 5 0 0 0.000 0.000 -0.002Nickel 0.1 mg/L 0 0 0 0 4 0 0 0.000 0.000 -0.100Nitrate 10 mg/L 0 NA 0.11 0 0 4 0 0.11 0.028 0.055 -9.973Nitrite 1 mg/L 0 NA 0 0 0 4 0 0 0.000 0.000 -1.000Selenium 0.05 mg/L 0 0 0 0 0.013 5 0 0.013 0.003 0.006 -0.047Sodium 160 mg/L 1827 950 1029 1053 4 950 1827 1214.750 410.532 1054.750Antimony 0.006 mg/L 0 0 0 0 4 0 0 0.000 0.000 -0.006Beryllium 0.004 mg/L 0 0 0 0 4 0 0 0.000 0.000 -0.004Thallium 0.002 mg/L 0 0 0 0 4 0 0 0.000 0.000 -0.002Secondary Analysis 0Aluminum 0.2 mg/L 0 0 0 0 4 0 0 -0.200Chloride 250 mg/L 3524 2000 2449 2349 1920 5 1920 3524 2448.400 641.690 2198.400Copper 1 mg/L 0.011 0.005 0.01 0.023 0 5 0 0.023 0.010 0.009 -0.990Iron 0.3 mg/L 0.156 4.295 0.343 0.575 0.022 5 0.022 4.295 1.078 1.810 0.778Manganese 0.05 mg/L 0.014 0.165 0.012 0.015 0 5 0 0.165 0.041 0.069 -0.009Silver 0.1 mg/L 0 0 0 0 0 5 0 0 0.000 0.000 -0.100Sulfate 250 mg/L 725 238 615 595 436 5 238 725 521.800 189.235 271.800Zinc 5 mg/L 0 0.018 0.065 0.324 0 5 0 0.324 0.081 0.138 -4.919Color 15 PtCo units 17 10 2 31 0 5 0 31 12.000 12.590 -3.000Odor 3 TON 50 1 2 1 4 1 50 13.500 24.338 10.500pH (units) 6.5-8.5 std units 7.61 6.91 7.12 8.39 7.6 5 6.91 8.39 7.526 0.571TDS 500 mg/L 7880 5980 4390 4040 3910 5 3910 7880 5240.000 1691.789 4740.000Foaming Agents 1.5 mg/L 0.04 0 0.13 0.18 0 5 0 0.18 0.070 0.081 -1.430Trihalomethane Analysis 0Total THMs mg/L 0.0017 9.93 0 0 4 0 9.93 2.483 4.965 2.483Radiological Analysis 0Gross Alpha pCi/L 30.7 7.8 47 19.3 18.5 5 7.8 47 24.660 14.887 24.660Miscellaneous Analysis 0Ammonia-N mg/L 0.68 0.4 0.49 0.73 4 0.4 0.73 0.575 0.156 0.575Nitrogen, total mg/L 0 0Nitrogen, organic mg/L 0.19 0.31 0.42 3 0.19 0.42 0.307 0.115 0.307Nitrogen, total Kjeldahl mg/L 0.87 0.71 0.91 3 0.71 0.91 0.830 0.106 0.830Ortho-phosphate mg/L 0 0.19 0.2 3 0 0.2 0.130 0.113 0.130Phosphorus, total mg/L NA 0.22 0.29 2 0.22 0.29 0.255 0.049 0.255BOD mg/L 0 1.8 1.9 3 0 1.9 1.233 1.069 1.233Total Coliform col/100ml 6 1 6 6 6.000 one data 6.000Water Temperature ° C 0.000
MDWASD - West Wellfield
Parameter NameStandard
mg/L UnitsFive Ash
ASR MeanStandart Deviation
Mean - Reg. Standard
Boynton Beach (Background)
Number of Data Min Max
FPL-012-102
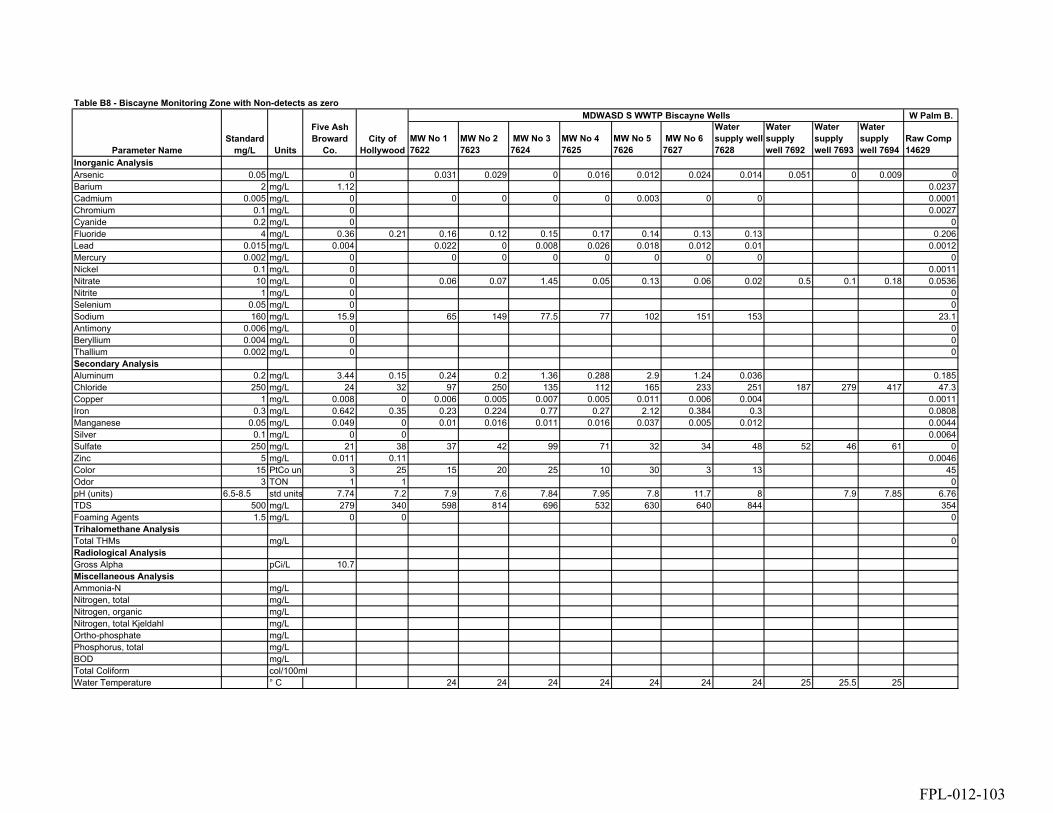
Table B8 - Biscayne Monitoring Zone with Non-detects as zeroW Palm B.
MW No 1 7622
MW No 2 7623
MW No 3 7624
MW No 4 7625
MW No 5 7626
MW No 6 7627
Water supply well 7628
Water supply well 7692
Water supply well 7693
Water supply well 7694
Raw Comp 14629
Inorganic AnalysisArsenic 0.05 mg/L 0 0.031 0.029 0 0.016 0.012 0.024 0.014 0.051 0 0.009 0Barium 2 mg/L 1.12 0.0237Cadmium 0.005 mg/L 0 0 0 0 0 0.003 0 0 0.0001Chromium 0.1 mg/L 0 0.0027Cyanide 0.2 mg/L 0 0Fluoride 4 mg/L 0.36 0.21 0.16 0.12 0.15 0.17 0.14 0.13 0.13 0.206Lead 0.015 mg/L 0.004 0.022 0 0.008 0.026 0.018 0.012 0.01 0.0012Mercury 0.002 mg/L 0 0 0 0 0 0 0 0 0Nickel 0.1 mg/L 0 0.0011Nitrate 10 mg/L 0 0.06 0.07 1.45 0.05 0.13 0.06 0.02 0.5 0.1 0.18 0.0536Nitrite 1 mg/L 0 0Selenium 0.05 mg/L 0 0Sodium 160 mg/L 15.9 65 149 77.5 77 102 151 153 23.1Antimony 0.006 mg/L 0 0Beryllium 0.004 mg/L 0 0Thallium 0.002 mg/L 0 0Secondary AnalysisAluminum 0.2 mg/L 3.44 0.15 0.24 0.2 1.36 0.288 2.9 1.24 0.036 0.185Chloride 250 mg/L 24 32 97 250 135 112 165 233 251 187 279 417 47.3Copper 1 mg/L 0.008 0 0.006 0.005 0.007 0.005 0.011 0.006 0.004 0.0011Iron 0.3 mg/L 0.642 0.35 0.23 0.224 0.77 0.27 2.12 0.384 0.3 0.0808Manganese 0.05 mg/L 0.049 0 0.01 0.016 0.011 0.016 0.037 0.005 0.012 0.0044Silver 0.1 mg/L 0 0 0.0064Sulfate 250 mg/L 21 38 37 42 99 71 32 34 48 52 46 61 0Zinc 5 mg/L 0.011 0.11 0.0046Color 15 PtCo un 3 25 15 20 25 10 30 3 13 45Odor 3 TON 1 1 0pH (units) 6.5-8.5 std units 7.74 7.2 7.9 7.6 7.84 7.95 7.8 11.7 8 7.9 7.85 6.76TDS 500 mg/L 279 340 598 814 696 532 630 640 844 354Foaming Agents 1.5 mg/L 0 0 0Trihalomethane AnalysisTotal THMs mg/L 0Radiological AnalysisGross Alpha pCi/L 10.7Miscellaneous AnalysisAmmonia-N mg/LNitrogen, total mg/LNitrogen, organic mg/LNitrogen, total Kjeldahl mg/LOrtho-phosphate mg/LPhosphorus, total mg/LBOD mg/LTotal Coliform col/100mlWater Temperature ° C 24 24 24 24 24 24 24 25 25.5 25
City of HollywoodParameter Name
Standard mg/L
Five Ash Broward
Co.Units
MDWASD S WWTP Biscayne Wells
FPL-012-103

13025elclairch 14575
Raw Comp 15015 Raw 19151 Raw 15660 7692 7693 7694 7627
0 0 0 0.051 0 0.009 0.024 19 0 0.051 0.0142 0.0168 -0.0360.025 0.0256 0.0266 5 0.0237 1.12 0.2442 0.4896 -1.756
0 0.000402 0.0005 0 13 0 0.003 0.0003 0.0008 -0.0050.002 0.00265 0.0022 5 0 0.0027 0.0019 0.0011 -0.098
0 0 0.0133 5 0 0.0133 0.0027 0.0059 -0.1970.22 0.214 0.259 0.13 14 0.12 0.36 0.1856 0.0660 -3.814
0 0.00261 0 0.012 13 0 0.026 0.0089 0.0088 -0.0060.00217 0 0 0 0 14 0 0.00217 0.0002 0.0006 -0.002
0.000849 0.00169 0.0041 5 0 0.0041 0.0015 0.0016 -0.0980.159 0 0 0.5 0.1 0.18 0.06 19 0 1.45 0.1933 0.3367 -9.807
0 0 0 5 0 0 0.0000 0.0000 -1.0000 0 0 5 0 0 0.0000 0.0000 -0.050
25.3 24.4 27 152 13 15.9 153 80.1692 55.7358 -79.8310 0 0 5 0 0 0.0000 0.0000 -0.0060 0 0 5 0 0 0.0000 0.0000 -0.0040 0 0 5 0 0 0.0000 0.0000 -0.002
0.057 0.17 0 1.24 14 0 3.44 0.8219 1.1088 0.62275.4 45.7 58.1 187 279 417 233 20 24 417 176.2250 118.9342 -73.775
0.00437 0.000536 0.0007 0.006 14 0 0.011 0.0046 0.0032 -0.9950.001 0.0628 0.0666 0.384 14 0.001 2.12 0.4204 0.5352 0.120
0.00258 0.00505 0.0054 0.005 14 0 0.049 0.0127 0.0139 -0.0370 0 0 6 0 0.0064 0.0011 0.0026 -0.0990 0 0 52 46 61 34 16 0 99 38.7000 25.7807 -211.300
0.001 0.0121 0.0096 6 0.001 0.11 0.0247 0.0420 -4.97540 25 50 3 14 3 50 21.9286 15.4146 6.9290 0 0 6 0 1 0.3333 0.5164 -2.667
7.13 7.22 7.48 7.9 7.85 11.7 18 6.76 11.7 8.0844 1.3598396 348 352 640 14 279 844 533.0714 187.7693 33.071
0 0 0 6 0 0 0.0000 0.0000 -1.500
0.0397 0.0381 3 0 0.0397 0.0259 0.0225 0.026
0.4 2 0.4 10.7 5.5500 7.2832 5.550
0 0 0.0000 0 0.0000 0 0.0000 0 0.0000 0 0.0000 0 0.0000 0 0.0000 0 0.000
10 24 25.5 24.3500 0.5798 24.350
Standart Deviation
Mean - Reg.
Standard
West Palm Beach
Number of Data Min Max Mean
MDWASD S WWTP IW and MW
FPL-012-104
84
APPENDIX C. TABLES OF DATA TOTALS AND STATISTICS, ASSUMING NON-DETECTED VALUES EQUAL TO REPORTED DETECTION LIMITS
FPL-012-105
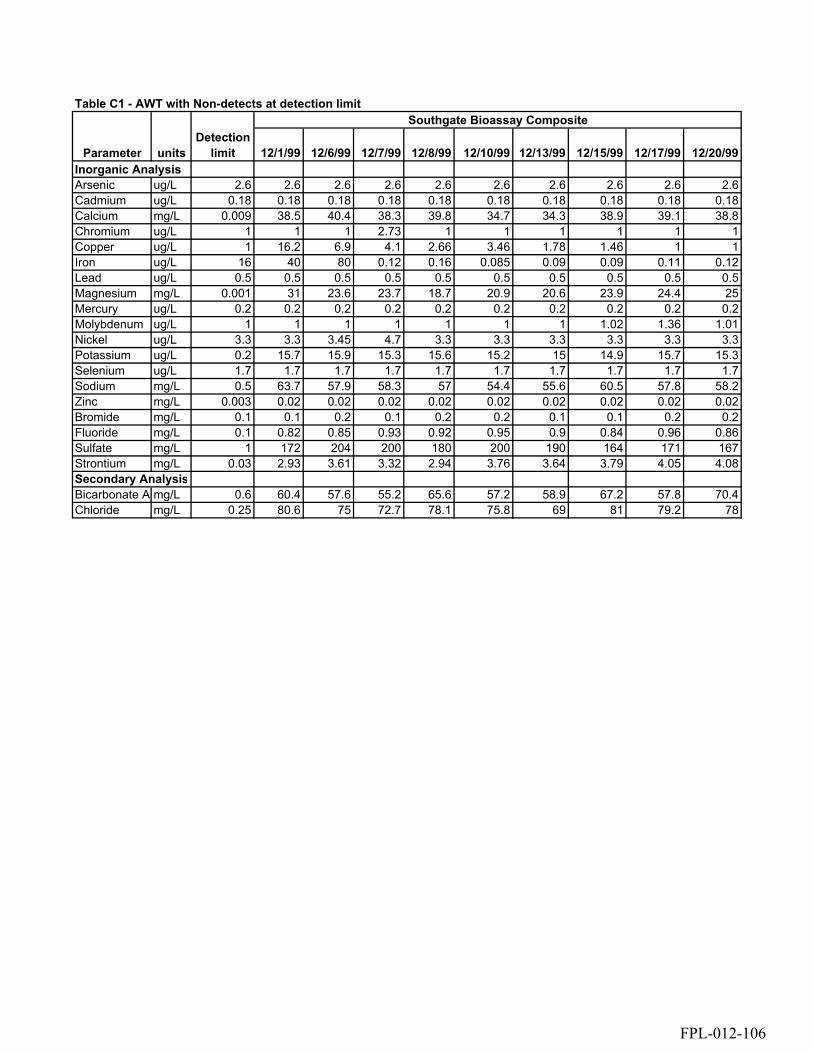
Table C1 - AWT with Non-detects at detection limit
12/1/99 12/6/99 12/7/99 12/8/99 12/10/99 12/13/99 12/15/99 12/17/99 12/20/99Inorganic AnalysisArsenic ug/L 2.6 2.6 2.6 2.6 2.6 2.6 2.6 2.6 2.6 2.6Cadmium ug/L 0.18 0.18 0.18 0.18 0.18 0.18 0.18 0.18 0.18 0.18Calcium mg/L 0.009 38.5 40.4 38.3 39.8 34.7 34.3 38.9 39.1 38.8Chromium ug/L 1 1 1 2.73 1 1 1 1 1 1Copper ug/L 1 16.2 6.9 4.1 2.66 3.46 1.78 1.46 1 1Iron ug/L 16 40 80 0.12 0.16 0.085 0.09 0.09 0.11 0.12Lead ug/L 0.5 0.5 0.5 0.5 0.5 0.5 0.5 0.5 0.5 0.5Magnesium mg/L 0.001 31 23.6 23.7 18.7 20.9 20.6 23.9 24.4 25Mercury ug/L 0.2 0.2 0.2 0.2 0.2 0.2 0.2 0.2 0.2 0.2Molybdenum ug/L 1 1 1 1 1 1 1 1.02 1.36 1.01Nickel ug/L 3.3 3.3 3.45 4.7 3.3 3.3 3.3 3.3 3.3 3.3Potassium ug/L 0.2 15.7 15.9 15.3 15.6 15.2 15 14.9 15.7 15.3Selenium ug/L 1.7 1.7 1.7 1.7 1.7 1.7 1.7 1.7 1.7 1.7Sodium mg/L 0.5 63.7 57.9 58.3 57 54.4 55.6 60.5 57.8 58.2Zinc mg/L 0.003 0.02 0.02 0.02 0.02 0.02 0.02 0.02 0.02 0.02Bromide mg/L 0.1 0.1 0.2 0.1 0.2 0.2 0.1 0.1 0.2 0.2Fluoride mg/L 0.1 0.82 0.85 0.93 0.92 0.95 0.9 0.84 0.96 0.86Sulfate mg/L 1 172 204 200 180 200 190 164 171 167Strontium mg/L 0.03 2.93 3.61 3.32 2.94 3.76 3.64 3.79 4.05 4.08Secondary AnalysisBicarbonate A mg/L 0.6 60.4 57.6 55.2 65.6 57.2 58.9 67.2 57.8 70.4Chloride mg/L 0.25 80.6 75 72.7 78.1 75.8 69 81 79.2 78
Southgate Bioassay Composite
Parameter unitsDetection
limit
FPL-012-106
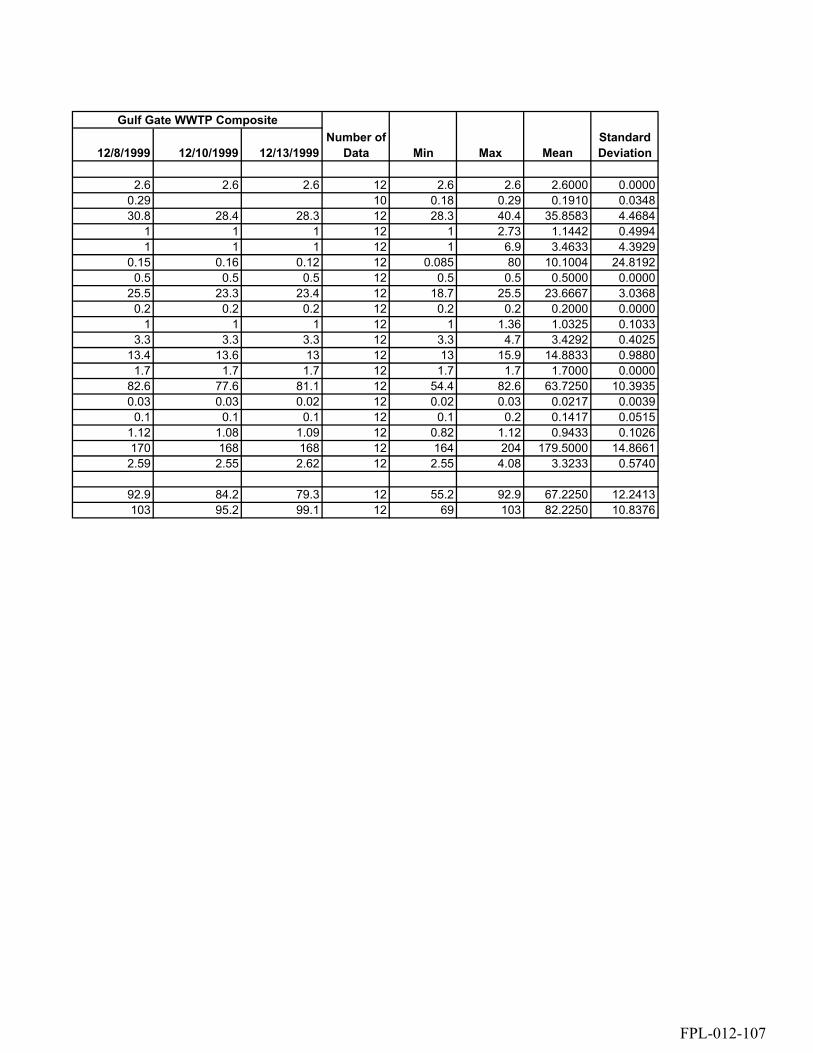
12/8/1999 12/10/1999 12/13/1999
2.6 2.6 2.6 12 2.6 2.6 2.6000 0.00000.29 10 0.18 0.29 0.1910 0.034830.8 28.4 28.3 12 28.3 40.4 35.8583 4.4684
1 1 1 12 1 2.73 1.1442 0.49941 1 1 12 1 6.9 3.4633 4.3929
0.15 0.16 0.12 12 0.085 80 10.1004 24.81920.5 0.5 0.5 12 0.5 0.5 0.5000 0.0000
25.5 23.3 23.4 12 18.7 25.5 23.6667 3.03680.2 0.2 0.2 12 0.2 0.2 0.2000 0.0000
1 1 1 12 1 1.36 1.0325 0.10333.3 3.3 3.3 12 3.3 4.7 3.4292 0.4025
13.4 13.6 13 12 13 15.9 14.8833 0.98801.7 1.7 1.7 12 1.7 1.7 1.7000 0.0000
82.6 77.6 81.1 12 54.4 82.6 63.7250 10.39350.03 0.03 0.02 12 0.02 0.03 0.0217 0.0039
0.1 0.1 0.1 12 0.1 0.2 0.1417 0.05151.12 1.08 1.09 12 0.82 1.12 0.9433 0.1026170 168 168 12 164 204 179.5000 14.8661
2.59 2.55 2.62 12 2.55 4.08 3.3233 0.5740
92.9 84.2 79.3 12 55.2 92.9 67.2250 12.2413103 95.2 99.1 12 69 103 82.2250 10.8376
Gulf Gate WWTP CompositeStandard Deviation
Number of Data Min Max Mean
FPL-012-107

Tabel C2 - Reclaimed Water Analysis with Non-detects at detection limit
Parameter NameStandard
mg/L Units Boca Raton
City of Hollywood
WWTPHollywood, reuse filter
Boca Raton
Boca Raton
Boca Raton
Boca Raton
Hollywood Re-use filter
Hollywood Re-use filter
Hollywood Re-use filter
Boca Raton
No of Data Mean Min
Inorganic AnalysisArsenic 0.05 mg/L 0.0012 0.01 0.01 0.0004 0.004 0.005 0.005 0.01 0.01 0.01 0.004 11 0.0063 0.0004Barium 2 mg/L 0.7 0.05 0.01 0.5 0.5 0.1 0.1 0.01 0.01 0.01 0.07 11 0.1873 0.0100Cadmium 0.005 mg/L 0.0001 0.005 0.004 0.0003 0.0003 0.0005 0.0005 0.004 0.004 0.004 0.003 11 0.0023 0.0001Chromium 0.1 mg/L 0.0017 0.005 0.01 0.003 0.003 0.001 0.002 0.01 0.01 0.01 0.005 11 0.0055 0.0010Cyanide 0.2 mg/L 0.004 0.004 0.002 0.004 0.004 5 0.0036 0.0020Fluoride 4 mg/L 0.3 0.72 0.67 0.34 0.289 0.27 0.292 0.69 0.67 0.61 0.25 11 0.4637 0.2500Lead 0.015 mg/L 0.0005 0.005 0.005 0.0033 0.001 0.002 0.002 0.0005 0.0005 0.0005 0.005 11 0.0023 0.0005Mercury 0.002 mg/L 0.0001 0.001 0.001 0.0002 0.0002 0.0002 0.0002 0.0001 0.001 0.0001 0.0002 11 0.0004 0.0001Nickel 0.1 mg/L 0.005 0.01 0.01 0.01 0.01 5 0.0090 0.0050Nitrate 10 mg/L 1.03 0.21 9.1 1.34 6.03 0.304 3.3 2.3 9.1 6.5 1.37 11 3.6895 0.2100Nitrite 1 mg/L 0.05 0.02 0.02 0.02 0.02 5 0.0260 0.0200Selenium 0.05 mg/L 0.0015 0.01 0.01 0.005 0.005 0.005 0.005 0.01 0.01 0.01 0.005 11 0.0070 0.0015Sodium 160 mg/L 107 69 79.6 77.6 64.6 73.1 85 69 66 58.2 10 74.9100 58.2Antimony 0.006 mg/L 0.81 0.005 0.05 0.0079 0.005 0.005 6 0.1472 0.0050Beryllium 0.004 mg/L 0.002 0.03 0.003 0.003 0.003 5 0.0082 0.0020Thallium 0.002 mg/L 0.002 0.001 0.002 0.002 0.002 5 0.0018 0.0010Secondary Analysis Aluminum 0.2 mg/L 0.1 0.1 0.1 0.1 4 0.1000 0.1000Chloride 250 mg/L 126 75 130 120 148 96 101 140 130 120 99.4 11 116.8545 75.0Copper 1 mg/L 0.1 0.01 0.0002 0.03 0.02 0.021 0.01 0.025 0.0002 0.0035 0.07 11 0.0264 0.0002Iron 0.3 mg/L 0.4 0.29 0.28 0.054 0.01 0.18 0.1 0.16 0.28 0.16 0.09 11 0.1822 0.0100Manganese 0.05 mg/L 0.0976 0.05 0.022 0.014 0.01 0.0086 0.0146 0.014 0.022 0.019 0.014 11 0.0260 0.0086Silver 0.1 mg/L 0.003 0.002 0.0005 0.001 0.001 0.004 0.001 0.0005 0.0005 0.0005 0.005 11 0.0017 0.0005Sulfate 250 mg/L 36.1 150 120 27 39.4 28.7 35 64 120 190 28.4 11 76.2364 27.0Zinc 5 mg/L 0.02 0.01 0.032 0.036 0.032 0.01 0.011 0.063 0.032 0.016 0.02 11 0.0256 0.0100Color 15 PtCo units 40 30 25 30 40 5 33.0000 25.0Odor 3 TON 1 1 2 1 8 5 2.6000 1.0000pH (units) 6.5-8.5 std units 6.87 6.8 7 7.5 7.2 7.6 7 7 6.2 7.32 10 7.0490 6.2000TDS 500 mg/L 385 1119 550 354 438 400 400 540 550 690 382 11 528.0000 354.0Foaming Agents 1.5 mg/L 0.23 0.13 0.01 0.04 0.246 0.5 0.2 0.29 0.01 0.026 0.14 11 0.1656 0.0100Trihalomethane AnalysisTotal THMs 100 mg/L 11 34.8 13.3 35 17.4 21 61.3 34.8 26.9 13 10 26.8500 11.0Radiological AnalysisGross Alpha pCi/L 1.2+/-1.4 6.7 4.0+/-5.0 0.5 1 n/a 0.0+/-0.7 4+/-5 3+/-5 0+/-0.6 9 2.7333 0.5Miscellenous AnalysisAmmonia-N mg/L 0Nitrogen, total mg/L 13.6 16 13.6 10 4 13.3000 10.0Nitrogen, organic mg/L 0Nitrogen, total Kjeldahl mg/L 4.5 3.3 4.5 4 4 4.0750 3.3Ortho-phosphate mg/L 0Phosphorus, total mg/L 1.1 2 1.1 1.3 4 1.3750 1.1BOD mg/L 0Water Temperature ° C 0
FPL-012-108
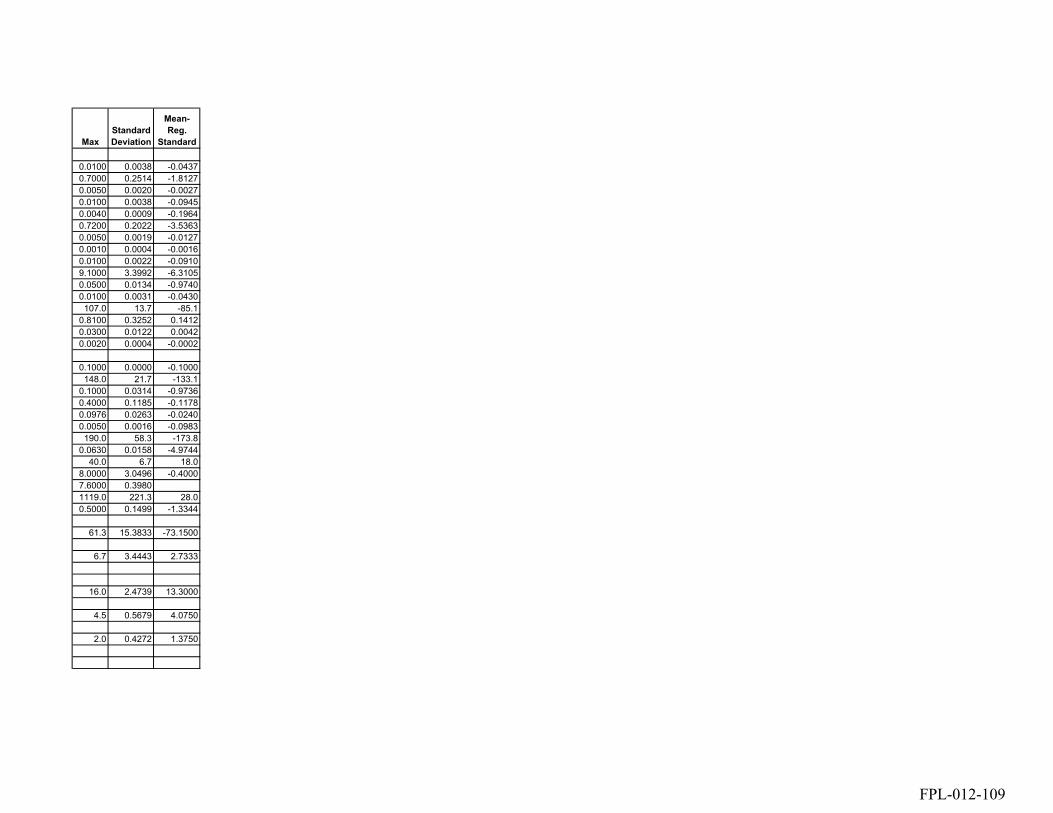
MaxStandard Deviation
Mean-Reg.
Standard
0.0100 0.0038 -0.04370.7000 0.2514 -1.81270.0050 0.0020 -0.00270.0100 0.0038 -0.09450.0040 0.0009 -0.19640.7200 0.2022 -3.53630.0050 0.0019 -0.01270.0010 0.0004 -0.00160.0100 0.0022 -0.09109.1000 3.3992 -6.31050.0500 0.0134 -0.97400.0100 0.0031 -0.0430107.0 13.7 -85.1
0.8100 0.3252 0.14120.0300 0.0122 0.00420.0020 0.0004 -0.0002
0.1000 0.0000 -0.1000148.0 21.7 -133.1
0.1000 0.0314 -0.97360.4000 0.1185 -0.11780.0976 0.0263 -0.02400.0050 0.0016 -0.0983190.0 58.3 -173.8
0.0630 0.0158 -4.974440.0 6.7 18.0
8.0000 3.0496 -0.40007.6000 0.39801119.0 221.3 28.00.5000 0.1499 -1.3344
61.3 15.3833 -73.1500
6.7 3.4443 2.7333
16.0 2.4739 13.3000
4.5 0.5679 4.0750
2.0 0.4272 1.3750
FPL-012-109
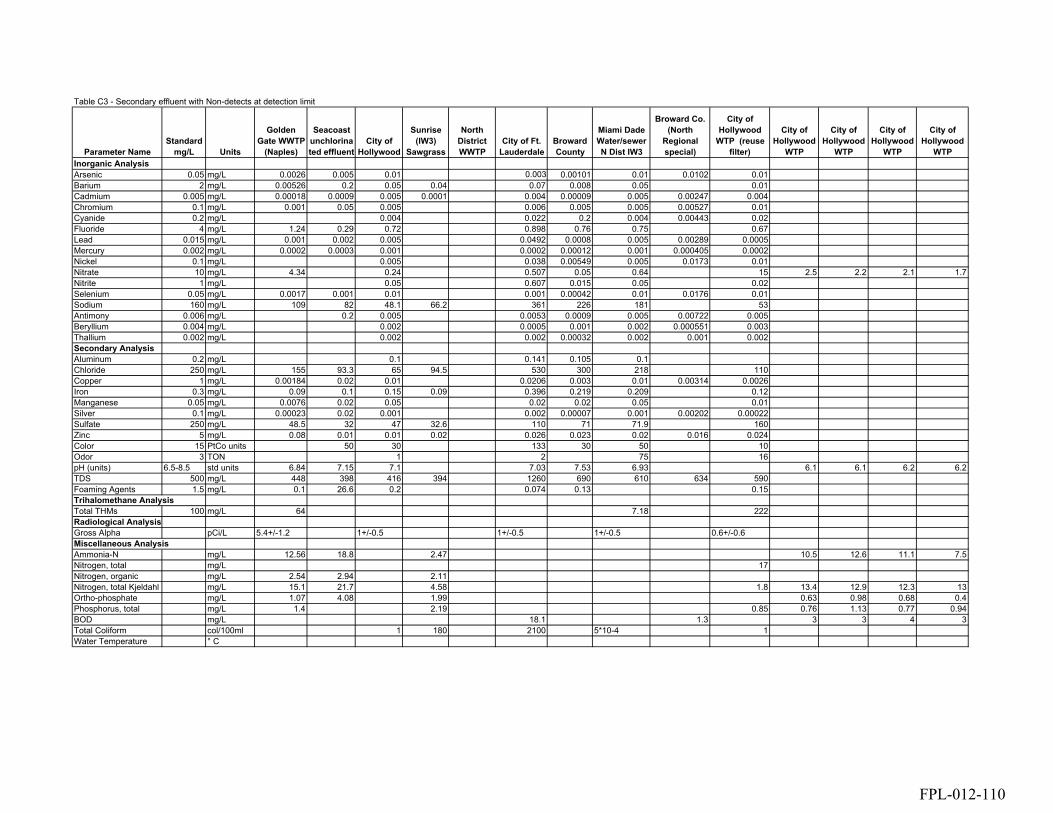
Table C3 - Secondary effluent with Non-detects at detection limit
Parameter NameStandard
mg/L Units
Golden Gate WWTP
(Naples)
Seacoast unchlorinated effluent
City of Hollywood
Sunrise (IW3)
Sawgrass
North District WWTP
City of Ft. Lauderdale
Broward County
Miami Dade Water/sewer N Dist IW3
Broward Co. (North
Regional special)
City of Hollywood
WTP (reuse filter)
City of Hollywood
WTP
City of Hollywood
WTP
City of Hollywood
WTP
City of Hollywood
WTPInorganic AnalysisArsenic 0.05 mg/L 0.0026 0.005 0.01 0.003 0.00101 0.01 0.0102 0.01Barium 2 mg/L 0.00526 0.2 0.05 0.04 0.07 0.008 0.05 0.01Cadmium 0.005 mg/L 0.00018 0.0009 0.005 0.0001 0.004 0.00009 0.005 0.00247 0.004Chromium 0.1 mg/L 0.001 0.05 0.005 0.006 0.005 0.005 0.00527 0.01Cyanide 0.2 mg/L 0.004 0.022 0.2 0.004 0.00443 0.02Fluoride 4 mg/L 1.24 0.29 0.72 0.898 0.76 0.75 0.67Lead 0.015 mg/L 0.001 0.002 0.005 0.0492 0.0008 0.005 0.00289 0.0005Mercury 0.002 mg/L 0.0002 0.0003 0.001 0.0002 0.00012 0.001 0.000405 0.0002Nickel 0.1 mg/L 0.005 0.038 0.00549 0.005 0.0173 0.01Nitrate 10 mg/L 4.34 0.24 0.507 0.05 0.64 15 2.5 2.2 2.1 1.7Nitrite 1 mg/L 0.05 0.607 0.015 0.05 0.02Selenium 0.05 mg/L 0.0017 0.001 0.01 0.001 0.00042 0.01 0.0176 0.01Sodium 160 mg/L 109 82 48.1 66.2 361 226 181 53Antimony 0.006 mg/L 0.2 0.005 0.0053 0.0009 0.005 0.00722 0.005Beryllium 0.004 mg/L 0.002 0.0005 0.001 0.002 0.000551 0.003Thallium 0.002 mg/L 0.002 0.002 0.00032 0.002 0.001 0.002Secondary AnalysisAluminum 0.2 mg/L 0.1 0.141 0.105 0.1Chloride 250 mg/L 155 93.3 65 94.5 530 300 218 110Copper 1 mg/L 0.00184 0.02 0.01 0.0206 0.003 0.01 0.00314 0.0026Iron 0.3 mg/L 0.09 0.1 0.15 0.09 0.396 0.219 0.209 0.12Manganese 0.05 mg/L 0.0076 0.02 0.05 0.02 0.02 0.05 0.01Silver 0.1 mg/L 0.00023 0.02 0.001 0.002 0.00007 0.001 0.00202 0.00022Sulfate 250 mg/L 48.5 32 47 32.6 110 71 71.9 160Zinc 5 mg/L 0.08 0.01 0.01 0.02 0.026 0.023 0.02 0.016 0.024Color 15 PtCo units 50 30 133 30 50 10Odor 3 TON 1 2 75 16pH (units) 6.5-8.5 std units 6.84 7.15 7.1 7.03 7.53 6.93 6.1 6.1 6.2 6.2TDS 500 mg/L 448 398 416 394 1260 690 610 634 590Foaming Agents 1.5 mg/L 0.1 26.6 0.2 0.074 0.13 0.15Trihalomethane AnalysisTotal THMs 100 mg/L 64 7.18 222Radiological AnalysisGross Alpha pCi/L 5.4+/-1.2 1+/-0.5 1+/-0.5 1+/-0.5 0.6+/-0.6Miscellaneous AnalysisAmmonia-N mg/L 12.56 18.8 2.47 10.5 12.6 11.1 7.5Nitrogen, total mg/L 17Nitrogen, organic mg/L 2.54 2.94 2.11Nitrogen, total Kjeldahl mg/L 15.1 21.7 4.58 1.8 13.4 12.9 12.3 13Ortho-phosphate mg/L 1.07 4.08 1.99 0.63 0.98 0.68 0.4Phosphorus, total mg/L 1.4 2.19 0.85 0.76 1.13 0.77 0.94BOD mg/L 18.1 1.3 3 3 4 3Total Coliform col/100ml 1 180 2100 5*10-4 1Water Temperature ° C
FPL-012-110

City of Hollywood
WTPPalm Beach
CountySunrise
(IW1 + IW2)Sunrise
(IW1 + IW2)Sunrise
(IW3)
0.000611 bdl bdl bdl bdl bdl bdl bdl bdl bdl bdl bdl bdl bdl bdl bdl bdl bdl bdl bdl0.00606 bdl bdl bdl0.00005 bdl bdl 0.0002 bdl bdl bdl bdl bdl bdl bdl bdl bdl bdl bdl bdl bdl bdl bdl bdl0.00146 bdl bdl bdl bdl bdl bdl bdl bdl bdl bdl bdl bdl bdl bdl bdl bdl bdl bdl bdl
0.005 bdl 0.03 bdl 0.00472 bdl bdl bdl bdl 0.024 0.0145 0.00575 bdl bdl bdl bdl bdl bdl 0.0152 bdl0.289 0.74 0.6 0.73
0.000274 bdl 0.004 bdl 0.00197 0.00289 0.00198 0.00424 0.00427 0.0046 0.0034 0.00322 bdl 0.00247 bdl 0.00165 0.011 bdl bdl 0.004220.0002 bdl bdl bdl bdl 0.00041 bdl 0.00087 0.00055 0.000378 bdl 0.000271 0.00043 bdl 0.000408 0.000296 0.0005 0.0008 6E-05 bdl
0.00309 bdl bdl bdl 0.0135 0.0173 0.0094 0.0101 0.00819 0.0144 0.0169 0.0205 0.00956 0.00654 0.0158 0.0021 0.0052 0.0095 0.0084 0.02241.5 2.03 5.69 15.1 7.41
0.73 2.12 0.06 0.730.00326 0.025 bdl 0.006 bdl bdl bdl bdl bdl bdl bdl bdl bdl bdl bdl bdl bdl bdl bdl bdl
58.4 86.1 74.3 78.10.0002 bdl bdl bdl0.0001 0.0004 bdl bdl bdl bdl bdl bdl bdl bdl bdl bdl bdl bdl bdl bdl bdl bdl bdl bdl
0.00114 bdl bdl bdl bdl bdl bdl 0.0133 bdl bdl bdl bdl bdl bdl bdl bdl bdl bdl bdl bdl
0.0473 0.1 bdl bdl bdl bdl bdl bdl bdl bdl bdl 0.048289.7 21.9 81.6 125
0.00298 bdl bdl bdl bdl 0.00314 0.00276 0.00273 0.00229 0.0037 0.00609 0.00219 0.00238 0.00134 0.00272 bdl bdl 0.00138 bdl 0.00720.386 0.08 0.03 0.05
0.0209 bdl bdl bdl0.00005 bdl bdl bdl bdl bdl bdl bdl bdl bdl bdl bdl bdl bdl bdl bdl bdl bdl bdl bdl
32 29.3 30.6 23.20.0126 bdl bdl bdl bdl bdl bdl bdl bdl bdl bdl bdl bdl bdl 0.00517 0.00843 0.004 0.0181 bdl 0.00901
35 40 15 601 1 1 1
6.2 6.67 7.26 7.1 7.58514 484 460 450
0.166 0.03 0.02 0.02
100 4.74 bdl
0.1
6.4 4.62 bdl 5.15
0.2 0.1310 5.32 2.02 5.28
0.8 2.54 0.23 2.340.94 2.54 2.2 1.81 0.46 1.13 1.33 1.49 1.07 1.55
5 12 0.6 33-10 280 -1025 26 25
Broward Co. Secondary Effluent
FPL-012-111
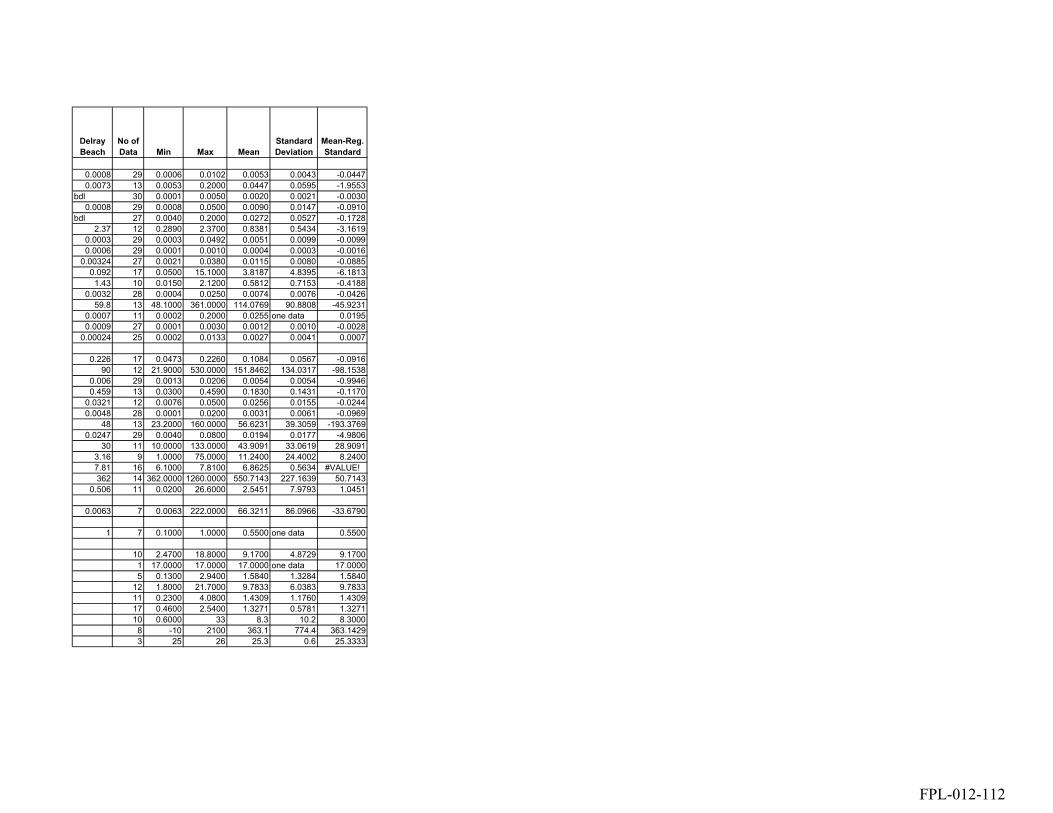
Delray Beach
No of Data Min Max Mean
Standard Deviation
Mean-Reg. Standard
0.0008 29 0.0006 0.0102 0.0053 0.0043 -0.04470.0073 13 0.0053 0.2000 0.0447 0.0595 -1.9553
bdl 30 0.0001 0.0050 0.0020 0.0021 -0.00300.0008 29 0.0008 0.0500 0.0090 0.0147 -0.0910
bdl 27 0.0040 0.2000 0.0272 0.0527 -0.17282.37 12 0.2890 2.3700 0.8381 0.5434 -3.1619
0.0003 29 0.0003 0.0492 0.0051 0.0099 -0.00990.0006 29 0.0001 0.0010 0.0004 0.0003 -0.0016
0.00324 27 0.0021 0.0380 0.0115 0.0080 -0.08850.092 17 0.0500 15.1000 3.8187 4.8395 -6.18131.43 10 0.0150 2.1200 0.5812 0.7153 -0.4188
0.0032 28 0.0004 0.0250 0.0074 0.0076 -0.042659.8 13 48.1000 361.0000 114.0769 90.8808 -45.9231
0.0007 11 0.0002 0.2000 0.0255 one data 0.01950.0009 27 0.0001 0.0030 0.0012 0.0010 -0.0028
0.00024 25 0.0002 0.0133 0.0027 0.0041 0.0007
0.226 17 0.0473 0.2260 0.1084 0.0567 -0.091690 12 21.9000 530.0000 151.8462 134.0317 -98.1538
0.006 29 0.0013 0.0206 0.0054 0.0054 -0.99460.459 13 0.0300 0.4590 0.1830 0.1431 -0.1170
0.0321 12 0.0076 0.0500 0.0256 0.0155 -0.02440.0048 28 0.0001 0.0200 0.0031 0.0061 -0.0969
48 13 23.2000 160.0000 56.6231 39.3059 -193.37690.0247 29 0.0040 0.0800 0.0194 0.0177 -4.9806
30 11 10.0000 133.0000 43.9091 33.0619 28.90913.16 9 1.0000 75.0000 11.2400 24.4002 8.24007.81 16 6.1000 7.8100 6.8625 0.5634 #VALUE!362 14 362.0000 1260.0000 550.7143 227.1639 50.7143
0.506 11 0.0200 26.6000 2.5451 7.9793 1.0451
0.0063 7 0.0063 222.0000 66.3211 86.0966 -33.6790
1 7 0.1000 1.0000 0.5500 one data 0.5500
10 2.4700 18.8000 9.1700 4.8729 9.17001 17.0000 17.0000 17.0000 one data 17.00005 0.1300 2.9400 1.5840 1.3284 1.5840
12 1.8000 21.7000 9.7833 6.0383 9.783311 0.2300 4.0800 1.4309 1.1760 1.430917 0.4600 2.5400 1.3271 0.5781 1.327110 0.6000 33 8.3 10.2 8.30008 -10 2100 363.1 774.4 363.14293 25 26 25.3 0.6 25.3333
FPL-012-112
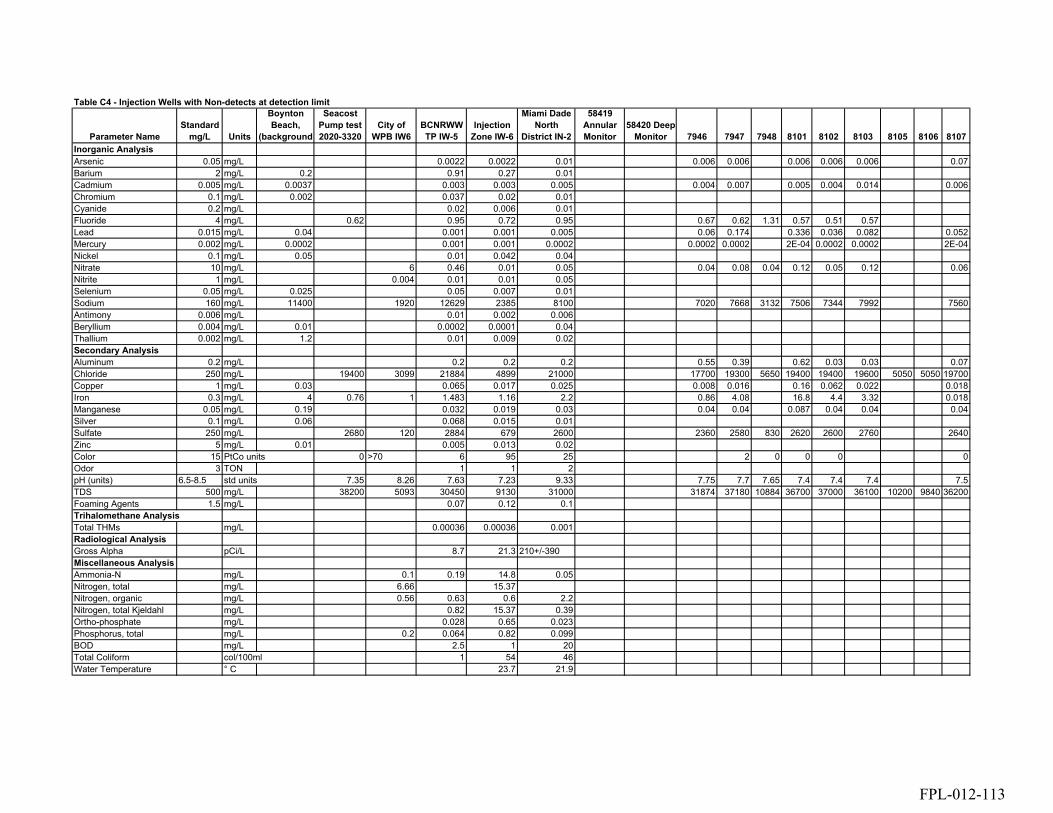
Table C4 - Injection Wells with Non-detects at detection limit
Parameter NameStandard
mg/L Units
Boynton Beach,
(background
Seacost Pump test 2020-3320
City of WPB IW6
BCNRWWTP IW-5
Injection Zone IW-6
Miami Dade North
District IN-2
58419 Annular Monitor
58420 Deep Monitor 7946 7947 7948 8101 8102 8103 8105 8106 8107
Inorganic AnalysisArsenic 0.05 mg/L 0.0022 0.0022 0.01 0.006 0.006 0.006 0.006 0.006 0.07Barium 2 mg/L 0.2 0.91 0.27 0.01Cadmium 0.005 mg/L 0.0037 0.003 0.003 0.005 0.004 0.007 0.005 0.004 0.014 0.006Chromium 0.1 mg/L 0.002 0.037 0.02 0.01Cyanide 0.2 mg/L 0.02 0.006 0.01Fluoride 4 mg/L 0.62 0.95 0.72 0.95 0.67 0.62 1.31 0.57 0.51 0.57Lead 0.015 mg/L 0.04 0.001 0.001 0.005 0.06 0.174 0.336 0.036 0.082 0.052Mercury 0.002 mg/L 0.0002 0.001 0.001 0.0002 0.0002 0.0002 2E-04 0.0002 0.0002 2E-04Nickel 0.1 mg/L 0.05 0.01 0.042 0.04Nitrate 10 mg/L 6 0.46 0.01 0.05 0.04 0.08 0.04 0.12 0.05 0.12 0.06Nitrite 1 mg/L 0.004 0.01 0.01 0.05Selenium 0.05 mg/L 0.025 0.05 0.007 0.01Sodium 160 mg/L 11400 1920 12629 2385 8100 7020 7668 3132 7506 7344 7992 7560Antimony 0.006 mg/L 0.01 0.002 0.006Beryllium 0.004 mg/L 0.01 0.0002 0.0001 0.04Thallium 0.002 mg/L 1.2 0.01 0.009 0.02Secondary AnalysisAluminum 0.2 mg/L 0.2 0.2 0.2 0.55 0.39 0.62 0.03 0.03 0.07Chloride 250 mg/L 19400 3099 21884 4899 21000 17700 19300 5650 19400 19400 19600 5050 5050 19700Copper 1 mg/L 0.03 0.065 0.017 0.025 0.008 0.016 0.16 0.062 0.022 0.018Iron 0.3 mg/L 4 0.76 1 1.483 1.16 2.2 0.86 4.08 16.8 4.4 3.32 0.018Manganese 0.05 mg/L 0.19 0.032 0.019 0.03 0.04 0.04 0.087 0.04 0.04 0.04Silver 0.1 mg/L 0.06 0.068 0.015 0.01Sulfate 250 mg/L 2680 120 2884 679 2600 2360 2580 830 2620 2600 2760 2640Zinc 5 mg/L 0.01 0.005 0.013 0.02Color 15 PtCo units 0 >70 6 95 25 2 0 0 0 0Odor 3 TON 1 1 2pH (units) 6.5-8.5 std units 7.35 8.26 7.63 7.23 9.33 7.75 7.7 7.65 7.4 7.4 7.4 7.5TDS 500 mg/L 38200 5093 30450 9130 31000 31874 37180 10884 36700 37000 36100 10200 9840 36200Foaming Agents 1.5 mg/L 0.07 0.12 0.1Trihalomethane AnalysisTotal THMs mg/L 0.00036 0.00036 0.001Radiological AnalysisGross Alpha pCi/L 8.7 21.3 210+/-390Miscellaneous AnalysisAmmonia-N mg/L 0.1 0.19 14.8 0.05Nitrogen, total mg/L 6.66 15.37Nitrogen, organic mg/L 0.56 0.63 0.6 2.2Nitrogen, total Kjeldahl mg/L 0.82 15.37 0.39Ortho-phosphate mg/L 0.028 0.65 0.023Phosphorus, total mg/L 0.2 0.064 0.82 0.099BOD mg/L 2.5 1 20Total Coliform col/100ml 1 54 46Water Temperature ° C 23.7 21.9
FPL-012-113

8108 8109 8110 8111 8112 8113 8524 8526 8399 8400 8525Number of Data Min Max Mean
Standart Deviation
Mean - Reg. Standard
0.03 0.006 0.006 0.006 13 0.0022 0.0700 0.0125 0.0186 -0.03750.004 0.004 0.004 7 0.0040 0.9100 0.2003 0.3317 -1.7997
0.006 11 0.0030 0.0140 0.0055 0.0031 0.00054 0.0020 0.0370 0.0173 0.0151 -0.08283 0.0060 0.0200 0.0120 0.0072 -0.1880
0.61 0.56 0.58 0.59 14 0.5100 1.3100 0.7021 0.2211 -3.29790.02 0.128 0.034 0.02 14 0.0010 0.3360 0.0706 0.0910 0.0556
0.0002 0.0006 0.0006 0.0002 14 0.0002 0.0010 0.0004 0.0003 -0.00164 0.0100 0.0500 0.0355 0.0175 -0.0645
0.06 0.15 0.02 0.05 0.235 0.05 0.155 0.335 19 0.0100 6.0000 0.4255 1.3549 -9.57454 0.0040 0.0500 0.0185 0.0212 -0.98154 0.0070 0.0500 0.0230 0.0196 -0.0270
7560 7992 7776 8014 10800 10900 10200 10600 10800 21 1920.0 12629.0 8061.8 2854.7 7901.83 0.0020 0.0100 0.0060 0.0040 0.00004 0.0001 0.0400 0.0126 0.0189 0.00864 0.0090 1.2000 0.3098 0.5935 0.3078
0.03 0.41 0.16 0.05 13 0.0300 0.6200 0.2262 0.2037 0.026219200 2080 4950 19500 19500 19500 19700 19400 19400 18800 19400 25 2080.0 21884.0 15302.5 7006.6 15052.5
0.002 0.019 0.004 0.004 14 0.0020 0.1600 0.0323 0.0415 -0.96770.51 3.2 3.3 3.32 16 0.0180 16.8000 3.1507 3.9120 2.85070.04 0.04 0.04 0.04 14 0.0190 0.1900 0.0513 0.0425 0.0013
4 0.0100 0.0680 0.0383 0.0300 -0.06182740 2760 2760 2620 2760 2840 2660 2670 2800 21 120.0000 2884.0 2379.2 785.0 2129.2
4 0.0050 0.0200 0.0120 0.0063 -4.98800 0 0 0 1 1 0 1 2 0.0000 95.0000 7.3889 22.6408 -7.6111
3 1.0000 2.0000 1.3333 0.5774 -1.66677.45 7.7 7.5 7.6 7.55 7.7 8.05 7.65 7.85 21 7.2300 9.3300 7.6976 0.4425
36300 4640 10348 37000 37600 38700 39800 38300 37500 38000 39000 25 4640.0 39800.0 28681.6 13049.7 28181.63 0.0700 0.1200 0.0967 0.0252 -1.4033
3 0.0004 0.0010 0.0006 0.0004 0.0006
3 8.7000 21.3000 15.0000 8.9095 15.0000
4 0.0500 14.8000 3.7850 7.3436 3.78502 6.6600 15.3700 11.0150 6.1589 11.01504 0.5600 2.2000 0.9975 0.8022 0.99753 0.3900 15.3700 5.5267 8.5273 5.52673 0.0230 0.6500 0.2337 0.3606 0.23374 0.0640 0.8200 0.2958 0.3542 0.29583 1.0000 20.0000 7.8333 10.5633 7.83333 1.0000 54.0000 33.6667 28.5715 33.66672 21.9000 23.7000 22.8000 1.2728 22.8000
FPL-012-114

Table C5 - Lower Monitoring zone with Non-detects at detection limit
70717-2 FA-2N Lower FA-4 Lower FA-10 Lower Lower
F2 Lower
Sanders Lab
Savannah Lab
Sanders Lab
Savannah Lab
110969 Lower Zone 7941 7942 7943
Inorganic AnalysisArsenic 0.05 mg/L 0.01 0.01 0.01 0.024 0.025 0.006 0.006 0.006Barium 2 mg/L 0.042 0.076 0.01 1.33Cadmium 0.005 mg/L 0.073 0.005 0.005 0.003 0.023 0.008 0.004Chromium 0.1 mg/L 0.05 0.01 0.01 0.02Cyanide 0.2 mg/L 0.01 0.01 0.01 0.004Fluoride 4 mg/L 0.61 0.8 0.8 0.38 1.92 1.72 1.2Lead 0.015 mg/L 0.005 0.0052 0.005 0.04 0.028 0.216 0.076Mercury 0.002 mg/L 0.0002 0.0002 0.0002 0.001 0.0022 0.0018 0.0008Nickel 0.1 mg/L 0.04 0.04 0.04 0.082Nitrate 10 mg/L 0.13 0.05 0.01 0.01 0.1 0.03 0.04 0.06Nitrite 1 mg/L 0.05 0.05 0.01 0.01 0.004Selenium 0.05 mg/L 0.005 0.01 0.01 0.004Sodium 160 mg/L 7600 7200 7900 2167 8200 1546 NA 2470 NA 972 2430 3726Antimony 0.006 mg/L 0.003 0.006 0.05 0.005 0.03Beryllium 0.004 mg/L 0.002 0.04 0.005 0.002 0.0006Thallium 0.002 mg/L 0.02 0.02 0.01 0.002Secondary AnalysisAluminum 0.2 mg/L 0.2 0.2 0.2 0.2 3.7 2.2 1.31Chloride 250 mg/L 17000 14000 14000 4649 14346 3949 4300 4949 5000 1080 4160 8260Copper 1 mg/L 0.025 0.025 0.025 0.02 0.119 0.066 0.03Iron 0.3 mg/L 2.9 1.4 0.78 0.443 10 15.8 6.6 2.95Manganese 0.05 mg/L 0.072 0.015 0.01 0.013 0.09 0.06 0.06Silver 0.1 mg/L 0.01 0.01 0.01 0.017Sulfate 250 mg/L 1100 830 1700 466 660 481 350 548 500 324 535 1140Zinc 5 mg/L 0.02 0.022 0.02 0.016Color 15 PtCo un 10 5 20 12 >70 0 3Odor 3 TON 4 4 1 4pH (units) 6.5-8.5 std units 7.83 8.57 6.93 10.61 8.13 7.45 7.7 7.8 8.2TDS 500 mg/L 21000 18000 31000 7220 24243 6000 7100 9320 10000 28300 3224 7528 15212Foaming Agents 1.5 mg/L 0.52 0.14 0.16 0.27 0.177Trihalomethane AnalysisTotal THMs mg/L 1 1 1 1.1Radiological AnalysisGross Alpha pCi/L 180+/-280 350+/-210 7.3Miscellaneous AnalysisAmmonia-N mg/L 0.22 0.18 1.5 0.42 0.4 0.75 0.61 0.53 0.73 0.27Nitrogen, total mg/L 0.63 1.43 0.6 1.5 0.56Nitrogen, organic mg/L 0.44 0.92 0.1 0.34 0.12Nitrogen, total Kjeldahl mg/L 0.22 0.65 0.42 0.76 0.32Ortho-phosphate mg/L 0.05 0.1 0.01 0.02Phosphorus, total mg/L 0.034 0.03 0.29 0.7 0.5 0.01BOD mg/L 2 20 2 1 2Total Coliform col/100m 1 20 1Water Temperature ° C 23 21.8 23.1 26
Parameter NameStandard
mg/L Units
MD-North District MDWASD S WWTP IW and MW
Miami Dade North District
MDWASD South
MDWASD-Westfield
City of WPB IW 6
Lower Monitoring Zone of MW-1 and 2 Broward MW-1 MW-2
Boynton Beach
FPL-012-115

7944 7945 8396 8397 8398 7628
0.006 0.006 0.014 10 0.006 0.025 0.0112 0.0071 -0.0394 0.01 1.33 0.3645 0.6442 -1.636
0.006 0.004 0.002 10 0.002 0.073 0.0133 0.0218 0.0084 0.01 0.05 0.0225 0.0189 -0.0784 0.004 0.01 0.0085 0.0030 -0.192
0.88 0.95 0.6 0.59 0.61 0.13 13 0.13 1.92 0.8608 0.5019 -3.1390.56 0.16 0.01 10 0.005 0.56 0.1105 0.1739 0.096
0.0008 0.0003 0.0002 10 0.0002 0.0022 0.0008 0.0007 -0.0014 0.04 0.082 0.0505 0.0210 -0.050
0.02 0.04 0.11 0.233 0.145 0.02 14 0.01 0.233 0.0713 0.0647 -9.9295 0.004 0.05 0.0248 0.0231 -0.9754 0.004 0.01 0.0073 0.0032 -0.043
5238 5076 11200 11100 11250 153 16 153 11250 5514.3 3786.8 5354.35 0.003 0.05 0.0188 0.0206 0.0135 0.0006 0.04 0.0099 0.0169 0.0064 0.002 0.02 0.0130 0.0087 0.011
0.99 0.53 0.036 10 0.036 3.7 0.9566 1.1793 0.75712300 11500 19500 19400 19500 251 18 251 19500 9896.9 6580.2 9646.90.033 0.013 0.004 10 0.004 0.119 0.0360 0.0333 -0.964
6.1 1.68 0.3 11 0.3 15.8 4.4503 4.8512 4.1500.09 0.04 0.012 10 0.01 0.09 0.0462 0.0325 -0.004
4 0.01 0.017 0.0118 0.0035 -0.0881700 1660 2720 2710 2650 48 18 48 2720 1117.9 873.0 867.9
4 0.016 0.022 0.0195 0.0025 -4.9812 0 0 13 10 0 20 6.5000 6.9001 -8.500
4 1 4 3.2500 1.5000 0.2507.6 7.9 7.45 7.15 7.55 8 15 6.93 10.61 7.9247 0.8499
21900 21544 40000 38500 37300 844 19 844 40000 18328.2 12414.1 17828.24 0.14 0.52 0.2534 0.1571 -1.247
4 1 1.1 1.0250 0.0500 1.025
3 7.3 7.3 7.3000 one data 7.300
10 0.18 1.5 0.5610 0.3860 0.5615 0.56 1.5 0.9440 0.4769 0.9445 0.1 0.92 0.3840 0.3327 0.3845 0.22 0.76 0.4740 0.2258 0.4744 0.01 0.1 0.0450 0.0404 0.0456 0.01 0.7 0.2607 0.2893 0.2615 1 20 5.4000 8.1731 5.4003 1 20 7.3333 10.9697 7.3334 21.8 26 23.4750 1.7840 23.475
MDWASD S WWTP IW and MWNumber of Data
Mean - Reg. Standard
Standart DeviationMeanMaxMin
FPL-012-116
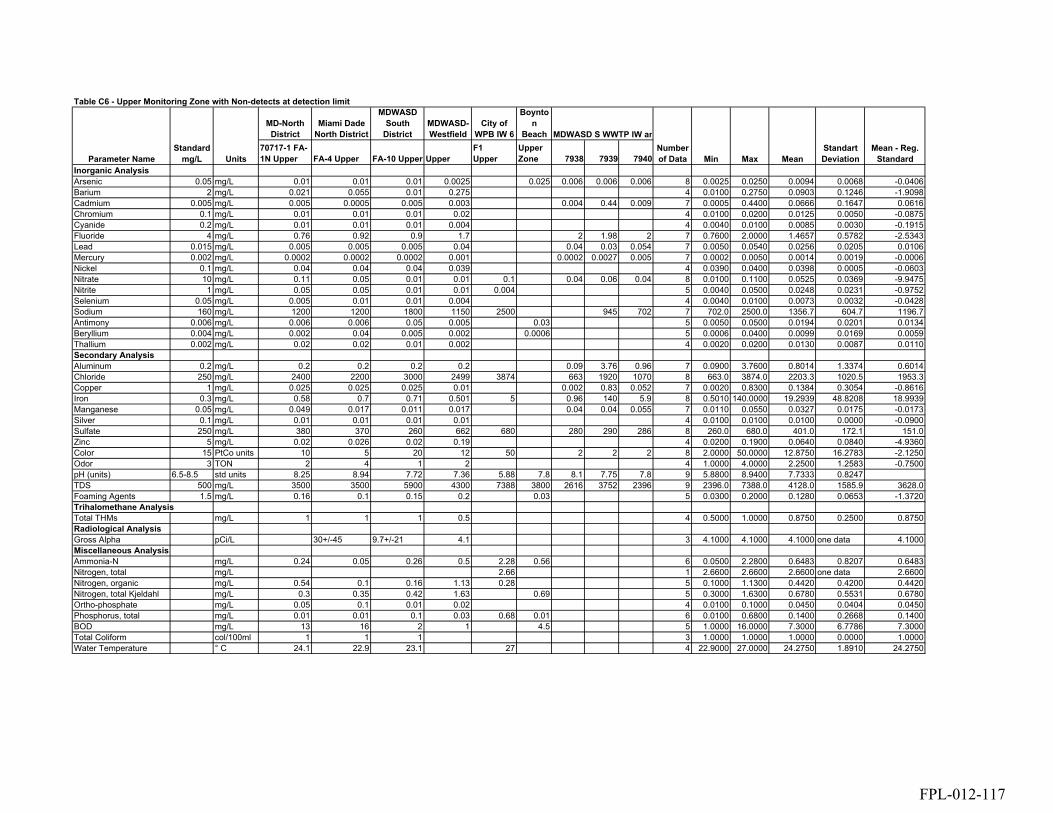
Table C6 - Upper Monitoring Zone with Non-detects at detection limit
MD-North District
Miami Dade North District
MDWASD South
DistrictMDWASD-Westfield
City of WPB IW 6
Boynton
Beach MDWASD S WWTP IW an70717-1 FA-1N Upper FA-4 Upper FA-10 Upper Upper
F1 Upper
Upper Zone 7938 7939 7940
Inorganic AnalysisArsenic 0.05 mg/L 0.01 0.01 0.01 0.0025 0.025 0.006 0.006 0.006 8 0.0025 0.0250 0.0094 0.0068 -0.0406Barium 2 mg/L 0.021 0.055 0.01 0.275 4 0.0100 0.2750 0.0903 0.1246 -1.9098Cadmium 0.005 mg/L 0.005 0.0005 0.005 0.003 0.004 0.44 0.009 7 0.0005 0.4400 0.0666 0.1647 0.0616Chromium 0.1 mg/L 0.01 0.01 0.01 0.02 4 0.0100 0.0200 0.0125 0.0050 -0.0875Cyanide 0.2 mg/L 0.01 0.01 0.01 0.004 4 0.0040 0.0100 0.0085 0.0030 -0.1915Fluoride 4 mg/L 0.76 0.92 0.9 1.7 2 1.98 2 7 0.7600 2.0000 1.4657 0.5782 -2.5343Lead 0.015 mg/L 0.005 0.005 0.005 0.04 0.04 0.03 0.054 7 0.0050 0.0540 0.0256 0.0205 0.0106Mercury 0.002 mg/L 0.0002 0.0002 0.0002 0.001 0.0002 0.0027 0.005 7 0.0002 0.0050 0.0014 0.0019 -0.0006Nickel 0.1 mg/L 0.04 0.04 0.04 0.039 4 0.0390 0.0400 0.0398 0.0005 -0.0603Nitrate 10 mg/L 0.11 0.05 0.01 0.01 0.1 0.04 0.06 0.04 8 0.0100 0.1100 0.0525 0.0369 -9.9475Nitrite 1 mg/L 0.05 0.05 0.01 0.01 0.004 5 0.0040 0.0500 0.0248 0.0231 -0.9752Selenium 0.05 mg/L 0.005 0.01 0.01 0.004 4 0.0040 0.0100 0.0073 0.0032 -0.0428Sodium 160 mg/L 1200 1200 1800 1150 2500 945 702 7 702.0 2500.0 1356.7 604.7 1196.7Antimony 0.006 mg/L 0.006 0.006 0.05 0.005 0.03 5 0.0050 0.0500 0.0194 0.0201 0.0134Beryllium 0.004 mg/L 0.002 0.04 0.005 0.002 0.0006 5 0.0006 0.0400 0.0099 0.0169 0.0059Thallium 0.002 mg/L 0.02 0.02 0.01 0.002 4 0.0020 0.0200 0.0130 0.0087 0.0110Secondary AnalysisAluminum 0.2 mg/L 0.2 0.2 0.2 0.2 0.09 3.76 0.96 7 0.0900 3.7600 0.8014 1.3374 0.6014Chloride 250 mg/L 2400 2200 3000 2499 3874 663 1920 1070 8 663.0 3874.0 2203.3 1020.5 1953.3Copper 1 mg/L 0.025 0.025 0.025 0.01 0.002 0.83 0.052 7 0.0020 0.8300 0.1384 0.3054 -0.8616Iron 0.3 mg/L 0.58 0.7 0.71 0.501 5 0.96 140 5.9 8 0.5010 140.0000 19.2939 48.8208 18.9939Manganese 0.05 mg/L 0.049 0.017 0.011 0.017 0.04 0.04 0.055 7 0.0110 0.0550 0.0327 0.0175 -0.0173Silver 0.1 mg/L 0.01 0.01 0.01 0.01 4 0.0100 0.0100 0.0100 0.0000 -0.0900Sulfate 250 mg/L 380 370 260 662 680 280 290 286 8 260.0 680.0 401.0 172.1 151.0Zinc 5 mg/L 0.02 0.026 0.02 0.19 4 0.0200 0.1900 0.0640 0.0840 -4.9360Color 15 PtCo units 10 5 20 12 50 2 2 2 8 2.0000 50.0000 12.8750 16.2783 -2.1250Odor 3 TON 2 4 1 2 4 1.0000 4.0000 2.2500 1.2583 -0.7500pH (units) 6.5-8.5 std units 8.25 8.94 7.72 7.36 5.88 7.8 8.1 7.75 7.8 9 5.8800 8.9400 7.7333 0.8247TDS 500 mg/L 3500 3500 5900 4300 7388 3800 2616 3752 2396 9 2396.0 7388.0 4128.0 1585.9 3628.0Foaming Agents 1.5 mg/L 0.16 0.1 0.15 0.2 0.03 5 0.0300 0.2000 0.1280 0.0653 -1.3720Trihalomethane AnalysisTotal THMs mg/L 1 1 1 0.5 4 0.5000 1.0000 0.8750 0.2500 0.8750Radiological AnalysisGross Alpha pCi/L 30+/-45 9.7+/-21 4.1 3 4.1000 4.1000 4.1000 one data 4.1000Miscellaneous AnalysisAmmonia-N mg/L 0.24 0.05 0.26 0.5 2.28 0.56 6 0.0500 2.2800 0.6483 0.8207 0.6483Nitrogen, total mg/L 2.66 1 2.6600 2.6600 2.6600 one data 2.6600Nitrogen, organic mg/L 0.54 0.1 0.16 1.13 0.28 5 0.1000 1.1300 0.4420 0.4200 0.4420Nitrogen, total Kjeldahl mg/L 0.3 0.35 0.42 1.63 0.69 5 0.3000 1.6300 0.6780 0.5531 0.6780Ortho-phosphate mg/L 0.05 0.1 0.01 0.02 4 0.0100 0.1000 0.0450 0.0404 0.0450Phosphorus, total mg/L 0.01 0.01 0.1 0.03 0.68 0.01 6 0.0100 0.6800 0.1400 0.2668 0.1400BOD mg/L 13 16 2 1 4.5 5 1.0000 16.0000 7.3000 6.7786 7.3000Total Coliform col/100ml 1 1 1 3 1.0000 1.0000 1.0000 0.0000 1.0000Water Temperature ° C 24.1 22.9 23.1 27 4 22.9000 27.0000 24.2750 1.8910 24.2750
Parameter NameStandard
mg/L UnitsNumber of Data
Mean - Reg. StandardMin Max Mean
Standart Deviation
FPL-012-117

Table C7 - ASR with Non-detects at detection limit
ASR 1 ASR 2 ASR 3Inorganic AnalysisArsenic 0.05 mg/L 0.0022 0.01 0.0025 0.0022 0.005 5 0.0022 0.01 0.0044 0.0034 -0.0456Barium 2 mg/L 1.506 0.05 0.376 0.2 0.012 5 0.012 1.506 0.4288 0.6190 -1.5712Cadmium 0.005 mg/L 0.003 0.005 0.003 0.003 0.005 5 0.003 0.005 0.0038 0.0011 -0.0012Chromium 0.1 mg/L 0.02 0.019 0.02 0.02 0.006 5 0.006 0.02 0.0170 0.0062 -0.0830Cyanide 0.2 mg/L 0.006 0.004 0.004 0.004 4 0.004 0.006 0.0045 0.0010 -0.1955Fluoride 4 mg/L 1.44 1.5 1.86 1.8 1.3 5 1.3 1.86 1.5800 0.2404 -2.4200Lead 0.015 mg/L 0.001 0.005 0.0001 0.001 0.01 5 0.0001 0.01 0.0034 0.0041 -0.0116Mercury 0.002 mg/L 0.001 0.001 0.001 0.001 0.0002 5 0.0002 0.001 0.0008 0.0004 -0.0012Nickel 0.1 mg/L 0.01 0.005 0.01 0.01 4 0.005 0.01 0.0088 0.0025 -0.0913Nitrate 10 mg/L 0.01 NA 0.11 0.01 0.02 4 0.01 0.11 0.0375 0.0486 -9.9625Nitrite 1 mg/L 0.01 NA 0.01 0.01 0.02 4 0.01 0.02 0.0125 0.0050 -0.9875Selenium 0.05 mg/L 0.004 0.01 0.002 0.004 0.013 5 0.002 0.013 0.0066 0.0047 -0.0434Sodium 160 mg/L 1827 950 1029 1053 4 950 1827 1214.8 410.5 1054.8Antimony 0.006 mg/L 0.017 0.005 0.005 0.005 4 0.005 0.017 0.0080 0.0060 0.0020Beryllium 0.004 mg/L 0.0003 0.002 0.002 0.002 4 0.0003 0.002 0.0016 0.0009 -0.0024Thallium 0.002 mg/L 0.0006 0.002 0.002 0.002 4 0.0006 0.002 0.0017 0.0007 -0.0004Secondary AnalysisAluminum 0.2 mg/L 0.2 0.05 0.2 0.2 4 0.05 0.2 0.1625 0.0750 -0.0375Chloride 250 mg/L 3524 2000 2449 2349 1920 5 1920 3524 2448.4 641.7 2198.4Copper 1 mg/L 0.011 0.005 0.01 0.023 0.006 5 0.005 0.023 0.0110 0.0072 -0.9890Iron 0.3 mg/L 0.156 4.295 0.343 0.575 0.022 5 0.022 4.295 1.0782 1.8102 0.7782Manganese 0.05 mg/L 0.014 0.165 0.012 0.015 0.02 5 0.012 0.165 0.0452 0.0670 -0.0048Silver 0.1 mg/L 0.01 0.004 0.01 0.01 0.005 5 0.004 0.01 0.0078 0.0030 -0.0922Sulfate 250 mg/L 725 238 615 595 436 5 238 725 521.8 189.2 271.8Zinc 5 mg/L 0.005 0.018 0.065 0.324 0.003 5 0.003 0.324 0.0830 0.1370 -4.9170Color 15 PtCo un 17 10 2 31 0 5 0 31 12.0000 12.5897 -3.0000Odor 3 TON 50 1 2 1 4 1 50 13.5000 24.3379 10.5000pH (units) 6.5-8.5 std units 7.61 6.91 7.12 8.39 7.6 5 6.91 8.39 7.5260 0.5708TDS 500 mg/L 7880 5980 4390 4040 3910 5 3910 7880 5240.0 1691.8 4740.0Foaming Agents 1.5 mg/L 0.04 0.01 0.13 0.18 0.025 5 0.01 0.18 0.0770 0.0741 -1.4230Trihalomethane AnalysisTotal THMs mg/L 0.0017 9.93 0.5 0.5 4 0.0017 9.93 2.7329 4.8038 2.7329Radiological AnalysisGross Alpha pCi/L 30.7 7.8 47 19.3 18.5 5 7.8 47 24.6600 14.8870 24.6600Miscellaneous AnalysisAmmonia-N mg/L 0.68 0.4 0.49 0.73 4 0.4 0.73 0.5750 0.1559 0.5750Nitrogen, total mg/L 0 0 0.0000Nitrogen, organic mg/L 0.19 0.31 0.42 3 0.19 0.42 0.3067 0.1150 0.3067Nitrogen, total Kjeldahl mg/L 0.87 0.71 0.91 3 0.71 0.91 0.8300 0.1058 0.8300Ortho-phosphate mg/L 0.02 0.19 0.2 3 0.02 0.2 0.1367 0.1012 0.1367Phosphorus, total mg/L NA 0.22 0.29 2 0.22 0.29 0.2550 0.0495 0.2550BOD mg/L 1 1.8 1.9 3 1 1.9 1.5667 0.4933 1.5667Total Coliform col/100m 6 1 6 6 6.0000 one data 6.0000Water Temperature ° C 0 0 0.0000
MDWASD - West Wellfield
Parameter NameStandard
mg/L UnitsFive Ash
ASR MeanStandart Deviation
Mean - Reg. Standard
Boynton Beach (Background)
Number of Data Min Max
FPL-012-118

Table C8 - Biscayne Monitoring Zone with Non-detects at detection limit
MW No 1 7622
MW No 2 7623
MW No 3 7624
MW No 4 7625
MW No 5 7626
MW No 6 7627
Water supply well 7628
Water supply well 7692
Water supply well 7693
Water supply well 7694
Raw Comp 14629
13025elclairch 14575
Inorganic AnalysisArsenic 0.05 mg/L 0.0022 0.031 0.029 0.006 0.016 0.012 0.024 0.014 0.051 0.006 0.009 0.0005 0.0005Barium 2 mg/L 1.12 0.0237 0.025Cadmium 0.005 mg/L 0.003 0.002 0.002 0.002 0.002 0.003 0.002 0.002 0.0001 0.0001Chromium 0.1 mg/L 0.02 0.0027 0.002Cyanide 0.2 mg/L 0.006 0.005 0.0005Fluoride 4 mg/L 0.36 0.21 0.16 0.12 0.15 0.17 0.14 0.13 0.13 0.206 0.22Lead 0.015 mg/L 0.004 0.022 0.008 0.008 0.026 0.018 0.012 0.01 0.0012 0.001Mercury 0.002 mg/L 0.001 0.0002 0.0002 0.0002 0.0002 0.0002 0.0002 0.0002 0.0002 0.00217Nickel 0.1 mg/L 0.01 0.0011 0.000849Nitrate 10 mg/L 0.01 0.06 0.07 1.45 0.05 0.13 0.06 0.02 0.5 0.1 0.18 0.0536 0.159Nitrite 1 mg/L 0.01 0.01 0.01Selenium 0.05 mg/L 0.004 0.0005 0.0005Sodium 160 mg/L 15.9 65 149 77.5 77 102 151 153 23.1 25.3Antimony 0.006 mg/L 0.0017 0.003 0.003Beryllium 0.004 mg/L 0.0003 0.0002 0.0002Thallium 0.002 mg/L 0.0006 0.001 0.001Secondary AnalysisAluminum 0.2 mg/L 3.44 0.15 0.24 0.2 1.36 0.288 2.9 1.24 0.036 0.185 0.057Chloride 250 mg/L 24 32 97 250 135 112 165 233 251 187 279 417 47.3 75.4Copper 1 mg/L 0.008 0.01 0.006 0.005 0.007 0.005 0.011 0.006 0.004 0.0011 0.00437Iron 0.3 mg/L 0.642 0.35 0.23 0.224 0.77 0.27 2.12 0.384 0.3 0.0808 0.001Manganese 0.05 mg/L 0.049 0.01 0.01 0.016 0.011 0.016 0.037 0.005 0.012 0.0044 0.00258Silver 0.1 mg/L 0.01 0.01 0.0064 0.0002Sulfate 250 mg/L 21 38 37 42 99 71 32 34 48 52 46 61 1 1Zinc 5 mg/L 0.011 0.11 0.0046 0.001Color 15 PtCo un 3 25 15 20 25 10 30 3 13 45 40Odor 3 TON 1 1 1 1pH (units) 6.5-8.5 std units 7.74 7.2 7.9 7.6 7.84 7.95 7.8 11.7 8 7.9 7.85 6.76 7.13TDS 500 mg/L 279 340 598 814 696 532 630 640 844 354 396Foaming Agents 1.5 mg/L 0.02 0.1 0.1 0.1Trihalomethane AnalysisTotal THMs mg/L 0.001 0.0397Radiological AnalysisGross Alpha pCi/L 10.7Miscellaneous AnalysisAmmonia-N mg/LNitrogen, total mg/LNitrogen, organic mg/LNitrogen, total Kjeldahl mg/LOrtho-phosphate mg/LPhosphorus, total mg/LBOD mg/LTotal Coliform col/100mlWater Temperature ° C 24 24 24 24 24 24 24 25 25.5 25
MDWASD S WWTP Biscayne Wells
Parameter NameStandard
mg/L Units
Five Ash Broward
Co.City of
Hollywood
West Palm Beac
FPL-012-119
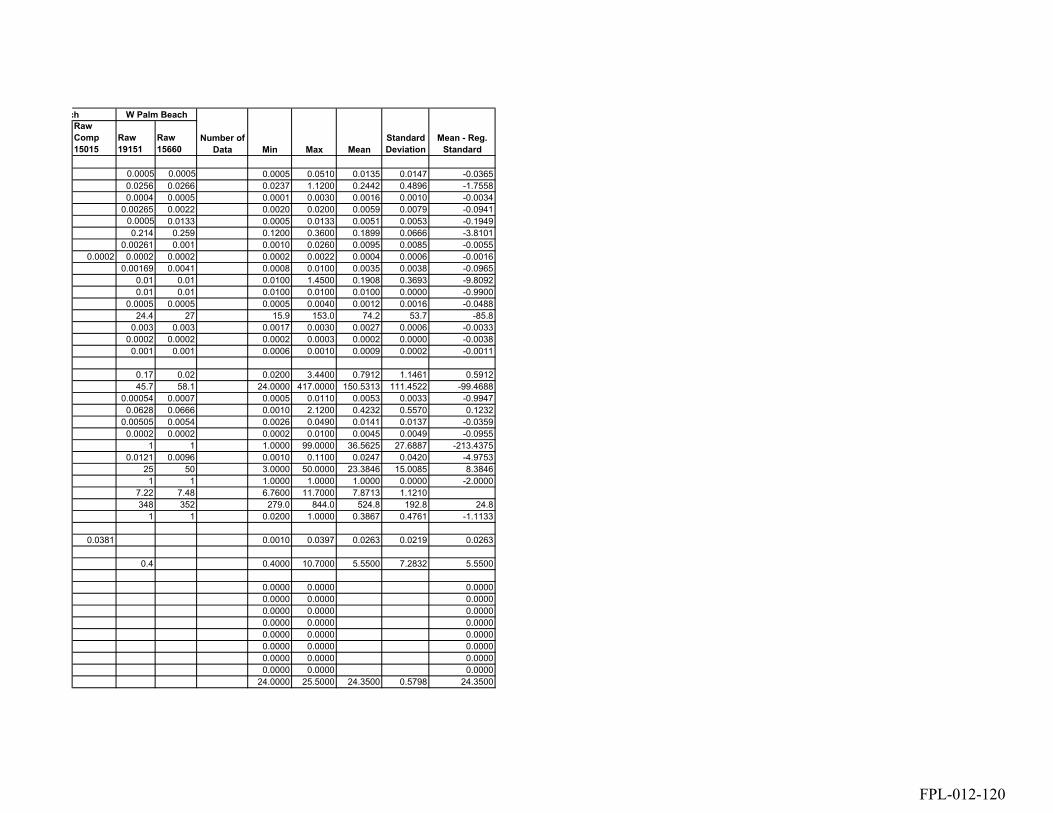
Raw Comp 15015
Raw 19151
Raw 15660
0.0005 0.0005 0.0005 0.0510 0.0135 0.0147 -0.03650.0256 0.0266 0.0237 1.1200 0.2442 0.4896 -1.75580.0004 0.0005 0.0001 0.0030 0.0016 0.0010 -0.0034
0.00265 0.0022 0.0020 0.0200 0.0059 0.0079 -0.09410.0005 0.0133 0.0005 0.0133 0.0051 0.0053 -0.19490.214 0.259 0.1200 0.3600 0.1899 0.0666 -3.8101
0.00261 0.001 0.0010 0.0260 0.0095 0.0085 -0.00550.0002 0.0002 0.0002 0.0002 0.0022 0.0004 0.0006 -0.0016
0.00169 0.0041 0.0008 0.0100 0.0035 0.0038 -0.09650.01 0.01 0.0100 1.4500 0.1908 0.3693 -9.80920.01 0.01 0.0100 0.0100 0.0100 0.0000 -0.9900
0.0005 0.0005 0.0005 0.0040 0.0012 0.0016 -0.048824.4 27 15.9 153.0 74.2 53.7 -85.8
0.003 0.003 0.0017 0.0030 0.0027 0.0006 -0.00330.0002 0.0002 0.0002 0.0003 0.0002 0.0000 -0.00380.001 0.001 0.0006 0.0010 0.0009 0.0002 -0.0011
0.17 0.02 0.0200 3.4400 0.7912 1.1461 0.591245.7 58.1 24.0000 417.0000 150.5313 111.4522 -99.4688
0.00054 0.0007 0.0005 0.0110 0.0053 0.0033 -0.99470.0628 0.0666 0.0010 2.1200 0.4232 0.5570 0.1232
0.00505 0.0054 0.0026 0.0490 0.0141 0.0137 -0.03590.0002 0.0002 0.0002 0.0100 0.0045 0.0049 -0.0955
1 1 1.0000 99.0000 36.5625 27.6887 -213.43750.0121 0.0096 0.0010 0.1100 0.0247 0.0420 -4.9753
25 50 3.0000 50.0000 23.3846 15.0085 8.38461 1 1.0000 1.0000 1.0000 0.0000 -2.0000
7.22 7.48 6.7600 11.7000 7.8713 1.1210348 352 279.0 844.0 524.8 192.8 24.8
1 1 0.0200 1.0000 0.3867 0.4761 -1.1133
0.0381 0.0010 0.0397 0.0263 0.0219 0.0263
0.4 0.4000 10.7000 5.5500 7.2832 5.5500
0.0000 0.0000 0.00000.0000 0.0000 0.00000.0000 0.0000 0.00000.0000 0.0000 0.00000.0000 0.0000 0.00000.0000 0.0000 0.00000.0000 0.0000 0.00000.0000 0.0000 0.0000
24.0000 25.5000 24.3500 0.5798 24.3500
Standard Deviation
Mean - Reg. Standard
W Palm Beachch
Number of Data Min Max Mean
FPL-012-120
85
APPENDIX D. DATA AND ANALYSIS OF VOLATILE ORGANIC COMPOUNDS AND SYNTHETIC ORGANIC COMPOUNDS
FPL-012-121
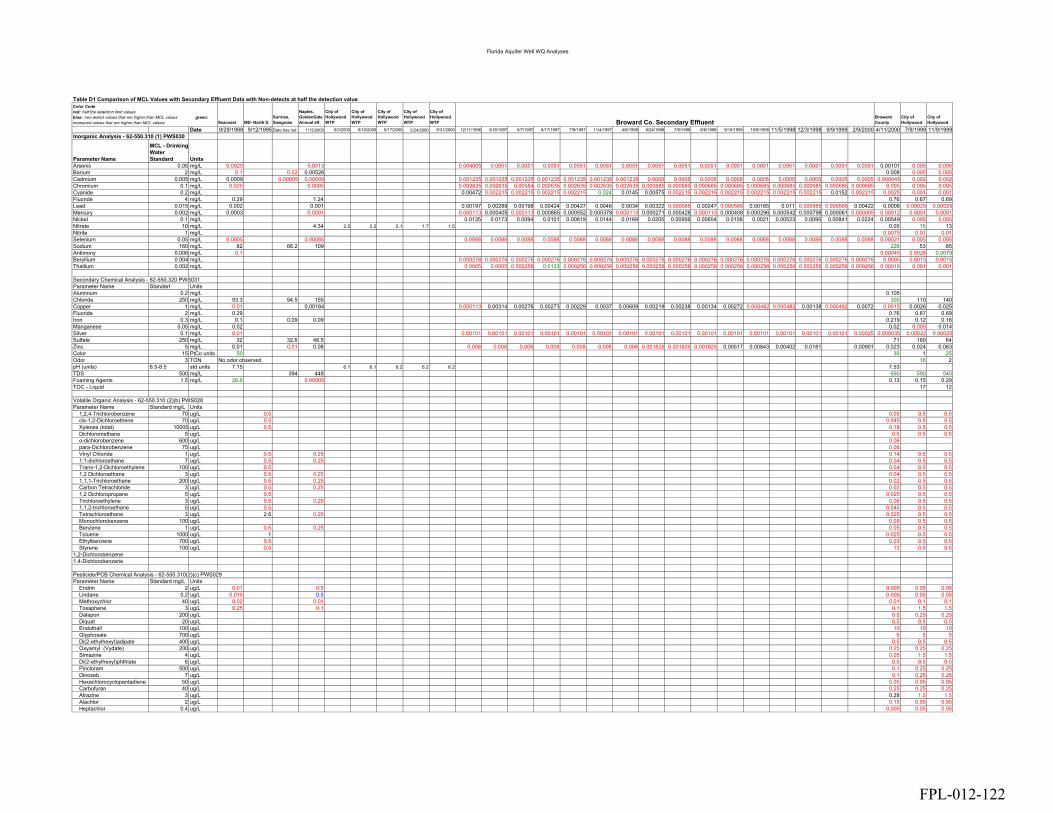
Florida Aquifer Well WQ Analyses
Table D1 Comparison of MCL Values with Secondary Effluent Data with Non-detects at half the detection value
Seacoast MD- North D.Sunrise, Sawgrass
Naples, GoldenGate Annual eff.
City of Hollywood WTP
City of Hollywood WTP
City of Hollywood WTP
City of Hollywood WTP
City of Hollywood WTP
Broward County
City of Hollywood
City of Hollywood
Date 9/29/1988 9/12/1995 Date has not b 1/13/2000 5/3/2000 5/10/2000 5/17/2000 5/24/2000 5/31/2000 12/11/1996 3/18/1997 5/7/1997 6/17/1997 7/9/1997 11/4/1997 4/8/1998 6/24/1998 7/9/1998 8/6/1998 9/10/1998 10/8/1998 11/5/1998 12/3/1998 9/9/1999 2/9/2000 4/11/2000 7/9/1999 11/9/1999Inorganic Analysis - 62-550.310 (1) PWS030
Parameter Name
MCL - Drinking Water Standard Units
Arsenic 0.05 mg/L 0.0025 0.0013 0.004005 0.0051 0.0051 0.0051 0.0051 0.0051 0.0051 0.0051 0.0051 0.0051 0.0051 0.0051 0.0051 0.0051 0.0051 0.0051 0.00101 0.005 0.005Barium 2 mg/L 0.1 0.02 0.00526 0.008 0.005 0.005Cadmium 0.005 mg/L 0.0009 0.00005 0.00009 0.001235 0.001235 0.001235 0.001235 0.001235 0.001235 0.001235 0.0005 0.0005 0.0005 0.0005 0.0005 0.0005 0.0005 0.0005 0.0005 0.000045 0.002 0.002Chromium 0.1 mg/L 0.025 0.0005 0.002635 0.002635 0.00584 0.002635 0.002635 0.002635 0.002635 0.000685 0.000685 0.000685 0.000685 0.000685 0.000685 0.000685 0.000685 0.000685 0.005 0.005 0.005Cyanide 0.2 mg/L 0.00472 0.002215 0.002215 0.002215 0.002215 0.024 0.0145 0.00575 0.002215 0.002215 0.002215 0.002215 0.002215 0.002215 0.0152 0.002215 0.0025 0.001 0.001Fluoride 4 mg/L 0.29 1.24 0.76 0.67 0.69Lead 0.015 mg/L 0.002 0.001 0.00197 0.00289 0.00198 0.00424 0.00427 0.0046 0.0034 0.00322 0.000565 0.00247 0.000565 0.00165 0.011 0.000565 0.000565 0.00422 0.0008 0.00025 0.00025Mercury 0.002 mg/L 0.0003 0.0001 0.000113 0.000405 0.000113 0.000865 0.000552 0.000378 0.000113 0.000271 0.000428 0.000113 0.000408 0.000296 0.000542 0.000798 0.000061 0.000005 0.00012 0.0001 0.0001Nickel 0.1 mg/L 0.0135 0.0173 0.0094 0.0101 0.00819 0.0144 0.0169 0.0205 0.00956 0.00654 0.0158 0.0021 0.00523 0.0095 0.00841 0.0224 0.00549 0.005 0.005Nitrate 10 mg/L 4.34 2.5 2.2 2.1 1.7 1.5 0.05 15 13Nitrite 1 mg/L 0.0075 0.01 0.01Selenium 0.05 mg/L 0.0005 0.00085 0.0088 0.0088 0.0088 0.0088 0.0088 0.0088 0.0088 0.0088 0.0088 0.0088 0.0088 0.0088 0.0088 0.0088 0.0088 0.0088 0.00021 0.005 0.005Sodium 160 mg/L 82 66.2 109 226 53 85Antimony 0.006 mg/L 0.1 0.00045 0.0025 0.0079Beryllium 0.004 mg/L 0.000276 0.000276 0.000276 0.000276 0.000276 0.000276 0.000276 0.000276 0.000276 0.000276 0.000276 0.000276 0.000276 0.000276 0.000276 0.000276 0.0005 0.0015 0.0015Thallium 0.002 mg/L 0.0005 0.0005 0.000256 0.0133 0.000256 0.000256 0.000256 0.000256 0.000256 0.000256 0.000256 0.000256 0.000256 0.000256 0.000256 0.000256 0.00016 0.001 0.001
Secondary Chemical Analysis - 62-550.320 PWS031Parameter Name Standart UnitsAluminum 0.2 mg/L 0.105Chloride 250 mg/L 93.3 94.5 155 300 110 140Copper 1 mg/L 0.01 0.00184 0.000113 0.00314 0.00276 0.00273 0.00229 0.0037 0.00609 0.00219 0.00238 0.00134 0.00272 0.000482 0.000482 0.00138 0.000482 0.0072 0.0015 0.0026 0.025Fluoride 2 mg/L 0.29 0.76 0.67 0.69Iron 0.3 mg/L 0.1 0.09 0.09 0.219 0.12 0.16Manganese 0.05 mg/L 0.02 0.02 0.005 0.014Silver 0.1 mg/L 0.01 0.00101 0.00101 0.00101 0.00101 0.00101 0.00101 0.00101 0.00101 0.00101 0.00101 0.00101 0.00101 0.00101 0.00101 0.00101 0.00025 0.000035 0.00022 0.00025Sulfate 250 mg/L 32 32.6 48.5 71 160 64Zinc 5 mg/L 0.01 0.01 0.08 0.008 0.008 0.008 0.008 0.008 0.008 0.008 0.001825 0.001825 0.001825 0.00517 0.00843 0.00402 0.0181 0.00901 0.023 0.024 0.063Color 15 PtCo units 50 30 1 25Odor 3 TON No odor observed 16 2pH (units) 6.5-8.5 std units 7.15 6.1 6.1 6.2 6.2 6.2 7.53TDS 500 mg/L 394 448 690 590 540Foaming Agents 1.5 mg/L 26.6 0.00005 0.13 0.15 0.29TOC - Liquid 17 12
Volatile Organic Analysis - 62-550.310 (2)(b) PWS028Parameter Name Standard mg/L Units 1,2,4-Trichlorobenzene 70 ug/L 0.5 0.05 0.5 0.5 cis-1,2-Dichloroethene 70 ug/L 0.5 0.045 0.5 0.5 Xylenes (total) 10000 ug/L 0.5 0.18 0.5 0.5 Dichloromethane 5 ug/L 0.5 0.5 0.5 o-dichlorobenzene 600 ug/L 0.06 para-Dichlorobenzene 75 ug/L 0.06 Vinyl Chloride 1 ug/L 0.5 0.25 0.14 0.5 0.5 1,1-dichloroethane 7 ug/L 0.5 0.25 0.04 0.5 0.5 Trans-1,2-Dichloroethylene 100 ug/L 0.5 0.04 0.5 0.5 1,2 Dichloroethane 3 ug/L 0.5 0.25 0.04 0.5 0.5 1,1,1-Trichloroethane 200 ug/L 0.5 0.25 0.02 0.5 0.5 Carbon Tetrachloride 3 ug/L 0.5 0.25 0.02 0.5 0.5 1,2 Dichloropropane 5 ug/L 0.5 0.025 0.5 0.5 Trichloroethylene 3 ug/L 0.5 0.25 0.06 0.5 0.5 1,1,2-trichloroethane 5 ug/L 0.5 0.045 0.5 0.5 Tetrachloroethene 3 ug/L 2.6 0.25 0.025 0.5 0.5 Monochlorobenzene 100 ug/L 0.09 0.5 0.5 Benzene 1 ug/L 0.5 0.25 0.05 0.5 0.5 Toluene 1000 ug/L 1 0.025 0.5 0.5 Ethylbenzene 700 ug/L 0.5 0.03 0.5 0.5 Styrene 100 ug/L 0.5 13 0.5 0.51,2-Dichlorobenzene1,4-Dichlorobenzene
Pesticide/PCB Chemical Analysis - 62-550.310(2)(c) PWS029Parameter Name Standard mg/L Units Endrin 2 ug/L 0.01 0.5 0.005 0.05 0.05 Lindane 0.2 ug/L 0.015 0.5 0.005 0.05 0.05 Methoxychlor 40 ug/L 0.02 0.01 0.01 0.1 0.1 Toxaphene 3 ug/L 0.25 0.1 0.1 1.5 1.5 Dalapon 200 ug/L 0.5 0.25 0.25 Diquat 20 ug/L 0.5 0.5 0.5 Endothall 100 ug/L 10 10 10 Glyphosate 700 ug/L 5 5 5 Di(2-ethylhexyl)adipate 400 ug/L 0.5 0.5 0.5 Oxyamyl (Vydate) 200 ug/L 0.25 0.25 0.25 Simazine 4 ug/L 0.05 1.5 1.5 Di(2-ethylhexyl)phthlate 6 ug/L 0.5 0.5 0.5 Pincloram 500 ug/L 0.1 0.25 0.25 Dinoseb 7 ug/L 0.1 0.25 0.25 Hexachlorocyclopentadiene 50 ug/L 0.05 0.05 0.05 Carbofuran 40 ug/L 0.25 0.25 0.25 Atrazine 3 ug/L 0.28 1.5 1.5 Alachlor 2 ug/L 0.15 0.05 0.05 Heptachlor 0.4 ug/L 0.005 0.05 0.05
Broward Co. Secondary Effluent
Color Code red: half the detection limit values blue: non-detect values that are higher than MCL values green: measured values that are higher than MCL values
FPL-012-122

Florida Aquifer Well WQ Analyses
Seacoast MD- North D.Sunrise, Sawgrass
Naples, GoldenGate Annual eff.
City of Hollywood WTP
City of Hollywood WTP
City of Hollywood WTP
City of Hollywood WTP
City of Hollywood WTP
Broward County
City of Hollywood
City of Hollywood
Date 9/29/1988 9/12/1995 Date has not b 1/13/2000 5/3/2000 5/10/2000 5/17/2000 5/24/2000 5/31/2000 12/11/1996 3/18/1997 5/7/1997 6/17/1997 7/9/1997 11/4/1997 4/8/1998 6/24/1998 7/9/1998 8/6/1998 9/10/1998 10/8/1998 11/5/1998 12/3/1998 9/9/1999 2/9/2000 4/11/2000 7/9/1999 11/9/1999 Heptachlor epoxide 0.2 ug/L 0.005 0.05 0.05 2,4-D 70 ug/L 18.5 0.25 0.25 0.25 0.25 2,4, 5-TP (Silvex) 50 ug/L 28.5 0.025 0.025 0.05 0.05 Hexachlorobenzene 1 ug/L 0.005 0.05 0.05 Benzo (a) pyrene 0.2 ug/L 0.005 0.1 0.1 Pentachlorophenol 1 ug/L 0.025 0.025 0.025 PCB 0.5 ug/L 0.25 Dibromochloropropane 0.2 ug/L 0.005 0.01 0.01 Ethylene Dibromide 0.02 ug/L 0.01 0.01 0.01 Chlordane 2 ug/L 0.025 0.25 0.25
Trihalomethane Analysis - 62-550.310(2)(a) PWS027Parameter Name Standard mg/L UnitsChloroform mg/L 0.16 0.032Bromodichloromethane mg/L 0.035 0.02Dibromochloromethane mg/L 0.0089 0.007Bromoform mg/L 0.00025 0.0023Total THMs mg/L 0.064 0.222 0.0613
Radiochemical Analysis - 62-550.310(5) PWS033Parameter Name Standart UnitsGross Alpha pCi/L 13.7+/-0.7Radium 226 pCi/L 0.3+0.09 0.3+/-0.1 0.2+/-0.05Radium 228 pCi/L 1.3+0.8 0.5+/-0.7 0.0+/-0.5
Unregulated Group I Analysis - 62-550.405 PWS035Parameter Name Standart UnitsCarbaryl ug/LMethomyl ug/LAldicarb Sulfoxide ug/LAldicarb Sulfone ug/LMetolachlor ug/LAldicarb ug/L3-Hydroxycarbofuran ug/LPropachlor ug/LAldrin ug/LDieldrin ug/LDicamba ug/LMetribuzin ug/LButachlor ug/L
Unregulated Group II Analysis - 62-550.410 PWS034Parameter Name Standart Units Chloromethane ug/L 0.5 Dichlorodiflouromethane ug/L 0.5 Bromomethane ug/L 0.5 Chloroethane ug/L 0.5 Trichloroflouromethane ug/L 0.5 Methyl-Tert-Butyl-Ether ug/L 0.5 Dibromomethane ug/L 0.5 1,1-Dichloropropylene ug/L 0.5 1,3 Dichloropropane ug/L 0.5 1,3-Dichloropropene ug/L 0.5 1,2,3 Trichloropropane ug/L 0.5 2,2 Dichloropropane ug/L Chloroform ug/L 5 Bromoform ug/L 0.5 Bromodichloromethane ug/L 0.5 Dibromochloromethane ug/L 0.5 o-chlorotoluene ug/L 0.5 p-chlorotoluene ug/L 0.5 m-dichlorobenzene ug/L 1,1-dichloroethane ug/L 1,1,1,2 Tetrachloroethane ug/L 0.5 1,1,2,2-tetrachloroethane ug/L 0.5 Bromobenzene ug/L 0.5
Unregulated Group III Analysis - 62-550.415 PWS036&0347Parameter Name Standart UnitsIsophrone ug/L2,4-Dinitrotoluene ug/LDimethylphthalate ug/LDiethylphthalate ug/LDi-n-Butylphthalate ug/LButyl benzyl phthalate ug/LDi-n-octylphthalate ug/L2-Chlorophenol ug/L2-Methyl-4,6-dinitrophenol ug/LPhenol ug/L2,4,6-Trichlorophenol ug/L
EPA 608Parameter Name Standart UnitA-BHC ug/LB-BHC ug/LD-BHC ug/LG-BHC (Lindane) ug/LHeptachlor ug/L
Color Code red: half the detection limit values blue: non-detect values that are higher than MCL values green: measured values that are higher than MCL values Broward Co. Secondary Effluent
FPL-012-123
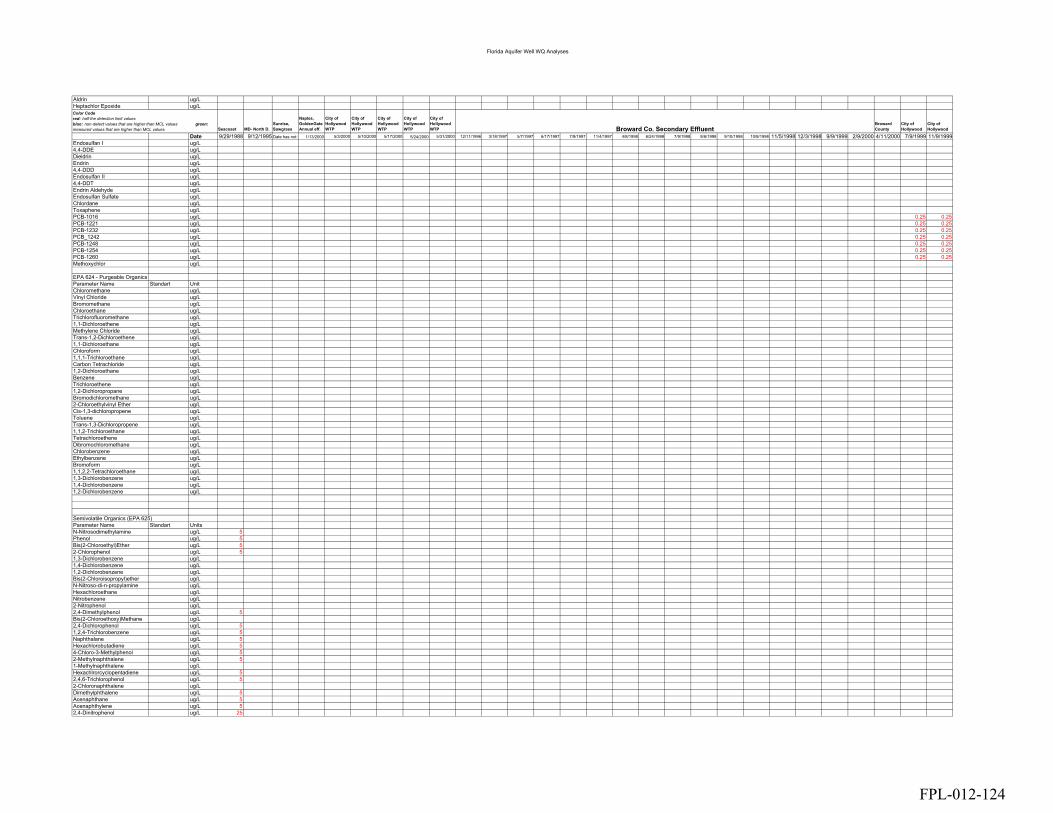
Florida Aquifer Well WQ Analyses
Aldrin ug/LHeptachlor Epoxide ug/L
Seacoast MD- North D.Sunrise, Sawgrass
Naples, GoldenGate Annual eff.
City of Hollywood WTP
City of Hollywood WTP
City of Hollywood WTP
City of Hollywood WTP
City of Hollywood WTP
Broward County
City of Hollywood
City of Hollywood
Date 9/29/1988 9/12/1995 Date has not b 1/13/2000 5/3/2000 5/10/2000 5/17/2000 5/24/2000 5/31/2000 12/11/1996 3/18/1997 5/7/1997 6/17/1997 7/9/1997 11/4/1997 4/8/1998 6/24/1998 7/9/1998 8/6/1998 9/10/1998 10/8/1998 11/5/1998 12/3/1998 9/9/1999 2/9/2000 4/11/2000 7/9/1999 11/9/1999Endosulfan I ug/L4,4-DDE ug/LDieldrin ug/LEndrin ug/L4,4-DDD ug/LEndosulfan II ug/L4,4-DDT ug/LEndrin Aldehyde ug/LEndosulfan Sulfate ug/LChlordane ug/LToxaphene ug/LPCB-1016 ug/L 0.25 0.25PCB-1221 ug/L 0.25 0.25PCB-1232 ug/L 0.25 0.25PCB_1242 ug/L 0.25 0.25PCB-1248 ug/L 0.25 0.25PCB-1254 ug/L 0.25 0.25PCB-1260 ug/L 0.25 0.25Methoxychlor ug/L
EPA 624 - Purgeable OrganicsParameter Name Standart UnitChloromethane ug/LVinyl Chloride ug/LBromomethane ug/LChloroethane ug/LTrichlorofluoromethane ug/L1,1-Dichloroethene ug/LMethylene Chloride ug/LTrans-1,2-Dichloroethene ug/L1,1-Dichloroethane ug/LChloroform ug/L1,1,1-Trichloroethane ug/LCarbon Tetrachloride ug/L1,2-Dichloroethane ug/LBenzene ug/LTrichloroethene ug/L1,2-Dichloropropane ug/LBromodichloromethane ug/L2-Chloroethylvinyl Ether ug/LCis-1,3-dichloropropene ug/LToluene ug/LTrans-1,3-Dichloropropene ug/L1,1,2-Trichloroethane ug/LTetrachloroethene ug/LDibromochloromethane ug/LChlorobenzene ug/LEthylbenzene ug/LBromoform ug/L1,1,2,2-Tetrachloroethane ug/L1,3-Dichlorobenzene ug/L1,4-Dichlorobenzene ug/L1,2-Dichlorobenzene ug/L
Semivolatile Organics (EPA 625)Parameter Name Standart UnitsN-Nitrosodimethylamine ug/L 5Phenol ug/L 5Bis(2-Chloroethyl)Ether ug/L 52-Chlorophenol ug/L 51,3-Dichlorobenzene ug/L1,4-Dichlorobenzene ug/L1,2-Dichlorobenzene ug/LBis(2-Chloroisopropyl)ether ug/LN-Nitroso-di-n-propylamine ug/LHexachloroethane ug/LNitrobenzene ug/L2-Nitrophenol ug/L2,4-Dimethylphenol ug/L 5Bis(2-Chloroethoxy)Methane ug/L2,4-Dichlorophenol ug/L 51,2,4-Trichlorobenzene ug/L 5Naphthalane ug/L 5Hexachlorobutadiene ug/L 54-Chloro-3-Methylphenol ug/L 52-Methylnaphthalene ug/L 51-Methylnaphthalene ug/LHexachlrorcyclopentadiene ug/L 52,4,6-Trichlorophenol ug/L 52-Chloronaphthalene ug/LDimethylphthalene ug/L 5Acenaphthane ug/L 5Acenaphthylene ug/L 52,4-Dinitrophenol ug/L 25
Color Code red: half the detection limit values blue: non-detect values that are higher than MCL values green: measured values that are higher than MCL values Broward Co. Secondary Effluent
FPL-012-124
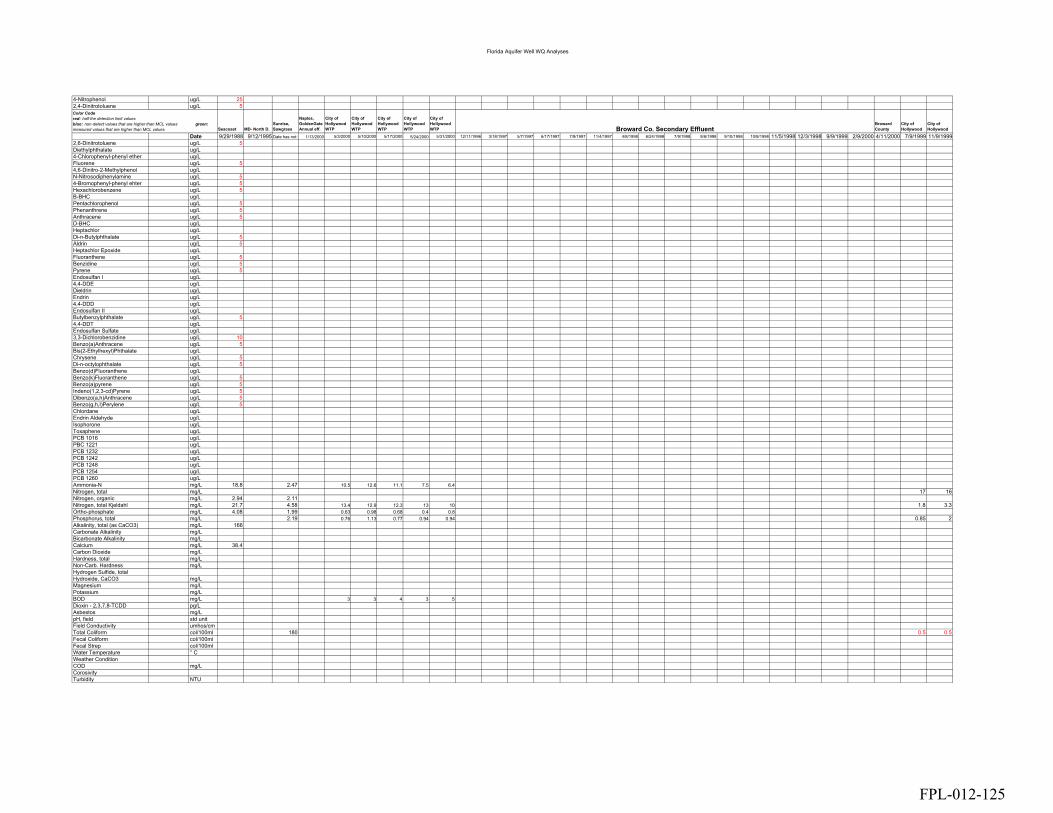
Florida Aquifer Well WQ Analyses
4-Nitrophenol ug/L 252,4-Dinitrotoluene ug/L 5
Seacoast MD- North D.Sunrise, Sawgrass
Naples, GoldenGate Annual eff.
City of Hollywood WTP
City of Hollywood WTP
City of Hollywood WTP
City of Hollywood WTP
City of Hollywood WTP
Broward County
City of Hollywood
City of Hollywood
Date 9/29/1988 9/12/1995 Date has not b 1/13/2000 5/3/2000 5/10/2000 5/17/2000 5/24/2000 5/31/2000 12/11/1996 3/18/1997 5/7/1997 6/17/1997 7/9/1997 11/4/1997 4/8/1998 6/24/1998 7/9/1998 8/6/1998 9/10/1998 10/8/1998 11/5/1998 12/3/1998 9/9/1999 2/9/2000 4/11/2000 7/9/1999 11/9/19992,6-Dinitrotoluene ug/L 5Diethylphthalate ug/L4-Chlorophenyl-phenyl ether ug/LFluorene ug/L 54,6-Dinitro-2-Methylphenol ug/LN-Nitrosodiphenylamine ug/L 54-Bromophenyl-phenyl ehter ug/L 5Hexachlorobenzene ug/L 5B-BHC ug/LPentachlorophenol ug/L 5Phenanthrene ug/L 5Anthracene ug/L 5D-BHC ug/LHeptachlor ug/LDi-n-Butylphthalate ug/L 5Aldrin ug/L 5Heptachlor Epoxide ug/LFluoranthene ug/L 5Benzidine ug/L 5Pyrene ug/L 5Endosulfan I ug/L4,4-DDE ug/LDieldrin ug/LEndrin ug/L4,4-DDD ug/LEndosulfan II ug/LButylbenzylphthalate ug/L 54,4-DDT ug/LEndosulfan Sulfate ug/L3,3-Dichlorobenzidine ug/L 10Benzo(a)Anthracene ug/L 5Bis(2-Ethylhexyl)Phthalate ug/LChrysene ug/L 5Di-n-octylophthalate ug/L 5Benzo(d)Fluoranthene ug/LBenzo(k)Fluoranthene ug/L 5Benzo(a)pyrene ug/L 5Indeno(1,2,3-cd)Pyrene ug/L 5Dibenzo(a,h)Anthracene ug/L 5Benzo(g,h,I)Perylene ug/L 5Chlordane ug/LEndrin Aldehyde ug/LIsophorone ug/LToxaphene ug/LPCB 1016 ug/LPBC 1221 ug/LPCB 1232 ug/LPCB 1242 ug/LPCB 1248 ug/LPCB 1254 ug/LPCB 1260 ug/LAmmonia-N mg/L 18.8 2.47 10.5 12.6 11.1 7.5 6.4Nitrogen, total mg/L 17 16Nitrogen, organic mg/L 2.94 2.11Nitrogen, total Kjeldahl mg/L 21.7 4.58 13.4 12.9 12.3 13 10 1.8 3.3Ortho-phosphate mg/L 4.08 1.99 0.63 0.98 0.68 0.4 0.8Phosphorus, total mg/L 2.19 0.76 1.13 0.77 0.94 0.94 0.85 2Alkalinity, total (as CaCO3) mg/L 166Carbonate Alkalinity mg/LBicarbonate Alkalinity mg/LCalcium mg/L 38.4Carbon Dioxide mg/LHardness, total mg/LNon-Carb. Hardness mg/LHydrogen Sulfide, totalHydroxide, CaCO3 mg/LMagnesium mg/LPotassium mg/LBOD mg/L 3 3 4 3 5Dioxin - 2,3,7,8-TCDD pg/LAsbestos mg/LpH, field std unitField Conductivity umhos/cmTotal Coliform col/100ml 180 0.5 0.5Fecal Coliform col/100mlFecal Strep col/100mlWater Temperature ° CWeather ConditionCOD mg/LCorosivityTurbidity NTU
Color Code red: half the detection limit values blue: non-detect values that are higher than MCL values green: measured values that are higher than MCL values Broward Co. Secondary Effluent
FPL-012-125

Florida Aquifer Well WQ Analyses
Table D1 Comparison of MCL Values with Secondary Effluent Data with Non-detects at half the detection value
City of Hollywood
City of Hollywood
MD-South D.
Broward County
Date 4/17/2000 7/10/2000 3/19/1999 3/18/1997Inorganic Analysis - 62-550.310 (1) PWS030
Parameter Name
MCL - Drinking Water Standard Units
Arsenic 0.05 mg/L 0.005 0.005 0.005 0.005Barium 2 mg/L 0.005 0.005 0.025Cadmium 0.005 mg/L 0.002 0.002 0.0025 0.001235Chromium 0.1 mg/L 0.005 0.005 0.0025 0.002635Cyanide 0.2 mg/L 0.001 0.001 0.002Fluoride 4 mg/L 0.67 0.61 0.75Lead 0.015 mg/L 0.00025 0.00025 0.0025 0.00289Mercury 0.002 mg/L 0.001 0.0001 0.0005 0.00405Nickel 0.1 mg/L 0.005 0.005 0.0025 0.0173Nitrate 10 mg/L 9.1 6.5 0.64Nitrite 1 mg/L 0.01 0.01 0.025Selenium 0.05 mg/L 0.005 0.005 0.005 0.0088Sodium 160 mg/L 69 66 181Antimony 0.006 mg/L 0.0025 0.0025 0.0025 0.00361Beryllium 0.004 mg/L 0.0015 0.0015 0.001 0.000551Thallium 0.002 mg/L 0.001 0.001 0.001 0.0005
Secondary Chemical Analysis - 62-550.320 PWS031Parameter Name Standart UnitsAluminum 0.2 mg/L 0.05Chloride 250 mg/L 130 218Copper 1 mg/L 0.0001 0.0035 0.005 0.00314Fluoride 2 mg/L 0.67 0.61 0.75Iron 0.3 mg/L 0.28 0.16 0.209Manganese 0.05 mg/L 0.022 0.019 0.025Silver 0.1 mg/L 0.00025 0.00025 0.0005Sulfate 250 mg/L 120 190 71.9Zinc 5 mg/L 0.032 0.016 0.02 0.008Color 15 PtCo units 30 40 50Odor 3 TON 1 8 75pH (units) 6.5-8.5 std units 7 6.2 6.93TDS 500 mg/L 550 690 610Foaming Agents 1.5 mg/L 0.01 0.025 0.063TOC - Liquid 17 16
Volatile Organic Analysis - 62-550.310 (2)(b) PWS028Parameter Name Standard mg/L Units 1,2,4-Trichlorobenzene 70 ug/L 0.5 0.5 0.25 0.53 cis-1,2-Dichloroethene 70 ug/L 0.5 0.5 0.25 Xylenes (total) 10000 ug/L 0.5 0.5 0.25 Dichloromethane 5 ug/L 0.5 0.5 0.25 o-dichlorobenzene 600 ug/L para-Dichlorobenzene 75 ug/L Vinyl Chloride 1 ug/L 0.5 0.5 0.25 0.0545 1,1-dichloroethane 7 ug/L 0.5 0.5 0.25 0.0102 Trans-1,2-Dichloroethylene 100 ug/L 0.5 0.5 0.25 0.0085 1,2 Dichloroethane 3 ug/L 0.5 0.5 0.25 0.0175 1,1,1-Trichloroethane 200 ug/L 0.5 0.5 0.25 0.027 Carbon Tetrachloride 3 ug/L 0.5 0.5 0.25 6.42 1,2 Dichloropropane 5 ug/L 0.5 0.5 0.25 0.012 Trichloroethylene 3 ug/L 0.5 0.5 0.25 0.0075 1,1,2-trichloroethane 5 ug/L 0.5 0.5 0.25 0.0175 Tetrachloroethene 3 ug/L 0.5 0.5 0.25 0.165 Monochlorobenzene 100 ug/L 0.5 0.5 0.25 0.012 Benzene 1 ug/L 0.5 0.5 0.25 0.005 Toluene 1000 ug/L 0.5 0.5 0.25 0.095 Ethylbenzene 700 ug/L 0.5 0.5 0.25 0.0125 Styrene 100 ug/L 0.5 0.5 0.251,2-Dichlorobenzene 0.021,4-Dichlorobenzene 0.88
Pesticide/PCB Chemical Analysis - 62-550.310(2)(c) PWS029Parameter Name Standard mg/L Units Endrin 2 ug/L 0.05 0.05 0.005 0.995 Lindane 0.2 ug/L 0.05 0.05 0.005 Methoxychlor 40 ug/L 0.1 0.1 0.005 Toxaphene 3 ug/L 1.5 1.5 0.005 Dalapon 200 ug/L 0.25 0.25 0.65 Diquat 20 ug/L 0.5 0.5 0.25 Endothall 100 ug/L 10 10 5 Glyphosate 700 ug/L 5 5 5 Di(2-ethylhexyl)adipate 400 ug/L 0.5 0.5 2.5 Oxyamyl (Vydate) 200 ug/L 0.25 0.25 25 Simazine 4 ug/L 1.5 1.5 0.25 Di(2-ethylhexyl)phthlate 6 ug/L 0.5 0.5 2.5 0.407 Pincloram 500 ug/L 0.25 0.25 0.1 Dinoseb 7 ug/L 0.25 0.25 0.1 Hexachlorocyclopentadiene 50 ug/L 0.05 0.05 0.005 0.298 Carbofuran 40 ug/L 0.25 0.25 5 Atrazine 3 ug/L 1.5 1.5 0.1 Alachlor 2 ug/L 0.05 0.05 0.005 Heptachlor 0.4 ug/L 0.05 0.05 0.005 0.84
Color Code red: half the detection limit values blue: non-detect values that are higher than MCL values green: measured values that are higher than MCL values
FPL-012-126

Florida Aquifer Well WQ Analyses
City of Hollywood
City of Hollywood
MD-South D.
Broward County
Date 4/17/2000 7/10/2000 3/19/1999 3/18/1997 Heptachlor epoxide 0.2 ug/L 0.05 0.05 0.005 0.48 2,4-D 70 ug/L 0.25 0.25 0.1 2,4, 5-TP (Silvex) 50 ug/L 0.05 0.05 0.1 Hexachlorobenzene 1 ug/L 0.05 0.05 0.005 0.825 Benzo (a) pyrene 0.2 ug/L 0.1 0.1 0.1 0.515 Pentachlorophenol 1 ug/L 0.025 0.025 0.5 0.293 PCB 0.5 ug/L Dibromochloropropane 0.2 ug/L 0.01 0.01 0.01 Ethylene Dibromide 0.02 ug/L 0.01 0.01 0.01 Chlordane 2 ug/L 0.25 0.25 0.005 0.0555
Trihalomethane Analysis - 62-550.310(2)(a) PWS027Parameter Name Standard mg/L UnitsChloroform mg/L 0.02 0.019 0.00718 0.0017Bromodichloromethane mg/L 0.012 0.0063 0.00025 0.000455Dibromochloromethane mg/L 0.0028 0.0016 0.00025Bromoform mg/L 0.00025 0.00025 0.00025 0.000021Total THMs mg/L 0.0348 0.0269 0.00718
Radiochemical Analysis - 62-550.310(5) PWS033Parameter Name Standart UnitsGross Alpha pCi/LRadium 226 pCi/L 0.1+/-0.0 0.4+/-0.1 0.5+/-0.25Radium 228 pCi/L 0.5+/-0.4 0.5+/-0.5
Unregulated Group I Analysis - 62-550.405 PWS035Parameter Name Standart UnitsCarbaryl ug/LMethomyl ug/LAldicarb Sulfoxide ug/LAldicarb Sulfone ug/LMetolachlor ug/LAldicarb ug/L3-Hydroxycarbofuran ug/LPropachlor ug/LAldrin ug/L 1.045Dieldrin ug/L 0.3545Dicamba ug/LMetribuzin ug/LButachlor ug/L
Unregulated Group II Analysis - 62-550.410 PWS034Parameter Name Standart Units Chloromethane ug/L 0.0505 Dichlorodiflouromethane ug/L Bromomethane ug/L 0.036 Chloroethane ug/L 0.0265 Trichloroflouromethane ug/L 0.006 Methyl-Tert-Butyl-Ether ug/L Dibromomethane ug/L 1,1-Dichloropropylene ug/L 1,3 Dichloropropane ug/L 1,3-Dichloropropene ug/L 1,2,3 Trichloropropane ug/L 2,2 Dichloropropane ug/L Chloroform ug/L Bromoform ug/L Bromodichloromethane ug/L Dibromochloromethane ug/L o-chlorotoluene ug/L p-chlorotoluene ug/L m-dichlorobenzene ug/L 1,1-dichloroethane ug/L 1,1,1,2 Tetrachloroethane ug/L 1,1,2,2-tetrachloroethane ug/L 0.0175 Bromobenzene ug/L
Unregulated Group III Analysis - 62-550.415 PWS036&0347Parameter Name Standart UnitsIsophrone ug/L 0.2782,4-Dinitrotoluene ug/L 0.305Dimethylphthalate ug/L 0.382Diethylphthalate ug/L 0.407Di-n-Butylphthalate ug/L 1.215Butyl benzyl phthalate ug/LDi-n-octylphthalate ug/L 2.292-Chlorophenol ug/L 0.33052-Methyl-4,6-dinitrophenol ug/L rejectedPhenol ug/L 1.072,4,6-Trichlorophenol ug/L 0.2855
EPA 608Parameter Name Standart UnitA-BHC ug/L 0.04055B-BHC ug/L 0.04D-BHC ug/L 0.04165G-BHC (Lindane) ug/LHeptachlor ug/L
Color Code red: half the detection limit values blue: non-detect values that are higher than MCL values green: measured values that are higher than MCL values
FPL-012-127

Florida Aquifer Well WQ Analyses
Aldrin ug/L 0.0915Heptachlor Epoxide ug/L
City of Hollywood
City of Hollywood
MD-South D.
Broward County
Date 4/17/2000 7/10/2000 3/19/1999 3/18/1997Endosulfan I ug/L 0.0614,4-DDE ug/L 0.0389Dieldrin ug/L 0.065Endrin ug/L 0.9954,4-DDD ug/L 0.066Endosulfan II ug/L 1.4954,4-DDT ug/L 0.064Endrin Aldehyde ug/L rejectedEndosulfan Sulfate ug/L 0.98Chlordane ug/L 0.0555Toxaphene ug/LPCB-1016 ug/L 0.25 0.25PCB-1221 ug/L 0.25 0.25PCB-1232 ug/L 0.25 0.25PCB_1242 ug/L 0.25 0.25PCB-1248 ug/L 0.25 0.25PCB-1254 ug/L 0.25 0.25PCB-1260 ug/L 0.25 0.25Methoxychlor ug/L
EPA 624 - Purgeable OrganicsParameter Name Standart UnitChloromethane ug/LVinyl Chloride ug/LBromomethane ug/LChloroethane ug/LTrichlorofluoromethane ug/L1,1-Dichloroethene ug/LMethylene Chloride ug/LTrans-1,2-Dichloroethene ug/L1,1-Dichloroethane ug/LChloroform ug/L1,1,1-Trichloroethane ug/LCarbon Tetrachloride ug/L1,2-Dichloroethane ug/LBenzene ug/LTrichloroethene ug/L1,2-Dichloropropane ug/LBromodichloromethane ug/L2-Chloroethylvinyl Ether ug/LCis-1,3-dichloropropene ug/LToluene ug/LTrans-1,3-Dichloropropene ug/L1,1,2-Trichloroethane ug/LTetrachloroethene ug/LDibromochloromethane ug/LChlorobenzene ug/LEthylbenzene ug/LBromoform ug/L1,1,2,2-Tetrachloroethane ug/L1,3-Dichlorobenzene ug/L1,4-Dichlorobenzene ug/L1,2-Dichlorobenzene ug/L
Semivolatile Organics (EPA 625)Parameter Name Standart UnitsN-Nitrosodimethylamine ug/LPhenol ug/LBis(2-Chloroethyl)Ether ug/L2-Chlorophenol ug/L1,3-Dichlorobenzene ug/L1,4-Dichlorobenzene ug/L1,2-Dichlorobenzene ug/LBis(2-Chloroisopropyl)ether ug/LN-Nitroso-di-n-propylamine ug/LHexachloroethane ug/LNitrobenzene ug/L2-Nitrophenol ug/L2,4-Dimethylphenol ug/LBis(2-Chloroethoxy)Methane ug/L2,4-Dichlorophenol ug/L1,2,4-Trichlorobenzene ug/LNaphthalane ug/LHexachlorobutadiene ug/L4-Chloro-3-Methylphenol ug/L2-Methylnaphthalene ug/L1-Methylnaphthalene ug/LHexachlrorcyclopentadiene ug/L2,4,6-Trichlorophenol ug/L2-Chloronaphthalene ug/LDimethylphthalene ug/LAcenaphthane ug/LAcenaphthylene ug/L2,4-Dinitrophenol ug/L
Color Code red: half the detection limit values blue: non-detect values that are higher than MCL values green: measured values that are higher than MCL values
FPL-012-128
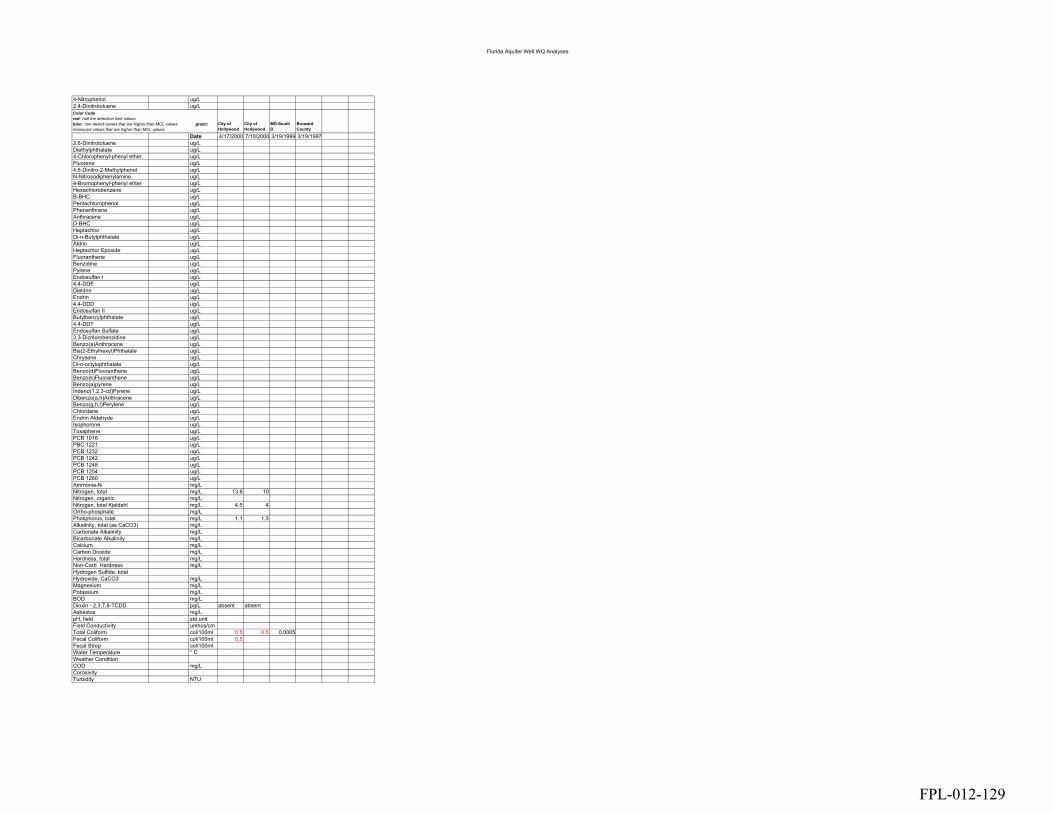
Florida Aquifer Well WQ Analyses
4-Nitrophenol ug/L2,4-Dinitrotoluene ug/L
City of Hollywood
City of Hollywood
MD-South D.
Broward County
Date 4/17/2000 7/10/2000 3/19/1999 3/18/19972,6-Dinitrotoluene ug/LDiethylphthalate ug/L4-Chlorophenyl-phenyl ether ug/LFluorene ug/L4,6-Dinitro-2-Methylphenol ug/LN-Nitrosodiphenylamine ug/L4-Bromophenyl-phenyl ehter ug/LHexachlorobenzene ug/LB-BHC ug/LPentachlorophenol ug/LPhenanthrene ug/LAnthracene ug/LD-BHC ug/LHeptachlor ug/LDi-n-Butylphthalate ug/LAldrin ug/LHeptachlor Epoxide ug/LFluoranthene ug/LBenzidine ug/LPyrene ug/LEndosulfan I ug/L4,4-DDE ug/LDieldrin ug/LEndrin ug/L4,4-DDD ug/LEndosulfan II ug/LButylbenzylphthalate ug/L4,4-DDT ug/LEndosulfan Sulfate ug/L3,3-Dichlorobenzidine ug/LBenzo(a)Anthracene ug/LBis(2-Ethylhexyl)Phthalate ug/LChrysene ug/LDi-n-octylophthalate ug/LBenzo(d)Fluoranthene ug/LBenzo(k)Fluoranthene ug/LBenzo(a)pyrene ug/LIndeno(1,2,3-cd)Pyrene ug/LDibenzo(a,h)Anthracene ug/LBenzo(g,h,I)Perylene ug/LChlordane ug/LEndrin Aldehyde ug/LIsophorone ug/LToxaphene ug/LPCB 1016 ug/LPBC 1221 ug/LPCB 1232 ug/LPCB 1242 ug/LPCB 1248 ug/LPCB 1254 ug/LPCB 1260 ug/LAmmonia-N mg/LNitrogen, total mg/L 13.6 10Nitrogen, organic mg/LNitrogen, total Kjeldahl mg/L 4.5 4Ortho-phosphate mg/LPhosphorus, total mg/L 1.1 1.3Alkalinity, total (as CaCO3) mg/LCarbonate Alkalinity mg/LBicarbonate Alkalinity mg/LCalcium mg/LCarbon Dioxide mg/LHardness, total mg/LNon-Carb. Hardness mg/LHydrogen Sulfide, totalHydroxide, CaCO3 mg/LMagnesium mg/LPotassium mg/LBOD mg/LDioxin - 2,3,7,8-TCDD pg/L absent absentAsbestos mg/LpH, field std unitField Conductivity umhos/cmTotal Coliform col/100ml 0.5 0.5 0.0005Fecal Coliform col/100ml 0.5Fecal Strep col/100mlWater Temperature ° CWeather ConditionCOD mg/LCorosivityTurbidity NTU
Color Code red: half the detection limit values blue: non-detect values that are higher than MCL values green: measured values that are higher than MCL values
FPL-012-129
86
APPENDIX E. GRAPHICAL COMPARISON OF MEANS FOR WATER QUALITY CONSTITUENTS
FPL-012-130

Figure E-1. COMPARISON OF AVERAGE ARSENIC VALUES IN TREATED WASTEWATERVERSUS THE BACKGOUND GROUNDWATER QUALITY
0
0.01
0.02
0.03
0.04
0.05
0.06
DrinkingWater MCL
Open Ocean(from G&Mand Brwd
Co)
AWT ReclaimedWater
Analysis
SecondaryEffluent
EffluentInjection
Zone
LowerMonitoring
Zone
UpperMonitoring
Zone
ASRInjection
Zone
BiscayneMonitoring
Zone
Source of Water
mg/
L
FPL-012-131

Figure E-2. COMPARISON OF AVERAGE BARIUM VALUES IN TREATED WASTEWATERVERSUS THE BACKGOUND GROUNDWATER QUALITY
0
0.5
1
1.5
2
2.5
DrinkingWater MCL
Open Ocean(from G&Mand Brwd
Co)
AWT ReclaimedWater
Analysis
SecondaryEffluent
EffluentInjection
Zone
LowerMonitoring
Zone
UpperMonitoring
Zone
ASRInjection
Zone
BiscayneMonitoring
Zone
Source of Water
mg/
L
n/a
FPL-012-132
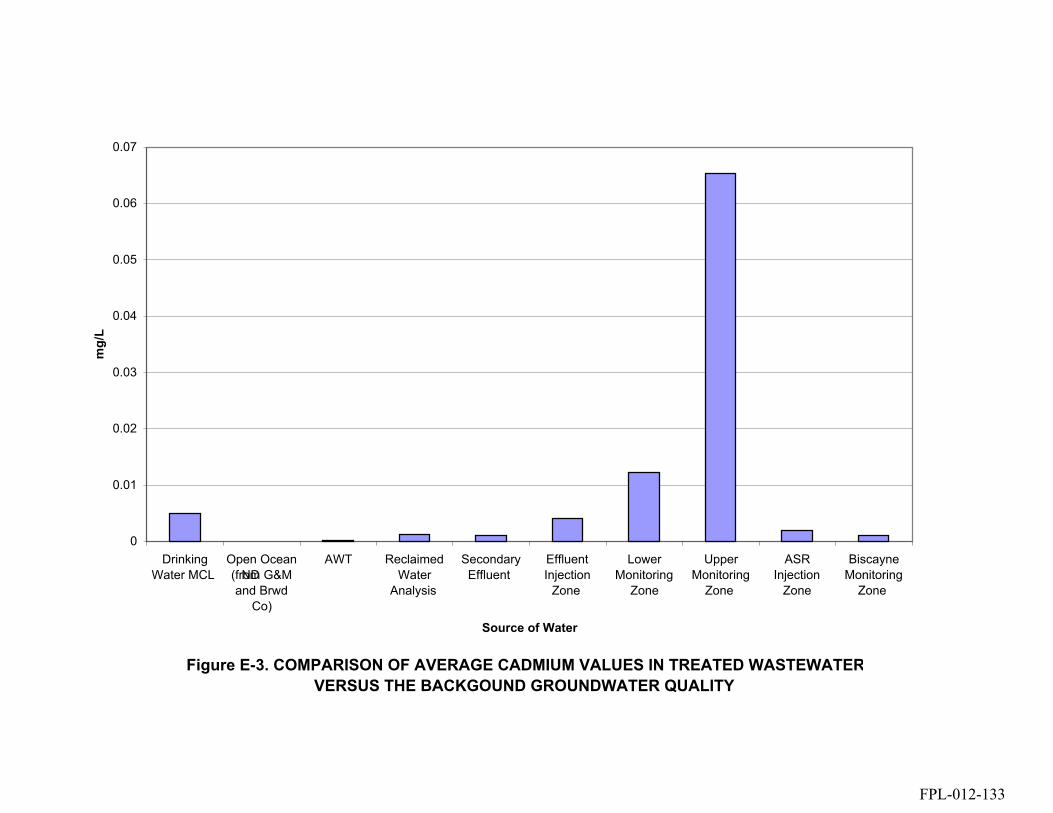
Figure E-3. COMPARISON OF AVERAGE CADMIUM VALUES IN TREATED WASTEWATERVERSUS THE BACKGOUND GROUNDWATER QUALITY
0
0.01
0.02
0.03
0.04
0.05
0.06
0.07
DrinkingWater MCL
Open Ocean(from G&Mand Brwd
Co)
AWT ReclaimedWater
Analysis
SecondaryEffluent
EffluentInjection
Zone
LowerMonitoring
Zone
UpperMonitoring
Zone
ASRInjection
Zone
BiscayneMonitoring
Zone
Source of Water
mg/
L
ND
FPL-012-133
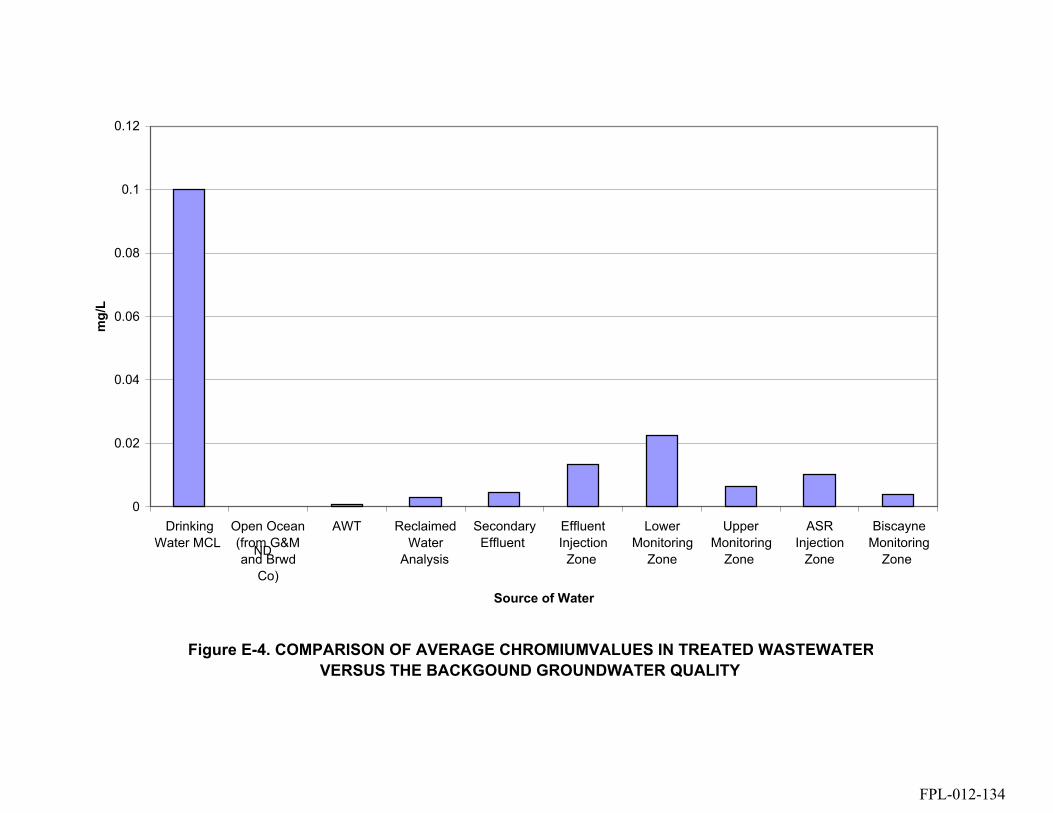
Figure E-4. COMPARISON OF AVERAGE CHROMIUMVALUES IN TREATED WASTEWATERVERSUS THE BACKGOUND GROUNDWATER QUALITY
0
0.02
0.04
0.06
0.08
0.1
0.12
DrinkingWater MCL
Open Ocean(from G&Mand Brwd
Co)
AWT ReclaimedWater
Analysis
SecondaryEffluent
EffluentInjection
Zone
LowerMonitoring
Zone
UpperMonitoring
Zone
ASRInjection
Zone
BiscayneMonitoring
Zone
Source of Water
mg/
L
ND
FPL-012-134
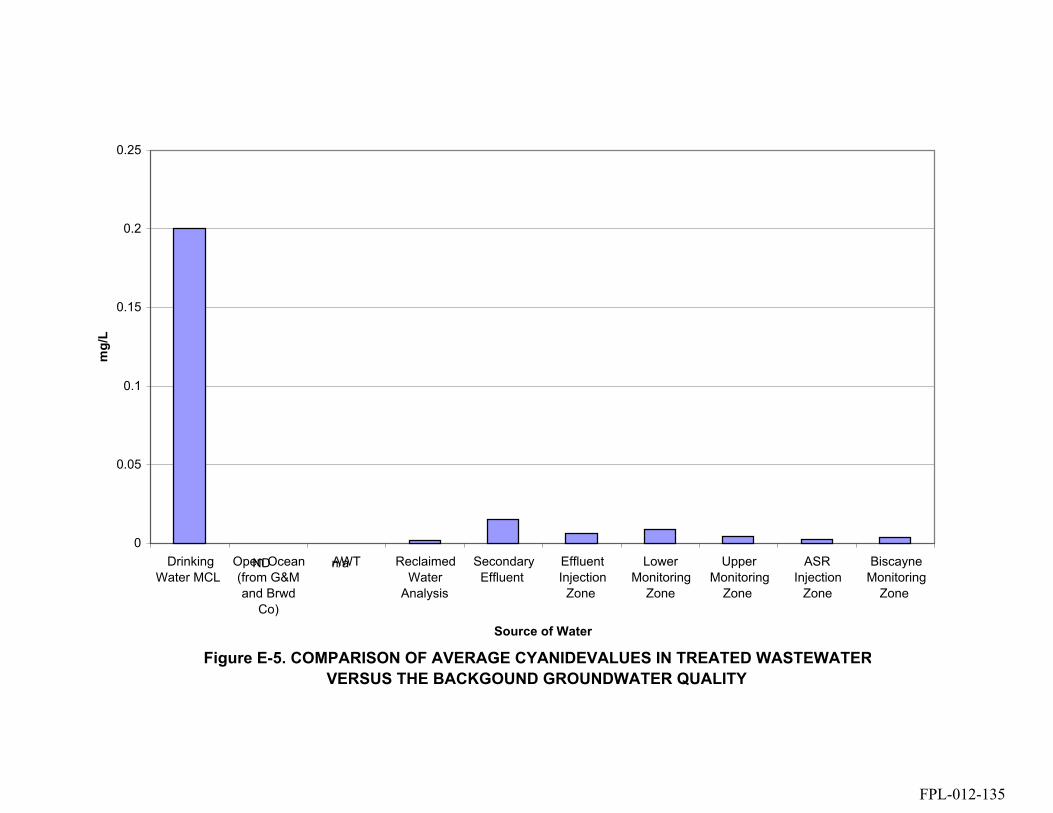
Figure E-5. COMPARISON OF AVERAGE CYANIDEVALUES IN TREATED WASTEWATERVERSUS THE BACKGOUND GROUNDWATER QUALITY
0
0.05
0.1
0.15
0.2
0.25
DrinkingWater MCL
Open Ocean(from G&Mand Brwd
Co)
AWT ReclaimedWater
Analysis
SecondaryEffluent
EffluentInjection
Zone
LowerMonitoring
Zone
UpperMonitoring
Zone
ASRInjection
Zone
BiscayneMonitoring
Zone
Source of Water
mg/
L
ND n/a
FPL-012-135

Figure E-6. COMPARISON OF AVERAGE FLUORIDE VALUES IN TREATED WASTEWATERVERSUS THE BACKGOUND GROUNDWATER QUALITY
0
0.5
1
1.5
2
2.5
3
3.5
4
4.5
DrinkingWater MCL
Open Ocean(from G&Mand Brwd
Co)
AWT ReclaimedWater
Analysis
SecondaryEffluent
EffluentInjection
Zone
LowerMonitoring
Zone
UpperMonitoring
Zone
ASRInjection
Zone
BiscayneMonitoring
Zone
Source of Water
mg/
L
FPL-012-136
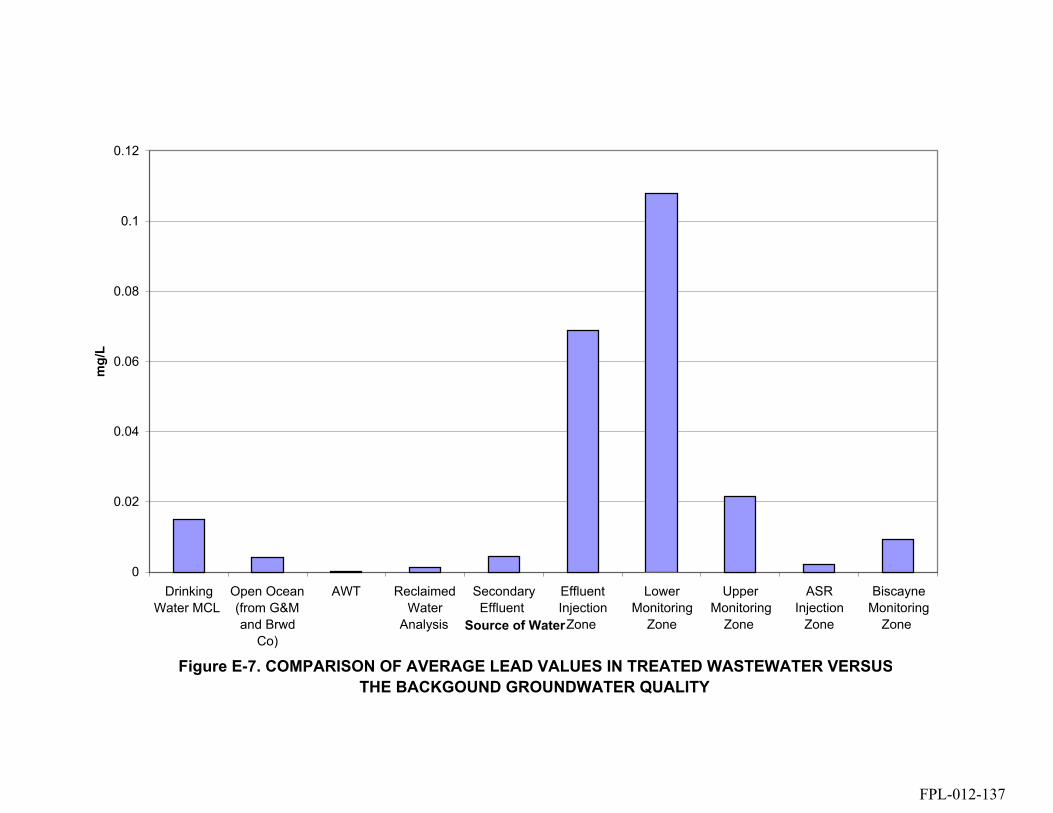
Figure E-7. COMPARISON OF AVERAGE LEAD VALUES IN TREATED WASTEWATER VERSUSTHE BACKGOUND GROUNDWATER QUALITY
0
0.02
0.04
0.06
0.08
0.1
0.12
DrinkingWater MCL
Open Ocean(from G&Mand Brwd
Co)
AWT ReclaimedWater
Analysis
SecondaryEffluent
EffluentInjection
Zone
LowerMonitoring
Zone
UpperMonitoring
Zone
ASRInjection
Zone
BiscayneMonitoring
Zone Source of Water
mg/
L
FPL-012-137
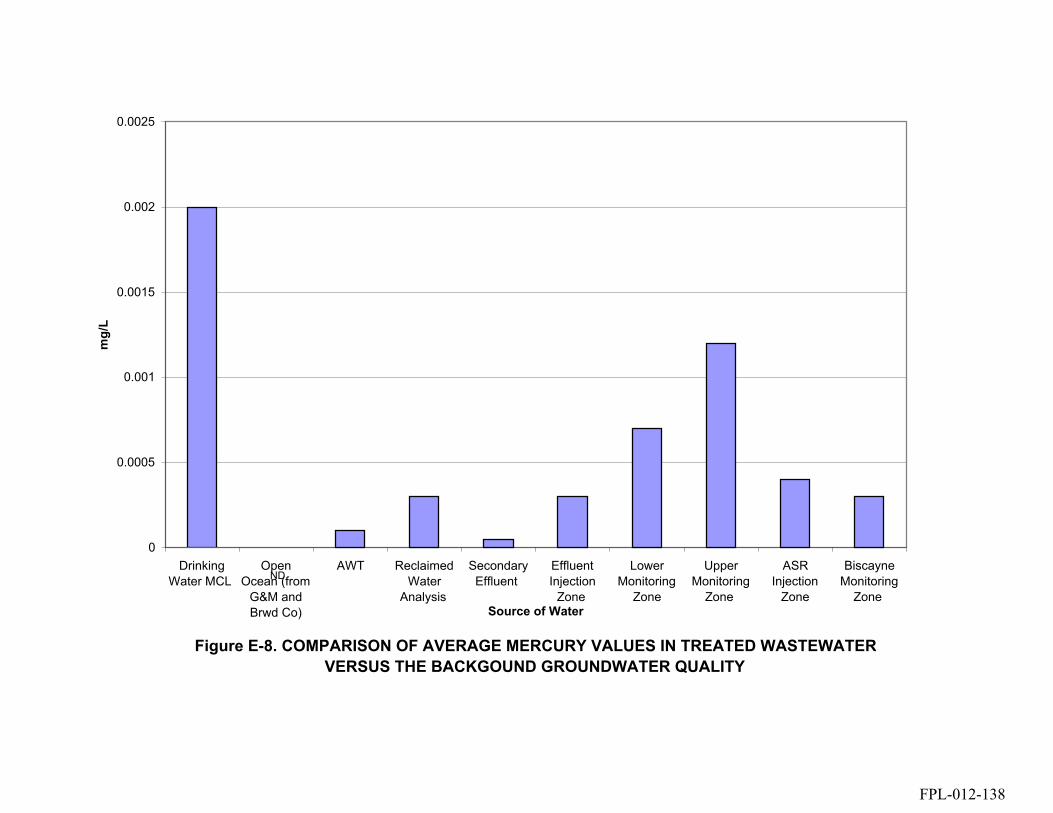
Figure E-8. COMPARISON OF AVERAGE MERCURY VALUES IN TREATED WASTEWATERVERSUS THE BACKGOUND GROUNDWATER QUALITY
0
0.0005
0.001
0.0015
0.002
0.0025
DrinkingWater MCL
OpenOcean (from
G&M andBrwd Co)
AWT ReclaimedWater
Analysis
SecondaryEffluent
EffluentInjection
Zone
LowerMonitoring
Zone
UpperMonitoring
Zone
ASRInjection
Zone
BiscayneMonitoring
Zone Source of Water
mg/
L
ND
FPL-012-138
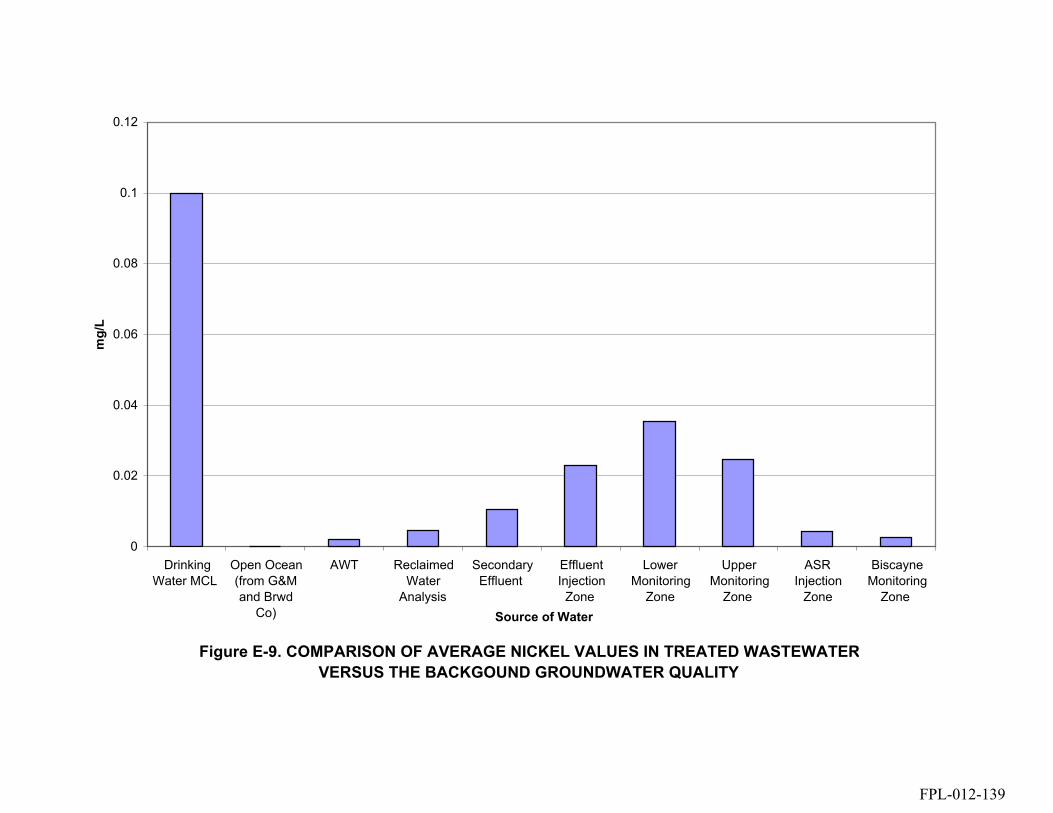
Figure E-9. COMPARISON OF AVERAGE NICKEL VALUES IN TREATED WASTEWATERVERSUS THE BACKGOUND GROUNDWATER QUALITY
0
0.02
0.04
0.06
0.08
0.1
0.12
DrinkingWater MCL
Open Ocean(from G&Mand Brwd
Co)
AWT ReclaimedWater
Analysis
SecondaryEffluent
EffluentInjection
Zone
LowerMonitoring
Zone
UpperMonitoring
Zone
ASRInjection
Zone
BiscayneMonitoring
Zone Source of Water
mg/
L
FPL-012-139

Figure E-10. COMPARISON OF AVERAGE NITRATE VALUES IN TREATED WASTEWATER VERSUS THE BACKGOUND GROUNDWATER QUALITY
0
2
4
6
8
10
12
DrinkingWater MCL
Open Ocean(from G&Mand Brwd
Co)
AWT ReclaimedWater
Analysis
SecondaryEffluent
EffluentInjection
Zone
LowerMonitoring
Zone
UpperMonitoring
Zone
ASRInjection
Zone
BiscayneMonitoring
Zone Source of Water
mg/
L
n/a n/a
FPL-012-140

Figure E-11. COMPARISON OF AVERAGE NITRITE VALUES IN TREATED WASTEWATER VERSUS THE BACKGOUND GROUNDWATER QUALITY
0
0.2
0.4
0.6
0.8
1
1.2
DrinkingWater MCL
Open Ocean(from G&Mand Brwd
Co)
AWT ReclaimedWater
Analysis
SecondaryEffluent
EffluentInjection
Zone
LowerMonitoring
Zone
UpperMonitoring
Zone
ASRInjection
Zone
BiscayneMonitoring
Zone Source of Water
mg/
L
n/an/a
FPL-012-141
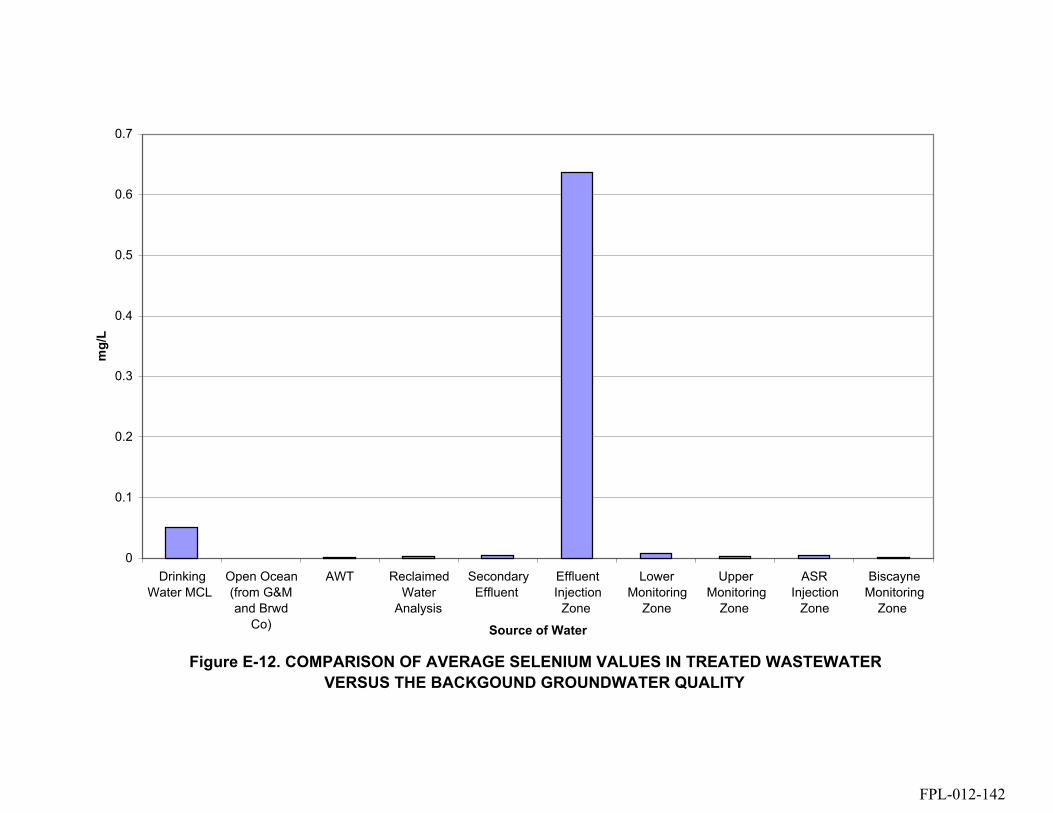
Figure E-12. COMPARISON OF AVERAGE SELENIUM VALUES IN TREATED WASTEWATERVERSUS THE BACKGOUND GROUNDWATER QUALITY
0
0.1
0.2
0.3
0.4
0.5
0.6
0.7
DrinkingWater MCL
Open Ocean(from G&Mand Brwd
Co)
AWT ReclaimedWater
Analysis
SecondaryEffluent
EffluentInjection
Zone
LowerMonitoring
Zone
UpperMonitoring
Zone
ASRInjection
Zone
BiscayneMonitoring
Zone
Source of Water
mg/
L
FPL-012-142
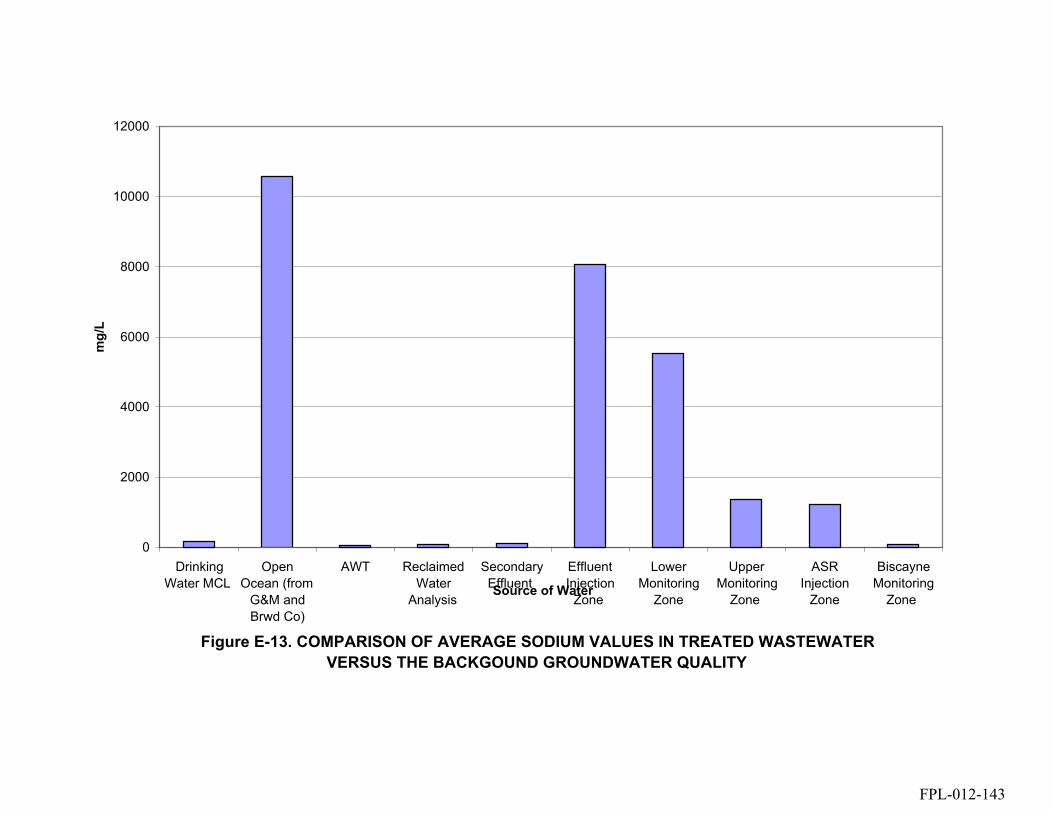
Figure E-13. COMPARISON OF AVERAGE SODIUM VALUES IN TREATED WASTEWATERVERSUS THE BACKGOUND GROUNDWATER QUALITY
0
2000
4000
6000
8000
10000
12000
DrinkingWater MCL
OpenOcean (from
G&M andBrwd Co)
AWT ReclaimedWater
Analysis
SecondaryEffluent
EffluentInjection
Zone
LowerMonitoring
Zone
UpperMonitoring
Zone
ASRInjection
Zone
BiscayneMonitoring
Zone Source of Water
mg/
L
FPL-012-143
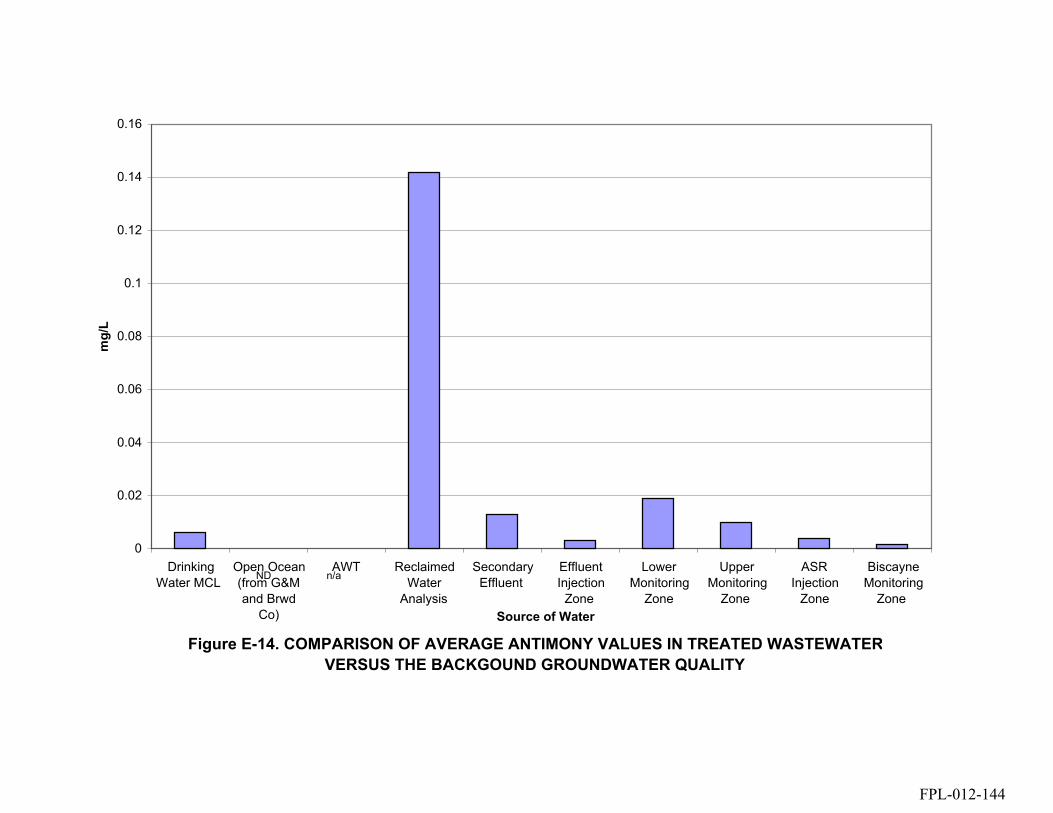
Figure E-14. COMPARISON OF AVERAGE ANTIMONY VALUES IN TREATED WASTEWATERVERSUS THE BACKGOUND GROUNDWATER QUALITY
0
0.02
0.04
0.06
0.08
0.1
0.12
0.14
0.16
DrinkingWater MCL
Open Ocean(from G&Mand Brwd
Co)
AWT ReclaimedWater
Analysis
SecondaryEffluent
EffluentInjection
Zone
LowerMonitoring
Zone
UpperMonitoring
Zone
ASRInjection
Zone
BiscayneMonitoring
Zone Source of Water
mg/
L
n/aND
FPL-012-144

Figure E-15. COMPARISON OF AVERAGE BERYLLIUM VALUES IN TREATED WASTEWATERVERSUS THE BACKGOUND GROUNDWATER QUALITY
0
0.002
0.004
0.006
0.008
0.01
0.012
DrinkingWater MCL
Open Ocean(from G&Mand Brwd
Co)
AWT ReclaimedWater
Analysis
SecondaryEffluent
EffluentInjection
Zone
LowerMonitoring
Zone
UpperMonitoring
Zone
ASRInjection
Zone
BiscayneMonitoring
Zone Source of Water
mg/
L
ND n/a
FPL-012-145

Figure E-16. COMPARISON OF AVERAGE THALLIUM VALUES IN TREATED WASTEWATERVERSUS THE BACKGOUND GROUNDWATER QUALITY
0
0.05
0.1
0.15
0.2
0.25
0.3
0.35
DrinkingWater MCL
Open Ocean(from G&Mand Brwd
Co)
AWT ReclaimedWater
Analysis
SecondaryEffluent
EffluentInjection
Zone
LowerMonitoring
Zone
UpperMonitoring
Zone
ASRInjection
Zone
BiscayneMonitoring
Zone Source of Water
mg/
L
ND n/a
FPL-012-146

Figure E-17. COMPARISON OF AVERAGE ALUMINUM VALUES IN TREATED WASTEWATERVERSUS THE BACKGOUND GROUNDWATER QUALITY
0
0.1
0.2
0.3
0.4
0.5
0.6
0.7
0.8
0.9
1
DrinkingWater MCL
Open Ocean(from G&Mand Brwd
Co)
AWT ReclaimedWater
Analysis
SecondaryEffluent
EffluentInjection
Zone
LowerMonitoring
Zone
UpperMonitoring
Zone
ASRInjection
Zone
BiscayneMonitoring
Zone Source of Water
mg/
L
ND n/a
FPL-012-147
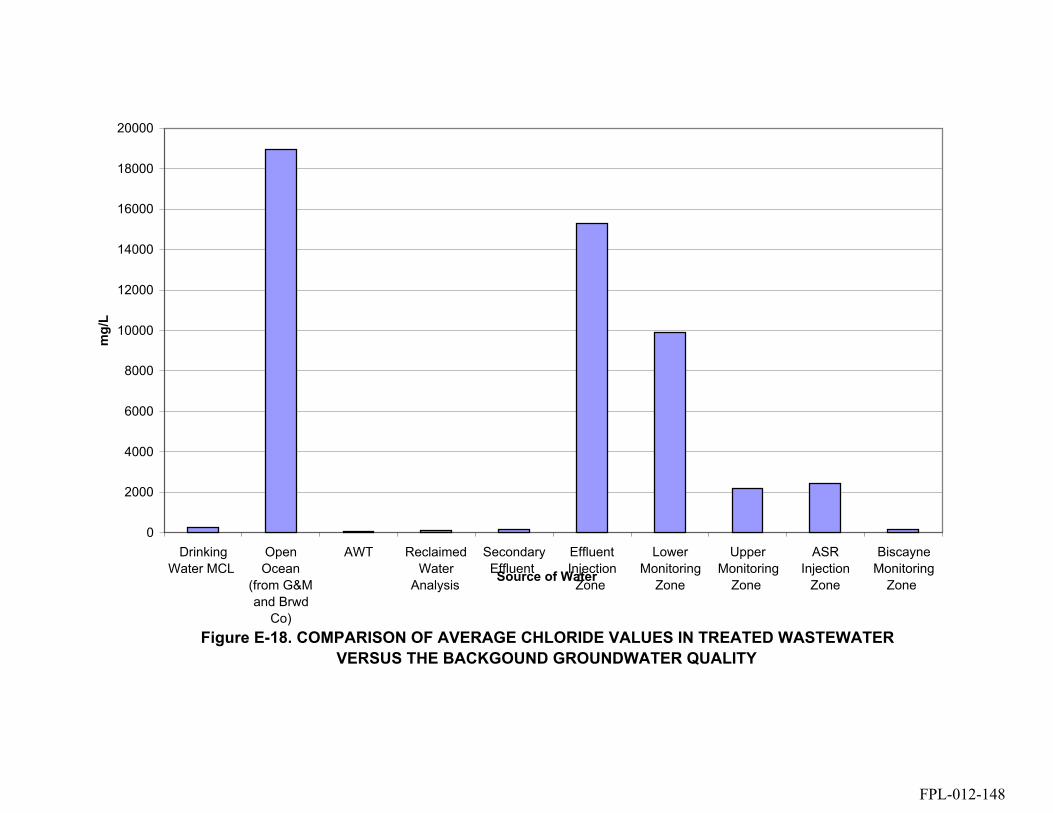
Figure E-18. COMPARISON OF AVERAGE CHLORIDE VALUES IN TREATED WASTEWATERVERSUS THE BACKGOUND GROUNDWATER QUALITY
0
2000
4000
6000
8000
10000
12000
14000
16000
18000
20000
DrinkingWater MCL
OpenOcean
(from G&Mand Brwd
Co)
AWT ReclaimedWater
Analysis
SecondaryEffluent
EffluentInjection
Zone
LowerMonitoring
Zone
UpperMonitoring
Zone
ASRInjection
Zone
BiscayneMonitoring
Zone Source of Water
mg/
L
FPL-012-148

Figure E-19 COMPARISON OF AVERAGE COPPER VALUES IN TREATED WASTEWATERVERSUS THE BACKGOUND GROUNDWATER QUALITY
0
0.2
0.4
0.6
0.8
1
1.2
DrinkingWater MCL
Open Ocean(from G&Mand Brwd
Co)
AWT ReclaimedWater
Analysis
SecondaryEffluent
EffluentInjection
Zone
LowerMonitoring
Zone
UpperMonitoring
Zone
ASRInjection
Zone
BiscayneMonitoring
Zone Source of Water
mg/
L
FPL-012-149

Figure E-20. COMPARISON OF AVERAGE IRON VALUES IN TREATED WASTEWATERVERSUS THE BACKGOUND GROUNDWATER QUALITY
0
5
10
15
20
25
DrinkingWater MCL
Open Ocean(from G&Mand Brwd
Co)
AWT ReclaimedWater
Analysis
SecondaryEffluent
EffluentInjection
Zone
LowerMonitoring
Zone
UpperMonitoring
Zone
ASRInjection
Zone
BiscayneMonitoring
Zone Source of Water
mg/
L
ND
FPL-012-150

Figure E-21. COMPARISON OF AVERAGE MANGANESE VALUES IN TREATED WASTEWATERVERSUS THE BACKGOUND GROUNDWATER QUALITY
0
0.01
0.02
0.03
0.04
0.05
0.06
DrinkingWater MCL
Open Ocean(from G&Mand Brwd
Co)
AWT ReclaimedWater
Analysis
SecondaryEffluent
EffluentInjection
Zone
LowerMonitoring
Zone
UpperMonitoring
Zone
ASRInjection
Zone
BiscayneMonitoring
Zone Source of Water
mg/
L
n/a
FPL-012-151
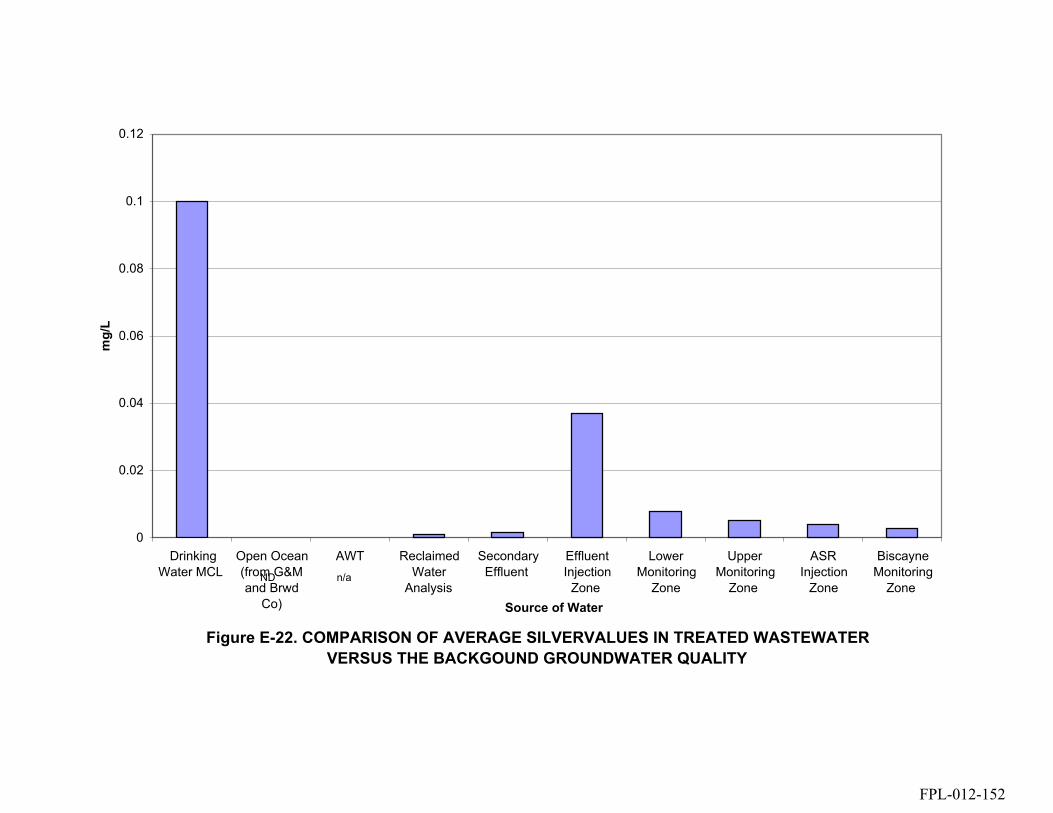
Figure E-22. COMPARISON OF AVERAGE SILVERVALUES IN TREATED WASTEWATERVERSUS THE BACKGOUND GROUNDWATER QUALITY
0
0.02
0.04
0.06
0.08
0.1
0.12
DrinkingWater MCL
Open Ocean(from G&Mand Brwd
Co)
AWT ReclaimedWater
Analysis
SecondaryEffluent
EffluentInjection
Zone
LowerMonitoring
Zone
UpperMonitoring
Zone
ASRInjection
Zone
BiscayneMonitoring
Zone Source of Water
mg/
L
n/aND
FPL-012-152

Figure E-23. COMPARISON OF AVERAGE SULFATE VALUES IN TREATED WASTEWATER VERSUS THE BACKGOUND GROUNDWATER QUALITY
0
500
1000
1500
2000
2500
3000
DrinkingWater MCL
Open Ocean(from G&Mand Brwd
Co)
AWT ReclaimedWater
Analysis
SecondaryEffluent
EffluentInjection
Zone
LowerMonitoring
Zone
UpperMonitoring
Zone
ASRInjection
Zone
BiscayneMonitoring
Zone
Source of Water
mg/
L
FPL-012-153

Figure E-24. COMPARISON OF AVERAGE ZINC VALUES IN TREATED WASTEWATERVERSUS THE BACKGOUND GROUNDWATER QUALITY
0
1
2
3
4
5
6
DrinkingWater MCL
Open Ocean(from G&Mand Brwd
Co)
AWT ReclaimedWater
Analysis
SecondaryEffluent
EffluentInjection
Zone
LowerMonitoring
Zone
UpperMonitoring
Zone
ASR InjectionZone
BiscayneMonitoring
Zone
Source of Water
mg/
L
ND
FPL-012-154
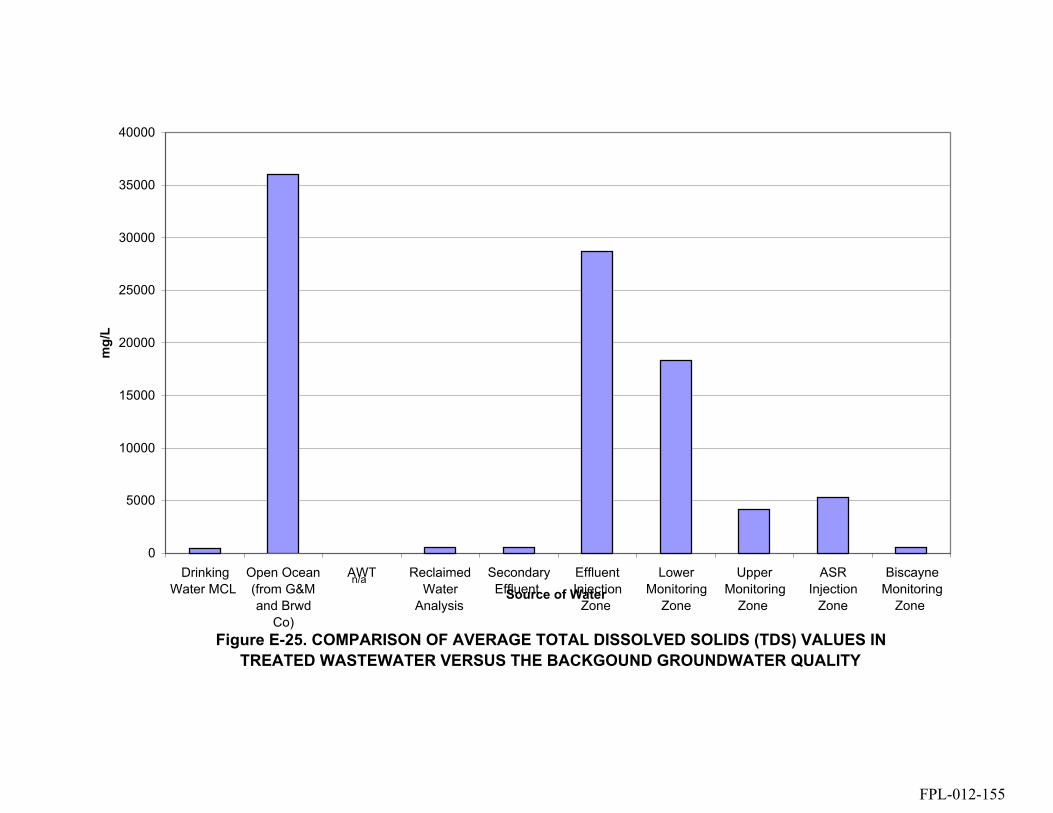
Figure E-25. COMPARISON OF AVERAGE TOTAL DISSOLVED SOLIDS (TDS) VALUES IN TREATED WASTEWATER VERSUS THE BACKGOUND GROUNDWATER QUALITY
0
5000
10000
15000
20000
25000
30000
35000
40000
DrinkingWater MCL
Open Ocean(from G&Mand Brwd
Co)
AWT ReclaimedWater
Analysis
SecondaryEffluent
EffluentInjection
Zone
LowerMonitoring
Zone
UpperMonitoring
Zone
ASRInjection
Zone
BiscayneMonitoring
Zone Source of Water
mg/
L
n/a
FPL-012-155

COMPARISON OF AVERAGE AMMONIA VALUES IN TREATED WASTEWATER VERSUS THEBACKGOUND GROUNDWATER QUALITY
0
1
2
3
4
5
6
7
8
9
10
Open Ocean(from G&M
and Brwd Co)
AWT ReclaimedWater
Analysis
SecondaryEffluent
EffluentInjection Zone
LowerMonitoring
Zone
UpperMonitoring
Zone
ASR InjectionZone
BiscayneMonitoring
Zone
Source of Water
mg/
L
n/a n/an/a
FPL-012-156

87
APPENDIX F. LISTS OF SAMPLING DATES AND SAMPLING METHODS [Task 10 report]
FPL-012-157
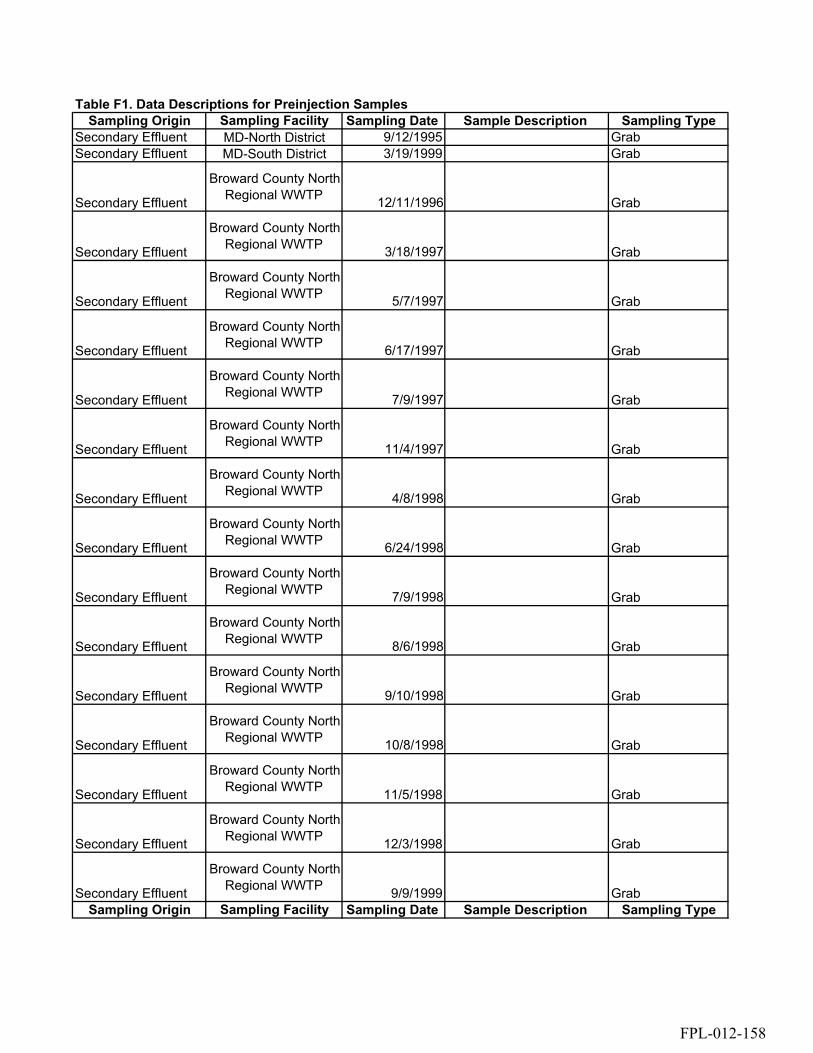
Sampling Origin Sampling Facility Sampling Date Sample Description Sampling TypeSecondary Effluent MD-North District 9/12/1995 GrabSecondary Effluent MD-South District 3/19/1999 Grab
Secondary Effluent
Broward County North Regional WWTP 12/11/1996 Grab
Secondary Effluent
Broward County North Regional WWTP 3/18/1997 Grab
Secondary Effluent
Broward County North Regional WWTP 5/7/1997 Grab
Secondary Effluent
Broward County North Regional WWTP 6/17/1997 Grab
Secondary Effluent
Broward County North Regional WWTP 7/9/1997 Grab
Secondary Effluent
Broward County North Regional WWTP 11/4/1997 Grab
Secondary Effluent
Broward County North Regional WWTP 4/8/1998 Grab
Secondary Effluent
Broward County North Regional WWTP 6/24/1998 Grab
Secondary Effluent
Broward County North Regional WWTP 7/9/1998 Grab
Secondary Effluent
Broward County North Regional WWTP 8/6/1998 Grab
Secondary Effluent
Broward County North Regional WWTP 9/10/1998 Grab
Secondary Effluent
Broward County North Regional WWTP 10/8/1998 Grab
Secondary Effluent
Broward County North Regional WWTP 11/5/1998 Grab
Secondary Effluent
Broward County North Regional WWTP 12/3/1998 Grab
Secondary Effluent
Broward County North Regional WWTP 9/9/1999 Grab
Sampling Origin Sampling Facility Sampling Date Sample Description Sampling Type
Table F1. Data Descriptions for Preinjection Samples
FPL-012-158
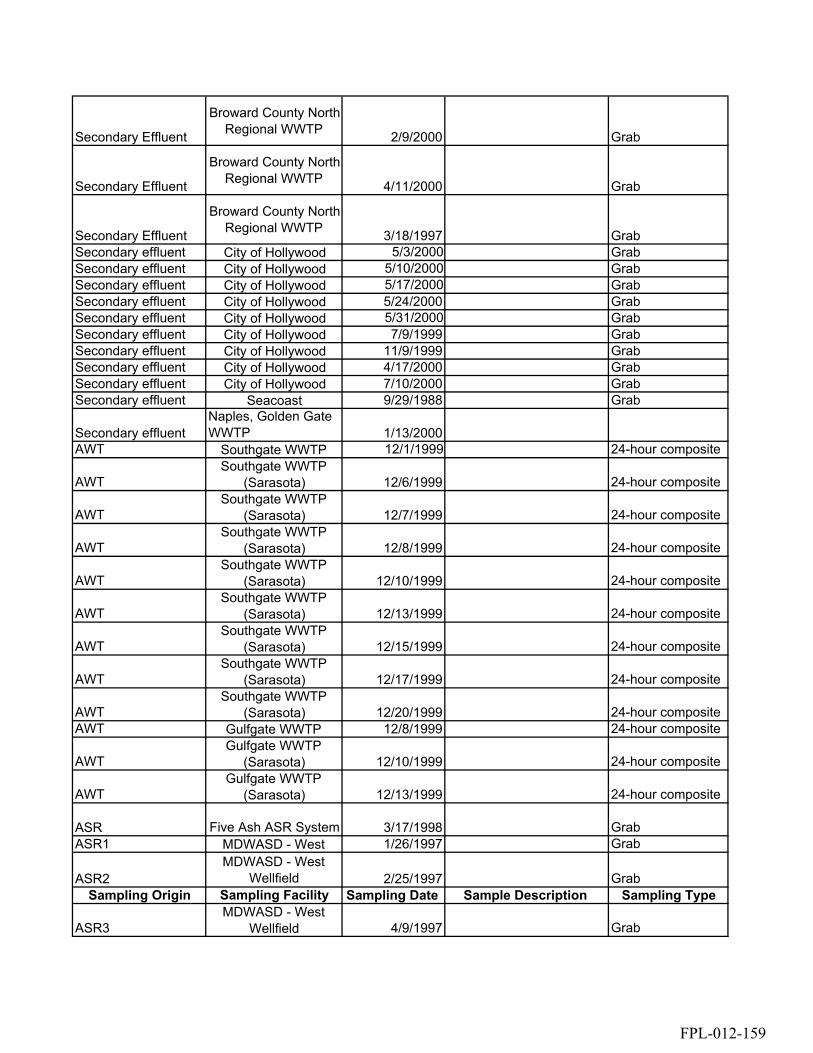
Secondary Effluent
Broward County North Regional WWTP 2/9/2000 Grab
Secondary Effluent
Broward County North Regional WWTP 4/11/2000 Grab
Secondary Effluent
Broward County North Regional WWTP 3/18/1997 Grab
Secondary effluent City of Hollywood 5/3/2000 GrabSecondary effluent City of Hollywood 5/10/2000 GrabSecondary effluent City of Hollywood 5/17/2000 GrabSecondary effluent City of Hollywood 5/24/2000 GrabSecondary effluent City of Hollywood 5/31/2000 GrabSecondary effluent City of Hollywood 7/9/1999 GrabSecondary effluent City of Hollywood 11/9/1999 GrabSecondary effluent City of Hollywood 4/17/2000 GrabSecondary effluent City of Hollywood 7/10/2000 GrabSecondary effluent Seacoast 9/29/1988 Grab
Secondary effluentNaples, Golden Gate WWTP 1/13/2000
AWT Southgate WWTP 12/1/1999 24-hour composite
AWTSouthgate WWTP
(Sarasota) 12/6/1999 24-hour composite
AWTSouthgate WWTP
(Sarasota) 12/7/1999 24-hour composite
AWTSouthgate WWTP
(Sarasota) 12/8/1999 24-hour composite
AWTSouthgate WWTP
(Sarasota) 12/10/1999 24-hour composite
AWTSouthgate WWTP
(Sarasota) 12/13/1999 24-hour composite
AWTSouthgate WWTP
(Sarasota) 12/15/1999 24-hour composite
AWTSouthgate WWTP
(Sarasota) 12/17/1999 24-hour composite
AWTSouthgate WWTP
(Sarasota) 12/20/1999 24-hour compositeAWT Gulfgate WWTP 12/8/1999 24-hour composite
AWTGulfgate WWTP
(Sarasota) 12/10/1999 24-hour composite
AWTGulfgate WWTP
(Sarasota) 12/13/1999 24-hour composite
ASR Five Ash ASR System 3/17/1998 GrabASR1 MDWASD - West 1/26/1997 Grab
ASR2MDWASD - West
Wellfield 2/25/1997 GrabSampling Origin Sampling Facility Sampling Date Sample Description Sampling Type
ASR3MDWASD - West
Wellfield 4/9/1997 Grab
FPL-012-159

ASRBoynton Beach (Not
working) 5/21/1992 GrabBiscayne Aquifer City of Hollywood 5/20/1999 Grab
Biscayne Aquifer Five Ash ASR System 1/15/1998 (intake #: 51121)
Biscayne Aquifer MDWASD - S WWTP 7/9/1977 7622 (MW No:1)
Biscayne Aquifer MDWASD - S WWTP 7/9/1977 7623 (MW No:2)
Biscayne Aquifer MDWASD - S WWTP 7/9/1977 7624 (MW No:3)
Biscayne Aquifer MDWASD - S WWTP 7/9/1977 7625 (MW No:4)
Biscayne Aquifer MDWASD - S WWTP 7/9/1977 7626 (MW No:5)
Biscayne Aquifer MDWASD - S WWTP 7/9/1977 7627 (MW No:6)
Biscayne Aquifer MDWASD - S WWTP 7/9/1977 7628 (water supply well)
Biscayne Aquifer MDWASD - S WWTP 7/3/1977 7692 (water supply well)
Biscayne Aquifer MDWASD - S WWTP 7/3/1977 7693 (water supply well)
Biscayne Aquifer MDWASD - S WWTP 7/3/1977 7694 (water supply well)Biscayne Aquifer WPB 11/1/1993 14629 grabBiscayne Aquifer WPB 8/31/1994 14575 GrabBiscayne Aquifer WPB 10/6/1994 15015 GrabBiscayne Aquifer WPB 8/31/1995 19151 Grab
UMZ MDWASD - S WWTP 8/13/1977 7938 Grab
UMZ MDWASD - S WWTP 8/15/1977 7939 Grab
UMZ MDWASD - S WWTP 8/16/1977 7940 GrabUMZ City of WPB 10/15/1986 FA 1 upper grabUMZ MD-South District 3/9/1995 (FA-10) GrabUMZ MD-North District 3/27/1996 (FA-1N) GrabUMZ MD-North District 8/21/1995 (FA-4) GrabUMZ Boynton Beach 4/21/1992 GrabLMZ MD-North District 3/27/1996 (FA-2) GrabLMZ MD-North District 8/21/1995 (FA-4) Grab
UMZMDWASD - West
Wellfield 2/6/1997 GrabLMZ City of WPB 10/15/1986 FA 2 lower grab
Sampling Origin Sampling Facility Sampling Date Sample Description Sampling Type
LMZ
Broward County North Regional WWTP 11/19/1997 MW1 Grab
LMZ
Broward County North Regional WWTP 12/12/1997 MW1 Grab
FPL-012-160

LMZ
Broward County North Regional WWTP 12/10/1997 MW2 Grab
LMZ
Broward County North Regional WWTP 12/12/1997 MW2 Grab
LMZ MDWASD - S WWTP 8/18/1977 7941
LMZ MDWASD - S WWTP 8/18/1977 7942
LMZ MDWASD - S WWTP 8/20/1977 7943
LMZ MDWASD - S WWTP 8/21/1977 7944
LMZ MDWASD - S WWTP 8/21/1977 7945
LMZ MDWASD - S WWTP 9/21/1977 8396
LMZ MDWASD - S WWTP 9/21/1977 8397
LMZ MDWASD - S WWTP 9/21/1977 8398
LMZ MDWASD - S WWTP 7/9/1977 7628
LMZMDWASD - West
Wellfield 2/6/1997 GrabLMZ MD-South District 3/9/1995 (FA-10) GrabLMZ Boynton Beach 4/21/1992 -110969 GrabInjection zone Boynton Beach 9/30/1991 GrabInjection zone Broward County North 11/2/1999 IW5 Grab
Injection zone
Broward County North Regional WWTP 1/19/2000 IW6 Grab
Injection zone City of WPB 9/16/1986 (water works job #: 4212) grab
Injection zone MDWASD - S WWTP 8/22/1977 7946 airlift
Injection zone MDWASD - S WWTP 8/23/1977 7947 airlift
Injection zone MDWASD - S WWTP 8/24/1977 7949 24-hr composite
Injection zone MDWASD - S WWTP 8/25/1977 8101 packer testSampling Origin Sampling Facility Sampling Date Sample Description Sampling Type
Injection zone MDWASD - S WWTP 8/26/1977 8102 packer test
Injection zone MDWASD - S WWTP 8/26/1977 8103 packer test
Injection zone MDWASD - S WWTP 8/27/1977 8105 packer test
Injection zone MDWASD - S WWTP 8/27/1977 8106 packer test
FPL-012-161
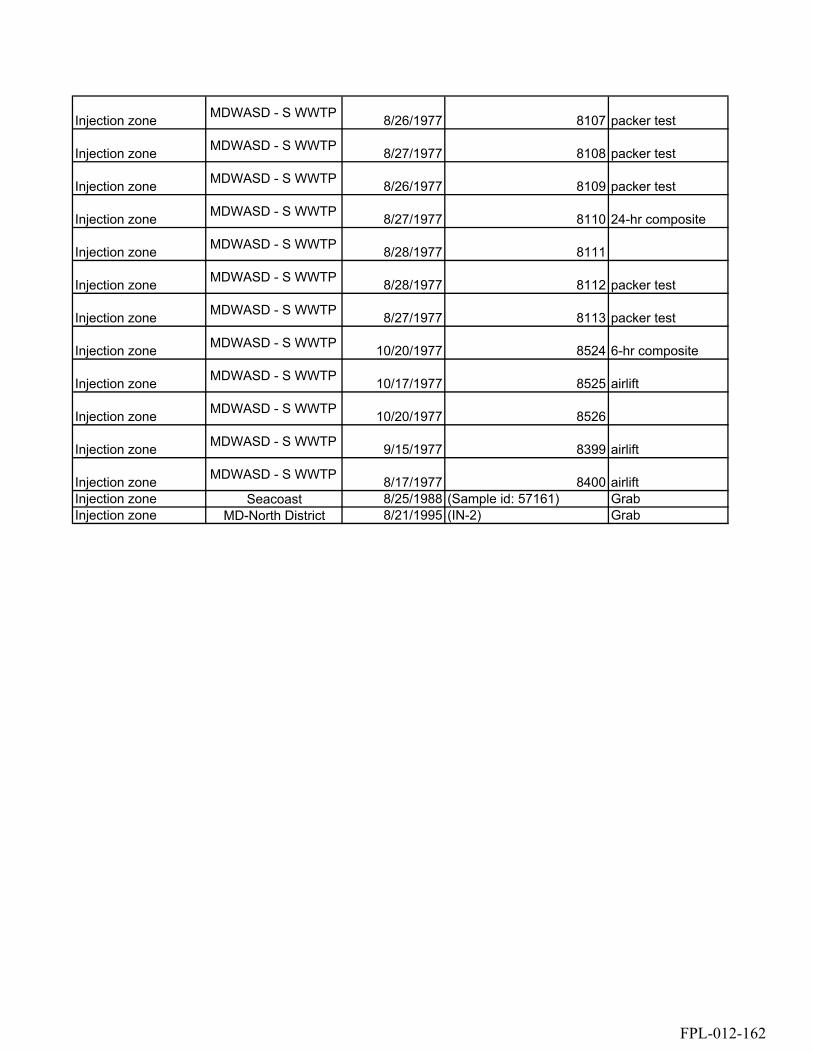
Injection zone MDWASD - S WWTP 8/26/1977 8107 packer test
Injection zone MDWASD - S WWTP 8/27/1977 8108 packer test
Injection zone MDWASD - S WWTP 8/26/1977 8109 packer test
Injection zone MDWASD - S WWTP 8/27/1977 8110 24-hr composite
Injection zone MDWASD - S WWTP 8/28/1977 8111
Injection zone MDWASD - S WWTP 8/28/1977 8112 packer test
Injection zone MDWASD - S WWTP 8/27/1977 8113 packer test
Injection zone MDWASD - S WWTP 10/20/1977 8524 6-hr composite
Injection zone MDWASD - S WWTP 10/17/1977 8525 airlift
Injection zone MDWASD - S WWTP 10/20/1977 8526
Injection zone MDWASD - S WWTP 9/15/1977 8399 airlift
Injection zone MDWASD - S WWTP 8/17/1977 8400 airliftInjection zone Seacoast 8/25/1988 (Sample id: 57161) GrabInjection zone MD-North District 8/21/1995 (IN-2) Grab
FPL-012-162
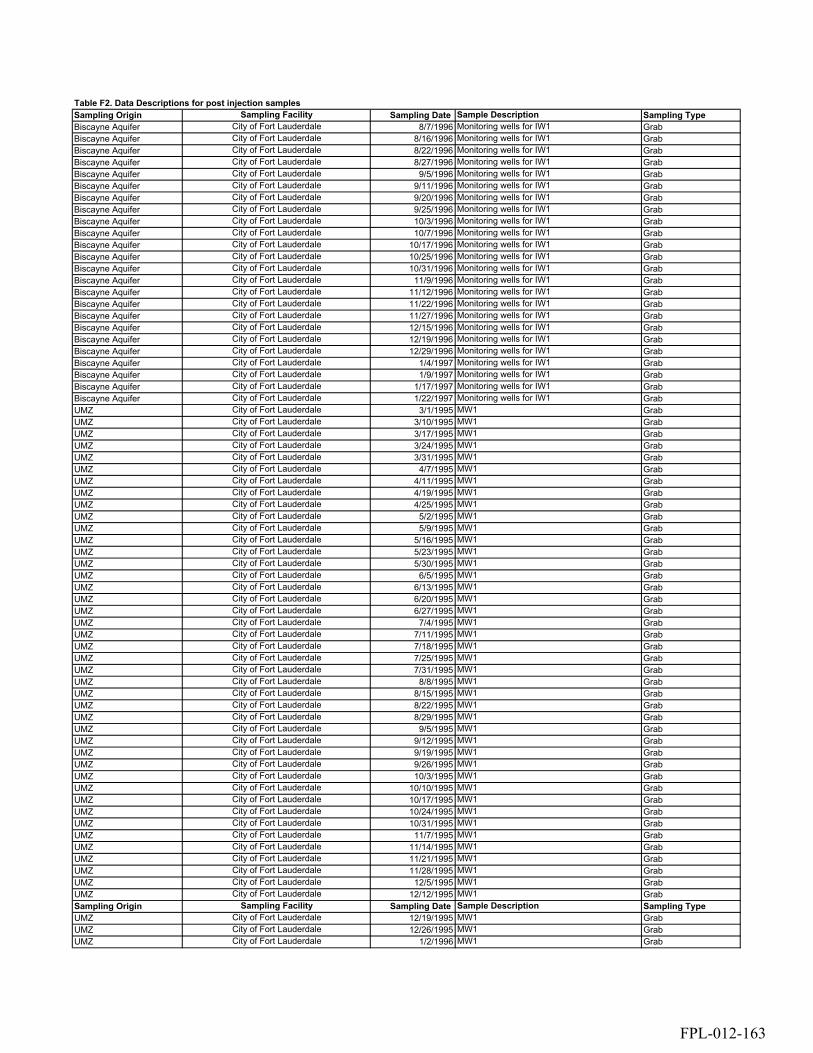
Sampling Origin Sampling Facility Sampling Date Sample Description Sampling TypeBiscayne Aquifer City of Fort Lauderdale 8/7/1996 Monitoring wells for IW1 GrabBiscayne Aquifer City of Fort Lauderdale 8/16/1996 Monitoring wells for IW1 GrabBiscayne Aquifer City of Fort Lauderdale 8/22/1996 Monitoring wells for IW1 GrabBiscayne Aquifer City of Fort Lauderdale 8/27/1996 Monitoring wells for IW1 GrabBiscayne Aquifer City of Fort Lauderdale 9/5/1996 Monitoring wells for IW1 GrabBiscayne Aquifer City of Fort Lauderdale 9/11/1996 Monitoring wells for IW1 GrabBiscayne Aquifer City of Fort Lauderdale 9/20/1996 Monitoring wells for IW1 GrabBiscayne Aquifer City of Fort Lauderdale 9/25/1996 Monitoring wells for IW1 GrabBiscayne Aquifer City of Fort Lauderdale 10/3/1996 Monitoring wells for IW1 GrabBiscayne Aquifer City of Fort Lauderdale 10/7/1996 Monitoring wells for IW1 GrabBiscayne Aquifer City of Fort Lauderdale 10/17/1996 Monitoring wells for IW1 GrabBiscayne Aquifer City of Fort Lauderdale 10/25/1996 Monitoring wells for IW1 GrabBiscayne Aquifer City of Fort Lauderdale 10/31/1996 Monitoring wells for IW1 GrabBiscayne Aquifer City of Fort Lauderdale 11/9/1996 Monitoring wells for IW1 GrabBiscayne Aquifer City of Fort Lauderdale 11/12/1996 Monitoring wells for IW1 GrabBiscayne Aquifer City of Fort Lauderdale 11/22/1996 Monitoring wells for IW1 GrabBiscayne Aquifer City of Fort Lauderdale 11/27/1996 Monitoring wells for IW1 GrabBiscayne Aquifer City of Fort Lauderdale 12/15/1996 Monitoring wells for IW1 GrabBiscayne Aquifer City of Fort Lauderdale 12/19/1996 Monitoring wells for IW1 GrabBiscayne Aquifer City of Fort Lauderdale 12/29/1996 Monitoring wells for IW1 GrabBiscayne Aquifer City of Fort Lauderdale 1/4/1997 Monitoring wells for IW1 GrabBiscayne Aquifer City of Fort Lauderdale 1/9/1997 Monitoring wells for IW1 GrabBiscayne Aquifer City of Fort Lauderdale 1/17/1997 Monitoring wells for IW1 GrabBiscayne Aquifer City of Fort Lauderdale 1/22/1997 Monitoring wells for IW1 GrabUMZ City of Fort Lauderdale 3/1/1995 MW1 GrabUMZ City of Fort Lauderdale 3/10/1995 MW1 GrabUMZ City of Fort Lauderdale 3/17/1995 MW1 GrabUMZ City of Fort Lauderdale 3/24/1995 MW1 GrabUMZ City of Fort Lauderdale 3/31/1995 MW1 GrabUMZ City of Fort Lauderdale 4/7/1995 MW1 GrabUMZ City of Fort Lauderdale 4/11/1995 MW1 GrabUMZ City of Fort Lauderdale 4/19/1995 MW1 GrabUMZ City of Fort Lauderdale 4/25/1995 MW1 GrabUMZ City of Fort Lauderdale 5/2/1995 MW1 GrabUMZ City of Fort Lauderdale 5/9/1995 MW1 GrabUMZ City of Fort Lauderdale 5/16/1995 MW1 GrabUMZ City of Fort Lauderdale 5/23/1995 MW1 GrabUMZ City of Fort Lauderdale 5/30/1995 MW1 GrabUMZ City of Fort Lauderdale 6/5/1995 MW1 GrabUMZ City of Fort Lauderdale 6/13/1995 MW1 GrabUMZ City of Fort Lauderdale 6/20/1995 MW1 GrabUMZ City of Fort Lauderdale 6/27/1995 MW1 GrabUMZ City of Fort Lauderdale 7/4/1995 MW1 GrabUMZ City of Fort Lauderdale 7/11/1995 MW1 GrabUMZ City of Fort Lauderdale 7/18/1995 MW1 GrabUMZ City of Fort Lauderdale 7/25/1995 MW1 GrabUMZ City of Fort Lauderdale 7/31/1995 MW1 GrabUMZ City of Fort Lauderdale 8/8/1995 MW1 GrabUMZ City of Fort Lauderdale 8/15/1995 MW1 GrabUMZ City of Fort Lauderdale 8/22/1995 MW1 GrabUMZ City of Fort Lauderdale 8/29/1995 MW1 GrabUMZ City of Fort Lauderdale 9/5/1995 MW1 GrabUMZ City of Fort Lauderdale 9/12/1995 MW1 GrabUMZ City of Fort Lauderdale 9/19/1995 MW1 GrabUMZ City of Fort Lauderdale 9/26/1995 MW1 GrabUMZ City of Fort Lauderdale 10/3/1995 MW1 GrabUMZ City of Fort Lauderdale 10/10/1995 MW1 GrabUMZ City of Fort Lauderdale 10/17/1995 MW1 GrabUMZ City of Fort Lauderdale 10/24/1995 MW1 GrabUMZ City of Fort Lauderdale 10/31/1995 MW1 GrabUMZ City of Fort Lauderdale 11/7/1995 MW1 GrabUMZ City of Fort Lauderdale 11/14/1995 MW1 GrabUMZ City of Fort Lauderdale 11/21/1995 MW1 GrabUMZ City of Fort Lauderdale 11/28/1995 MW1 GrabUMZ City of Fort Lauderdale 12/5/1995 MW1 GrabUMZ City of Fort Lauderdale 12/12/1995 MW1 GrabSampling Origin Sampling Facility Sampling Date Sample Description Sampling TypeUMZ City of Fort Lauderdale 12/19/1995 MW1 GrabUMZ City of Fort Lauderdale 12/26/1995 MW1 GrabUMZ City of Fort Lauderdale 1/2/1996 MW1 Grab
Table F2. Data Descriptions for post injection samples
FPL-012-163

UMZ City of Fort Lauderdale 1/9/1996 MW1 GrabUMZ City of Fort Lauderdale 1/16/1996 MW1 GrabUMZ City of Fort Lauderdale 1/23/1996 MW1 GrabUMZ City of Fort Lauderdale 1/30/1996 MW1 GrabUMZ City of Fort Lauderdale 2/6/1996 MW1 GrabUMZ City of Fort Lauderdale 2/13/1996 MW1 GrabUMZ City of Fort Lauderdale 2/20/1996 MW1 GrabUMZ City of Fort Lauderdale 2/27/1996 MW1 GrabUMZ City of Fort Lauderdale 3/5/1996 MW1 GrabUMZ City of Fort Lauderdale 3/12/1996 MW1 GrabUMZ City of Fort Lauderdale 3/19/1996 MW1 GrabUMZ City of Fort Lauderdale 3/26/1996 MW1 GrabUMZ City of Fort Lauderdale 4/2/1996 MW1 GrabUMZ City of Fort Lauderdale 4/9/1996 MW1 GrabUMZ City of Fort Lauderdale 4/16/1996 MW1 GrabUMZ City of Fort Lauderdale 4/23/1996 MW1 GrabUMZ City of Fort Lauderdale 4/30/1996 MW1 GrabUMZ City of Fort Lauderdale 5/7/1996 MW1 GrabUMZ City of Fort Lauderdale 5/14/1996 MW1 GrabUMZ City of Fort Lauderdale 6/4/1996 MW1 GrabUMZ City of Fort Lauderdale 6/11/1996 MW1 GrabUMZ City of Fort Lauderdale 6/19/1996 MW1 GrabUMZ City of Fort Lauderdale 6/25/1996 MW1 GrabUMZ City of Fort Lauderdale 7/2/1996 MW1 GrabUMZ City of Fort Lauderdale 7/9/1996 MW1 GrabUMZ City of Fort Lauderdale 7/16/1996 MW1 GrabUMZ City of Fort Lauderdale 7/23/1996 MW1 GrabUMZ City of Fort Lauderdale 7/30/1996 MW1 GrabUMZ City of Fort Lauderdale 8/6/1996 MW1 GrabUMZ City of Fort Lauderdale 8/15/1996 MW1 GrabUMZ City of Fort Lauderdale 8/20/1996 MW1 GrabUMZ City of Fort Lauderdale 8/27/1996 MW1 GrabUMZ City of Fort Lauderdale 9/4/1996 MW1 GrabUMZ City of Fort Lauderdale 9/17/1996 MW1 GrabUMZ City of Fort Lauderdale 10/8/1996 MW1 GrabUMZ City of Fort Lauderdale 10/15/1996 MW1 GrabUMZ City of Fort Lauderdale 10/22/1996 MW1 GrabUMZ City of Fort Lauderdale 10/29/1996 MW1 GrabUMZ City of Fort Lauderdale 11/5/1996 MW1 GrabUMZ City of Fort Lauderdale 11/12/1996 MW1 GrabUMZ City of Fort Lauderdale 11/18/1996 MW1 GrabUMZ City of Fort Lauderdale 11/26/1996 MW1 GrabUMZ City of Fort Lauderdale 12/2/1996 MW1 GrabUMZ City of Fort Lauderdale 12/10/1996 MW1 GrabUMZ City of Fort Lauderdale 12/17/1996 MW1 GrabUMZ City of Fort Lauderdale 12/24/1996 MW1 GrabUMZ City of Fort Lauderdale 12/31/1996 MW1 GrabUMZ City of Fort Lauderdale 1/7/1997 MW1 GrabUMZ City of Fort Lauderdale 1/14/1997 MW1 GrabUMZ City of Fort Lauderdale 1/21/1997 MW1 GrabUMZ City of Fort Lauderdale 1/28/1997 MW1 GrabUMZ City of Fort Lauderdale 2/4/1997 MW1 GrabUMZ City of Fort Lauderdale 2/11/1997 MW1 GrabUMZ City of Fort Lauderdale 2/18/1997 MW1 GrabUMZ City of Fort Lauderdale 2/25/1997 MW1 GrabUMZ City of Fort Lauderdale 3/4/1997 MW1 GrabUMZ City of Fort Lauderdale 3/11/1997 MW1 GrabUMZ City of Fort Lauderdale 3/18/1997 MW1 GrabUMZ City of Fort Lauderdale 3/25/1997 MW1 GrabUMZ City of Fort Lauderdale 4/1/1997 MW1 GrabUMZ City of Fort Lauderdale 4/8/1997 MW1 GrabUMZ City of Fort Lauderdale 5/6/1997 MW1 GrabUMZ City of Fort Lauderdale 5/13/1997 MW1 GrabUMZ City of Fort Lauderdale 5/20/1997 MW1 GrabSampling Origin Sampling Facility Sampling Date Sample Description Sampling TypeUMZ City of Fort Lauderdale 5/27/1997 MW1 GrabUMZ City of Fort Lauderdale 6/3/1997 MW1 GrabUMZ City of Fort Lauderdale 6/10/1997 MW1 GrabUMZ City of Fort Lauderdale 6/18/1997 MW1 GrabUMZ City of Fort Lauderdale 6/24/1997 MW1 GrabUMZ City of Fort Lauderdale 7/1/1997 MW1 GrabUMZ City of Fort Lauderdale 7/8/1997 MW1 Grab
FPL-012-164
UMZ City of Fort Lauderdale 7/15/1997 MW1 GrabUMZ City of Fort Lauderdale 7/22/1997 MW1 GrabUMZ City of Fort Lauderdale 7/29/1997 MW1 GrabUMZ City of Fort Lauderdale 8/5/1997 MW1 GrabUMZ City of Fort Lauderdale 8/12/1997 MW1 GrabUMZ City of Fort Lauderdale 8/18/1997 MW1 GrabUMZ City of Fort Lauderdale 8/26/1997 MW1 GrabUMZ City of Fort Lauderdale 9/3/1997 MW1 GrabUMZ City of Fort Lauderdale 9/9/1997 MW1 GrabUMZ City of Fort Lauderdale 9/16/1997 MW1 GrabUMZ City of Fort Lauderdale 9/23/1997 MW1 GrabUMZ City of Fort Lauderdale 9/30/1997 MW1 GrabUMZ City of Fort Lauderdale 10/7/1997 MW1 GrabUMZ City of Fort Lauderdale 10/14/1997 MW1 GrabUMZ City of Fort Lauderdale 10/22/1997 MW1 GrabUMZ City of Fort Lauderdale 10/29/1997 MW1 GrabUMZ City of Fort Lauderdale 11/5/1997 MW1 GrabUMZ City of Fort Lauderdale 11/12/1997 MW1 GrabUMZ City of Fort Lauderdale 11/18/1997 MW1 GrabUMZ City of Fort Lauderdale 11/25/1997 MW1 GrabUMZ City of Fort Lauderdale 12/2/1997 MW1 GrabUMZ City of Fort Lauderdale 12/9/1997 MW1 GrabUMZ City of Fort Lauderdale 12/16/1997 MW1 GrabUMZ City of Fort Lauderdale 12/23/1997 MW1 GrabUMZ City of Fort Lauderdale 12/30/1997 MW1 GrabUMZ City of Fort Lauderdale 1/6/1998 MW1 GrabUMZ City of Fort Lauderdale 1/13/1998 MW1 GrabUMZ City of Fort Lauderdale 1/20/1998 MW1 GrabUMZ City of Fort Lauderdale 1/27/1998 MW1 GrabUMZ City of Fort Lauderdale 2/3/1998 MW1 GrabUMZ City of Fort Lauderdale 2/10/1998 MW1 GrabUMZ City of Fort Lauderdale 2/17/1998 MW1 GrabUMZ City of Fort Lauderdale 2/24/1998 MW1 GrabUMZ City of Fort Lauderdale 3/3/1998 MW1 GrabUMZ City of Fort Lauderdale 3/10/1998 MW1 GrabUMZ City of Fort Lauderdale 3/17/1998 MW1 GrabUMZ City of Fort Lauderdale 3/24/1998 MW1 GrabUMZ City of Fort Lauderdale 3/31/1998 MW1 GrabUMZ City of Fort Lauderdale 4/7/1998 MW1 GrabUMZ City of Fort Lauderdale 4/14/1998 MW1 GrabUMZ City of Fort Lauderdale 4/21/1998 MW1 GrabUMZ City of Fort Lauderdale 4/28/1998 MW1 GrabUMZ City of Fort Lauderdale 5/5/1998 MW1 GrabUMZ City of Fort Lauderdale 5/12/1998 MW1 GrabUMZ City of Fort Lauderdale 5/19/1998 MW1 GrabUMZ City of Fort Lauderdale 5/26/1998 MW1 GrabUMZ City of Fort Lauderdale 6/2/1998 MW1 GrabUMZ City of Fort Lauderdale 6/9/1998 MW1 GrabUMZ City of Fort Lauderdale 6/16/1998 MW1 GrabUMZ City of Fort Lauderdale 6/23/1998 MW1 GrabUMZ City of Fort Lauderdale 6/30/1998 MW1 GrabUMZ City of Fort Lauderdale 7/7/1998 MW1 GrabUMZ City of Fort Lauderdale 7/14/1998 MW1 GrabUMZ City of Fort Lauderdale 7/21/1998 MW1 GrabUMZ City of Fort Lauderdale 7/28/1998 MW1 GrabUMZ City of Fort Lauderdale 8/4/1998 MW1 GrabUMZ City of Fort Lauderdale 8/11/1998 MW1 GrabUMZ City of Fort Lauderdale 8/18/1998 MW1 GrabUMZ City of Fort Lauderdale 8/25/1998 MW1 GrabUMZ City of Fort Lauderdale 9/1/1998 MW1 GrabSampling Origin Sampling Facility Sampling Date Sample Description Sampling TypeUMZ City of Fort Lauderdale 9/8/1998 MW1 GrabUMZ City of Fort Lauderdale 9/15/1998 MW1 GrabUMZ City of Fort Lauderdale 9/22/1998 MW1 GrabUMZ City of Fort Lauderdale 9/29/1998 MW1 GrabUMZ City of Fort Lauderdale 10/6/1998 MW1 GrabUMZ City of Fort Lauderdale 10/13/1998 MW1 GrabUMZ City of Fort Lauderdale 10/20/1998 MW1 GrabUMZ City of Fort Lauderdale 10/27/1998 MW1 GrabUMZ City of Fort Lauderdale 11/3/1998 MW1 GrabUMZ City of Fort Lauderdale 11/10/1998 MW1 GrabUMZ City of Fort Lauderdale 11/17/1998 MW1 Grab
FPL-012-165
UMZ City of Fort Lauderdale 11/24/1998 MW1 GrabUMZ City of Fort Lauderdale 12/1/1998 MW1 GrabUMZ City of Fort Lauderdale 12/8/1998 MW1 GrabUMZ City of Fort Lauderdale 12/15/1998 MW1 GrabUMZ City of Fort Lauderdale 12/22/1998 MW1 GrabUMZ City of Fort Lauderdale 12/29/1998 MW1 GrabUMZ City of Fort Lauderdale 1/5/1999 MW1 GrabUMZ City of Fort Lauderdale 1/12/1999 MW1 GrabUMZ City of Fort Lauderdale 1/19/1999 MW1 GrabUMZ City of Fort Lauderdale 1/26/1999 MW1 GrabUMZ City of Fort Lauderdale 2/2/1999 MW1 GrabUMZ City of Fort Lauderdale 2/9/1999 MW1 GrabUMZ City of Fort Lauderdale 2/16/1999 MW1 GrabUMZ City of Fort Lauderdale 2/23/1999 MW1 GrabUMZ City of Fort Lauderdale 3/2/1999 MW1 GrabUMZ City of Fort Lauderdale 3/9/1999 MW1 GrabUMZ City of Fort Lauderdale 3/16/1999 MW1 GrabUMZ City of Fort Lauderdale 4/6/1999 MW1 GrabUMZ City of Fort Lauderdale 4/13/1999 MW1 GrabUMZ City of Fort Lauderdale 4/20/1999 MW1 GrabUMZ City of Fort Lauderdale 4/27/1999 MW1 GrabUMZ City of Fort Lauderdale 5/4/1999 MW1 GrabUMZ City of Fort Lauderdale 5/11/1999 MW1 GrabUMZ City of Fort Lauderdale 5/18/1999 MW1 GrabUMZ City of Fort Lauderdale 5/25/1999 MW1 GrabUMZ City of Fort Lauderdale 6/1/1999 MW1 GrabUMZ City of Fort Lauderdale 6/8/1999 MW1 GrabUMZ City of Fort Lauderdale 6/15/1999 MW1 GrabUMZ City of Fort Lauderdale 6/22/1999 MW1 GrabUMZ City of Fort Lauderdale 6/29/1999 MW1 GrabUMZ City of Fort Lauderdale 7/6/1999 MW1 GrabUMZ City of Fort Lauderdale 7/13/1999 MW1 GrabUMZ City of Fort Lauderdale 8/3/1999 MW1 GrabUMZ City of Fort Lauderdale 8/10/1999 MW1 GrabUMZ City of Fort Lauderdale 8/17/1999 MW1 GrabUMZ City of Fort Lauderdale 8/24/1999 MW1 GrabUMZ City of Fort Lauderdale 8/31/1999 MW1 GrabUMZ City of Fort Lauderdale 9/7/1999 MW1 GrabUMZ City of Fort Lauderdale 9/15/1999 MW1 GrabUMZ City of Fort Lauderdale 9/21/1999 MW1 GrabUMZ City of Fort Lauderdale 9/28/1999 MW1 GrabUMZ City of Fort Lauderdale 10/5/1999 MW1 GrabUMZ City of Fort Lauderdale 10/12/1999 MW1 GrabUMZ City of Fort Lauderdale 10/19/1999 MW1 GrabUMZ City of Fort Lauderdale 10/26/1999 MW1 GrabUMZ City of Fort Lauderdale 11/2/1999 MW1 GrabUMZ City of Fort Lauderdale 11/9/1999 MW1 GrabUMZ City of Fort Lauderdale 11/16/1999 MW1 GrabUMZ City of Fort Lauderdale 11/23/1999 MW1 GrabUMZ City of Fort Lauderdale 11/30/1999 MW1 GrabUMZ City of Fort Lauderdale 12/7/1999 MW1 GrabUMZ City of Fort Lauderdale 12/14/1999 MW1 GrabUMZ City of Fort Lauderdale 12/21/1999 MW1 GrabUMZ City of Fort Lauderdale 12/28/1999 MW1 GrabUMZ MD-North District 3/19/1996 FAL 1, 2, 3, 4 GrabUMZ MD-North District 3/27/1996 FAL 1, 2, 3, 4 GrabSampling Origin Sampling Facility Sampling Date Sample Description Sampling TypeUMZ MD-North District 4/1/1996 FAL 1, 2, 3, 4 GrabUMZ MD-North District 4/9/1996 FAL 1, 2, 3, 4 GrabUMZ MD-North District 4/16/1996 FAL 1, 2, 3, 4 GrabUMZ MD-North District 4/25/1996 FAL 1, 2, 3, 4 GrabUMZ MD-North District 5/1/1996 FAL 1, 2, 3, 4 GrabUMZ MD-North District 5/9/1996 FAL 1, 2, 3, 4 GrabUMZ MD-North District 5/23/1996 FAL 1, 2, 3, 4 GrabUMZ MD-North District 5/30/1996 FAL 1, 2, 3, 4 GrabUMZ MD-North District 6/3/1996 FAL 1, 2, 3, 4 GrabUMZ MD-North District 6/19/1996 FAL 1, 2, 3, 4 GrabUMZ MD-North District 6/27/1996 FAL 1, 2, 3, 4 GrabUMZ MD-North District 7/16/1996 FAL 1, 2, 3, 4 GrabUMZ MD-North District 7/23/1996 FAL 1, 2, 3, 4 GrabUMZ MD-North District 7/31/1996 FAL 1, 2, 3, 4 GrabUMZ MD-North District 8/8/1996 FAL 1, 2, 3, 4 Grab
FPL-012-166
UMZ MD-North District 8/14/1996 FAL 1, 2, 3, 4 GrabUMZ MD-North District 9/5/1996 FAL 1, 2, 3, 4 GrabUMZ MD-North District 9/11/1996 FAL 1, 2, 3, 4 GrabUMZ MD-North District 9/19/1996 FAL 1, 2, 3, 4 GrabUMZ MD-North District 10/2/1996 FAL 1, 2, 3, 4 GrabUMZ MD-North District 10/7/1996 FAL 1, 2, 3, 4 GrabUMZ MD-North District 10/16/1996 FAL 1, 2, 3, 4 GrabUMZ MD-North District 10/21/1996 FAL 1, 2, 3, 4 GrabUMZ MD-North District 10/28/1996 FAL 1, 2, 3, 4 GrabUMZ MD-North District 12/30/1996 FAL 1, 2, 3, 4 GrabUMZ MD-North District FAL 1, 2, 3, 4 GrabUMZ MD-North District 1/8/1997 FAL 1, 2, 3, 4 GrabUMZ MD-North District 1/13/1997 FAL 1, 2, 3, 4 GrabUMZ MD-North District 1/27/1997 FAL 1, 2, 3, 4 GrabUMZ MD-North District 2/3/1997 FAL 1, 2, 3, 4 GrabUMZ MD-North District 2/10/1997 FAL 1, 2, 3, 4 GrabUMZ MD-North District 2/24/1997 FAL 1, 2, 3, 4 GrabUMZ MD-North District 3/3/1997 FAL 1, 2, 3, 4 GrabUMZ MD-North District 3/17/1997 FAL 1, 2, 3, 4 GrabUMZ MD-North District 3/31/1997 FAL 1, 2, 3, 4 GrabUMZ MD-North District 4/7/1997 FAL 1, 2, 3, 4 GrabUMZ MD-North District 4/15/1997 FAL 1, 2, 3, 4 GrabUMZ MD-North District 4/22/1997 FAL 1, 2, 3, 4 GrabUMZ MD-North District 4/29/1997 FAL 1, 2, 3, 4 GrabUMZ MD-North District 5/6/1997 FAL 1, 2, 3, 4 GrabUMZ MD-North District 5/12/1997 FAL 1, 2, 3, 4 GrabUMZ MD-North District 5/19/1997 FAL 1, 2, 3, 4 GrabUMZ MD-North District 5/27/1997 FAL 1, 2, 3, 4 GrabUMZ MD-North District 6/3/1997 FAL 1, 2, 3, 4 GrabUMZ MD-North District 6/9/1997 FAL 1, 2, 3, 4 GrabUMZ MD-North District 6/16/1997 FAL 1, 2, 3, 4 GrabUMZ MD-North District 6/23/1997 FAL 1, 2, 3, 4 GrabUMZ MD-North District 6/30/1997 FAL 1, 2, 3, 4 GrabUMZ MD-North District 7/9/1997 FAL 1, 2, 3, 4 GrabUMZ MD-North District 7/15/1997 FAL 1, 2, 3, 4 GrabUMZ MD-North District 7/22/1997 FAL 1, 2, 3, 4 GrabUMZ MD-North District 7/29/1997 FAL 1, 2, 3, 4 GrabUMZ MD-North District 8/4/1997 FAL 1, 2, 3, 4 GrabUMZ MD-North District 8/11/1997 FAL 1, 2, 3, 4 GrabUMZ MD-North District 8/18/1997 FAL 1, 2, 3, 4 GrabUMZ MD-North District 8/25/1997 FAL 1, 2, 3, 4 GrabUMZ MD-North District 9/2/1997 FAL 1, 2, 3, 4 GrabUMZ MD-North District 9/8/1997 FAL 1, 2, 3, 4 GrabUMZ MD-North District 9/15/1997 FAL 1, 2, 3, 4 GrabUMZ MD-North District 9/22/1997 FAL 1, 2, 3, 4 GrabUMZ MD-North District 9/29/1997 FAL 1, 2, 3, 4 GrabUMZ MD-North District 10/6/1997 FAL 1, 2, 3, 4 GrabUMZ MD-North District 10/13/1997 FAL 1, 2, 3, 4 GrabUMZ MD-North District 10/21/1997 FAL 1, 2, 3, 4 GrabUMZ MD-North District 10/28/1997 FAL 1, 2, 3, 4 GrabUMZ MD-North District 11/5/1997 FAL 1, 2, 3, 4 GrabUMZ MD-North District 11/10/1997 FAL 1, 2, 3, 4 GrabSampling Origin Sampling Facility Sampling Date Sample Description Sampling TypeUMZ MD-North District 11/17/1997 FAL 1, 2, 3, 4 GrabUMZ MD-North District 11/24/1997 FAL 1, 2, 3, 4 GrabUMZ MD-North District 12/1/1997 FAL 1, 2, 3, 4 GrabUMZ MD-North District 12/8/1997 FAL 1, 2, 3, 4 GrabUMZ MD-North District 12/15/1997 FAL 1, 2, 3, 4 GrabUMZ MD-North District 12/23/1997 FAL 1, 2, 3, 4 GrabUMZ MD-North District 1/6/1998 FAL 1, 2, 3, 4 GrabUMZ MD-North District 1/13/1998 FAL 1, 2, 3, 4 GrabUMZ MD-North District 1/20/1998 FAL 1, 2, 3, 4 GrabUMZ MD-North District 1/28/1998 FAL 1, 2, 3, 4 GrabUMZ MD-North District 2/2/1998 FAL 1, 2, 3, 4 GrabUMZ MD-North District 2/9/1998 FAL 1, 2, 3, 4 GrabUMZ MD-North District 2/17/1998 FAL 1, 2, 3, 4 GrabUMZ MD-North District 2/24/1998 FAL 1, 2, 3, 4 GrabUMZ MD-North District 3/2/1998 FAL 1, 2, 3, 4 GrabUMZ MD-North District 3/9/1998 FAL 1, 2, 3, 4 GrabUMZ MD-North District 3/16/1998 FAL 1, 2, 3, 4 GrabUMZ MD-North District 3/23/1998 FAL 1, 2, 3, 4 GrabUMZ MD-North District 4/8/1998 FAL 1, 2, 3, 4 Grab
FPL-012-167

UMZ MD-North District 4/14/1998 FAL 1, 2, 3, 4 GrabUMZ MD-North District 4/22/1998 FAL 1, 2, 3, 4 GrabUMZ MD-North District 4/27/1998 FAL 1, 2, 3, 4 GrabUMZ MD-North District 5/4/1998 FAL 1, 2, 3, 4 GrabUMZ MD-North District 5/13/1998 FAL 1, 2, 3, 4 GrabUMZ MD-North District 5/18/1998 FAL 1, 2, 3, 4 GrabUMZ MD-North District 5/27/1998 FAL 1, 2, 3, 4 GrabUMZ MD-North District 6/1/1998 FAL 1, 2, 3, 4 GrabUMZ MD-North District 6/9/1998 FAL 1, 2, 3, 4 GrabUMZ MD-North District 6/15/1998 FAL 1, 2, 3, 4 GrabUMZ MD-North District 6/29/1998 FAL 1, 2, 3, 4 GrabUMZ MD-North District 7/5/1998 FAL 1, 2, 3, 4 GrabUMZ MD-North District 7/10/1998 FAL 1, 2, 3, 4 GrabUMZ MD-North District 7/20/1998 FAL 1, 2, 3, 4 GrabUMZ MD-North District 7/27/1998 FAL 1, 2, 3, 4 GrabUMZ MD-North District 8/10/1998 FAL 1, 2, 3, 4 GrabUMZ MD-North District 8/17/1998 FAL 1, 2, 3, 4 GrabUMZ MD-North District 8/25/1998 FAL 1, 2, 3, 4 GrabUMZ MD-North District 8/31/1998 FAL 1, 2, 3, 4 GrabUMZ MD-North District 9/9/1998 FAL 1, 2, 3, 4 GrabUMZ MD-North District 9/14/1998 FAL 1, 2, 3, 4 GrabUMZ MD-North District 9/23/1998 FAL 1, 2, 3, 4 GrabUMZ MD-North District 9/28/1998 FAL 1, 2, 3, 4 GrabUMZ MD-North District 10/5/1998 FAL 1, 2, 3, 4 GrabUMZ MD-North District 10/13/1998 FAL 1, 2, 3, 4 GrabUMZ MD-North District 10/19/1998 FAL 1, 2, 3, 4 GrabUMZ MD-North District 11/4/1998 FAL 1, 2, 3, 4 GrabUMZ MD-North District 11/9/1998 FAL 1, 2, 3, 4 GrabUMZ MD-North District 11/18/1998 FAL 1, 2, 3, 4 GrabUMZ MD-North District 11/23/1998 FAL 1, 2, 3, 4 GrabUMZ MD-North District 12/9/1998 FAL 1, 2, 3, 4 GrabUMZ MD-North District 12/22/1998 FAL 1, 2, 3, 4 GrabUMZ MD-North District 12/28/1998 FAL 1, 2, 3, 4 GrabUMZ MD-North District 1/5/1999 FAL 1, 2, 3, 4 GrabUMZ MD-North District 1/20/1999 FAL 1, 2, 3, 4 GrabUMZ MD-North District 1/25/1999 FAL 1, 2, 3, 4 GrabUMZ MD-North District 2/8/1999 FAL 1, 2, 3, 4 GrabUMZ MD-North District 2/16/1999 FAL 1, 2, 3, 4 GrabUMZ MD-North District 2/27/1999 FAL 1, 2, 3, 4 GrabUMZ MD-North District 3/1/1999 FAL 1, 2, 3, 4 GrabUMZ MD-North District 3/8/1999 FAL 1, 2, 3, 4 GrabUMZ MD-North District 3/15/1999 FAL 1, 2, 3, 4 GrabUMZ MD-North District 3/22/1999 FAL 1, 2, 3, 4 GrabUMZ MD-North District 3/29/1999 FAL 1, 2, 3, 4 GrabUMZ MD-North District 4/7/1999 FAL 1, 2, 3, 4 GrabUMZ MD-North District 4/12/1999 FAL 1, 2, 3, 4 GrabUMZ MD-North District 4/19/1999 FAL 1, 2, 3, 4 GrabUMZ MD-North District 4/29/1999 FAL 1, 2, 3, 4 GrabSampling Origin Sampling Facility Sampling Date Sample Description Sampling TypeUMZ MD-North District 5/4/1999 FAL 1, 2, 3, 4 GrabUMZ MD-North District 5/10/1999 FAL 1, 2, 3, 4 GrabUMZ MD-North District 5/17/1999 FAL 1, 2, 3, 4 GrabUMZ MD-North District 5/24/1999 FAL 1, 2, 3, 4 GrabUMZ MD-North District 6/2/1999 FAL 1, 2, 3, 4 GrabUMZ MD-North District 6/7/1999 FAL 1, 2, 3, 4 GrabUMZ MD-North District 6/14/1999 FAL 1, 2, 3, 4 GrabUMZ MD-North District 6/30/1999 FAL 1, 2, 3, 4 GrabUMZ MD-North District 7/7/1999 FAL 1, 2, 3, 4 GrabUMZ MD-North District 7/12/1999 FAL 1, 2, 3, 4 GrabUMZ MD-North District 7/19/1999 FAL 1, 2, 3, 4 GrabUMZ MD-North District 7/26/1999 FAL 1, 2, 3, 4 GrabUMZ MD-North District 8/2/1999 FAL 1, 2, 3, 4 GrabUMZ MD-North District 8/9/1999 FAL 1, 2, 3, 4 GrabUMZ MD-North District 8/16/1999 FAL 1, 2, 3, 4 GrabUMZ MD-North District 8/23/1999 FAL 1, 2, 3, 4 GrabUMZ MD-North District 9/1/1999 FAL 1, 2, 3, 4 GrabUMZ MD-North District 9/7/1999 FAL 1, 2, 3, 4 GrabUMZ MD-North District 9/13/1999 FAL 1, 2, 3, 4 GrabUMZ MD-North District 9/20/1999 FAL 1, 2, 3, 4 GrabUMZ MD-North District 10/6/1999 FAL 1, 2, 3, 4 GrabUMZ MD-North District 10/13/1999 FAL 1, 2, 3, 4 GrabUMZ MD-North District 10/18/1999 FAL 1, 2, 3, 4 Grab
FPL-012-168
UMZ MD-North District 10/25/1999 FAL 1, 2, 3, 4 GrabUMZ MD-North District 11/1/1999 FAL 1, 2, 3, 4 GrabUMZ MD-North District 11/8/1999 FAL 1, 2, 3, 4 GrabUMZ MD-North District 11/15/1999 FAL 1, 2, 3, 4 GrabUMZ MD-North District 11/22/1999 FAL 1, 2, 3, 4 GrabUMZ MD-North District 12/6/1999 FAL 1, 2, 3, 4 GrabUMZ MD-North District 12/13/1999 FAL 1, 2, 3, 4 GrabUMZ MD-North District 12/20/1999 FAL 1, 2, 3, 4 GrabUMZ MD-North District 12/27/1999 FAL 1, 2, 3, 4 GrabUMZ MD-North District 1/3/2000 FAL 1, 2, 3, 4 GrabUMZ MD-North District 1/10/2000 FAL 1, 2, 3, 4 GrabUMZ MD-North District 1/18/2000 FAL 1, 2, 3, 4 GrabUMZ MD-North District 1/24/2000 FAL 1, 2, 3, 4 GrabUMZ MD-North District 2/7/2000 FAL 1, 2, 3, 4 GrabUMZ MD-North District 2/14/2000 FAL 1, 2, 3, 4 GrabUMZ MD-North District 2/22/2000 FAL 1, 2, 3, 4 GrabUMZ MD-North District 2/28/2000 FAL 1, 2, 3, 4 GrabUMZ MD-North District 3/6/2000 FAL 1, 2, 3, 4 GrabUMZ MD-North District 3/13/2000 FAL 1, 2, 3, 4 GrabUMZ MD-North District 3/20/2000 FAL 1, 2, 3, 4 GrabUMZ MD-North District 3/27/2000 FAL 1, 2, 3, 4 GrabUMZ MD-North District 4/4/2000 FAL 1, 2, 3, 4 GrabUMZ MD-North District 4/10/2000 FAL 1, 2, 3, 4 GrabUMZ MD-North District 4/22/2000 FAL 1, 2, 3, 4 GrabUMZ MD-North District 4/26/2000 FAL 1, 2, 3, 4 GrabUMZ MD-North District 5/1/2000 FAL 1, 2, 3, 4 GrabUMZ MD-North District 5/8/2000 FAL 1, 2, 3, 4 GrabUMZ MD-North District 5/21/2000 FAL 1, 2, 3, 4 GrabUMZ MD-North District 5/24/2000 FAL 1, 2, 3, 4 GrabUMZ MD-North District 5/31/2000 FAL 1, 2, 3, 4 GrabUMZ MD-South District 12/1/1983 FAL1,2,3,4,5,6,7,8,9,10,11,12,13,14,15,16 GrabUMZ MD-South District 3/1/1984 FAL1,2,3,4,5,6,7,8,9,10,11,12,13,14,15,16 GrabUMZ MD-South District 6/1/1984 FAL1,2,3,4,5,6,7,8,9,10,11,12,13,14,15,16 GrabUMZ MD-South District 9/1/1984 FAL1,2,3,4,5,6,7,8,9,10,11,12,13,14,15,16 GrabUMZ MD-South District 12/1/1984 FAL1,2,3,4,5,6,7,8,9,10,11,12,13,14,15,16 GrabUMZ MD-South District 3/1/1985 FAL1,2,3,4,5,6,7,8,9,10,11,12,13,14,15,16 GrabUMZ MD-South District 6/1/1985 FAL1,2,3,4,5,6,7,8,9,10,11,12,13,14,15,16 GrabUMZ MD-South District 9/1/1985 FAL1,2,3,4,5,6,7,8,9,10,11,12,13,14,15,16 GrabUMZ MD-South District 12/1/1985 FAL1,2,3,4,5,6,7,8,9,10,11,12,13,14,15,16 GrabUMZ MD-South District 3/1/1986 FAL1,2,3,4,5,6,7,8,9,10,11,12,13,14,15,16 GrabUMZ MD-South District 6/1/1986 FAL1,2,3,4,5,6,7,8,9,10,11,12,13,14,15,16 GrabUMZ MD-South District 9/1/1986 FAL1,2,3,4,5,6,7,8,9,10,11,12,13,14,15,16 GrabSampling Origin Sampling Facility Sampling Date Sample Description Sampling TypeUMZ MD-South District 12/1/1986 FAL1,2,3,4,5,6,7,8,9,10,11,12,13,14,15,16 GrabUMZ MD-South District 3/1/1987 FAL1,2,3,4,5,6,7,8,9,10,11,12,13,14,15,16 GrabUMZ MD-South District 6/1/1987 FAL1,2,3,4,5,6,7,8,9,10,11,12,13,14,15,16 GrabUMZ MD-South District 9/1/1987 FAL1,2,3,4,5,6,7,8,9,10,11,12,13,14,15,16 GrabUMZ MD-South District 12/1/1987 FAL1,2,3,4,5,6,7,8,9,10,11,12,13,14,15,16 GrabUMZ MD-South District 3/1/1988 FAL1,2,3,4,5,6,7,8,9,10,11,12,13,14,15,16 GrabUMZ MD-South District 6/1/1988 FAL1,2,3,4,5,6,7,8,9,10,11,12,13,14,15,16 GrabUMZ MD-South District 9/1/1988 FAL1,2,3,4,5,6,7,8,9,10,11,12,13,14,15,16 GrabUMZ MD-South District 12/1/1988 FAL1,2,3,4,5,6,7,8,9,10,11,12,13,14,15,16 GrabUMZ MD-South District 3/1/1989 FAL1,2,3,4,5,6,7,8,9,10,11,12,13,14,15,16 GrabUMZ MD-South District 6/1/1989 FAL1,2,3,4,5,6,7,8,9,10,11,12,13,14,15,16 GrabUMZ MD-South District 9/1/1989 FAL1,2,3,4,5,6,7,8,9,10,11,12,13,14,15,16 GrabUMZ MD-South District 10/1/1989 FAL1,2,3,4,5,6,7,8,9,10,11,12,13,14,15,16 GrabUMZ MD-South District 11/1/1989 FAL1,2,3,4,5,6,7,8,9,10,11,12,13,14,15,16 GrabUMZ MD-South District 12/1/1989 FAL1,2,3,4,5,6,7,8,9,10,11,12,13,14,15,16 GrabUMZ MD-South District 3/1/1990 FAL1,2,3,4,5,6,7,8,9,10,11,12,13,14,15,16 GrabUMZ MD-South District 4/1/1990 FAL1,2,3,4,5,6,7,8,9,10,11,12,13,14,15,16 GrabUMZ MD-South District 5/1/1990 FAL1,2,3,4,5,6,7,8,9,10,11,12,13,14,15,16 GrabUMZ MD-South District 6/1/1990 FAL1,2,3,4,5,6,7,8,9,10,11,12,13,14,15,16 GrabUMZ MD-South District 8/1/1990 FAL1,2,3,4,5,6,7,8,9,10,11,12,13,14,15,16 GrabUMZ MD-South District 9/1/1990 FAL1,2,3,4,5,6,7,8,9,10,11,12,13,14,15,16 GrabUMZ MD-South District 10/1/1990 FAL1,2,3,4,5,6,7,8,9,10,11,12,13,14,15,16 GrabUMZ MD-South District 11/1/1990 FAL1,2,3,4,5,6,7,8,9,10,11,12,13,14,15,16 GrabUMZ MD-South District 1/1/1991 FAL1,2,3,4,5,6,7,8,9,10,11,12,13,14,15,16 Grab
FPL-012-169

UMZ MD-South District 2/1/1991 FAL1,2,3,4,5,6,7,8,9,10,11,12,13,14,15,16 GrabUMZ MD-South District 3/1/1991 FAL1,2,3,4,5,6,7,8,9,10,11,12,13,14,15,16 GrabUMZ MD-South District 4/1/1991 FAL1,2,3,4,5,6,7,8,9,10,11,12,13,14,15,16 GrabUMZ MD-South District 5/7/1991 FAL1,2,3,4,5,6,7,8,9,10,11,12,13,14,15,16 GrabUMZ MD-South District 5/14/1991 FAL1,2,3,4,5,6,7,8,9,10,11,12,13,14,15,16 GrabUMZ MD-South District 5/21/1991 FAL1,2,3,4,5,6,7,8,9,10,11,12,13,14,15,16 GrabUMZ MD-South District 5/28/1991 FAL1,2,3,4,5,6,7,8,9,10,11,12,13,14,15,16 GrabUMZ MD-South District 6/4/1991 FAL1,2,3,4,5,6,7,8,9,10,11,12,13,14,15,16 GrabUMZ MD-South District 6/11/1991 FAL1,2,3,4,5,6,7,8,9,10,11,12,13,14,15,16 GrabUMZ MD-South District 6/18/1991 FAL1,2,3,4,5,6,7,8,9,10,11,12,13,14,15,16 GrabUMZ MD-South District 6/25/1991 FAL1,2,3,4,5,6,7,8,9,10,11,12,13,14,15,16 GrabUMZ MD-South District 7/2/1991 FAL1,2,3,4,5,6,7,8,9,10,11,12,13,14,15,16 GrabUMZ MD-South District 7/9/1991 FAL1,2,3,4,5,6,7,8,9,10,11,12,13,14,15,16 GrabUMZ MD-South District 7/16/1991 FAL1,2,3,4,5,6,7,8,9,10,11,12,13,14,15,16 GrabUMZ MD-South District 7/23/1991 FAL1,2,3,4,5,6,7,8,9,10,11,12,13,14,15,16 GrabUMZ MD-South District 7/30/1991 FAL1,2,3,4,5,6,7,8,9,10,11,12,13,14,15,16 GrabUMZ MD-South District 8/6/1991 FAL1,2,3,4,5,6,7,8,9,10,11,12,13,14,15,16 GrabUMZ MD-South District 8/13/1991 FAL1,2,3,4,5,6,7,8,9,10,11,12,13,14,15,16 GrabUMZ MD-South District 8/20/1991 FAL1,2,3,4,5,6,7,8,9,10,11,12,13,14,15,16 GrabUMZ MD-South District 8/27/1991 FAL1,2,3,4,5,6,7,8,9,10,11,12,13,14,15,16 GrabUMZ MD-South District 9/3/1991 FAL1,2,3,4,5,6,7,8,9,10,11,12,13,14,15,16 GrabUMZ MD-South District 9/10/1991 FAL1,2,3,4,5,6,7,8,9,10,11,12,13,14,15,16 GrabUMZ MD-South District 9/17/1991 FAL1,2,3,4,5,6,7,8,9,10,11,12,13,14,15,16 GrabUMZ MD-South District 10/1/1991 FAL1,2,3,4,5,6,7,8,9,10,11,12,13,14,15,16 GrabUMZ MD-South District 10/8/1991 FAL1,2,3,4,5,6,7,8,9,10,11,12,13,14,15,16 GrabUMZ MD-South District 10/16/1991 FAL1,2,3,4,5,6,7,8,9,10,11,12,13,14,15,16 GrabUMZ MD-South District 10/22/1991 FAL1,2,3,4,5,6,7,8,9,10,11,12,13,14,15,16 GrabUMZ MD-South District 10/29/1991 FAL1,2,3,4,5,6,7,8,9,10,11,12,13,14,15,16 GrabUMZ MD-South District 11/5/1991 FAL1,2,3,4,5,6,7,8,9,10,11,12,13,14,15,16 GrabUMZ MD-South District 11/13/1991 FAL1,2,3,4,5,6,7,8,9,10,11,12,13,14,15,16 GrabUMZ MD-South District 11/19/1991 FAL1,2,3,4,5,6,7,8,9,10,11,12,13,14,15,16 GrabUMZ MD-South District 11/26/1991 FAL1,2,3,4,5,6,7,8,9,10,11,12,13,14,15,16 GrabUMZ MD-South District 12/3/1991 FAL1,2,3,4,5,6,7,8,9,10,11,12,13,14,15,16 GrabUMZ MD-South District 12/10/1991 FAL1,2,3,4,5,6,7,8,9,10,11,12,13,14,15,16 GrabUMZ MD-South District 12/17/1991 FAL1,2,3,4,5,6,7,8,9,10,11,12,13,14,15,16 GrabSampling Origin Sampling Facility Sampling Date Sample Description Sampling TypeUMZ MD-South District 12/26/1991 FAL1,2,3,4,5,6,7,8,9,10,11,12,13,14,15,16 GrabUMZ MD-South District 1/2/1992 FAL1,2,3,4,5,6,7,8,9,10,11,12,13,14,15,16 GrabUMZ MD-South District 1/14/1992 FAL1,2,3,4,5,6,7,8,9,10,11,12,13,14,15,16 GrabUMZ MD-South District 1/21/1992 FAL1,2,3,4,5,6,7,8,9,10,11,12,13,14,15,16 GrabUMZ MD-South District 1/28/1992 FAL1,2,3,4,5,6,7,8,9,10,11,12,13,14,15,16 GrabUMZ MD-South District 2/4/1992 FAL1,2,3,4,5,6,7,8,9,10,11,12,13,14,15,16 GrabUMZ MD-South District 2/13/1992 FAL1,2,3,4,5,6,7,8,9,10,11,12,13,14,15,16 GrabUMZ MD-South District 2/18/1992 FAL1,2,3,4,5,6,7,8,9,10,11,12,13,14,15,16 GrabUMZ MD-South District 2/25/1992 FAL1,2,3,4,5,6,7,8,9,10,11,12,13,14,15,16 GrabUMZ MD-South District 3/3/1992 FAL1,2,3,4,5,6,7,8,9,10,11,12,13,14,15,16 GrabUMZ MD-South District 3/10/1992 FAL1,2,3,4,5,6,7,8,9,10,11,12,13,14,15,16 GrabUMZ MD-South District 3/17/1992 FAL1,2,3,4,5,6,7,8,9,10,11,12,13,14,15,16 GrabUMZ MD-South District 3/26/1992 FAL1,2,3,4,5,6,7,8,9,10,11,12,13,14,15,16 GrabUMZ MD-South District 3/31/1992 FAL1,2,3,4,5,6,7,8,9,10,11,12,13,14,15,16 GrabUMZ MD-South District 4/7/1992 FAL1,2,3,4,5,6,7,8,9,10,11,12,13,14,15,16 GrabUMZ MD-South District 4/14/1992 FAL1,2,3,4,5,6,7,8,9,10,11,12,13,14,15,16 GrabUMZ MD-South District 4/21/1992 FAL1,2,3,4,5,6,7,8,9,10,11,12,13,14,15,16 GrabUMZ MD-South District 4/28/1992 FAL1,2,3,4,5,6,7,8,9,10,11,12,13,14,15,16 GrabUMZ MD-South District 5/5/1992 FAL1,2,3,4,5,6,7,8,9,10,11,12,13,14,15,16 GrabUMZ MD-South District 5/12/1992 FAL1,2,3,4,5,6,7,8,9,10,11,12,13,14,15,16 GrabUMZ MD-South District 5/20/1992 FAL1,2,3,4,5,6,7,8,9,10,11,12,13,14,15,16 GrabUMZ MD-South District 5/26/1992 FAL1,2,3,4,5,6,7,8,9,10,11,12,13,14,15,16 GrabUMZ MD-South District 6/3/1992 FAL1,2,3,4,5,6,7,8,9,10,11,12,13,14,15,16 GrabUMZ MD-South District 6/9/1992 FAL1,2,3,4,5,6,7,8,9,10,11,12,13,14,15,16 GrabUMZ MD-South District 6/16/1992 FAL1,2,3,4,5,6,7,8,9,10,11,12,13,14,15,16 GrabUMZ MD-South District 6/23/1992 FAL1,2,3,4,5,6,7,8,9,10,11,12,13,14,15,16 GrabUMZ MD-South District 6/30/1992 FAL1,2,3,4,5,6,7,8,9,10,11,12,13,14,15,16 GrabUMZ MD-South District 7/7/1992 FAL1,2,3,4,5,6,7,8,9,10,11,12,13,14,15,16 Grab
FPL-012-170

UMZ MD-South District 7/14/1992 FAL1,2,3,4,5,6,7,8,9,10,11,12,13,14,15,16 GrabUMZ MD-South District 7/21/1992 FAL1,2,3,4,5,6,7,8,9,10,11,12,13,14,15,16 GrabUMZ MD-South District 7/28/1992 FAL1,2,3,4,5,6,7,8,9,10,11,12,13,14,15,16 GrabUMZ MD-South District 8/4/1992 FAL1,2,3,4,5,6,7,8,9,10,11,12,13,14,15,16 GrabUMZ MD-South District 8/11/1992 FAL1,2,3,4,5,6,7,8,9,10,11,12,13,14,15,16 GrabUMZ MD-South District 8/18/1992 FAL1,2,3,4,5,6,7,8,9,10,11,12,13,14,15,16 GrabUMZ MD-South District 7/13/1993 FAL1,2,3,4,5,6,7,8,9,10,11,12,13,14,15,16 GrabUMZ MD-South District 12/7/1993 FAL1,2,3,4,5,6,7,8,9,10,11,12,13,14,15,16 GrabUMZ MD-South District 12/14/1993 FAL1,2,3,4,5,6,7,8,9,10,11,12,13,14,15,16 GrabUMZ MD-South District 12/21/1993 FAL1,2,3,4,5,6,7,8,9,10,11,12,13,14,15,16 GrabUMZ MD-South District 12/28/1993 FAL1,2,3,4,5,6,7,8,9,10,11,12,13,14,15,16 GrabUMZ MD-South District 1/6/1994 FAL1,2,3,4,5,6,7,8,9,10,11,12,13,14,15,16 GrabUMZ MD-South District 1/11/1994 FAL1,2,3,4,5,6,7,8,9,10,11,12,13,14,15,16 GrabUMZ MD-South District 1/18/1994 FAL1,2,3,4,5,6,7,8,9,10,11,12,13,14,15,16 GrabUMZ MD-South District 1/25/1994 FAL1,2,3,4,5,6,7,8,9,10,11,12,13,14,15,16 GrabUMZ MD-South District 2/2/1994 FAL1,2,3,4,5,6,7,8,9,10,11,12,13,14,15,16 GrabUMZ MD-South District 2/8/1994 FAL1,2,3,4,5,6,7,8,9,10,11,12,13,14,15,16 GrabUMZ MD-South District 2/15/1994 FAL1,2,3,4,5,6,7,8,9,10,11,12,13,14,15,16 GrabUMZ MD-South District 2/22/1994 FAL1,2,3,4,5,6,7,8,9,10,11,12,13,14,15,16 GrabUMZ MD-South District 3/1/1994 FAL1,2,3,4,5,6,7,8,9,10,11,12,13,14,15,16 GrabUMZ MD-South District 3/8/1994 FAL1,2,3,4,5,6,7,8,9,10,11,12,13,14,15,16 GrabUMZ MD-South District 3/15/1994 FAL1,2,3,4,5,6,7,8,9,10,11,12,13,14,15,16 GrabUMZ MD-South District 3/22/1994 FAL1,2,3,4,5,6,7,8,9,10,11,12,13,14,15,16 GrabUMZ MD-South District 3/29/1994 FAL1,2,3,4,5,6,7,8,9,10,11,12,13,14,15,16 GrabUMZ MD-South District 4/6/1994 FAL1,2,3,4,5,6,7,8,9,10,11,12,13,14,15,16 GrabUMZ MD-South District 4/13/1994 FAL1,2,3,4,5,6,7,8,9,10,11,12,13,14,15,16 GrabUMZ MD-South District 4/19/1994 FAL1,2,3,4,5,6,7,8,9,10,11,12,13,14,15,16 GrabUMZ MD-South District 4/26/1994 FAL1,2,3,4,5,6,7,8,9,10,11,12,13,14,15,16 GrabUMZ MD-South District 5/3/1994 FAL1,2,3,4,5,6,7,8,9,10,11,12,13,14,15,16 GrabUMZ MD-South District 5/10/1994 FAL1,2,3,4,5,6,7,8,9,10,11,12,13,14,15,16 GrabUMZ MD-South District 5/17/1994 FAL1,2,3,4,5,6,7,8,9,10,11,12,13,14,15,16 GrabSampling Origin Sampling Facility Sampling Date Sample Description Sampling TypeUMZ MD-South District 5/24/1994 FAL1,2,3,4,5,6,7,8,9,10,11,12,13,14,15,16 GrabUMZ MD-South District 5/31/1994 FAL1,2,3,4,5,6,7,8,9,10,11,12,13,14,15,16 GrabUMZ MD-South District 6/7/1994 FAL1,2,3,4,5,6,7,8,9,10,11,12,13,14,15,16 GrabUMZ MD-South District 6/14/1994 FAL1,2,3,4,5,6,7,8,9,10,11,12,13,14,15,16 GrabUMZ MD-South District 6/21/1994 FAL1,2,3,4,5,6,7,8,9,10,11,12,13,14,15,16 GrabUMZ MD-South District 6/28/1994 FAL1,2,3,4,5,6,7,8,9,10,11,12,13,14,15,16 GrabUMZ MD-South District 7/5/1994 FAL1,2,3,4,5,6,7,8,9,10,11,12,13,14,15,16 GrabUMZ MD-South District 7/12/1994 FAL1,2,3,4,5,6,7,8,9,10,11,12,13,14,15,16 GrabUMZ MD-South District 7/19/1994 FAL1,2,3,4,5,6,7,8,9,10,11,12,13,14,15,16 GrabUMZ MD-South District 7/26/1994 FAL1,2,3,4,5,6,7,8,9,10,11,12,13,14,15,16 GrabUMZ MD-South District 8/2/1994 FAL1,2,3,4,5,6,7,8,9,10,11,12,13,14,15,16 GrabUMZ MD-South District 8/9/1994 FAL1,2,3,4,5,6,7,8,9,10,11,12,13,14,15,16 GrabUMZ MD-South District 8/16/1994 FAL1,2,3,4,5,6,7,8,9,10,11,12,13,14,15,16 GrabUMZ MD-South District 8/23/1994 FAL1,2,3,4,5,6,7,8,9,10,11,12,13,14,15,16 GrabUMZ MD-South District 8/30/1994 FAL1,2,3,4,5,6,7,8,9,10,11,12,13,14,15,16 GrabUMZ MD-South District 9/6/1994 FAL1,2,3,4,5,6,7,8,9,10,11,12,13,14,15,16 GrabUMZ MD-South District 9/12/1994 FAL1,2,3,4,5,6,7,8,9,10,11,12,13,14,15,16 GrabUMZ MD-South District 9/19/1994 FAL1,2,3,4,5,6,7,8,9,10,11,12,13,14,15,16 GrabUMZ MD-South District 9/26/1994 FAL1,2,3,4,5,6,7,8,9,10,11,12,13,14,15,16 GrabUMZ MD-South District 10/3/1994 FAL1,2,3,4,5,6,7,8,9,10,11,12,13,14,15,16 GrabUMZ MD-South District 10/11/1994 FAL1,2,3,4,5,6,7,8,9,10,11,12,13,14,15,16 GrabUMZ MD-South District 10/17/1994 FAL1,2,3,4,5,6,7,8,9,10,11,12,13,14,15,16 GrabUMZ MD-South District 10/26/1994 FAL1,2,3,4,5,6,7,8,9,10,11,12,13,14,15,16 GrabUMZ MD-South District 10/31/1994 FAL1,2,3,4,5,6,7,8,9,10,11,12,13,14,15,16 GrabUMZ MD-South District 11/8/1994 FAL1,2,3,4,5,6,7,8,9,10,11,12,13,14,15,16 GrabUMZ MD-South District 11/21/1994 FAL1,2,3,4,5,6,7,8,9,10,11,12,13,14,15,16 GrabUMZ MD-South District 11/28/1994 FAL1,2,3,4,5,6,7,8,9,10,11,12,13,14,15,16 GrabUMZ MD-South District 12/6/1994 FAL1,2,3,4,5,6,7,8,9,10,11,12,13,14,15,16 GrabUMZ MD-South District 12/12/1994 FAL1,2,3,4,5,6,7,8,9,10,11,12,13,14,15,16 GrabUMZ MD-South District 12/19/1994 FAL1,2,3,4,5,6,7,8,9,10,11,12,13,14,15,16 GrabUMZ MD-South District 12/28/1994 FAL1,2,3,4,5,6,7,8,9,10,11,12,13,14,15,16 GrabUMZ MD-South District 1/4/1995 FAL1,2,3,4,5,6,7,8,9,10,11,12,13,14,15,16 Grab
FPL-012-171

UMZ MD-South District 1/10/1995 FAL1,2,3,4,5,6,7,8,9,10,11,12,13,14,15,16 GrabUMZ MD-South District 1/17/1995 FAL1,2,3,4,5,6,7,8,9,10,11,12,13,14,15,16 GrabUMZ MD-South District 1/23/1995 FAL1,2,3,4,5,6,7,8,9,10,11,12,13,14,15,16 GrabUMZ MD-South District 1/31/1995 FAL1,2,3,4,5,6,7,8,9,10,11,12,13,14,15,16 GrabUMZ MD-South District 2/6/1995 FAL1,2,3,4,5,6,7,8,9,10,11,12,13,14,15,16 GrabUMZ MD-South District 2/13/1995 FAL1,2,3,4,5,6,7,8,9,10,11,12,13,14,15,16 GrabUMZ MD-South District 2/21/1995 FAL1,2,3,4,5,6,7,8,9,10,11,12,13,14,15,16 GrabUMZ MD-South District 2/28/1995 FAL1,2,3,4,5,6,7,8,9,10,11,12,13,14,15,16 GrabUMZ MD-South District 3/8/1995 FAL1,2,3,4,5,6,7,8,9,10,11,12,13,14,15,16 GrabUMZ MD-South District 3/14/1995 FAL1,2,3,4,5,6,7,8,9,10,11,12,13,14,15,16 GrabUMZ MD-South District 3/21/1995 FAL1,2,3,4,5,6,7,8,9,10,11,12,13,14,15,16 GrabUMZ MD-South District 3/28/1995 FAL1,2,3,4,5,6,7,8,9,10,11,12,13,14,15,16 GrabUMZ MD-South District 4/4/1995 FAL1,2,3,4,5,6,7,8,9,10,11,12,13,14,15,16 GrabUMZ MD-South District 4/12/1995 FAL1,2,3,4,5,6,7,8,9,10,11,12,13,14,15,16 GrabUMZ MD-South District 4/18/1995 FAL1,2,3,4,5,6,7,8,9,10,11,12,13,14,15,16 GrabUMZ MD-South District 4/25/1995 FAL1,2,3,4,5,6,7,8,9,10,11,12,13,14,15,16 GrabUMZ MD-South District 5/2/1995 FAL1,2,3,4,5,6,7,8,9,10,11,12,13,14,15,16 GrabUMZ MD-South District 5/8/1995 FAL1,2,3,4,5,6,7,8,9,10,11,12,13,14,15,16 GrabUMZ MD-South District 5/16/1995 FAL1,2,3,4,5,6,7,8,9,10,11,12,13,14,15,16 GrabUMZ MD-South District 5/23/1995 FAL1,2,3,4,5,6,7,8,9,10,11,12,13,14,15,16 GrabUMZ MD-South District 5/31/1995 FAL1,2,3,4,5,6,7,8,9,10,11,12,13,14,15,16 GrabUMZ MD-South District 6/7/1995 FAL1,2,3,4,5,6,7,8,9,10,11,12,13,14,15,16 GrabUMZ MD-South District 6/13/1995 FAL1,2,3,4,5,6,7,8,9,10,11,12,13,14,15,16 GrabUMZ MD-South District 6/20/1995 FAL1,2,3,4,5,6,7,8,9,10,11,12,13,14,15,16 GrabUMZ MD-South District 6/27/1995 FAL1,2,3,4,5,6,7,8,9,10,11,12,13,14,15,16 GrabUMZ MD-South District 7/5/1995 FAL1,2,3,4,5,6,7,8,9,10,11,12,13,14,15,16 GrabUMZ MD-South District 7/11/1995 FAL1,2,3,4,5,6,7,8,9,10,11,12,13,14,15,16 GrabSampling Origin Sampling Facility Sampling Date Sample Description Sampling TypeUMZ MD-South District 7/18/1995 FAL1,2,3,4,5,6,7,8,9,10,11,12,13,14,15,16 GrabUMZ MD-South District 7/21/1995 FAL1,2,3,4,5,6,7,8,9,10,11,12,13,14,15,16 GrabUMZ MD-South District 8/3/1995 FAL1,2,3,4,5,6,7,8,9,10,11,12,13,14,15,16 GrabUMZ MD-South District 8/8/1995 FAL1,2,3,4,5,6,7,8,9,10,11,12,13,14,15,16 GrabUMZ MD-South District 8/15/1995 FAL1,2,3,4,5,6,7,8,9,10,11,12,13,14,15,16 GrabUMZ MD-South District 8/23/1995 FAL1,2,3,4,5,6,7,8,9,10,11,12,13,14,15,16 GrabUMZ MD-South District 8/29/1995 FAL1,2,3,4,5,6,7,8,9,10,11,12,13,14,15,16 GrabUMZ MD-South District 9/5/1995 FAL1,2,3,4,5,6,7,8,9,10,11,12,13,14,15,16 GrabUMZ MD-South District 9/12/1995 FAL1,2,3,4,5,6,7,8,9,10,11,12,13,14,15,16 GrabUMZ MD-South District 9/19/1995 FAL1,2,3,4,5,6,7,8,9,10,11,12,13,14,15,16 GrabUMZ MD-South District 9/28/1995 FAL1,2,3,4,5,6,7,8,9,10,11,12,13,14,15,16 GrabUMZ MD-South District 10/3/1995 FAL1,2,3,4,5,6,7,8,9,10,11,12,13,14,15,16 GrabUMZ MD-South District 10/11/1995 FAL1,2,3,4,5,6,7,8,9,10,11,12,13,14,15,16 GrabUMZ MD-South District 10/17/1995 FAL1,2,3,4,5,6,7,8,9,10,11,12,13,14,15,16 GrabUMZ MD-South District 10/24/1995 FAL1,2,3,4,5,6,7,8,9,10,11,12,13,14,15,16 GrabUMZ MD-South District 10/31/1995 FAL1,2,3,4,5,6,7,8,9,10,11,12,13,14,15,16 GrabUMZ MD-South District 11/7/1995 FAL1,2,3,4,5,6,7,8,9,10,11,12,13,14,15,16 GrabUMZ MD-South District 11/14/1995 FAL1,2,3,4,5,6,7,8,9,10,11,12,13,14,15,16 GrabUMZ MD-South District 11/21/1995 FAL1,2,3,4,5,6,7,8,9,10,11,12,13,14,15,16 GrabUMZ MD-South District 11/28/1995 FAL1,2,3,4,5,6,7,8,9,10,11,12,13,14,15,16 GrabUMZ MD-South District 12/5/1995 FAL1,2,3,4,5,6,7,8,9,10,11,12,13,14,15,16 GrabUMZ MD-South District 12/12/1995 FAL1,2,3,4,5,6,7,8,9,10,11,12,13,14,15,16 GrabUMZ MD-South District 12/19/1995 FAL1,2,3,4,5,6,7,8,9,10,11,12,13,14,15,16 GrabUMZ MD-South District 12/29/1995 FAL1,2,3,4,5,6,7,8,9,10,11,12,13,14,15,16 GrabUMZ MD-South District 1/4/1996 FAL1,2,3,4,5,6,7,8,9,10,11,12,13,14,15,16 GrabUMZ MD-South District 1/11/1996 FAL1,2,3,4,5,6,7,8,9,10,11,12,13,14,15,16 GrabUMZ MD-South District 1/19/1996 FAL1,2,3,4,5,6,7,8,9,10,11,12,13,14,15,16 GrabUMZ MD-South District 1/25/1996 FAL1,2,3,4,5,6,7,8,9,10,11,12,13,14,15,16 GrabUMZ MD-South District 2/1/1996 FAL1,2,3,4,5,6,7,8,9,10,11,12,13,14,15,16 GrabUMZ MD-South District 2/7/1996 FAL1,2,3,4,5,6,7,8,9,10,11,12,13,14,15,16 GrabUMZ MD-South District 2/13/1996 FAL1,2,3,4,5,6,7,8,9,10,11,12,13,14,15,16 GrabUMZ MD-South District 2/21/1996 FAL1,2,3,4,5,6,7,8,9,10,11,12,13,14,15,16 GrabUMZ MD-South District 2/27/1996 FAL1,2,3,4,5,6,7,8,9,10,11,12,13,14,15,16 GrabUMZ MD-South District 3/5/1996 FAL1,2,3,4,5,6,7,8,9,10,11,12,13,14,15,16 GrabUMZ MD-South District 3/12/1996 FAL1,2,3,4,5,6,7,8,9,10,11,12,13,14,15,16 GrabUMZ MD-South District 3/20/1996 FAL1,2,3,4,5,6,7,8,9,10,11,12,13,14,15,16 Grab
FPL-012-172
UMZ MD-South District 3/26/1996 FAL1,2,3,4,5,6,7,8,9,10,11,12,13,14,15,16 GrabUMZ MD-South District 4/2/1996 FAL1,2,3,4,5,6,7,8,9,10,11,12,13,14,15,16 GrabUMZ MD-South District 4/9/1996 FAL1,2,3,4,5,6,7,8,9,10,11,12,13,14,15,16 GrabUMZ MD-South District 4/17/1996 FAL1,2,3,4,5,6,7,8,9,10,11,12,13,14,15,16 GrabUMZ MD-South District 4/23/1996 FAL1,2,3,4,5,6,7,8,9,10,11,12,13,14,15,16 GrabUMZ MD-South District 4/30/1996 FAL1,2,3,4,5,6,7,8,9,10,11,12,13,14,15,16 GrabUMZ MD-South District 5/7/1996 FAL1,2,3,4,5,6,7,8,9,10,11,12,13,14,15,16 GrabUMZ MD-South District 5/14/1996 FAL1,2,3,4,5,6,7,8,9,10,11,12,13,14,15,16 GrabUMZ MD-South District 5/21/1996 FAL1,2,3,4,5,6,7,8,9,10,11,12,13,14,15,16 GrabUMZ MD-South District 5/28/1996 FAL1,2,3,4,5,6,7,8,9,10,11,12,13,14,15,16 GrabUMZ MD-South District 6/4/1996 FAL1,2,3,4,5,6,7,8,9,10,11,12,13,14,15,16 GrabUMZ MD-South District 6/11/1996 FAL1,2,3,4,5,6,7,8,9,10,11,12,13,14,15,16 GrabUMZ MD-South District 6/18/1996 FAL1,2,3,4,5,6,7,8,9,10,11,12,13,14,15,16 GrabUMZ MD-South District 6/25/1996 FAL1,2,3,4,5,6,7,8,9,10,11,12,13,14,15,16 GrabUMZ MD-South District 7/2/1996 FAL1,2,3,4,5,6,7,8,9,10,11,12,13,14,15,16 GrabUMZ MD-South District 7/9/1996 FAL1,2,3,4,5,6,7,8,9,10,11,12,13,14,15,16 GrabUMZ MD-South District 7/16/1996 FAL1,2,3,4,5,6,7,8,9,10,11,12,13,14,15,16 GrabUMZ MD-South District 7/25/1996 FAL1,2,3,4,5,6,7,8,9,10,11,12,13,14,15,16 GrabUMZ MD-South District 8/1/1996 FAL1,2,3,4,5,6,7,8,9,10,11,12,13,14,15,16 GrabUMZ MD-South District 8/6/1996 FAL1,2,3,4,5,6,7,8,9,10,11,12,13,14,15,16 GrabUMZ MD-South District 8/14/1996 FAL1,2,3,4,5,6,7,8,9,10,11,12,13,14,15,16 GrabUMZ MD-South District 8/21/1996 FAL1,2,3,4,5,6,7,8,9,10,11,12,13,14,15,16 GrabUMZ MD-South District 8/27/1996 FAL1,2,3,4,5,6,7,8,9,10,11,12,13,14,15,16 GrabSampling Origin Sampling Facility Sampling Date Sample Description Sampling TypeUMZ MD-South District 9/4/1996 FAL1,2,3,4,5,6,7,8,9,10,11,12,13,14,15,16 GrabUMZ MD-South District 9/10/1996 FAL1,2,3,4,5,6,7,8,9,10,11,12,13,14,15,16 GrabUMZ MD-South District 9/17/1996 FAL1,2,3,4,5,6,7,8,9,10,11,12,13,14,15,16 GrabUMZ MD-South District 9/24/1996 FAL1,2,3,4,5,6,7,8,9,10,11,12,13,14,15,16 GrabUMZ MD-South District 10/1/1996 FAL1,2,3,4,5,6,7,8,9,10,11,12,13,14,15,16 GrabUMZ MD-South District 10/8/1996 FAL1,2,3,4,5,6,7,8,9,10,11,12,13,14,15,16 GrabUMZ MD-South District 10/16/1996 FAL1,2,3,4,5,6,7,8,9,10,11,12,13,14,15,16 GrabUMZ MD-South District 10/22/1996 FAL1,2,3,4,5,6,7,8,9,10,11,12,13,14,15,16 GrabUMZ MD-South District 10/29/1996 FAL1,2,3,4,5,6,7,8,9,10,11,12,13,14,15,16 GrabUMZ MD-South District 11/5/1996 FAL1,2,3,4,5,6,7,8,9,10,11,12,13,14,15,16 GrabUMZ MD-South District 11/12/1996 FAL1,2,3,4,5,6,7,8,9,10,11,12,13,14,15,16 GrabUMZ MD-South District 11/19/1996 FAL1,2,3,4,5,6,7,8,9,10,11,12,13,14,15,16 GrabUMZ MD-South District 11/26/1996 FAL1,2,3,4,5,6,7,8,9,10,11,12,13,14,15,16 GrabUMZ MD-South District 12/3/1996 FAL1,2,3,4,5,6,7,8,9,10,11,12,13,14,15,16 GrabUMZ MD-South District 12/10/1996 FAL1,2,3,4,5,6,7,8,9,10,11,12,13,14,15,16 GrabUMZ MD-South District 12/17/1996 FAL1,2,3,4,5,6,7,8,9,10,11,12,13,14,15,16 GrabUMZ MD-South District 12/24/1996 FAL1,2,3,4,5,6,7,8,9,10,11,12,13,14,15,16 GrabUMZ MD-South District 12/31/1996 FAL1,2,3,4,5,6,7,8,9,10,11,12,13,14,15,16 GrabUMZ MD-South District 1/7/1997 FAL1,2,3,4,5,6,7,8,9,10,11,12,13,14,15,16 GrabUMZ MD-South District 1/14/1997 FAL1,2,3,4,5,6,7,8,9,10,11,12,13,14,15,16 GrabUMZ MD-South District 1/21/1997 FAL1,2,3,4,5,6,7,8,9,10,11,12,13,14,15,16 GrabUMZ MD-South District 1/28/1997 FAL1,2,3,4,5,6,7,8,9,10,11,12,13,14,15,16 GrabUMZ MD-South District 2/4/1997 FAL1,2,3,4,5,6,7,8,9,10,11,12,13,14,15,16 GrabUMZ MD-South District 2/11/1997 FAL1,2,3,4,5,6,7,8,9,10,11,12,13,14,15,16 GrabUMZ MD-South District 2/18/1997 FAL1,2,3,4,5,6,7,8,9,10,11,12,13,14,15,16 GrabUMZ MD-South District 2/25/1997 FAL1,2,3,4,5,6,7,8,9,10,11,12,13,14,15,16 GrabUMZ MD-South District 3/4/1997 FAL1,2,3,4,5,6,7,8,9,10,11,12,13,14,15,16 GrabUMZ MD-South District 3/11/1997 FAL1,2,3,4,5,6,7,8,9,10,11,12,13,14,15,16 GrabUMZ MD-South District 3/18/1997 FAL1,2,3,4,5,6,7,8,9,10,11,12,13,14,15,16 GrabUMZ MD-South District 3/25/1997 FAL1,2,3,4,5,6,7,8,9,10,11,12,13,14,15,16 GrabUMZ MD-South District 4/2/1997 FAL1,2,3,4,5,6,7,8,9,10,11,12,13,14,15,16 GrabUMZ MD-South District 4/8/1997 FAL1,2,3,4,5,6,7,8,9,10,11,12,13,14,15,16 GrabUMZ MD-South District 4/15/1997 FAL1,2,3,4,5,6,7,8,9,10,11,12,13,14,15,16 GrabUMZ MD-South District 4/22/1997 FAL1,2,3,4,5,6,7,8,9,10,11,12,13,14,15,16 GrabUMZ MD-South District 4/29/1997 FAL1,2,3,4,5,6,7,8,9,10,11,12,13,14,15,16 GrabUMZ MD-South District 5/6/1997 FAL1,2,3,4,5,6,7,8,9,10,11,12,13,14,15,16 GrabUMZ MD-South District 5/13/1997 FAL1,2,3,4,5,6,7,8,9,10,11,12,13,14,15,16 GrabUMZ MD-South District 5/20/1997 FAL1,2,3,4,5,6,7,8,9,10,11,12,13,14,15,16 GrabUMZ MD-South District 5/27/1997 FAL1,2,3,4,5,6,7,8,9,10,11,12,13,14,15,16 GrabUMZ MD-South District 6/3/1997 FAL1,2,3,4,5,6,7,8,9,10,11,12,13,14,15,16 Grab
FPL-012-173
UMZ MD-South District 6/10/1997 FAL1,2,3,4,5,6,7,8,9,10,11,12,13,14,15,16 GrabUMZ MD-South District 6/17/1997 FAL1,2,3,4,5,6,7,8,9,10,11,12,13,14,15,16 GrabUMZ MD-South District 6/24/1997 FAL1,2,3,4,5,6,7,8,9,10,11,12,13,14,15,16 GrabUMZ MD-South District 7/1/1997 FAL1,2,3,4,5,6,7,8,9,10,11,12,13,14,15,16 GrabUMZ MD-South District 7/8/1997 FAL1,2,3,4,5,6,7,8,9,10,11,12,13,14,15,16 GrabUMZ MD-South District 7/15/1997 FAL1,2,3,4,5,6,7,8,9,10,11,12,13,14,15,16 GrabUMZ MD-South District 7/22/1997 FAL1,2,3,4,5,6,7,8,9,10,11,12,13,14,15,16 GrabUMZ MD-South District 7/29/1997 FAL1,2,3,4,5,6,7,8,9,10,11,12,13,14,15,16 GrabUMZ MD-South District 8/5/1997 FAL1,2,3,4,5,6,7,8,9,10,11,12,13,14,15,16 GrabUMZ MD-South District 8/12/1997 FAL1,2,3,4,5,6,7,8,9,10,11,12,13,14,15,16 GrabUMZ MD-South District 8/19/1997 FAL1,2,3,4,5,6,7,8,9,10,11,12,13,14,15,16 GrabUMZ MD-South District 8/26/1997 FAL1,2,3,4,5,6,7,8,9,10,11,12,13,14,15,16 GrabUMZ MD-South District 9/2/1997 FAL1,2,3,4,5,6,7,8,9,10,11,12,13,14,15,16 GrabUMZ MD-South District 9/10/1997 FAL1,2,3,4,5,6,7,8,9,10,11,12,13,14,15,16 GrabUMZ MD-South District 9/16/1997 FAL1,2,3,4,5,6,7,8,9,10,11,12,13,14,15,16 GrabUMZ MD-South District 9/25/1997 FAL1,2,3,4,5,6,7,8,9,10,11,12,13,14,15,16 GrabUMZ MD-South District 10/1/1997 FAL1,2,3,4,5,6,7,8,9,10,11,12,13,14,15,16 GrabUMZ MD-South District 10/7/1997 FAL1,2,3,4,5,6,7,8,9,10,11,12,13,14,15,16 GrabUMZ MD-South District 10/14/1997 FAL1,2,3,4,5,6,7,8,9,10,11,12,13,14,15,16 GrabSampling Origin Sampling Facility Sampling Date Sample Description Sampling TypeUMZ MD-South District 10/22/1997 FAL1,2,3,4,5,6,7,8,9,10,11,12,13,14,15,16 GrabUMZ MD-South District 10/28/1997 FAL1,2,3,4,5,6,7,8,9,10,11,12,13,14,15,16 GrabUMZ MD-South District 11/4/1997 FAL1,2,3,4,5,6,7,8,9,10,11,12,13,14,15,16 GrabUMZ MD-South District 11/11/1997 FAL1,2,3,4,5,6,7,8,9,10,11,12,13,14,15,16 GrabUMZ MD-South District 11/18/1997 FAL1,2,3,4,5,6,7,8,9,10,11,12,13,14,15,16 GrabUMZ MD-South District 11/25/1997 FAL1,2,3,4,5,6,7,8,9,10,11,12,13,14,15,16 GrabUMZ MD-South District 12/2/1997 FAL1,2,3,4,5,6,7,8,9,10,11,12,13,14,15,16 GrabUMZ MD-South District 12/9/1997 FAL1,2,3,4,5,6,7,8,9,10,11,12,13,14,15,16 GrabUMZ MD-South District 12/16/1997 FAL1,2,3,4,5,6,7,8,9,10,11,12,13,14,15,16 GrabUMZ MD-South District 12/23/1997 FAL1,2,3,4,5,6,7,8,9,10,11,12,13,14,15,16 GrabUMZ MD-South District 12/30/1997 FAL1,2,3,4,5,6,7,8,9,10,11,12,13,14,15,16 GrabUMZ MD-South District 1/6/1998 FAL1,2,3,4,5,6,7,8,9,10,11,12,13,14,15,16 GrabUMZ MD-South District 1/13/1998 FAL1,2,3,4,5,6,7,8,9,10,11,12,13,14,15,16 GrabUMZ MD-South District 1/20/1998 FAL1,2,3,4,5,6,7,8,9,10,11,12,13,14,15,16 GrabUMZ MD-South District 1/27/1998 FAL1,2,3,4,5,6,7,8,9,10,11,12,13,14,15,16 GrabUMZ MD-South District 2/3/1998 FAL1,2,3,4,5,6,7,8,9,10,11,12,13,14,15,16 GrabUMZ MD-South District 2/10/1998 FAL1,2,3,4,5,6,7,8,9,10,11,12,13,14,15,16 GrabUMZ MD-South District 2/17/1998 FAL1,2,3,4,5,6,7,8,9,10,11,12,13,14,15,16 GrabUMZ MD-South District 2/24/1998 FAL1,2,3,4,5,6,7,8,9,10,11,12,13,14,15,16 GrabUMZ MD-South District 3/3/1998 FAL1,2,3,4,5,6,7,8,9,10,11,12,13,14,15,16 GrabUMZ MD-South District 3/10/1998 FAL1,2,3,4,5,6,7,8,9,10,11,12,13,14,15,16 GrabUMZ MD-South District 3/17/1998 FAL1,2,3,4,5,6,7,8,9,10,11,12,13,14,15,16 GrabUMZ MD-South District 3/24/1998 FAL1,2,3,4,5,6,7,8,9,10,11,12,13,14,15,16 GrabUMZ MD-South District 3/31/1998 FAL1,2,3,4,5,6,7,8,9,10,11,12,13,14,15,16 GrabUMZ MD-South District 4/7/1998 FAL1,2,3,4,5,6,7,8,9,10,11,12,13,14,15,16 GrabUMZ MD-South District 4/14/1998 FAL1,2,3,4,5,6,7,8,9,10,11,12,13,14,15,16 GrabUMZ MD-South District 4/22/1998 FAL1,2,3,4,5,6,7,8,9,10,11,12,13,14,15,16 GrabUMZ MD-South District 4/28/1998 FAL1,2,3,4,5,6,7,8,9,10,11,12,13,14,15,16 GrabUMZ MD-South District 5/5/1998 FAL1,2,3,4,5,6,7,8,9,10,11,12,13,14,15,16 GrabUMZ MD-South District 5/13/1998 FAL1,2,3,4,5,6,7,8,9,10,11,12,13,14,15,16 GrabUMZ MD-South District 5/19/1998 FAL1,2,3,4,5,6,7,8,9,10,11,12,13,14,15,16 GrabUMZ MD-South District 6/2/1998 FAL1,2,3,4,5,6,7,8,9,10,11,12,13,14,15,16 GrabUMZ MD-South District 6/9/1998 FAL1,2,3,4,5,6,7,8,9,10,11,12,13,14,15,16 GrabUMZ MD-South District 6/16/1998 FAL1,2,3,4,5,6,7,8,9,10,11,12,13,14,15,16 GrabUMZ MD-South District 6/23/1998 FAL1,2,3,4,5,6,7,8,9,10,11,12,13,14,15,16 GrabUMZ MD-South District 7/1/1998 FAL1,2,3,4,5,6,7,8,9,10,11,12,13,14,15,16 GrabUMZ MD-South District 7/7/1998 FAL1,2,3,4,5,6,7,8,9,10,11,12,13,14,15,16 GrabUMZ MD-South District 7/14/1998 FAL1,2,3,4,5,6,7,8,9,10,11,12,13,14,15,16 GrabUMZ MD-South District 7/21/1998 FAL1,2,3,4,5,6,7,8,9,10,11,12,13,14,15,16 GrabUMZ MD-South District 7/28/1998 FAL1,2,3,4,5,6,7,8,9,10,11,12,13,14,15,16 GrabUMZ MD-South District 8/4/1998 FAL1,2,3,4,5,6,7,8,9,10,11,12,13,14,15,16 GrabUMZ MD-South District 8/11/1998 FAL1,2,3,4,5,6,7,8,9,10,11,12,13,14,15,16 GrabUMZ MD-South District 8/18/1998 FAL1,2,3,4,5,6,7,8,9,10,11,12,13,14,15,16 GrabUMZ MD-South District 8/25/1998 FAL1,2,3,4,5,6,7,8,9,10,11,12,13,14,15,16 Grab
FPL-012-174
UMZ MD-South District 9/1/1998 FAL1,2,3,4,5,6,7,8,9,10,11,12,13,14,15,16 GrabUMZ MD-South District 9/8/1998 FAL1,2,3,4,5,6,7,8,9,10,11,12,13,14,15,16 GrabUMZ MD-South District 9/15/1998 FAL1,2,3,4,5,6,7,8,9,10,11,12,13,14,15,16 GrabUMZ MD-South District 9/22/1998 FAL1,2,3,4,5,6,7,8,9,10,11,12,13,14,15,16 GrabUMZ MD-South District 9/29/1998 FAL1,2,3,4,5,6,7,8,9,10,11,12,13,14,15,16 GrabUMZ MD-South District 10/6/1998 FAL1,2,3,4,5,6,7,8,9,10,11,12,13,14,15,16 GrabUMZ MD-South District 10/14/1998 FAL1,2,3,4,5,6,7,8,9,10,11,12,13,14,15,16 GrabUMZ MD-South District 10/20/1998 FAL1,2,3,4,5,6,7,8,9,10,11,12,13,14,15,16 GrabUMZ MD-South District 11/3/1998 FAL1,2,3,4,5,6,7,8,9,10,11,12,13,14,15,16 GrabUMZ MD-South District 11/12/1998 FAL1,2,3,4,5,6,7,8,9,10,11,12,13,14,15,16 GrabUMZ MD-South District 11/17/1998 FAL1,2,3,4,5,6,7,8,9,10,11,12,13,14,15,16 GrabUMZ MD-South District 11/24/1998 FAL1,2,3,4,5,6,7,8,9,10,11,12,13,14,15,16 GrabUMZ MD-South District 12/1/1998 FAL1,2,3,4,5,6,7,8,9,10,11,12,13,14,15,16 GrabUMZ MD-South District 12/9/1998 FAL1,2,3,4,5,6,7,8,9,10,11,12,13,14,15,16 GrabUMZ MD-South District 12/17/1998 FAL1,2,3,4,5,6,7,8,9,10,11,12,13,14,15,16 GrabSampling Origin Sampling Facility Sampling Date Sample Description Sampling TypeUMZ MD-South District 12/22/1998 FAL1,2,3,4,5,6,7,8,9,10,11,12,13,14,15,16 GrabUMZ MD-South District 1/5/1999 FAL1,2,3,4,5,6,7,8,9,10,11,12,13,14,15,16 GrabUMZ MD-South District 1/12/1999 FAL1,2,3,4,5,6,7,8,9,10,11,12,13,14,15,16 GrabUMZ MD-South District 1/20/1999 FAL1,2,3,4,5,6,7,8,9,10,11,12,13,14,15,16 GrabUMZ MD-South District 1/27/1999 FAL1,2,3,4,5,6,7,8,9,10,11,12,13,14,15,16 GrabUMZ MD-South District 2/3/1999 FAL1,2,3,4,5,6,7,8,9,10,11,12,13,14,15,16 GrabUMZ MD-South District 2/10/1999 FAL1,2,3,4,5,6,7,8,9,10,11,12,13,14,15,16 GrabUMZ MD-South District 2/17/1999 FAL1,2,3,4,5,6,7,8,9,10,11,12,13,14,15,16 GrabUMZ MD-South District 2/24/1999 FAL1,2,3,4,5,6,7,8,9,10,11,12,13,14,15,16 GrabUMZ MD-South District 3/4/1999 FAL1,2,3,4,5,6,7,8,9,10,11,12,13,14,15,16 GrabUMZ MD-South District 3/10/1999 FAL1,2,3,4,5,6,7,8,9,10,11,12,13,14,15,16 GrabUMZ MD-South District 3/17/1999 FAL1,2,3,4,5,6,7,8,9,10,11,12,13,14,15,16 GrabUMZ MD-South District 3/24/1999 FAL1,2,3,4,5,6,7,8,9,10,11,12,13,14,15,16 GrabUMZ MD-South District 4/7/1999 FAL1,2,3,4,5,6,7,8,9,10,11,12,13,14,15,16 GrabUMZ MD-South District 4/14/1999 FAL1,2,3,4,5,6,7,8,9,10,11,12,13,14,15,16 GrabUMZ MD-South District 4/21/1999 FAL1,2,3,4,5,6,7,8,9,10,11,12,13,14,15,16 GrabUMZ MD-South District 4/28/1999 FAL1,2,3,4,5,6,7,8,9,10,11,12,13,14,15,16 GrabUMZ MD-South District 5/5/1999 FAL1,2,3,4,5,6,7,8,9,10,11,12,13,14,15,16 GrabUMZ MD-South District 5/12/1999 FAL1,2,3,4,5,6,7,8,9,10,11,12,13,14,15,16 GrabUMZ MD-South District 5/19/1999 FAL1,2,3,4,5,6,7,8,9,10,11,12,13,14,15,16 GrabUMZ MD-South District 5/28/1999 FAL1,2,3,4,5,6,7,8,9,10,11,12,13,14,15,16 GrabUMZ MD-South District 6/2/1999 FAL1,2,3,4,5,6,7,8,9,10,11,12,13,14,15,16 GrabUMZ MD-South District 6/9/1999 FAL1,2,3,4,5,6,7,8,9,10,11,12,13,14,15,16 GrabUMZ MD-South District 6/16/1999 FAL1,2,3,4,5,6,7,8,9,10,11,12,13,14,15,16 GrabUMZ MD-South District 6/23/1999 FAL1,2,3,4,5,6,7,8,9,10,11,12,13,14,15,16 GrabUMZ MD-South District 7/7/1999 FAL1,2,3,4,5,6,7,8,9,10,11,12,13,14,15,16 GrabUMZ MD-South District 7/14/1999 FAL1,2,3,4,5,6,7,8,9,10,11,12,13,14,15,16 GrabUMZ MD-South District 7/21/1999 FAL1,2,3,4,5,6,7,8,9,10,11,12,13,14,15,16 GrabUMZ MD-South District 7/28/1999 FAL1,2,3,4,5,6,7,8,9,10,11,12,13,14,15,16 GrabUMZ MD-South District 8/4/1999 FAL1,2,3,4,5,6,7,8,9,10,11,12,13,14,15,16 GrabUMZ MD-South District 8/9/1999 FAL1,2,3,4,5,6,7,8,9,10,11,12,13,14,15,16 GrabUMZ MD-South District 8/18/1999 FAL1,2,3,4,5,6,7,8,9,10,11,12,13,14,15,16 GrabUMZ MD-South District 8/25/1999 FAL1,2,3,4,5,6,7,8,9,10,11,12,13,14,15,16 GrabUMZ MD-South District 9/2/1999 FAL1,2,3,4,5,6,7,8,9,10,11,12,13,14,15,16 GrabUMZ MD-South District 9/8/1999 FAL1,2,3,4,5,6,7,8,9,10,11,12,13,14,15,16 GrabUMZ MD-South District 9/16/1999 FAL1,2,3,4,5,6,7,8,9,10,11,12,13,14,15,16 GrabUMZ MD-South District 9/22/1999 FAL1,2,3,4,5,6,7,8,9,10,11,12,13,14,15,16 GrabUMZ MD-South District 10/6/1999 FAL1,2,3,4,5,6,7,8,9,10,11,12,13,14,15,16 GrabUMZ MD-South District 10/13/1999 FAL1,2,3,4,5,6,7,8,9,10,11,12,13,14,15,16 GrabUMZ MD-South District 10/20/1999 FAL1,2,3,4,5,6,7,8,9,10,11,12,13,14,15,16 GrabUMZ MD-South District 10/27/1999 FAL1,2,3,4,5,6,7,8,9,10,11,12,13,14,15,16 GrabUMZ MD-South District 11/3/1999 FAL1,2,3,4,5,6,7,8,9,10,11,12,13,14,15,16 GrabUMZ MD-South District 11/10/1999 FAL1,2,3,4,5,6,7,8,9,10,11,12,13,14,15,16 GrabUMZ MD-South District 11/25/1999 FAL1,2,3,4,5,6,7,8,9,10,11,12,13,14,15,16 GrabUMZ MD-South District 11/30/1999 FAL1,2,3,4,5,6,7,8,9,10,11,12,13,14,15,16 GrabUMZ MD-South District 12/8/1999 FAL1,2,3,4,5,6,7,8,9,10,11,12,13,14,15,16 GrabUMZ MD-South District 12/14/1999 FAL1,2,3,4,5,6,7,8,9,10,11,12,13,14,15,16 GrabUMZ MD-South District 12/22/1999 FAL1,2,3,4,5,6,7,8,9,10,11,12,13,14,15,16 Grab
FPL-012-175

UMZ MD-South District 12/29/1999 FAL1,2,3,4,5,6,7,8,9,10,11,12,13,14,15,16 GrabUMZ MD-South District 1/5/2000 FAL1,2,3,4,5,6,7,8,9,10,11,12,13,14,15,16 GrabUMZ MD-South District 2/2/2000 FAL1,2,3,4,5,6,7,8,9,10,11,12,13,14,15,16 GrabUMZ MD-South District 3/8/2000 FAL1,2,3,4,5,6,7,8,9,10,11,12,13,14,15,16 GrabUMZ MD-South District 4/2/2000 FAL1,2,3,4,5,6,7,8,9,10,11,12,13,14,15,16 GrabUMZ MD-South District 5/10/2000 FAL1,2,3,4,5,6,7,8,9,10,11,12,13,14,15,16 GrabUMZ West Palm Beach 6/21/1995 GrabLMZ Broward County North Regional WWTP 11/18/1997 MW1 GrabLMZ Broward County North Regional WWTP 11/25/1997 MW1 GrabLMZ Broward County North Regional WWTP 12/2/1997 MW1 GrabLMZ Broward County North Regional WWTP 12/9/1997 MW1 GrabSampling Origin Sampling Facility Sampling Date Sample Description Sampling TypeLMZ Broward County North Regional WWTP 12/12/1997 MW1 GrabLMZ Broward County North Regional WWTP 12/16/1997 MW1 GrabLMZ Broward County North Regional WWTP 12/19/1997 MW1 GrabLMZ Broward County North Regional WWTP 12/23/1997 MW1 GrabLMZ Broward County North Regional WWTP 12/29/1997 MW1 GrabLMZ Broward County North Regional WWTP 12/30/1997 MW1 GrabLMZ Broward County North Regional WWTP 12/9/1997 MW2 GrabLMZ Broward County North Regional WWTP 12/12/1997 MW2 GrabLMZ Broward County North Regional WWTP 12/16/1997 MW2 GrabLMZ Broward County North Regional WWTP 12/19/1997 MW2 GrabLMZ Broward County North Regional WWTP 12/23/1997 MW2 GrabLMZ Broward County North Regional WWTP 12/29/1997 MW2 GrabLMZ Broward County North Regional WWTP 12/30/1997 MW2 GrabLMZ City of Fort Lauderdale 3/1/1995 MW1 GrabLMZ City of Fort Lauderdale 3/10/1995 MW1 GrabLMZ City of Fort Lauderdale 3/17/1995 MW1 GrabLMZ City of Fort Lauderdale 3/24/1995 MW1 GrabLMZ City of Fort Lauderdale 3/31/1995 MW1 GrabLMZ City of Fort Lauderdale 4/7/1995 MW1 GrabLMZ City of Fort Lauderdale 4/11/1995 MW1 GrabLMZ City of Fort Lauderdale 4/19/1995 MW1 GrabLMZ City of Fort Lauderdale 4/25/1995 MW1 GrabLMZ City of Fort Lauderdale 5/2/1995 MW1 GrabLMZ City of Fort Lauderdale 5/9/1995 MW1 GrabLMZ City of Fort Lauderdale 5/16/1995 MW1 GrabLMZ City of Fort Lauderdale 5/23/1995 MW1 GrabLMZ City of Fort Lauderdale 5/30/1995 MW1 GrabLMZ City of Fort Lauderdale 6/5/1995 MW1 GrabLMZ City of Fort Lauderdale 6/13/1995 MW1 GrabLMZ City of Fort Lauderdale 6/20/1995 MW1 GrabLMZ City of Fort Lauderdale 6/27/1995 MW1 GrabLMZ City of Fort Lauderdale 7/4/1995 MW1 GrabLMZ City of Fort Lauderdale 7/11/1995 MW1 GrabLMZ City of Fort Lauderdale 7/18/1995 MW1 GrabLMZ City of Fort Lauderdale 7/25/1995 MW1 GrabLMZ City of Fort Lauderdale 7/31/1995 MW1 GrabLMZ City of Fort Lauderdale 8/8/1995 MW1 GrabLMZ City of Fort Lauderdale 8/15/1995 MW1 GrabLMZ City of Fort Lauderdale 8/22/1995 MW1 GrabLMZ City of Fort Lauderdale 8/29/1995 MW1 GrabLMZ City of Fort Lauderdale 9/5/1995 MW1 GrabLMZ City of Fort Lauderdale 9/12/1995 MW1 GrabLMZ City of Fort Lauderdale 9/19/1995 MW1 GrabLMZ City of Fort Lauderdale 9/26/1995 MW1 GrabLMZ City of Fort Lauderdale 10/3/1995 MW1 GrabLMZ City of Fort Lauderdale 10/10/1995 MW1 GrabLMZ City of Fort Lauderdale 10/17/1995 MW1 GrabLMZ City of Fort Lauderdale 10/24/1995 MW1 GrabLMZ City of Fort Lauderdale 10/31/1995 MW1 GrabLMZ City of Fort Lauderdale 11/7/1995 MW1 GrabLMZ City of Fort Lauderdale 11/14/1995 MW1 GrabLMZ City of Fort Lauderdale 11/21/1995 MW1 GrabLMZ City of Fort Lauderdale 11/28/1995 MW1 GrabLMZ City of Fort Lauderdale 12/5/1995 MW1 GrabLMZ City of Fort Lauderdale 12/12/1995 MW1 GrabLMZ City of Fort Lauderdale 12/19/1995 MW1 GrabLMZ City of Fort Lauderdale 12/26/1995 MW1 Grab
FPL-012-176

LMZ City of Fort Lauderdale 1/2/1996 MW1 GrabLMZ City of Fort Lauderdale 1/9/1996 MW1 GrabLMZ City of Fort Lauderdale 1/16/1996 MW1 GrabLMZ City of Fort Lauderdale 1/23/1996 MW1 GrabLMZ City of Fort Lauderdale 1/30/1996 MW1 GrabLMZ City of Fort Lauderdale 2/6/1996 MW1 GrabLMZ City of Fort Lauderdale 2/13/1996 MW1 GrabLMZ City of Fort Lauderdale 2/20/1996 MW1 GrabSampling Origin Sampling Facility Sampling Date Sample Description Sampling TypeLMZ City of Fort Lauderdale 2/27/1996 MW1 GrabLMZ City of Fort Lauderdale 3/5/1996 MW1 GrabLMZ City of Fort Lauderdale 3/12/1996 MW1 GrabLMZ City of Fort Lauderdale 3/19/1996 MW1 GrabLMZ City of Fort Lauderdale 3/26/1996 MW1 GrabLMZ City of Fort Lauderdale 4/2/1996 MW1 GrabLMZ City of Fort Lauderdale 4/9/1996 MW1 GrabLMZ City of Fort Lauderdale 4/16/1996 MW1 GrabLMZ City of Fort Lauderdale 4/23/1996 MW1 GrabLMZ City of Fort Lauderdale 4/30/1996 MW1 GrabLMZ City of Fort Lauderdale 5/7/1996 MW1 GrabLMZ City of Fort Lauderdale 5/14/1996 MW1 GrabLMZ City of Fort Lauderdale 6/4/1996 MW1 GrabLMZ City of Fort Lauderdale 6/11/1996 MW1 GrabLMZ City of Fort Lauderdale 6/19/1996 MW1 GrabLMZ City of Fort Lauderdale 6/25/1996 MW1 GrabLMZ City of Fort Lauderdale 7/2/1996 MW1 GrabLMZ City of Fort Lauderdale 7/9/1996 MW1 GrabLMZ City of Fort Lauderdale 7/16/1996 MW1 GrabLMZ City of Fort Lauderdale 7/23/1996 MW1 GrabLMZ City of Fort Lauderdale 7/30/1996 MW1 GrabLMZ City of Fort Lauderdale 8/6/1996 MW1 GrabLMZ City of Fort Lauderdale 8/15/1996 MW1 GrabLMZ City of Fort Lauderdale 8/20/1996 MW1 GrabLMZ City of Fort Lauderdale 8/27/1996 MW1 GrabLMZ City of Fort Lauderdale 9/4/1996 MW1 GrabLMZ City of Fort Lauderdale 9/17/1996 MW1 GrabLMZ City of Fort Lauderdale 10/8/1996 MW1 GrabLMZ City of Fort Lauderdale 10/15/1996 MW1 GrabLMZ City of Fort Lauderdale 10/22/1996 MW1 GrabLMZ City of Fort Lauderdale 10/29/1996 MW1 GrabLMZ City of Fort Lauderdale 11/5/1996 MW1 GrabLMZ City of Fort Lauderdale 11/12/1996 MW1 GrabLMZ City of Fort Lauderdale 11/18/1996 MW1 GrabLMZ City of Fort Lauderdale 11/26/1996 MW1 GrabLMZ City of Fort Lauderdale 12/2/1996 MW1 GrabLMZ City of Fort Lauderdale 12/10/1996 MW1 GrabLMZ City of Fort Lauderdale 12/17/1996 MW1 GrabLMZ City of Fort Lauderdale 12/24/1996 MW1 GrabLMZ City of Fort Lauderdale 12/31/1996 MW1 GrabLMZ City of Fort Lauderdale 1/7/1997 MW1 GrabLMZ City of Fort Lauderdale 1/14/1997 MW1 GrabLMZ City of Fort Lauderdale 1/21/1997 MW1 GrabLMZ City of Fort Lauderdale 1/28/1997 MW1 GrabLMZ City of Fort Lauderdale 2/4/1997 MW1 GrabLMZ City of Fort Lauderdale 2/11/1997 MW1 GrabLMZ City of Fort Lauderdale 2/18/1997 MW1 GrabLMZ City of Fort Lauderdale 2/25/1997 MW1 GrabLMZ City of Fort Lauderdale 3/4/1997 MW1 GrabLMZ City of Fort Lauderdale 3/11/1997 MW1 GrabLMZ City of Fort Lauderdale 3/18/1997 MW1 GrabLMZ City of Fort Lauderdale 3/25/1997 MW1 GrabLMZ City of Fort Lauderdale 4/1/1997 MW1 GrabLMZ City of Fort Lauderdale 4/8/1997 MW1 GrabLMZ City of Fort Lauderdale 5/6/1997 MW1 GrabLMZ City of Fort Lauderdale 5/13/1997 MW1 GrabLMZ City of Fort Lauderdale 5/20/1997 MW1 GrabLMZ City of Fort Lauderdale 5/27/1997 MW1 GrabLMZ City of Fort Lauderdale 6/3/1997 MW1 GrabLMZ City of Fort Lauderdale 6/10/1997 MW1 GrabLMZ City of Fort Lauderdale 6/18/1997 MW1 GrabLMZ City of Fort Lauderdale 6/24/1997 MW1 GrabLMZ City of Fort Lauderdale 7/1/1997 MW1 Grab
FPL-012-177
LMZ City of Fort Lauderdale 7/8/1997 MW1 GrabLMZ City of Fort Lauderdale 7/15/1997 MW1 GrabLMZ City of Fort Lauderdale 7/22/1997 MW1 GrabLMZ City of Fort Lauderdale 7/29/1997 MW1 GrabSampling Origin Sampling Facility Sampling Date Sample Description Sampling TypeLMZ City of Fort Lauderdale 8/5/1997 MW1 GrabLMZ City of Fort Lauderdale 8/12/1997 MW1 GrabLMZ City of Fort Lauderdale 8/18/1997 MW1 GrabLMZ City of Fort Lauderdale 8/26/1997 MW1 GrabLMZ City of Fort Lauderdale 9/3/1997 MW1 GrabLMZ City of Fort Lauderdale 9/9/1997 MW1 GrabLMZ City of Fort Lauderdale 9/16/1997 MW1 GrabLMZ City of Fort Lauderdale 9/23/1997 MW1 GrabLMZ City of Fort Lauderdale 9/30/1997 MW1 GrabLMZ City of Fort Lauderdale 10/7/1997 MW1 GrabLMZ City of Fort Lauderdale 10/14/1997 MW1 GrabLMZ City of Fort Lauderdale 10/22/1997 MW1 GrabLMZ City of Fort Lauderdale 10/29/1997 MW1 GrabLMZ City of Fort Lauderdale 11/5/1997 MW1 GrabLMZ City of Fort Lauderdale 11/12/1997 MW1 GrabLMZ City of Fort Lauderdale 11/18/1997 MW1 GrabLMZ City of Fort Lauderdale 11/25/1997 MW1 GrabLMZ City of Fort Lauderdale 12/2/1997 MW1 GrabLMZ City of Fort Lauderdale 12/9/1997 MW1 GrabLMZ City of Fort Lauderdale 12/16/1997 MW1 GrabLMZ City of Fort Lauderdale 12/23/1997 MW1 GrabLMZ City of Fort Lauderdale 12/30/1997 MW1 GrabLMZ City of Fort Lauderdale 1/6/1998 MW1 GrabLMZ City of Fort Lauderdale 1/13/1998 MW1 GrabLMZ City of Fort Lauderdale 1/20/1998 MW1 GrabLMZ City of Fort Lauderdale 1/27/1998 MW1 GrabLMZ City of Fort Lauderdale 2/3/1998 MW1 GrabLMZ City of Fort Lauderdale 2/10/1998 MW1 GrabLMZ City of Fort Lauderdale 2/17/1998 MW1 GrabLMZ City of Fort Lauderdale 2/24/1998 MW1 GrabLMZ City of Fort Lauderdale 3/3/1998 MW1 GrabLMZ City of Fort Lauderdale 3/10/1998 MW1 GrabLMZ City of Fort Lauderdale 3/17/1998 MW1 GrabLMZ City of Fort Lauderdale 3/24/1998 MW1 GrabLMZ City of Fort Lauderdale 3/31/1998 MW1 GrabLMZ City of Fort Lauderdale 4/7/1998 MW1 GrabLMZ City of Fort Lauderdale 4/14/1998 MW1 GrabLMZ City of Fort Lauderdale 4/21/1998 MW1 GrabLMZ City of Fort Lauderdale 4/28/1998 MW1 GrabLMZ City of Fort Lauderdale 5/5/1998 MW1 GrabLMZ City of Fort Lauderdale 5/12/1998 MW1 GrabLMZ City of Fort Lauderdale 5/19/1998 MW1 GrabLMZ City of Fort Lauderdale 5/26/1998 MW1 GrabLMZ City of Fort Lauderdale 6/2/1998 MW1 GrabLMZ City of Fort Lauderdale 6/9/1998 MW1 GrabLMZ City of Fort Lauderdale 6/16/1998 MW1 GrabLMZ City of Fort Lauderdale 6/23/1998 MW1 GrabLMZ City of Fort Lauderdale 6/30/1998 MW1 GrabLMZ City of Fort Lauderdale 7/7/1998 MW1 GrabLMZ City of Fort Lauderdale 7/14/1998 MW1 GrabLMZ City of Fort Lauderdale 7/21/1998 MW1 GrabLMZ City of Fort Lauderdale 7/28/1998 MW1 GrabLMZ City of Fort Lauderdale 8/4/1998 MW1 GrabLMZ City of Fort Lauderdale 8/11/1998 MW1 GrabLMZ City of Fort Lauderdale 8/18/1998 MW1 GrabLMZ City of Fort Lauderdale 8/25/1998 MW1 GrabLMZ City of Fort Lauderdale 9/1/1998 MW1 GrabLMZ City of Fort Lauderdale 9/8/1998 MW1 GrabLMZ City of Fort Lauderdale 9/15/1998 MW1 GrabLMZ City of Fort Lauderdale 9/22/1998 MW1 GrabLMZ City of Fort Lauderdale 9/29/1998 MW1 GrabLMZ City of Fort Lauderdale 10/6/1998 MW1 GrabLMZ City of Fort Lauderdale 10/13/1998 MW1 GrabLMZ City of Fort Lauderdale 10/20/1998 MW1 GrabLMZ City of Fort Lauderdale 10/27/1998 MW1 GrabLMZ City of Fort Lauderdale 11/3/1998 MW1 GrabLMZ City of Fort Lauderdale 11/10/1998 MW1 Grab
FPL-012-178

Sampling Origin Sampling Facility Sampling Date Sample Description Sampling TypeLMZ City of Fort Lauderdale 11/17/1998 MW1 GrabLMZ City of Fort Lauderdale 11/24/1998 MW1 GrabLMZ City of Fort Lauderdale 12/1/1998 MW1 GrabLMZ City of Fort Lauderdale 12/8/1998 MW1 GrabLMZ City of Fort Lauderdale 12/15/1998 MW1 GrabLMZ City of Fort Lauderdale 12/22/1998 MW1 GrabLMZ City of Fort Lauderdale 12/29/1998 MW1 GrabLMZ City of Fort Lauderdale 1/5/1999 MW1 GrabLMZ City of Fort Lauderdale 1/12/1999 MW1 GrabLMZ City of Fort Lauderdale 1/19/1999 MW1 GrabLMZ City of Fort Lauderdale 1/26/1999 MW1 GrabLMZ City of Fort Lauderdale 2/2/1999 MW1 GrabLMZ City of Fort Lauderdale 2/9/1999 MW1 GrabLMZ City of Fort Lauderdale 2/16/1999 MW1 GrabLMZ City of Fort Lauderdale 2/23/1999 MW1 GrabLMZ City of Fort Lauderdale 3/2/1999 MW1 GrabLMZ City of Fort Lauderdale 3/9/1999 MW1 GrabLMZ City of Fort Lauderdale 3/16/1999 MW1 GrabLMZ City of Fort Lauderdale 4/6/1999 MW1 GrabLMZ City of Fort Lauderdale 4/13/1999 MW1 GrabLMZ City of Fort Lauderdale 4/20/1999 MW1 GrabLMZ City of Fort Lauderdale 4/27/1999 MW1 GrabLMZ City of Fort Lauderdale 5/4/1999 MW1 GrabLMZ City of Fort Lauderdale 5/11/1999 MW1 GrabLMZ City of Fort Lauderdale 5/18/1999 MW1 GrabLMZ City of Fort Lauderdale 5/25/1999 MW1 GrabLMZ City of Fort Lauderdale 6/1/1999 MW1 GrabLMZ City of Fort Lauderdale 6/8/1999 MW1 GrabLMZ City of Fort Lauderdale 6/15/1999 MW1 GrabLMZ City of Fort Lauderdale 6/22/1999 MW1 GrabLMZ City of Fort Lauderdale 6/29/1999 MW1 GrabLMZ City of Fort Lauderdale 7/6/1999 MW1 GrabLMZ City of Fort Lauderdale 7/13/1999 MW1 GrabLMZ City of Fort Lauderdale 8/3/1999 MW1 GrabLMZ City of Fort Lauderdale 8/10/1999 MW1 GrabLMZ City of Fort Lauderdale 8/17/1999 MW1 GrabLMZ City of Fort Lauderdale 8/24/1999 MW1 GrabLMZ City of Fort Lauderdale 8/31/1999 MW1 GrabLMZ City of Fort Lauderdale 9/7/1999 MW1 GrabLMZ City of Fort Lauderdale 9/15/1999 MW1 GrabLMZ City of Fort Lauderdale 9/21/1999 MW1 GrabLMZ City of Fort Lauderdale 9/28/1999 MW1 GrabLMZ City of Fort Lauderdale 10/5/1999 MW1 GrabLMZ City of Fort Lauderdale 10/12/1999 MW1 GrabLMZ City of Fort Lauderdale 10/19/1999 MW1 GrabLMZ City of Fort Lauderdale 10/26/1999 MW1 GrabLMZ City of Fort Lauderdale 11/2/1999 MW1 GrabLMZ City of Fort Lauderdale 11/9/1999 MW1 GrabLMZ City of Fort Lauderdale 11/16/1999 MW1 GrabLMZ City of Fort Lauderdale 11/23/1999 MW1 GrabLMZ City of Fort Lauderdale 11/30/1999 MW1 GrabLMZ City of Fort Lauderdale 12/7/1999 MW1 GrabLMZ City of Fort Lauderdale 12/14/1999 MW1 GrabLMZ City of Fort Lauderdale 12/21/1999 MW1 GrabLMZ City of Fort Lauderdale 12/28/1999 MW1 GrabLMZ City of Fort Lauderdale 3/1/1995 MW2 GrabLMZ City of Fort Lauderdale 3/10/1995 MW2 GrabLMZ City of Fort Lauderdale 3/17/1995 MW2 GrabLMZ City of Fort Lauderdale 3/24/1995 MW2 GrabLMZ City of Fort Lauderdale 3/31/1995 MW2 GrabLMZ City of Fort Lauderdale 4/7/1995 MW2 GrabLMZ City of Fort Lauderdale 4/11/1995 MW2 GrabLMZ City of Fort Lauderdale 4/19/1995 MW2 GrabLMZ City of Fort Lauderdale 4/25/1995 MW2 GrabLMZ City of Fort Lauderdale 5/2/1995 MW2 GrabLMZ City of Fort Lauderdale 5/9/1995 MW2 GrabLMZ City of Fort Lauderdale 5/16/1995 MW2 GrabSampling Origin Sampling Facility Sampling Date Sample Description Sampling TypeLMZ City of Fort Lauderdale 5/23/1995 MW2 GrabLMZ City of Fort Lauderdale 5/30/1995 MW2 GrabLMZ City of Fort Lauderdale 6/5/1995 MW2 Grab
FPL-012-179

LMZ City of Fort Lauderdale 6/13/1995 MW2 GrabLMZ City of Fort Lauderdale 6/20/1995 MW2 GrabLMZ City of Fort Lauderdale 6/27/1995 MW2 GrabLMZ City of Fort Lauderdale 7/4/1995 MW2 GrabLMZ City of Fort Lauderdale 7/11/1995 MW2 GrabLMZ City of Fort Lauderdale 7/18/1995 MW2 GrabLMZ City of Fort Lauderdale 7/25/1995 MW2 GrabLMZ City of Fort Lauderdale 7/31/1995 MW2 GrabLMZ City of Fort Lauderdale 8/8/1995 MW2 GrabLMZ City of Fort Lauderdale 8/15/1995 MW2 GrabLMZ City of Fort Lauderdale 8/22/1995 MW2 GrabLMZ City of Fort Lauderdale 8/29/1995 MW2 GrabLMZ City of Fort Lauderdale 9/5/1995 MW2 GrabLMZ City of Fort Lauderdale 9/12/1995 MW2 GrabLMZ City of Fort Lauderdale 9/19/1995 MW2 GrabLMZ City of Fort Lauderdale 9/26/1995 MW2 GrabLMZ City of Fort Lauderdale 10/3/1995 MW2 GrabLMZ City of Fort Lauderdale 10/10/1995 MW2 GrabLMZ City of Fort Lauderdale 10/17/1995 MW2 GrabLMZ City of Fort Lauderdale 10/24/1995 MW2 GrabLMZ City of Fort Lauderdale 10/31/1995 MW2 GrabLMZ City of Fort Lauderdale 11/7/1995 MW2 GrabLMZ City of Fort Lauderdale 11/14/1995 MW2 GrabLMZ City of Fort Lauderdale 11/21/1995 MW2 GrabLMZ City of Fort Lauderdale 11/28/1995 MW2 GrabLMZ City of Fort Lauderdale 12/5/1995 MW2 GrabLMZ City of Fort Lauderdale 12/12/1995 MW2 GrabLMZ City of Fort Lauderdale 12/19/1995 MW2 GrabLMZ City of Fort Lauderdale 12/26/1995 MW2 GrabLMZ City of Fort Lauderdale 1/2/1996 MW2 GrabLMZ City of Fort Lauderdale 1/9/1996 MW2 GrabLMZ City of Fort Lauderdale 1/16/1996 MW2 GrabLMZ City of Fort Lauderdale 1/23/1996 MW2 GrabLMZ City of Fort Lauderdale 1/30/1996 MW2 GrabLMZ City of Fort Lauderdale 2/6/1996 MW2 GrabLMZ City of Fort Lauderdale 2/13/1996 MW2 GrabLMZ City of Fort Lauderdale 2/20/1996 MW2 GrabLMZ City of Fort Lauderdale 2/27/1996 MW2 GrabLMZ City of Fort Lauderdale 3/5/1996 MW2 GrabLMZ City of Fort Lauderdale 3/12/1996 MW2 GrabLMZ City of Fort Lauderdale 3/19/1996 MW2 GrabLMZ City of Fort Lauderdale 3/26/1996 MW2 GrabLMZ City of Fort Lauderdale 4/2/1996 MW2 GrabLMZ City of Fort Lauderdale 4/9/1996 MW2 GrabLMZ City of Fort Lauderdale 4/16/1996 MW2 GrabLMZ City of Fort Lauderdale 4/23/1996 MW2 GrabLMZ City of Fort Lauderdale 4/30/1996 MW2 GrabLMZ City of Fort Lauderdale 5/7/1996 MW2 GrabLMZ City of Fort Lauderdale 5/14/1996 MW2 GrabLMZ City of Fort Lauderdale 6/4/1996 MW2 GrabLMZ City of Fort Lauderdale 6/11/1996 MW2 GrabLMZ City of Fort Lauderdale 6/189/96 MW2 GrabLMZ City of Fort Lauderdale 6/25/1996 MW2 GrabLMZ City of Fort Lauderdale 7/2/1996 MW2 GrabLMZ City of Fort Lauderdale 7/9/1996 MW2 GrabLMZ City of Fort Lauderdale 7/16/1996 MW2 GrabLMZ City of Fort Lauderdale 7/23/1996 MW2 GrabLMZ City of Fort Lauderdale 7/30/1996 MW2 GrabLMZ City of Fort Lauderdale 8/6/1996 MW2 GrabLMZ City of Fort Lauderdale 8/15/1996 MW2 GrabLMZ City of Fort Lauderdale 8/20/1996 MW2 GrabLMZ City of Fort Lauderdale 8/27/1996 MW2 GrabLMZ City of Fort Lauderdale 9/4/1996 MW2 GrabLMZ City of Fort Lauderdale 9/17/1996 MW2 GrabSampling Origin Sampling Facility Sampling Date Sample Description Sampling TypeLMZ City of Fort Lauderdale 10/8/1996 MW2 GrabLMZ City of Fort Lauderdale 10/15/1996 MW2 GrabLMZ City of Fort Lauderdale 10/22/1996 MW2 GrabLMZ City of Fort Lauderdale 10/29/1996 MW2 GrabLMZ City of Fort Lauderdale 11/5/1996 MW2 GrabLMZ City of Fort Lauderdale 11/12/1996 MW2 GrabLMZ City of Fort Lauderdale 11/18/1996 MW2 Grab
FPL-012-180

LMZ City of Fort Lauderdale 11/26/1996 MW2 GrabLMZ City of Fort Lauderdale 12/2/1996 MW2 GrabLMZ City of Fort Lauderdale 12/10/1996 MW2 GrabLMZ City of Fort Lauderdale 12/17/1996 MW2 GrabLMZ City of Fort Lauderdale 12/24/1996 MW2 GrabLMZ City of Fort Lauderdale 12/31/1996 MW2 GrabLMZ City of Fort Lauderdale 1/7/1997 MW2 GrabLMZ City of Fort Lauderdale 1/14/1997 MW2 GrabLMZ City of Fort Lauderdale 1/21/1997 MW2 GrabLMZ City of Fort Lauderdale 1/28/1997 MW2 GrabLMZ City of Fort Lauderdale 2/4/1997 MW2 GrabLMZ City of Fort Lauderdale 2/11/1997 MW2 GrabLMZ City of Fort Lauderdale 2/18/1997 MW2 GrabLMZ City of Fort Lauderdale 2/25/1997 MW2 GrabLMZ City of Fort Lauderdale 3/4/1997 MW2 GrabLMZ City of Fort Lauderdale 3/11/1997 MW2 GrabLMZ City of Fort Lauderdale 3/18/1997 MW2 GrabLMZ City of Fort Lauderdale 3/25/1997 MW2 GrabLMZ City of Fort Lauderdale 4/1/1997 MW2 GrabLMZ City of Fort Lauderdale 4/8/1997 MW2 GrabLMZ City of Fort Lauderdale 5/6/1997 MW2 GrabLMZ City of Fort Lauderdale 5/13/1997 MW2 GrabLMZ City of Fort Lauderdale 5/20/1997 MW2 GrabLMZ City of Fort Lauderdale 5/27/1997 MW2 GrabLMZ City of Fort Lauderdale 6/3/1997 MW2 GrabLMZ City of Fort Lauderdale 6/10/1997 MW2 GrabLMZ City of Fort Lauderdale 6/18/1997 MW2 GrabLMZ City of Fort Lauderdale 6/24/1997 MW2 GrabLMZ City of Fort Lauderdale 7/1/1997 MW2 GrabLMZ City of Fort Lauderdale 7/8/1997 MW2 GrabLMZ City of Fort Lauderdale 7/15/1997 MW2 GrabLMZ City of Fort Lauderdale 7/22/1997 MW2 GrabLMZ City of Fort Lauderdale 7/29/1997 MW2 GrabLMZ City of Fort Lauderdale 8/5/1997 MW2 GrabLMZ City of Fort Lauderdale 8/12/1997 MW2 GrabLMZ City of Fort Lauderdale 8/18/1997 MW2 GrabLMZ City of Fort Lauderdale 8/26/1997 MW2 GrabLMZ City of Fort Lauderdale 9/3/1997 MW2 GrabLMZ City of Fort Lauderdale 9/9/1997 MW2 GrabLMZ City of Fort Lauderdale 9/16/1997 MW2 GrabLMZ City of Fort Lauderdale 9/23/1997 MW2 GrabLMZ City of Fort Lauderdale 9/30/1997 MW2 GrabLMZ City of Fort Lauderdale 10/7/1997 MW2 GrabLMZ City of Fort Lauderdale 10/14/1997 MW2 GrabLMZ City of Fort Lauderdale 10/22/1997 MW2 GrabLMZ City of Fort Lauderdale 10/29/1997 MW2 GrabLMZ City of Fort Lauderdale 11/5/1997 MW2 GrabLMZ City of Fort Lauderdale 11/12/1997 MW2 GrabLMZ City of Fort Lauderdale 11/18/1997 MW2 GrabLMZ City of Fort Lauderdale 11/25/1997 MW2 GrabLMZ City of Fort Lauderdale 12/2/1997 MW2 GrabLMZ City of Fort Lauderdale 12/9/1997 MW2 GrabLMZ City of Fort Lauderdale 12/16/1997 MW2 GrabLMZ City of Fort Lauderdale 12/23/1997 MW2 GrabLMZ City of Fort Lauderdale 12/30/1997 MW2 GrabLMZ City of Fort Lauderdale 1/6/1998 MW2 GrabLMZ City of Fort Lauderdale 1/13/1998 MW2 GrabLMZ City of Fort Lauderdale 1/20/1998 MW2 GrabLMZ City of Fort Lauderdale 1/27/1998 MW2 GrabLMZ City of Fort Lauderdale 2/3/1998 MW2 GrabSampling Origin Sampling Facility Sampling Date Sample Description Sampling TypeLMZ City of Fort Lauderdale 2/10/1998 MW2 GrabLMZ City of Fort Lauderdale 2/17/1998 MW2 GrabLMZ City of Fort Lauderdale 2/24/1998 MW2 GrabLMZ City of Fort Lauderdale 3/3/1998 MW2 GrabLMZ City of Fort Lauderdale 3/10/1998 MW2 GrabLMZ City of Fort Lauderdale 3/17/1998 MW2 GrabLMZ City of Fort Lauderdale 3/24/1998 MW2 GrabLMZ City of Fort Lauderdale 3/31/1998 MW2 GrabLMZ City of Fort Lauderdale 4/7/1998 MW2 GrabLMZ City of Fort Lauderdale 4/14/1998 MW2 GrabLMZ City of Fort Lauderdale 4/21/1998 MW2 Grab
FPL-012-181
LMZ City of Fort Lauderdale 4/28/1998 MW2 GrabLMZ City of Fort Lauderdale 5/5/1998 MW2 GrabLMZ City of Fort Lauderdale 5/12/1998 MW2 GrabLMZ City of Fort Lauderdale 5/19/1998 MW2 GrabLMZ City of Fort Lauderdale 5/26/1998 MW2 GrabLMZ City of Fort Lauderdale 6/2/1998 MW2 GrabLMZ City of Fort Lauderdale 6/9/1998 MW2 GrabLMZ City of Fort Lauderdale 6/16/1998 MW2 GrabLMZ City of Fort Lauderdale 6/23/1998 MW2 GrabLMZ City of Fort Lauderdale 6/30/1998 MW2 GrabLMZ City of Fort Lauderdale 7/7/1998 MW2 GrabLMZ City of Fort Lauderdale 7/14/1998 MW2 GrabLMZ City of Fort Lauderdale 7/21/1998 MW2 GrabLMZ City of Fort Lauderdale 7/28/1998 MW2 GrabLMZ City of Fort Lauderdale 8/4/1998 MW2 GrabLMZ City of Fort Lauderdale 8/11/1998 MW2 GrabLMZ City of Fort Lauderdale 8/18/1998 MW2 GrabLMZ City of Fort Lauderdale 8/25/1998 MW2 GrabLMZ City of Fort Lauderdale 9/1/1998 MW2 GrabLMZ City of Fort Lauderdale 9/8/1998 MW2 GrabLMZ City of Fort Lauderdale 9/15/1998 MW2 GrabLMZ City of Fort Lauderdale 9/22/1998 MW2 GrabLMZ City of Fort Lauderdale 9/29/1998 MW2 GrabLMZ City of Fort Lauderdale 10/6/1998 MW2 GrabLMZ City of Fort Lauderdale 10/13/1998 MW2 GrabLMZ City of Fort Lauderdale 10/20/1998 MW2 GrabLMZ City of Fort Lauderdale 10/27/1998 MW2 GrabLMZ City of Fort Lauderdale 11/3/1998 MW2 GrabLMZ City of Fort Lauderdale 11/10/1998 MW2 GrabLMZ City of Fort Lauderdale 11/17/1998 MW2 GrabLMZ City of Fort Lauderdale 11/24/1998 MW2 GrabLMZ City of Fort Lauderdale 12/1/1998 MW2 GrabLMZ City of Fort Lauderdale 12/8/1998 MW2 GrabLMZ City of Fort Lauderdale 12/15/1998 MW2 GrabLMZ City of Fort Lauderdale 12/22/1998 MW2 GrabLMZ City of Fort Lauderdale 12/29/1998 MW2 GrabLMZ City of Fort Lauderdale 1/5/1999 MW2 GrabLMZ City of Fort Lauderdale 1/12/1999 MW2 GrabLMZ City of Fort Lauderdale 1/19/1999 MW2 GrabLMZ City of Fort Lauderdale 1/26/1999 MW2 GrabLMZ City of Fort Lauderdale 2/2/1999 MW2 GrabLMZ City of Fort Lauderdale 2/9/1999 MW2 GrabLMZ City of Fort Lauderdale 2/16/1999 MW2 GrabLMZ City of Fort Lauderdale 2/23/1999 MW2 GrabLMZ City of Fort Lauderdale 3/2/1999 MW2 GrabLMZ City of Fort Lauderdale 3/9/1999 MW2 GrabLMZ City of Fort Lauderdale 3/16/1999 MW2 GrabLMZ City of Fort Lauderdale 4/6/1999 MW2 GrabLMZ City of Fort Lauderdale 4/13/1999 MW2 GrabLMZ City of Fort Lauderdale 4/20/1999 MW2 GrabLMZ City of Fort Lauderdale 4/27/1999 MW2 GrabLMZ City of Fort Lauderdale 5/4/1999 MW2 GrabLMZ City of Fort Lauderdale 5/11/1999 MW2 GrabLMZ City of Fort Lauderdale 5/18/1999 MW2 GrabLMZ City of Fort Lauderdale 5/25/1999 MW2 GrabLMZ City of Fort Lauderdale 6/1/1999 MW2 GrabSampling Origin Sampling Facility Sampling Date Sample Description Sampling TypeLMZ City of Fort Lauderdale 6/8/1999 MW2 GrabLMZ City of Fort Lauderdale 6/15/1999 MW2 GrabLMZ City of Fort Lauderdale 6/22/1999 MW2 GrabLMZ City of Fort Lauderdale 6/29/1999 MW2 GrabLMZ City of Fort Lauderdale 7/6/1999 MW2 GrabLMZ City of Fort Lauderdale 7/13/1999 MW2 GrabLMZ City of Fort Lauderdale 8/3/1999 MW2 GrabLMZ City of Fort Lauderdale 8/10/1999 MW2 GrabLMZ City of Fort Lauderdale 8/17/1999 MW2 GrabLMZ City of Fort Lauderdale 8/24/1999 MW2 GrabLMZ City of Fort Lauderdale 8/31/1999 MW2 GrabLMZ City of Fort Lauderdale 9/7/1999 MW2 GrabLMZ City of Fort Lauderdale 9/15/1999 MW2 GrabLMZ City of Fort Lauderdale 9/21/1999 MW2 GrabLMZ City of Fort Lauderdale 9/28/1999 MW2 Grab
FPL-012-182

LMZ City of Fort Lauderdale 10/5/1999 MW2 GrabLMZ City of Fort Lauderdale 10/12/1999 MW2 GrabLMZ City of Fort Lauderdale 10/19/1999 MW2 GrabLMZ City of Fort Lauderdale 10/26/1999 MW2 GrabLMZ City of Fort Lauderdale 11/2/1999 MW2 GrabLMZ City of Fort Lauderdale 11/9/1999 MW2 GrabLMZ City of Fort Lauderdale 11/16/1999 MW2 GrabLMZ City of Fort Lauderdale 11/23/1999 MW2 GrabLMZ City of Fort Lauderdale 11/30/1999 MW2 GrabLMZ City of Fort Lauderdale 12/7/1999 MW2 GrabLMZ City of Fort Lauderdale 12/14/1999 MW2 GrabLMZ City of Fort Lauderdale 12/21/1999 MW2 GrabLMZ City of Fort Lauderdale 12/28/1999 MW2 GrabLMZ City of Fort Lauderdale 3/1/1995 MW3 GrabLMZ City of Fort Lauderdale 3/10/1995 MW3 GrabLMZ City of Fort Lauderdale 3/17/1995 MW3 GrabLMZ City of Fort Lauderdale 3/24/1995 MW3 GrabLMZ City of Fort Lauderdale 3/31/1995 MW3 GrabLMZ City of Fort Lauderdale 4/7/1995 MW3 GrabLMZ City of Fort Lauderdale 4/11/1995 MW3 GrabLMZ City of Fort Lauderdale 4/19/1995 MW3 GrabLMZ City of Fort Lauderdale 4/25/1995 MW3 GrabLMZ City of Fort Lauderdale 5/2/1995 MW3 GrabLMZ City of Fort Lauderdale 5/9/1995 MW3 GrabLMZ City of Fort Lauderdale 5/16/1995 MW3 GrabLMZ City of Fort Lauderdale 5/23/1995 MW3 GrabLMZ City of Fort Lauderdale 5/30/1995 MW3 GrabLMZ City of Fort Lauderdale 6/5/1995 MW3 GrabLMZ City of Fort Lauderdale 6/13/1995 MW3 GrabLMZ City of Fort Lauderdale 6/20/1995 MW3 GrabLMZ City of Fort Lauderdale 6/27/1995 MW3 GrabLMZ City of Fort Lauderdale 7/4/1995 MW3 GrabLMZ City of Fort Lauderdale 7/11/1995 MW3 GrabLMZ City of Fort Lauderdale 7/18/1995 MW3 GrabLMZ City of Fort Lauderdale 7/25/1995 MW3 GrabLMZ City of Fort Lauderdale 7/31/1995 MW3 GrabLMZ City of Fort Lauderdale 8/8/1995 MW3 GrabLMZ City of Fort Lauderdale 8/15/1995 MW3 GrabLMZ City of Fort Lauderdale 8/22/1995 MW3 GrabLMZ City of Fort Lauderdale 8/29/1995 MW3 GrabLMZ City of Fort Lauderdale 9/5/1995 MW3 GrabLMZ City of Fort Lauderdale 9/12/1995 MW3 GrabLMZ City of Fort Lauderdale 9/19/1995 MW3 GrabLMZ City of Fort Lauderdale 9/26/1995 MW3 GrabLMZ City of Fort Lauderdale 10/3/1995 MW3 GrabLMZ City of Fort Lauderdale 10/10/1995 MW3 GrabLMZ City of Fort Lauderdale 10/17/1995 MW3 GrabLMZ City of Fort Lauderdale 10/24/1995 MW3 GrabLMZ City of Fort Lauderdale 10/31/1995 MW3 GrabLMZ City of Fort Lauderdale 11/7/1995 MW3 GrabLMZ City of Fort Lauderdale 11/14/1995 MW3 GrabLMZ City of Fort Lauderdale 11/21/1995 MW3 GrabSampling Origin Sampling Facility Sampling Date Sample Description Sampling TypeLMZ City of Fort Lauderdale 11/28/1995 MW3 GrabLMZ City of Fort Lauderdale 12/5/1995 MW3 GrabLMZ City of Fort Lauderdale 12/12/1995 MW3 GrabLMZ City of Fort Lauderdale 12/19/1995 MW3 GrabLMZ City of Fort Lauderdale 12/26/1995 MW3 GrabLMZ City of Fort Lauderdale 1/2/1996 MW3 GrabLMZ City of Fort Lauderdale 1/9/1996 MW3 GrabLMZ City of Fort Lauderdale 1/16/1996 MW3 GrabLMZ City of Fort Lauderdale 1/23/1996 MW3 GrabLMZ City of Fort Lauderdale 1/30/1996 MW3 GrabLMZ City of Fort Lauderdale 2/6/1996 MW3 GrabLMZ City of Fort Lauderdale 2/13/1996 MW3 GrabLMZ City of Fort Lauderdale 2/20/1996 MW3 GrabLMZ City of Fort Lauderdale 2/27/1996 MW3 GrabLMZ City of Fort Lauderdale 3/5/1996 MW3 GrabLMZ City of Fort Lauderdale 3/12/1996 MW3 GrabLMZ City of Fort Lauderdale 3/19/1996 MW3 GrabLMZ City of Fort Lauderdale 3/26/1996 MW3 GrabLMZ City of Fort Lauderdale 4/2/1996 MW3 Grab
FPL-012-183
LMZ City of Fort Lauderdale 4/9/1996 MW3 GrabLMZ City of Fort Lauderdale 4/16/1996 MW3 GrabLMZ City of Fort Lauderdale 4/23/1996 MW3 GrabLMZ City of Fort Lauderdale 4/30/1996 MW3 GrabLMZ City of Fort Lauderdale 5/7/1996 MW3 GrabLMZ City of Fort Lauderdale 5/14/1996 MW3 GrabLMZ City of Fort Lauderdale 6/4/1996 MW3 GrabLMZ City of Fort Lauderdale 6/11/1996 MW3 GrabLMZ City of Fort Lauderdale 6/19/1996 MW3 GrabLMZ City of Fort Lauderdale 6/25/1996 MW3 GrabLMZ City of Fort Lauderdale 7/2/1996 MW3 GrabLMZ City of Fort Lauderdale 7/9/1996 MW3 GrabLMZ City of Fort Lauderdale 7/16/1996 MW3 GrabLMZ City of Fort Lauderdale 7/23/1996 MW3 GrabLMZ City of Fort Lauderdale 7/30/1996 MW3 GrabLMZ City of Fort Lauderdale 8/6/1996 MW3 GrabLMZ City of Fort Lauderdale 8/15/1996 MW3 GrabLMZ City of Fort Lauderdale 8/20/1996 MW3 GrabLMZ City of Fort Lauderdale 9/4/1996 MW3 GrabLMZ City of Fort Lauderdale 9/10/1996 MW3 GrabLMZ City of Fort Lauderdale 9/17/1996 MW3 GrabLMZ City of Fort Lauderdale 10/8/1996 MW3 GrabLMZ City of Fort Lauderdale 10/15/1996 MW3 GrabLMZ City of Fort Lauderdale 10/22/1996 MW3 GrabLMZ City of Fort Lauderdale 10/29/1996 MW3 GrabLMZ City of Fort Lauderdale 11/5/1996 MW3 GrabLMZ City of Fort Lauderdale 11/12/1996 MW3 GrabLMZ City of Fort Lauderdale 11/18/1996 MW3 GrabLMZ City of Fort Lauderdale 11/26/1996 MW3 GrabLMZ City of Fort Lauderdale 12/2/1996 MW3 GrabLMZ City of Fort Lauderdale 12/10/1996 MW3 GrabLMZ City of Fort Lauderdale 12/17/1996 MW3 GrabLMZ City of Fort Lauderdale 12/24/1996 MW3 GrabLMZ City of Fort Lauderdale 12/31/1996 MW3 GrabLMZ City of Fort Lauderdale 1/7/1997 MW3 GrabLMZ City of Fort Lauderdale 1/14/1997 MW3 GrabLMZ City of Fort Lauderdale 1/21/1997 MW3 GrabLMZ City of Fort Lauderdale 1/28/1997 MW3 GrabLMZ City of Fort Lauderdale 2/4/1997 MW3 GrabLMZ City of Fort Lauderdale 2/11/1997 MW3 GrabLMZ City of Fort Lauderdale 2/18/1997 MW3 GrabLMZ City of Fort Lauderdale 2/25/1997 MW3 GrabLMZ City of Fort Lauderdale 3/4/1997 MW3 GrabLMZ City of Fort Lauderdale 3/11/1997 MW3 GrabLMZ City of Fort Lauderdale 3/18/1997 MW3 GrabLMZ City of Fort Lauderdale 3/25/1997 MW3 GrabLMZ City of Fort Lauderdale 4/1/1997 MW3 GrabLMZ City of Fort Lauderdale 4/8/1997 MW3 GrabSampling Origin Sampling Facility Sampling Date Sample Description Sampling TypeLMZ City of Fort Lauderdale 5/6/1997 MW3 GrabLMZ City of Fort Lauderdale 5/13/1997 MW3 GrabLMZ City of Fort Lauderdale 5/20/1997 MW3 GrabLMZ City of Fort Lauderdale 5/27/1997 MW3 GrabLMZ City of Fort Lauderdale 6/3/1997 MW3 GrabLMZ City of Fort Lauderdale 6/10/1997 MW3 GrabLMZ City of Fort Lauderdale 6/18/1997 MW3 GrabLMZ City of Fort Lauderdale 6/24/1997 MW3 GrabLMZ City of Fort Lauderdale 7/1/1997 MW3 GrabLMZ City of Fort Lauderdale 7/8/1997 MW3 GrabLMZ City of Fort Lauderdale 7/15/1997 MW3 GrabLMZ City of Fort Lauderdale 7/22/1997 MW3 GrabLMZ City of Fort Lauderdale 7/29/1997 MW3 GrabLMZ City of Fort Lauderdale 8/5/1997 MW3 GrabLMZ City of Fort Lauderdale 8/12/1997 MW3 GrabLMZ City of Fort Lauderdale 8/18/1997 MW3 GrabLMZ City of Fort Lauderdale 8/26/1997 MW3 GrabLMZ City of Fort Lauderdale 9/3/1997 MW3 GrabLMZ City of Fort Lauderdale 9/9/1997 MW3 GrabLMZ City of Fort Lauderdale 9/16/1997 MW3 GrabLMZ City of Fort Lauderdale 9/23/1997 MW3 GrabLMZ City of Fort Lauderdale 9/30/1997 MW3 GrabLMZ City of Fort Lauderdale 10/7/1997 MW3 Grab
FPL-012-184

LMZ City of Fort Lauderdale 10/14/1997 MW3 GrabLMZ City of Fort Lauderdale 10/22/1997 MW3 GrabLMZ City of Fort Lauderdale 10/29/1997 MW3 GrabLMZ City of Fort Lauderdale 11/5/1997 MW3 GrabLMZ City of Fort Lauderdale 11/12/1997 MW3 GrabLMZ City of Fort Lauderdale 11/18/1997 MW3 GrabLMZ City of Fort Lauderdale 11/25/1997 MW3 GrabLMZ City of Fort Lauderdale 12/2/1997 MW3 GrabLMZ City of Fort Lauderdale 12/9/1997 MW3 GrabLMZ City of Fort Lauderdale 12/16/1997 MW3 GrabLMZ City of Fort Lauderdale 12/23/1997 MW3 GrabLMZ City of Fort Lauderdale 12/30/1997 MW3 GrabLMZ City of Fort Lauderdale 1/6/1998 MW3 GrabLMZ City of Fort Lauderdale 1/13/1998 MW3 GrabLMZ City of Fort Lauderdale 1/20/1998 MW3 GrabLMZ City of Fort Lauderdale 1/27/1998 MW3 GrabLMZ City of Fort Lauderdale 2/3/1998 MW3 GrabLMZ City of Fort Lauderdale 2/10/1998 MW3 GrabLMZ City of Fort Lauderdale 2/17/1998 MW3 GrabLMZ City of Fort Lauderdale 2/24/1998 MW3 GrabLMZ City of Fort Lauderdale 3/3/1998 MW3 GrabLMZ City of Fort Lauderdale 3/10/1998 MW3 GrabLMZ City of Fort Lauderdale 3/17/1998 MW3 GrabLMZ City of Fort Lauderdale 3/24/1998 MW3 GrabLMZ City of Fort Lauderdale 3/31/1998 MW3 GrabLMZ City of Fort Lauderdale 4/7/1998 MW3 GrabLMZ City of Fort Lauderdale 4/14/1998 MW3 GrabLMZ City of Fort Lauderdale 4/21/1998 MW3 GrabLMZ City of Fort Lauderdale 4/28/1998 MW3 GrabLMZ City of Fort Lauderdale 5/5/1998 MW3 GrabLMZ City of Fort Lauderdale 5/12/1998 MW3 GrabLMZ City of Fort Lauderdale 5/19/1998 MW3 GrabLMZ City of Fort Lauderdale 5/26/1998 MW3 GrabLMZ City of Fort Lauderdale 6/2/1998 MW3 GrabLMZ City of Fort Lauderdale 6/9/1998 MW3 GrabLMZ City of Fort Lauderdale 6/16/1998 MW3 GrabLMZ City of Fort Lauderdale 6/23/1998 MW3 GrabLMZ City of Fort Lauderdale 6/30/1998 MW3 GrabLMZ City of Fort Lauderdale 7/7/1998 MW3 GrabLMZ City of Fort Lauderdale 7/14/1998 MW3 GrabLMZ City of Fort Lauderdale 7/21/1998 MW3 GrabLMZ City of Fort Lauderdale 7/28/1998 MW3 GrabLMZ City of Fort Lauderdale 8/4/1998 MW3 GrabLMZ City of Fort Lauderdale 8/11/1998 MW3 GrabSampling Origin Sampling Facility Sampling Date Sample Description Sampling TypeLMZ City of Fort Lauderdale 8/18/1998 MW3 GrabLMZ City of Fort Lauderdale 8/25/1998 MW3 GrabLMZ City of Fort Lauderdale 9/1/1998 MW3 GrabLMZ City of Fort Lauderdale 9/8/1998 MW3 GrabLMZ City of Fort Lauderdale 9/15/1998 MW3 GrabLMZ City of Fort Lauderdale 9/22/1998 MW3 GrabLMZ City of Fort Lauderdale 9/29/1998 MW3 GrabLMZ City of Fort Lauderdale 10/6/1998 MW3 GrabLMZ City of Fort Lauderdale 10/13/1998 MW3 GrabLMZ City of Fort Lauderdale 10/20/1998 MW3 GrabLMZ City of Fort Lauderdale 10/27/1998 MW3 GrabLMZ City of Fort Lauderdale 11/3/1998 MW3 GrabLMZ City of Fort Lauderdale 11/10/1998 MW3 GrabLMZ City of Fort Lauderdale 11/17/1998 MW3 GrabLMZ City of Fort Lauderdale 11/24/1998 MW3 GrabLMZ City of Fort Lauderdale 12/1/1998 MW3 GrabLMZ City of Fort Lauderdale 12/8/1998 MW3 GrabLMZ City of Fort Lauderdale 12/15/1998 MW3 GrabLMZ City of Fort Lauderdale 12/22/1998 MW3 GrabLMZ City of Fort Lauderdale 12/29/1998 MW3 GrabLMZ City of Fort Lauderdale 1/5/1999 MW3 GrabLMZ City of Fort Lauderdale 1/12/1999 MW3 GrabLMZ City of Fort Lauderdale 1/19/1999 MW3 GrabLMZ City of Fort Lauderdale 1/26/1999 MW3 GrabLMZ City of Fort Lauderdale 2/2/1999 MW3 GrabLMZ City of Fort Lauderdale 2/9/1999 MW3 GrabLMZ City of Fort Lauderdale 2/16/1999 MW3 Grab
FPL-012-185

LMZ City of Fort Lauderdale 2/23/1999 MW3 GrabLMZ City of Fort Lauderdale 3/2/1999 MW3 GrabLMZ City of Fort Lauderdale 3/9/1999 MW3 GrabLMZ City of Fort Lauderdale 3/16/1999 MW3 GrabLMZ City of Fort Lauderdale 4/6/1999 MW3 GrabLMZ City of Fort Lauderdale 4/13/1999 MW3 GrabLMZ City of Fort Lauderdale 4/20/1999 MW3 GrabLMZ City of Fort Lauderdale 4/27/1999 MW3 GrabLMZ City of Fort Lauderdale 5/4/1999 MW3 GrabLMZ City of Fort Lauderdale 5/11/1999 MW3 GrabLMZ City of Fort Lauderdale 5/18/1999 MW3 GrabLMZ City of Fort Lauderdale 5/25/1999 MW3 GrabLMZ City of Fort Lauderdale 6/1/1999 MW3 GrabLMZ City of Fort Lauderdale 6/8/1999 MW3 GrabLMZ City of Fort Lauderdale 6/15/1999 MW3 GrabLMZ City of Fort Lauderdale 6/22/1999 MW3 GrabLMZ City of Fort Lauderdale 6/29/1999 MW3 GrabLMZ City of Fort Lauderdale 7/6/1999 MW3 GrabLMZ City of Fort Lauderdale 7/13/1999 MW3 GrabLMZ City of Fort Lauderdale 8/3/1999 MW3 GrabLMZ City of Fort Lauderdale 8/10/1999 MW3 GrabLMZ City of Fort Lauderdale 8/17/1999 MW3 GrabLMZ City of Fort Lauderdale 8/24/1999 MW3 GrabLMZ City of Fort Lauderdale 8/31/1999 MW3 GrabLMZ City of Fort Lauderdale 9/7/1999 MW3 GrabLMZ City of Fort Lauderdale 9/15/1999 MW3 GrabLMZ City of Fort Lauderdale 9/21/1999 MW3 GrabLMZ City of Fort Lauderdale 9/28/1999 MW3 GrabLMZ City of Fort Lauderdale 10/5/1999 MW3 GrabLMZ City of Fort Lauderdale 10/12/1999 MW3 GrabLMZ City of Fort Lauderdale 10/19/1999 MW3 GrabLMZ City of Fort Lauderdale 10/26/1999 MW3 GrabLMZ City of Fort Lauderdale 11/2/1999 MW3 GrabLMZ City of Fort Lauderdale 11/9/1999 MW3 GrabLMZ City of Fort Lauderdale 11/16/1999 MW3 GrabLMZ City of Fort Lauderdale 11/23/1999 MW3 GrabLMZ City of Fort Lauderdale 11/30/1999 MW3 GrabLMZ City of Fort Lauderdale 12/7/1999 MW3 GrabLMZ City of Fort Lauderdale 12/14/1999 MW3 GrabLMZ City of Fort Lauderdale 12/21/1999 MW3 GrabSampling Origin Sampling Facility Sampling Date Sample Description Sampling TypeLMZ City of Fort Lauderdale 12/28/1999 MW3 GrabLMZ City of Fort Lauderdale 3/31/1995 RMW1 GrabLMZ City of Fort Lauderdale 4/7/1995 RMW1 GrabLMZ City of Fort Lauderdale 4/11/1995 RMW1 GrabLMZ City of Fort Lauderdale 4/19/1995 RMW1 GrabLMZ City of Fort Lauderdale 4/25/1995 RMW1 GrabLMZ City of Fort Lauderdale 5/2/1995 RMW1 GrabLMZ City of Fort Lauderdale 5/9/1995 RMW1 GrabLMZ City of Fort Lauderdale 5/16/1995 RMW1 GrabLMZ City of Fort Lauderdale 5/23/1995 RMW1 GrabLMZ City of Fort Lauderdale 5/30/1995 RMW1 GrabLMZ City of Fort Lauderdale 6/5/1995 RMW1 GrabLMZ City of Fort Lauderdale 6/13/1995 RMW1 GrabLMZ City of Fort Lauderdale 6/20/1995 RMW1 GrabLMZ City of Fort Lauderdale 6/27/1995 RMW1 GrabLMZ City of Fort Lauderdale 7/4/1995 RMW1 GrabLMZ City of Fort Lauderdale 7/11/1995 RMW1 GrabLMZ City of Fort Lauderdale 7/18/1995 RMW1 GrabLMZ City of Fort Lauderdale 7/25/1995 RMW1 GrabLMZ City of Fort Lauderdale 7/31/1995 RMW1 GrabLMZ City of Fort Lauderdale 8/8/1995 RMW1 GrabLMZ City of Fort Lauderdale 8/15/1995 RMW1 GrabLMZ City of Fort Lauderdale 8/22/1995 RMW1 GrabLMZ City of Fort Lauderdale 8/29/1995 RMW1 GrabLMZ City of Fort Lauderdale 9/5/1995 RMW1 GrabLMZ City of Fort Lauderdale 9/12/1995 RMW1 GrabLMZ City of Fort Lauderdale 9/19/1995 RMW1 GrabLMZ City of Fort Lauderdale 9/26/1995 RMW1 GrabLMZ City of Fort Lauderdale 10/3/1995 RMW1 GrabLMZ City of Fort Lauderdale 10/10/1995 RMW1 GrabLMZ City of Fort Lauderdale 11/7/1995 RMW1 Grab
FPL-012-186
LMZ City of Fort Lauderdale 12/5/1995 RMW1 GrabLMZ City of Fort Lauderdale 1/2/1996 RMW1 GrabLMZ City of Fort Lauderdale 2/6/1996 RMW1 GrabLMZ City of Fort Lauderdale 3/5/1996 RMW1 GrabLMZ City of Fort Lauderdale 3/19/1996 RMW1 GrabLMZ City of Fort Lauderdale 4/2/1996 RMW1 GrabLMZ City of Fort Lauderdale 5/7/1996 RMW1 GrabLMZ City of Fort Lauderdale 6/4/1996 RMW1 GrabLMZ City of Fort Lauderdale 7/2/1996 RMW1 GrabLMZ City of Fort Lauderdale 8/6/1996 RMW1 GrabLMZ City of Fort Lauderdale 9/4/1996 RMW1 GrabLMZ City of Fort Lauderdale 10/8/1996 RMW1 GrabLMZ City of Fort Lauderdale 11/5/1996 RMW1 GrabLMZ City of Fort Lauderdale 12/2/1996 RMW1 GrabLMZ City of Fort Lauderdale 1/7/1997 RMW1 GrabLMZ City of Fort Lauderdale 2/4/1997 RMW1 GrabLMZ City of Fort Lauderdale 3/4/1997 RMW1 GrabLMZ City of Fort Lauderdale 4/8/1997 RMW1 GrabLMZ City of Fort Lauderdale 5/6/1997 RMW1 GrabLMZ City of Fort Lauderdale 6/3/1997 RMW1 GrabLMZ City of Fort Lauderdale 7/8/1997 RMW1 GrabLMZ City of Fort Lauderdale 8/5/1997 RMW1 GrabLMZ City of Fort Lauderdale 9/3/1997 RMW1 GrabLMZ City of Fort Lauderdale 10/7/1997 RMW1 GrabLMZ City of Fort Lauderdale 11/5/1997 RMW1 GrabLMZ City of Fort Lauderdale 12/2/1997 RMW1 GrabLMZ City of Fort Lauderdale 1/6/1998 RMW1 GrabLMZ City of Fort Lauderdale 2/3/1998 RMW1 GrabLMZ City of Fort Lauderdale 3/3/1998 RMW1 GrabLMZ City of Fort Lauderdale 5/5/1998 RMW1 GrabLMZ City of Fort Lauderdale 6/2/1998 RMW1 GrabLMZ City of Fort Lauderdale 7/7/1998 RMW1 GrabLMZ City of Fort Lauderdale 8/4/1998 RMW1 GrabLMZ City of Fort Lauderdale 9/1/1998 RMW1 GrabLMZ City of Fort Lauderdale 10/6/1998 RMW1 GrabLMZ City of Fort Lauderdale 12/8/1998 RMW1 GrabSampling Origin Sampling Facility Sampling Date Sample Description Sampling TypeLMZ City of Fort Lauderdale 10/5/1999 RMW1 GrabLMZ City of Fort Lauderdale 11/2/1999 RMW1 GrabLMZ City of Fort Lauderdale 12/7/1999 RMW1 GrabLMZ MD-North District 3/19/1996 FAL 1, 2, 3, 4 GrabLMZ MD-North District 3/27/1996 FAL 1, 2, 3, 4 GrabLMZ MD-North District 4/1/1996 FAL 1, 2, 3, 4 GrabLMZ MD-North District 4/9/1996 FAL 1, 2, 3, 4 GrabLMZ MD-North District 4/16/1996 FAL 1, 2, 3, 4 GrabLMZ MD-North District 5/1/1996 FAL 1, 2, 3, 4 GrabLMZ MD-North District 5/9/1996 FAL 1, 2, 3, 4 GrabLMZ MD-North District 5/23/1996 FAL 1, 2, 3, 4 GrabLMZ MD-North District 5/30/1996 FAL 1, 2, 3, 4 GrabLMZ MD-North District 6/3/1996 FAL 1, 2, 3, 4 GrabLMZ MD-North District 6/19/1996 FAL 1, 2, 3, 4 GrabLMZ MD-North District 6/27/1996 FAL 1, 2, 3, 4 GrabLMZ MD-North District 7/16/1996 FAL 1, 2, 3, 4 GrabLMZ MD-North District 7/23/1996 FAL 1, 2, 3, 4 GrabLMZ MD-North District 7/31/1996 FAL 1, 2, 3, 4 GrabLMZ MD-North District 8/8/1996 FAL 1, 2, 3, 4 GrabLMZ MD-North District 8/14/1996 FAL 1, 2, 3, 4 GrabLMZ MD-North District 9/5/1996 FAL 1, 2, 3, 4 GrabLMZ MD-North District 9/11/1996 FAL 1, 2, 3, 4 GrabLMZ MD-North District 9/19/1996 FAL 1, 2, 3, 4 GrabLMZ MD-North District 10/2/1996 FAL 1, 2, 3, 4 GrabLMZ MD-North District 10/7/1996 FAL 1, 2, 3, 4 GrabLMZ MD-North District 10/16/1996 FAL 1, 2, 3, 4 GrabLMZ MD-North District 10/21/1996 FAL 1, 2, 3, 4 GrabLMZ MD-North District FAL 1, 2, 3, 4 GrabLMZ MD-North District 1/8/1997 FAL 1, 2, 3, 4 GrabLMZ MD-North District 1/13/1997 FAL 1, 2, 3, 4 GrabLMZ MD-North District 1/27/1997 FAL 1, 2, 3, 4 GrabLMZ MD-North District 2/3/1997 FAL 1, 2, 3, 4 GrabLMZ MD-North District 2/10/1997 FAL 1, 2, 3, 4 GrabLMZ MD-North District 2/24/1997 FAL 1, 2, 3, 4 GrabLMZ MD-North District 3/3/1997 FAL 1, 2, 3, 4 Grab
FPL-012-187
LMZ MD-North District 3/17/1997 FAL 1, 2, 3, 4 GrabLMZ MD-North District 3/31/1997 FAL 1, 2, 3, 4 GrabLMZ MD-North District 4/7/1997 FAL 1, 2, 3, 4 GrabLMZ MD-North District 4/15/1997 FAL 1, 2, 3, 4 GrabLMZ MD-North District 4/22/1997 FAL 1, 2, 3, 4 GrabLMZ MD-North District 4/29/1997 FAL 1, 2, 3, 4 GrabLMZ MD-North District 5/6/1997 FAL 1, 2, 3, 4 GrabLMZ MD-North District 5/12/1997 FAL 1, 2, 3, 4 GrabLMZ MD-North District 5/19/1997 FAL 1, 2, 3, 4 GrabLMZ MD-North District 5/27/1997 FAL 1, 2, 3, 4 GrabLMZ MD-North District 6/3/1997 FAL 1, 2, 3, 4 GrabLMZ MD-North District 6/9/1997 FAL 1, 2, 3, 4 GrabLMZ MD-North District 6/16/1997 FAL 1, 2, 3, 4 GrabLMZ MD-North District 6/23/1997 FAL 1, 2, 3, 4 GrabLMZ MD-North District 6/30/1997 FAL 1, 2, 3, 4 GrabLMZ MD-North District 7/9/1997 FAL 1, 2, 3, 4 GrabLMZ MD-North District 7/15/1997 FAL 1, 2, 3, 4 GrabLMZ MD-North District 7/22/1997 FAL 1, 2, 3, 4 GrabLMZ MD-North District 7/29/1997 FAL 1, 2, 3, 4 GrabLMZ MD-North District 8/4/1997 FAL 1, 2, 3, 4 GrabLMZ MD-North District 8/11/1997 FAL 1, 2, 3, 4 GrabLMZ MD-North District 8/18/1997 FAL 1, 2, 3, 4 GrabLMZ MD-North District 8/25/1997 FAL 1, 2, 3, 4 GrabLMZ MD-North District 9/2/1997 FAL 1, 2, 3, 4 GrabLMZ MD-North District 9/8/1997 FAL 1, 2, 3, 4 GrabLMZ MD-North District 9/15/1997 FAL 1, 2, 3, 4 GrabLMZ MD-North District 9/22/1997 FAL 1, 2, 3, 4 GrabLMZ MD-North District 9/29/1997 FAL 1, 2, 3, 4 GrabLMZ MD-North District 10/6/1997 FAL 1, 2, 3, 4 GrabLMZ MD-North District 10/13/1997 FAL 1, 2, 3, 4 GrabLMZ MD-North District 10/21/1997 FAL 1, 2, 3, 4 GrabLMZ MD-North District 10/28/1997 FAL 1, 2, 3, 4 GrabSampling Origin Sampling Facility Sampling Date Sample Description Sampling TypeLMZ MD-North District 11/5/1997 FAL 1, 2, 3, 4 GrabLMZ MD-North District 11/10/1997 FAL 1, 2, 3, 4 GrabLMZ MD-North District 11/17/1997 FAL 1, 2, 3, 4 GrabLMZ MD-North District 11/24/1997 FAL 1, 2, 3, 4 GrabLMZ MD-North District 12/1/1997 FAL 1, 2, 3, 4 GrabLMZ MD-North District 12/8/1997 FAL 1, 2, 3, 4 GrabLMZ MD-North District 12/15/1997 FAL 1, 2, 3, 4 GrabLMZ MD-North District 12/23/1997 FAL 1, 2, 3, 4 GrabLMZ MD-North District 1/6/1998 FAL 1, 2, 3, 4 GrabLMZ MD-North District 1/13/1998 FAL 1, 2, 3, 4 GrabLMZ MD-North District 1/20/1998 FAL 1, 2, 3, 4 GrabLMZ MD-North District 1/28/1998 FAL 1, 2, 3, 4 GrabLMZ MD-North District 2/2/1998 FAL 1, 2, 3, 4 GrabLMZ MD-North District 2/9/1998 FAL 1, 2, 3, 4 GrabLMZ MD-North District 2/17/1998 FAL 1, 2, 3, 4 GrabLMZ MD-North District 2/24/1998 FAL 1, 2, 3, 4 GrabLMZ MD-North District 3/2/1998 FAL 1, 2, 3, 4 GrabLMZ MD-North District 3/9/1998 FAL 1, 2, 3, 4 GrabLMZ MD-North District 3/16/1998 FAL 1, 2, 3, 4 GrabLMZ MD-North District 3/23/1998 FAL 1, 2, 3, 4 GrabLMZ MD-North District 4/8/1998 FAL 1, 2, 3, 4 GrabLMZ MD-North District 4/14/1998 FAL 1, 2, 3, 4 GrabLMZ MD-North District 4/22/1998 FAL 1, 2, 3, 4 GrabLMZ MD-North District 4/27/1998 FAL 1, 2, 3, 4 GrabLMZ MD-North District 5/4/1998 FAL 1, 2, 3, 4 GrabLMZ MD-North District 5/13/1998 FAL 1, 2, 3, 4 GrabLMZ MD-North District 5/18/1998 FAL 1, 2, 3, 4 GrabLMZ MD-North District 5/27/1998 FAL 1, 2, 3, 4 GrabLMZ MD-North District 6/1/1998 FAL 1, 2, 3, 4 GrabLMZ MD-North District 6/9/1998 FAL 1, 2, 3, 4 GrabLMZ MD-North District 6/15/1998 FAL 1, 2, 3, 4 GrabLMZ MD-North District 6/22/1998 FAL 1, 2, 3, 4 GrabLMZ MD-North District 6/29/1998 FAL 1, 2, 3, 4 GrabLMZ MD-North District 7/5/1998 FAL 1, 2, 3, 4 GrabLMZ MD-North District 7/10/1998 FAL 1, 2, 3, 4 GrabLMZ MD-North District 7/20/1998 FAL 1, 2, 3, 4 GrabLMZ MD-North District 7/27/1998 FAL 1, 2, 3, 4 GrabLMZ MD-North District 8/10/1998 FAL 1, 2, 3, 4 GrabLMZ MD-North District 8/17/1998 FAL 1, 2, 3, 4 Grab
FPL-012-188
LMZ MD-North District 8/25/1998 FAL 1, 2, 3, 4 GrabLMZ MD-North District 8/31/1998 FAL 1, 2, 3, 4 GrabLMZ MD-North District 9/9/1998 FAL 1, 2, 3, 4 GrabLMZ MD-North District 9/14/1998 FAL 1, 2, 3, 4 GrabLMZ MD-North District 9/23/1998 FAL 1, 2, 3, 4 GrabLMZ MD-North District 9/28/1998 FAL 1, 2, 3, 4 GrabLMZ MD-North District 10/5/1998 FAL 1, 2, 3, 4 GrabLMZ MD-North District 10/13/1998 FAL 1, 2, 3, 4 GrabLMZ MD-North District 10/19/1998 FAL 1, 2, 3, 4 GrabLMZ MD-North District 10/30/1998 FAL 1, 2, 3, 4 GrabLMZ MD-North District 11/2/1998 FAL 1, 2, 3, 4 GrabLMZ MD-North District 11/4/1998 FAL 1, 2, 3, 4 GrabLMZ MD-North District 11/9/1998 FAL 1, 2, 3, 4 GrabLMZ MD-North District 11/18/1998 FAL 1, 2, 3, 4 GrabLMZ MD-North District 11/23/1998 FAL 1, 2, 3, 4 GrabLMZ MD-North District 12/9/1998 FAL 1, 2, 3, 4 GrabLMZ MD-North District 12/22/1998 FAL 1, 2, 3, 4 GrabLMZ MD-North District 12/28/1998 FAL 1, 2, 3, 4 GrabLMZ MD-North District 1/5/1999 FAL 1, 2, 3, 4 GrabLMZ MD-North District 1/20/1999 FAL 1, 2, 3, 4 GrabLMZ MD-North District 1/25/1999 FAL 1, 2, 3, 4 GrabLMZ MD-North District 2/8/1999 FAL 1, 2, 3, 4 GrabLMZ MD-North District 2/16/1999 FAL 1, 2, 3, 4 GrabLMZ MD-North District 2/27/1999 FAL 1, 2, 3, 4 GrabLMZ MD-North District 3/1/1999 FAL 1, 2, 3, 4 GrabLMZ MD-North District 3/8/1999 FAL 1, 2, 3, 4 GrabLMZ MD-North District 3/15/1999 FAL 1, 2, 3, 4 GrabLMZ MD-North District 3/22/1999 FAL 1, 2, 3, 4 GrabSampling Origin Sampling Facility Sampling Date Sample Description Sampling TypeLMZ MD-North District 3/29/1999 FAL 1, 2, 3, 4 GrabLMZ MD-North District 4/7/1999 FAL 1, 2, 3, 4 GrabLMZ MD-North District 4/12/1999 FAL 1, 2, 3, 4 GrabLMZ MD-North District 4/19/1999 FAL 1, 2, 3, 4 GrabLMZ MD-North District 4/29/1999 FAL 1, 2, 3, 4 GrabLMZ MD-North District 5/4/1999 FAL 1, 2, 3, 4 GrabLMZ MD-North District 5/10/1999 FAL 1, 2, 3, 4 GrabLMZ MD-North District 5/17/1999 FAL 1, 2, 3, 4 GrabLMZ MD-North District 5/24/1999 FAL 1, 2, 3, 4 GrabLMZ MD-North District 6/2/1999 FAL 1, 2, 3, 4 GrabLMZ MD-North District 6/7/1999 FAL 1, 2, 3, 4 GrabLMZ MD-North District 6/14/1999 FAL 1, 2, 3, 4 GrabLMZ MD-North District 6/30/1999 FAL 1, 2, 3, 4 GrabLMZ MD-North District 7/7/1999 FAL 1, 2, 3, 4 GrabLMZ MD-North District 7/12/1999 FAL 1, 2, 3, 4 GrabLMZ MD-North District 7/19/1999 FAL 1, 2, 3, 4 GrabLMZ MD-North District 7/26/1999 FAL 1, 2, 3, 4 GrabLMZ MD-North District 8/2/1999 FAL 1, 2, 3, 4 GrabLMZ MD-North District 8/9/1999 FAL 1, 2, 3, 4 GrabLMZ MD-North District 8/16/1999 FAL 1, 2, 3, 4 GrabLMZ MD-North District 8/23/1999 FAL 1, 2, 3, 4 GrabLMZ MD-North District 9/1/1999 FAL 1, 2, 3, 4 GrabLMZ MD-North District 9/7/1999 FAL 1, 2, 3, 4 GrabLMZ MD-North District 9/13/1999 FAL 1, 2, 3, 4 GrabLMZ MD-North District 9/20/1999 FAL 1, 2, 3, 4 GrabLMZ MD-North District 10/6/1999 FAL 1, 2, 3, 4 GrabLMZ MD-North District 10/13/1999 FAL 1, 2, 3, 4 GrabLMZ MD-North District 10/18/1999 FAL 1, 2, 3, 4 GrabLMZ MD-North District 10/25/1999 FAL 1, 2, 3, 4 GrabLMZ MD-North District 11/1/1999 FAL 1, 2, 3, 4 GrabLMZ MD-North District 11/8/1999 FAL 1, 2, 3, 4 GrabLMZ MD-North District 11/15/1999 FAL 1, 2, 3, 4 GrabLMZ MD-North District 11/22/1999 FAL 1, 2, 3, 4 GrabLMZ MD-North District 12/6/1999 FAL 1, 2, 3, 4 GrabLMZ MD-North District 12/3/1999 FAL 1, 2, 3, 4 GrabLMZ MD-North District 12/20/1999 FAL 1, 2, 3, 4 GrabLMZ MD-North District 12/27/1999 FAL 1, 2, 3, 4 GrabLMZ MD-North District 1/3/2000 FAL 1, 2, 3, 4 GrabLMZ MD-North District 1/10/2000 FAL 1, 2, 3, 4 GrabLMZ MD-North District 1/18/2000 FAL 1, 2, 3, 4 GrabLMZ MD-North District 1/24/2000 FAL 1, 2, 3, 4 GrabLMZ MD-North District 2/7/2000 FAL 1, 2, 3, 4 GrabLMZ MD-North District 2/14/2000 FAL 1, 2, 3, 4 Grab
FPL-012-189
LMZ MD-North District 2/22/2000 FAL 1, 2, 3, 4 GrabLMZ MD-North District 2/28/2000 FAL 1, 2, 3, 4 GrabLMZ MD-North District 3/6/2000 FAL 1, 2, 3, 4 GrabLMZ MD-North District 3/13/2000 FAL 1, 2, 3, 4 GrabLMZ MD-North District 3/20/2000 FAL 1, 2, 3, 4 GrabLMZ MD-North District 3/27/2000 FAL 1, 2, 3, 4 GrabLMZ MD-North District 4/4/2000 FAL 1, 2, 3, 4 GrabLMZ MD-North District 4/10/2000 FAL 1, 2, 3, 4 GrabLMZ MD-North District 4/22/2000 FAL 1, 2, 3, 4 GrabLMZ MD-North District 4/26/2000 FAL 1, 2, 3, 4 GrabLMZ MD-North District 5/1/2000 FAL 1, 2, 3, 4 GrabLMZ MD-North District 5/8/2000 FAL 1, 2, 3, 4 GrabLMZ MD-North District 5/21/2000 FAL 1, 2, 3, 4 GrabLMZ MD-North District 5/24/2000 FAL 1, 2, 3, 4 GrabLMZ MD-North District 5/31/2000 FAL 1, 2, 3, 4 GrabLMZ MD-South District 12/1/1983 FAL1,2,3,4,5,6,7,8,9,10,11,12,13,14,15,16 GrabLMZ MD-South District 3/1/1984 FAL1,2,3,4,5,6,7,8,9,10,11,12,13,14,15,16 GrabLMZ MD-South District 6/1/1984 FAL1,2,3,4,5,6,7,8,9,10,11,12,13,14,15,16 GrabLMZ MD-South District 9/1/1984 FAL1,2,3,4,5,6,7,8,9,10,11,12,13,14,15,16 GrabLMZ MD-South District 12/1/1984 FAL1,2,3,4,5,6,7,8,9,10,11,12,13,14,15,16 GrabLMZ MD-South District 3/1/1985 FAL1,2,3,4,5,6,7,8,9,10,11,12,13,14,15,16 GrabLMZ MD-South District 6/1/1985 FAL1,2,3,4,5,6,7,8,9,10,11,12,13,14,15,16 GrabLMZ MD-South District 9/1/1985 FAL1,2,3,4,5,6,7,8,9,10,11,12,13,14,15,16 GrabSampling Origin Sampling Facility Sampling Date Sample Description Sampling TypeLMZ MD-South District 12/1/1985 FAL1,2,3,4,5,6,7,8,9,10,11,12,13,14,15,16 GrabLMZ MD-South District 3/1/1986 FAL1,2,3,4,5,6,7,8,9,10,11,12,13,14,15,16 GrabLMZ MD-South District 6/1/1986 FAL1,2,3,4,5,6,7,8,9,10,11,12,13,14,15,16 GrabLMZ MD-South District 9/1/1986 FAL1,2,3,4,5,6,7,8,9,10,11,12,13,14,15,16 GrabLMZ MD-South District 12/1/1986 FAL1,2,3,4,5,6,7,8,9,10,11,12,13,14,15,16 GrabLMZ MD-South District 3/1/1987 FAL1,2,3,4,5,6,7,8,9,10,11,12,13,14,15,16 GrabLMZ MD-South District 6/1/1987 FAL1,2,3,4,5,6,7,8,9,10,11,12,13,14,15,16 GrabLMZ MD-South District 9/1/1987 FAL1,2,3,4,5,6,7,8,9,10,11,12,13,14,15,16 GrabLMZ MD-South District 12/1/1987 FAL1,2,3,4,5,6,7,8,9,10,11,12,13,14,15,16 GrabLMZ MD-South District 3/1/1988 FAL1,2,3,4,5,6,7,8,9,10,11,12,13,14,15,16 GrabLMZ MD-South District 6/1/1988 FAL1,2,3,4,5,6,7,8,9,10,11,12,13,14,15,16 GrabLMZ MD-South District 9/1/1988 FAL1,2,3,4,5,6,7,8,9,10,11,12,13,14,15,16 GrabLMZ MD-South District 12/1/1988 FAL1,2,3,4,5,6,7,8,9,10,11,12,13,14,15,16 GrabLMZ MD-South District 3/1/1989 FAL1,2,3,4,5,6,7,8,9,10,11,12,13,14,15,16 GrabLMZ MD-South District 6/1/1989 FAL1,2,3,4,5,6,7,8,9,10,11,12,13,14,15,16 GrabLMZ MD-South District 9/1/1989 FAL1,2,3,4,5,6,7,8,9,10,11,12,13,14,15,16 GrabLMZ MD-South District 10/1/1989 FAL1,2,3,4,5,6,7,8,9,10,11,12,13,14,15,16 GrabLMZ MD-South District 11/1/1989 FAL1,2,3,4,5,6,7,8,9,10,11,12,13,14,15,16 GrabLMZ MD-South District 12/1/1989 FAL1,2,3,4,5,6,7,8,9,10,11,12,13,14,15,16 GrabLMZ MD-South District 1/1/1990 FAL1,2,3,4,5,6,7,8,9,10,11,12,13,14,15,16 GrabLMZ MD-South District 3/1/1990 FAL1,2,3,4,5,6,7,8,9,10,11,12,13,14,15,16 GrabLMZ MD-South District 4/1/1990 FAL1,2,3,4,5,6,7,8,9,10,11,12,13,14,15,16 GrabLMZ MD-South District 5/1/1990 FAL1,2,3,4,5,6,7,8,9,10,11,12,13,14,15,16 GrabLMZ MD-South District 6/1/1990 FAL1,2,3,4,5,6,7,8,9,10,11,12,13,14,15,16 GrabLMZ MD-South District 8/1/1990 FAL1,2,3,4,5,6,7,8,9,10,11,12,13,14,15,16 GrabLMZ MD-South District 9/1/1990 FAL1,2,3,4,5,6,7,8,9,10,11,12,13,14,15,16 GrabLMZ MD-South District 10/1/1990 FAL1,2,3,4,5,6,7,8,9,10,11,12,13,14,15,16 GrabLMZ MD-South District 11/1/1990 FAL1,2,3,4,5,6,7,8,9,10,11,12,13,14,15,16 GrabLMZ MD-South District 1/1/1991 FAL1,2,3,4,5,6,7,8,9,10,11,12,13,14,15,16 GrabLMZ MD-South District 2/1/1991 FAL1,2,3,4,5,6,7,8,9,10,11,12,13,14,15,16 GrabLMZ MD-South District 3/1/1991 FAL1,2,3,4,5,6,7,8,9,10,11,12,13,14,15,16 GrabLMZ MD-South District 4/1/1991 FAL1,2,3,4,5,6,7,8,9,10,11,12,13,14,15,16 GrabLMZ MD-South District 5/7/1991 FAL1,2,3,4,5,6,7,8,9,10,11,12,13,14,15,16 GrabLMZ MD-South District 5/14/1991 FAL1,2,3,4,5,6,7,8,9,10,11,12,13,14,15,16 GrabLMZ MD-South District 5/21/1991 FAL1,2,3,4,5,6,7,8,9,10,11,12,13,14,15,16 GrabLMZ MD-South District 5/28/1991 FAL1,2,3,4,5,6,7,8,9,10,11,12,13,14,15,16 GrabLMZ MD-South District 6/4/1991 FAL1,2,3,4,5,6,7,8,9,10,11,12,13,14,15,16 GrabLMZ MD-South District 6/11/1991 FAL1,2,3,4,5,6,7,8,9,10,11,12,13,14,15,16 GrabLMZ MD-South District 6/18/1991 FAL1,2,3,4,5,6,7,8,9,10,11,12,13,14,15,16 GrabLMZ MD-South District 6/25/1991 FAL1,2,3,4,5,6,7,8,9,10,11,12,13,14,15,16 GrabLMZ MD-South District 7/2/1991 FAL1,2,3,4,5,6,7,8,9,10,11,12,13,14,15,16 GrabLMZ MD-South District 7/9/1991 FAL1,2,3,4,5,6,7,8,9,10,11,12,13,14,15,16 Grab
FPL-012-190
LMZ MD-South District 7/16/1991 FAL1,2,3,4,5,6,7,8,9,10,11,12,13,14,15,16 GrabLMZ MD-South District 7/23/1991 FAL1,2,3,4,5,6,7,8,9,10,11,12,13,14,15,16 GrabLMZ MD-South District 7/30/1991 FAL1,2,3,4,5,6,7,8,9,10,11,12,13,14,15,16 GrabLMZ MD-South District 8/6/1991 FAL1,2,3,4,5,6,7,8,9,10,11,12,13,14,15,16 GrabLMZ MD-South District 8/13/1991 FAL1,2,3,4,5,6,7,8,9,10,11,12,13,14,15,16 GrabLMZ MD-South District 8/20/1991 FAL1,2,3,4,5,6,7,8,9,10,11,12,13,14,15,16 GrabLMZ MD-South District 8/27/1991 FAL1,2,3,4,5,6,7,8,9,10,11,12,13,14,15,16 GrabLMZ MD-South District 9/3/1991 FAL1,2,3,4,5,6,7,8,9,10,11,12,13,14,15,16 GrabLMZ MD-South District 9/10/1991 FAL1,2,3,4,5,6,7,8,9,10,11,12,13,14,15,16 GrabLMZ MD-South District 9/17/1991 FAL1,2,3,4,5,6,7,8,9,10,11,12,13,14,15,16 GrabLMZ MD-South District 10/1/1991 FAL1,2,3,4,5,6,7,8,9,10,11,12,13,14,15,16 GrabLMZ MD-South District 10/8/1991 FAL1,2,3,4,5,6,7,8,9,10,11,12,13,14,15,16 GrabLMZ MD-South District 10/16/1991 FAL1,2,3,4,5,6,7,8,9,10,11,12,13,14,15,16 GrabLMZ MD-South District 10/22/1991 FAL1,2,3,4,5,6,7,8,9,10,11,12,13,14,15,16 GrabLMZ MD-South District 10/29/1991 FAL1,2,3,4,5,6,7,8,9,10,11,12,13,14,15,16 GrabLMZ MD-South District 11/5/1991 FAL1,2,3,4,5,6,7,8,9,10,11,12,13,14,15,16 GrabLMZ MD-South District 11/13/1991 FAL1,2,3,4,5,6,7,8,9,10,11,12,13,14,15,16 GrabSampling Origin Sampling Facility Sampling Date Sample Description Sampling TypeLMZ MD-South District 11/26/1991 FAL1,2,3,4,5,6,7,8,9,10,11,12,13,14,15,16 GrabLMZ MD-South District 12/3/1991 FAL1,2,3,4,5,6,7,8,9,10,11,12,13,14,15,16 GrabLMZ MD-South District 12/10/1991 FAL1,2,3,4,5,6,7,8,9,10,11,12,13,14,15,16 GrabLMZ MD-South District 12/17/1991 FAL1,2,3,4,5,6,7,8,9,10,11,12,13,14,15,16 GrabLMZ MD-South District 12/26/1991 FAL1,2,3,4,5,6,7,8,9,10,11,12,13,14,15,16 GrabLMZ MD-South District 1/2/1992 FAL1,2,3,4,5,6,7,8,9,10,11,12,13,14,15,16 GrabLMZ MD-South District 1/14/1992 FAL1,2,3,4,5,6,7,8,9,10,11,12,13,14,15,16 GrabLMZ MD-South District 1/21/1992 FAL1,2,3,4,5,6,7,8,9,10,11,12,13,14,15,16 GrabLMZ MD-South District 1/28/1992 FAL1,2,3,4,5,6,7,8,9,10,11,12,13,14,15,16 GrabLMZ MD-South District 2/4/1992 FAL1,2,3,4,5,6,7,8,9,10,11,12,13,14,15,16 GrabLMZ MD-South District 2/13/1992 FAL1,2,3,4,5,6,7,8,9,10,11,12,13,14,15,16 GrabLMZ MD-South District 2/18/1992 FAL1,2,3,4,5,6,7,8,9,10,11,12,13,14,15,16 GrabLMZ MD-South District 2/25/1992 FAL1,2,3,4,5,6,7,8,9,10,11,12,13,14,15,16 GrabLMZ MD-South District 3/3/1992 FAL1,2,3,4,5,6,7,8,9,10,11,12,13,14,15,16 GrabLMZ MD-South District 3/10/1992 FAL1,2,3,4,5,6,7,8,9,10,11,12,13,14,15,16 GrabLMZ MD-South District 3/17/1992 FAL1,2,3,4,5,6,7,8,9,10,11,12,13,14,15,16 GrabLMZ MD-South District 3/26/1992 FAL1,2,3,4,5,6,7,8,9,10,11,12,13,14,15,16 GrabLMZ MD-South District 3/31/1992 FAL1,2,3,4,5,6,7,8,9,10,11,12,13,14,15,16 GrabLMZ MD-South District 4/7/1992 FAL1,2,3,4,5,6,7,8,9,10,11,12,13,14,15,16 GrabLMZ MD-South District 4/14/1992 FAL1,2,3,4,5,6,7,8,9,10,11,12,13,14,15,16 GrabLMZ MD-South District 4/21/1992 FAL1,2,3,4,5,6,7,8,9,10,11,12,13,14,15,16 GrabLMZ MD-South District 4/28/1992 FAL1,2,3,4,5,6,7,8,9,10,11,12,13,14,15,16 GrabLMZ MD-South District 5/5/1992 FAL1,2,3,4,5,6,7,8,9,10,11,12,13,14,15,16 GrabLMZ MD-South District 5/12/1992 FAL1,2,3,4,5,6,7,8,9,10,11,12,13,14,15,16 GrabLMZ MD-South District 5/20/1992 FAL1,2,3,4,5,6,7,8,9,10,11,12,13,14,15,16 GrabLMZ MD-South District 5/26/1992 FAL1,2,3,4,5,6,7,8,9,10,11,12,13,14,15,16 GrabLMZ MD-South District 6/3/1992 FAL1,2,3,4,5,6,7,8,9,10,11,12,13,14,15,16 GrabLMZ MD-South District 6/9/1992 FAL1,2,3,4,5,6,7,8,9,10,11,12,13,14,15,16 GrabLMZ MD-South District 6/16/1992 FAL1,2,3,4,5,6,7,8,9,10,11,12,13,14,15,16 GrabLMZ MD-South District 6/23/1992 FAL1,2,3,4,5,6,7,8,9,10,11,12,13,14,15,16 GrabLMZ MD-South District 6/30/1992 FAL1,2,3,4,5,6,7,8,9,10,11,12,13,14,15,16 GrabLMZ MD-South District 7/7/1992 FAL1,2,3,4,5,6,7,8,9,10,11,12,13,14,15,16 GrabLMZ MD-South District 7/14/1992 FAL1,2,3,4,5,6,7,8,9,10,11,12,13,14,15,16 GrabLMZ MD-South District 7/21/1992 FAL1,2,3,4,5,6,7,8,9,10,11,12,13,14,15,16 GrabLMZ MD-South District 7/28/1992 FAL1,2,3,4,5,6,7,8,9,10,11,12,13,14,15,16 GrabLMZ MD-South District 8/4/1992 FAL1,2,3,4,5,6,7,8,9,10,11,12,13,14,15,16 GrabLMZ MD-South District 8/11/1992 FAL1,2,3,4,5,6,7,8,9,10,11,12,13,14,15,16 GrabLMZ MD-South District 8/18/1992 FAL1,2,3,4,5,6,7,8,9,10,11,12,13,14,15,16 GrabLMZ MD-South District 7/13/1993 FAL1,2,3,4,5,6,7,8,9,10,11,12,13,14,15,16 GrabLMZ MD-South District 10/13/1993 FAL1,2,3,4,5,6,7,8,9,10,11,12,13,14,15,16 GrabLMZ MD-South District 12/7/1993 FAL1,2,3,4,5,6,7,8,9,10,11,12,13,14,15,16 GrabLMZ MD-South District 12/14/1993 FAL1,2,3,4,5,6,7,8,9,10,11,12,13,14,15,16 GrabLMZ MD-South District 12/21/1993 FAL1,2,3,4,5,6,7,8,9,10,11,12,13,14,15,16 GrabLMZ MD-South District 12/28/1993 FAL1,2,3,4,5,6,7,8,9,10,11,12,13,14,15,16 GrabLMZ MD-South District 1/6/1994 FAL1,2,3,4,5,6,7,8,9,10,11,12,13,14,15,16 GrabLMZ MD-South District 1/11/1994 FAL1,2,3,4,5,6,7,8,9,10,11,12,13,14,15,16 Grab
FPL-012-191

LMZ MD-South District 1/18/1994 FAL1,2,3,4,5,6,7,8,9,10,11,12,13,14,15,16 GrabLMZ MD-South District 1/25/1994 FAL1,2,3,4,5,6,7,8,9,10,11,12,13,14,15,16 GrabLMZ MD-South District 2/2/1994 FAL1,2,3,4,5,6,7,8,9,10,11,12,13,14,15,16 GrabLMZ MD-South District 2/8/1994 FAL1,2,3,4,5,6,7,8,9,10,11,12,13,14,15,16 GrabLMZ MD-South District 2/15/1994 FAL1,2,3,4,5,6,7,8,9,10,11,12,13,14,15,16 GrabLMZ MD-South District 2/22/1994 FAL1,2,3,4,5,6,7,8,9,10,11,12,13,14,15,16 GrabLMZ MD-South District 3/1/1994 FAL1,2,3,4,5,6,7,8,9,10,11,12,13,14,15,16 GrabLMZ MD-South District 3/8/1994 FAL1,2,3,4,5,6,7,8,9,10,11,12,13,14,15,16 GrabLMZ MD-South District 3/15/1994 FAL1,2,3,4,5,6,7,8,9,10,11,12,13,14,15,16 GrabLMZ MD-South District 3/22/1994 FAL1,2,3,4,5,6,7,8,9,10,11,12,13,14,15,16 GrabLMZ MD-South District 3/29/1994 FAL1,2,3,4,5,6,7,8,9,10,11,12,13,14,15,16 GrabLMZ MD-South District 4/6/1994 FAL1,2,3,4,5,6,7,8,9,10,11,12,13,14,15,16 GrabLMZ MD-South District 4/13/1994 FAL1,2,3,4,5,6,7,8,9,10,11,12,13,14,15,16 GrabSampling Origin Sampling Facility Sampling Date Sample Description Sampling TypeLMZ MD-South District 4/19/1994 FAL1,2,3,4,5,6,7,8,9,10,11,12,13,14,15,16 GrabLMZ MD-South District 4/26/1994 FAL1,2,3,4,5,6,7,8,9,10,11,12,13,14,15,16 GrabLMZ MD-South District 5/3/1994 FAL1,2,3,4,5,6,7,8,9,10,11,12,13,14,15,16 GrabLMZ MD-South District 5/10/1994 FAL1,2,3,4,5,6,7,8,9,10,11,12,13,14,15,16 GrabLMZ MD-South District 5/17/1994 FAL1,2,3,4,5,6,7,8,9,10,11,12,13,14,15,16 GrabLMZ MD-South District 5/24/1994 FAL1,2,3,4,5,6,7,8,9,10,11,12,13,14,15,16 GrabLMZ MD-South District 5/31/1994 FAL1,2,3,4,5,6,7,8,9,10,11,12,13,14,15,16 GrabLMZ MD-South District 6/7/1994 FAL1,2,3,4,5,6,7,8,9,10,11,12,13,14,15,16 GrabLMZ MD-South District 6/14/1994 FAL1,2,3,4,5,6,7,8,9,10,11,12,13,14,15,16 GrabLMZ MD-South District 6/21/1994 FAL1,2,3,4,5,6,7,8,9,10,11,12,13,14,15,16 GrabLMZ MD-South District 6/28/1994 FAL1,2,3,4,5,6,7,8,9,10,11,12,13,14,15,16 GrabLMZ MD-South District 7/5/1994 FAL1,2,3,4,5,6,7,8,9,10,11,12,13,14,15,16 GrabLMZ MD-South District 7/12/1994 FAL1,2,3,4,5,6,7,8,9,10,11,12,13,14,15,16 GrabLMZ MD-South District 7/19/1994 FAL1,2,3,4,5,6,7,8,9,10,11,12,13,14,15,16 GrabLMZ MD-South District 7/26/1994 FAL1,2,3,4,5,6,7,8,9,10,11,12,13,14,15,16 GrabLMZ MD-South District 8/2/1994 FAL1,2,3,4,5,6,7,8,9,10,11,12,13,14,15,16 GrabLMZ MD-South District 8/9/1994 FAL1,2,3,4,5,6,7,8,9,10,11,12,13,14,15,16 GrabLMZ MD-South District 8/16/1994 FAL1,2,3,4,5,6,7,8,9,10,11,12,13,14,15,16 GrabLMZ MD-South District 8/23/1994 FAL1,2,3,4,5,6,7,8,9,10,11,12,13,14,15,16 GrabLMZ MD-South District 8/30/1994 FAL1,2,3,4,5,6,7,8,9,10,11,12,13,14,15,16 GrabLMZ MD-South District 9/6/1994 FAL1,2,3,4,5,6,7,8,9,10,11,12,13,14,15,16 GrabLMZ MD-South District 9/12/1994 FAL1,2,3,4,5,6,7,8,9,10,11,12,13,14,15,16 GrabLMZ MD-South District 9/19/1994 FAL1,2,3,4,5,6,7,8,9,10,11,12,13,14,15,16 GrabLMZ MD-South District 9/26/1994 FAL1,2,3,4,5,6,7,8,9,10,11,12,13,14,15,16 GrabLMZ MD-South District 10/3/1994 FAL1,2,3,4,5,6,7,8,9,10,11,12,13,14,15,16 GrabLMZ MD-South District 10/11/1994 FAL1,2,3,4,5,6,7,8,9,10,11,12,13,14,15,16 GrabLMZ MD-South District 10/17/1994 FAL1,2,3,4,5,6,7,8,9,10,11,12,13,14,15,16 GrabLMZ MD-South District 10/26/1994 FAL1,2,3,4,5,6,7,8,9,10,11,12,13,14,15,16 GrabLMZ MD-South District 10/31/1994 FAL1,2,3,4,5,6,7,8,9,10,11,12,13,14,15,16 GrabLMZ MD-South District 11/8/1994 FAL1,2,3,4,5,6,7,8,9,10,11,12,13,14,15,16 GrabLMZ MD-South District 11/21/1994 FAL1,2,3,4,5,6,7,8,9,10,11,12,13,14,15,16 GrabLMZ MD-South District 11/28/1994 FAL1,2,3,4,5,6,7,8,9,10,11,12,13,14,15,16 GrabLMZ MD-South District 12/6/1994 FAL1,2,3,4,5,6,7,8,9,10,11,12,13,14,15,16 GrabLMZ MD-South District 12/12/1994 FAL1,2,3,4,5,6,7,8,9,10,11,12,13,14,15,16 GrabLMZ MD-South District 12/19/1994 FAL1,2,3,4,5,6,7,8,9,10,11,12,13,14,15,16 GrabLMZ MD-South District 12/28/1994 FAL1,2,3,4,5,6,7,8,9,10,11,12,13,14,15,16 GrabLMZ MD-South District 1/4/1995 FAL1,2,3,4,5,6,7,8,9,10,11,12,13,14,15,16 GrabLMZ MD-South District 1/10/1995 FAL1,2,3,4,5,6,7,8,9,10,11,12,13,14,15,16 GrabLMZ MD-South District 1/17/1995 FAL1,2,3,4,5,6,7,8,9,10,11,12,13,14,15,16 GrabLMZ MD-South District 1/23/1995 FAL1,2,3,4,5,6,7,8,9,10,11,12,13,14,15,16 GrabLMZ MD-South District 1/31/1995 FAL1,2,3,4,5,6,7,8,9,10,11,12,13,14,15,16 GrabLMZ MD-South District 2/3/1995 FAL1,2,3,4,5,6,7,8,9,10,11,12,13,14,15,16 GrabLMZ MD-South District 2/13/1995 FAL1,2,3,4,5,6,7,8,9,10,11,12,13,14,15,16 GrabLMZ MD-South District 2/21/1995 FAL1,2,3,4,5,6,7,8,9,10,11,12,13,14,15,16 GrabLMZ MD-South District 2/28/1995 FAL1,2,3,4,5,6,7,8,9,10,11,12,13,14,15,16 GrabLMZ MD-South District 3/8/1995 FAL1,2,3,4,5,6,7,8,9,10,11,12,13,14,15,16 GrabLMZ MD-South District 3/14/1995 FAL1,2,3,4,5,6,7,8,9,10,11,12,13,14,15,16 GrabLMZ MD-South District 3/21/1995 FAL1,2,3,4,5,6,7,8,9,10,11,12,13,14,15,16 GrabLMZ MD-South District 3/28/1995 FAL1,2,3,4,5,6,7,8,9,10,11,12,13,14,15,16 GrabLMZ MD-South District 4/4/1995 FAL1,2,3,4,5,6,7,8,9,10,11,12,13,14,15,16 Grab
FPL-012-192
LMZ MD-South District 4/12/1995 FAL1,2,3,4,5,6,7,8,9,10,11,12,13,14,15,16 GrabLMZ MD-South District 4/18/1995 FAL1,2,3,4,5,6,7,8,9,10,11,12,13,14,15,16 GrabLMZ MD-South District 4/25/1995 FAL1,2,3,4,5,6,7,8,9,10,11,12,13,14,15,16 GrabLMZ MD-South District 5/2/1995 FAL1,2,3,4,5,6,7,8,9,10,11,12,13,14,15,16 GrabLMZ MD-South District 5/8/1995 FAL1,2,3,4,5,6,7,8,9,10,11,12,13,14,15,16 GrabLMZ MD-South District 5/16/1995 FAL1,2,3,4,5,6,7,8,9,10,11,12,13,14,15,16 GrabLMZ MD-South District 5/23/1995 FAL1,2,3,4,5,6,7,8,9,10,11,12,13,14,15,16 GrabLMZ MD-South District 5/31/1995 FAL1,2,3,4,5,6,7,8,9,10,11,12,13,14,15,16 GrabLMZ MD-South District 6/7/1995 FAL1,2,3,4,5,6,7,8,9,10,11,12,13,14,15,16 GrabSampling Origin Sampling Facility Sampling Date Sample Description Sampling TypeLMZ MD-South District 6/13/1995 FAL1,2,3,4,5,6,7,8,9,10,11,12,13,14,15,16 GrabLMZ MD-South District 6/20/1995 FAL1,2,3,4,5,6,7,8,9,10,11,12,13,14,15,16 GrabLMZ MD-South District 6/27/1995 FAL1,2,3,4,5,6,7,8,9,10,11,12,13,14,15,16 GrabLMZ MD-South District 7/5/1995 FAL1,2,3,4,5,6,7,8,9,10,11,12,13,14,15,16 GrabLMZ MD-South District 7/11/1995 FAL1,2,3,4,5,6,7,8,9,10,11,12,13,14,15,16 GrabLMZ MD-South District 7/18/1995 FAL1,2,3,4,5,6,7,8,9,10,11,12,13,14,15,16 GrabLMZ MD-South District 7/21/1995 FAL1,2,3,4,5,6,7,8,9,10,11,12,13,14,15,16 GrabLMZ MD-South District 8/3/1995 FAL1,2,3,4,5,6,7,8,9,10,11,12,13,14,15,16 GrabLMZ MD-South District 8/8/1995 FAL1,2,3,4,5,6,7,8,9,10,11,12,13,14,15,16 GrabLMZ MD-South District 8/15/1995 FAL1,2,3,4,5,6,7,8,9,10,11,12,13,14,15,16 GrabLMZ MD-South District 8/23/1995 FAL1,2,3,4,5,6,7,8,9,10,11,12,13,14,15,16 GrabLMZ MD-South District 8/29/1995 FAL1,2,3,4,5,6,7,8,9,10,11,12,13,14,15,16 GrabLMZ MD-South District 9/5/1995 FAL1,2,3,4,5,6,7,8,9,10,11,12,13,14,15,16 GrabLMZ MD-South District 9/12/1995 FAL1,2,3,4,5,6,7,8,9,10,11,12,13,14,15,16 GrabLMZ MD-South District 9/19/1995 FAL1,2,3,4,5,6,7,8,9,10,11,12,13,14,15,16 GrabLMZ MD-South District 9/28/1995 FAL1,2,3,4,5,6,7,8,9,10,11,12,13,14,15,16 GrabLMZ MD-South District 10/3/1995 FAL1,2,3,4,5,6,7,8,9,10,11,12,13,14,15,16 GrabLMZ MD-South District 10/11/1995 FAL1,2,3,4,5,6,7,8,9,10,11,12,13,14,15,16 GrabLMZ MD-South District 10/17/1995 FAL1,2,3,4,5,6,7,8,9,10,11,12,13,14,15,16 GrabLMZ MD-South District 10/24/1995 FAL1,2,3,4,5,6,7,8,9,10,11,12,13,14,15,16 GrabLMZ MD-South District 10/31/1995 FAL1,2,3,4,5,6,7,8,9,10,11,12,13,14,15,16 GrabLMZ MD-South District 11/7/1995 FAL1,2,3,4,5,6,7,8,9,10,11,12,13,14,15,16 GrabLMZ MD-South District 11/14/1995 FAL1,2,3,4,5,6,7,8,9,10,11,12,13,14,15,16 GrabLMZ MD-South District 11/21/1995 FAL1,2,3,4,5,6,7,8,9,10,11,12,13,14,15,16 GrabLMZ MD-South District 11/28/1995 FAL1,2,3,4,5,6,7,8,9,10,11,12,13,14,15,16 GrabLMZ MD-South District 12/5/1995 FAL1,2,3,4,5,6,7,8,9,10,11,12,13,14,15,16 GrabLMZ MD-South District 12/12/1995 FAL1,2,3,4,5,6,7,8,9,10,11,12,13,14,15,16 GrabLMZ MD-South District 12/19/1995 FAL1,2,3,4,5,6,7,8,9,10,11,12,13,14,15,16 GrabLMZ MD-South District 12/29/1995 FAL1,2,3,4,5,6,7,8,9,10,11,12,13,14,15,16 GrabLMZ MD-South District 1/4/1996 FAL1,2,3,4,5,6,7,8,9,10,11,12,13,14,15,16 GrabLMZ MD-South District 1/11/1996 FAL1,2,3,4,5,6,7,8,9,10,11,12,13,14,15,16 GrabLMZ MD-South District 1/19/1996 FAL1,2,3,4,5,6,7,8,9,10,11,12,13,14,15,16 GrabLMZ MD-South District 1/25/1996 FAL1,2,3,4,5,6,7,8,9,10,11,12,13,14,15,16 GrabLMZ MD-South District 2/1/1996 FAL1,2,3,4,5,6,7,8,9,10,11,12,13,14,15,16 GrabLMZ MD-South District 2/7/1996 FAL1,2,3,4,5,6,7,8,9,10,11,12,13,14,15,16 GrabLMZ MD-South District 2/13/1996 FAL1,2,3,4,5,6,7,8,9,10,11,12,13,14,15,16 GrabLMZ MD-South District 2/21/1996 FAL1,2,3,4,5,6,7,8,9,10,11,12,13,14,15,16 GrabLMZ MD-South District 2/27/1996 FAL1,2,3,4,5,6,7,8,9,10,11,12,13,14,15,16 GrabLMZ MD-South District 3/5/1996 FAL1,2,3,4,5,6,7,8,9,10,11,12,13,14,15,16 GrabLMZ MD-South District 3/12/1996 FAL1,2,3,4,5,6,7,8,9,10,11,12,13,14,15,16 GrabLMZ MD-South District 3/20/1996 FAL1,2,3,4,5,6,7,8,9,10,11,12,13,14,15,16 GrabLMZ MD-South District 3/26/1996 FAL1,2,3,4,5,6,7,8,9,10,11,12,13,14,15,16 GrabLMZ MD-South District 4/2/1996 FAL1,2,3,4,5,6,7,8,9,10,11,12,13,14,15,16 GrabLMZ MD-South District 4/9/1996 FAL1,2,3,4,5,6,7,8,9,10,11,12,13,14,15,16 GrabLMZ MD-South District 4/17/1996 FAL1,2,3,4,5,6,7,8,9,10,11,12,13,14,15,16 GrabLMZ MD-South District 4/23/1996 FAL1,2,3,4,5,6,7,8,9,10,11,12,13,14,15,16 GrabLMZ MD-South District 4/30/1996 FAL1,2,3,4,5,6,7,8,9,10,11,12,13,14,15,16 GrabLMZ MD-South District 5/7/1996 FAL1,2,3,4,5,6,7,8,9,10,11,12,13,14,15,16 GrabLMZ MD-South District 5/14/1996 FAL1,2,3,4,5,6,7,8,9,10,11,12,13,14,15,16 GrabLMZ MD-South District 5/21/1996 FAL1,2,3,4,5,6,7,8,9,10,11,12,13,14,15,16 GrabLMZ MD-South District 5/28/1996 FAL1,2,3,4,5,6,7,8,9,10,11,12,13,14,15,16 GrabLMZ MD-South District 6/4/1996 FAL1,2,3,4,5,6,7,8,9,10,11,12,13,14,15,16 GrabLMZ MD-South District 6/11/1996 FAL1,2,3,4,5,6,7,8,9,10,11,12,13,14,15,16 GrabLMZ MD-South District 6/18/1996 FAL1,2,3,4,5,6,7,8,9,10,11,12,13,14,15,16 Grab
FPL-012-193
LMZ MD-South District 6/25/1996 FAL1,2,3,4,5,6,7,8,9,10,11,12,13,14,15,16 GrabLMZ MD-South District 7/2/1996 FAL1,2,3,4,5,6,7,8,9,10,11,12,13,14,15,16 GrabLMZ MD-South District 7/9/1996 FAL1,2,3,4,5,6,7,8,9,10,11,12,13,14,15,16 GrabLMZ MD-South District 7/16/1996 FAL1,2,3,4,5,6,7,8,9,10,11,12,13,14,15,16 GrabLMZ MD-South District 7/25/1996 FAL1,2,3,4,5,6,7,8,9,10,11,12,13,14,15,16 GrabSampling Origin Sampling Facility Sampling Date Sample Description Sampling TypeLMZ MD-South District 8/1/1996 FAL1,2,3,4,5,6,7,8,9,10,11,12,13,14,15,16 GrabLMZ MD-South District 8/6/1996 FAL1,2,3,4,5,6,7,8,9,10,11,12,13,14,15,16 GrabLMZ MD-South District 8/14/1996 FAL1,2,3,4,5,6,7,8,9,10,11,12,13,14,15,16 GrabLMZ MD-South District 8/21/1996 FAL1,2,3,4,5,6,7,8,9,10,11,12,13,14,15,16 GrabLMZ MD-South District 8/27/1996 FAL1,2,3,4,5,6,7,8,9,10,11,12,13,14,15,16 GrabLMZ MD-South District 9/4/1996 FAL1,2,3,4,5,6,7,8,9,10,11,12,13,14,15,16 GrabLMZ MD-South District 9/10/1996 FAL1,2,3,4,5,6,7,8,9,10,11,12,13,14,15,16 GrabLMZ MD-South District 9/17/1996 FAL1,2,3,4,5,6,7,8,9,10,11,12,13,14,15,16 GrabLMZ MD-South District 9/24/1996 FAL1,2,3,4,5,6,7,8,9,10,11,12,13,14,15,16 GrabLMZ MD-South District 10/1/1996 FAL1,2,3,4,5,6,7,8,9,10,11,12,13,14,15,16 GrabLMZ MD-South District 10/8/1996 FAL1,2,3,4,5,6,7,8,9,10,11,12,13,14,15,16 GrabLMZ MD-South District 10/16/1996 FAL1,2,3,4,5,6,7,8,9,10,11,12,13,14,15,16 GrabLMZ MD-South District 10/22/1996 FAL1,2,3,4,5,6,7,8,9,10,11,12,13,14,15,16 GrabLMZ MD-South District 10/29/1996 FAL1,2,3,4,5,6,7,8,9,10,11,12,13,14,15,16 GrabLMZ MD-South District 11/5/1996 FAL1,2,3,4,5,6,7,8,9,10,11,12,13,14,15,16 GrabLMZ MD-South District 11/12/1996 FAL1,2,3,4,5,6,7,8,9,10,11,12,13,14,15,16 GrabLMZ MD-South District 11/19/1996 FAL1,2,3,4,5,6,7,8,9,10,11,12,13,14,15,16 GrabLMZ MD-South District 11/26/1996 FAL1,2,3,4,5,6,7,8,9,10,11,12,13,14,15,16 GrabLMZ MD-South District 12/3/1996 FAL1,2,3,4,5,6,7,8,9,10,11,12,13,14,15,16 GrabLMZ MD-South District 12/10/1996 FAL1,2,3,4,5,6,7,8,9,10,11,12,13,14,15,16 GrabLMZ MD-South District 12/17/1996 FAL1,2,3,4,5,6,7,8,9,10,11,12,13,14,15,16 GrabLMZ MD-South District 12/24/1996 FAL1,2,3,4,5,6,7,8,9,10,11,12,13,14,15,16 GrabLMZ MD-South District 12/31/1996 FAL1,2,3,4,5,6,7,8,9,10,11,12,13,14,15,16 GrabLMZ MD-South District 1/7/1997 FAL1,2,3,4,5,6,7,8,9,10,11,12,13,14,15,16 GrabLMZ MD-South District 1/14/1997 FAL1,2,3,4,5,6,7,8,9,10,11,12,13,14,15,16 GrabLMZ MD-South District 1/21/1997 FAL1,2,3,4,5,6,7,8,9,10,11,12,13,14,15,16 GrabLMZ MD-South District 1/28/1997 FAL1,2,3,4,5,6,7,8,9,10,11,12,13,14,15,16 GrabLMZ MD-South District 2/4/1997 FAL1,2,3,4,5,6,7,8,9,10,11,12,13,14,15,16 GrabLMZ MD-South District 2/11/1997 FAL1,2,3,4,5,6,7,8,9,10,11,12,13,14,15,16 GrabLMZ MD-South District 2/18/1997 FAL1,2,3,4,5,6,7,8,9,10,11,12,13,14,15,16 GrabLMZ MD-South District 2/25/1997 FAL1,2,3,4,5,6,7,8,9,10,11,12,13,14,15,16 GrabLMZ MD-South District 3/4/1997 FAL1,2,3,4,5,6,7,8,9,10,11,12,13,14,15,16 GrabLMZ MD-South District 3/11/1997 FAL1,2,3,4,5,6,7,8,9,10,11,12,13,14,15,16 GrabLMZ MD-South District 3/18/1997 FAL1,2,3,4,5,6,7,8,9,10,11,12,13,14,15,16 GrabLMZ MD-South District 3/25/1997 FAL1,2,3,4,5,6,7,8,9,10,11,12,13,14,15,16 GrabLMZ MD-South District 4/2/1997 FAL1,2,3,4,5,6,7,8,9,10,11,12,13,14,15,16 GrabLMZ MD-South District 4/8/1997 FAL1,2,3,4,5,6,7,8,9,10,11,12,13,14,15,16 GrabLMZ MD-South District 4/15/1997 FAL1,2,3,4,5,6,7,8,9,10,11,12,13,14,15,16 GrabLMZ MD-South District 4/22/1997 FAL1,2,3,4,5,6,7,8,9,10,11,12,13,14,15,16 GrabLMZ MD-South District 4/29/1997 FAL1,2,3,4,5,6,7,8,9,10,11,12,13,14,15,16 GrabLMZ MD-South District 5/6/1997 FAL1,2,3,4,5,6,7,8,9,10,11,12,13,14,15,16 GrabLMZ MD-South District 5/13/1997 FAL1,2,3,4,5,6,7,8,9,10,11,12,13,14,15,16 GrabLMZ MD-South District 5/20/1997 FAL1,2,3,4,5,6,7,8,9,10,11,12,13,14,15,16 GrabLMZ MD-South District 5/27/1997 FAL1,2,3,4,5,6,7,8,9,10,11,12,13,14,15,16 GrabLMZ MD-South District 6/3/1997 FAL1,2,3,4,5,6,7,8,9,10,11,12,13,14,15,16 GrabLMZ MD-South District 6/10/1997 FAL1,2,3,4,5,6,7,8,9,10,11,12,13,14,15,16 GrabLMZ MD-South District 6/17/1997 FAL1,2,3,4,5,6,7,8,9,10,11,12,13,14,15,16 GrabLMZ MD-South District 6/24/1997 FAL1,2,3,4,5,6,7,8,9,10,11,12,13,14,15,16 GrabLMZ MD-South District 7/1/1997 FAL1,2,3,4,5,6,7,8,9,10,11,12,13,14,15,16 GrabLMZ MD-South District 7/8/1997 FAL1,2,3,4,5,6,7,8,9,10,11,12,13,14,15,16 GrabLMZ MD-South District 7/15/1997 FAL1,2,3,4,5,6,7,8,9,10,11,12,13,14,15,16 GrabLMZ MD-South District 7/22/1997 FAL1,2,3,4,5,6,7,8,9,10,11,12,13,14,15,16 GrabLMZ MD-South District 7/29/1997 FAL1,2,3,4,5,6,7,8,9,10,11,12,13,14,15,16 GrabLMZ MD-South District 8/5/1997 FAL1,2,3,4,5,6,7,8,9,10,11,12,13,14,15,16 GrabLMZ MD-South District 8/12/1997 FAL1,2,3,4,5,6,7,8,9,10,11,12,13,14,15,16 GrabLMZ MD-South District 8/19/1997 FAL1,2,3,4,5,6,7,8,9,10,11,12,13,14,15,16 GrabLMZ MD-South District 8/26/1997 FAL1,2,3,4,5,6,7,8,9,10,11,12,13,14,15,16 GrabLMZ MD-South District 9/2/1997 FAL1,2,3,4,5,6,7,8,9,10,11,12,13,14,15,16 Grab
FPL-012-194

LMZ MD-South District 9/10/1997 FAL1,2,3,4,5,6,7,8,9,10,11,12,13,14,15,16 GrabSampling Origin Sampling Facility Sampling Date Sample Description Sampling TypeLMZ MD-South District 9/16/1997 FAL1,2,3,4,5,6,7,8,9,10,11,12,13,14,15,16 GrabLMZ MD-South District 9/25/1997 FAL1,2,3,4,5,6,7,8,9,10,11,12,13,14,15,16 GrabLMZ MD-South District 10/1/1997 FAL1,2,3,4,5,6,7,8,9,10,11,12,13,14,15,16 GrabLMZ MD-South District 10/7/1997 FAL1,2,3,4,5,6,7,8,9,10,11,12,13,14,15,16 GrabLMZ MD-South District 10/14/1997 FAL1,2,3,4,5,6,7,8,9,10,11,12,13,14,15,16 GrabLMZ MD-South District 10/22/1997 FAL1,2,3,4,5,6,7,8,9,10,11,12,13,14,15,16 GrabLMZ MD-South District 10/28/1997 FAL1,2,3,4,5,6,7,8,9,10,11,12,13,14,15,16 GrabLMZ MD-South District 11/4/1997 FAL1,2,3,4,5,6,7,8,9,10,11,12,13,14,15,16 GrabLMZ MD-South District 11/11/1997 FAL1,2,3,4,5,6,7,8,9,10,11,12,13,14,15,16 GrabLMZ MD-South District 11/18/1997 FAL1,2,3,4,5,6,7,8,9,10,11,12,13,14,15,16 GrabLMZ MD-South District 11/25/1997 FAL1,2,3,4,5,6,7,8,9,10,11,12,13,14,15,16 GrabLMZ MD-South District 12/2/1997 FAL1,2,3,4,5,6,7,8,9,10,11,12,13,14,15,16 GrabLMZ MD-South District 12/9/1997 FAL1,2,3,4,5,6,7,8,9,10,11,12,13,14,15,16 GrabLMZ MD-South District 12/16/1997 FAL1,2,3,4,5,6,7,8,9,10,11,12,13,14,15,16 GrabLMZ MD-South District 12/23/1997 FAL1,2,3,4,5,6,7,8,9,10,11,12,13,14,15,16 GrabLMZ MD-South District 12/30/1997 FAL1,2,3,4,5,6,7,8,9,10,11,12,13,14,15,16 GrabLMZ MD-South District 1/6/1998 FAL1,2,3,4,5,6,7,8,9,10,11,12,13,14,15,16 GrabLMZ MD-South District 1/13/1998 FAL1,2,3,4,5,6,7,8,9,10,11,12,13,14,15,16 GrabLMZ MD-South District 1/20/1998 FAL1,2,3,4,5,6,7,8,9,10,11,12,13,14,15,16 GrabLMZ MD-South District 1/27/1998 FAL1,2,3,4,5,6,7,8,9,10,11,12,13,14,15,16 GrabLMZ MD-South District 2/3/1998 FAL1,2,3,4,5,6,7,8,9,10,11,12,13,14,15,16 GrabLMZ MD-South District 2/10/1998 FAL1,2,3,4,5,6,7,8,9,10,11,12,13,14,15,16 GrabLMZ MD-South District 2/17/1998 FAL1,2,3,4,5,6,7,8,9,10,11,12,13,14,15,16 GrabLMZ MD-South District 2/24/1998 FAL1,2,3,4,5,6,7,8,9,10,11,12,13,14,15,16 GrabLMZ MD-South District 3/3/1998 FAL1,2,3,4,5,6,7,8,9,10,11,12,13,14,15,16 GrabLMZ MD-South District 3/10/1998 FAL1,2,3,4,5,6,7,8,9,10,11,12,13,14,15,16 GrabLMZ MD-South District 3/17/1998 FAL1,2,3,4,5,6,7,8,9,10,11,12,13,14,15,16 GrabLMZ MD-South District 3/24/1998 FAL1,2,3,4,5,6,7,8,9,10,11,12,13,14,15,16 GrabLMZ MD-South District 3/31/1998 FAL1,2,3,4,5,6,7,8,9,10,11,12,13,14,15,16 GrabLMZ MD-South District 4/7/1998 FAL1,2,3,4,5,6,7,8,9,10,11,12,13,14,15,16 GrabLMZ MD-South District 4/14/1998 FAL1,2,3,4,5,6,7,8,9,10,11,12,13,14,15,16 GrabLMZ MD-South District 4/22/1998 FAL1,2,3,4,5,6,7,8,9,10,11,12,13,14,15,16 GrabLMZ MD-South District 4/28/1998 FAL1,2,3,4,5,6,7,8,9,10,11,12,13,14,15,16 GrabLMZ MD-South District 5/5/1998 FAL1,2,3,4,5,6,7,8,9,10,11,12,13,14,15,16 GrabLMZ MD-South District 5/13/1998 FAL1,2,3,4,5,6,7,8,9,10,11,12,13,14,15,16 GrabLMZ MD-South District 5/19/1998 FAL1,2,3,4,5,6,7,8,9,10,11,12,13,14,15,16 GrabLMZ MD-South District 6/2/1998 FAL1,2,3,4,5,6,7,8,9,10,11,12,13,14,15,16 GrabLMZ MD-South District 6/9/1998 FAL1,2,3,4,5,6,7,8,9,10,11,12,13,14,15,16 GrabLMZ MD-South District 6/16/1998 FAL1,2,3,4,5,6,7,8,9,10,11,12,13,14,15,16 GrabLMZ MD-South District 6/23/1998 FAL1,2,3,4,5,6,7,8,9,10,11,12,13,14,15,16 GrabLMZ MD-South District 7/1/1998 FAL1,2,3,4,5,6,7,8,9,10,11,12,13,14,15,16 GrabLMZ MD-South District 7/7/1998 FAL1,2,3,4,5,6,7,8,9,10,11,12,13,14,15,16 GrabLMZ MD-South District 7/14/1998 FAL1,2,3,4,5,6,7,8,9,10,11,12,13,14,15,16 GrabLMZ MD-South District 7/21/1998 FAL1,2,3,4,5,6,7,8,9,10,11,12,13,14,15,16 GrabLMZ MD-South District 7/28/1998 FAL1,2,3,4,5,6,7,8,9,10,11,12,13,14,15,16 GrabLMZ MD-South District 8/4/1998 FAL1,2,3,4,5,6,7,8,9,10,11,12,13,14,15,16 GrabLMZ MD-South District 8/11/1998 FAL1,2,3,4,5,6,7,8,9,10,11,12,13,14,15,16 GrabLMZ MD-South District 8/18/1998 FAL1,2,3,4,5,6,7,8,9,10,11,12,13,14,15,16 GrabLMZ MD-South District 8/25/1998 FAL1,2,3,4,5,6,7,8,9,10,11,12,13,14,15,16 GrabLMZ MD-South District 9/1/1998 FAL1,2,3,4,5,6,7,8,9,10,11,12,13,14,15,16 GrabLMZ MD-South District 9/8/1998 FAL1,2,3,4,5,6,7,8,9,10,11,12,13,14,15,16 GrabLMZ MD-South District 9/15/1998 FAL1,2,3,4,5,6,7,8,9,10,11,12,13,14,15,16 GrabLMZ MD-South District 9/22/1998 FAL1,2,3,4,5,6,7,8,9,10,11,12,13,14,15,16 GrabLMZ MD-South District 9/29/1998 FAL1,2,3,4,5,6,7,8,9,10,11,12,13,14,15,16 GrabLMZ MD-South District 10/6/1998 FAL1,2,3,4,5,6,7,8,9,10,11,12,13,14,15,16 GrabLMZ MD-South District 10/14/1998 FAL1,2,3,4,5,6,7,8,9,10,11,12,13,14,15,16 GrabLMZ MD-South District 10/20/1998 FAL1,2,3,4,5,6,7,8,9,10,11,12,13,14,15,16 GrabLMZ MD-South District 11/3/1998 FAL1,2,3,4,5,6,7,8,9,10,11,12,13,14,15,16 GrabLMZ MD-South District 11/12/1998 FAL1,2,3,4,5,6,7,8,9,10,11,12,13,14,15,16 GrabSampling Origin Sampling Facility Sampling Date Sample Description Sampling TypeLMZ MD-South District 11/17/1998 FAL1,2,3,4,5,6,7,8,9,10,11,12,13,14,15,16 GrabLMZ MD-South District 11/24/1998 FAL1,2,3,4,5,6,7,8,9,10,11,12,13,14,15,16 Grab
FPL-012-195

LMZ MD-South District 12/1/1998 FAL1,2,3,4,5,6,7,8,9,10,11,12,13,14,15,16 GrabLMZ MD-South District 12/9/1998 FAL1,2,3,4,5,6,7,8,9,10,11,12,13,14,15,16 GrabLMZ MD-South District 12/17/1998 FAL1,2,3,4,5,6,7,8,9,10,11,12,13,14,15,16 GrabLMZ MD-South District 12/22/1998 FAL1,2,3,4,5,6,7,8,9,10,11,12,13,14,15,16 GrabLMZ MD-South District 1/5/1999 FAL1,2,3,4,5,6,7,8,9,10,11,12,13,14,15,16 GrabLMZ MD-South District 1/12/1999 FAL1,2,3,4,5,6,7,8,9,10,11,12,13,14,15,16 GrabLMZ MD-South District 1/20/1999 FAL1,2,3,4,5,6,7,8,9,10,11,12,13,14,15,16 GrabLMZ MD-South District 1/27/1999 FAL1,2,3,4,5,6,7,8,9,10,11,12,13,14,15,16 GrabLMZ MD-South District 2/3/1999 FAL1,2,3,4,5,6,7,8,9,10,11,12,13,14,15,16 GrabLMZ MD-South District 2/10/1999 FAL1,2,3,4,5,6,7,8,9,10,11,12,13,14,15,16 GrabLMZ MD-South District 2/17/1999 FAL1,2,3,4,5,6,7,8,9,10,11,12,13,14,15,16 GrabLMZ MD-South District 2/24/1999 FAL1,2,3,4,5,6,7,8,9,10,11,12,13,14,15,16 GrabLMZ MD-South District 3/4/1999 FAL1,2,3,4,5,6,7,8,9,10,11,12,13,14,15,16 GrabLMZ MD-South District 3/10/1999 FAL1,2,3,4,5,6,7,8,9,10,11,12,13,14,15,16 GrabLMZ MD-South District 3/17/1999 FAL1,2,3,4,5,6,7,8,9,10,11,12,13,14,15,16 GrabLMZ MD-South District 3/24/1999 FAL1,2,3,4,5,6,7,8,9,10,11,12,13,14,15,16 GrabLMZ MD-South District 4/7/1999 FAL1,2,3,4,5,6,7,8,9,10,11,12,13,14,15,16 GrabLMZ MD-South District 4/14/1999 FAL1,2,3,4,5,6,7,8,9,10,11,12,13,14,15,16 GrabLMZ MD-South District 4/21/1999 FAL1,2,3,4,5,6,7,8,9,10,11,12,13,14,15,16 GrabLMZ MD-South District 4/28/1999 FAL1,2,3,4,5,6,7,8,9,10,11,12,13,14,15,16 GrabLMZ MD-South District 5/5/1999 FAL1,2,3,4,5,6,7,8,9,10,11,12,13,14,15,16 GrabLMZ MD-South District 5/12/1999 FAL1,2,3,4,5,6,7,8,9,10,11,12,13,14,15,16 GrabLMZ MD-South District 5/19/1999 FAL1,2,3,4,5,6,7,8,9,10,11,12,13,14,15,16 GrabLMZ MD-South District 5/28/1999 FAL1,2,3,4,5,6,7,8,9,10,11,12,13,14,15,16 GrabLMZ MD-South District 6/2/1999 FAL1,2,3,4,5,6,7,8,9,10,11,12,13,14,15,16 GrabLMZ MD-South District 6/9/1999 FAL1,2,3,4,5,6,7,8,9,10,11,12,13,14,15,16 GrabLMZ MD-South District 6/16/1999 FAL1,2,3,4,5,6,7,8,9,10,11,12,13,14,15,16 GrabLMZ MD-South District 6/23/1999 FAL1,2,3,4,5,6,7,8,9,10,11,12,13,14,15,16 GrabLMZ MD-South District 7/7/1999 FAL1,2,3,4,5,6,7,8,9,10,11,12,13,14,15,16 GrabLMZ MD-South District 7/14/1999 FAL1,2,3,4,5,6,7,8,9,10,11,12,13,14,15,16 GrabLMZ MD-South District 7/21/1999 FAL1,2,3,4,5,6,7,8,9,10,11,12,13,14,15,16 GrabLMZ MD-South District 7/28/1999 FAL1,2,3,4,5,6,7,8,9,10,11,12,13,14,15,16 GrabLMZ MD-South District 8/4/1999 FAL1,2,3,4,5,6,7,8,9,10,11,12,13,14,15,16 GrabLMZ MD-South District 8/9/1999 FAL1,2,3,4,5,6,7,8,9,10,11,12,13,14,15,16 GrabLMZ MD-South District 8/18/1999 FAL1,2,3,4,5,6,7,8,9,10,11,12,13,14,15,16 GrabLMZ MD-South District 8/25/1999 FAL1,2,3,4,5,6,7,8,9,10,11,12,13,14,15,16 GrabLMZ MD-South District 9/2/1999 FAL1,2,3,4,5,6,7,8,9,10,11,12,13,14,15,16 GrabLMZ MD-South District 9/8/1999 FAL1,2,3,4,5,6,7,8,9,10,11,12,13,14,15,16 GrabLMZ MD-South District 9/16/1999 FAL1,2,3,4,5,6,7,8,9,10,11,12,13,14,15,16 GrabLMZ MD-South District 9/22/1999 FAL1,2,3,4,5,6,7,8,9,10,11,12,13,14,15,16 GrabLMZ MD-South District 10/6/1999 FAL1,2,3,4,5,6,7,8,9,10,11,12,13,14,15,16 GrabLMZ MD-South District 10/13/1999 FAL1,2,3,4,5,6,7,8,9,10,11,12,13,14,15,16 GrabLMZ MD-South District 10/20/1999 FAL1,2,3,4,5,6,7,8,9,10,11,12,13,14,15,16 GrabLMZ MD-South District 11/3/1999 FAL1,2,3,4,5,6,7,8,9,10,11,12,13,14,15,16 GrabLMZ MD-South District 11/10/1999 FAL1,2,3,4,5,6,7,8,9,10,11,12,13,14,15,16 GrabLMZ MD-South District 11/23/1999 FAL1,2,3,4,5,6,7,8,9,10,11,12,13,14,15,16 GrabLMZ MD-South District 11/30/1999 FAL1,2,3,4,5,6,7,8,9,10,11,12,13,14,15,16 GrabLMZ MD-South District 12/8/1999 FAL1,2,3,4,5,6,7,8,9,10,11,12,13,14,15,16 GrabLMZ MD-South District 12/14/1999 FAL1,2,3,4,5,6,7,8,9,10,11,12,13,14,15,16 GrabLMZ MD-South District 12/22/1999 FAL1,2,3,4,5,6,7,8,9,10,11,12,13,14,15,16 GrabLMZ MD-South District 12/29/1999 FAL1,2,3,4,5,6,7,8,9,10,11,12,13,14,15,16 GrabLMZ MD-South District 1/5/2000 FAL1,2,3,4,5,6,7,8,9,10,11,12,13,14,15,16 GrabLMZ MD-South District 2/2/2000 FAL1,2,3,4,5,6,7,8,9,10,11,12,13,14,15,16 GrabLMZ MD-South District 3/8/2000 FAL1,2,3,4,5,6,7,8,9,10,11,12,13,14,15,16 GrabLMZ MD-South District 4/5/2000 FAL1,2,3,4,5,6,7,8,9,10,11,12,13,14,15,16 GrabLMZ MD-South District 5/10/2000 FAL1,2,3,4,5,6,7,8,9,10,11,12,13,14,15,16 GrabLMZ West Palm Beach 1999 Grab
FPL-012-196

88
APPENDIX G. SCHEMATIC DIAGRAMS OF TREATMENT AND DISPOSAL PROCESSES
FPL-012-197
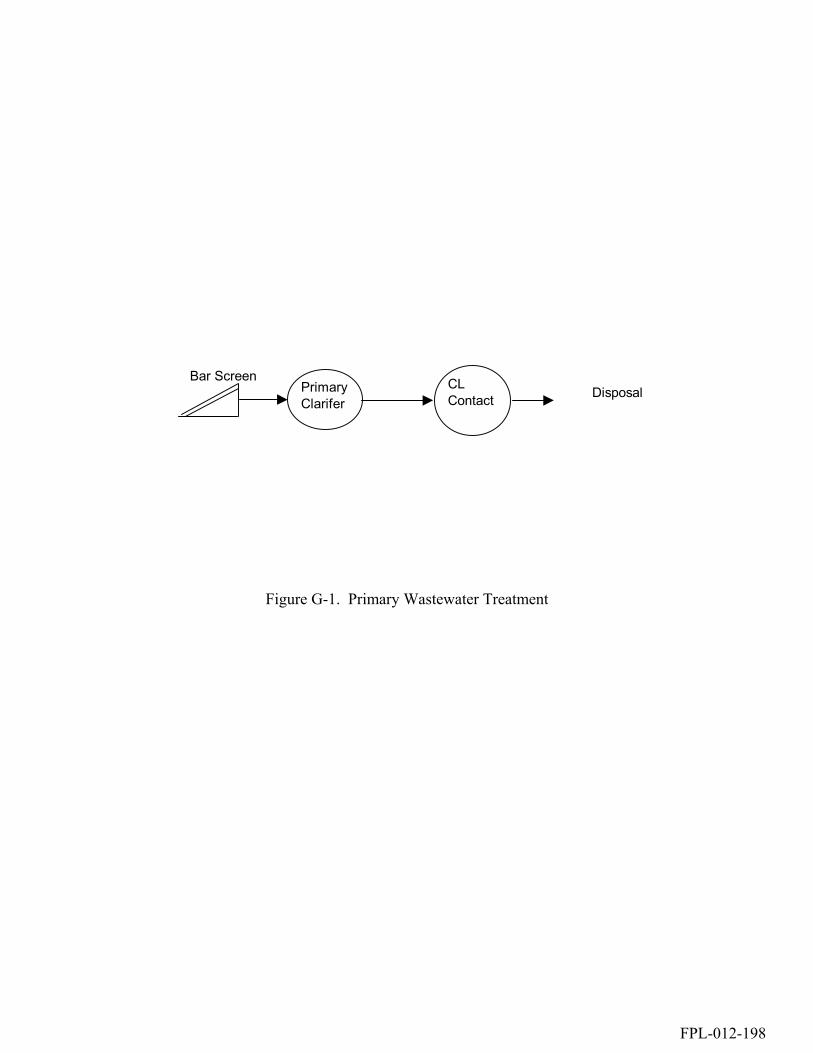
Bar ScreenDisposalPrimary
ClariferCL Contact
Figure G-1. Primary Wastewater Treatment
FPL-012-198

Bar ScreenAeration Basin
Disposal
Primary Clarifer
Second.Clarifier
CL Contact
Figure G-2. Secondary Wastewater Treatment
FPL-012-199
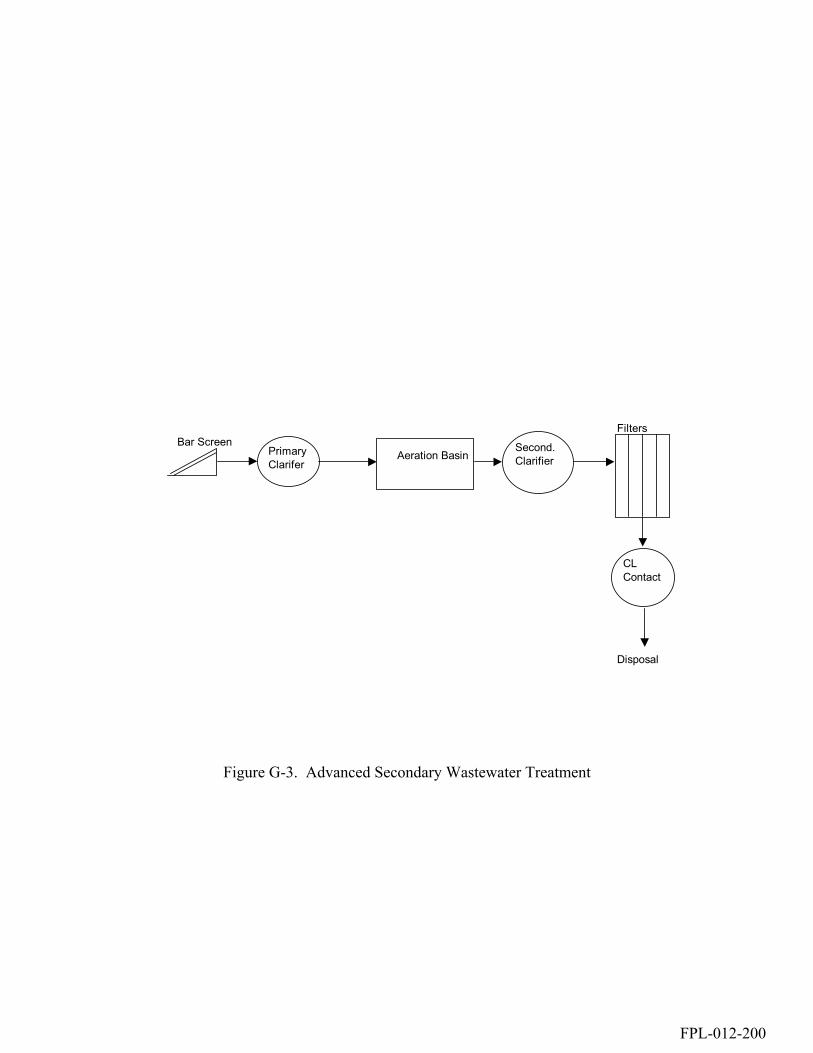
FiltersBar Screen
Aeration Basin
Disposal
Primary Clarifer
Second.Clarifier
CL Contact
Figure G-3. Advanced Secondary Wastewater Treatment
FPL-012-200

FiltersBar Screen
Aeration Basin
CL
Nitrification
Disposal
Primary Clarifer
Second.Clarifier
Denitrif.Tank
CL Contact
Figure G-4. Principal Wastewater Treatment
FPL-012-201

FiltersBar Screen
Aeration Basin
CL
Nitrification
Disposal
Primary Clarifer
Second.Clarifier
Denitrif.Tank
CL Contact
Dechlor
Figure G-5. Advanced Wastewater Treatment (AWT)
FPL-012-202
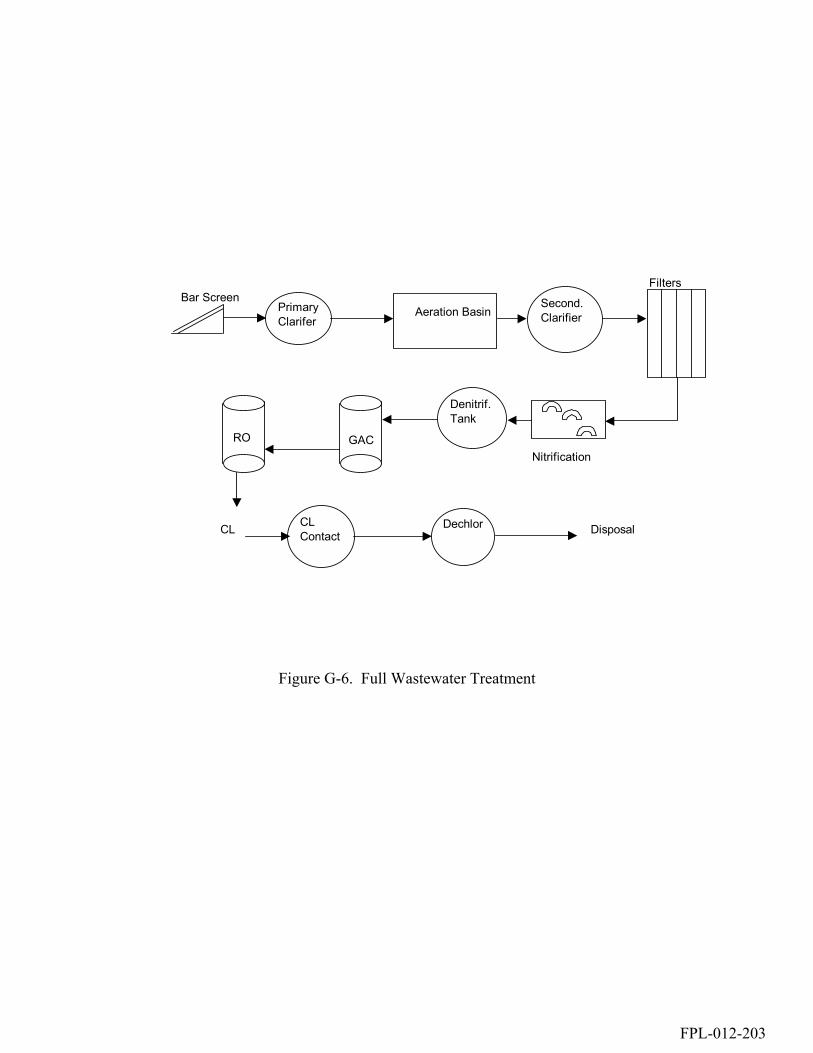
FiltersBar Screen
Aeration Basin
Nitrification
CL Disposal
Primary Clarifer
Second.Clarifier
Denitrif.Tank
CL Contact
Dechlor
GACRO
Figure G-6. Full Wastewater Treatment
FPL-012-203
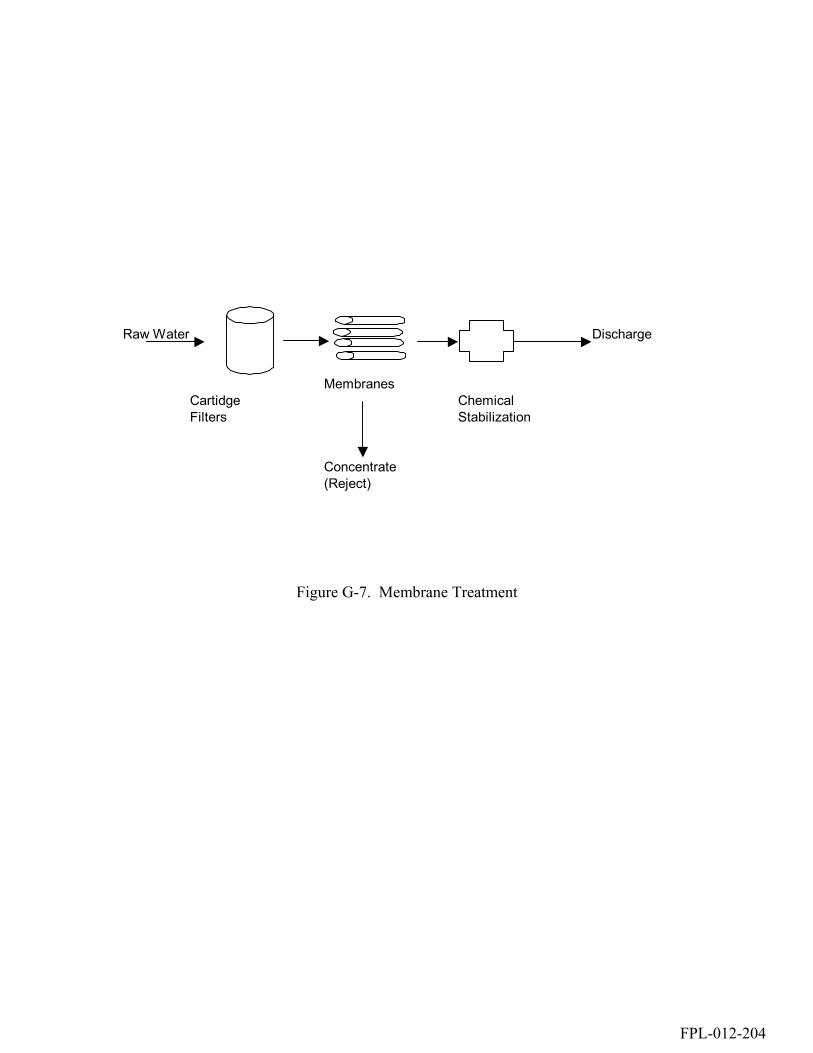
Raw Water Discharge
Membranes Cartidge ChemicalFilters Stabilization
Concentrate(Reject)
Figure G-7. Membrane Treatment
FPL-012-204
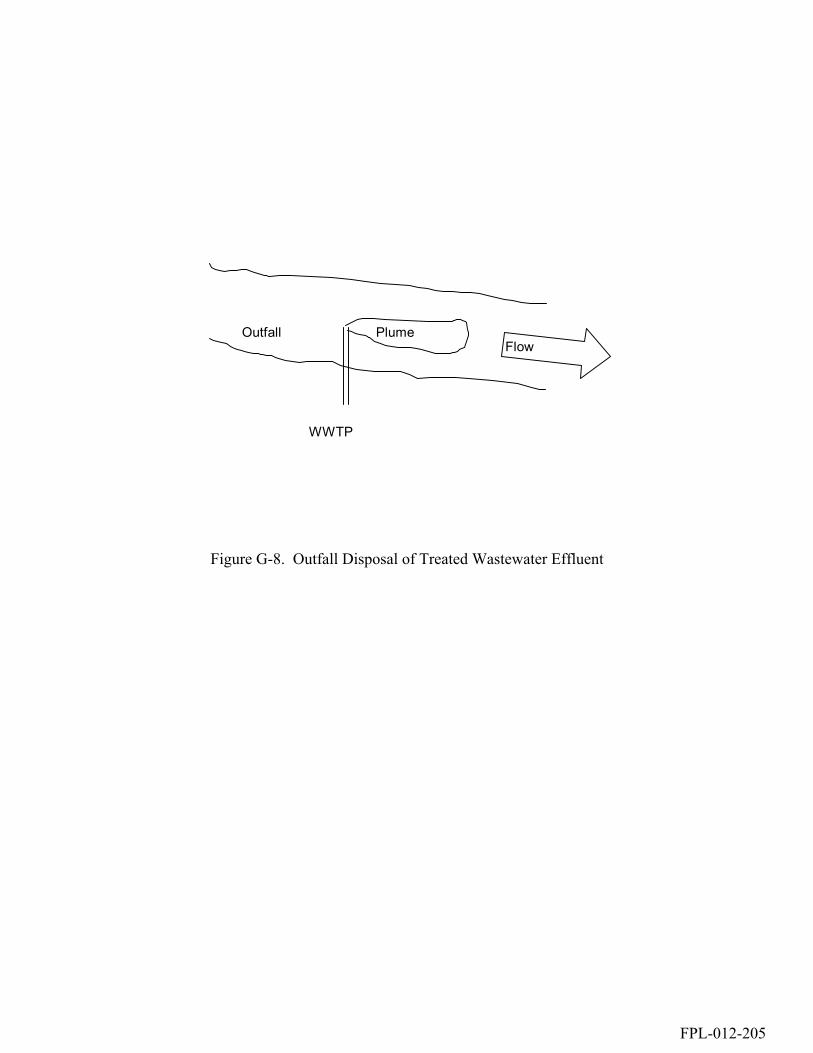
Outfall Plume
WWTP
Flow
Figure G-8. Outfall Disposal of Treated Wastewater Effluent
FPL-012-205

Ocean Surface
Plume
Outfall Pipe
Ocean Floor
Init. Dil Nearfield Dilution Farfield Dilution
Figure G-9. Open Ocean Outfall Disposal of Treated Wastewater Effluent
FPL-012-206

89
APPENDIX H. CONCEPTUAL DIAGRAM OF HYDRAULIC CONDUCTIVITIES IN THE FLORIDAN AQUIFER SYSTEM, AND GEOLOGIC DATA FOR SOUTHEAST FLORIDA
FPL-012-207
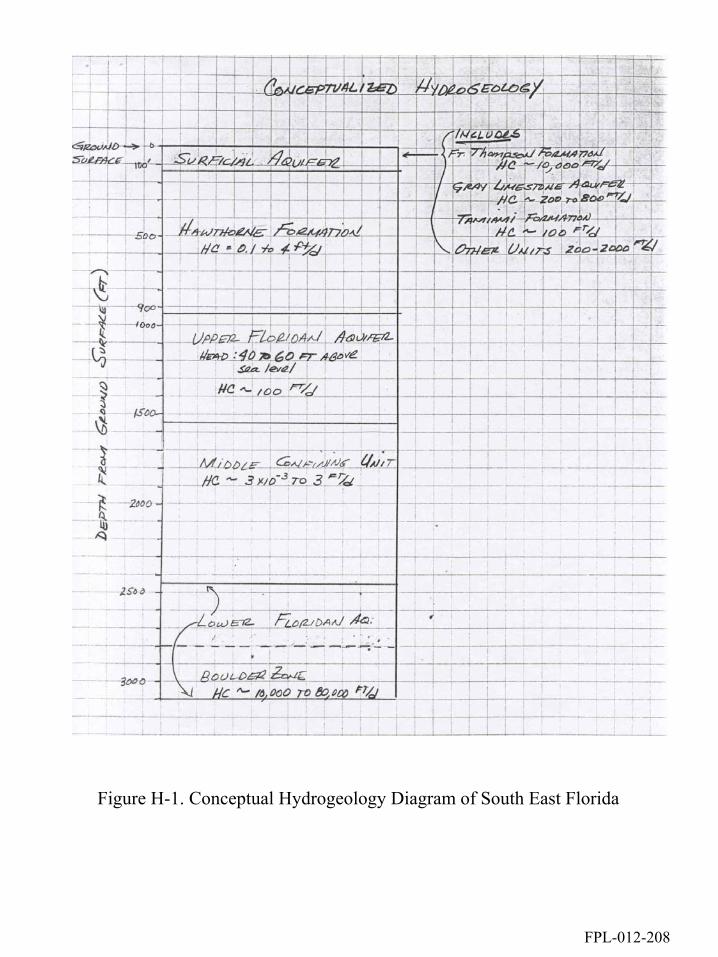
Figure H-1. Conceptual Hydrogeology Diagram of South East Florida
FPL-012-208
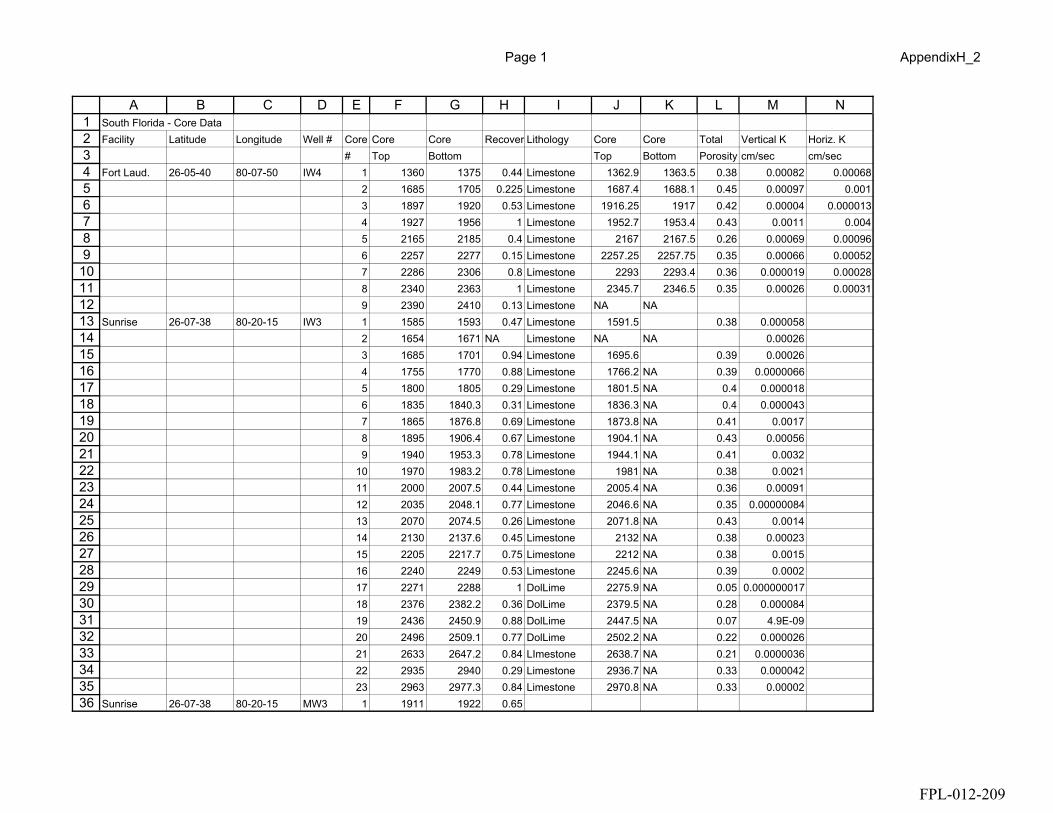
Page 1 AppendixH_2
123456789
101112131415161718192021222324252627282930313233343536
A B C D E F G H I J K L M NSouth Florida - Core DataFacility Latitude Longitude Well # Core Core Core Recover Lithology Core Core Total Vertical K Horiz. K
# Top Bottom Top Bottom Porosity cm/sec cm/secFort Laud. 26-05-40 80-07-50 IW4 1 1360 1375 0.44 Limestone 1362.9 1363.5 0.38 0.00082 0.00068
2 1685 1705 0.225 Limestone 1687.4 1688.1 0.45 0.00097 0.0013 1897 1920 0.53 Limestone 1916.25 1917 0.42 0.00004 0.0000134 1927 1956 1 Limestone 1952.7 1953.4 0.43 0.0011 0.0045 2165 2185 0.4 Limestone 2167 2167.5 0.26 0.00069 0.000966 2257 2277 0.15 Limestone 2257.25 2257.75 0.35 0.00066 0.000527 2286 2306 0.8 Limestone 2293 2293.4 0.36 0.000019 0.000288 2340 2363 1 Limestone 2345.7 2346.5 0.35 0.00026 0.000319 2390 2410 0.13 Limestone NA NA
Sunrise 26-07-38 80-20-15 IW3 1 1585 1593 0.47 Limestone 1591.5 0.38 0.0000582 1654 1671 NA Limestone NA NA 0.000263 1685 1701 0.94 Limestone 1695.6 0.39 0.000264 1755 1770 0.88 Limestone 1766.2 NA 0.39 0.00000665 1800 1805 0.29 Limestone 1801.5 NA 0.4 0.0000186 1835 1840.3 0.31 Limestone 1836.3 NA 0.4 0.0000437 1865 1876.8 0.69 Limestone 1873.8 NA 0.41 0.00178 1895 1906.4 0.67 Limestone 1904.1 NA 0.43 0.000569 1940 1953.3 0.78 Limestone 1944.1 NA 0.41 0.0032
10 1970 1983.2 0.78 Limestone 1981 NA 0.38 0.002111 2000 2007.5 0.44 Limestone 2005.4 NA 0.36 0.0009112 2035 2048.1 0.77 Limestone 2046.6 NA 0.35 0.0000008413 2070 2074.5 0.26 Limestone 2071.8 NA 0.43 0.001414 2130 2137.6 0.45 Limestone 2132 NA 0.38 0.0002315 2205 2217.7 0.75 Limestone 2212 NA 0.38 0.001516 2240 2249 0.53 Limestone 2245.6 NA 0.39 0.000217 2271 2288 1 DolLime 2275.9 NA 0.05 0.00000001718 2376 2382.2 0.36 DolLime 2379.5 NA 0.28 0.00008419 2436 2450.9 0.88 DolLime 2447.5 NA 0.07 4.9E-0920 2496 2509.1 0.77 DolLime 2502.2 NA 0.22 0.00002621 2633 2647.2 0.84 LImestone 2638.7 NA 0.21 0.000003622 2935 2940 0.29 Limestone 2936.7 NA 0.33 0.00004223 2963 2977.3 0.84 Limestone 2970.8 NA 0.33 0.00002
Sunrise 26-07-38 80-20-15 MW3 1 1911 1922 0.65
FPL-012-209

Page 2 AppendixH_2
3738394041424344454647484950515253545556575859606162636465666768
A B C D E F G H I J K L M NBroward N 26-15-36 80-09-18 MW4 1 1650 1650.57 1650 1650.57 0.41 0.00025 0.000038
2 1650.12 1652.55 1652.12 1652.55 0.34 0.000056 0.0000643 1653.08 1653.76 1653.08 1653.76 0.41 0.000048 0.000144 1654.66 1655.32 1654.66 1655.32 0.41 0.000082 0.0000945 1658.75 1659.5 1658.75 1659.5 0.4 0.000048 0.000066 1711 1711.75 1711 1711.55 0.4 0.00035 0.000297 1712.5 1713 1712.5 1713 0.4 0.000092 0.0000798 1715.9 1716.4 1715.9 1716.4 0.4 0.00035 0.00049 1717.5 1717.65 1717.5 1717.65 0.39 0.00022 0.00024
10 1718.15 1718.65 1718.15 1718.65 0.33 0.00034 0.00007511 1887.9 1888.5 1887.9 1888.5 0.4 0.00034 0.0004712 1889.25 1889.75 1889.25 1889.75 0.4 0.000053 0.0003613 1890.25 1890.85 1890.25 1890.85 0.39 0.00014 0.0001214 1891 1891.5 1891 1891.5 0.4 0.00002 0.00003115 1894.75 1895.4 1891.75 1891.5 0.4 0.0000074 0.000031
Plantation 26-07-36 80-16-08 IW1 1 2156.22 2157.12 Limestone 2156.22 2157.12 0.44 0.00082 0.000382 2166 2166.82 Limestone 2166 2166.82 0.39 0.000082 0.0000753 2307.41 2308.29 Limestone 2307.41 2308.29 0.27 0.000018 0.0000894 2437.65 2438.48 Limestone 2437.65 2438.48 0.33 0.000017 0.0000445 2532.64 2533.39 Dolomite 2532.64 2533.39 0.31 0.000045 0.0000996 2645.75 2646.65 Dolomite 2645.75 2646.65 0.32 0.00028 0.000027 2812.81 2813.55 Dolomite 2812.81 2813.55 0.42 0.000046 0.0000748 2852.38 2852.83 Limestone 2852.38 2852.83 0.42 0.000074 0.00021
Plantation 26-08-22 80-14-13 Reject # 1 2150 2170 0.73 2156.22 2157.12 0.41 0.00082 0.000382 2166 2166.82 2166 2166.82 0.38 0.000082 0.0000753 2307.41 2308.29 2307.41 2308.29 0.27 0.000018 0.0000894 2437.65 2438.48 2437.65 2438.48 0.3 0.000017 0.0000445 2532.64 2533.39 2532.64 2533.39 0.26 0.000045 0.0000996 2645.75 2646.65 2645.75 2646.65 0.31 0.00028 0.000027 2691.85 2692.15 2691.85 2692.15 0.32 0.0000158 2812.81 2813.55 2812.81 2813.55 0.42 0.000046 0.0000749 2852.38 2852.83 2852.38 2852.83 0.39 0.00021
FPL-012-210

Page 3 AppendixH_2
697071727374757677787980818283848586878889909192939495
A B C D E F G H I J K L M NBoynton Bch, 26-31-43 80-07-18 1 2130 2147 1 Limestone 2137.5 2138.5 0.26 0.0000079 0.000015
2 2200 2214 0.5 Dolomite 2204.1 2204.5 0.29 6.6E-09 2.5E-093 2351 2365 1 Limestone 2361.8 2362.7 0.29 0.000034 0.0000454 2411 2426 0.8 Limestone 2416.3 2416.9 0.35 0.000026 0.0000195 2441 2456 0.8 Limestone 2448.5 2449 0.32 0.000027 0.0000126 2651 2662 0.23 Dolomite 2653 2653.5 0.09 0.000000046 0.00000012
South Dade, MDWASA FA-10 1 1540 1550 1540 1540.5 0.005 0.00122 1570 1580 1570 1570.6 0.004 0.003
1610 1620 1610 1610.8 0.0025 0.0011West Palm 26-44-21 80-07-32 Test We 1 2503 2510 Limestone 2503 2503.2 0.134 0.000005668
2 2520 Limestone 2520 2520.2 0.403 0.0000088093 2750 Limestone 2750 2750.2 0.297 0.000004084 2957 Limestone 2957 2957.2 0.288 0.00000118
Fort Laud. 26-05-40 80-07-50 IW1 1 2180 Limestone 2180.55 2181.4 0.311 0.00008362 2112 Limestone 2112 2112.95 0.304 0.0000563 2293 Limestone 2293.63 2294.58 0.347 0.000034
IW2 1 2491 Limestone 2491.1 2595 0.324 0.00000832 2470 Limestone 2470.55 2471.3 0.361 0.00001443 2410 Limestone 2410 2410.8 0.328 0.0000207
IW3 1 2149 Limestone 2149 0.345 0.0003252 2360 Limestone 2360 23610.8 0.345 0.00001313 2369 Limestone 2369 2370 0.381 0.0000165
IW5 3 2543 Limestone 2543.16 2543.92 0.278 0.00000775 2757 Limestone 2757.58 2754.42 0.383 0.000126 2802 Limestone 2802.84 2803.84 0.329 0.0001557 2854 Limestone 2854.33 2855.5 0.034 0.00005168 2901 Limestone 2901.5 2902 0.314 0.000029
FPL-012-211

Page 4 AppendixH_2
96979899100101102103104105106107108109110111112113114115116
A B C D E F G H I J K L M NPemb. Pines 25-59-25 80-20-05 IW2 1 2020.6 2020.6 0.348 0.000000949 0.00000985
2 2028 2028.8 0.404 0.00000651 0.000007323 2361 Dolomite 2361.3 0.4 9.66E-10 9.66E-094 2364 Dolomite 2364 0.4 9.66E-10 9.66E-095 2567 2567.6 0.215 0.000119 0.0001416 2571 2571.8 0.216 0.000228 0.0004287 2804 2804.7 0.25 0.000108 0.00006988 2814 2814 0.329 0.00000545 0.000008359 2808 2808.8 0.28 0.0000152 0.0000121
10 2975 2975 0.3 0.0000633 0.000014311 2993 2993 0.352 0.000034 0.0000388
Broward N 26-15-36 80-09-18 IW1 1 2303 2303 0.31 0.00015 0.000722 2405 2405 0.38 0.000063 0.000463 2503 2503 0.33 0.000084 0.0000514 2616 2616 0.33 0.00017 0.0000175 2730 2730 0.38 0.00032 0.00025
Coral Springs 26-14-30 80-15-30 IW1 1 2015 Limestone 2015 2016.2 0.415 0.0000582 2111 Limestone 2111.4 2112 0.314 0.0000793 2357 Limestone 2357.9 2358.4 0.342 0.00000954 2704 Dolomite 2704 2705.2 0.081 3.4E-095 2892 Limestone 2892 2892.8 0.351 0.000065
FPL-012-212
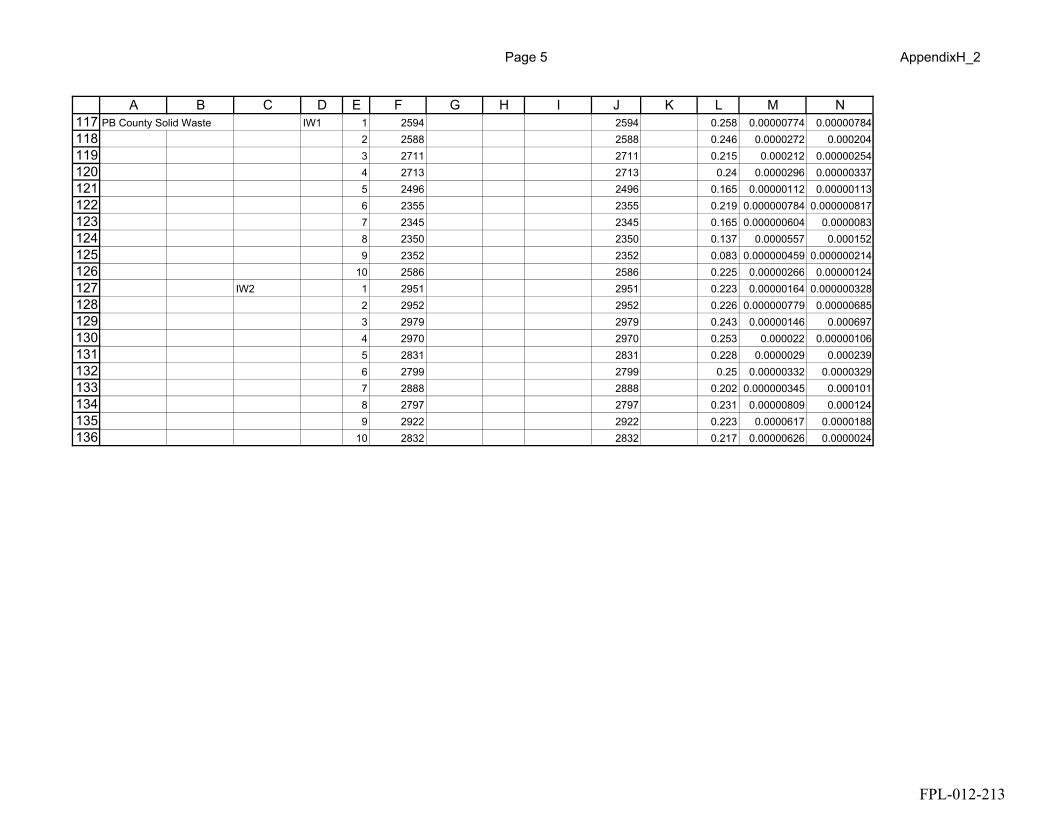
Page 5 AppendixH_2
117118119120121122123124125126127128129130131132133134135136
A B C D E F G H I J K L M NPB County Solid Waste IW1 1 2594 2594 0.258 0.00000774 0.00000784
2 2588 2588 0.246 0.0000272 0.0002043 2711 2711 0.215 0.000212 0.000002544 2713 2713 0.24 0.0000296 0.000003375 2496 2496 0.165 0.00000112 0.000001136 2355 2355 0.219 0.000000784 0.0000008177 2345 2345 0.165 0.000000604 0.00000838 2350 2350 0.137 0.0000557 0.0001529 2352 2352 0.083 0.000000459 0.000000214
10 2586 2586 0.225 0.00000266 0.00000124IW2 1 2951 2951 0.223 0.00000164 0.000000328
2 2952 2952 0.226 0.000000779 0.000006853 2979 2979 0.243 0.00000146 0.0006974 2970 2970 0.253 0.000022 0.000001065 2831 2831 0.228 0.0000029 0.0002396 2799 2799 0.25 0.00000332 0.00003297 2888 2888 0.202 0.000000345 0.0001018 2797 2797 0.231 0.00000809 0.0001249 2922 2922 0.223 0.0000617 0.0000188
10 2832 2832 0.217 0.00000626 0.0000024
FPL-012-213

90
APPENDIX I. SCHEMATIC DIAGRAMS, TREE DIAGRAMS SHOWING POTENTIAL PATHWAYS OF EXPOSURE, AND MODIFIED DIAGRAMS SHOWING NODES HAVING REGULATORY STANDARDS
FPL-012-214
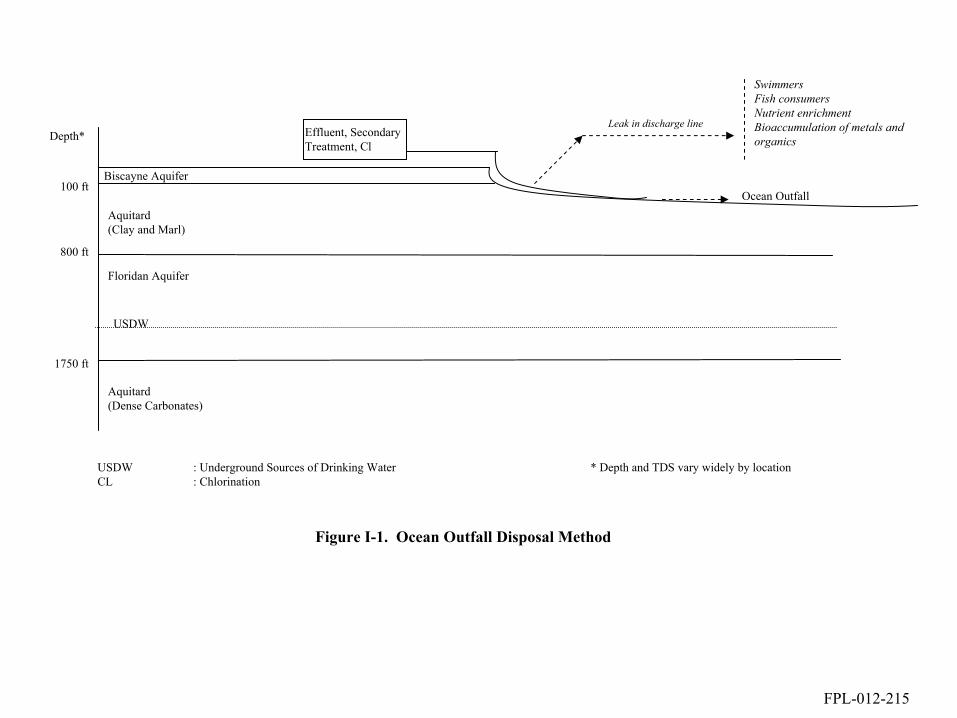
Figure I-1. Ocean Outfall Disposal Method
Biscayne Aquifer
Aquitard (Clay and Marl)
Floridan Aquifer
Aquitard (Dense Carbonates)
100 ft
800 ft
1750 ft
Effluent, Secondary Treatment, Cl
Depth*
Swimmers Fish consumersNutrient enrichmentBioaccumulation of metals and organics
Ocean Outfall
USDW
USDW : Underground Sources of Drinking WaterCL : Chlorination
* Depth and TDS vary widely by location
Leak in discharge line
FPL-012-215
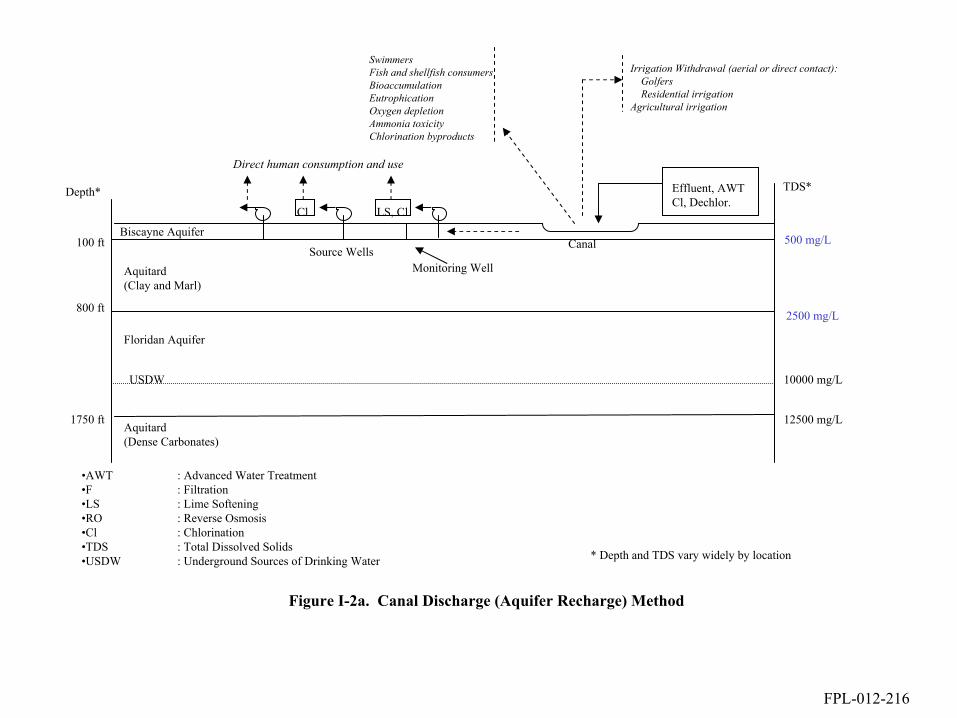
•AWT : Advanced Water Treatment•F : Filtration•LS : Lime Softening•RO : Reverse Osmosis•Cl : Chlorination•TDS : Total Dissolved Solids•USDW : Underground Sources of Drinking Water
Figure I-2a. Canal Discharge (Aquifer Recharge) Method
2500 mg/L
Biscayne Aquifer
Aquitard (Clay and Marl)
Floridan Aquifer
Aquitard (Dense Carbonates)
100 ft
800 ft
1750 ft
Source Wells
Direct human consumption and use
Depth* TDS*
500 mg/L
LS, Cl
SwimmersFish and shellfish consumersBioaccumulationEutrophicationOxygen depletionAmmonia toxicityChlorination byproducts
Canal
Effluent, AWTCl, Dechlor.
Irrigation Withdrawal (aerial or direct contact):GolfersResidential irrigation
Agricultural irrigation
USDW 10000 mg/L
12500 mg/L
* Depth and TDS vary widely by location
Cl
Monitoring Well
FPL-012-216
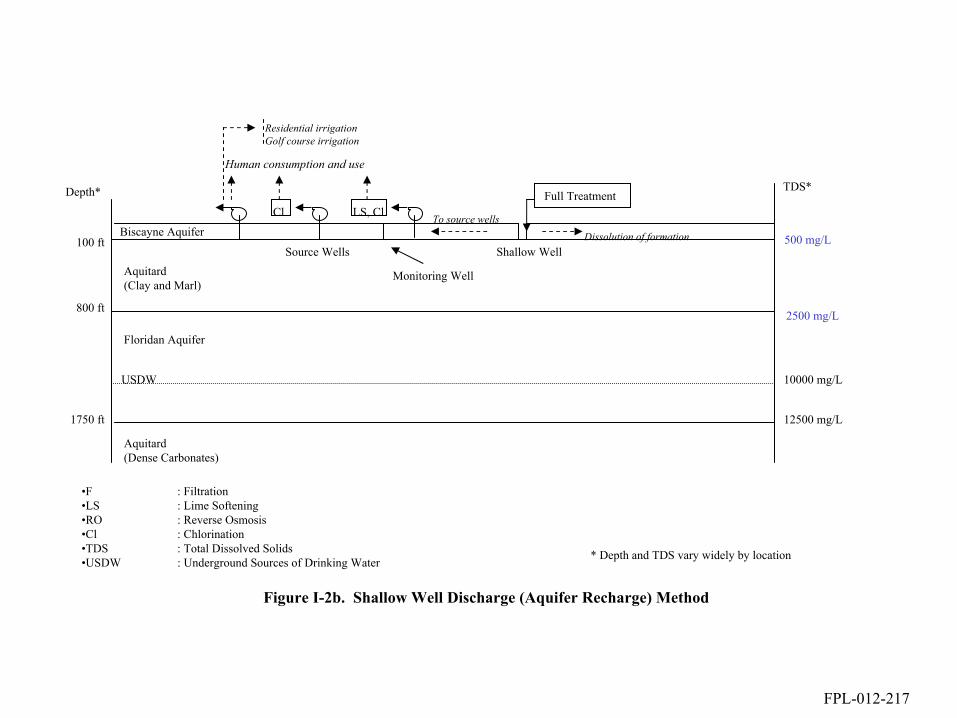
•F : Filtration•LS : Lime Softening•RO : Reverse Osmosis•Cl : Chlorination•TDS : Total Dissolved Solids•USDW : Underground Sources of Drinking Water
Figure I-2b. Shallow Well Discharge (Aquifer Recharge) Method
2500 mg/L
Biscayne Aquifer
Aquitard (Clay and Marl)
Floridan Aquifer
Aquitard (Dense Carbonates)
100 ft
800 ft
1750 ft
Human consumption and use
Depth* TDS*
500 mg/LShallow Well
Full Treatment
Dissolution of formationTo source wells
USDW 10000 mg/L
Monitoring Well
Residential irrigationGolf course irrigation
12500 mg/L
* Depth and TDS vary widely by location
Source Wells
LS, ClCl
FPL-012-217

2500 mg/L
10000 mg/L
12500 mg/L
Biscayne Aquifer
Aquitard (Clay and Marl)
Floridan Aquifer
Aquitard (Dense Carbonates)
Boulder Zone
100 ft
800 ft
1750 ft
2800 ft
Injection Well
Effluent, Secondary Treatment, Cl
Monitoring wells
ASR
F, LS, Cl
Human consumption and useDirect human consumption and use
Depth*TDS*
500 mg/L
USDW
•ASR : Aquifer Storage and Recharge •F : Filtration•LS : Lime Softening•RO : Reverse Osmosis•Cl : Chlorination•LMZ : Lower Monitoring Zone•UMZ : Upper Monitoring Zone•TDS : Total Dissolved Solids•USDW : Underground Sources of Drinking Water
Figure I-3. Deep Well Injection Disposal Method
SwimmersFish and shellfish consumersResidential irrigationEutrophicationOxygen depletion
OceanSwimmers Fish consumersNutrient enrichmentBioaccumulation
To source wells
To Regional ASR
To Potable ASR
Accumulation of organics, persistent compoundsNutrient EnrichmentDissolution of formation
Potable ASR
Non-potable ASR
Cl
* Depth and TDS vary widely by location
UMZ
LMZ
Source Wells
RO, Cl
ASR
Canal discharge
Regional ASR
LS, Cl
F, LS, Cl
Leak incasing
Leak incasing
FPL-012-218
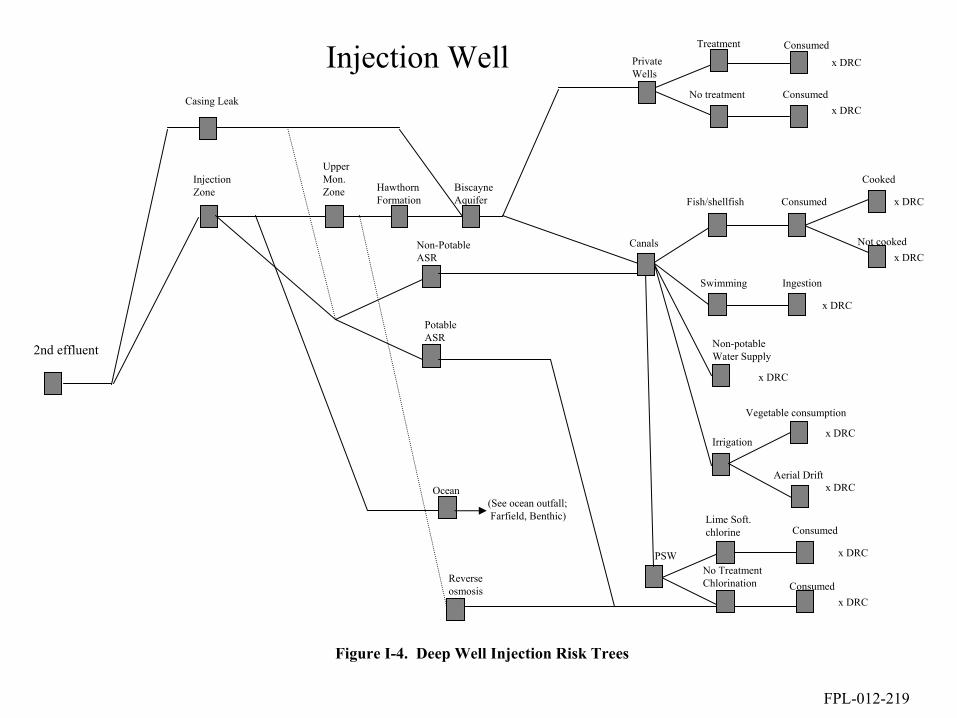
InjectionZone
UpperMon.Zone Hawthorn
FormationBiscayne Aquifer
Private Wells
Treatment
No treatment
Consumed
Consumedx DRC
x DRC
Casing Leak
2nd effluent
Consumed
Cooked
Not cooked
Fish/shellfish
Swimming Ingestion
Non-potable Water Supply
Irrigation
Vegetable consumption
x DRC
x DRC
x DRC
x DRC
x DRC
Canals
Aerial Driftx DRC
Lime Soft.chlorine
No TreatmentChlorination
Consumed
Consumedx DRC
x DRCPSW
Reverseosmosis
Injection Well
Ocean
Non-PotableASR
PotableASR
(See ocean outfall;Farfield, Benthic)
Figure I-4. Deep Well Injection Risk Trees
FPL-012-219
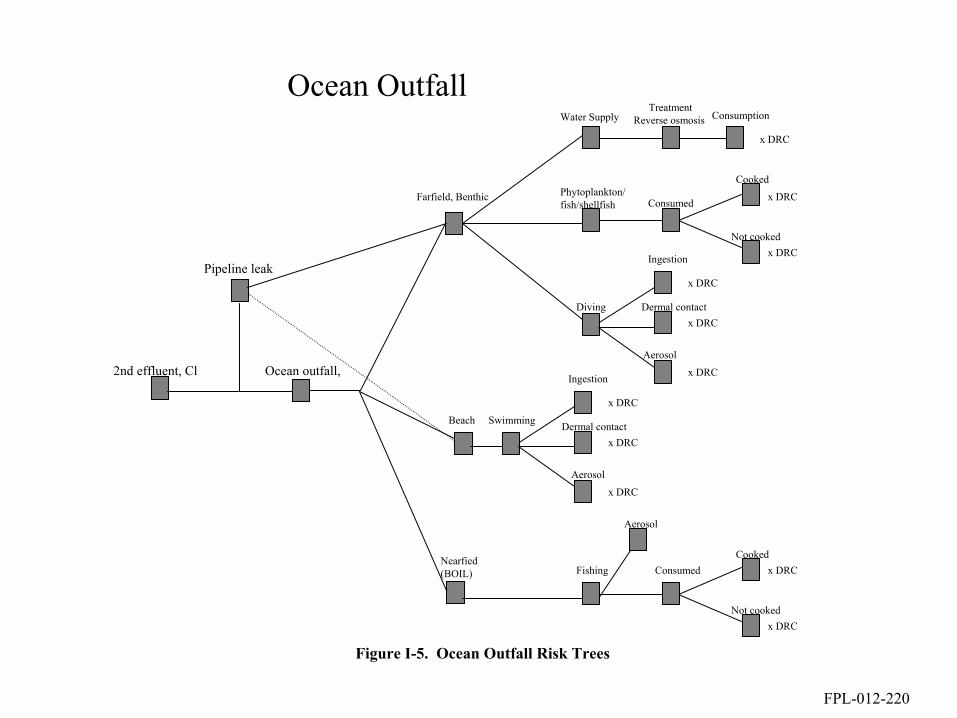
Farfield, Benthic
Water SupplyTreatment
Reverse osmosis Consumption
Ocean outfall,
x DRC
ConsumedCooked
Not cooked
Fishing
x DRC
x DRCNearfied(BOIL)
Consumed
Cooked
Not cooked
Phytoplankton/fish/shellfish
x DRC
x DRC
Ocean Outfall
2nd effluent, Cl
Pipeline leakx DRC
Diving Dermal contactx DRC
Ingestion
Aerosol
x DRC
x DRC
Swimming Dermal contactx DRC
Ingestion
Aerosol
x DRC
Beach
Aerosol
Figure I-5. Ocean Outfall Risk Trees
FPL-012-220

Consumed
Cooked
Not cooked
Fish/shellfish
Water SupplyLime soft.,chlorine Consumption
Irrigation Aerial Drift
x DRC
x DRC
x DRC
Effluent,Advanced Wastewater Treatment,high level disinfection
x DRC
Dermal Contactx DRC
x DRCSwimming
Ingestion
Vegetable consumption
x DRC
Surficial Aquifer Recharge
Canals
GAC/RO Shallow wells
x DRCAerosol
Figure I-6. Surficial Aquifer Recharge Risk Trees
FPL-012-221
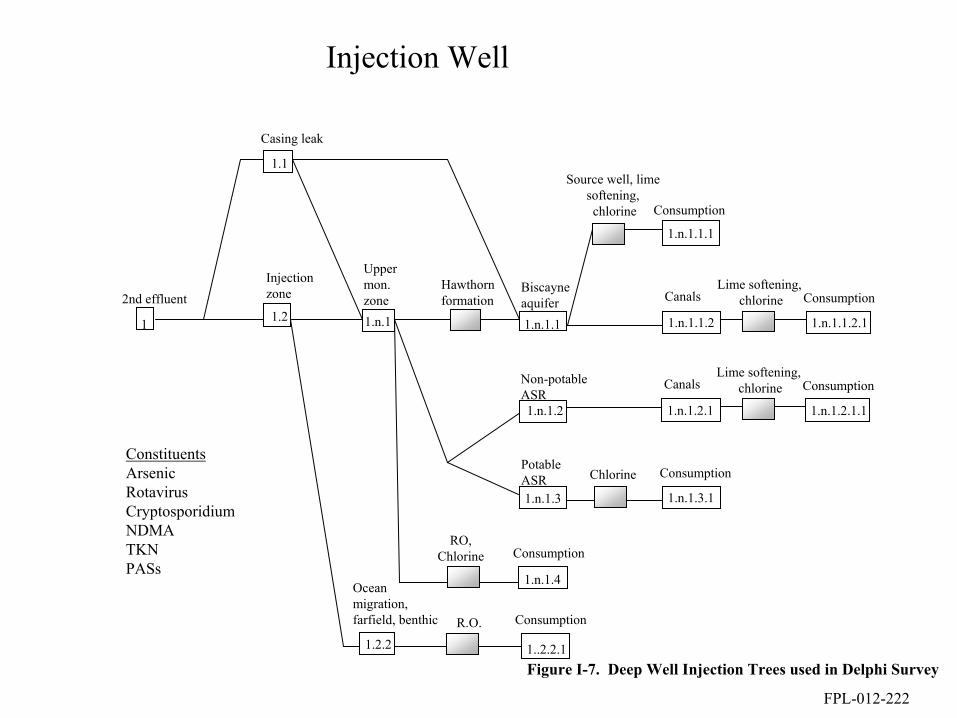
2nd effluent
Injection Well
Injectionzone
Uppermon.zone
Hawthornformation
Biscayne aquifer
Casing leak
Canals
Ocean migration, farfield, benthic
Non-potableASR
PotableASR
1.1
1.2 1.n.1 1.n.1.1
1.n.1.2
1.n.1.3
1.2.2
1 1.n.1.1.2.1
Lime softening, chlorine Consumption
1.n.1.3.1
Chlorine Consumption
1.n.1.4
RO,Chlorine Consumption
ConstituentsArsenicRotavirusCryptosporidiumNDMATKNPASs
1.n.1.1.1
Consumption
Source well, lime softening, chlorine
1.n.1.1.2
1..2.2.1
ConsumptionR.O.
Canals
1.n.1.2.1.1
Lime softening, chlorine Consumption
1.n.1.2.1
Figure I-7. Deep Well Injection Trees used in Delphi Survey
FPL-012-222

Farfield, benthicOcean outfall
ConstituentsCryptosporidiumArsenicNDMATKNPASs
Ocean Outfall
2nd effluent, ClBeach
2
2.1
2..n.1
Nearfield(boil)
2..n.2.1
2..n.3
Pipelineleak
2.2
2.n.2
ConsumptionR.O.
Figure I-8. Ocean Outfall Trees used in Delphi Survey
FPL-012-223
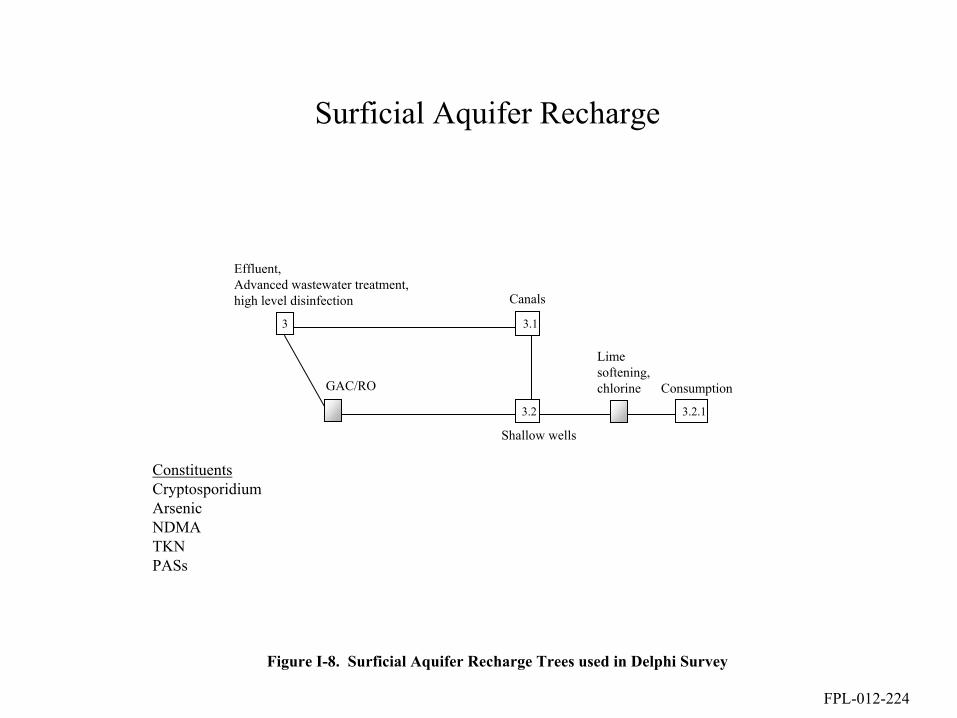
Lime softening,chlorine
Effluent,Advanced wastewater treatment,high level disinfection
Surficial Aquifer Recharge
Canals
GAC/RO
Shallow wells
ConstituentsCryptosporidiumArsenicNDMATKNPASs
3 3.1
3.2 3.2.1
Consumption
Figure I-8. Surficial Aquifer Recharge Trees used in Delphi Survey
FPL-012-224

91
APPENDIX J. MODIFIED DELPHI QUESTIONNAIRE WITH FINAL INDIVIDUAL AND SUMMARIZED RESULTS
FPL-012-225

Inj Wells
Table J-1 FIRST DELPHI SURVEY ITERATION TO ELICIT PROFESSIONAL JUDGMENT: INJECTION WELL EFFLUENT DISPOSAL
QUESTIONS1. How many times in 30 years will the regulatory standard be exceeded at the receiving node? (One such exceedance event may last any number of days.)2. What is your confidence in the numbers of exceedance events you entered? Please select low (L), medium (M) or high (H).3. How many days will exceedence events last (min., mean, max.)? 4. What is your confidence in the event sizes you entered? Please select from low (L), medium (M) or high (H).
NOTES:1. Please view supporting information by placing your cursor over the cells having a red corner.2. If part of the text in the yellow comment does not show when you place your cursor over the cell, click on the cell, select "Edit Comment" from the Insert menu, and drag the lower edge of the yellow comment window down to enlarge it. (This is a Microsoft problem we cannot solve)3. If you want to change an assumption, please do so and explain in your reasons.4. If within your area of expertise for the Team, please supply at least (a) a min & max & confidence, or (b) a mean & confidence.5. Remember that the average number of events over 30 years can be a fraction.
Link Link Event Reg. Stds. & Assumptions CommentsFrom To Min. Mean Max. nfidence Min. Mean Max. nfidence
L M H L M H
1.1 1.n.1.1
Exceedence of MCL drinking water stds. in Biscayne Aquifer due to leakage from injection well casing
There are 4 casings in the Biscayne Aquifer, 3 in the Hawthorn (see Figure 2. in supporting information).
Mmbr 1 For rotavirus 0 1E-06 0.000001 x 0.05 1 10 x 2E-7 org/L2 For rotavirus 1.00E-12 1E-09 1.00E-06 h ####### 0.01 1.00E-06 h 2E-7 org/L3 For rotavirus 0 0.1 1 x 1 2 5 x 2E-7 org/L4 For rotavirus 0.001 0.1 1 L 0 10 21 L 2E-7 org/L
5 For rotavirus 1 6 10 x 5 14 20 x 2E-7 org/L
It is possible that on any given day high level of viruses will be injected based on excretion and casing leakage. To meet the standard 10-10 dilution would be needed. Viruses can survive in groundwater and would not be detected.
Avg 0.00057 0.00631 1.22866 0.46179Min 0 1E-09 0.000001 0 0.01 1E-06
Max 1 6 10 5 14 21Wtd geo.
Mean 2.9E-05 5 0.912 5log of mean -4.5444
Mmbr 1 For Arsenic 0 1E-06 0.000001 x 0.05 5 10 x 50 ug/L2 For Arsenic 1.00E-12 1E-09 1.00E-06 h ####### 0.01 1.00E-06 h 50 ug/L3 For Arsenic 0 0.1 1 x 1 2 5 x 50 ug/L4 0.001 0.01 0.1 L 0 10 50 L 50 ug/L
5 For Arsenic 0.001 0.3 0.1 x 2 7 30 x 50 ug/L
It soes not seem possible that arsenic will be increased in the sewage. With the dilution etc, I don't see how this will ever happen.
Avg 0.0002 0.001585 1.47577 0.59568Min 0 1E-09 0.000001 0 0.01 1E-06
Max 0.001 0.3 1 2 10 50
Wtd Avg. 4.1E-06 4 0.63794 4log of mean -5.3914
Mmbr 1 For TKN 0 1E-06 x 0.05 5 10 x 10 mg/L2 For TKN 1.00E-12 1E-09 1.00E-06 h ####### 0.01 1.00E-06 h 10 mg/L3 For TKN 0 0.1 1 x 1 2 5 x 10 mg/L4 0.001 0.01 0.1 L 0 5 21 L 10 mg/L
No. Exceedance Events Days per Event
Assume mean of 10 virus/L (range 0.001-1000) in secondary effluent (conservative) based on total virus data of Tanaka, et al. (1998) and Rose and Carnahan (1992)
Mean Arsenic from data for secondary treatment plants is 4.5 ug/L. Two standard deviations = +/- 2.6 ug/L.For AWT, mean is 1.3 ug/L
Mean TKN from data for secondary treatment plants is 9.8 mg/L. Two standard deviations = +/- 12.1 mg/L.
Standard assumed based on 2L/d drinking water consumption, beta-Poisson rotavirus dose-response (Haas, et al. 1999), and 1E-4 infections/cap-year
Assumed MCL Drinking Water Standard, based on MCL = 10
mg/L nitrate as nitrogen
MCL regulatory drinking water std.
Page 1
FPL-012-226

Inj Wells
5 For TKN 1 6 10 x 7 10 60 x 10 mg/L
If there is a leak the TKN could be continuously moving into the aquifer and it may take a while to find the leak and correct it.
Avg 0.00036 0.031623 1.37973 0.57527Min 0 1E-09 0.000001 0 0.01 1E-06
Max 1 6 10 7 10 60
Wtd Avg. 5.7E-06 4 0.6545 4log of mean -5.2469
Mmbr 1 For NDMA 0 1E-06 x 0.05 1 10 x 0.002 ug/L2 For NDMA 1.00E-12 1E-09 1.00E-06 h ####### 0.01 1.00E-06 h 0.002 ug/L3 For NDMA 0 0.1 1 x 1 2 5 x 0.002 ug/L4 0.001 0.1 1 L 0 5 21 L 0.002 ug/L
5 For NDMA 1 6 10 x 7 10 60 0.002 ug/L
Once a leak occurs, difficult to detect and may last for a while.
7 0 0.05 3 M 1 3 10 MAvg 0.0012 0.124573 1.20094 0.92588Min 0 1E-09 0.000001 0 0.01 1E-06
Max 1 6 10 7 10 60
Wtd Avg. 3.6E-05 4 0.52858 4log of mean -4.4385
1.n.1 1.n.1.1
Exceedence of MCL drinking water stds. in Biscayne Aquifer due to upward migration of effluent from upper Floridan through Hawthorn Formation
Assume effluent has penetrated upper Floridan, and must pass 400 ft of Hawthorn clays
Hydraulic conductivity of clay is<0.01 m/d (Chin, 2000)
Mmbr 1 For rotavirus 0 1E-12 0.00001 x 0.01 10590 x 2E-7 org/L2 For rotavirus 1.00E-12 1E-09 1.00E-06 h 0.01 h 2E-7 org/L3 For rotavirus 0 ####### 1.00E-12 x 0 1.00E-02 x 2E-7 org/L4 0.1 3 30 L 0 50 10950 L 2E-7 org/L
5 For rotavirus 15 30 60 x 1 3 7 x 2E-7 org/L
Viruses will easily migrate 400 ft, and there may be small cracks that viruses can get through. It is likely to happen but less likely that the levels will last be very high or last very long.
Avg 6.2E-07 0.262074 0.17188 932.83Min 0 1E-12 1E-12 0 0.01 7
Max 15 30 60 1 50 10950
Wtd Avg. 7E-08 5 0.07333 5log of mean -7.1569
Mmbr 1 For Arsenic 0 1E-06 0.00001 x 0.05 1 10 x 50 ug/L2 For Arsenic 1.00E-12 1E-09 1.00E-06 h 0.01 h 50 ug/L3 For Arsenic 0 ####### 1.00E-12 x 0 1.00E-02 x 50 ug/L4 0.01 0.1 1 L 0 50 500 L 50 ug/L
5 For Arsenic 0.001 0.01 0.1 x 2 7 30 x 50 ug/L
It seems very unlikly that the arsenic will move, but if it does I suppose it would be persistent.
Avg 1E-06 0.01 0.51146 53.1329Min 0 1E-12 1E-12 0 0.01 10
Max 0.01 0.1 1 2 50 500
Wtd Avg. 2.2E-07 4 0.2476 4
Range 0.02 - 14 ug/L in secondary effluent in California. NDMA occurrence may be related to chlorination and to rocket fuel manufacture.
Assume mean of 10 virus/L (range 0.001-1000) in secondary effluent (conservative) based on total virus data of Tanaka, et al. (1998) and Rose and Carnahan (1992)
Mean Arsenic from data for secondary treatment plants is 4.5 ug/L. Two standard deviations = +/- 2.6 ug/L.For AWT, mean is 1.3 ug/L
State of California Action Level
Standard assumed based on 2L/d drinking water consumption, beta-Poisson rotavirus dose-response (Haas, et al. 1999), and 1E-4 infections/cap-year
MCL regulatory drinking water std.
Page 2
FPL-012-227
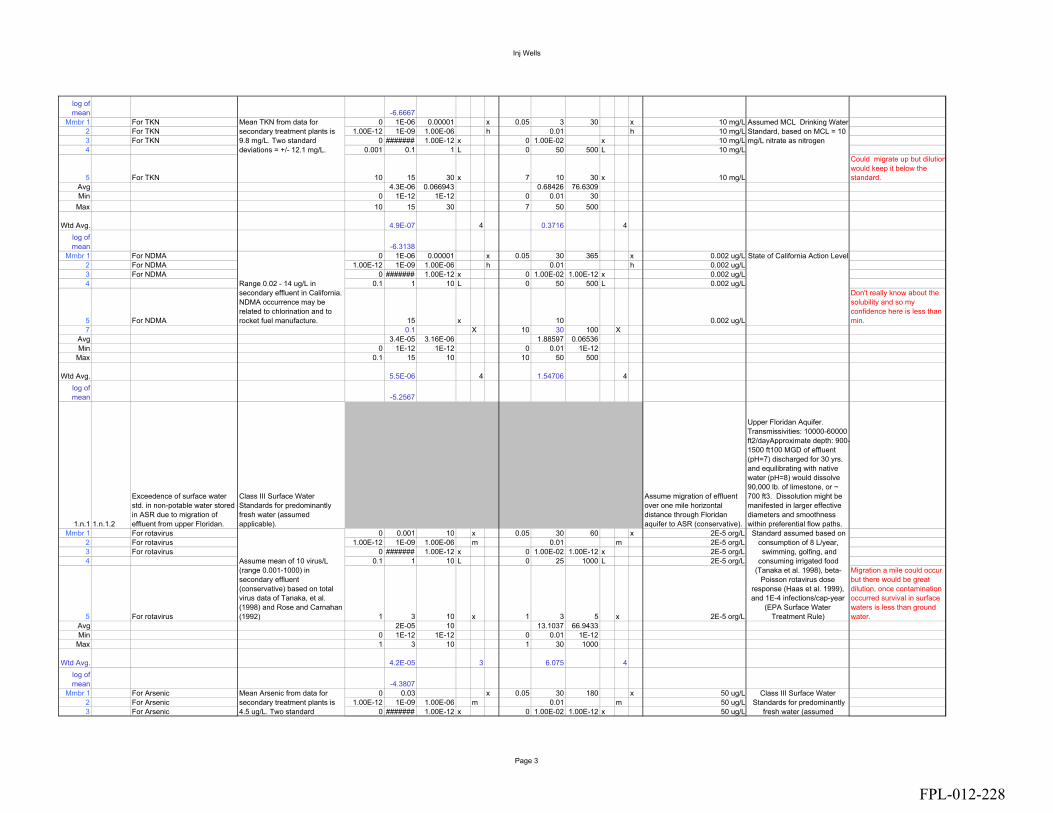
Inj Wells
log of mean -6.6667
Mmbr 1 For TKN 0 1E-06 0.00001 x 0.05 3 30 x 10 mg/L2 For TKN 1.00E-12 1E-09 1.00E-06 h 0.01 h 10 mg/L3 For TKN 0 ####### 1.00E-12 x 0 1.00E-02 x 10 mg/L4 0.001 0.1 1 L 0 50 500 L 10 mg/L
5 For TKN 10 15 30 x 7 10 30 x 10 mg/L
Could migrate up but dilution would keep it below the standard.
Avg 4.3E-06 0.066943 0.68426 76.6309Min 0 1E-12 1E-12 0 0.01 30
Max 10 15 30 7 50 500
Wtd Avg. 4.9E-07 4 0.3716 4log of mean -6.3138
Mmbr 1 For NDMA 0 1E-06 0.00001 x 0.05 30 365 x 0.002 ug/L2 For NDMA 1.00E-12 1E-09 1.00E-06 h 0.01 h 0.002 ug/L3 For NDMA 0 ####### 1.00E-12 x 0 1.00E-02 1.00E-12 x 0.002 ug/L4 0.1 1 10 L 0 50 500 L 0.002 ug/L
5 For NDMA 15 x 10 0.002 ug/L
Don't really know about the solubility and so my confidence here is less than min.
7 0.1 X 10 30 100 XAvg 3.4E-05 3.16E-06 1.88597 0.06536Min 0 1E-12 1E-12 0 0.01 1E-12
Max 0.1 15 10 10 50 500
Wtd Avg. 5.5E-06 4 1.54706 4log of mean -5.2567
1.n.1 1.n.1.2
Exceedence of surface water std. in non-potable water stored in ASR due to migration of effluent from upper Floridan.
Class III Surface Water Standards for predominantly fresh water (assumed applicable).
Assume migration of effluent over one mile horizontal distance through Floridan aquifer to ASR (conservative).
Upper Floridan Aquifer. Transmissivities: 10000-60000 ft2/dayApproximate depth: 900-1500 ft100 MGD of effluent (pH=7) discharged for 30 yrs. and equilibrating with native water (pH=8) would dissolve 90,000 lb. of limestone, or ~ 700 ft3. Dissolution might be manifested in larger effective diameters and smoothness within preferential flow paths.
Mmbr 1 For rotavirus 0 0.001 10 x 0.05 30 60 x 2E-5 org/L2 For rotavirus 1.00E-12 1E-09 1.00E-06 m 0.01 m 2E-5 org/L3 For rotavirus 0 ####### 1.00E-12 x 0 1.00E-02 1.00E-12 x 2E-5 org/L4 0.1 1 10 L 0 25 1000 L 2E-5 org/L
5 For rotavirus 1 3 10 x 1 3 5 x 2E-5 org/L
Migration a mile could occur but there would be great dilution, once contamination occurred survival in surface waters is less than ground water.
Avg 2E-05 10 13.1037 66.9433Min 0 1E-12 1E-12 0 0.01 1E-12
Max 1 3 10 1 30 1000
Wtd Avg. 4.2E-05 3 6.075 4log of mean -4.3807
Mmbr 1 For Arsenic 0 0.03 x 0.05 30 180 x 50 ug/L2 For Arsenic 1.00E-12 1E-09 1.00E-06 m 0.01 m 50 ug/L3 For Arsenic 0 ####### 1.00E-12 x 0 1.00E-02 1.00E-12 x 50 ug/L
Mean TKN from data for secondary treatment plants is 9.8 mg/L. Two standard deviations = +/- 12.1 mg/L.
Range 0.02 - 14 ug/L in secondary effluent in California. NDMA occurrence may be related to chlorination and to rocket fuel manufacture.
Assume mean of 10 virus/L (range 0.001-1000) in secondary effluent (conservative) based on total virus data of Tanaka, et al. (1998) and Rose and Carnahan (1992)
Mean Arsenic from data for secondary treatment plants is 4.5 ug/L. Two standard
State of California Action Level
Standard assumed based on consumption of 8 L/year, swimming, golfing, and
consuming irrigated food (Tanaka et al. 1998), beta-
Poisson rotavirus dose response (Haas et al. 1999), and 1E-4 infections/cap-year
(EPA Surface Water Treatment Rule)
Class III Surface Water Standards for predominantly
fresh water (assumed
Assumed MCL Drinking Water Standard, based on MCL = 10 mg/L nitrate as nitrogen
Page 3
FPL-012-228
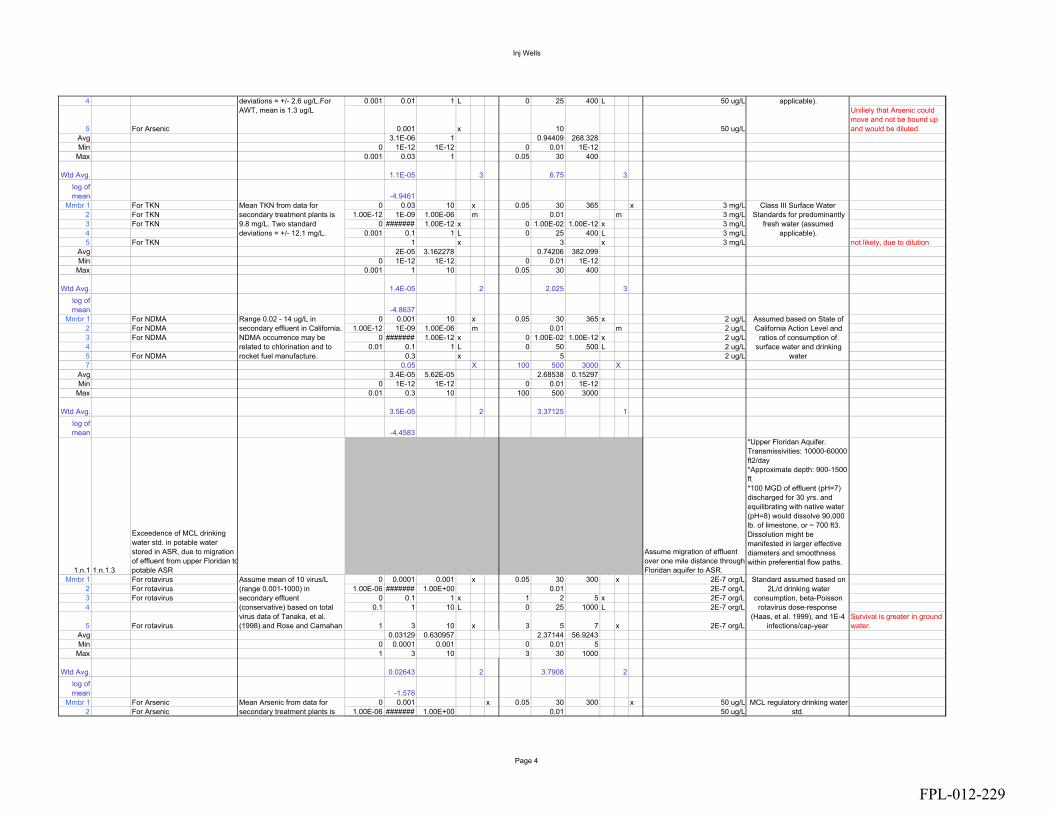
Inj Wells
4 0.001 0.01 1 L 0 25 400 L 50 ug/L
5 For Arsenic 0.001 x 10 50 ug/L
Uniliely that Arsenic could move and not be bound up and would be diluted.
Avg 3.1E-06 1 0.94409 268.328Min 0 1E-12 1E-12 0 0.01 1E-12
Max 0.001 0.03 1 0.05 30 400
Wtd Avg. 1.1E-05 3 6.75 3log of mean -4.9461
Mmbr 1 For TKN 0 0.03 10 x 0.05 30 365 x 3 mg/L 2 For TKN 1.00E-12 1E-09 1.00E-06 m 0.01 m 3 mg/L 3 For TKN 0 ####### 1.00E-12 x 0 1.00E-02 1.00E-12 x 3 mg/L 4 0.001 0.1 1 L 0 25 400 L 3 mg/L 5 For TKN 1 x 3 x 3 mg/L not likely, due to dilution
Avg 2E-05 3.162278 0.74206 382.099Min 0 1E-12 1E-12 0 0.01 1E-12
Max 0.001 1 10 0.05 30 400
Wtd Avg. 1.4E-05 2 2.025 3log of mean -4.8637
Mmbr 1 For NDMA 0 0.001 10 x 0.05 30 365 x 2 ug/L2 For NDMA 1.00E-12 1E-09 1.00E-06 m 0.01 m 2 ug/L3 For NDMA 0 ####### 1.00E-12 x 0 1.00E-02 1.00E-12 x 2 ug/L4 0.01 0.1 1 L 0 50 500 L 2 ug/L5 For NDMA 0.3 x 5 2 ug/L7 0.05 X 100 500 3000 X
Avg 3.4E-05 5.62E-05 2.68538 0.15297Min 0 1E-12 1E-12 0 0.01 1E-12
Max 0.01 0.3 10 100 500 3000
Wtd Avg. 3.5E-05 2 3.37125 1log of mean -4.4583
1.n.1 1.n.1.3
Exceedence of MCL drinking water std. in potable water stored in ASR, due to migration of effluent from upper Floridan topotable ASR
Assume migration of effluent over one mile distance through Floridan aquifer to ASR.
*Upper Floridan Aquifer. Transmissivities: 10000-60000 ft2/day *Approximate depth: 900-1500 ft *100 MGD of effluent (pH=7) discharged for 30 yrs. and equilibrating with native water (pH=8) would dissolve 90,000 lb. of limestone, or ~ 700 ft3. Dissolution might be manifested in larger effective diameters and smoothness within preferential flow paths.
Mmbr 1 For rotavirus 0 0.0001 0.001 x 0.05 30 300 x 2E-7 org/L2 For rotavirus 1.00E-06 ####### 1.00E+00 0.01 2E-7 org/L3 For rotavirus 0 0.1 1 x 1 2 5 x 2E-7 org/L4 0.1 1 10 L 0 25 1000 L 2E-7 org/L
5 For rotavirus 1 3 10 x 3 5 7 x 2E-7 org/LSurvival is greater in ground water.
Avg 0.03129 0.630957 2.37144 56.9243Min 0 0.0001 0.001 0 0.01 5
Max 1 3 10 3 30 1000
Wtd Avg. 0.02643 2 3.7908 2log of mean -1.578
Mmbr 1 For Arsenic 0 0.001 x 0.05 30 300 x 50 ug/L2 For Arsenic 1.00E-06 ####### 1.00E+00 0.01 50 ug/L
deviations = +/- 2.6 ug/L.For AWT, mean is 1.3 ug/L
Mean TKN from data for secondary treatment plants is 9.8 mg/L. Two standard deviations = +/- 12.1 mg/L.
Range 0.02 - 14 ug/L in secondary effluent in California. NDMA occurrence may be related to chlorination and to rocket fuel manufacture.
Assume mean of 10 virus/L (range 0.001-1000) in secondary effluent (conservative) based on total virus data of Tanaka, et al. (1998) and Rose and Carnahan
Mean Arsenic from data for secondary treatment plants is
applicable).
Class III Surface Water Standards for predominantly
fresh water (assumed applicable).
Assumed based on State of California Action Level and
ratios of consumption of surface water and drinking
water
Standard assumed based on 2L/d drinking water
consumption, beta-Poisson rotavirus dose-response
(Haas, et al. 1999), and 1E-4 infections/cap-year
MCL regulatory drinking water std.
Page 4
FPL-012-229
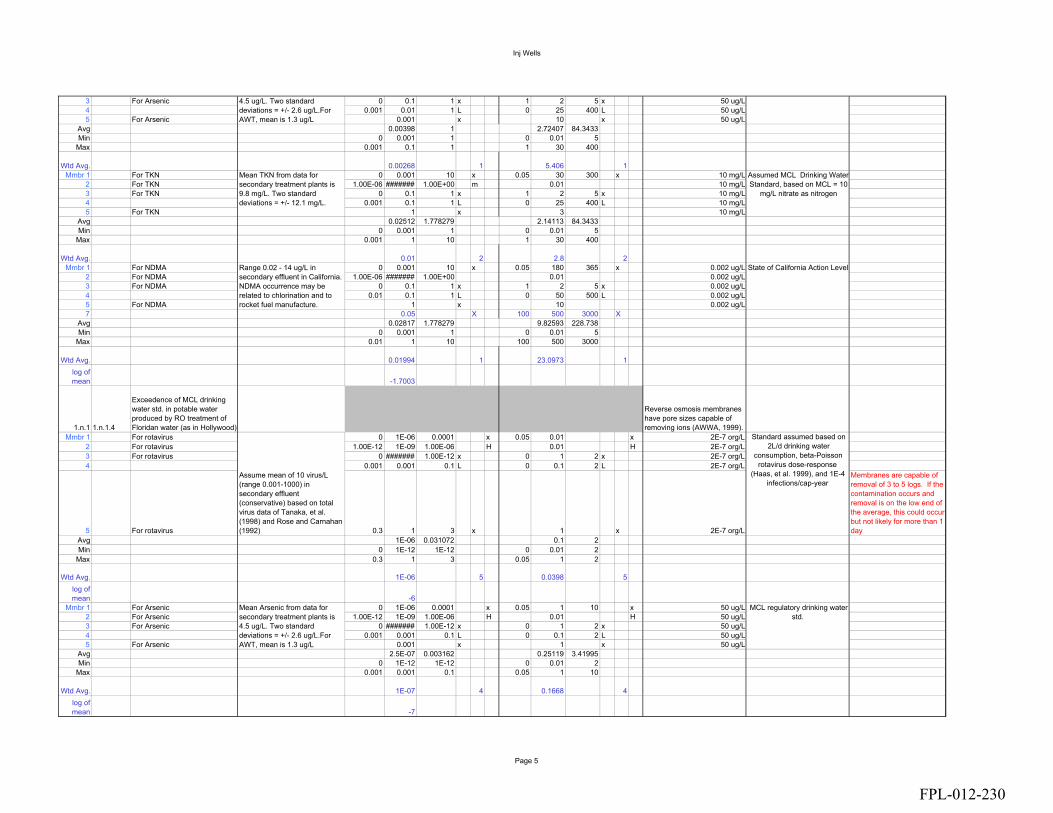
Inj Wells
3 For Arsenic 0 0.1 1 x 1 2 5 x 50 ug/L4 0.001 0.01 1 L 0 25 400 L 50 ug/L5 For Arsenic 0.001 x 10 x 50 ug/L
Avg 0.00398 1 2.72407 84.3433Min 0 0.001 1 0 0.01 5
Max 0.001 0.1 1 1 30 400
Wtd Avg. 0.00268 1 5.406 1Mmbr 1 For TKN 0 0.001 10 x 0.05 30 300 x 10 mg/L
2 For TKN 1.00E-06 ####### 1.00E+00 m 0.01 10 mg/L3 For TKN 0 0.1 1 x 1 2 5 x 10 mg/L4 0.001 0.1 1 L 0 25 400 L 10 mg/L5 For TKN 1 x 3 10 mg/L
Avg 0.02512 1.778279 2.14113 84.3433Min 0 0.001 1 0 0.01 5
Max 0.001 1 10 1 30 400
Wtd Avg. 0.01 2 2.8 2Mmbr 1 For NDMA 0 0.001 10 x 0.05 180 365 x 0.002 ug/L
2 For NDMA 1.00E-06 ####### 1.00E+00 0.01 0.002 ug/L3 For NDMA 0 0.1 1 x 1 2 5 x 0.002 ug/L4 0.01 0.1 1 L 0 50 500 L 0.002 ug/L5 For NDMA 1 x 10 0.002 ug/L7 0.05 X 100 500 3000 X
Avg 0.02817 1.778279 9.82593 228.738Min 0 0.001 1 0 0.01 5
Max 0.01 1 10 100 500 3000
Wtd Avg. 0.01994 1 23.0973 1log of mean -1.7003
1.n.1 1.n.1.4
Exceedence of MCL drinking water std. in potable water produced by RO treatment of Floridan water (as in Hollywood)
Reverse osmosis membranes have pore sizes capable of removing ions (AWWA, 1999).
Mmbr 1 For rotavirus 0 1E-06 0.0001 x 0.05 0.01 x 2E-7 org/L2 For rotavirus 1.00E-12 1E-09 1.00E-06 H 0.01 H 2E-7 org/L3 For rotavirus 0 ####### 1.00E-12 x 0 1 2 x 2E-7 org/L4 0.001 0.001 0.1 L 0 0.1 2 L 2E-7 org/L
5 For rotavirus 0.3 1 3 x 1 x 2E-7 org/L
Membranes are capable of removal of 3 to 5 logs. If the contamination occurs and removal is on the low end of the average, this could occur but not likely for more than 1 day
Avg 1E-06 0.031072 0.1 2Min 0 1E-12 1E-12 0 0.01 2
Max 0.3 1 3 0.05 1 2
Wtd Avg. 1E-06 5 0.0398 5log of mean -6
Mmbr 1 For Arsenic 0 1E-06 0.0001 x 0.05 1 10 x 50 ug/L2 For Arsenic 1.00E-12 1E-09 1.00E-06 H 0.01 H 50 ug/L3 For Arsenic 0 ####### 1.00E-12 x 0 1 2 x 50 ug/L4 0.001 0.001 0.1 L 0 0.1 2 L 50 ug/L5 For Arsenic 0.001 x 1 x 50 ug/L
Avg 2.5E-07 0.003162 0.25119 3.41995Min 0 1E-12 1E-12 0 0.01 2
Max 0.001 0.001 0.1 0.05 1 10
Wtd Avg. 1E-07 4 0.1668 4log of mean -7
4.5 ug/L. Two standard deviations = +/- 2.6 ug/L.For AWT, mean is 1.3 ug/L
Mean TKN from data for secondary treatment plants is 9.8 mg/L. Two standard deviations = +/- 12.1 mg/L.
Range 0.02 - 14 ug/L in secondary effluent in California. NDMA occurrence may be related to chlorination and to rocket fuel manufacture.
Assume mean of 10 virus/L (range 0.001-1000) in secondary effluent (conservative) based on total virus data of Tanaka, et al. (1998) and Rose and Carnahan (1992)
Mean Arsenic from data for secondary treatment plants is 4.5 ug/L. Two standard deviations = +/- 2.6 ug/L.For AWT, mean is 1.3 ug/L
Assumed MCL Drinking Water Standard, based on MCL = 10
mg/L nitrate as nitrogen
State of California Action Level
Standard assumed based on 2L/d drinking water
consumption, beta-Poisson rotavirus dose-response
(Haas, et al. 1999), and 1E-4 infections/cap-year
MCL regulatory drinking water std.
Page 5
FPL-012-230
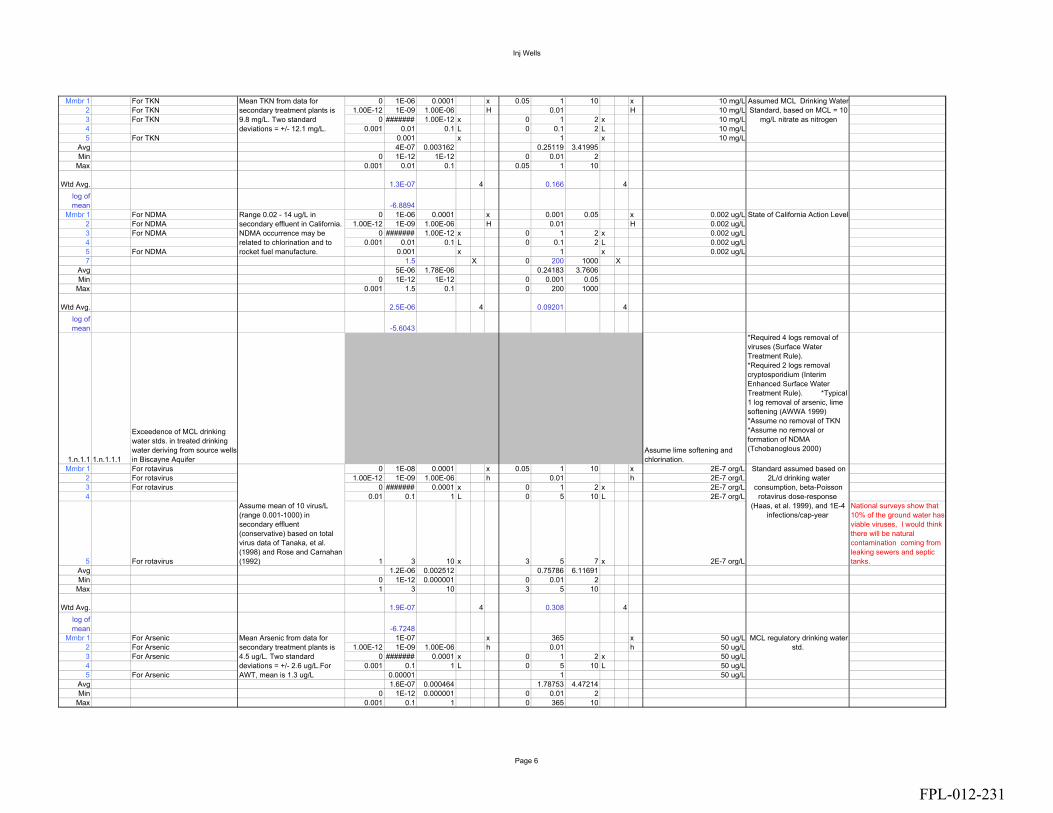
Inj Wells
Mmbr 1 For TKN 0 1E-06 0.0001 x 0.05 1 10 x 10 mg/L2 For TKN 1.00E-12 1E-09 1.00E-06 H 0.01 H 10 mg/L3 For TKN 0 ####### 1.00E-12 x 0 1 2 x 10 mg/L4 0.001 0.01 0.1 L 0 0.1 2 L 10 mg/L5 For TKN 0.001 x 1 x 10 mg/L
Avg 4E-07 0.003162 0.25119 3.41995Min 0 1E-12 1E-12 0 0.01 2
Max 0.001 0.01 0.1 0.05 1 10
Wtd Avg. 1.3E-07 4 0.166 4log of mean -6.8894
Mmbr 1 For NDMA 0 1E-06 0.0001 x 0.001 0.05 x 0.002 ug/L2 For NDMA 1.00E-12 1E-09 1.00E-06 H 0.01 H 0.002 ug/L3 For NDMA 0 ####### 1.00E-12 x 0 1 2 x 0.002 ug/L4 0.001 0.01 0.1 L 0 0.1 2 L 0.002 ug/L5 For NDMA 0.001 x 1 x 0.002 ug/L7 1.5 X 0 200 1000 X
Avg 5E-06 1.78E-06 0.24183 3.7606Min 0 1E-12 1E-12 0 0.001 0.05
Max 0.001 1.5 0.1 0 200 1000
Wtd Avg. 2.5E-06 4 0.09201 4log of mean -5.6043
1.n.1.1 1.n.1.1.1
Exceedence of MCL drinking water stds. in treated drinking water deriving from source wells in Biscayne Aquifer
Assume lime softening and chlorination.
*Required 4 logs removal of viruses (Surface Water Treatment Rule). *Required 2 logs removal cryptosporidium (Interim Enhanced Surface Water Treatment Rule). *Typical 1 log removal of arsenic, lime softening (AWWA 1999) *Assume no removal of TKN *Assume no removal or formation of NDMA (Tchobanoglous 2000)
Mmbr 1 For rotavirus 0 1E-08 0.0001 x 0.05 1 10 x 2E-7 org/L2 For rotavirus 1.00E-12 1E-09 1.00E-06 h 0.01 h 2E-7 org/L3 For rotavirus 0 ####### 0.0001 x 0 1 2 x 2E-7 org/L4 0.01 0.1 1 L 0 5 10 L 2E-7 org/L
5 For rotavirus 1 3 10 x 3 5 7 x 2E-7 org/L
National surveys show that 10% of the ground water has viable viruses, I would think there will be natural contamination coming from leaking sewers and septic tanks.
Avg 1.2E-06 0.002512 0.75786 6.11691Min 0 1E-12 0.000001 0 0.01 2
Max 1 3 10 3 5 10
Wtd Avg. 1.9E-07 4 0.308 4log of mean -6.7248
Mmbr 1 For Arsenic 1E-07 x 365 x 50 ug/L2 For Arsenic 1.00E-12 1E-09 1.00E-06 h 0.01 h 50 ug/L3 For Arsenic 0 ####### 0.0001 x 0 1 2 x 50 ug/L4 0.001 0.1 1 L 0 5 10 L 50 ug/L5 For Arsenic 0.00001 1 50 ug/L
Avg 1.6E-07 0.000464 1.78753 4.47214Min 0 1E-12 0.000001 0 0.01 2
Max 0.001 0.1 1 0 365 10
Standard assumed based on 2L/d drinking water
consumption, beta-Poisson rotavirus dose-response
(Haas, et al. 1999), and 1E-4 infections/cap-year
MCL regulatory drinking water std.
Mean TKN from data for secondary treatment plants is 9.8 mg/L. Two standard deviations = +/- 12.1 mg/L.
Range 0.02 - 14 ug/L in secondary effluent in California. NDMA occurrence may be related to chlorination and to rocket fuel manufacture.
Assume mean of 10 virus/L (range 0.001-1000) in secondary effluent (conservative) based on total virus data of Tanaka, et al. (1998) and Rose and Carnahan (1992)
Mean Arsenic from data for secondary treatment plants is 4.5 ug/L. Two standard deviations = +/- 2.6 ug/L.For AWT, mean is 1.3 ug/L
Assumed MCL Drinking Water Standard, based on MCL = 10
mg/L nitrate as nitrogen
State of California Action Level
Page 6
FPL-012-231

Inj Wells
Wtd Avg. 4.6E-08 4 1.84 4log of mean -7.3335
Mmbr 1 For TKN 1E-07 x 365 x 10 mg/L2 For TKN 1.00E-12 1E-09 1.00E-06 h 0.01 h 10 mg/L3 For TKN 0 ####### 0.0001 x 0 1 2 x 10 mg/L4 0.001 0.1 1 L 0 5 10 L 10 mg/L5 For TKN 0.0001 10 mg/L
Avg 0.001 2.5E-07 1 2.06688 4.47214Min 0 1E-12 0.000001 0 0.01 2
Max 0.001 0.1 1 0 365 10
Wtd Avg. 4.6E-08 4 1.987 5log of mean -7.3335
Mmbr 1 For NDMA 0.0001 x 180 x 0.002 ug/L2 For NDMA 1.00E-12 1E-09 1.00E-06 h 0.01 h 0.002 ug/L3 For NDMA 0 ####### 0.0001 x 0 1 2 x 0.002 ug/L4 0.1 1 10 L 0 25 200 L 0.002 ug/L5 For NDMA 0.0001 x 1 x 0.002 ug/L7 0 0.1 1 100
Avg 0.00001 0.005623 4.06321 20Min 0 1E-12 0.000001 0 0.01 2
Max 0.1 1 10 0 180 200
Wtd Avg. 2.5E-06 4 2.60841 4log of mean -5.6
1.n.1.1 1.n.1.1.2
Exceedence of surface water stds. in canals due to contamination in the Biscayne aquifer by casing leak or migration through Hawthorn
Class III Surface Water Standards for predominantly fresh water
Drainage of Biscayne aquifer water into canals. Assume this drainage happens continually.
Mmbr 1 For rotavirus 1E-08 x 0.05 1 2 x 2E-5 org/L2 For rotavirus 1.00E-12 1E-09 0.000001 m m 2E-5 org/L3 For rotavirus 0 ####### 0.00001 x 0 1 2 x 2E-5 org/L4 0.01 0.1 1 L 0 25 500 L 2E-5 org/L
5 For rotavirus 0.1 0.3 1 x 0.5 1 3 x 2E-5 org/L
dilution and die-off greater in surface waters warmer temperatures would also leadto die-off
Avg 0.17321 0.001778 2.23607 8.80112Min 0 1E-12 0.000001 0 1 2
Max 0.1 0.3 1 0.5 25 500
Wtd Avg. 1.4E-06 3 1.58 4log of mean -5.8665
Mmbr 1 For Arsenic 0 1E-08 0.0001 x 0.05 30 365 x 50 ug/L2 For Arsenic 1.00E-12 1E-09 0.000001 m 0.01 m 50 ug/L3 For Arsenic 0 ####### 0.00001 x 0 1 2 x 50 ug/L4 0.001 0.01 0.1 L 0 25 500 L 50 ug/L
5 For Arsenic 0.001 x 1 x 50 ug/L
don't suppose this would occur, if it did there could be much more persistance, but likely accumulate in the sediments.
Avg 1.6E-07 0.0001 1.49628 71.4657Min 0 1E-12 0.000001 0 0.01 2
Max 0.001 0.01 0.1 0.05 30 500
Standard assumed based on consumption of 8 L/year, swimming, golfing, and consuming irrigated food (Tanaka et al. 1998), beta-Poisson rotavirus dose response (Haas et al. 1999), and 1E-4 infections/cap-year (EPA Surface Water Treatment Rule)
Class III Surface Water Standards for predominantly fresh water (assumed applicable).
Assumed MCL Drinking Water Standard, based on MCL = 10
mg/L nitrate as nitrogen
State of California Action Level
Mean TKN from data for secondary treatment plants is 9.8 mg/L. Two standard deviations = +/- 12.1 mg/L.
Range 0.02 - 14 ug/L in secondary effluent in California. NDMA occurrence may be related to chlorination and to rocket fuel manufacture.
Assume mean of 10 virus/L (range 0.001-1000) in secondary effluent (conservative) based on total virus data of Tanaka, et al. (1998) and Rose and Carnahan (1992)
Mean Arsenic from data for secondary treatment plants is 4.5 ug/L. Two standard deviations = +/- 2.6 ug/L.For AWT, mean is 1.3 ug/L
Page 7
FPL-012-232

Inj Wells
Wtd Avg. 7.2E-08 2 1.69 3log of mean -7.1429
Mmbr 1 For TKN 0 1E-08 0.0001 x 0.05 30 365 x 3 mg/L 2 For TKN 1.00E-12 1E-09 0.000001 m 0.01 m 3 mg/L 3 For TKN 0 ####### 0.00001 x 0 1 2 x 3 mg/L 4 0.001 0.01 0.1 L 0 25 500 L 3 mg/L 5 For TKN 0.0001 x 1 3 mg/L dilution likely to keep it low.
Avg 1E-07 0.0001 1.49628 71.4657Min 0 1E-12 0.000001 0 0.01 2
Max 0.001 0.01 0.1 0.05 30 500
Wtd Avg. 5.2E-08 2 1.69 3log of mean -7.2858
Mmbr 1 For NDMA 0 0.00001 0.0001 x 0.05 30 365 x 2 ug/L2 For NDMA 1.00E-12 1E-09 0.000001 m 0.01 m 2 ug/L3 For NDMA 0 ####### 0.00001 x 0 1 2 x 2 ug/L4 0.01 0.1 1 L 0 25 500 L 2 ug/L
5 For NDMA 0.0001 x 0.5 2 ug/L
don't feel much confidence about the persistence of this compound in surface waters
7 0 0.05 1 100Avg 4.1E-06 0.001 2.68538 71.4657Min 0 1E-12 0.000001 0 0.01 2
Max 0.01 0.1 1 0.05 100 500
Wtd Avg. 5.2E-06 2 4.90947 3log of mean -5.2876
1.n.1.2 1.n.1.2.1
Exceedence of surface water stds. in canals due to discharge of non-potable ASR water to canals
Class III Surface Water Standards for predominantly fresh water
Non-potable ASR water is discharged directly to canals. Assume no dilution. When ASRmonitoring system detects elevated salinity, withdrawals from ASR wells should stop.
Mmbr 1 For rotavirus 0 0.0001 10 x 0.05 30 60 x 2E-5 org/L2 For rotavirus 0.1 1 10 m 10 24.4949 60 m 2E-5 org/L3 For rotavirus 0 0.1 1 x 0 1 2 x 2E-5 org/L4 0.01 0.1 1 L 0 25 500 L 2E-5 org/L
5 For rotavirus 1 10 30 X 1 3 5 X 2E-5 org/L
Much more likely that viruses will be detected, however survival will be lower.
Avg 0.1 4.959344 8.8767 28.2523Min 0 0.0001 1 0 1 2
Max 1 10 30 10 30 500
Wtd Avg. 0.1 3 11.55 4log of mean -1
Mmbr 1 For Arsenic 0 0.003 x 0.05 0.1 1 x 50 ug/L2 For Arsenic 0.1 1 10 m 10 24.4949 60 m 50 ug/L3 For Arsenic 0 0.1 1 x 0 1 2 x 50 ug/L4 0.001 0.01 0.1 L 0 25 400 L 50 ug/L
5 For Arsenic 1 x 10 x 50 ug/Lless dilution, more arsenic found in natural waters
Avg 0.0786 1 3.60913 14.8017Min 0 0.003 0.1 0 0.1 1
Max 0.1 1 10 10 25 400
Standard assumed based on consumption of 8 L/year, swimming, golfing, and
consuming irrigated food (Tanaka et al. 1998), beta-
Poisson rotavirus dose response (Haas et al. 1999), and 1E-4 infections/cap-year
(EPA Surface Water
Class III Surface Water Standards for predominantly
fresh water (assumed applicable).
Class III Surface Water Standards for predominantly fresh water (assumed applicable).
Assumed based on State of California Action Level and ratios of consumption of surface water and drinking water
Mean TKN from data for secondary treatment plants is 9.8 mg/L. Two standard deviations = +/- 12.1 mg/L.
Range 0.02 - 14 ug/L in secondary effluent in California. NDMA occurrence may be related to chlorination and to rocket fuel manufacture.
Assume mean of 10 virus/L (range 0.001-1000) in secondary effluent (conservative) based on total virus data of Tanaka, et al. (1998) and Rose and Carnahan (1992)
Mean Arsenic from data for secondary treatment plants is 4.5 ug/L. Two standard deviations = +/- 2.6 ug/L.For AWT, mean is 1.3 ug/L
Page 8
FPL-012-233
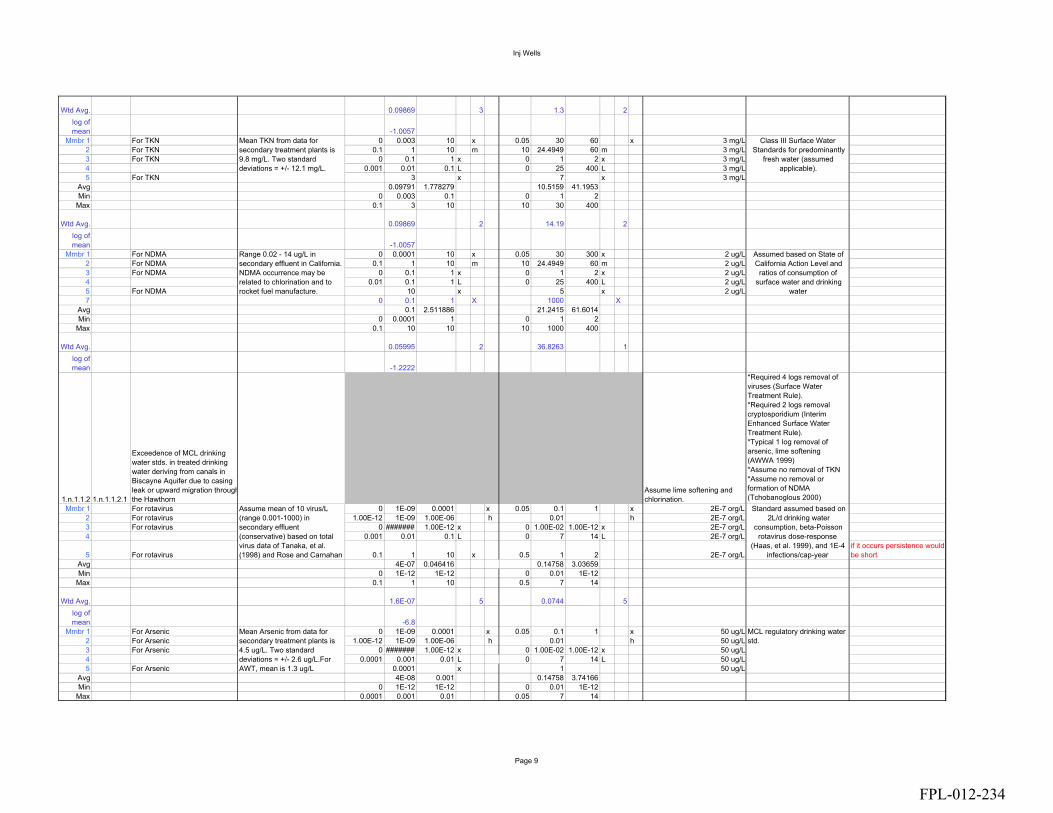
Inj Wells
Wtd Avg. 0.09869 3 1.3 2log of mean -1.0057
Mmbr 1 For TKN 0 0.003 10 x 0.05 30 60 x 3 mg/L 2 For TKN 0.1 1 10 m 10 24.4949 60 m 3 mg/L 3 For TKN 0 0.1 1 x 0 1 2 x 3 mg/L 4 0.001 0.01 0.1 L 0 25 400 L 3 mg/L 5 For TKN 3 x 7 x 3 mg/L
Avg 0.09791 1.778279 10.5159 41.1953Min 0 0.003 0.1 0 1 2
Max 0.1 3 10 10 30 400
Wtd Avg. 0.09869 2 14.19 2log of mean -1.0057
Mmbr 1 For NDMA 0 0.0001 10 x 0.05 30 300 x 2 ug/L2 For NDMA 0.1 1 10 m 10 24.4949 60 m 2 ug/L3 For NDMA 0 0.1 1 x 0 1 2 x 2 ug/L4 0.01 0.1 1 L 0 25 400 L 2 ug/L5 For NDMA 10 x 5 x 2 ug/L7 0 0.1 1 X 1000 X
Avg 0.1 2.511886 21.2415 61.6014Min 0 0.0001 1 0 1 2
Max 0.1 10 10 10 1000 400
Wtd Avg. 0.05995 2 36.8263 1log of mean -1.2222
1.n.1.1.2 1.n.1.1.2.1
Exceedence of MCL drinking water stds. in treated drinking water deriving from canals in Biscayne Aquifer due to casing leak or upward migration throughthe Hawthorn
Assume lime softening and chlorination.
*Required 4 logs removal of viruses (Surface Water Treatment Rule). *Required 2 logs removal cryptosporidium (Interim Enhanced Surface Water Treatment Rule). *Typical 1 log removal of arsenic, lime softening (AWWA 1999) *Assume no removal of TKN *Assume no removal or formation of NDMA (Tchobanoglous 2000)
Mmbr 1 For rotavirus 0 1E-09 0.0001 x 0.05 0.1 1 x 2E-7 org/L2 For rotavirus 1.00E-12 1E-09 1.00E-06 h 0.01 h 2E-7 org/L3 For rotavirus 0 ####### 1.00E-12 x 0 1.00E-02 1.00E-12 x 2E-7 org/L4 0.001 0.01 0.1 L 0 7 14 L 2E-7 org/L
5 For rotavirus 0.1 1 10 x 0.5 1 2 2E-7 org/Lif it occurs persistence would be short
Avg 4E-07 0.046416 0.14758 3.03659Min 0 1E-12 1E-12 0 0.01 1E-12
Max 0.1 1 10 0.5 7 14
Wtd Avg. 1.6E-07 5 0.0744 5log of mean -6.8
Mmbr 1 For Arsenic 0 1E-09 0.0001 x 0.05 0.1 1 x 50 ug/L2 For Arsenic 1.00E-12 1E-09 1.00E-06 h 0.01 h 50 ug/L3 For Arsenic 0 ####### 1.00E-12 x 0 1.00E-02 1.00E-12 x 50 ug/L4 0.0001 0.001 0.01 L 0 7 14 L 50 ug/L5 For Arsenic 0.0001 x 1 50 ug/L
Avg 4E-08 0.001 0.14758 3.74166Min 0 1E-12 1E-12 0 0.01 1E-12
Max 0.0001 0.001 0.01 0.05 7 14
Standard assumed based on 2L/d drinking water
consumption, beta-Poisson rotavirus dose-response
(Haas, et al. 1999), and 1E-4 infections/cap-year
MCL regulatory drinking water std.
Class III Surface Water Standards for predominantly
fresh water (assumed applicable).
Assumed based on State of California Action Level and
ratios of consumption of surface water and drinking
water
Mean TKN from data for secondary treatment plants is 9.8 mg/L. Two standard deviations = +/- 12.1 mg/L.
Range 0.02 - 14 ug/L in secondary effluent in California. NDMA occurrence may be related to chlorination and to rocket fuel manufacture.
Assume mean of 10 virus/L (range 0.001-1000) in secondary effluent (conservative) based on total virus data of Tanaka, et al. (1998) and Rose and Carnahan
Mean Arsenic from data for secondary treatment plants is 4.5 ug/L. Two standard deviations = +/- 2.6 ug/L.For AWT, mean is 1.3 ug/L
Page 9
FPL-012-234
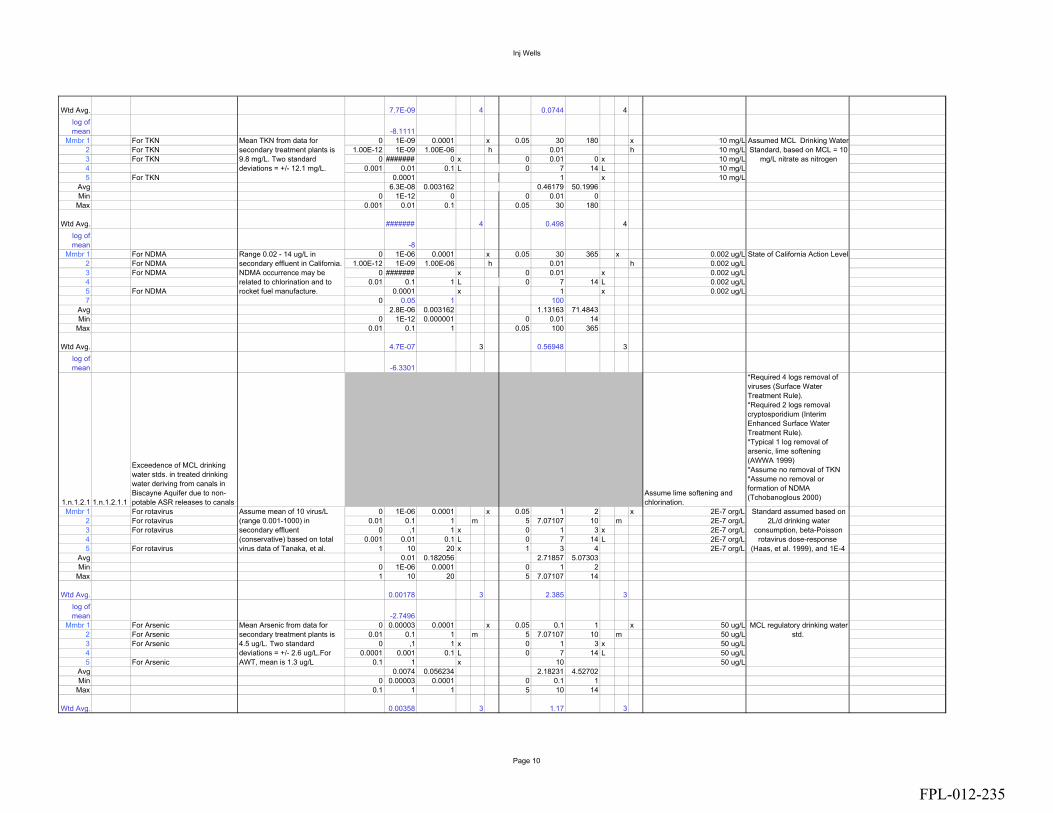
Inj Wells
Wtd Avg. 7.7E-09 4 0.0744 4log of mean -8.1111
Mmbr 1 For TKN 0 1E-09 0.0001 x 0.05 30 180 x 10 mg/L2 For TKN 1.00E-12 1E-09 1.00E-06 h 0.01 h 10 mg/L3 For TKN 0 ####### 0 x 0 0.01 0 x 10 mg/L4 0.001 0.01 0.1 L 0 7 14 L 10 mg/L5 For TKN 0.0001 1 x 10 mg/L
Avg 6.3E-08 0.003162 0.46179 50.1996Min 0 1E-12 0 0 0.01 0
Max 0.001 0.01 0.1 0.05 30 180
Wtd Avg. ####### 4 0.498 4log of mean -8
Mmbr 1 For NDMA 0 1E-06 0.0001 x 0.05 30 365 x 0.002 ug/L2 For NDMA 1.00E-12 1E-09 1.00E-06 h 0.01 h 0.002 ug/L3 For NDMA 0 ####### x 0 0.01 x 0.002 ug/L4 0.01 0.1 1 L 0 7 14 L 0.002 ug/L5 For NDMA 0.0001 x 1 x 0.002 ug/L7 0 0.05 1 100
Avg 2.8E-06 0.003162 1.13163 71.4843Min 0 1E-12 0.000001 0 0.01 14
Max 0.01 0.1 1 0.05 100 365
Wtd Avg. 4.7E-07 3 0.56948 3log of mean -6.3301
1.n.1.2.1 1.n.1.2.1.1
Exceedence of MCL drinking water stds. in treated drinking water deriving from canals in Biscayne Aquifer due to non-potable ASR releases to canals
Assume lime softening and chlorination.
*Required 4 logs removal of viruses (Surface Water Treatment Rule). *Required 2 logs removal cryptosporidium (Interim Enhanced Surface Water Treatment Rule). *Typical 1 log removal of arsenic, lime softening (AWWA 1999) *Assume no removal of TKN *Assume no removal or formation of NDMA (Tchobanoglous 2000)
Mmbr 1 For rotavirus 0 1E-06 0.0001 x 0.05 1 2 x 2E-7 org/L2 For rotavirus 0.01 0.1 1 m 5 7.07107 10 m 2E-7 org/L3 For rotavirus 0 ,1 1 x 0 1 3 x 2E-7 org/L4 0.001 0.01 0.1 L 0 7 14 L 2E-7 org/L5 For rotavirus 1 10 20 x 1 3 4 2E-7 org/L
Avg 0.01 0.182056 2.71857 5.07303Min 0 1E-06 0.0001 0 1 2
Max 1 10 20 5 7.07107 14
Wtd Avg. 0.00178 3 2.385 3log of mean -2.7496
Mmbr 1 For Arsenic 0 0.00003 0.0001 x 0.05 0.1 1 x 50 ug/L2 For Arsenic 0.01 0.1 1 m 5 7.07107 10 m 50 ug/L3 For Arsenic 0 ,1 1 x 0 1 3 x 50 ug/L4 0.0001 0.001 0.1 L 0 7 14 L 50 ug/L5 For Arsenic 0.1 1 x 10 50 ug/L
Avg 0.0074 0.056234 2.18231 4.52702Min 0 0.00003 0.0001 0 0.1 1
Max 0.1 1 1 5 10 14
Wtd Avg. 0.00358 3 1.17 3
Standard assumed based on 2L/d drinking water
consumption, beta-Poisson rotavirus dose-response
(Haas, et al. 1999), and 1E-4
MCL regulatory drinking water std.
Assumed MCL Drinking Water Standard, based on MCL = 10
mg/L nitrate as nitrogen
State of California Action Level
Mean TKN from data for secondary treatment plants is 9.8 mg/L. Two standard deviations = +/- 12.1 mg/L.
Range 0.02 - 14 ug/L in secondary effluent in California. NDMA occurrence may be related to chlorination and to rocket fuel manufacture.
Assume mean of 10 virus/L (range 0.001-1000) in secondary effluent (conservative) based on total virus data of Tanaka, et al.
Mean Arsenic from data for secondary treatment plants is 4.5 ug/L. Two standard deviations = +/- 2.6 ug/L.For AWT, mean is 1.3 ug/L
Page 10
FPL-012-235
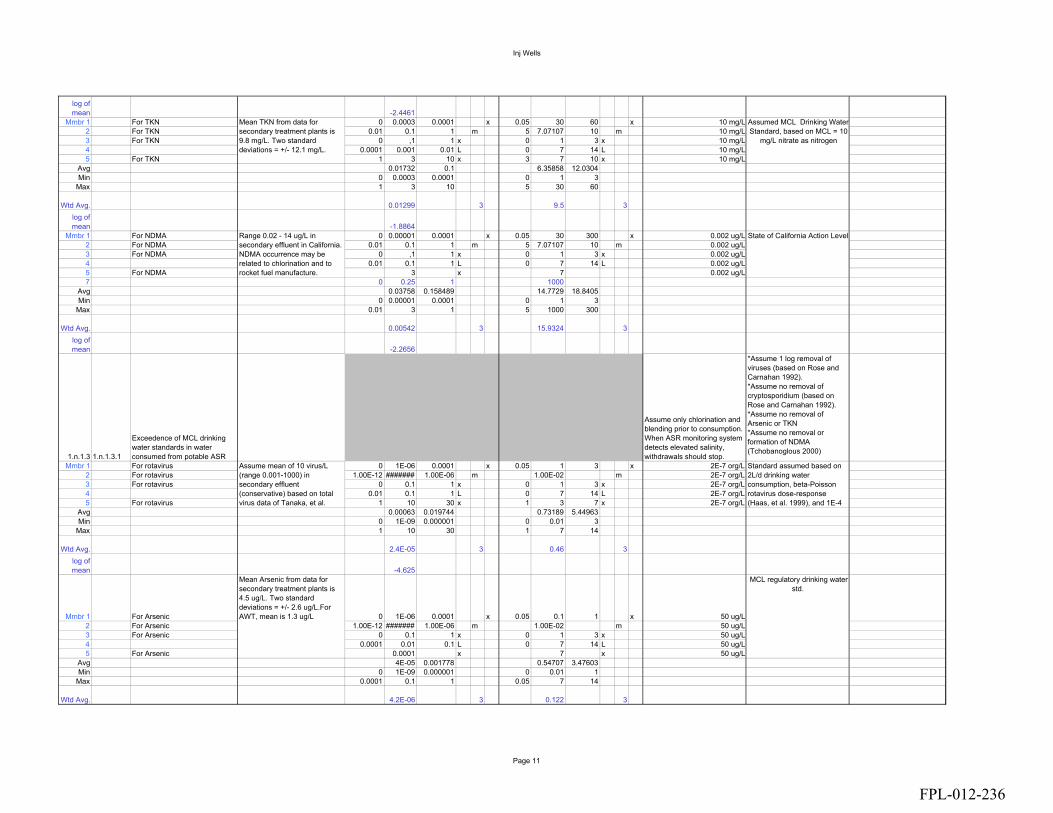
Inj Wells
log of mean -2.4461
Mmbr 1 For TKN 0 0.0003 0.0001 x 0.05 30 60 x 10 mg/L2 For TKN 0.01 0.1 1 m 5 7.07107 10 m 10 mg/L3 For TKN 0 ,1 1 x 0 1 3 x 10 mg/L4 0.0001 0.001 0.01 L 0 7 14 L 10 mg/L5 For TKN 1 3 10 x 3 7 10 x 10 mg/L
Avg 0.01732 0.1 6.35858 12.0304Min 0 0.0003 0.0001 0 1 3
Max 1 3 10 5 30 60
Wtd Avg. 0.01299 3 9.5 3log of mean -1.8864
Mmbr 1 For NDMA 0 0.00001 0.0001 x 0.05 30 300 x 0.002 ug/L2 For NDMA 0.01 0.1 1 m 5 7.07107 10 m 0.002 ug/L3 For NDMA 0 ,1 1 x 0 1 3 x 0.002 ug/L4 0.01 0.1 1 L 0 7 14 L 0.002 ug/L5 For NDMA 3 x 7 0.002 ug/L7 0 0.25 1 1000
Avg 0.03758 0.158489 14.7729 18.8405Min 0 0.00001 0.0001 0 1 3
Max 0.01 3 1 5 1000 300
Wtd Avg. 0.00542 3 15.9324 3log of mean -2.2656
1.n.1.3 1.n.1.3.1
Exceedence of MCL drinking water standards in water consumed from potable ASR
Assume only chlorination and blending prior to consumption. When ASR monitoring system detects elevated salinity, withdrawals should stop.
*Assume 1 log removal of viruses (based on Rose and Carnahan 1992). *Assume no removal of cryptosporidium (based on Rose and Carnahan 1992). *Assume no removal of Arsenic or TKN *Assume no removal or formation of NDMA (Tchobanoglous 2000)
Mmbr 1 For rotavirus 0 1E-06 0.0001 x 0.05 1 3 x 2E-7 org/L2 For rotavirus 1.00E-12 ####### 1.00E-06 m 1.00E-02 m 2E-7 org/L3 For rotavirus 0 0.1 1 x 0 1 3 x 2E-7 org/L4 0.01 0.1 1 L 0 7 14 L 2E-7 org/L5 For rotavirus 1 10 30 x 1 3 7 x 2E-7 org/L
Avg 0.00063 0.019744 0.73189 5.44963Min 0 1E-09 0.000001 0 0.01 3
Max 1 10 30 1 7 14
Wtd Avg. 2.4E-05 3 0.46 3log of mean -4.625
Mmbr 1 For Arsenic 0 1E-06 0.0001 x 0.05 0.1 1 x 50 ug/L2 For Arsenic 1.00E-12 ####### 1.00E-06 m 1.00E-02 m 50 ug/L3 For Arsenic 0 0.1 1 x 0 1 3 x 50 ug/L4 0.0001 0.01 0.1 L 0 7 14 L 50 ug/L5 For Arsenic 0.0001 x 7 x 50 ug/L
Avg 4E-05 0.001778 0.54707 3.47603Min 0 1E-09 0.000001 0 0.01 1
Max 0.0001 0.1 1 0.05 7 14
Wtd Avg. 4.2E-06 3 0.122 3
Standard assumed based on 2L/d drinking water consumption, beta-Poisson rotavirus dose-response (Haas, et al. 1999), and 1E-4
MCL regulatory drinking water std.
Assumed MCL Drinking Water Standard, based on MCL = 10
mg/L nitrate as nitrogen
State of California Action Level
Mean TKN from data for secondary treatment plants is 9.8 mg/L. Two standard deviations = +/- 12.1 mg/L.
Range 0.02 - 14 ug/L in secondary effluent in California. NDMA occurrence may be related to chlorination and to rocket fuel manufacture.
Assume mean of 10 virus/L (range 0.001-1000) in secondary effluent (conservative) based on total virus data of Tanaka, et al.
Mean Arsenic from data for secondary treatment plants is 4.5 ug/L. Two standard deviations = +/- 2.6 ug/L.For AWT, mean is 1.3 ug/L
Page 11
FPL-012-236
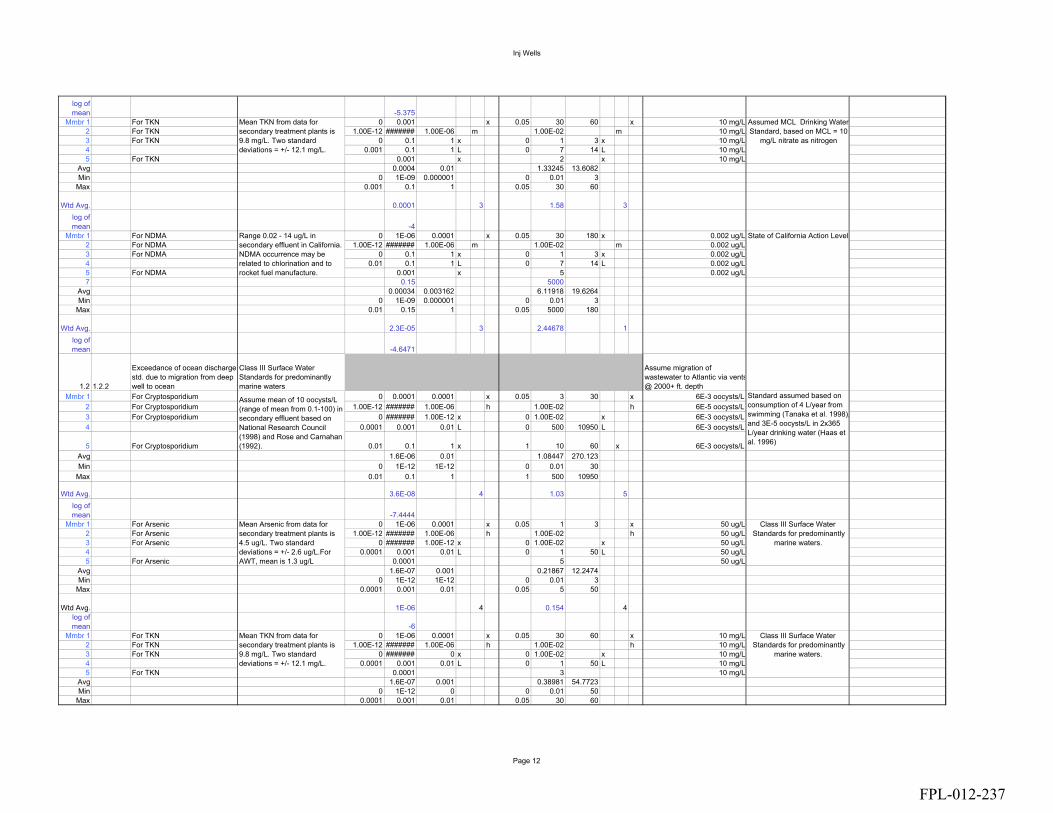
Inj Wells
log of mean -5.375
Mmbr 1 For TKN 0 0.001 x 0.05 30 60 x 10 mg/L2 For TKN 1.00E-12 ####### 1.00E-06 m 1.00E-02 m 10 mg/L3 For TKN 0 0.1 1 x 0 1 3 x 10 mg/L4 0.001 0.1 1 L 0 7 14 L 10 mg/L5 For TKN 0.001 x 2 x 10 mg/L
Avg 0.0004 0.01 1.33245 13.6082Min 0 1E-09 0.000001 0 0.01 3
Max 0.001 0.1 1 0.05 30 60
Wtd Avg. 0.0001 3 1.58 3log of mean -4
Mmbr 1 For NDMA 0 1E-06 0.0001 x 0.05 30 180 x 0.002 ug/L2 For NDMA 1.00E-12 ####### 1.00E-06 m 1.00E-02 m 0.002 ug/L3 For NDMA 0 0.1 1 x 0 1 3 x 0.002 ug/L4 0.01 0.1 1 L 0 7 14 L 0.002 ug/L5 For NDMA 0.001 x 5 0.002 ug/L7 0.15 5000
Avg 0.00034 0.003162 6.11918 19.6264Min 0 1E-09 0.000001 0 0.01 3
Max 0.01 0.15 1 0.05 5000 180
Wtd Avg. 2.3E-05 3 2.44678 1log of mean -4.6471
1.2 1.2.2
Exceedance of ocean discharge std. due to migration from deep well to ocean
Class III Surface Water Standards for predominantly marine waters
Assume migration of wastewater to Atlantic via vents@ 2000+ ft. depth
Mmbr 1 For Cryptosporidium 0 0.0001 0.0001 x 0.05 3 30 x 6E-3 oocysts/L2 For Cryptosporidium 1.00E-12 ####### 1.00E-06 h 1.00E-02 h 6E-5 oocysts/L3 For Cryptosporidium 0 ####### 1.00E-12 x 0 1.00E-02 x 6E-3 oocysts/L4 0.0001 0.001 0.01 L 0 500 10950 L 6E-3 oocysts/L
5 For Cryptosporidium 0.01 0.1 1 x 1 10 60 x 6E-3 oocysts/LAvg 1.6E-06 0.01 1.08447 270.123Min 0 1E-12 1E-12 0 0.01 30
Max 0.01 0.1 1 1 500 10950
Wtd Avg. 3.6E-08 4 1.03 5log of mean -7.4444
Mmbr 1 For Arsenic 0 1E-06 0.0001 x 0.05 1 3 x 50 ug/L2 For Arsenic 1.00E-12 ####### 1.00E-06 h 1.00E-02 h 50 ug/L3 For Arsenic 0 ####### 1.00E-12 x 0 1.00E-02 x 50 ug/L4 0.0001 0.001 0.01 L 0 1 50 L 50 ug/L5 For Arsenic 0.0001 5 50 ug/L
Avg 1.6E-07 0.001 0.21867 12.2474Min 0 1E-12 1E-12 0 0.01 3
Max 0.0001 0.001 0.01 0.05 5 50
Wtd Avg. 1E-06 4 0.154 4log of mean -6
Mmbr 1 For TKN 0 1E-06 0.0001 x 0.05 30 60 x 10 mg/L 2 For TKN 1.00E-12 ####### 1.00E-06 h 1.00E-02 h 10 mg/L 3 For TKN 0 ####### 0 x 0 1.00E-02 x 10 mg/L 4 0.0001 0.001 0.01 L 0 1 50 L 10 mg/L 5 For TKN 0.0001 3 10 mg/L
Avg 1.6E-07 0.001 0.38981 54.7723Min 0 1E-12 0 0 0.01 50
Max 0.0001 0.001 0.01 0.05 30 60
Standard assumed based on consumption of 4 L/year from swimming (Tanaka et al. 1998),and 3E-5 oocysts/L in 2x365 L/year drinking water (Haas et al. 1996)
Class III Surface Water Standards for predominantly
marine waters.
Class III Surface Water Standards for predominantly
marine waters.
Assumed MCL Drinking Water Standard, based on MCL = 10
mg/L nitrate as nitrogen
State of California Action Level
Mean TKN from data for secondary treatment plants is 9.8 mg/L. Two standard deviations = +/- 12.1 mg/L.
Range 0.02 - 14 ug/L in secondary effluent in California. NDMA occurrence may be related to chlorination and to rocket fuel manufacture.
Assume mean of 10 oocysts/L (range of mean from 0.1-100) in secondary effluent based on National Research Council (1998) and Rose and Carnahan (1992).
Mean Arsenic from data for secondary treatment plants is 4.5 ug/L. Two standard deviations = +/- 2.6 ug/L.For AWT, mean is 1.3 ug/L
Mean TKN from data for secondary treatment plants is 9.8 mg/L. Two standard deviations = +/- 12.1 mg/L.
Page 12
FPL-012-237
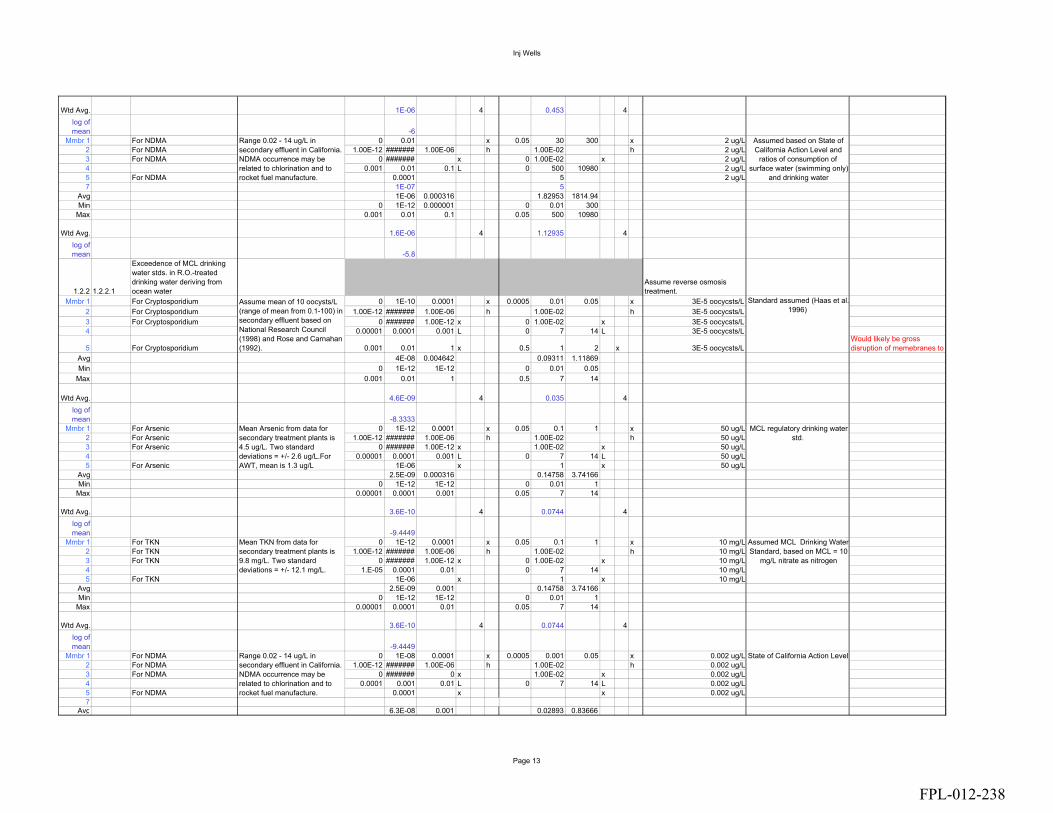
Inj Wells
Wtd Avg. 1E-06 4 0.453 4log of mean -6
Mmbr 1 For NDMA 0 0.01 x 0.05 30 300 x 2 ug/L2 For NDMA 1.00E-12 ####### 1.00E-06 h 1.00E-02 h 2 ug/L3 For NDMA 0 ####### x 0 1.00E-02 x 2 ug/L4 0.001 0.01 0.1 L 0 500 10980 2 ug/L5 For NDMA 0.0001 5 2 ug/L7 1E-07 5
Avg 1E-06 0.000316 1.82953 1814.94Min 0 1E-12 0.000001 0 0.01 300
Max 0.001 0.01 0.1 0.05 500 10980
Wtd Avg. 1.6E-06 4 1.12935 4log of mean -5.8
1.2.2 1.2.2.1
Exceedence of MCL drinking water stds. in R.O.-treated drinking water deriving from ocean water
Assume reverse osmosis treatment.
Mmbr 1 For Cryptosporidium 0 1E-10 0.0001 x 0.0005 0.01 0.05 x 3E-5 oocycsts/L2 For Cryptosporidium 1.00E-12 ####### 1.00E-06 h 1.00E-02 h 3E-5 oocycsts/L3 For Cryptosporidium 0 ####### 1.00E-12 x 0 1.00E-02 x 3E-5 oocycsts/L4 0.00001 0.0001 0.001 L 0 7 14 L 3E-5 oocycsts/L
5 For Cryptosporidium 0.001 0.01 1 x 0.5 1 2 x 3E-5 oocycsts/LWould likely be gross disruption of memebranes to
Avg 4E-08 0.004642 0.09311 1.11869Min 0 1E-12 1E-12 0 0.01 0.05
Max 0.001 0.01 1 0.5 7 14
Wtd Avg. 4.6E-09 4 0.035 4log of mean -8.3333
Mmbr 1 For Arsenic 0 1E-12 0.0001 x 0.05 0.1 1 x 50 ug/L2 For Arsenic 1.00E-12 ####### 1.00E-06 h 1.00E-02 h 50 ug/L3 For Arsenic 0 ####### 1.00E-12 x 1.00E-02 x 50 ug/L4 0.00001 0.0001 0.001 L 0 7 14 L 50 ug/L5 For Arsenic 1E-06 x 1 x 50 ug/L
Avg 2.5E-09 0.000316 0.14758 3.74166Min 0 1E-12 1E-12 0 0.01 1
Max 0.00001 0.0001 0.001 0.05 7 14
Wtd Avg. 3.6E-10 4 0.0744 4log of mean -9.4449
Mmbr 1 For TKN 0 1E-12 0.0001 x 0.05 0.1 1 x 10 mg/L2 For TKN 1.00E-12 ####### 1.00E-06 h 1.00E-02 h 10 mg/L3 For TKN 0 ####### 1.00E-12 x 0 1.00E-02 x 10 mg/L4 1.E-05 0.0001 0.01 0 7 14 10 mg/L5 For TKN 1E-06 x 1 x 10 mg/L
Avg 2.5E-09 0.001 0.14758 3.74166Min 0 1E-12 1E-12 0 0.01 1
Max 0.00001 0.0001 0.01 0.05 7 14
Wtd Avg. 3.6E-10 4 0.0744 4log of mean -9.4449
Mmbr 1 For NDMA 0 1E-08 0.0001 x 0.0005 0.001 0.05 x 0.002 ug/L2 For NDMA 1.00E-12 ####### 1.00E-06 h 1.00E-02 h 0.002 ug/L3 For NDMA 0 ####### 0 x 1.00E-02 x 0.002 ug/L4 0.0001 0.001 0.01 L 0 7 14 L 0.002 ug/L5 For NDMA 0.0001 x x 0.002 ug/L7
Avg 6.3E-08 0.001 0.02893 0.83666
Standard assumed (Haas et al.1996)
MCL regulatory drinking water std.
State of California Action Level
Assumed MCL Drinking Water Standard, based on MCL = 10
mg/L nitrate as nitrogen
Assumed based on State of California Action Level and
ratios of consumption of surface water (swimming only)
and drinking water
Assume mean of 10 oocysts/L (range of mean from 0.1-100) in secondary effluent based on National Research Council (1998) and Rose and Carnahan (1992).
Mean Arsenic from data for secondary treatment plants is 4.5 ug/L. Two standard deviations = +/- 2.6 ug/L.For AWT, mean is 1.3 ug/L
Mean TKN from data for secondary treatment plants is 9.8 mg/L. Two standard deviations = +/- 12.1 mg/L.
Range 0.02 - 14 ug/L in secondary effluent in California. NDMA occurrence may be related to chlorination and to rocket fuel manufacture.
Range 0.02 - 14 ug/L in secondary effluent in California. NDMA occurrence may be related to chlorination and to rocket fuel manufacture.
Page 13
FPL-012-238

Inj Wells
Min 0 1E-12 0 0 0.001 0.05Max 0.0001 0.001 0.01 0.0005 7 14
Wtd Avg. 1.7E-08 4 0.00956 4log of mean -7.7778
Page 14
FPL-012-239
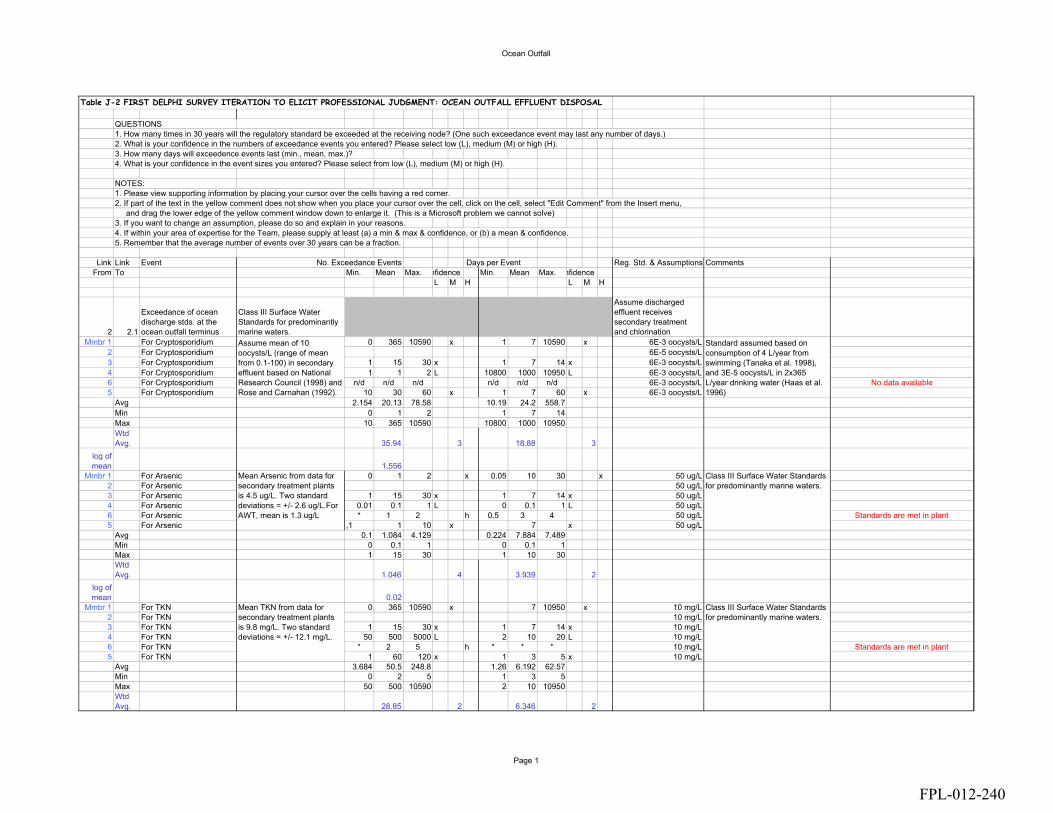
Ocean Outfall
Table J-2 FIRST DELPHI SURVEY ITERATION TO ELICIT PROFESSIONAL JUDGMENT: OCEAN OUTFALL EFFLUENT DISPOSAL
QUESTIONS1. How many times in 30 years will the regulatory standard be exceeded at the receiving node? (One such exceedance event may last any number of days.)2. What is your confidence in the numbers of exceedance events you entered? Please select low (L), medium (M) or high (H).3. How many days will exceedence events last (min., mean, max.)? 4. What is your confidence in the event sizes you entered? Please select from low (L), medium (M) or high (H).
NOTES:1. Please view supporting information by placing your cursor over the cells having a red corner.2. If part of the text in the yellow comment does not show when you place your cursor over the cell, click on the cell, select "Edit Comment" from the Insert menu, and drag the lower edge of the yellow comment window down to enlarge it. (This is a Microsoft problem we cannot solve)3. If you want to change an assumption, please do so and explain in your reasons.4. If within your area of expertise for the Team, please supply at least (a) a min & max & confidence, or (b) a mean & confidence.5. Remember that the average number of events over 30 years can be a fraction.
Link Link Event No. Exceedance Events Days per Event Reg. Std. & Assumptions CommentsFrom To Min. Mean Max. nfidence Min. Mean Max. nfidence
L M H L M H
2 2.1
Exceedance of ocean discharge stds. at the ocean outfall terminus
Class III Surface Water Standards for predominantly marine waters.
Assume discharged effluent receives secondary treatment and chlorination
Mmbr 1 For Cryptosporidium 0 365 10590 x 1 7 10590 x 6E-3 oocysts/L2 For Cryptosporidium 6E-5 oocysts/L3 For Cryptosporidium 1 15 30 x 1 7 14 x 6E-3 oocysts/L4 For Cryptosporidium 1 1 2 L 10800 1000 10950 L 6E-3 oocysts/L6 For Cryptosporidium n/d n/d n/d n/d n/d n/d 6E-3 oocysts/L No data available5 For Cryptosporidium 10 30 60 x 1 7 60 x 6E-3 oocysts/L
Avg 2.154 20.13 78.58 10.19 24.2 558.7Min 0 1 2 1 7 14Max 10 365 10590 10800 1000 10950Wtd Avg. 35.94 3 18.88 3
log of mean 1.556
Mmbr 1 For Arsenic 0 1 2 x 0.05 10 30 x 50 ug/L2 For Arsenic 50 ug/L3 For Arsenic 1 15 30 x 1 7 14 x 50 ug/L4 For Arsenic 0.01 0.1 1 L 0 0.1 1 L 50 ug/L6 For Arsenic * 1 2 h 0.5 3 4 50 ug/L Standards are met in plant5 For Arsenic ,1 1 10 x 7 x 50 ug/L
Avg 0.1 1.084 4.129 0.224 7.884 7.489Min 0 0.1 1 0 0.1 1Max 1 15 30 1 10 30Wtd Avg. 1.046 4 3.939 2
log of mean 0.02
Mmbr 1 For TKN 0 365 10590 x 7 10950 x 10 mg/L 2 For TKN 10 mg/L 3 For TKN 1 15 30 x 1 7 14 x 10 mg/L 4 For TKN 50 500 5000 L 2 10 20 L 10 mg/L 6 For TKN * 2 5 h * * * 10 mg/L Standards are met in plant5 For TKN 1 60 120 x 1 3 5 x 10 mg/L
Avg 3.684 50.5 248.8 1.26 6.192 62.57Min 0 2 5 1 3 5Max 50 500 10590 2 10 10950Wtd Avg. 28.85 2 6.346 2
Assume mean of 10 oocysts/L (range of mean from 0.1-100) in secondary effluent based on National Research Council (1998) and Rose and Carnahan (1992).
Mean Arsenic from data for secondary treatment plants is 4.5 ug/L. Two standard deviations = +/- 2.6 ug/L.For AWT, mean is 1.3 ug/L
Mean TKN from data for secondary treatment plants is 9.8 mg/L. Two standard deviations = +/- 12.1 mg/L.
Standard assumed based on consumption of 4 L/year from swimming (Tanaka et al. 1998), and 3E-5 oocysts/L in 2x365 L/year drinking water (Haas et al. 1996)
Class III Surface Water Standards for predominantly marine waters.
Class III Surface Water Standards for predominantly marine waters.
Page 1
FPL-012-240
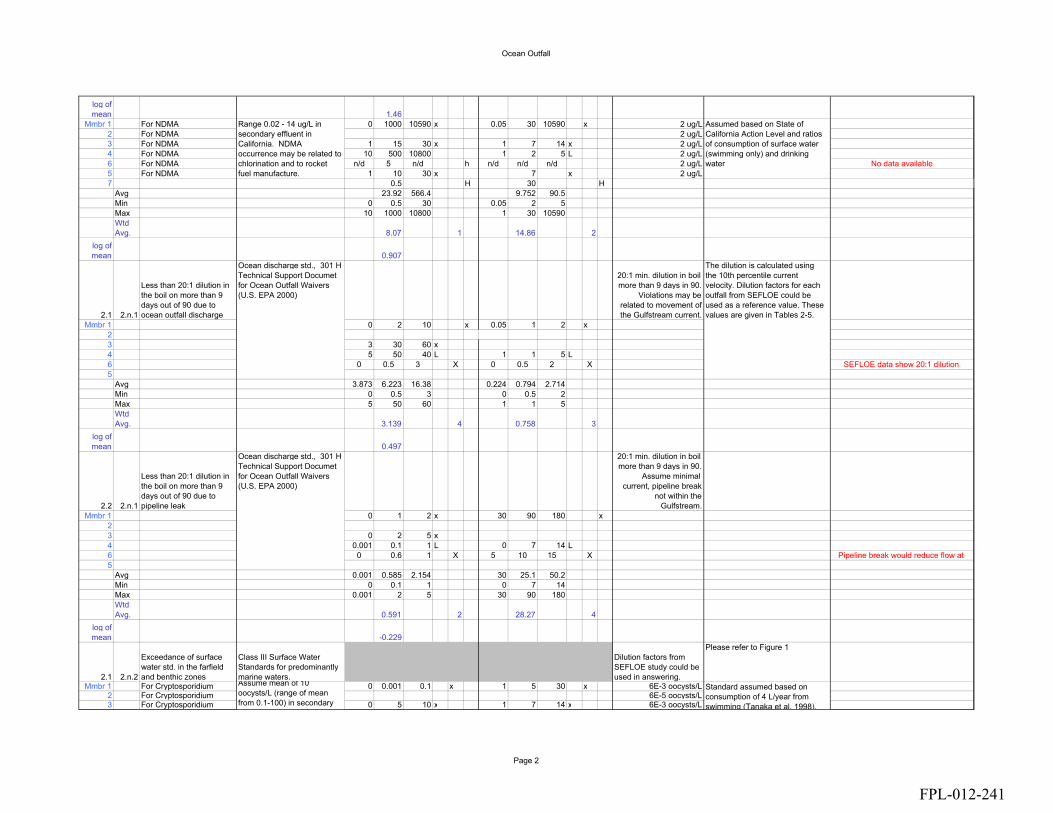
Ocean Outfall
log of mean 1.46
Mmbr 1 For NDMA 0 1000 10590 x 0.05 30 10590 x 2 ug/L2 For NDMA 2 ug/L3 For NDMA 1 15 30 x 1 7 14 x 2 ug/L4 For NDMA 10 500 10800 1 2 5 L 2 ug/L6 For NDMA n/d 5 n/d h n/d n/d n/d 2 ug/L No data available5 For NDMA 1 10 30 x 7 x 2 ug/L7 0.5 H 30 H
Avg 23.92 566.4 9.752 90.5Min 0 0.5 30 0.05 2 5Max 10 1000 10800 1 30 10590Wtd Avg. 8.07 1 14.86 2
log of mean 0.907
2.1 2.n.1
Less than 20:1 dilution in the boil on more than 9 days out of 90 due to ocean outfall discharge
20:1 min. dilution in boil more than 9 days in 90.
Violations may be related to movement of the Gulfstream current.
Mmbr 1 0 2 10 x 0.05 1 2 x23 3 30 60 x4 5 50 40 L 1 1 5 L6 0 0.5 3 X 0 0.5 2 X SEFLOE data show 20:1 dilution 5
Avg 3.873 6.223 16.38 0.224 0.794 2.714Min 0 0.5 3 0 0.5 2Max 5 50 60 1 1 5Wtd Avg. 3.139 4 0.758 3
log of mean 0.497
2.2 2.n.1
Less than 20:1 dilution in the boil on more than 9 days out of 90 due to pipeline leak
20:1 min. dilution in boil more than 9 days in 90.
Assume minimal current, pipeline break
not within the Gulfstream.
Mmbr 1 0 1 2 x 30 90 180 x23 0 2 5 x4 0.001 0.1 1 L 0 7 14 L6 0 0.6 1 X 5 10 15 X Pipeline break would reduce flow at 5
Avg 0.001 0.585 2.154 30 25.1 50.2Min 0 0.1 1 0 7 14Max 0.001 2 5 30 90 180Wtd Avg. 0.591 2 28.27 4
log of mean -0.229
2.1 2.n.2
Exceedance of surface water std. in the farfield and benthic zones
Class III Surface Water Standards for predominantly marine waters.
Dilution factors from SEFLOE study could be used in answering.
Please refer to Figure 1
Mmbr 1 For Cryptosporidium 0 0.001 0.1 x 1 5 30 x 6E-3 oocysts/L2 For Cryptosporidium 6E-5 oocysts/L3 For Cryptosporidium 0 5 10 x 1 7 14 x 6E-3 oocysts/L
Range 0.02 - 14 ug/L in secondary effluent in California. NDMA occurrence may be related to chlorination and to rocket fuel manufacture.
Assume mean of 10 oocysts/L (range of mean from 0.1-100) in secondary
Ocean discharge std., 301 H Technical Support Documet for Ocean Outfall Waivers (U.S. EPA 2000)
Ocean discharge std., 301 H Technical Support Documet for Ocean Outfall Waivers (U.S. EPA 2000)
Assumed based on State of California Action Level and ratios of consumption of surface water (swimming only) and drinking water
Standard assumed based on consumption of 4 L/year from swimming (Tanaka et al. 1998),
The dilution is calculated using the 10th percentile current velocity. Dilution factors for each outfall from SEFLOE could be used as a reference value. These values are given in Tables 2-5.
Page 2
FPL-012-241
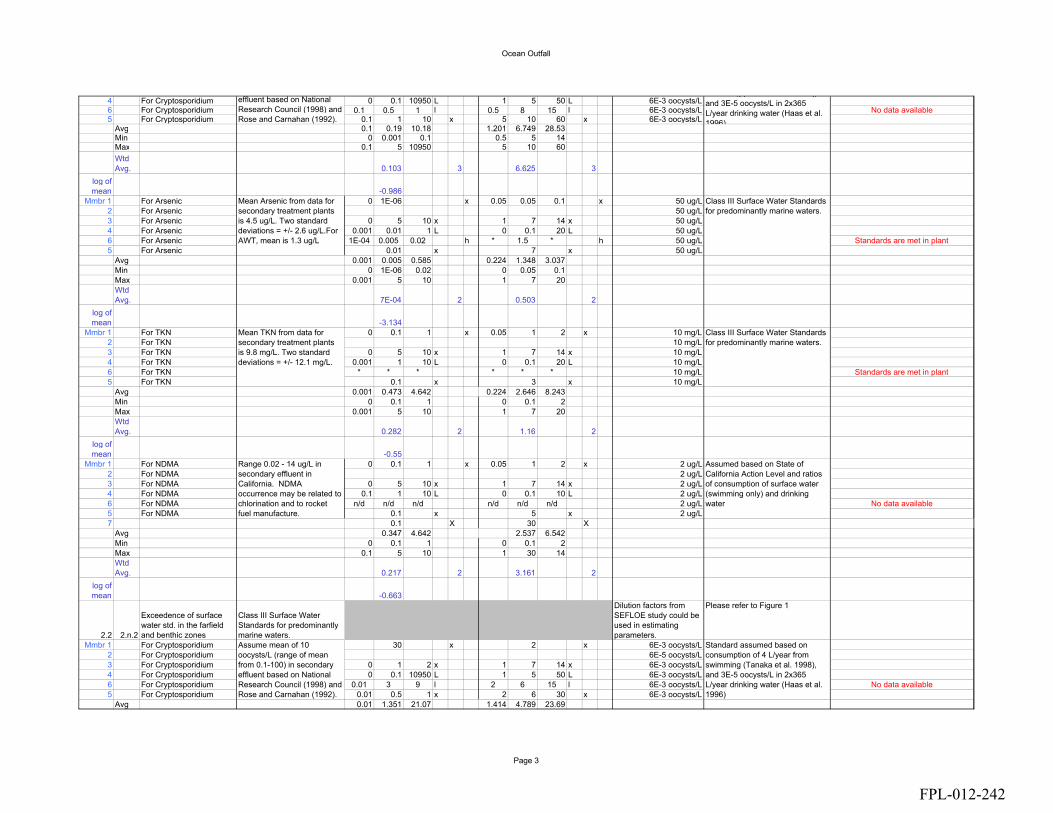
Ocean Outfall
4 For Cryptosporidium 0 0.1 10950 L 1 5 50 L 6E-3 oocysts/L6 For Cryptosporidium 0.1 0.5 1 l 0.5 8 15 l 6E-3 oocysts/L No data available5 For Cryptosporidium 0.1 1 10 x 5 10 60 x 6E-3 oocysts/L
Avg 0.1 0.19 10.18 1.201 6.749 28.53Min 0 0.001 0.1 0.5 5 14Max 0.1 5 10950 5 10 60Wtd Avg. 0.103 3 6.625 3
log of mean -0.986
Mmbr 1 For Arsenic 0 1E-06 x 0.05 0.05 0.1 x 50 ug/L2 For Arsenic 50 ug/L3 For Arsenic 0 5 10 x 1 7 14 x 50 ug/L4 For Arsenic 0.001 0.01 1 L 0 0.1 20 L 50 ug/L6 For Arsenic 1E-04 0.005 0.02 h * 1.5 * h 50 ug/L Standards are met in plant5 For Arsenic 0.01 x 7 x 50 ug/L
Avg 0.001 0.005 0.585 0.224 1.348 3.037Min 0 1E-06 0.02 0 0.05 0.1Max 0.001 5 10 1 7 20Wtd Avg. 7E-04 2 0.503 2
log of mean -3.134
Mmbr 1 For TKN 0 0.1 1 x 0.05 1 2 x 10 mg/L 2 For TKN 10 mg/L 3 For TKN 0 5 10 x 1 7 14 x 10 mg/L 4 For TKN 0.001 1 10 L 0 0.1 20 L 10 mg/L 6 For TKN * * * * * * 10 mg/L Standards are met in plant5 For TKN 0.1 x 3 x 10 mg/L
Avg 0.001 0.473 4.642 0.224 2.646 8.243Min 0 0.1 1 0 0.1 2Max 0.001 5 10 1 7 20Wtd Avg. 0.282 2 1.16 2
log of mean -0.55
Mmbr 1 For NDMA 0 0.1 1 x 0.05 1 2 x 2 ug/L2 For NDMA 2 ug/L3 For NDMA 0 5 10 x 1 7 14 x 2 ug/L4 For NDMA 0.1 1 10 L 0 0.1 10 L 2 ug/L6 For NDMA n/d n/d n/d n/d n/d n/d 2 ug/L No data available5 For NDMA 0.1 x 5 x 2 ug/L7 0.1 X 30 X
Avg 0.347 4.642 2.537 6.542Min 0 0.1 1 0 0.1 2Max 0.1 5 10 1 30 14Wtd Avg. 0.217 2 3.161 2
log of mean -0.663
2.2 2.n.2
Exceedence of surface water std. in the farfield and benthic zones
Class III Surface Water Standards for predominantly marine waters.
Dilution factors from SEFLOE study could be used in estimating parameters.
Please refer to Figure 1
Mmbr 1 For Cryptosporidium 30 x 2 x 6E-3 oocysts/L2 For Cryptosporidium 6E-5 oocysts/L3 For Cryptosporidium 0 1 2 x 1 7 14 x 6E-3 oocysts/L4 For Cryptosporidium 0 0.1 10950 L 1 5 50 L 6E-3 oocysts/L6 For Cryptosporidium 0.01 3 9 l 2 6 15 l 6E-3 oocysts/L No data available5 For Cryptosporidium 0.01 0.5 1 x 2 6 30 x 6E-3 oocysts/L
Avg 0.01 1.351 21.07 1.414 4.789 23.69
effluent based on National Research Council (1998) and Rose and Carnahan (1992).
Mean Arsenic from data for secondary treatment plants is 4.5 ug/L. Two standard deviations = +/- 2.6 ug/L.For AWT, mean is 1.3 ug/L
Mean TKN from data for secondary treatment plants is 9.8 mg/L. Two standard deviations = +/- 12.1 mg/L.
Range 0.02 - 14 ug/L in secondary effluent in California. NDMA occurrence may be related to chlorination and to rocket fuel manufacture.
Assume mean of 10 oocysts/L (range of mean from 0.1-100) in secondary effluent based on National Research Council (1998) and Rose and Carnahan (1992).
Class III Surface Water Standards for predominantly marine waters.
Class III Surface Water Standards for predominantly marine waters.
g ( ),and 3E-5 oocysts/L in 2x365 L/year drinking water (Haas et al. 1996)
Assumed based on State of California Action Level and ratios of consumption of surface water (swimming only) and drinking water
Standard assumed based on consumption of 4 L/year from swimming (Tanaka et al. 1998), and 3E-5 oocysts/L in 2x365 L/year drinking water (Haas et al. 1996)
Page 3
FPL-012-242
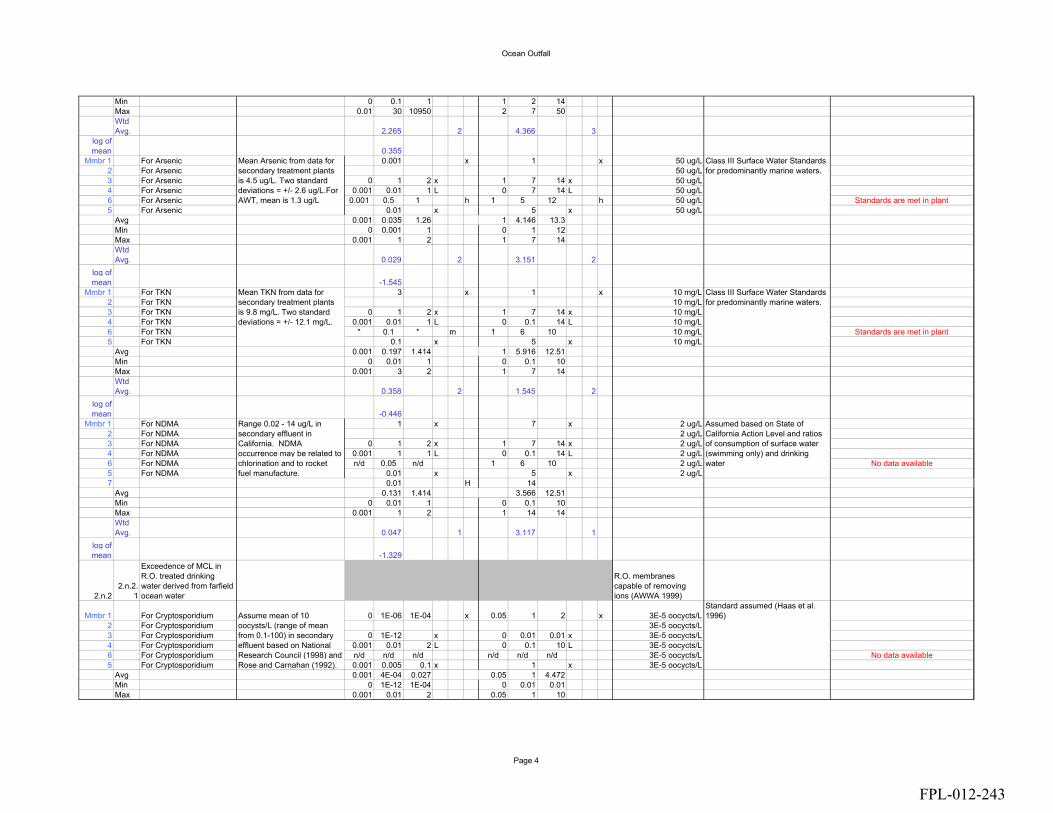
Ocean Outfall
Min 0 0.1 1 1 2 14Max 0.01 30 10950 2 7 50Wtd Avg. 2.265 2 4.366 3
log of mean 0.355
Mmbr 1 For Arsenic 0.001 x 1 x 50 ug/L2 For Arsenic 50 ug/L3 For Arsenic 0 1 2 x 1 7 14 x 50 ug/L4 For Arsenic 0.001 0.01 1 L 0 7 14 L 50 ug/L6 For Arsenic 0.001 0.5 1 h 1 5 12 h 50 ug/L Standards are met in plant5 For Arsenic 0.01 x 5 x 50 ug/L
Avg 0.001 0.035 1.26 1 4.146 13.3Min 0 0.001 1 0 1 12Max 0.001 1 2 1 7 14Wtd Avg. 0.029 2 3.151 2
log of mean -1.545
Mmbr 1 For TKN 3 x 1 x 10 mg/L 2 For TKN 10 mg/L 3 For TKN 0 1 2 x 1 7 14 x 10 mg/L 4 For TKN 0.001 0.01 1 L 0 0.1 14 L 10 mg/L 6 For TKN * 0.1 * m 1 6 10 10 mg/L Standards are met in plant5 For TKN 0.1 x 5 x 10 mg/L
Avg 0.001 0.197 1.414 1 5.916 12.51Min 0 0.01 1 0 0.1 10Max 0.001 3 2 1 7 14Wtd Avg. 0.358 2 1.545 2
log of mean -0.446
Mmbr 1 For NDMA 1 x 7 x 2 ug/L2 For NDMA 2 ug/L3 For NDMA 0 1 2 x 1 7 14 x 2 ug/L4 For NDMA 0.001 1 1 L 0 0.1 14 L 2 ug/L6 For NDMA n/d 0.05 n/d 1 6 10 2 ug/L No data available5 For NDMA 0.01 x 5 x 2 ug/L7 0.01 H 14
Avg 0.131 1.414 3.566 12.51Min 0 0.01 1 0 0.1 10Max 0.001 1 2 1 14 14Wtd Avg. 0.047 1 3.117 1
log of mean -1.329
2.n.22.n.2.
1
Exceedence of MCL in R.O. treated drinking water derived from farfield ocean water
R.O. membranes capable of removing ions (AWWA 1999)
Mmbr 1 For Cryptosporidium 0 1E-06 1E-04 x 0.05 1 2 x 3E-5 oocycts/L2 For Cryptosporidium 3E-5 oocycts/L3 For Cryptosporidium 0 1E-12 x 0 0.01 0.01 x 3E-5 oocycts/L4 For Cryptosporidium 0.001 0.01 2 L 0 0.1 10 L 3E-5 oocycts/L6 For Cryptosporidium n/d n/d n/d n/d n/d n/d 3E-5 oocycts/L No data available5 For Cryptosporidium 0.001 0.005 0.1 x 1 x 3E-5 oocycts/L
Avg 0.001 4E-04 0.027 0.05 1 4.472Min 0 1E-12 1E-04 0 0.01 0.01Max 0.001 0.01 2 0.05 1 10
Assume mean of 10 oocysts/L (range of mean from 0.1-100) in secondary effluent based on National Research Council (1998) and Rose and Carnahan (1992).
Mean Arsenic from data for secondary treatment plants is 4.5 ug/L. Two standard deviations = +/- 2.6 ug/L.For AWT, mean is 1.3 ug/L
Mean TKN from data for secondary treatment plants is 9.8 mg/L. Two standard deviations = +/- 12.1 mg/L.
Range 0.02 - 14 ug/L in secondary effluent in California. NDMA occurrence may be related to chlorination and to rocket fuel manufacture.
Assumed based on State of California Action Level and ratios of consumption of surface water (swimming only) and drinking water
Standard assumed (Haas et al. 1996)
Class III Surface Water Standards for predominantly marine waters.
Class III Surface Water Standards for predominantly marine waters.
Page 4
FPL-012-243

Ocean Outfall
Wtd Avg. 2E-06 2 0.316 2
log of mean -5.717
Mmbr 1 For Arsenic 0 1E-09 1E-04 x 0.05 1 2 x 50 ug/L2 For Arsenic 50 ug/L3 For Arsenic 0 1E-12 x 0 0.01 0.01 x 50 ug/L4 For Arsenic 0.001 0.001 0.1 L 0 0.1 2 L 50 ug/L6 For Arsenic * * * * * * 50 ug/L Standards are met in plant5 For Arsenic 0.001 x 1 x 50 ug/L
Avg 0.001 1E-05 0.003 0.05 1 2Min 0 1E-12 1E-04 0 0.01 0.01Max 0.001 0.001 0.1 0.05 1 2Wtd Avg. 3E-08 2 0.316 2
log of mean -7.5
Mmbr 1 For TKN 0 3E-06 1E-04 x 0.05 1 2 x 10 mg/L2 For TKN 10 mg/L3 For TKN 0 1E-12 1E-12 x 0 0.01 0.01 x 10 mg/L4 For TKN 0.001 0.1 0.1 L 0 0.1 2 L 10 mg/L6 For TKN * * * * * * 10 mg/L Standards are met in plant5 For TKN 0.3 x 1 x 10 mg/L
Avg 0.001 0.004 0.003 0.05 1 2Min 0 1E-12 1E-12 0 0.01 0.01Max 0.001 0.3 0.1 0.05 1 2Wtd Avg. 1E-05 2 0.316 2
log of mean -5.015
Mmbr 1 For NDMA 0 1E-05 1E-04 x 0.05 1 2 x 0.002 ug/L2 For NDMA 0.002 ug/L3 For NDMA 0 1E-12 x 0 0.01 x 0.002 ug/L4 For NDMA 0.001 0.1 L 0 0.1 2 L 0.002 ug/L6 For NDMA n/d n/d n/d n/d n/d n/d 0.002 ug/L No data available5 For NDMA 0.001 x 1 x 0.002 ug/L7 0 0.01 100 30
Avg 3E-05 0.1 0.496 2Min 0 1E-12 1E-04 0 0.01 2Max 0.001 0.1 100 0.05 30 2Wtd Avg. 3E-05 2 0.416 2
log of mean -4.5
2.1 2.n.3
Exceedence of surface water stds. in beach waters due to ocean outfall discharge
Class III Surface Water Standards for predominantly marine waters.
Mmbr 1 For Cryptosporidium 0 0.001 0.01 x 0.05 1 5 x 6E-3 oocysts/L2 For Cryptosporidium 6E-5 oocysts/L3 For Cryptosporidium 0 2 5 x 1 3 7 x 6E-3 oocysts/L4 For Cryptosporidium 0 0.1 20 L 0 7 14 L 6E-3 oocysts/L6 For Cryptosporidium n/d 0.1 n/d l n/d 3 n/d l 6E-3 oocysts/L No data available5 For Cryptosporidium 1E-04 0.01 0.1 x 1 3 7 6E-3 oocysts/L
Avg 1E-04 0.046 0.562 0.368 2.853 7.653Min 0 0.001 0.01 0 1 5Max 1E-04 2 20 1 7 14Wtd Avg. 0.015 2 2.396 2
log of mean -1.814
Mean Arsenic from data for secondary treatment plants is 4.5 ug/L. Two standard deviations = +/- 2.6 ug/L.For AWT, mean is 1.3 ug/L
Mean TKN from data for secondary treatment plants is 9.8 mg/L. Two standard deviations = +/- 12.1 mg/L.
Range 0.02 - 14 ug/L in secondary effluent in California. NDMA occurrence may be related to chlorination and to rocket fuel manufacture.
Assume mean of 10 oocysts/L (range of mean from 0.1-100) in secondary effluent based on National Research Council (1998) and Rose and Carnahan (1992).
State of California Action Level
Standard assumed based on consumption of 4 L/year from swimming (Tanaka et al. 1998), and 3E-5 oocysts/L in 2x365 L/year drinking water (Haas et al. 1996)
MCL regulatory drinking water std.
Assumed MCL Drinking Water Standard, based on MCL = 10 mg/L nitrate as nitrogen
Page 5
FPL-012-244
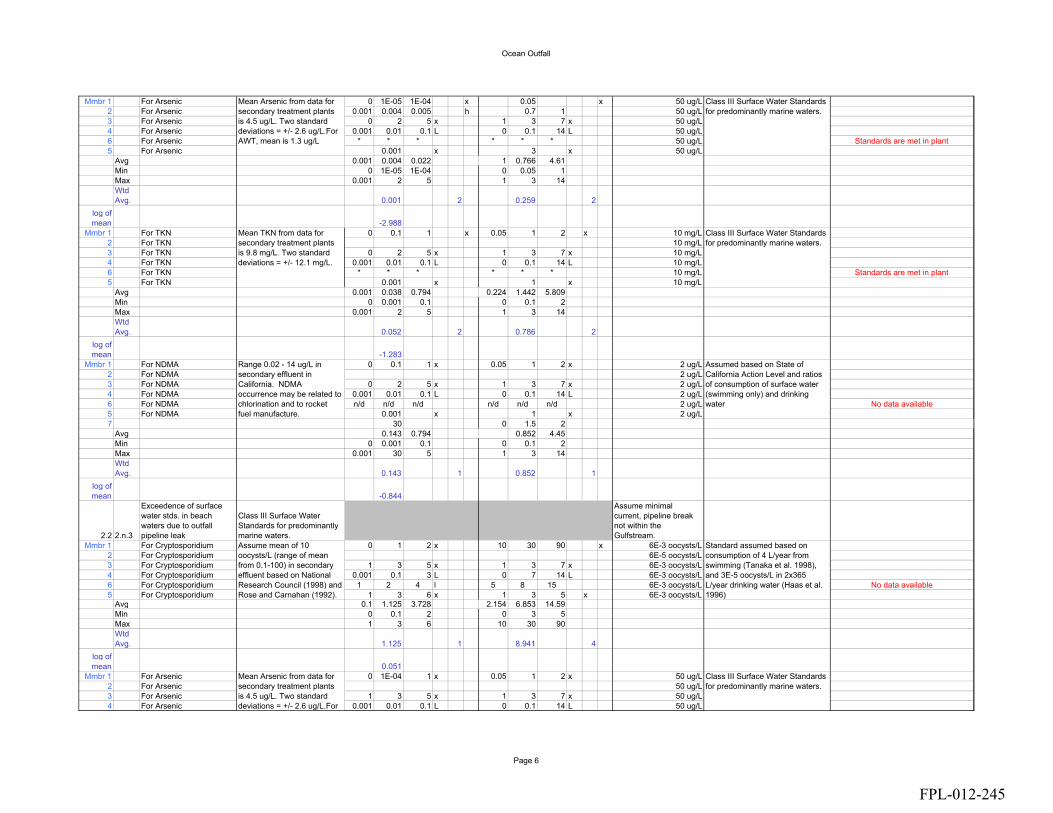
Ocean Outfall
Mmbr 1 For Arsenic 0 1E-05 1E-04 x 0.05 x 50 ug/L2 For Arsenic 0.001 0.004 0.005 h 0.7 1 50 ug/L3 For Arsenic 0 2 5 x 1 3 7 x 50 ug/L4 For Arsenic 0.001 0.01 0.1 L 0 0.1 14 L 50 ug/L6 For Arsenic * * * * * * 50 ug/L Standards are met in plant5 For Arsenic 0.001 x 3 x 50 ug/L
Avg 0.001 0.004 0.022 1 0.766 4.61Min 0 1E-05 1E-04 0 0.05 1Max 0.001 2 5 1 3 14Wtd Avg. 0.001 2 0.259 2
log of mean -2.988
Mmbr 1 For TKN 0 0.1 1 x 0.05 1 2 x 10 mg/L 2 For TKN 10 mg/L 3 For TKN 0 2 5 x 1 3 7 x 10 mg/L 4 For TKN 0.001 0.01 0.1 L 0 0.1 14 L 10 mg/L 6 For TKN * * * * * * 10 mg/L Standards are met in plant5 For TKN 0.001 x 1 x 10 mg/L
Avg 0.001 0.038 0.794 0.224 1.442 5.809Min 0 0.001 0.1 0 0.1 2Max 0.001 2 5 1 3 14Wtd Avg. 0.052 2 0.786 2
log of mean -1.283
Mmbr 1 For NDMA 0 0.1 1 x 0.05 1 2 x 2 ug/L2 For NDMA 2 ug/L3 For NDMA 0 2 5 x 1 3 7 x 2 ug/L4 For NDMA 0.001 0.01 0.1 L 0 0.1 14 L 2 ug/L6 For NDMA n/d n/d n/d n/d n/d n/d 2 ug/L No data available5 For NDMA 0.001 x 1 x 2 ug/L7 30 0 1.5 2
Avg 0.143 0.794 0.852 4.45Min 0 0.001 0.1 0 0.1 2Max 0.001 30 5 1 3 14Wtd Avg. 0.143 1 0.852 1
log of mean -0.844
2.2 2.n.3
Exceedence of surface water stds. in beach waters due to outfall pipeline leak
Class III Surface Water Standards for predominantly marine waters.
Assume minimal current, pipeline break not within the Gulfstream.
Mmbr 1 For Cryptosporidium 0 1 2 x 10 30 90 x 6E-3 oocysts/L2 For Cryptosporidium 6E-5 oocysts/L3 For Cryptosporidium 1 3 5 x 1 3 7 x 6E-3 oocysts/L4 For Cryptosporidium 0.001 0.1 3 L 0 7 14 L 6E-3 oocysts/L6 For Cryptosporidium 1 2 4 l 5 8 15 6E-3 oocysts/L No data available5 For Cryptosporidium 1 3 6 x 1 3 5 x 6E-3 oocysts/L
Avg 0.1 1.125 3.728 2.154 6.853 14.59Min 0 0.1 2 0 3 5Max 1 3 6 10 30 90Wtd Avg. 1.125 1 8.941 4
log of mean 0.051
Mmbr 1 For Arsenic 0 1E-04 1 x 0.05 1 2 x 50 ug/L2 For Arsenic 50 ug/L3 For Arsenic 1 3 5 x 1 3 7 x 50 ug/L4 For Arsenic 0.001 0.01 0.1 L 0 0.1 14 L 50 ug/L
Mean TKN from data for secondary treatment plants is 9.8 mg/L. Two standard deviations = +/- 12.1 mg/L.
Range 0.02 - 14 ug/L in secondary effluent in California. NDMA occurrence may be related to chlorination and to rocket fuel manufacture.
Assume mean of 10 oocysts/L (range of mean from 0.1-100) in secondary effluent based on National Research Council (1998) and Rose and Carnahan (1992).
Mean Arsenic from data for secondary treatment plants is 4.5 ug/L. Two standard deviations = +/- 2.6 ug/L.For
Mean Arsenic from data for secondary treatment plants is 4.5 ug/L. Two standard deviations = +/- 2.6 ug/L.For AWT, mean is 1.3 ug/L
Assumed based on State of California Action Level and ratios of consumption of surface water (swimming only) and drinking water
Standard assumed based on consumption of 4 L/year from swimming (Tanaka et al. 1998), and 3E-5 oocysts/L in 2x365 L/year drinking water (Haas et al. 1996)
Class III Surface Water Standards for predominantly marine waters.
Class III Surface Water Standards for predominantly marine waters.
Class III Surface Water Standards for predominantly marine waters.
Page 6
FPL-012-245
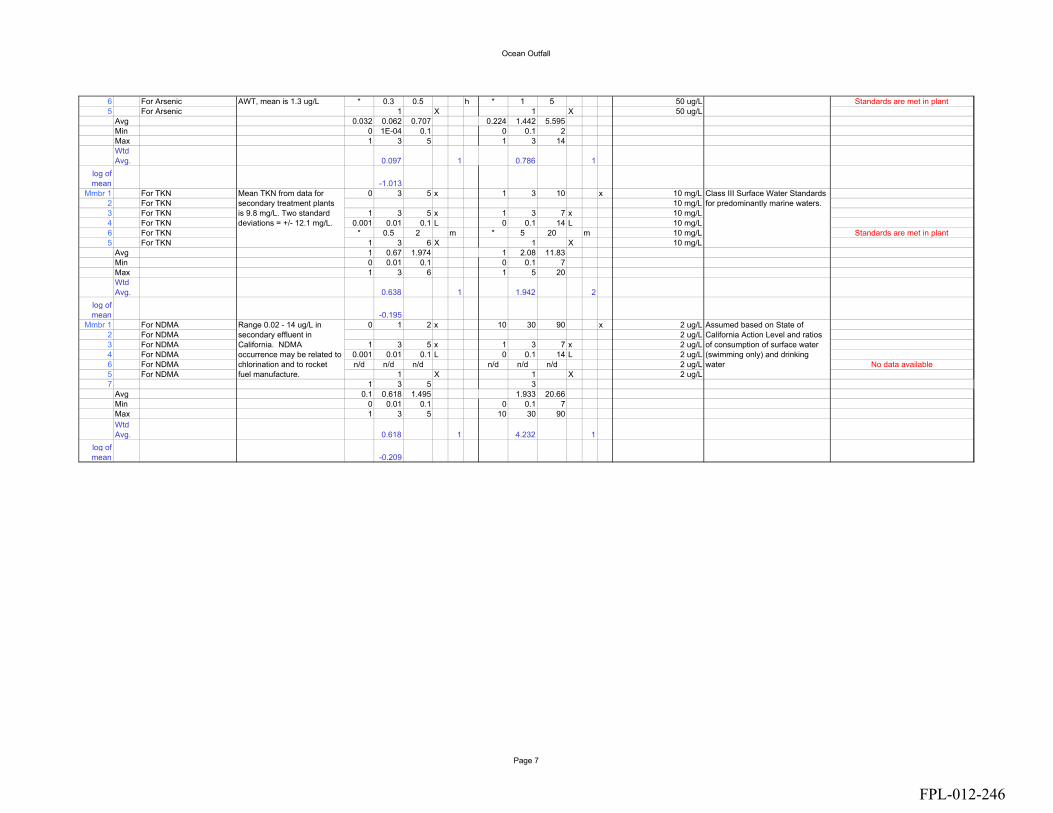
Ocean Outfall
6 For Arsenic * 0.3 0.5 h * 1 5 50 ug/L Standards are met in plant5 For Arsenic 1 X 1 X 50 ug/L
Avg 0.032 0.062 0.707 0.224 1.442 5.595Min 0 1E-04 0.1 0 0.1 2Max 1 3 5 1 3 14Wtd Avg. 0.097 1 0.786 1
log of mean -1.013
Mmbr 1 For TKN 0 3 5 x 1 3 10 x 10 mg/L 2 For TKN 10 mg/L 3 For TKN 1 3 5 x 1 3 7 x 10 mg/L 4 For TKN 0.001 0.01 0.1 L 0 0.1 14 L 10 mg/L 6 For TKN * 0.5 2 m * 5 20 m 10 mg/L Standards are met in plant5 For TKN 1 3 6 X 1 X 10 mg/L
Avg 1 0.67 1.974 1 2.08 11.83Min 0 0.01 0.1 0 0.1 7Max 1 3 6 1 5 20Wtd Avg. 0.638 1 1.942 2
log of mean -0.195
Mmbr 1 For NDMA 0 1 2 x 10 30 90 x 2 ug/L2 For NDMA 2 ug/L3 For NDMA 1 3 5 x 1 3 7 x 2 ug/L4 For NDMA 0.001 0.01 0.1 L 0 0.1 14 L 2 ug/L6 For NDMA n/d n/d n/d n/d n/d n/d 2 ug/L No data available5 For NDMA 1 X 1 X 2 ug/L7 1 3 5 3
Avg 0.1 0.618 1.495 1.933 20.66Min 0 0.01 0.1 0 0.1 7Max 1 3 5 10 30 90Wtd Avg. 0.618 1 4.232 1
log of mean -0.209
Range 0.02 - 14 ug/L in secondary effluent in California. NDMA occurrence may be related to chlorination and to rocket fuel manufacture.
AWT, mean is 1.3 ug/L
Mean TKN from data for secondary treatment plants is 9.8 mg/L. Two standard deviations = +/- 12.1 mg/L.
Assumed based on State of California Action Level and ratios of consumption of surface water (swimming only) and drinking water
Class III Surface Water Standards for predominantly marine waters.
Page 7
FPL-012-246
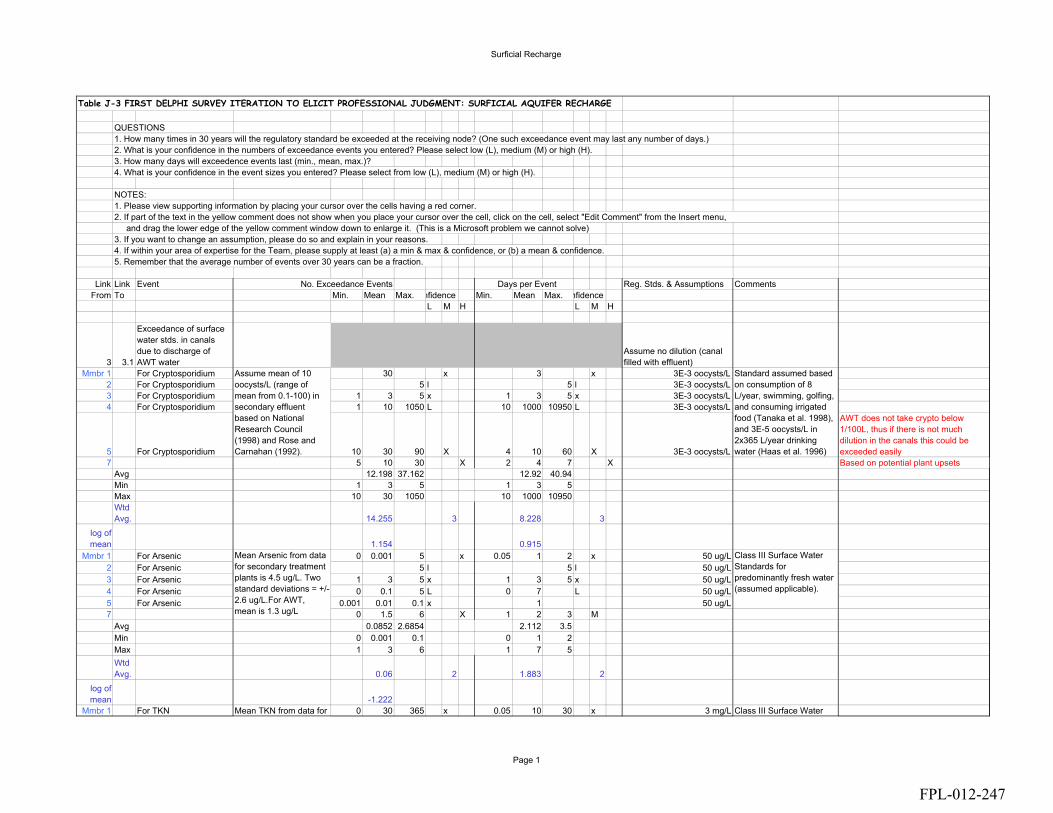
Surficial Recharge
Table J-3 FIRST DELPHI SURVEY ITERATION TO ELICIT PROFESSIONAL JUDGMENT: SURFICIAL AQUIFER RECHARGE
QUESTIONS1. How many times in 30 years will the regulatory standard be exceeded at the receiving node? (One such exceedance event may last any number of days.)2. What is your confidence in the numbers of exceedance events you entered? Please select low (L), medium (M) or high (H).3. How many days will exceedence events last (min., mean, max.)? 4. What is your confidence in the event sizes you entered? Please select from low (L), medium (M) or high (H).
NOTES:1. Please view supporting information by placing your cursor over the cells having a red corner.2. If part of the text in the yellow comment does not show when you place your cursor over the cell, click on the cell, select "Edit Comment" from the Insert menu, and drag the lower edge of the yellow comment window down to enlarge it. (This is a Microsoft problem we cannot solve)3. If you want to change an assumption, please do so and explain in your reasons.4. If within your area of expertise for the Team, please supply at least (a) a min & max & confidence, or (b) a mean & confidence.5. Remember that the average number of events over 30 years can be a fraction.
Link Link Event No. Exceedance Events Days per Event Reg. Stds. & Assumptions CommentsFrom To Min. Mean Max. nfidence Min. Mean Max. nfidence
L M H L M H
3 3.1
Exceedance of surface water stds. in canals due to discharge of AWT water
Assume no dilution (canal filled with effluent)
Mmbr 1 For Cryptosporidium 30 x 3 x 3E-3 oocysts/L2 For Cryptosporidium 5 l 5 l 3E-3 oocysts/L3 For Cryptosporidium 1 3 5 x 1 3 5 x 3E-3 oocysts/L4 For Cryptosporidium 1 10 1050 L 10 1000 10950 L 3E-3 oocysts/L
5 For Cryptosporidium 10 30 90 X 4 10 60 X 3E-3 oocysts/L
AWT does not take crypto below 1/100L, thus if there is not much dilution in the canals this could be exceeded easily
7 5 10 30 X 2 4 7 X Based on potential plant upsetsAvg 12.198 37.162 12.92 40.94Min 1 3 5 1 3 5Max 10 30 1050 10 1000 10950Wtd Avg. 14.255 3 8.228 3
log of mean 1.154 0.915
Mmbr 1 For Arsenic 0 0.001 5 x 0.05 1 2 x 50 ug/L2 For Arsenic 5 l 5 l 50 ug/L3 For Arsenic 1 3 5 x 1 3 5 x 50 ug/L4 For Arsenic 0 0.1 5 L 0 7 L 50 ug/L5 For Arsenic 0.001 0.01 0.1 x 1 50 ug/L7 0 1.5 6 X 1 2 3 M
Avg 0.0852 2.6854 2.112 3.5Min 0 0.001 0.1 0 1 2Max 1 3 6 1 7 5Wtd Avg. 0.06 2 1.883 2
log of mean -1.222
Mmbr 1 For TKN 0 30 365 x 0.05 10 30 x 3 mg/L
Assume mean of 10 oocysts/L (range of mean from 0.1-100) in secondary effluent based on National Research Council (1998) and Rose and Carnahan (1992).
Mean TKN from data for
Mean Arsenic from data for secondary treatment plants is 4.5 ug/L. Two standard deviations = +/- 2.6 ug/L.For AWT, mean is 1.3 ug/L
Standard assumed based on consumption of 8 L/year, swimming, golfing, and consuming irrigated food (Tanaka et al. 1998), and 3E-5 oocysts/L in 2x365 L/year drinking water (Haas et al. 1996)
Class III Surface Water Standards for predominantly fresh water (assumed applicable).
Class III Surface Water
Page 1
FPL-012-247

Surficial Recharge
2 For TKN 5 l 5 l 3 mg/L 3 For TKN 1 3 5 x 1 3 5 x 3 mg/L 4 For TKN 1 5 500 L 20 2000 10800 L 3 mg/L 5 For TKN 10 30 90 x 7 3 mg/L
7 15 40 120 H 1 3 5 XExceedance 1/3 months (maybe high), not nec. detected
Avg 14.011 60.549 16.6 33.23Min 0 3 5 0.05 3 5Max 15 40 500 20 2000 10800Wtd Avg. 20.031 2 12.09 2
log of mean 1.3017
Mmbr 1 For NDMA 0 60 10590 x 0.05 30 10590 x 2 ug/L2 For NDMA 5 l 5 l 2 ug/L3 For NDMA 1 3 5 x 1 3 5 x 2 ug/L4 For NDMA 100 500 10800 L 0.2 5 30 L 2 ug/L5 For NDMA 75 150 1000 x 5 2 ug/L
7 1 X 10950 H
If effluent chlorinated, and if amines present from backwash of residential ion exchange systems, may have formation
Avg 26.673 309.92 30.08 53.09Min 0 1 5 0.05 3 5Max 100 500 10800 1 10950 10590Wtd Avg. 10.438 1 162.2 1
log of mean 1.0186
3.1 3.2
Exceedance of MCL drinking water std. in Biscayne aquifer well water due to leakage from canals to well
Canal level higher than GW table. Assume that this is not the typical condition (Bloetscher 2000).
Mmbr 1 For Cryptosporidium 0 0.0001 0.001 x 0.05 1 2 x 3E-5 oocycts/L2 For Cryptosporidium 5 l 5 l 3E-5 oocycts/L3 For Cryptosporidium 0.0001 0.001 0.01 x 1 3 5 x 3E-5 oocycts/L4 For Cryptosporidium 1 1 10 L 1090 1000 10950 L 3E-5 oocycts/L5 For Cryptosporidium 1 3 6 x 10 30 60 x 3E-5 oocycts/L7 4 10 20 X 1 2 3 X
Avg 0.0786 0.6257 11.25 21.49Min 0 0.0001 0.001 0.05 1 2Max 4 10 20 1090 1000 10950Wtd Avg. 0.0272 2 7.571 3
log of mean -1.565
Mmbr 1 For Arsenic 0 0.0001 0.001 x 0.05 1 2 x 50 ug/L2 For Arsenic 5 l 5 l 50 ug/L3 For Arsenic 0.0001 0.001 0.01 x 1 3 5 x 50 ug/L4 For Arsenic 0.001 0.05 0.1 L 0.001 7 L 50 ug/L5 For Arsenic 0.01 x 5 50 ug/L7 0 1 5 X 1 1.5 2 X
Avg 0.0087 0.1201 2.751 3.162
secondary treatment plants is 9.8 mg/L. Two standard deviations = +/- 12.1 mg/L.
Range 0.02 - 14 ug/L in secondary effluent in California. NDMA occurrence may be related to chlorination
Assume mean of 10 oocysts/L (range of mean from 0.1-100) in secondary effluent based on National
Mean Arsenic from data for secondary treatment plants is 4.5 ug/L. Two standard deviations = +/- 2.6 ug/L.For AWT,
Standards for predominantly fresh water (assumed applicable).
Assumed based on State of California Action Level and ratios of consumption of surface water and drinking water
Standard assumed based on consumption of 8 L/year, swimming, golfing, and consuming irrigated food (Tanaka et al. 1998),
MCL regulatory drinking water std.
Page 2
FPL-012-248

Surficial Recharge
Min 0 0.0001 0.001 0.001 1 2Max 0.001 1 5 1 7 5Wtd Avg. 0.0052 2 1.98 2
log of mean -2.288
Mmbr 1 For TKN 0 3 10 x 0.05 30 90 x 10 mg/L2 For TKN 5 l 5 l 10 mg/L3 For TKN 0.0001 0.001 0.01 x 1 3 5 x 10 mg/L4 For TKN 1 3 100 L 0.2 2 20 L 10 mg/L5 For TKN 3 x 5 x 10 mg/L Treatment in canal bank assumed7 5 10 30 X 1 2 4 X
Avg 0.7696 4.3174 4.478 11.25Min 0 0.001 0.01 0.05 2 4Max 5 10 100 1 30 90Wtd Avg. 1.18 1 3.915 2
log of mean 0.0719
Mmbr 1 For NDMA 0 10 10590 x 0.05 30 10590 x 0.002 ug/L2 For NDMA l 5 l 0.002 ug/L3 For NDMA 0.0001 0.001 0.01 x 1 3 5 x 0.002 ug/L4 For NDMA 1 50 100 L 0.5 5 50 L 0.002 ug/L5 For NDMA 10 x 5 x 0.002 ug/L7 1 H 10950 X Not much removal at all
Avg 1.3797 21.96 30.08 60.32Min 0 0.001 0.01 0.05 3 5Max 1 50 10590 1 10950 10590Wtd Avg. 1.2585 1 162.2 1
log of mean 0.0999
3.2 3.2.1
Exceedance of MCL drinking water stds. in treated potable water derived from Biscayne aquifer wells
Assume lime softening and chlorination
*Required 4 logs removal of viruses (Surface Water Treatment Rule). *Required 2 logs removal cryptosporidium (Interim Enhanced Surface Water Treatment Rule). *Typical 1 log removal of arsenic in lime softening (AWWA 1999) *Assume no removal of TKN
Mmbr 1 For Cryptosporidium 0 0.0003 0.001 x 0.05 1 5 x 3E-5 oocycts/L2 For Cryptosporidium 1 l 5 ll 3E-5 oocycts/L3 For Cryptosporidium 0 0.0001 0.001 x 1 2 5 x 3E-5 oocycts/L4 For Cryptosporidium 1 1 2 L 50 100 10950 L 3E-5 oocycts/L5 For Cryptosporidium 0.1 1 3 x 10 30 60 x 3E-5 oocycts/L7 0 0.5 3 H 0 1 2 X Assuming filtration
Avg 0.0272 0.1619 5.697 23.4Min 0 0.0001 0.001 0 1 2Max 1 1 3 50 100 10950
Mean TKN from data for secondary treatment plants is 9.8 mg/L. Two standard deviations = +/- 12.1 mg/L.
Range 0.02 - 14 ug/L in secondary effluent in California. NDMA occurrence may be related to chlorination
Assume mean of 10 oocysts/L (range of mean from 0.1-100) in secondary effluent based on National
Assumed MCL Drinking Water Standard, based on MCL = 10 mg/L nitrate as nitrogen
State of California Action Level
Standard assumed based on consumption of 8 L/year, swimming, golfing, and consuming irrigated food (Tanaka et al. 1998), and 3E-5 oocysts/L in
Page 3
FPL-012-249
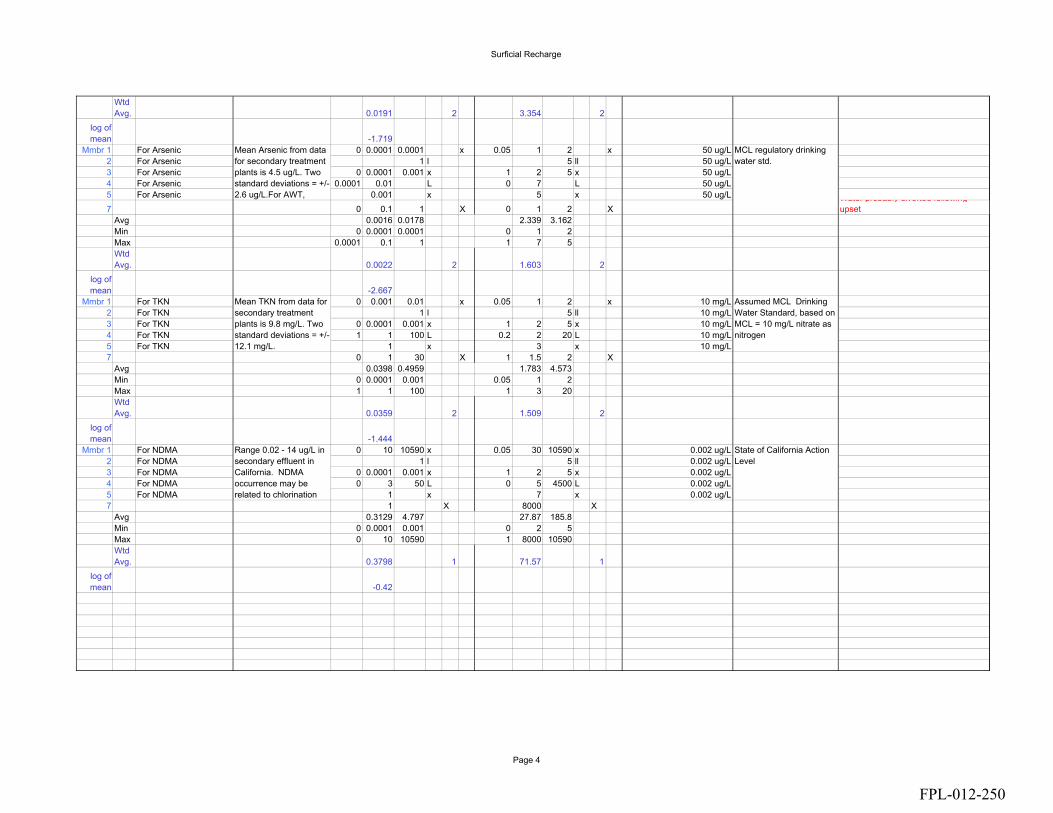
Surficial Recharge
Wtd Avg. 0.0191 2 3.354 2
log of mean -1.719
Mmbr 1 For Arsenic 0 0.0001 0.0001 x 0.05 1 2 x 50 ug/L2 For Arsenic 1 l 5 ll 50 ug/L3 For Arsenic 0 0.0001 0.001 x 1 2 5 x 50 ug/L4 For Arsenic 0.0001 0.01 L 0 7 L 50 ug/L5 For Arsenic 0.001 x 5 x 50 ug/L7 0 0.1 1 X 0 1 2 X
Water probably diverted following upset
Avg 0.0016 0.0178 2.339 3.162Min 0 0.0001 0.0001 0 1 2Max 0.0001 0.1 1 1 7 5Wtd Avg. 0.0022 2 1.603 2
log of mean -2.667
Mmbr 1 For TKN 0 0.001 0.01 x 0.05 1 2 x 10 mg/L2 For TKN 1 l 5 ll 10 mg/L3 For TKN 0 0.0001 0.001 x 1 2 5 x 10 mg/L4 For TKN 1 1 100 L 0.2 2 20 L 10 mg/L5 For TKN 1 x 3 x 10 mg/L7 0 1 30 X 1 1.5 2 X
Avg 0.0398 0.4959 1.783 4.573Min 0 0.0001 0.001 0.05 1 2Max 1 1 100 1 3 20Wtd Avg. 0.0359 2 1.509 2
log of mean -1.444
Mmbr 1 For NDMA 0 10 10590 x 0.05 30 10590 x 0.002 ug/L2 For NDMA 1 l 5 ll 0.002 ug/L3 For NDMA 0 0.0001 0.001 x 1 2 5 x 0.002 ug/L4 For NDMA 0 3 50 L 0 5 4500 L 0.002 ug/L5 For NDMA 1 x 7 x 0.002 ug/L7 1 X 8000 X
Avg 0.3129 4.797 27.87 185.8Min 0 0.0001 0.001 0 2 5Max 0 10 10590 1 8000 10590Wtd Avg. 0.3798 1 71.57 1
log of mean -0.42
Mean Arsenic from data for secondary treatment plants is 4.5 ug/L. Two standard deviations = +/- 2.6 ug/L.For AWT,
Mean TKN from data for secondary treatment plants is 9.8 mg/L. Two standard deviations = +/- 12.1 mg/L.
Range 0.02 - 14 ug/L in secondary effluent in California. NDMA occurrence may be related to chlorination
Assumed MCL Drinking Water Standard, based on MCL = 10 mg/L nitrate as nitrogen
State of California Action Level
MCL regulatory drinking water std.
Page 4
FPL-012-250
92
APPENDIX K. SUPPORTING INFORMATION PROVIDED TO TEAM MEMBERS WITH THE MODIFIED DELPHI QUESTIONNAIRE
FPL-012-251

SUPPORTING INFORMATION FOR THE MODIFIED DELPHI SURVEY Sinem Gokgoz
CONSTITUENTS Cryptosprodium is a protozoon. Protozoa are single celled organisms lacking a cell wall. They are larger in size than bacteria and viruses, and can form a protective coat, which makes them resistant to treatment and environmental decay. To date, Cryptosprodium parvum is the only Cryptosporidium species known to cause disease in humans. It causes gastrointestinal disorders. There have been some waterborne disease outbreaks related to Cryptosprodium parvum. The illness may become chronic and severe in people with weakened immune systems. A human feeding study using health volunteers showed that 132 oocysts would infect 50% of the population (DuPont, et. al., 1995). Cryptosprodium parvum oocysts are from 4 to 6 µm in size, and resistant to disinfection with chlorine. Filtration has been found to be effective in removing the protozoan (AWWA, 1999). The average number of oocysts per 100 liters from seven different references has been reported (National Research Council, 1998). These numbers are shown in Table K-1 below: Table K-1. Reported Levels of Total Coliform Microorganisms and Cryptosprodium
parvum oocysts in Untreated Wastewater
Reference Total Coliforms Cryptosprodium oocysts Occoquan, Virginia 2.4 x 10⁷ 1484 St. Petersburg, FL 8.2 x 10⁷ 1500 South Africa 2.46 x 10⁵ NT Tampa, FL NT 30 California NT NT San Diego NT 2 x 10² Denver 8 x 10⁵ 100 NT: Not tested Source: National Research Council, 1998.
Table K-2 shows the results of a study by Rose and Carnahan (1992). The numbers represent the arithmetic means of Cryptosprodium parvum oocysts in different treated waters. This study was performed at the Northeast Reclamation Facility in St. Petersburg, Florida (Rose and Carnahan, 1992).
FPL-012-252

Table K-2. Average values of Cryptosprodium oocysts
Type of Water Arithmetic mean of organisms (cycts/100L)
Raw Water 1.5 x 10³ Secondary Treatment 1.0 x 10² Secondary treatment with filtration 2.1 Reclaimed water with disinfection 0.82 Reclaimed water from storage tank 0.75 Source: Rose and Carnahan, 1992. Haas et al. (1996) estimated a maximum safe daily intake of Cryptosprodium of 3 x 10⁻⁵
organisms /L based on dose-response information developed from human exposure to Cryptosprodium oocycts, and assuming 2 L/day drinking water consumption (National Academy of Sciences, 1977). This intake was assumed as the drinking water standard not to be exceeded in the receiving media. The assumed standards for fresh and marine surface waters were adjusted to account for the reduced consumption of surface water relative to drinking water. Consumption of fresh surface water was found as 7.75 L/year assuming swimming, irrigated crop consumption, and golfing, using the exposure assumptions in Table K-3. Consumption of marine surface water was found as 4 L/year similarly, assuming consumption only during swimming. Assumed maximum concentrations are shown in the survey questionnaire.
Table K-3. Exposure to Microorganisms
Application Receptor Exposure Frequency
Amount of water ingestion in each exposure
Golf Course Irrigation Golfer Twice a week 1 ml Crop Irrigation Consumer Everyday 10 ml Recreational Impoundment
Swimmer 40 days a year (summer season only)
100 ml
Source: Tanaka, et.al. 1992 Viruses are a large group of small infectious agents. Viruses range in size from 0.02 to 0.3 µm. Viruses depend totally on living organisms for reproduction. Rotaviruses cause acute gastroenteritis. rotavirus infections in children are especially severe, and are the cause of many infant deaths in developing countries (AWWA, 1999). Rotaviruses spread by fecal-oral transmission and have been found in municipal wastewater, lakes, rivers, groundwater and tap water (Gerba et. al., 1996). Safe concentrations of rotavirus in drinking water were calculated assuming a maximum of 10-4 infections/cap-year, and the beta-Poisson dose response function of Haas et al. (1999). Water consumption for drinking water, fresh surface water, and marine surface
FPL-012-253
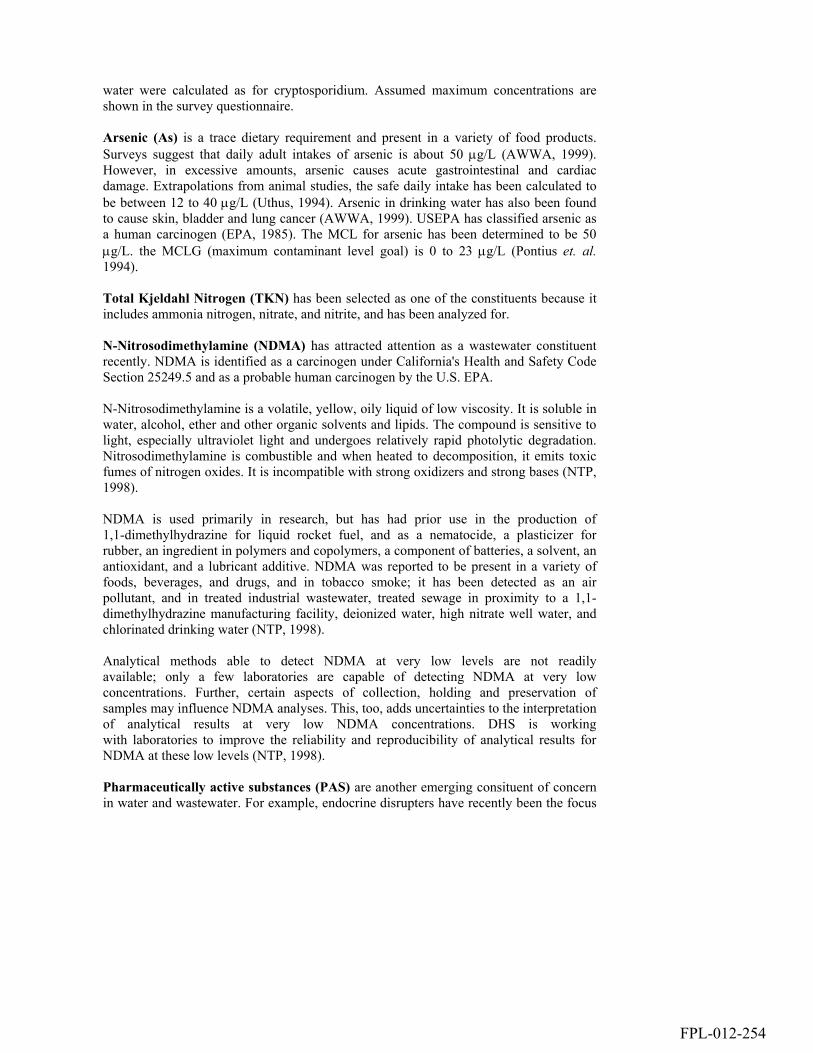
water were calculated as for cryptosporidium. Assumed maximum concentrations are shown in the survey questionnaire. Arsenic (As) is a trace dietary requirement and present in a variety of food products. Surveys suggest that daily adult intakes of arsenic is about 50 µg/L (AWWA, 1999). However, in excessive amounts, arsenic causes acute gastrointestinal and cardiac damage. Extrapolations from animal studies, the safe daily intake has been calculated to be between 12 to 40 µg/L (Uthus, 1994). Arsenic in drinking water has also been found to cause skin, bladder and lung cancer (AWWA, 1999). USEPA has classified arsenic as a human carcinogen (EPA, 1985). The MCL for arsenic has been determined to be 50 µg/L. the MCLG (maximum contaminant level goal) is 0 to 23 µg/L (Pontius et. al. 1994). Total Kjeldahl Nitrogen (TKN) has been selected as one of the constituents because it includes ammonia nitrogen, nitrate, and nitrite, and has been analyzed for. N-Nitrosodimethylamine (NDMA) has attracted attention as a wastewater constituent recently. NDMA is identified as a carcinogen under California's Health and Safety Code Section 25249.5 and as a probable human carcinogen by the U.S. EPA. N-Nitrosodimethylamine is a volatile, yellow, oily liquid of low viscosity. It is soluble in water, alcohol, ether and other organic solvents and lipids. The compound is sensitive to light, especially ultraviolet light and undergoes relatively rapid photolytic degradation. Nitrosodimethylamine is combustible and when heated to decomposition, it emits toxic fumes of nitrogen oxides. It is incompatible with strong oxidizers and strong bases (NTP, 1998). NDMA is used primarily in research, but has had prior use in the production of 1,1-dimethylhydrazine for liquid rocket fuel, and as a nematocide, a plasticizer for rubber, an ingredient in polymers and copolymers, a component of batteries, a solvent, an antioxidant, and a lubricant additive. NDMA was reported to be present in a variety of foods, beverages, and drugs, and in tobacco smoke; it has been detected as an air pollutant, and in treated industrial wastewater, treated sewage in proximity to a 1,1-dimethylhydrazine manufacturing facility, deionized water, high nitrate well water, and chlorinated drinking water (NTP, 1998). Analytical methods able to detect NDMA at very low levels are not readily available; only a few laboratories are capable of detecting NDMA at very low concentrations. Further, certain aspects of collection, holding and preservation of samples may influence NDMA analyses. This, too, adds uncertainties to the interpretation of analytical results at very low NDMA concentrations. DHS is working with laboratories to improve the reliability and reproducibility of analytical results for NDMA at these low levels (NTP, 1998). Pharmaceutically active substances (PAS) are another emerging consituent of concern in water and wastewater. For example, endocrine disrupters have recently been the focus
FPL-012-254
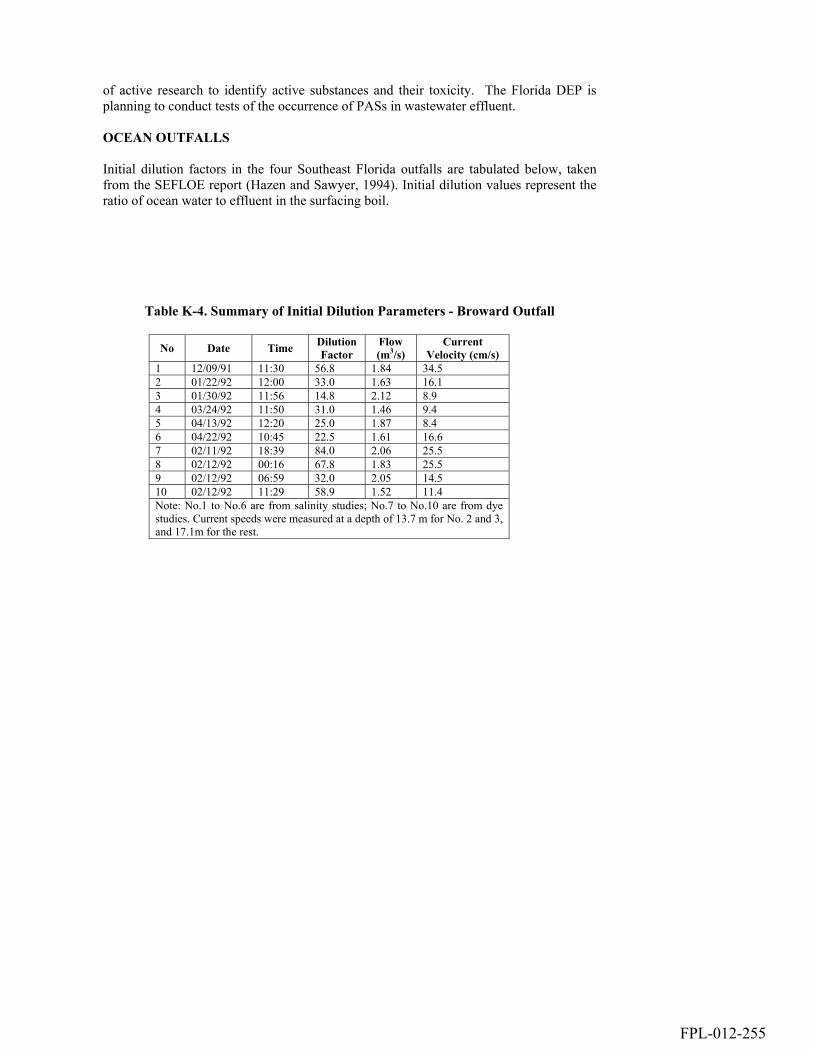
of active research to identify active substances and their toxicity. The Florida DEP is planning to conduct tests of the occurrence of PASs in wastewater effluent. OCEAN OUTFALLS Initial dilution factors in the four Southeast Florida outfalls are tabulated below, taken from the SEFLOE report (Hazen and Sawyer, 1994). Initial dilution values represent the ratio of ocean water to effluent in the surfacing boil.
Table K-4. Summary of Initial Dilution Parameters - Broward Outfall
No Date Time Dilution Factor
Flow (m3/s)
Current Velocity (cm/s)
1 12/09/91 11:30 56.8 1.84 34.5 2 01/22/92 12:00 33.0 1.63 16.1 3 01/30/92 11:56 14.8 2.12 8.9 4 03/24/92 11:50 31.0 1.46 9.4 5 04/13/92 12:20 25.0 1.87 8.4 6 04/22/92 10:45 22.5 1.61 16.6 7 02/11/92 18:39 84.0 2.06 25.5 8 02/12/92 00:16 67.8 1.83 25.5 9 02/12/92 06:59 32.0 2.05 14.5 10 02/12/92 11:29 58.9 1.52 11.4 Note: No.1 to No.6 are from salinity studies; No.7 to No.10 are from dye studies. Current speeds were measured at a depth of 13.7 m for No. 2 and 3, and 17.1m for the rest.
FPL-012-255

Table K-5. Summary of Initial Dilution Parameters - Hollywood Outfall
No Date Time Dilution
Factor Flow (m3/s)
Current Velocity (cm/s)
1 11/07/91 10:40 24.5 1.71 24.6 2 12/10/91 10:20 27.2 1.53 27.0 3 12/12/91 10:30 45.2 1.36 40.1 4 01/29/92 10:40 15.1 1.45 8.5 5 06/02/92 09:45 16.7 1.36 10.2 6 06/09/92 10:10 15.9 1.05 9.8 7 07/09/92 09:40 31.4 1.75 24.6 8 09/24/91 11:37 36.5 1.93 23.4 9 09/24/91 18:07 31.6 1.66 31.4 10 02/09/92 11:34 35.2 1.42 16.6 11 02/09/92 13:02 26.2 1.47 19.9 12 02/09/92 16:25 19.3 1.42 15.0 13 02/09/92 19:43 30.1 1.45 14.5 14 02/09/92 21:08 36.7 1.40 15.5 15 02/09/92 23:56 54.8 1.31 17.7 16 02/10/92 03:11 63.3 1.14 16.6 17 02/10/92 04:14 67.8 0.96 17.7 18 02/10/92 05:59 63.0 0.88 17.7 19 02/10/92 06:54 55.0 1.15 17.7 Note: No.1 to No.7 are from salinity studies; No.8 to No.19 are from dye studies. Current speeds were measured at a depth of 13.2 m for No. 1-3, 6.5 m for No. 8 and 9, and 16.5m for the rest.
FPL-012-256

Table K-6. Summary of Initial Dilution Parameters - Dade - North Outfall
No Date Time Dilution Factor
Flow (m3/s)
Current Velocity (cm/s)
1 09/04/91 12:40 51.7 4.47 44.7 2 09/06/91 11:10 31.1 4.31 23.5 3 01/15/91 13:50 49.1 3.90 12.6 4 05/27/92 11:56 47.7 3.80 12.3 5 09/18/91 10:52 49.3 5.03 15.7 6 09/18/91 11:31 44.1 5.06 15.9 7 09/18/91 16:15 22.9 4.83 7.7 8 09/18/91 16:59 19.0 4.91 7.7 9 09/18/91 20:34 27.5 5.16 8.3 10 09/18/91 21:30 28.0 4.89 10.6 11 09/19/91 01:34 27.5 3.82 9.7 12 09/19/91 02:21 32.8 3.31 9.7 13 02/03/92 11:39 54.6 4.56 12.5 14 02/03/92 13:15 54.6 3.88 11.7 15 02/03/92 15:17 49.7 3.94 10.8 16 02/03/92 16:49 46.7 3.94 11.3 17 02/03/92 19:28 72.0 4.25 10.7 18 02/03/92 21:51 60.0 3.99 9.8 19 02/04/92 01:42 65.5 2.83 10.7 20 02/04/92 03:08 72.0 2.33 10.7 21 02/04/92 05:24 65.5 2.50 10.7 22 02/04/92 08:19 31.7 4.50 8.9 23 02/04/92 09:55 47.5 4.29 9.8 Note: No.1 to No.4 are from salinity studies; No.5 to No.23 are from dye studies. Current speeds were measured at a depth of 6.5 m for No. 1,2 and 5-12, 13.6 m for No. 3 and 13-23, and 17.1m for No. 4
FPL-012-257

Table K-7. Summary of Initial Dilution Parameters - Dade - Central Outfall
No Date Time Dilution Factor
Flow (m3/s)
Current Velocity (cm/s)
1 12/04/91 13:20 24.4 5.97 14.3 2 01/21/92 12:20 20.9 6.42 19.4 3 05/05/92 11:00 29.3 5.70 16.4 4 05/21/92 11:30 44.7 5.04 28.1 5 06/03/92 11:30 13.7 6.81 7.2 6 06/18/92 11:20 42.0 6.44 52.5 7 07/07/92 12:00 18.6 6.29 30.8 8 07/28/92 11:00 18.1 6.32 6.8 9 02/07/92 10:13 30.0 6.21 16.6 10 02/07/92 11:11 25.8 6.52 18.7 11 02/07/92 13:55 39.3 6.92 18.7 12 02/07/92 14:55 15.5 6.61 18.9 13 02/07/92 18:08 19.0 6.19 21.0 14 02/07/92 19:17 24.7 6.05 20.0 15 02/07/92 22:59 20.0 6.10 20.5 16 02/07/92 23:55 29.7 6.05 21.0 17 02/08/92 03:01 29.7 4.53 18.7 18 02/08/92 04:37 43.1 4.68 15.5 19 02/08/92 07:18 25.3 4.64 14.5 20 02/08/92 08:40 19.0 5.69 13.5 Note: No.1 to No.8 are from salinity studies; No.9 to No.20 are from dye studies. Current speeds were measured at a depth of 16.8 m
Chronic water parameters such as chlorine and certain metal concentrations are based on 4-day average concentration exposure. For chronic exposure the dilution factors in Table K-6 might be used. Table 8 has been adopted from SEFLOE report (Hazen and Sawyer, 1994).
Table K-8. Flux-Averaged Initial Dilution
Outfall Flow (m3/s) 4-day avg. current velocity (cm/s)
Flux-avg. Initial Dilution
Broward 2.89 15.7 43.3:1 Hollywood 2.37 13.7 28.4:1 Dade-North 5.52 13.2 50.1:1 Dade-Central 7.89 13.6 28.3:1 For subsequent dilution in the farfield, the plot from SEFLOE report shown below might be used.
FPL-012-258
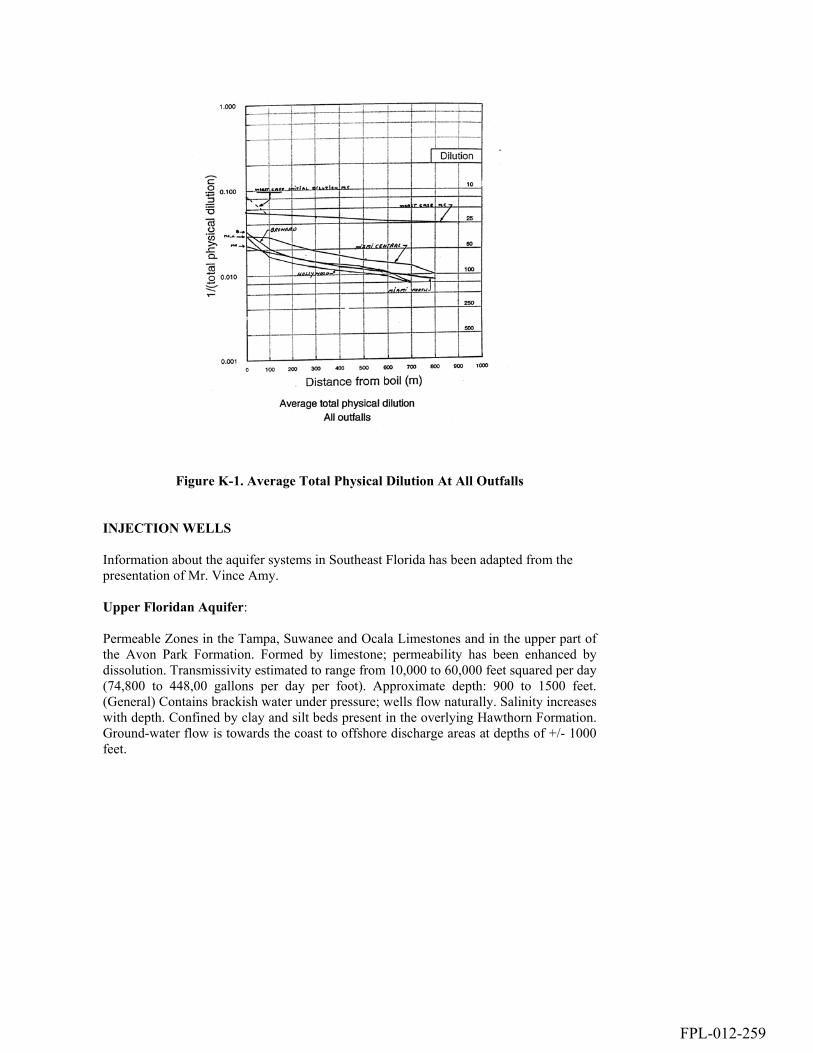
Figure K-1. Average Total Physical Dilution At All Outfalls
INJECTION WELLS Information about the aquifer systems in Southeast Florida has been adapted from the presentation of Mr. Vince Amy. Upper Floridan Aquifer: Permeable Zones in the Tampa, Suwanee and Ocala Limestones and in the upper part of the Avon Park Formation. Formed by limestone; permeability has been enhanced by dissolution. Transmissivity estimated to range from 10,000 to 60,000 feet squared per day (74,800 to 448,00 gallons per day per foot). Approximate depth: 900 to 1500 feet. (General) Contains brackish water under pressure; wells flow naturally. Salinity increases with depth. Confined by clay and silt beds present in the overlying Hawthorn Formation. Ground-water flow is towards the coast to offshore discharge areas at depths of +/- 1000 feet.
FPL-012-259
Floridan Aquifer System - Middle Confining Unit Formed by the lower part of the Avon Park Formation and, locally, parts of the upper Oldsmar Formation. Generally occurs between 1500 and 3000 feet +/- in the study area. The term “confining unit” is to a degree a misnomer; as it contains units that have low and relatively high permeability. In general it has an overall lower permeability than the overlying upper Floridan and the underlying lower unit. Composed of limestone and dolomite; the dolomite is a secondary feature created by the alteration of the original limestone. Salinity of the ground water ranges from brackish in the upper portion of the unit to saline (seawater composition) and occurs at a depth of 1700 to 2000 feet (approx). Regionally, the nature of this unit has the greatest amount of information available, as it is the unit forming the confining sequence for the underlying injection zone. Permits for construction and testing on injection wells include specific requirements for identifying a “confining bed” (sequence is a more meaningful term) and collecting information on the permeability of these units. Floridan Aquifer - Middle Confining Unit - Properties Depth covered: 1360 to 2993 feet Information vertical and horizontal permeability and porosity. Vertical permeability: (values in cm/sec.) Mean: 0.000283 Median: 0.000046 Standard Deviation: 0.0007146 Minimum: 9.66E-10 Maximum: 0.005 Porosity: ( values as decimal fraction of 1) Mean: 0.317 Median: 0.33 Standard Deviation: 0.091 Minimum: 0.034 Maximum: 0.45 Horizontal Permeability: (values in cm/sec) Mean: 0.000256 Median: 0.000074 Standard Deviation: 0.000582 Minimum: 2.5E-09 Maximum: 0.004 Floridan Aquifer System - Lower Unit Formed by the lower part of the Oldsmar Formation. Consists primarily of massive to cavernous, highly permeable dolomite (secondary). This system is present throughout southern peninsular Florida; known as the Boulder Zone. Cavities range from inches to feet in size; system is interconnected, giving rise to high transmissivity. Forms the disposal zone for treated sewage effluent because of its high transmissivity. Water
FPL-012-260
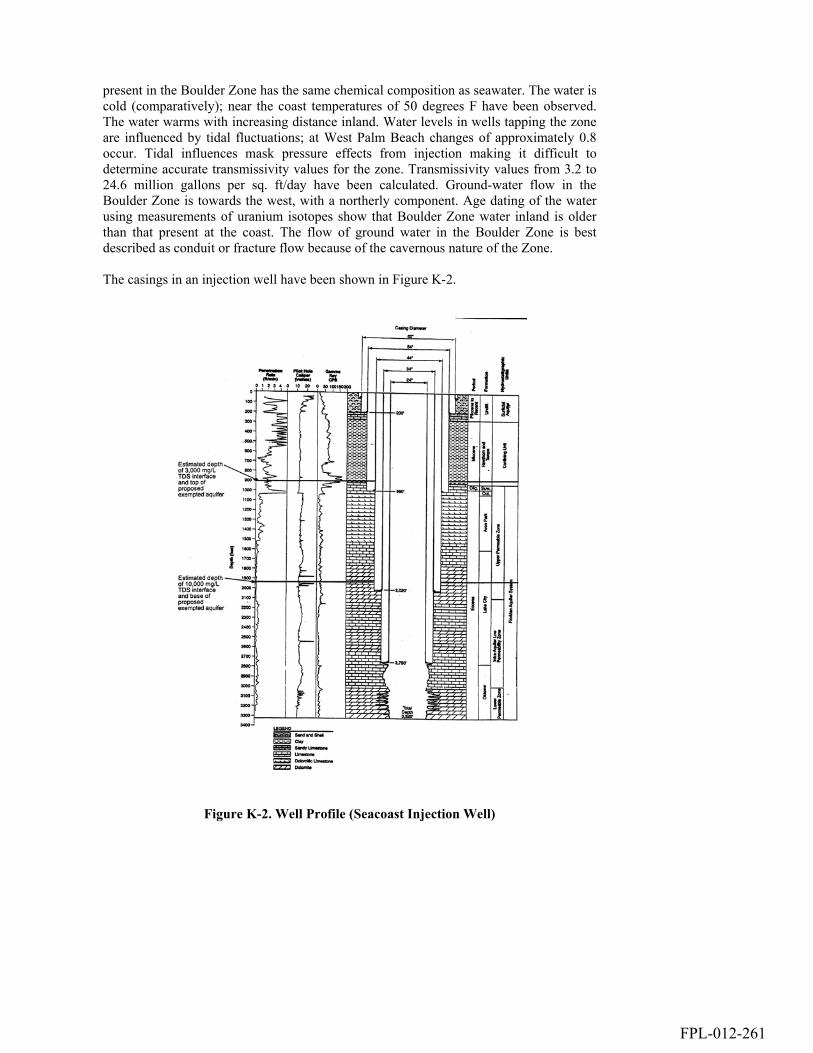
present in the Boulder Zone has the same chemical composition as seawater. The water is cold (comparatively); near the coast temperatures of 50 degrees F have been observed. The water warms with increasing distance inland. Water levels in wells tapping the zone are influenced by tidal fluctuations; at West Palm Beach changes of approximately 0.8 occur. Tidal influences mask pressure effects from injection making it difficult to determine accurate transmissivity values for the zone. Transmissivity values from 3.2 to 24.6 million gallons per sq. ft/day have been calculated. Ground-water flow in the Boulder Zone is towards the west, with a northerly component. Age dating of the water using measurements of uranium isotopes show that Boulder Zone water inland is older than that present at the coast. The flow of ground water in the Boulder Zone is best described as conduit or fracture flow because of the cavernous nature of the Zone. The casings in an injection well have been shown in Figure K-2.
Figure K-2. Well Profile (Seacoast Injection Well)
FPL-012-261

REFERENCES AWWA, 1999. Letterman, R. D. (ed.) Water Quality and Treatment - A handbook of
Community Water Supplies. McGraw-Hill, New York DuPont, H. L., C.L. Chappell, C.r. Sterling, P.C. Okhuysen, J.B. Rose, and W.
Jabukowski, 1995. "The Infectivity of Cryptosporidium parvum in healthy volunteers" New England Journal of Medicine, 332, pp. 855-859
Gerba, C.P., J. B. Rose, C.N. Haas, and K.D. Crabtree. "Waterborne Rotavirus: A Risk
Assessment" Water Research vol.30. pp. 2929-2940 Haas, C.N.; C.S. Crockett, J.B. Rose, C.P. Gerba, A.M. Fazil, 1996. Assessing the Risk
posed by oocycts in drinking water. Journal AWWA September. pp.131-136 Haas, C.N., J.B. Rose, and C.P. Gerba. Quantitative Microbial Risk Assessment, John
Wiley & Sons, Inc., New York,449 pp. Hazen and Sawyer Consulting Engineering PC, 1994. Southeast Florida Outfall
Experiment II. National Academy of Sciences, 1977. "Drinking Water and Health" National Academy
Press, Washington D. C. National Research Council, 1998. "Issues in Potable Water Use: The Viability of
Augmenting Drinking Water Supplies with Reclaimed Water." National Academy Press, Washington, D.C.
National Toxicology Program (NTP), 1998, "N-Nitrosodimethylamine CAS No.62-75-
9," Eighth Report on Carcinogens, 1998 Summary, Public Health Service, US Department of Health and Human Services.
Pontius, F.W., K.G. Brown and C. J.Chen. 1994. " Health Implications of Arsenic in
Drinking Water" Journal AWWA, 86, pp. 52-63 Rose, J.B. and R.P. Carnahan, 1992. "Pathogenic Removal by Full Scale Wastewater
Treatment" Contract SP249 Florida Department of Environmental Regulation. Tanaka, H., T. Asano, E.D. Schroeder, G. Tchobanoglous, 1998. Estimating the safety of
wastewater reclamation and reuse using enteric virus monitoring data. Water Environment Research vol. 70 pp. 39-51
Uthus, E. O., 1994 " Estimation of Safe and Adequate Daily Intake for Arsenic" In Risk
Assessment of Essential Elements, W. Mertz, C.O. Abernathy, and S.S. Olin, eds. Washington D.C.: International Life Sciences Institute Press.
Formatted
FPL-012-262
93
APPENDIX L. SUMMARY OF MODIFIED DELPHI RESULTS, ASSESSED BELIEVED PROBABILITIES, AND FULL BELIEVED PROBABILITY DISTRIBUTIONS
FPL-012-263

Table L-1. Input and Results of the Predictive Bayesian Compound Poisson Risk Assessment
Constituent Total Believed Violation Days (Predictive Bayesian Assessment) Number of Events in 30 Years Duration of Events Number of Events in 30
Years Duration of Events
Mean St. Dev. Max. Min. Median 95%
Exceed-ance level
Delphi Believed Delphi Believed Delphi Believed Delphi Believed
1.n.1.2.1.1
Arsenic 1.0286 65.3732 7953 0 0 0 0.00358 0.0262 1.17 27.9021
Microbial 0.1014 10.3027 1434 0 0 0 0.00178 0.0099 2.385 24.0464
NDMA 0.4581 24.7593 2548 0 0 0 0.00542 0.0372 15.9324 28.114
1.n.1.2.1
TKN (canal) 10.6672 194.341 9098 0 0 1.7955 0.09869 0.5403 14.19 48.0708
1.1 to 1.n.1.1 1.n.1 to 1.n.1.1
Dee
p W
ell I
njec
tion
TKN (Biscayne) 0.000013 0.0013 0.1322 0 0 0 5.7E-6 0.0001 0.6545 11.4352 4.9E-7 0 0.37 7.5657
2.1 to 2.n.3 2.2 to 2.n.3
Arsenic 13.2365 234.934 8736 0 0 1.6584 0.001 0 0.2593 3.0091 0.097 0.6123 0.7860 15.9274
Microbial 50.2852 487.0291 9884 0 0.2259 36.4245 0.0153 0.0817 2.3956 44.4526 1.1247 6.66736 8.9406 58.5455
NDMA 27.4743 315.151 9495 0 0 18.7566 0.1431 0.7941 0.8524 15.2301 0.6178 3.453 4.2317 40.0536
2.1 to 2.n.2 2.2 to 2.n.2
TKN 40.5736 390.0292 9505 0 0.1093 34.6846 0.2817 1.5818 1.16 19.9891 0.358 2.06 1.5449 54.9021
2.1 to 2.n.3 2.2 to 2.n.3
Oce
an O
utfa
ll
TKN (cont) 0.0521 0.2819 0.786 17.481 0.6381 3.8787 1.9422 30.8669
3.2.1
Arsenic 0.2886 27.4651 3234 0 0 0 0.0022 0.0015 1.6030 50.1563
Microbial 4.9487 138.9557 9397 0 0 0.2346 0.0191 0.1069 3.354 47.4834
NDMA 35.4112 370.6057 9972 0 0 13.2833 0.3798 1.0829 71.57 94.0215
3.1
TKN (canal) 144.6415 689.4461 9991 0 5.7259 507.4601 20.031 113.8345 12.09 47.453
3.2
Surf
icia
l Aqu
ifer
Rec
harg
e
TKN (shallow wells) 134.2676 684.2778 9992 0 4.3425 426.6599 1.18 86.4711 3.915 49.6224
FPL-012-264
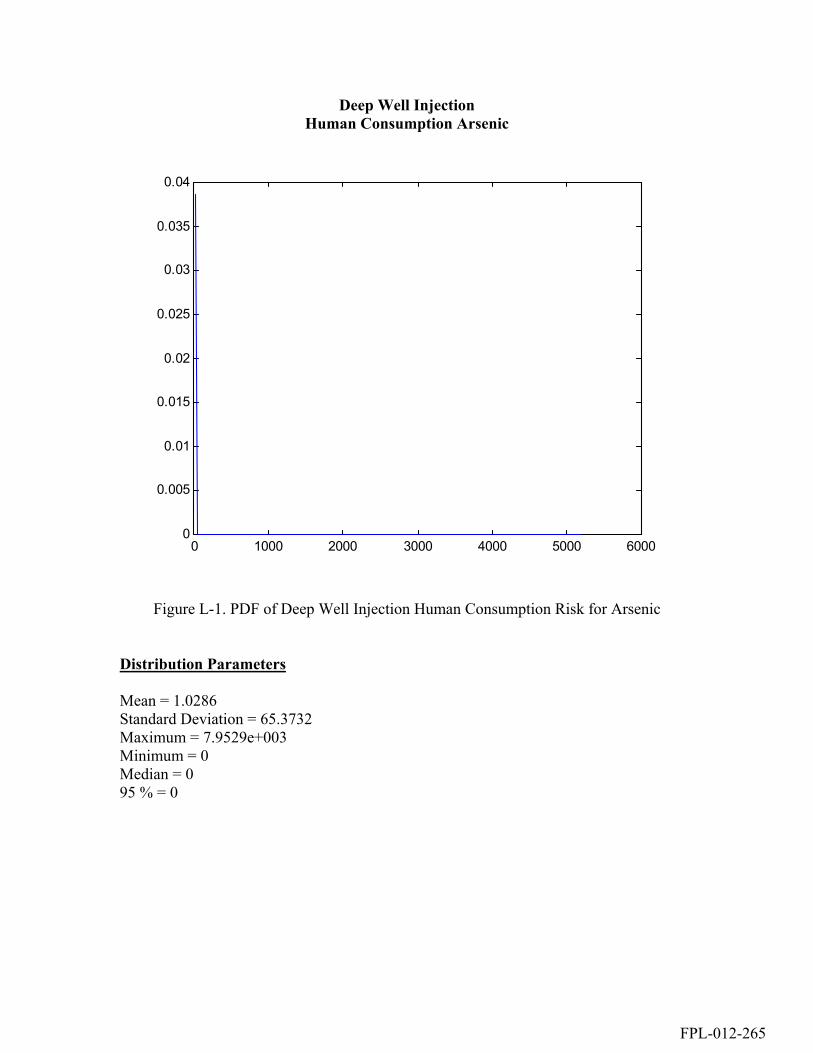
Deep Well Injection Human Consumption Arsenic
0 1000 2000 3000 4000 5000 60000
0.005
0.01
0.015
0.02
0.025
0.03
0.035
0.04
Figure L-1. PDF of Deep Well Injection Human Consumption Risk for Arsenic Distribution Parameters Mean = 1.0286 Standard Deviation = 65.3732 Maximum = 7.9529e+003 Minimum = 0 Median = 0 95 % = 0
FPL-012-265
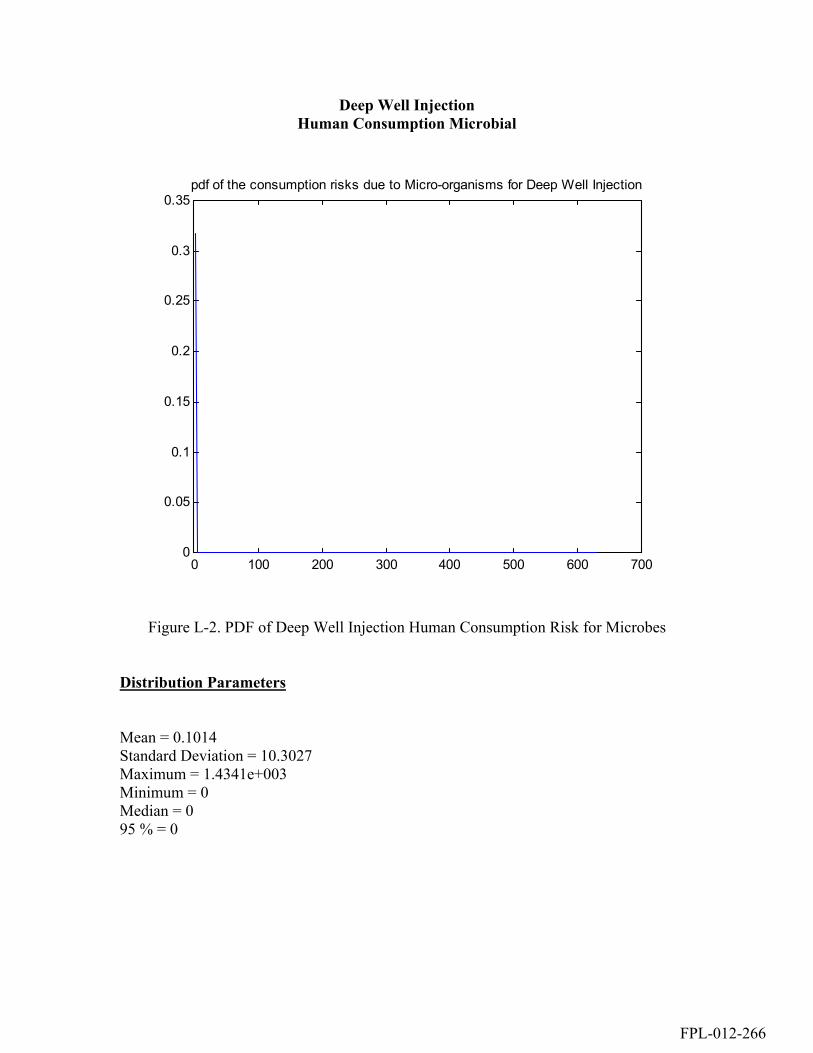
Deep Well Injection Human Consumption Microbial
0 100 200 300 400 500 600 7000
0.05
0.1
0.15
0.2
0.25
0.3
0.35pdf of the consumption risks due to Micro-organisms for Deep Well Injection
Figure L-2. PDF of Deep Well Injection Human Consumption Risk for Microbes Distribution Parameters Mean = 0.1014 Standard Deviation = 10.3027 Maximum = 1.4341e+003 Minimum = 0 Median = 0 95 % = 0
FPL-012-266
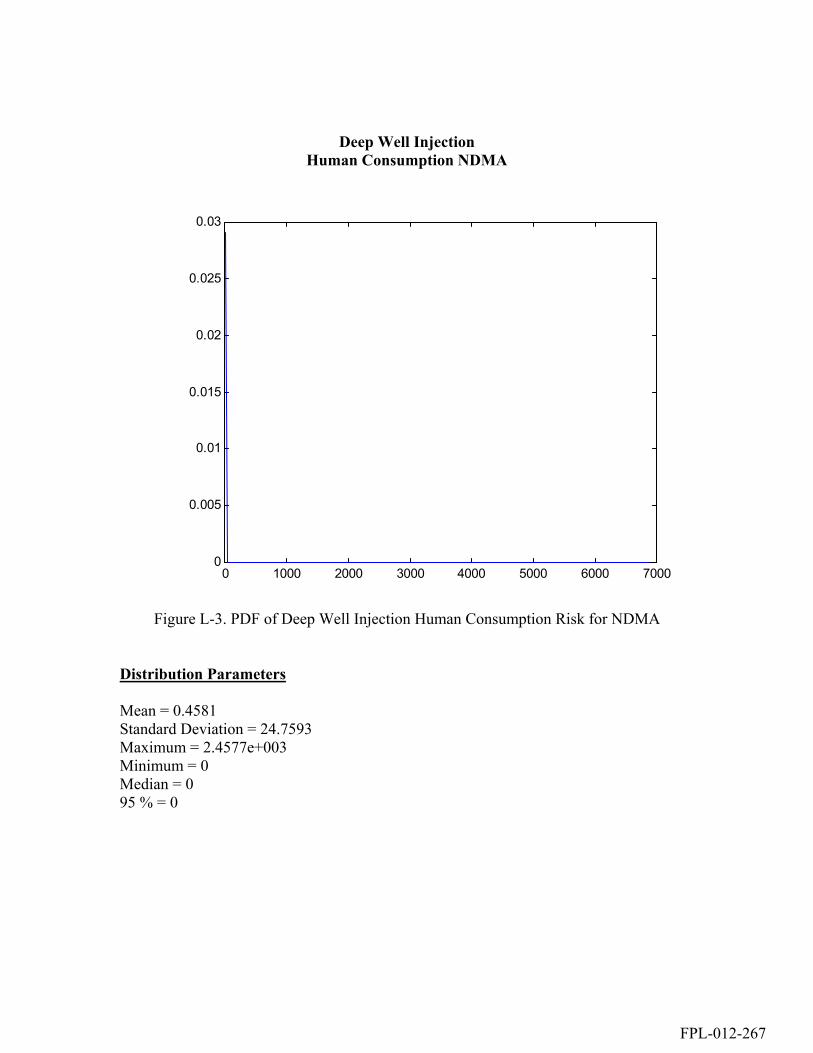
Deep Well Injection Human Consumption NDMA
Figure L-3. PDF of Deep Well Injection Human Consumption Risk for NDMA Distribution Parameters Mean = 0.4581 Standard Deviation = 24.7593 Maximum = 2.4577e+003 Minimum = 0 Median = 0 95 % = 0
0 1000 2000 3000 4000 5000 6000 70000
0.005
0.01
0.015
0.02
0.025
0.03
FPL-012-267
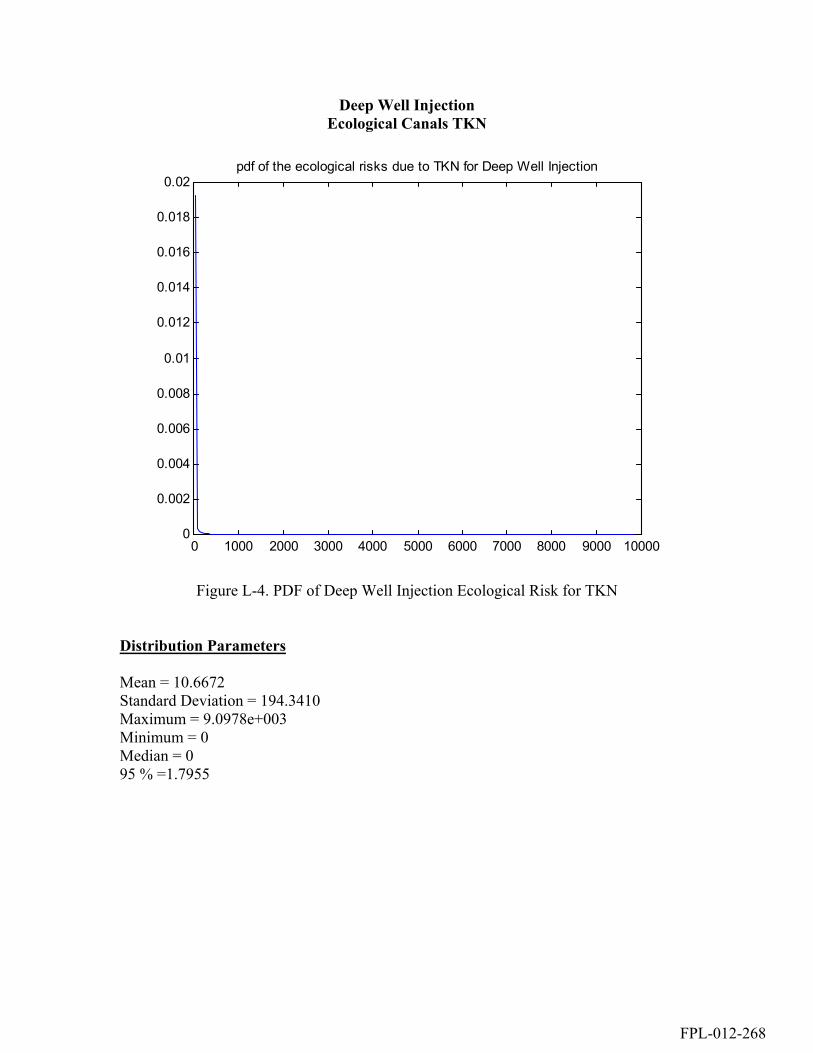
Deep Well Injection Ecological Canals TKN
0 1000 2000 3000 4000 5000 6000 7000 8000 9000 100000
0.002
0.004
0.006
0.008
0.01
0.012
0.014
0.016
0.018
0.02pdf of the ecological risks due to TKN for Deep Well Injection
Figure L-4. PDF of Deep Well Injection Ecological Risk for TKN
Distribution Parameters Mean = 10.6672 Standard Deviation = 194.3410 Maximum = 9.0978e+003 Minimum = 0 Median = 0 95 % =1.7955
FPL-012-268

Deep Well Injection Ecological Biscayne Aquifer TKN
-100 -80 -60 -40 -20 0 20 40 60 80 1000
0.5
1
1.5
2
2.5pdf of the ecological risks due to TKN in the Biscayne Aquifer for Deep Well Injection
Figure L-5. PDF of Deep Well Injection Ecological Risk for TKN at Biscayne Aquifer Distribution Parameters Mean = 0 Standard Deviation = 0 Maximum = 0 Minimum = 0 Median = 0 95 % = 0
FPL-012-269
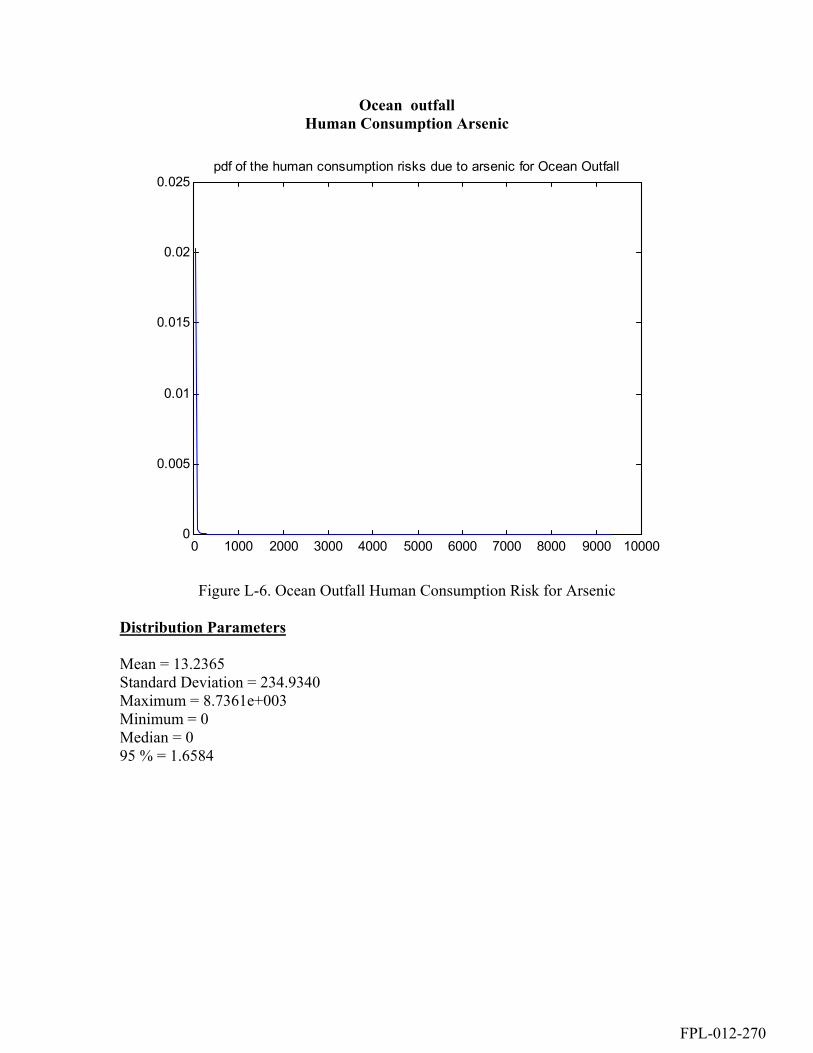
Ocean outfall Human Consumption Arsenic
0 1000 2000 3000 4000 5000 6000 7000 8000 9000 100000
0.005
0.01
0.015
0.02
0.025pdf of the human consumption risks due to arsenic for Ocean Outfall
Figure L-6. Ocean Outfall Human Consumption Risk for Arsenic
Distribution Parameters Mean = 13.2365 Standard Deviation = 234.9340 Maximum = 8.7361e+003 Minimum = 0 Median = 0 95 % = 1.6584
FPL-012-270
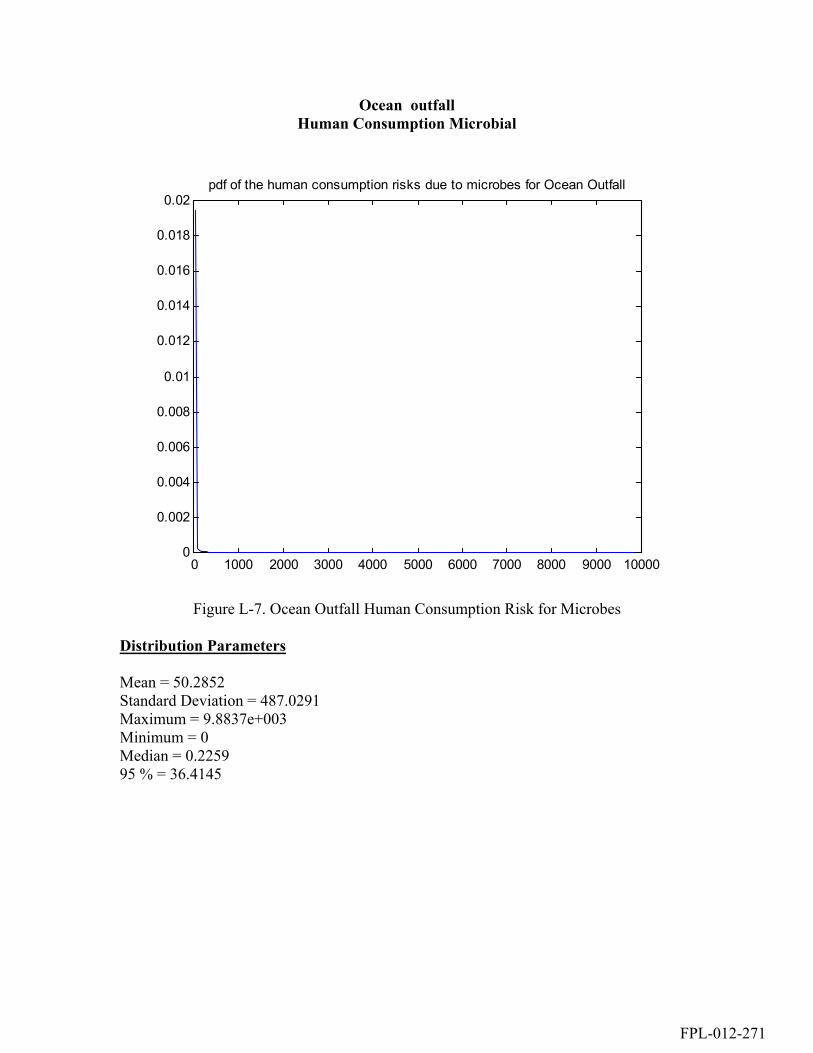
Ocean outfall Human Consumption Microbial
0 1000 2000 3000 4000 5000 6000 7000 8000 9000 100000
0.002
0.004
0.006
0.008
0.01
0.012
0.014
0.016
0.018
0.02pdf of the human consumption risks due to microbes for Ocean Outfall
Figure L-7. Ocean Outfall Human Consumption Risk for Microbes
Distribution Parameters Mean = 50.2852 Standard Deviation = 487.0291 Maximum = 9.8837e+003 Minimum = 0 Median = 0.2259 95 % = 36.4145
FPL-012-271
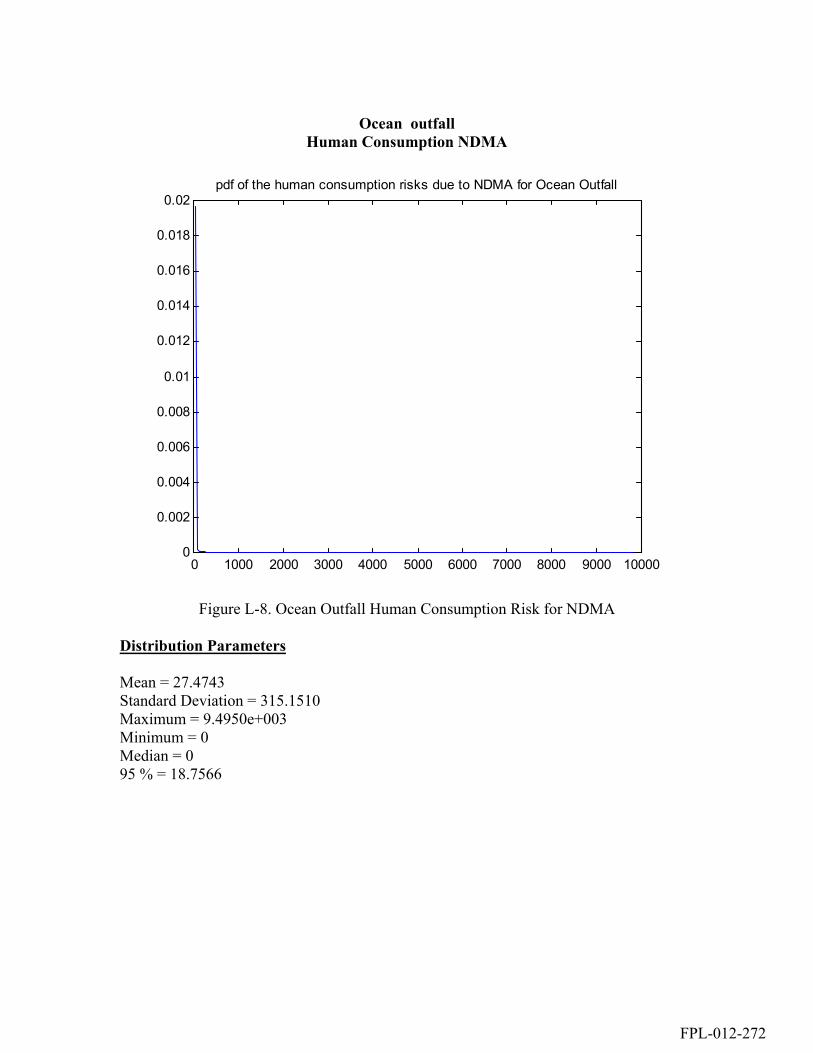
Ocean outfall
Human Consumption NDMA
0 1000 2000 3000 4000 5000 6000 7000 8000 9000 100000
0.002
0.004
0.006
0.008
0.01
0.012
0.014
0.016
0.018
0.02pdf of the human consumption risks due to NDMA for Ocean Outfall
Figure L-8. Ocean Outfall Human Consumption Risk for NDMA
Distribution Parameters Mean = 27.4743 Standard Deviation = 315.1510 Maximum = 9.4950e+003 Minimum = 0 Median = 0 95 % = 18.7566
FPL-012-272

Ocean outfall Ecological TKN
0 1000 2000 3000 4000 5000 6000 7000 8000 9000 100000
0.002
0.004
0.006
0.008
0.01
0.012
0.014
0.016
0.018
0.02pdf of the econlogical risks due to TKN for Ocean Outfall
Figure L-9. Ocean Outfall Ecological Risk for TKN
Distribution Parameters
Mean = 40.5736 Standard Deviation = 390.0292 Maximum = 9.5053e+003 Minimum = 0 Median = 0 95 % = 34.6846
FPL-012-273

Surficial Aquifer recharge Human Consumption Arsenic
0 5 10 15 20 25 30 35 400
1
2
3
4
5
6
Figure L-10. PDF of Surficial Aquifer recharge Human Consumption for Arsenic
Distribution Parameters Mean31 = 0.2886 Standard Deviation31 = 27.4651 Maximum31 = 3.2336e+003 Minimum31 = 0 Median = 0 95 % = 0
FPL-012-274
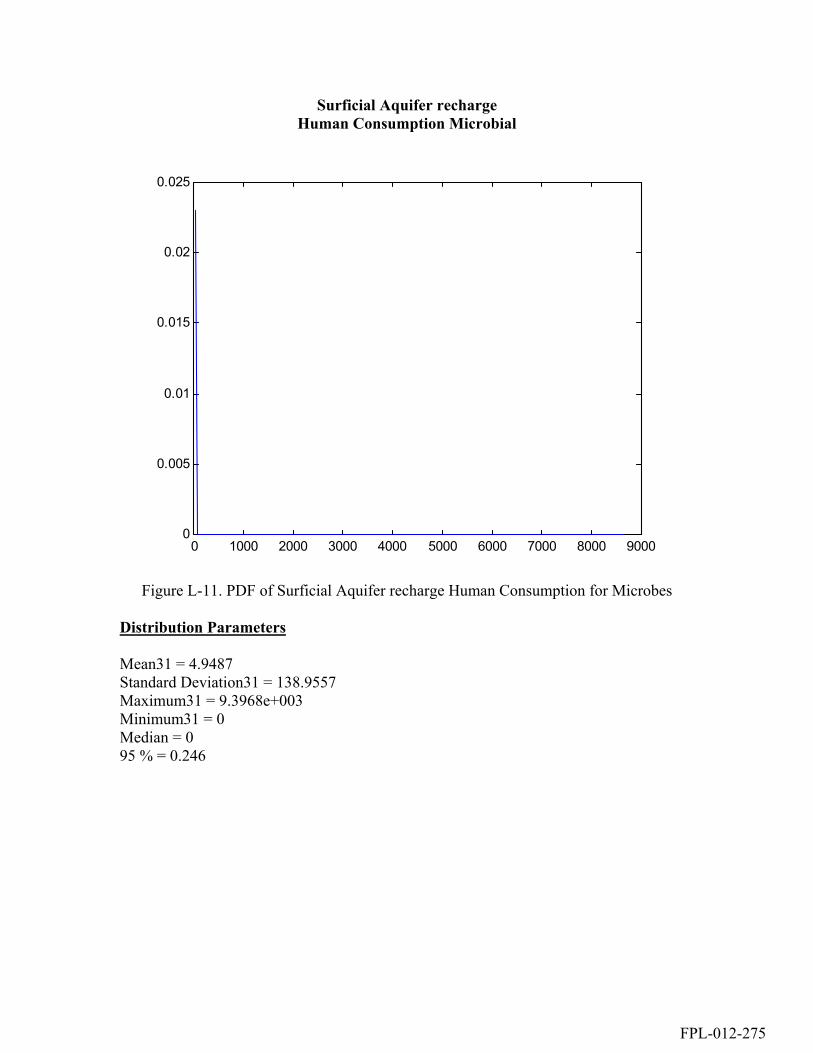
Surficial Aquifer recharge Human Consumption Microbial
0 1000 2000 3000 4000 5000 6000 7000 8000 90000
0.005
0.01
0.015
0.02
0.025
Figure L-11. PDF of Surficial Aquifer recharge Human Consumption for Microbes
Distribution Parameters Mean31 = 4.9487 Standard Deviation31 = 138.9557 Maximum31 = 9.3968e+003 Minimum31 = 0 Median = 0 95 % = 0.246
FPL-012-275
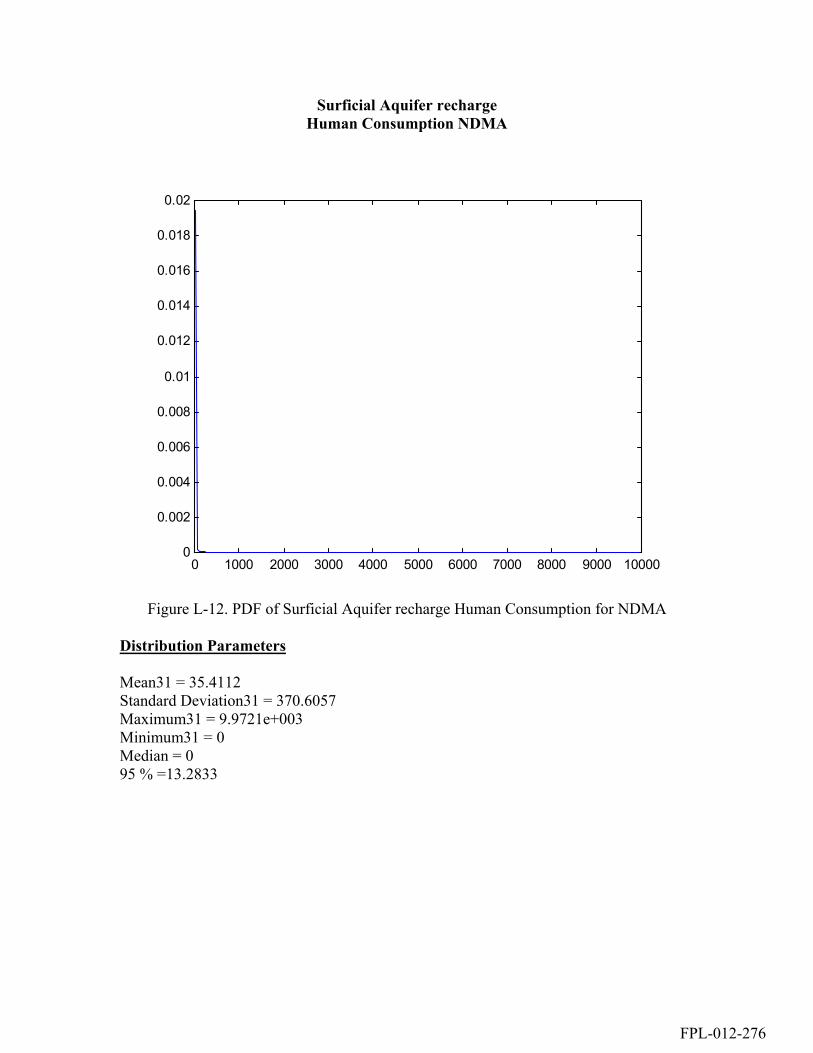
Surficial Aquifer recharge Human Consumption NDMA
0 1000 2000 3000 4000 5000 6000 7000 8000 9000 100000
0.002
0.004
0.006
0.008
0.01
0.012
0.014
0.016
0.018
0.02
Figure L-12. PDF of Surficial Aquifer recharge Human Consumption for NDMA
Distribution Parameters Mean31 = 35.4112 Standard Deviation31 = 370.6057 Maximum31 = 9.9721e+003 Minimum31 = 0 Median = 0 95 % =13.2833
FPL-012-276
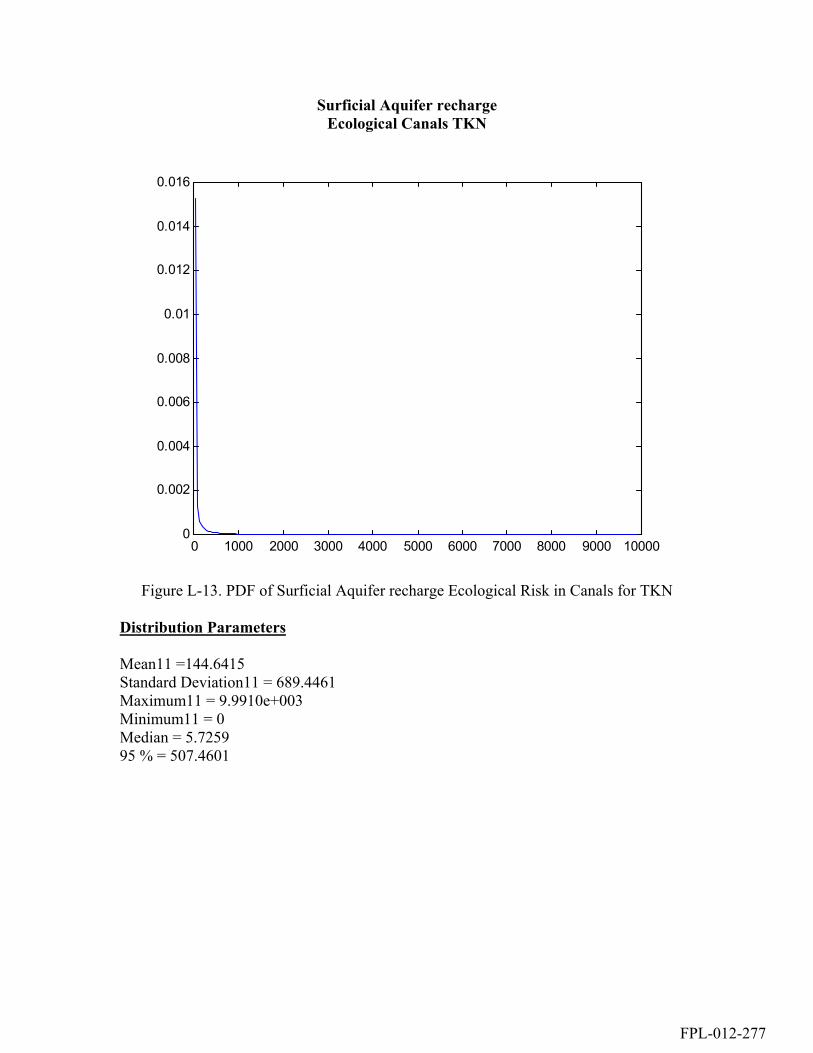
Surficial Aquifer recharge Ecological Canals TKN
0 1000 2000 3000 4000 5000 6000 7000 8000 9000 100000
0.002
0.004
0.006
0.008
0.01
0.012
0.014
0.016
Figure L-13. PDF of Surficial Aquifer recharge Ecological Risk in Canals for TKN
Distribution Parameters Mean11 =144.6415 Standard Deviation11 = 689.4461 Maximum11 = 9.9910e+003 Minimum11 = 0 Median = 5.7259 95 % = 507.4601
FPL-012-277

Surficial Aquifer recharge Ecological Shallow Wells TKN
0 1000 2000 3000 4000 5000 6000 7000 8000 9000 100000
0.002
0.004
0.006
0.008
0.01
0.012
0.014
0.016
0.018
Figure L-14. PDF of Surficial Aquifer recharge Ecological Risk in Shallow Wells for
TKN Distribution Parameters Mean21 =134.2676 Standard Deviation21 = 684.2778 Maximum21 = 9.9920e+003 Minimum21 = 0 Median = 4.3425 95 % = 426.6599
FPL-012-278