FP Trends and Policy Options in Ethiopia Draft 0 -...
30
1 Dynamics of Food Price Trends and Policy Options in Ethiopia (Preliminary Draft Report) CONFIDENTIAL NOT FOR DISTRIBUTION By Tadesse Kuma Worako (PhD) Ethiopian Development Research Institute E-mail: [email protected] Tel.: +251 911 402976, +251 115 543745 Draft report for ASARECA’s Project on Food Price Trend Analysis and Policy Options. June 2012
Transcript of FP Trends and Policy Options in Ethiopia Draft 0 -...

1
Dynamics of Food Price Trends and Policy Options in Ethiopia
(Preliminary Draft Report)
CONFIDENTIAL NOT FOR DISTRIBUTION
By
Tadesse Kuma Worako (PhD)
Ethiopian Development Research Institute
E-mail: [email protected]
Tel.: +251 911 402976, +251 115 543745
Draft report for ASARECA’s Project on Food Price Trend Analysis and Policy Options.
June 2012

2
Abstract
The recent surge in food prices continues to be a concern for policy makers as well as for the public at large. To
better understand this phenomenon, this study explores current developments in food price trends in Ethiopia and
compares them to regional and global prices. The analysis based on monthly average wholesale prices of major
cereals obtained from the Ethiopian Grain Trade Enterprise (EGTE) and Central Statistical Agency (CSA) and
International price data basis. As anecdotal results indicate: (1) Ethiopia’s cereal prices rose faster than those of
many other countries and were an important source of overall food price inflation; (2) a divergence between
nominal and real food prices for major cereals emerged as a result of high food price inflation between 2007 and
2012; and (3) between December 2006 and March 2012, domestic wheat prices have on average been more than 16
percent higher than the Import Parity Price (IPP), implying that there are non-price factors discouraging private
traders from importing. We note that if the private sector was able to import wheat during this period, they would
have limited the rise in domestic wheat prices. In general, the food prices in Ethiopia are abnormally high. Thus
more has to be done in terms of short and long term policies to ensure food security and price stabilization.
1. Introduction
Food is former necessity to survival. It is among the most important ingredients for human
development and national stability. The accessibility or existence of food is a big issue in
livelihood and it is obvious that any shock in the existence of food affects the nation negatively.
A country which can produce sufficient food can be indicated as low level of infant (adult)
mortality, low level of malnutrition; good health status, strong and active citizen and this will
help that country to grow faster as it has capable citizens that can produce effectively and
efficiently. This makes a circle of balanced diet, high productivity, and sufficient food. As some
anecdotal evidences indicate, aggregate food production at global level is more than enough for
all human population, the only problem is distribution.
The current food price inflation is global phenomenon. Except for differences in the severity, no
country is fully immune from its current surge. Global food situation from the 1970s until the
early 2000s, food prices on the international market remained relatively stable. However, in
2007, they began to soar and by mid-2008, they had reached their highest level in 30 years. Food
price stabilized in the 2009/10 and start to soar for the second time beginning January 2011 and
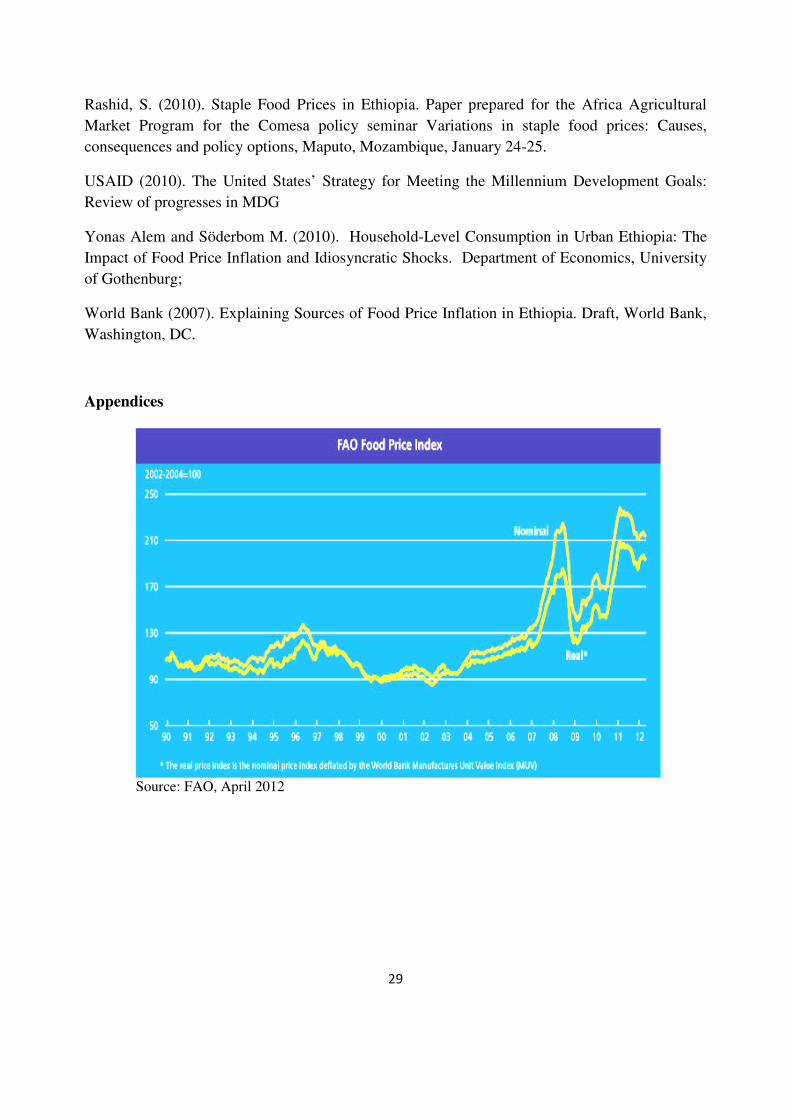
reached peak in the December 2011 exceeding its 2008 level. As FAO Food Price Index (March
2012) shows, it was averaged 214 points in April 2012, down 1.4% from March. The decline was
largely driven by falls in sugar and dairy prices followed by cereals which more than offset
strong gains in oils and a slight rise in meat prices. The FAO Food Price Index (FFPI) moved up
3
steadily in the first quarter of 2012 and while it fell in April, it still remained above the
December 2011 level. When we consider cereal prices, the FAO’s cereal price index averaged
224 points in April, down 2% from March. Maize quotations declined most, by 2.5 percent,
reflecting good production prospects. Wheat prices fell slightly, by just over 1 percent, while rice
values were also down marginally (See Annex Fig. 1). These surges were brought on by
weather-related shocks in major producing countries like drought in Russia, followed by the
country’s decision to restrict grain exports, as well as flooding in Australia and the United States,
caused shortfalls in food production and supplies as a result of climate change
When we consider price situation in the Eastern Africa as well as in Ethiopia, the first quarter of
2011 showed an upward trend in domestic food prices above the highest reported peak
experienced during the global food crisis in year 2008. During the 2007-2008 food price crisis,
some governments acted in haste, imposing export restrictions or engaging in panic buying and
hoarding, which disrupted world markets and made an already difficult situation worse.
The rising food price further worsens those below minimum income putting their purchasing
power low. According to USAID (2010) report on progress towards MDG goals, though much
has been achieved, much remains to be done in the pace of recent food price surge. In Sub-
Saharan Africa, while the proportion of people living on less than $1.25 per day has fallen, the
absolute number of people living in poverty has continued to rise to nearly 400 million. The
global food price hike in the recent years has aggravated this situation further.
Ethiopian economy was historically known for its low inflation. At present, however, this
history has changed. It has been experiencing two digit inflation and considered as one of the
most affected countries, with the exception of Zimbabwe and some small island economies, had
the strongest acceleration in food price inflation in Sub-Saharan Africa (IMF, 2008a, 2008c;
Minot, 2010, Durevall et al., 2010). The food price in Ethiopia is not only high but also relatively
more volatile. This abnormal food price surge put millions of rural and urban net food buyer at
risk. In Ethiopia where large proportion of household income (60%) goes for its purchase, let
along large surge slight increase has great implication for welfare of millions of households.
Indeed, the Government has made several policy responses to circumvent its negative effects1 on
1 Ethiopian government policy responses include: provision of subsidized wheat & edible oil to the urban poor, export ban on certain food items, lifting value added & turnover taxes on [imported] foodstuffs, etc.
4
the welfare of people, yet it is not curved. Indeed, for the government’s policy measure to be
effective, it requires the identification of the root causes of the food price surge and valuing their
relative importance.
So far, there is no consensus on why Ethiopia experienced such high food price surges. The
puzzle is that the increase in inflation in the recent years coincided with relatively favorable
harvests, whereas in the past inflation Ethiopia had typically been associated with agricultural
supply shocks due to droughts. Besides, the world food price increases are believed to have small
effects in Ethiopia because of the limited size of food trade. The International Monetary Fund
(IMF) and World Bank view as increased government expenditure which financed by an
increased money supply (through money printing) and testifies the current inflation as miss
management of money supply. Malfunctioning market at different levels and lack adequate
increase in food production due to structural factors are considered as major causes. Although
agricultural production has shown drastic growth as stated in the government’s official statistics,
high cost of transportation limited its movement from food surplus to deficit area are considered
as underlining causes.
The future is not gloomy; however, if current food price situation is not circumvented, it is
expected to be the major source of welfare deterioration for the urban and rural poor (net food
buyers). Hence, inflation in food prices is more critical for low-income economies like Ethiopia
as it hits large number of low-income households disproportionately. As some of anecdotal
evidences indicate, the failures in the food security policies in many developing countries
including Ethiopia may account that policy makers lack the evidence needed to make informed
policy decisions. The negative effects of high food prices could have been ameliorated if policy
makers had been better informed about the food price situation. Understanding its dynamics
overtime has great importance for policy makers as well for public at large.
Thus generating policy relevant evidences and informing policy makers about prevailing
situation overtime is highly relevant to intervene before food crisis. The major aim of the study is
to examine the dynamics of food price trends, underlining causes of its movement, explore
causality between major factors, and to suggest possible policy option required to be adopted to
curve current situation. In other words it is to assist contingency planning which mainly requires

5
increased information generation and synthesis of potential crises, developing strategies, putting
in place arrangements and procedures to address the needs of those adversely affected by crises.
2. Method and data sources
To explore the dynamics of food price mainly major cereals price movement using monthly
average prices compiled from Ethiopian Grain Trade Enterprise (EGTE), National Bank of
Ethiopia, Ministry of Trade (MoT), Ministry of Finance and Economic Development (MoFED),
Centeral Statistical Agency (CSA), and international data sources (FAOSTAT, etc).
Granger Causality and other related descriptive methods (price trends, import and export parity
analysis, correlation and coefficient of variation) will be applied for empirical analysis. Granger
causality is a term for a specific notion of causality in time-series analysis.
3. Production and Price trends of major cereals in Ethiopia
3.1 Cereals production
3.1.1 Importance of cereals
Cereal production and marketing are the means of livelihood for millions of households in
Ethiopia. It is the single largest sub-sector within Ethiopia’s agriculture, far exceeding all others
in terms of its share in rural employment, agricultural land use, calorie intake, and contribution to
national income. Over the past half century, cereals production and marketing has influenced
agricultural policy thinking of all three political regimes in Ethiopia (Shahid, 2010). Cereals
production, marketing and processing accounts for considerable contribution in terms of
employment, income, agricultural trade, as share of household consumption.
The extent of food price inflation could be explained in Ethiopia evaluating price trends of four
major cereals (i.e., teff, wheat, maize, sorghum and barley) which account for about 60% of total
calorie consumption, with maize and wheat representing 20 percent each. The share of teff and
sorghum is account for 13.7 and 10.3 percents respectively.

Source: Shahidur, 2010.
3.1.2 Trends of major cereals
Teff has always accounted for the largest share of cereal area cultivated (Table
share of area covered with teff
production share is 19.8% onl
(2004 to 2011) annual average growth in the area planted with
grew 13.5%. The average share of area covered with maize was about 20% while its production
contribution was 27.2% in the same period implying better productivity of maize. Area covered
with maize grew from 1.4million hectares in 2004 to 2.1 million hectares or by 47.5%.
Wheat on average account for about 17% of area and 18.2% share of cereal produ
2004 and 2011. Growth in area
1.39 million hectares to 1.43 million
considerable expansion in area (53.5%) in 2011 compared to 2004.
has decline from 1.1 to 0.98 million hectares (
covered with cereals grew by 25.6%
Average yield also has grown from abou
cereal sector performance remained promising over the periods under consideration.
30
0
20
40
60
80
100
Ocerall GDPexpenditure
Per
cen
tag
e
6
of major cereals production
has always accounted for the largest share of cereal area cultivated (Table
teff out of cereals in between 2004 and 2011 was 28.4% while its
production share is 19.8% only implying low productivity per hectare. Over the past eight years
(2004 to 2011) annual average growth in the area planted with teff was 3.5% while production
grew 13.5%. The average share of area covered with maize was about 20% while its production
ribution was 27.2% in the same period implying better productivity of maize. Area covered
with maize grew from 1.4million hectares in 2004 to 2.1 million hectares or by 47.5%.
Wheat on average account for about 17% of area and 18.2% share of cereal produ
Growth in area for wheat production is remained marginal
1.43 million hectares (2.8%) in the 2012. Sorghum has registered
considerable expansion in area (53.5%) in 2011 compared to 2004. The area covered with barely
has decline from 1.1 to 0.98 million hectares (-13.5%). On average over the same period area
covered with cereals grew by 25.6% and production is doubled from 90 to 188 million quintals.
Average yield also has grown from about 1.2 tons to 1.96tons over the same period. In general,
cereal sector performance remained promising over the periods under consideration.
40
60 62 60
Food expenditure
Calories intake
Agricultural GDP
Rural employment
Figure 1: Percentage share of cereals in the economy
has always accounted for the largest share of cereal area cultivated (Table 1). The average
out of cereals in between 2004 and 2011 was 28.4% while its
y implying low productivity per hectare. Over the past eight years
was 3.5% while production
grew 13.5%. The average share of area covered with maize was about 20% while its production
ribution was 27.2% in the same period implying better productivity of maize. Area covered
with maize grew from 1.4million hectares in 2004 to 2.1 million hectares or by 47.5%.
Wheat on average account for about 17% of area and 18.2% share of cereal production over
remained marginal. It increased from
Sorghum has registered
The area covered with barely
13.5%). On average over the same period area
and production is doubled from 90 to 188 million quintals.
t 1.2 tons to 1.96tons over the same period. In general,
cereal sector performance remained promising over the periods under consideration.
80
employment Total
cultivated area
Figure 1: Percentage share of cereals in the economy

7
Source: CSA database, 2011
3.1.3 Sources of cereal production growth
Cereal production growth in the recent years comes from combination of two potential sources:
area expansion and yield improvement. For the three major cereals (maize, wheat, and teff), both
acreage and yield have increased significantly since 2004 (Table ). Total production of these
cereals has jumped from 9 million tons in 2004 to 18.8 million tons in 2011, representing an
overall growth of 66.4 percent. Of the five cereals, Sorghum experienced the most growth
(125%), followed by teff (107%), maize (105%), wheat (76.9% ) and barely (57.8%).
3.1.4 Cereals consumption
Given the size and diversity of Ethiopia, the level and type of grain consumption varies by
region, due to differences in household preferences, income, prices, and so on. Among rural
households, per capita consumption of teff is significantly higher for non-poor households than
for poor households and is higher in the northern highlands than the south-central highlands. The
regional pattern is reversed for maize and wheat, for which per capita consumption of rural
Table 1: Estimates of Agricultural Production of Major Crops
Area (000Has) & production (000'Qtls)
Major cereals 2
004
20
05
20
06
20
07
20
08
20
09
20
10
20
11 Change b/n
2004 & 2011 (%)
Average Annual % change
Teff
Area 2136 2246 2405 2565 2481 2589 2761 2731 27.9 3.5
Production 16773 20255 21756 24377 29929 30280 31794 34835 107.7 13.5
Yield/ha 7.9 9.0 9.0 9.5 12.1 11.7 11.5 12.8 62.4 7.8
Wheat
Area 1398 1460 1474 1425 1454 1684 1553 1438 2.8 0.4
Production 16144 21766 22191 24630 23145 25376 30756 28557 76.9 9.6
Yield 11.5 14.9 15.1 17.3 15.9 15.1 19.8 19.9 72.0 9.0
Maize
Area 1393 1526 1694 1767 1768 1772 1963 2055 47.5 5.9
Production 25430 23942 33368 37764 37497 39325 38972 52189 105.2 13.2
Yield 18 16 20 21 21 22 20 25 39.1 4.9
Barely
Area 1095 998 1019 985 978 1129 1047 948 -13.5 -1.7
Production 10797 13281 12707 13521 13548 15194 17504 17033 57.8 7.2
Yield 9.9 13.3 12.5 13.7 13.9 13.5 16.7 18.0 82.3 10.3
Sorghum
Area 1254 1468 1464 1534 1615 1619 1898 1924 53.5 6.7
Production 17425 17160 21736 23160 26591 28044 29713 39599 127.3 15.9
Yield 13.9 11.7 14.8 15.1 16.5 17.3 15.7 20.6 48.1 6.0
Total Cereals
Area 7634 8081 8462 8706 8770 9233 9691 9588 25.6 3.2
Production 90007 100298 116243 128658 136456 144964 155342 188099 109.0 13.6
Yield 11.8 12.4 13.7 14.8 15.6 15.7 16.0 19.6 66.4 8.3
8
households is higher in the south-central highlands than in the northern highlands (Jeni Klugman
and Josef Loening, 2007).
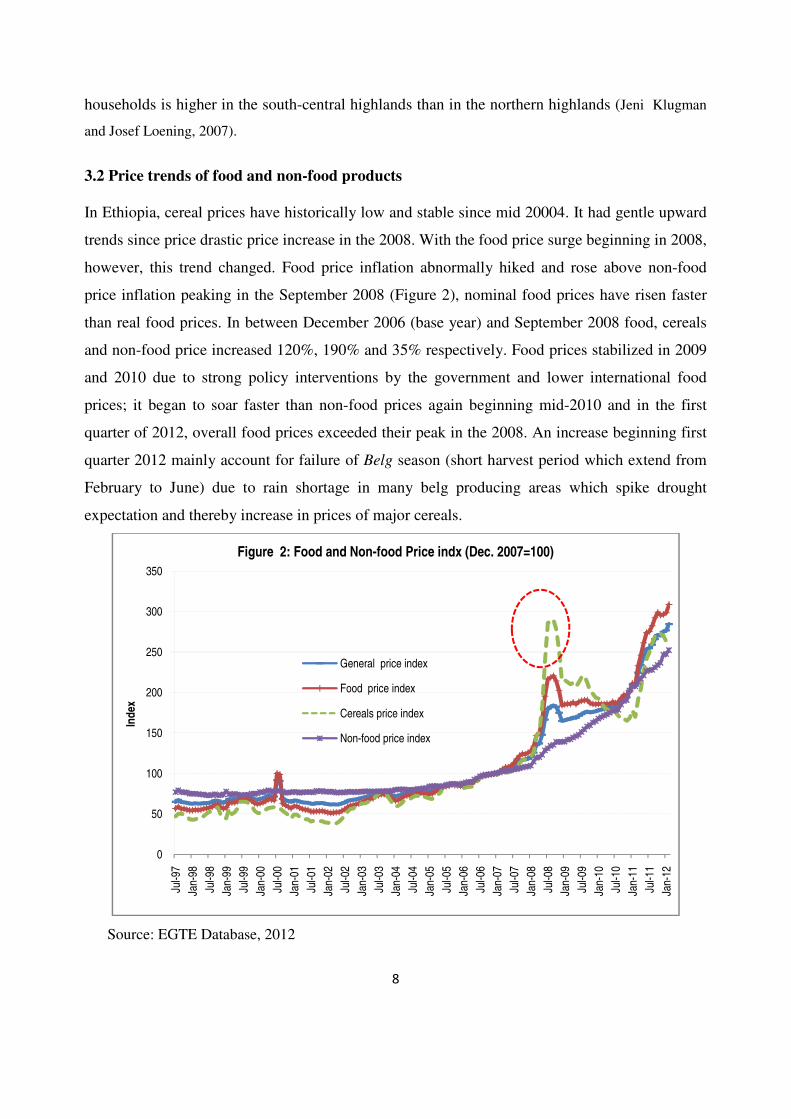
3.2 Price trends of food and non-food products
In Ethiopia, cereal prices have historically low and stable since mid 20004. It had gentle upward
trends since price drastic price increase in the 2008. With the food price surge beginning in 2008,
however, this trend changed. Food price inflation abnormally hiked and rose above non-food
price inflation peaking in the September 2008 (Figure 2), nominal food prices have risen faster
than real food prices. In between December 2006 (base year) and September 2008 food, cereals
and non-food price increased 120%, 190% and 35% respectively. Food prices stabilized in 2009
and 2010 due to strong policy interventions by the government and lower international food
prices; it began to soar faster than non-food prices again beginning mid-2010 and in the first
quarter of 2012, overall food prices exceeded their peak in the 2008. An increase beginning first
quarter 2012 mainly account for failure of Belg season (short harvest period which extend from
February to June) due to rain shortage in many belg producing areas which spike drought
expectation and thereby increase in prices of major cereals.
Source: EGTE Database, 2012
0
50
100
150
200
250
300
350
Jul-9
7
Jan-
98
Jul-9
8
Jan-
99
Jul-9
9
Jan-
00
Jul-0
0
Jan-
01
Jul-0
1
Jan-
02
Jul-0
2
Jan-
03
Jul-0
3
Jan-
04
Jul-0
4
Jan-
05
Jul-0
5
Jan-
06
Jul-0
6
Jan-
07
Jul-0
7
Jan-
08
Jul-0
8
Jan-
09
Jul-0
9
Jan-
10
Jul-1
0
Jan-
11
Jul-1
1
Jan-
12
Ind
ex
Figure 2: Food and Non-food Price indx (Dec. 2007=100)
General price index
Food price index
Cereals price index
Non-food price index

3.2.1 Nominal price of major cereals
The nominal prices of teff and
doubling between mid-2007 and mid
relatively stable over 2005-2007, but jumped about four
Since mid-2008, prices of all of them
almost half and wheat prices by almost a quarter, but
remained sticky compared all others.
Source: EGTE Database, 2012
3.2.2 Nominal and real prices of cereals
Real food prices are refers to prices adjusted for inflation
inflation by deflating in Consumer Price Index (CPI)
prices remained above nominal price since December 2006 implying
Figures 4 illustrate trends in nominal and real prices of
higher than nominal price till December 2006
started to widen and moved far apart beg
surge in the nominal price in the later period, real prices exhibited
0
200
400
600
800
1000
1200
Jan-
02
Jun-
02
Nov
-02
Apr
-03
Sep
-03
Pri
ce (B
irr/
100k
gs)
Figure 3: Nominal Cereals price trends for Addis Ababa Market
9
Nominal price of major cereals
and wheat rose gradually over the period 2005-2007 before more than
2007 and mid-2008. In contrast, maize and sorghum
2007, but jumped about four-fold between mid
prices of all of them have fallen at different rates. Maize price declined
almost half and wheat prices by almost a quarter, but teff prices have hardly declined at all
remained sticky compared all others.
Source: EGTE Database, 2012
Nominal and real prices of cereals
refers to prices adjusted for inflation and nominal prices are adjusted for
inflation by deflating in Consumer Price Index (CPI). As shown in Figures 4
remained above nominal price since December 2006 implying low cereal price inflation.
illustrate trends in nominal and real prices of teff in Ethiopia.
higher than nominal price till December 2006. Divergence between nominal and real price
started to widen and moved far apart beginning May 2008 with drastic price inflation. Despite
surge in the nominal price in the later period, real prices exhibited falling
Sep
-03
Feb
-04
Jul-0
4
Dec
-04
May
-05
Oct
-05
Mar
-06
Aug
-06
Jan-
07
Jun-
07
Nov
-07
Apr
-08
Sep
-08
Feb
-09
Jul-0
9
Dec
-09
Figure 3: Nominal Cereals price trends for Addis Ababa Market
Teff
Wheat white
Maize white
Sorghum white
2007 before more than
and sorghum prices were
fold between mid-2007 and mid-2008.
fferent rates. Maize price declined by
prices have hardly declined at all and
and nominal prices are adjusted for
. As shown in Figures 4-7, real staple food
low cereal price inflation.
in Ethiopia. Real price of teff was
. Divergence between nominal and real price
inning May 2008 with drastic price inflation. Despite
falling since January 2009
Dec
-09
May
-10
Oct
-10
Mar
-11
Aug
-11
Jan-
12
Figure 3: Nominal Cereals price trends for Addis Ababa Market
10
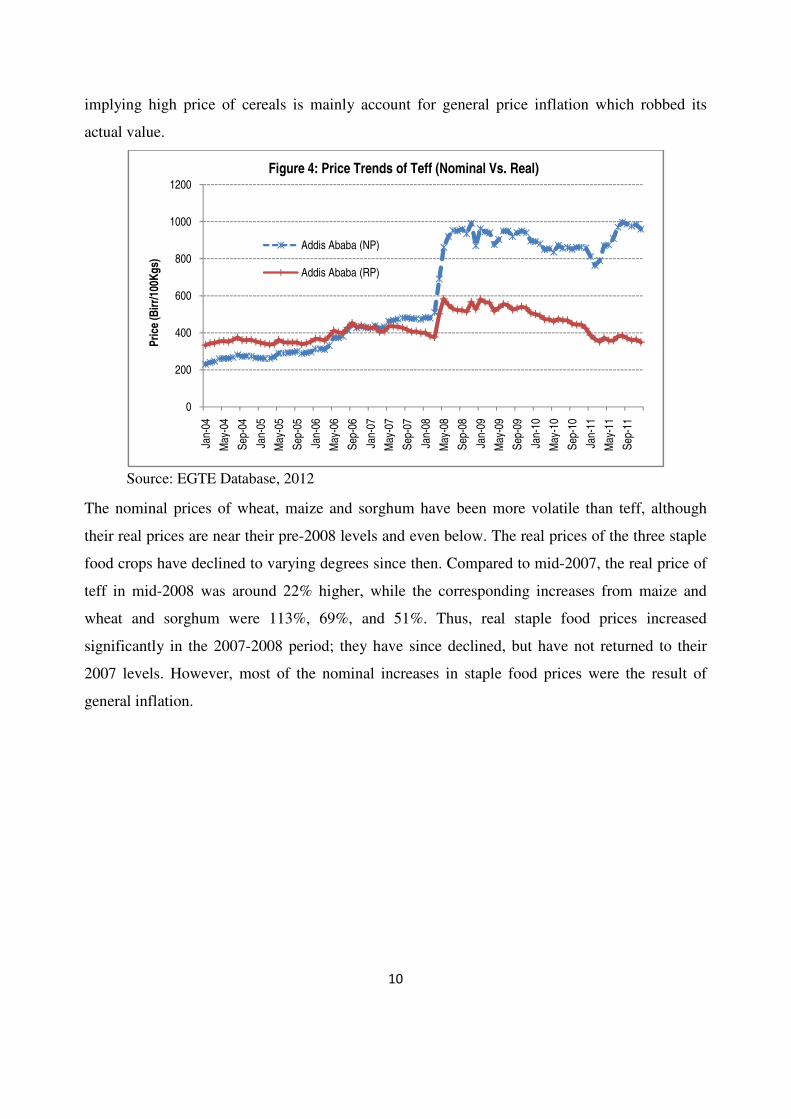
implying high price of cereals is mainly account for general price inflation which robbed its
actual value.
Source: EGTE Database, 2012
The nominal prices of wheat, maize and sorghum have been more volatile than teff, although
their real prices are near their pre-2008 levels and even below. The real prices of the three staple
food crops have declined to varying degrees since then. Compared to mid-2007, the real price of
teff in mid-2008 was around 22% higher, while the corresponding increases from maize and
wheat and sorghum were 113%, 69%, and 51%. Thus, real staple food prices increased
significantly in the 2007-2008 period; they have since declined, but have not returned to their
2007 levels. However, most of the nominal increases in staple food prices were the result of
general inflation.
0
200
400
600
800
1000
1200
Jan-
04
May
-04
Sep
-04
Jan-
05
May
-05
Sep
-05
Jan-
06
May
-06
Sep
-06
Jan-
07
May
-07
Sep
-07
Jan-
08
May
-08
Sep
-08
Jan-
09
May
-09
Sep
-09
Jan-
10
May
-10
Sep
-10
Jan-
11
May
-11
Sep
-11
Pri
ce (B
irr/
100K
gs)
Figure 4: Price Trends of Teff (Nominal Vs. Real)
Addis Ababa (NP)
Addis Ababa (RP)
11
Source: EGTE Database, 2012
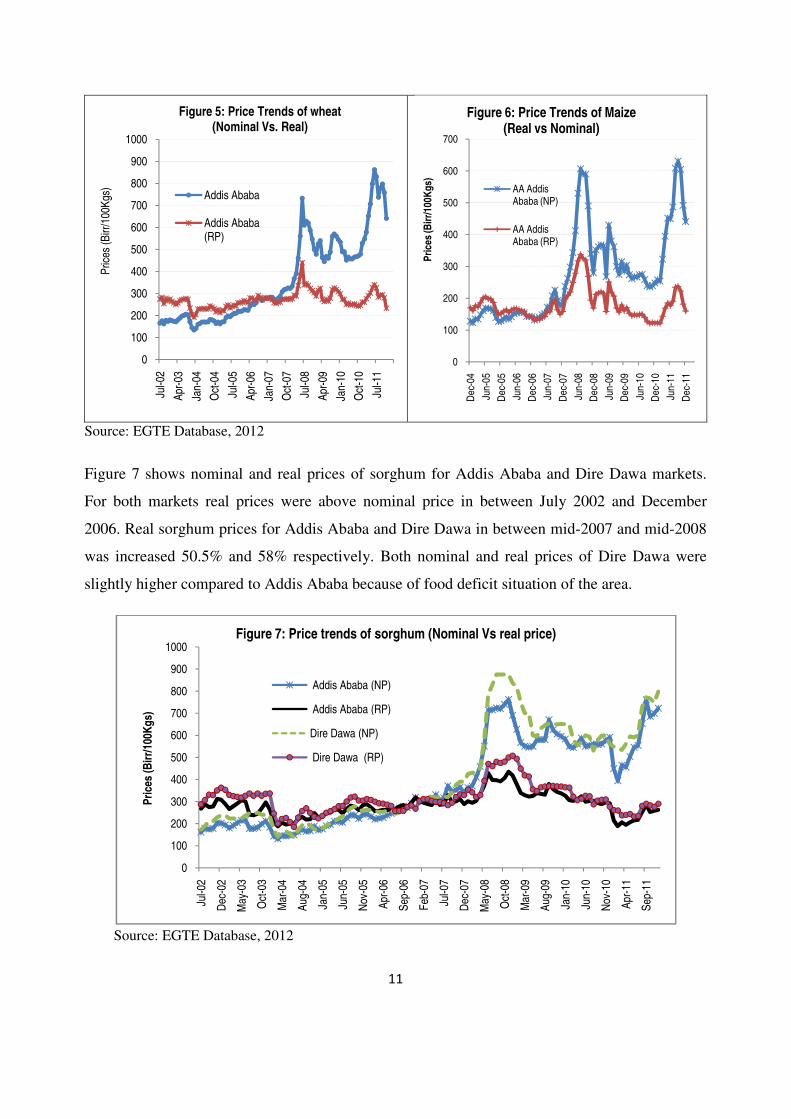
Figure 7 shows nominal and real prices of sorghum for Addis Ababa and Dire Dawa markets.
For both markets real prices were above nominal price in between July 2002 and December
2006. Real sorghum prices for Addis Ababa and Dire Dawa in between mid-2007 and mid-2008
was increased 50.5% and 58% respectively. Both nominal and real prices of Dire Dawa were
slightly higher compared to Addis Ababa because of food deficit situation of the area.
Source: EGTE Database, 2012
0
100
200
300
400
500
600
700
800
900
1000
Jul-0
2
Apr
-03
Jan-
04
Oct
-04
Jul-0
5
Apr
-06
Jan-
07
Oct
-07
Jul-0
8
Apr
-09
Jan-
10
Oct
-10
Jul-1
1
Pric
es (B
irr/1
00K
gs)
Figure 5: Price Trends of wheat (Nominal Vs. Real)
Addis Ababa
Addis Ababa (RP)
0
100
200
300
400
500
600
700
Dec
-04
Jun-
05
Dec
-05
Jun-
06
Dec
-06
Jun-
07
Dec
-07
Jun-
08
Dec
-08
Jun-
09
Dec
-09
Jun-
10
Dec
-10
Jun-
11
Dec
-11
Pri
ces
(Bir
r/10
0Kg
s)
Figure 6: Price Trends of Maize (Real vs Nominal)
AA Addis Ababa (NP)
AA Addis Ababa (RP)
0
100
200
300
400
500
600
700
800
900
1000
Jul-0
2
Dec
-02
May
-03
Oct
-03
Mar
-04
Aug
-04
Jan-
05
Jun-
05
Nov
-05
Apr
-06
Sep
-06
Feb
-07
Jul-0
7
Dec
-07
May
-08
Oct
-08
Mar
-09
Aug
-09
Jan-
10
Jun-
10
Nov
-10
Apr
-11
Sep
-11
Pri
ces
(Bir
r/10
0Kg
s)
Figure 7: Price trends of sorghum (Nominal Vs real price)
Addis Ababa (NP)
Addis Ababa (RP)
Dire Dawa (NP)
Dire Dawa (RP)
12
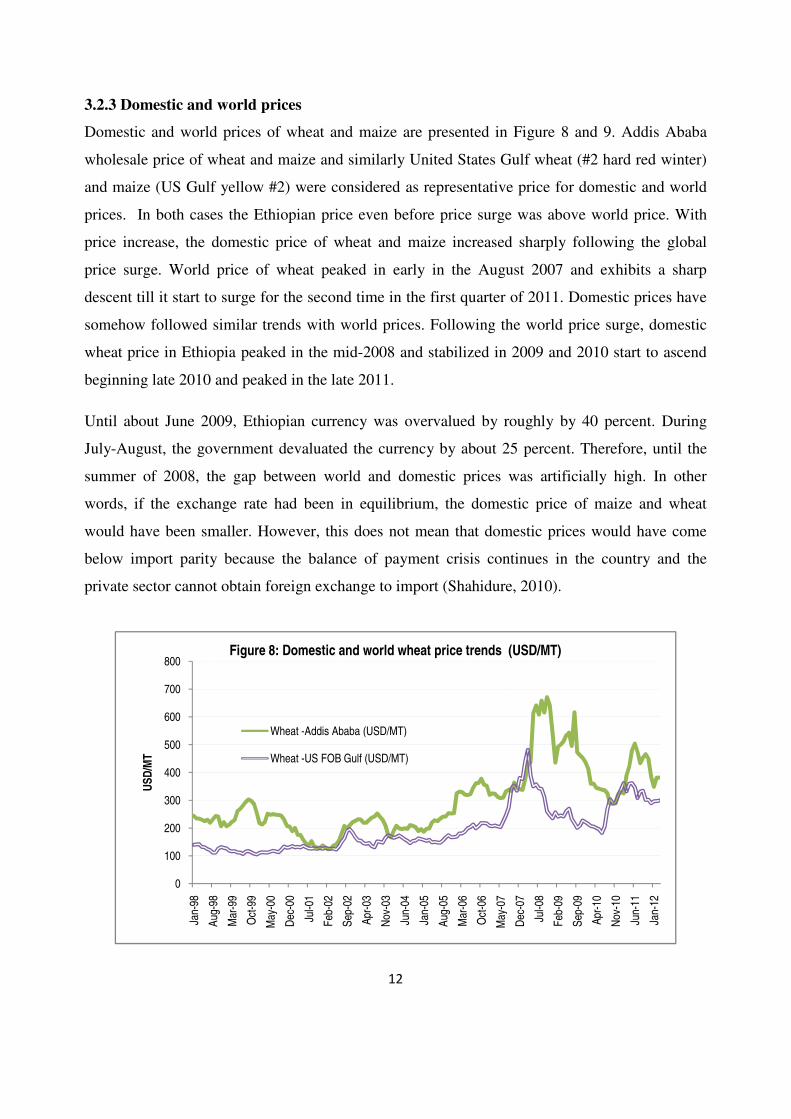
3.2.3 Domestic and world prices
Domestic and world prices of wheat and maize are presented in Figure 8 and 9. Addis Ababa
wholesale price of wheat and maize and similarly United States Gulf wheat (#2 hard red winter)
and maize (US Gulf yellow #2) were considered as representative price for domestic and world
prices. In both cases the Ethiopian price even before price surge was above world price. With
price increase, the domestic price of wheat and maize increased sharply following the global
price surge. World price of wheat peaked in early in the August 2007 and exhibits a sharp
descent till it start to surge for the second time in the first quarter of 2011. Domestic prices have
somehow followed similar trends with world prices. Following the world price surge, domestic
wheat price in Ethiopia peaked in the mid-2008 and stabilized in 2009 and 2010 start to ascend
beginning late 2010 and peaked in the late 2011.
Until about June 2009, Ethiopian currency was overvalued by roughly by 40 percent. During
July-August, the government devaluated the currency by about 25 percent. Therefore, until the
summer of 2008, the gap between world and domestic prices was artificially high. In other
words, if the exchange rate had been in equilibrium, the domestic price of maize and wheat
would have been smaller. However, this does not mean that domestic prices would have come
below import parity because the balance of payment crisis continues in the country and the
private sector cannot obtain foreign exchange to import (Shahidure, 2010).
0
100
200
300
400
500
600
700
800
Jan-
98
Aug
-98
Mar
-99
Oct
-99
May
-00
Dec
-00
Jul-0
1
Feb
-02
Sep
-02
Apr
-03
Nov
-03
Jun-
04
Jan-
05
Aug
-05
Mar
-06
Oct
-06
May
-07
Dec
-07
Jul-0
8
Feb
-09
Sep
-09
Apr
-10
Nov
-10
Jun-
11
Jan-
12
US
D/M
T
Figure 8: Domestic and world wheat price trends (USD/MT)
Wheat -Addis Ababa (USD/MT)
Wheat -US FOB Gulf (USD/MT)

13
Figure 10 depicts the world and regional (Kenya, Uganda, Ethiopia, and Tanzania) maize prices
index (January 2007=100) over 2007 to 2011/12 periods. Maize price index of Ethiopia still
remained higher compared to others. Uganda’s price index beginning January 2011 followed
Ethiopia’s trend. However it dropped sharply while the Ethiopian price index increased sharply.
0
100
200
300
400
500
600
700
Jan-
94
Oct
-94
Jul-9
5
Apr
-96
Jan-
97
Oct
-97
Jul-9
8
Apr
-99
Jan-
00
Oct
-00
Jul-0
1
Apr
-02
Jan-
03
Oct
-03
Jul-0
4
Apr
-05
Jan-
06
Oct
-06
Jul-0
7
Apr
-08
Jan-
09
Oct
-09
Jul-1
0
Apr
-11
Jan-
12
Figure 9: Local and World maize price trends (USD/MT)
Addis Ababa Maize WSP (USD/MT)
US Gulf Yellow Maize #2 (USD/MT)
0
100
200
300
400
500
600
Jan-
07
Mar
-07
May
-07
Jul-0
7
Sep
-07
Nov
-07
Jan-
08
Mar
-08
May
-08
Jul-0
8
Sep
-08
Nov
-08
Jan-
09
Mar
-09
May
-09
Jul-0
9
Sep
-09
Nov
-09
Jan-
10
Mar
-10
May
-10
Jul-1
0
Sep
-10
Nov
-10
Jan-
11
Mar
-11
May
-11
Jul-1
1
Sep
-11
ind
ex
Fig. 10: World and regional maize price index (Jan. 2007= 100)
Kenya - dry maize bag 90kg bag
Uganda - Maize grain Kg
Ethiopia- Maize (white) kg
Tanzania Wholesale Prices TZS/ 100 kg
FAO Global - Maize (U.S. Gulf, #2 yellow, US$/Ton)
Malawi - Retail prices in Malawi kwacha per kilogram

14
3.2.4 Export and Import parity prices for wheat and maize
In between 1998 and early 2000 domestic prices of wheat was above import parity price. From
mid-2000 through 2006, domestic prices of wheat in Addis Ababa were generally below import
parity levels but above export parity levels, thus providing little incentive for private imports or
exports of ordinary wheat (Figure 11). Domestic prices were on average 14 percent below import
parity levels in this period, in part because food aid inflows helped to depress prices to the
benefit of net wheat consumers and the detriment of net wheat producers.
From early 2006 to early 2007, domestic prices of wheat (wholesale, Addis Ababa) exceeded
import parity prices following global food price surge, providing some opportunity for private
importers. Since early 2008, domestic price of wheat skyrocketed with failure belg rainfall, rise
in concerns about adequacy of rainfall for planting of the upcoming 2008 meher season
(October-December) coupled with international food price surge resulted in sharp drastic wheat
price increase exceeding import parity prices which left an opportunity for private traders to
import or wheat import found profitable. However, restrictions on foreign exchange for imports
of wheat (and other goods) were imposed in March 2008 limiting opportunity for import.
0
100
200
300
400
500
600
700
800
Jan-
98
Jul-9
8
Jan-
99
Jul-9
9
Jan-
00
Jul-0
0
Jan-
01
Jul-0
1
Jan-
02
Jul-0
2
Jan-
03
Jul-0
3
Jan-
04
Jul-0
4
Jan-
05
Jul-0
5
Jan-
06
Jul-0
6
Jan-
07
Jul-0
7
Jan-
08
Jul-0
8
Jan-
09
Jul-0
9
Jan-
10
Jul-1
0
Jan-
11
Jul-1
1
Jan-
12
Pric
e (U
SD
/MT
)
Figure 11: Wheat: Import and Export Parity Prices
Wholesale price at Addis Ababa (USD/MT)
Import parity Addis Ababa (USD/MT)
Export parity FOB Djibouti (USD/MT)

15
Figure 12 shows domestic, import and export parity prices of maize over 1997 to 2012 period.
Opposite to wheat price, domestic price of maize (Addis Ababa wholesale price) constantly
remained below import parity price in between 1997 to late 2007 limiting profitability for private
traders to import. With price surge in 2008, it exceeded import parity price (IPP) but was not
possible for private traders to import due to foreign exchange shortage. Domestic price of maize
was lower by 36.5% compared to import parity price in between over 1997 to late 2007.
4. Price Interrelation among major markets
Interrelation between spatially separated markets has great economic and social implications.
Ascertaining the extent and nature of spatial price relationships provides insights into the flow of
information and goods between markets. Poor market linkages are characterized by persistently
high transaction costs which reflect the inadequacy of important infrastructure. Market
integration is an outcome of the arbitrage process where agents exchange between markets to
realize gains in excess of transaction costs.
Spatial market analysis is also instrumental in understanding how responsive related markets are
to changes in supply and demand. In developing economies, the risk of crop failure in important
production regions may have far reaching effects on prices and food security in dependent areas
linked through trading relationships. The expected duration of regional food shortages is
0
100
200
300
400
500
600
700
Jan-
97
Aug
-97
Mar
-98
Oct
-98
May
-99
Dec
-99
Jul-0
0
Feb
-01
Sep
-01
Apr
-02
Nov
-02
Jun-
03
Jan-
04
Aug
-04
Mar
-05
Oct
-05
May
-06
Dec
-06
Jul-0
7
Feb
-08
Sep
-08
Apr
-09
Nov
-09
Jun-
10
Jan-
11
Aug
-11
Mar
-12
Pri
ce ($
/MT
)
Fig. 12: Maize: Import and export parity price
Wholesale price at Addis Ababa ($/MT)
Import parity (Addis Ababa)
Export parity (FOB Djibouti)
16
ultimately linked to the level of integration between markets, as well as the efficiency with which
trade can take place (Ravallion, 1986; Van Campenhout, 2007). Although the situation of market
relation has been changing due to drastic infrastructure expansion in the recent years, the price
difference between regions and markets is common phenomenon.
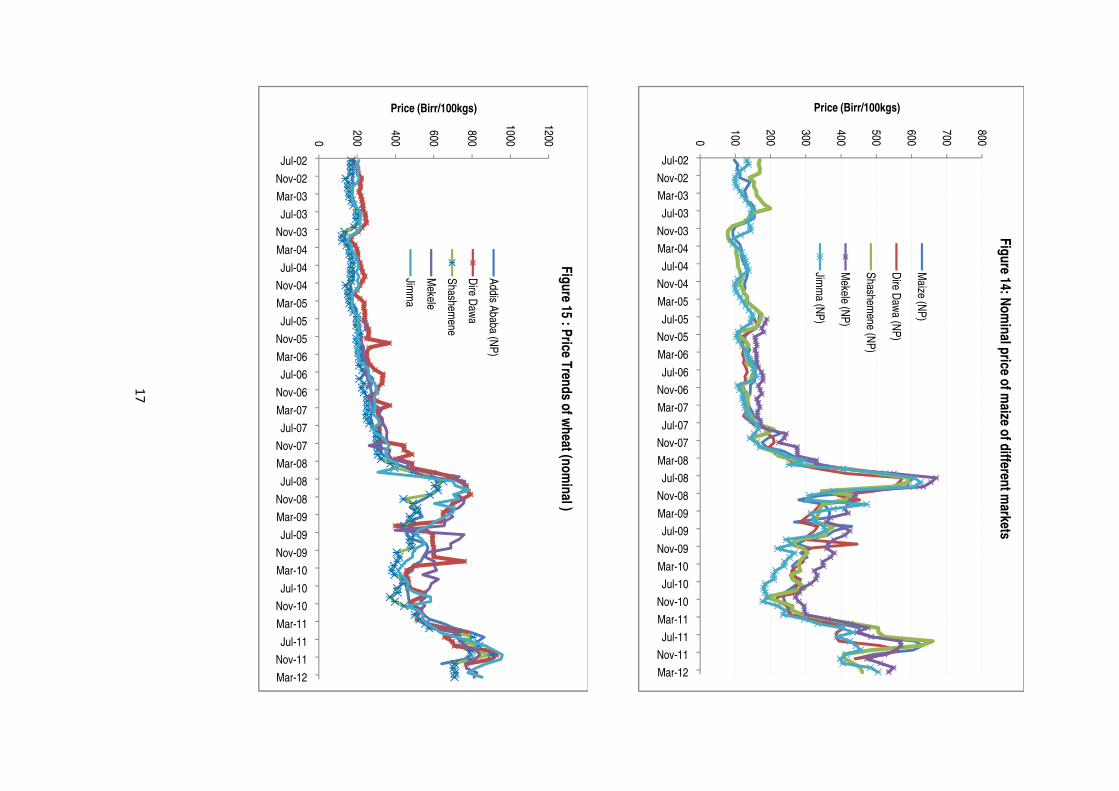
Analyzing price relation between markets requires deeper econometric approach to explore on
how one market respond or adjust for price changes in the other markets. However, in this study
employed simple price trends, price difference between reference market (Addis Ababa) and
other regional markets. Towards this end, Addis Ababa, Bahir Dar, Mekele, Shashemene, Jimma
and Diredawa were considered. Teff, maize and wheat commodities price movement are
assessed.
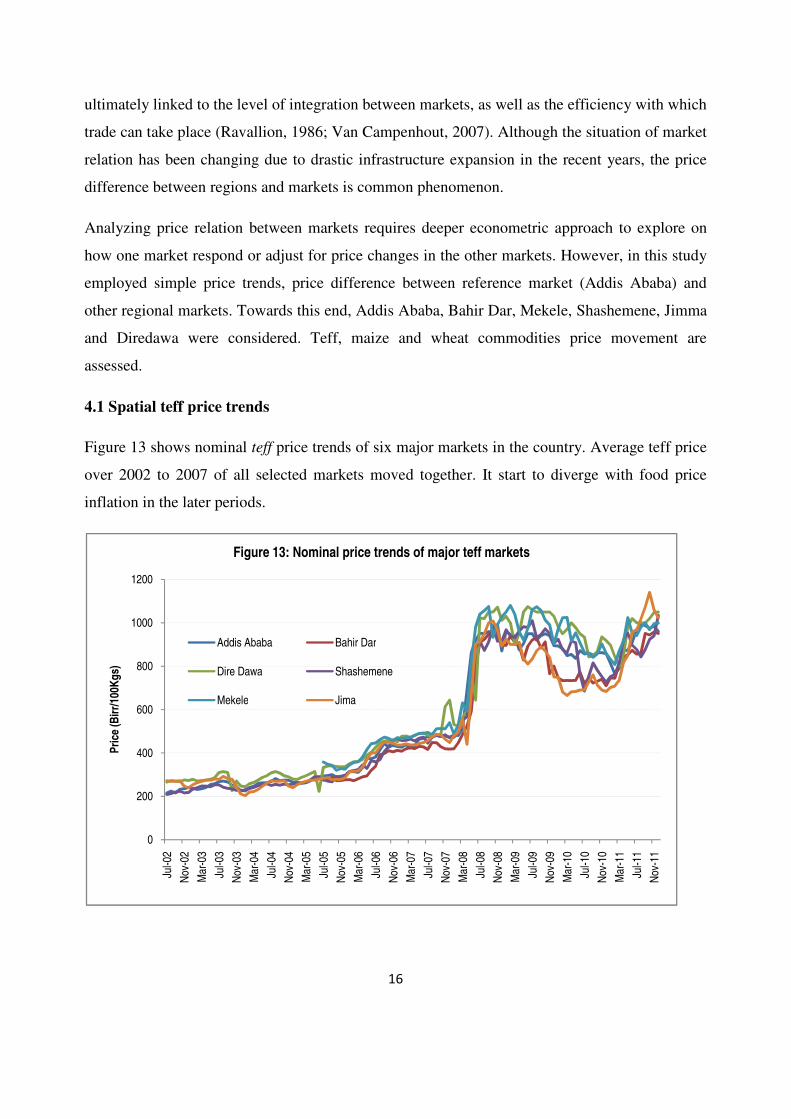
4.1 Spatial teff price trends
Figure 13 shows nominal teff price trends of six major markets in the country. Average teff price
over 2002 to 2007 of all selected markets moved together. It start to diverge with food price
inflation in the later periods.
0
200
400
600
800
1000
1200
Jul-0
2
Nov
-02
Mar
-03
Jul-0
3
Nov
-03
Mar
-04
Jul-0
4
Nov
-04
Mar
-05
Jul-0
5
Nov
-05
Mar
-06
Jul-0
6
Nov
-06
Mar
-07
Jul-0
7
Nov
-07
Mar
-08
Jul-0
8
Nov
-08
Mar
-09
Jul-0
9
Nov
-09
Mar
-10
Jul-1
0
Nov
-10
Mar
-11
Jul-1
1
Nov
-11
Pri
ce (B
irr/
100K
gs)
Figure 13: Nominal price trends of major teff markets
Addis Ababa Bahir Dar
Dire Dawa Shashemene
Mekele Jima
17
0
100
200
300
400
500
600
700
800
Jul-02
Nov-02
Mar-03
Jul-03
Nov-03
Mar-04
Jul-04
Nov-04
Mar-05
Jul-05
Nov-05
Mar-06
Jul-06
Nov-06
Mar-07
Jul-07
Nov-07
Mar-08
Jul-08
Nov-08
Mar-09
Jul-09
Nov-09
Mar-10
Jul-10
Nov-10
Mar-11
Jul-11
Nov-11
Mar-12
Price (Birr/100kgs)F
igu
re 14: No
min
al price o
f maize o
f differen
t markets
Maize (N
P)
Dire D
awa (N
P)
Shashem
ene (NP
)
Mekele (N
P)
Jimm
a (NP
)
0
200
400
600
800
1000
1200
Jul-02
Nov-02
Mar-03
Jul-03
Nov-03
Mar-04
Jul-04
Nov-04
Mar-05
Jul-05
Nov-05
Mar-06
Jul-06
Nov-06
Mar-07
Jul-07
Nov-07
Mar-08
Jul-08
Nov-08
Mar-09
Jul-09
Nov-09
Mar-10
Jul-10
Nov-10
Mar-11
Jul-11
Nov-11
Mar-12
Price (Birr/100kgs)
Fig
ure 15 : P
rice Tren
ds o
f wh
eat (no
min
al )
Addis A
baba (NP
)
Dire D
awa
Shashem
ene
Mekele
Jimm
a

18
4.2 Results of Granger Causality
The idea of Granger causality is based on idea that (1) only past values of X can temporarily
“cause” Y; (2) it is based on assumption of erogeneity (Sims, 1972), a necessary condition for X
to be exogenous of Y is that X fails to Granger-cause Y; (3) independence - variables X and Y
are only independent if both fail to Granger-cause the other. Granger causality is thus a powerful
tool, in that it allows us to test for things that we might otherwise assume away or otherwise take
for granted.
Freeman (1983) was identified two sets of for determining Granger Causality Testing. ARIMA
models/Cross-Correlations - If the series in question are stationary ARMA (p,q) processes:
then we can consider the cross-correlation functions of the two series. In particular, under the
null hypothesis of independence (no Granger causality in either direction), the cross-correlations
of the innovations uXt and uYt will be zero at all positive and negative lags.
Granger causality assessed in a more direct way: by regressing each variable on lagged values of
itself and the other, e.g.:
We can then simply use an F-test or the like to examine the null hypothesis = 0 Critical is the
choice of lags J and K; insufficient lags yield autocorrelated errors (and incorrect test statistics),
while too many lags reduce the power of the test. This approach also allows for a determination
of the causal direction of the relationships, since we can also estimate the “reverse” model:
Granger causality testing should take place in the context of a fully-specified model. If the model
isn’t well specified, “spurious” relationships may be found, despite the fact of no actual
19
(conditional) relationship between the variables. In many instances, analysts automatically
difference variables they believe to be I(1).
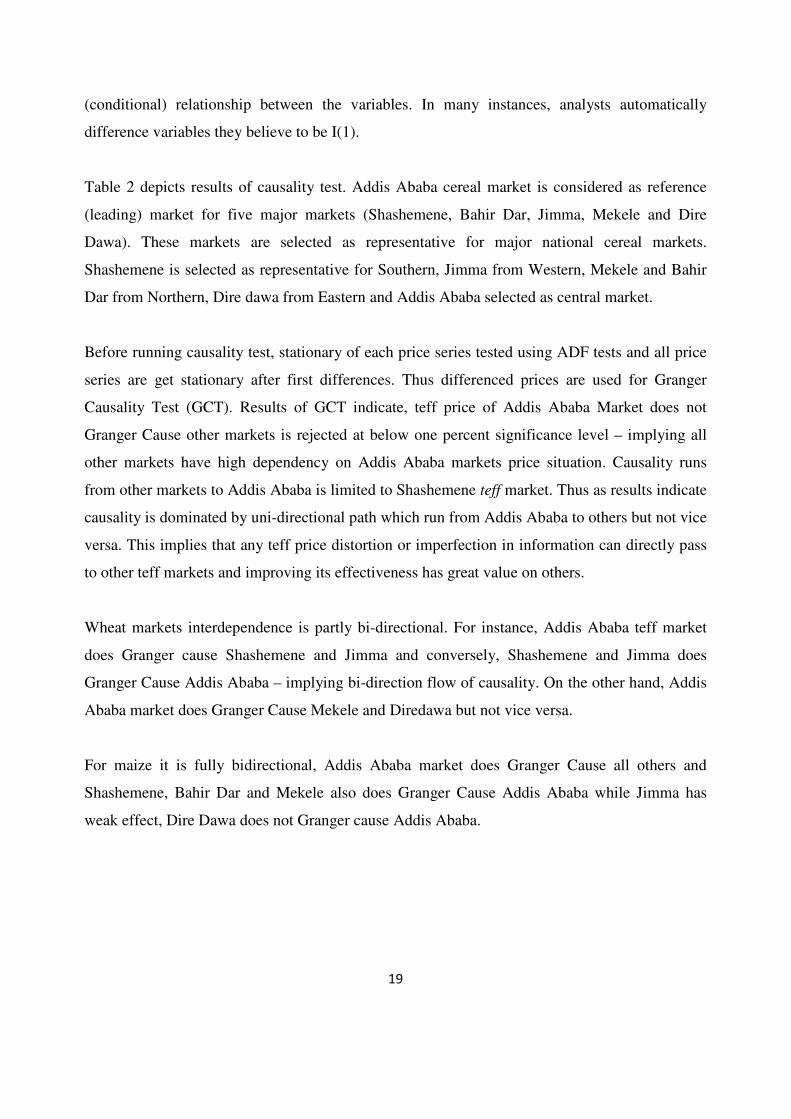
Table 2 depicts results of causality test. Addis Ababa cereal market is considered as reference
(leading) market for five major markets (Shashemene, Bahir Dar, Jimma, Mekele and Dire
Dawa). These markets are selected as representative for major national cereal markets.
Shashemene is selected as representative for Southern, Jimma from Western, Mekele and Bahir
Dar from Northern, Dire dawa from Eastern and Addis Ababa selected as central market.
Before running causality test, stationary of each price series tested using ADF tests and all price
series are get stationary after first differences. Thus differenced prices are used for Granger
Causality Test (GCT). Results of GCT indicate, teff price of Addis Ababa Market does not
Granger Cause other markets is rejected at below one percent significance level – implying all
other markets have high dependency on Addis Ababa markets price situation. Causality runs
from other markets to Addis Ababa is limited to Shashemene teff market. Thus as results indicate
causality is dominated by uni-directional path which run from Addis Ababa to others but not vice
versa. This implies that any teff price distortion or imperfection in information can directly pass
to other teff markets and improving its effectiveness has great value on others.
Wheat markets interdependence is partly bi-directional. For instance, Addis Ababa teff market
does Granger cause Shashemene and Jimma and conversely, Shashemene and Jimma does
Granger Cause Addis Ababa – implying bi-direction flow of causality. On the other hand, Addis
Ababa market does Granger Cause Mekele and Diredawa but not vice versa.
For maize it is fully bidirectional, Addis Ababa market does Granger Cause all others and
Shashemene, Bahir Dar and Mekele also does Granger Cause Addis Ababa while Jimma has
weak effect, Dire Dawa does not Granger cause Addis Ababa.

20
Table 2: Results of Granger Causality Test
Leading
market
Null hypothesis Follower markets F-Statistic Probability Causality from
follower market to
leading (reference
market)
Teff market
Addis Ababa
Teff price of AA
market does not
Granger Cause
Shasehemene 13.0662 0.0000
Yes, 5% sign.
Bahir Dar 15.5089 0.0000 No, very weak
Jimma 19.3666 0.0000 No, non existent
Mekele 25.6120 0.0000 No, very weak
Dire Dawa 18.4743 0.0000 No, non existent
Wheat market
Addis Ababa
Wheat price of AA
market does not
Granger cause
Shashemene 7.23532 0.0014 Yes, 1% sig
Jimma 15.1370 0.0000 Yes, 10% sig
Mekele 10.9383 0.0000 No, non existent
Dire Dawa 9.35685 0.0003 No, non existent
Maize market
Addis Ababa
Maize price of AA
market does not
Granger cause
Shashemene 2.98561 0.0570 Yes, 1% sig stronger
Bahir Dar 12.0024 0.0000 Yes, 1% Sig.
Jimma 5.90576 0.0043 Yes, 10% sig.
Mekele 3.59248 0.0327
Yes, 1% significant
Dire Dawa 8.21027 0.0006 No, non existent
Source: Authors computation using EGTE data
In general, although it not adequate to draw concrete evidence only from simple GCT result,
there are implications that commodities like teff price is highly affected/depend on what happens
in the Addis Ababa teff market. Thus improving market information and related institutional
arrangements have high value in the future success.
5. Causes behind the price puzzle in Ethiopia
5.1 Major Causes
As economic theories indicate, Inflation exists when money supply exceeds available goods and
services. It also may attribute to deficit financing which may be financed by the additional
money creation. Cause of inflation broadly could be categorized in to two views: monetarists and
Keynesians views. Monetarists attribute inflation as mismanagement of money flow while
Keynesians attribute inflation to increase in real demand other things kept constant.

21
Demand-pull inflation is caused by due to a shift in economy’s demand curve. An increase in
aggregate demand can be caused by the increase in both government and private consumption or
money supply this will in turn leads to high price. Cost- push inflation on the other hand is
caused by decrease aggregate supply of goods and services caused by high production costs. The
higher production cost is the lower the production that means low aggregate supply which leads
to inflation.
Regarding Ethiopia’s inflation, there appears to be little consensus on why Ethiopia experienced
such a rapid rate of inflation. World Bank (2007) and IMF (2008) argue that excess aggregate
demand generated by expansionary monetary policy were key driving factors, calling for forceful
policy tightening. Indeed, a 2007 World Bank study argued that, during 2004-2006, money
supply increased by 108 percent, and real GDP increased by 48 percent. That is, growth of
money supply was 40 percent faster than GDP growth. This helps explain the growth in nominal
food prices over this period. Loose monetary and fiscal policies are the principal sources of
inflation in Ethiopia. The pro-growth monetary and fiscal policies with massive financing of the
budget deficit for infrastructure have led to the inflation hike. Money supply can be interpreted
by government expenditure, private and public investment, salary and wage increment which
allows increase in general demand or consumption.
Economic growth in the country resulted in a new job creation, disbursement of large volume of
credit, remittances, monetization of food aid, etc. Even though there is no exact estimate of this
amount, the amount of Ethiopian remittances is believed to be in the range of $1.1 billion to $1.4
billion every year. The increased demands by those who receive and spend the remittances
exacerbate the inflationary pressures created mainly by the existing shortages, salary increment
for government employees, etc all are behind increase in money supply.
EDRI (2007) and FAO (2008b) however point out that domestic and external factors account for
the recent inflation, among them (i) increase in international commodity prices including oil
prices; (ii) structural change and continued good economic performance; (iii) increasing supply
of money and injection of cash into the rural economy; (v) changes in farmers� behavior to
supply products more uniformly over the year (improvements in access to micro-credit, storage
facilities, marketing information, etc; and (vi) increased local purchases by governmental food
security institutions, agricultural cooperatives, and relief agencies.
22
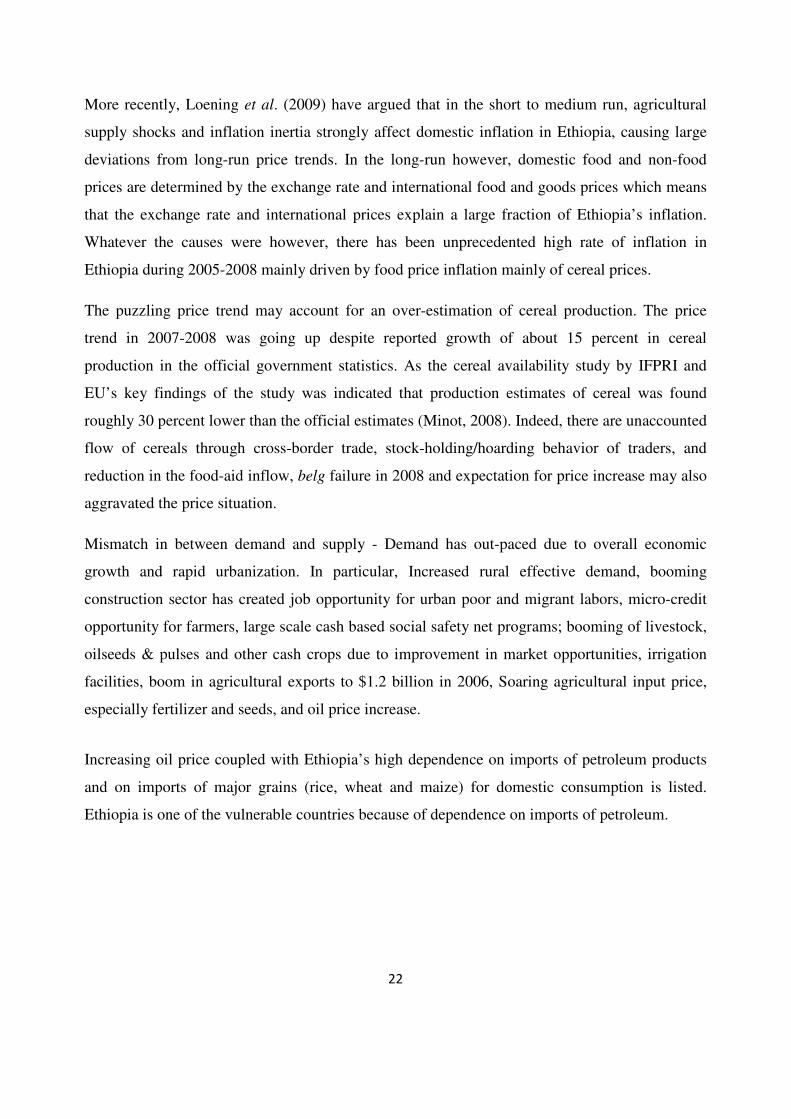
More recently, Loening et al. (2009) have argued that in the short to medium run, agricultural
supply shocks and inflation inertia strongly affect domestic inflation in Ethiopia, causing large
deviations from long-run price trends. In the long-run however, domestic food and non-food
prices are determined by the exchange rate and international food and goods prices which means
that the exchange rate and international prices explain a large fraction of Ethiopia’s inflation.
Whatever the causes were however, there has been unprecedented high rate of inflation in
Ethiopia during 2005-2008 mainly driven by food price inflation mainly of cereal prices.
The puzzling price trend may account for an over-estimation of cereal production. The price
trend in 2007-2008 was going up despite reported growth of about 15 percent in cereal
production in the official government statistics. As the cereal availability study by IFPRI and
EU’s key findings of the study was indicated that production estimates of cereal was found
roughly 30 percent lower than the official estimates (Minot, 2008). Indeed, there are unaccounted
flow of cereals through cross-border trade, stock-holding/hoarding behavior of traders, and
reduction in the food-aid inflow, belg failure in 2008 and expectation for price increase may also
aggravated the price situation.
Mismatch in between demand and supply - Demand has out-paced due to overall economic
growth and rapid urbanization. In particular, Increased rural effective demand, booming
construction sector has created job opportunity for urban poor and migrant labors, micro-credit
opportunity for farmers, large scale cash based social safety net programs; booming of livestock,
oilseeds & pulses and other cash crops due to improvement in market opportunities, irrigation
facilities, boom in agricultural exports to $1.2 billion in 2006, Soaring agricultural input price,
especially fertilizer and seeds, and oil price increase.
Increasing oil price coupled with Ethiopia’s high dependence on imports of petroleum products
and on imports of major grains (rice, wheat and maize) for domestic consumption is listed.
Ethiopia is one of the vulnerable countries because of dependence on imports of petroleum.

23
According to Ethiopian Government the causes of inflation are: increasing demand for food due
to economic growth; increase in international commodity prices including oil; mmalfunctioning
of wholesale markets, rapid increase in money supply, inflationary expectations by traders,
consumers and producers; institutional weakness to manage abnormal price movement (Answers
by H.E Ato Melese for Questions raised by MPs, Miazia 8/2004 EFY).
Indeed, the Ethiopian Economy exhibited considerable economic growth (on average about 11%)
for the last eight years. This has positive contribution on general price increase. Moderate
inflation is an inevitable consequence of sustained economic growth. It can enhance economic
growth by mobilizing the resources of a country. For the last eight years, Ethiopia has recorded
sustaining economic growth. However, inflation in Ethiopia is beyond the break-even point.
Instead of stimulating economic growth, inflationary pressure in Ethiopia seems to be on the
verge of distorting the allocation of resources and is likely to be a deterrent to undertaking
productive investments. Consumers in general and civil servants in particular are at verge of
crisis. Currently in Ethiopia there is no guarantee that today’s price level will remain the same to
for tomorrow. This in turn resulted in uncertainty in consumption and welfare of lion’s share of
majorities who have hand-to-mouth income.
0
50
100
150
200
250
300
350
Dec
-06
Feb
-07
Apr
-07
Jun-
07
Aug
-07
Oct
-07
Dec
-07
Feb
-08
Apr
-08
Jun-
08
Aug
-08
Oct
-08
Dec
-08
Feb
-09
Apr
-09
Jun-
09
Aug
-09
Oct
-09
Dec
-09
Feb
-10
Apr
-10
Jun-
10
Aug
-10
Oct
-10
Dec
-10
Feb
-11
Apr
-11
Ind
ex
Figure 16: Addis Ababa cereal & fuel price Index(Dec. 2006 = 100)
Fuel Price Index Average cereal Price Index
24
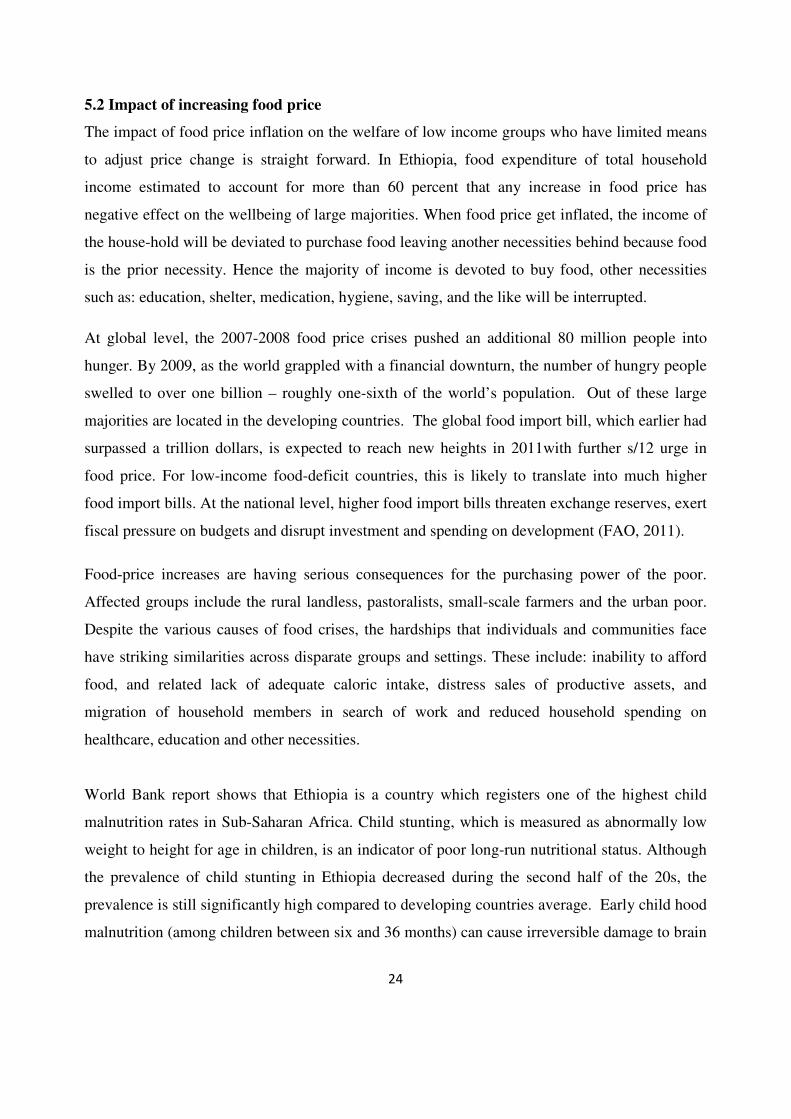
5.2 Impact of increasing food price
The impact of food price inflation on the welfare of low income groups who have limited means
to adjust price change is straight forward. In Ethiopia, food expenditure of total household
income estimated to account for more than 60 percent that any increase in food price has
negative effect on the wellbeing of large majorities. When food price get inflated, the income of
the house-hold will be deviated to purchase food leaving another necessities behind because food
is the prior necessity. Hence the majority of income is devoted to buy food, other necessities
such as: education, shelter, medication, hygiene, saving, and the like will be interrupted.
At global level, the 2007-2008 food price crises pushed an additional 80 million people into
hunger. By 2009, as the world grappled with a financial downturn, the number of hungry people
swelled to over one billion – roughly one-sixth of the world’s population. Out of these large
majorities are located in the developing countries. The global food import bill, which earlier had
surpassed a trillion dollars, is expected to reach new heights in 2011with further s/12 urge in
food price. For low-income food-deficit countries, this is likely to translate into much higher
food import bills. At the national level, higher food import bills threaten exchange reserves, exert
fiscal pressure on budgets and disrupt investment and spending on development (FAO, 2011).
Food-price increases are having serious consequences for the purchasing power of the poor.
Affected groups include the rural landless, pastoralists, small-scale farmers and the urban poor.
Despite the various causes of food crises, the hardships that individuals and communities face
have striking similarities across disparate groups and settings. These include: inability to afford
food, and related lack of adequate caloric intake, distress sales of productive assets, and
migration of household members in search of work and reduced household spending on
healthcare, education and other necessities.
World Bank report shows that Ethiopia is a country which registers one of the highest child
malnutrition rates in Sub-Saharan Africa. Child stunting, which is measured as abnormally low
weight to height for age in children, is an indicator of poor long-run nutritional status. Although
the prevalence of child stunting in Ethiopia decreased during the second half of the 20s, the
prevalence is still significantly high compared to developing countries average. Early child hood
malnutrition (among children between six and 36 months) can cause irreversible damage to brain
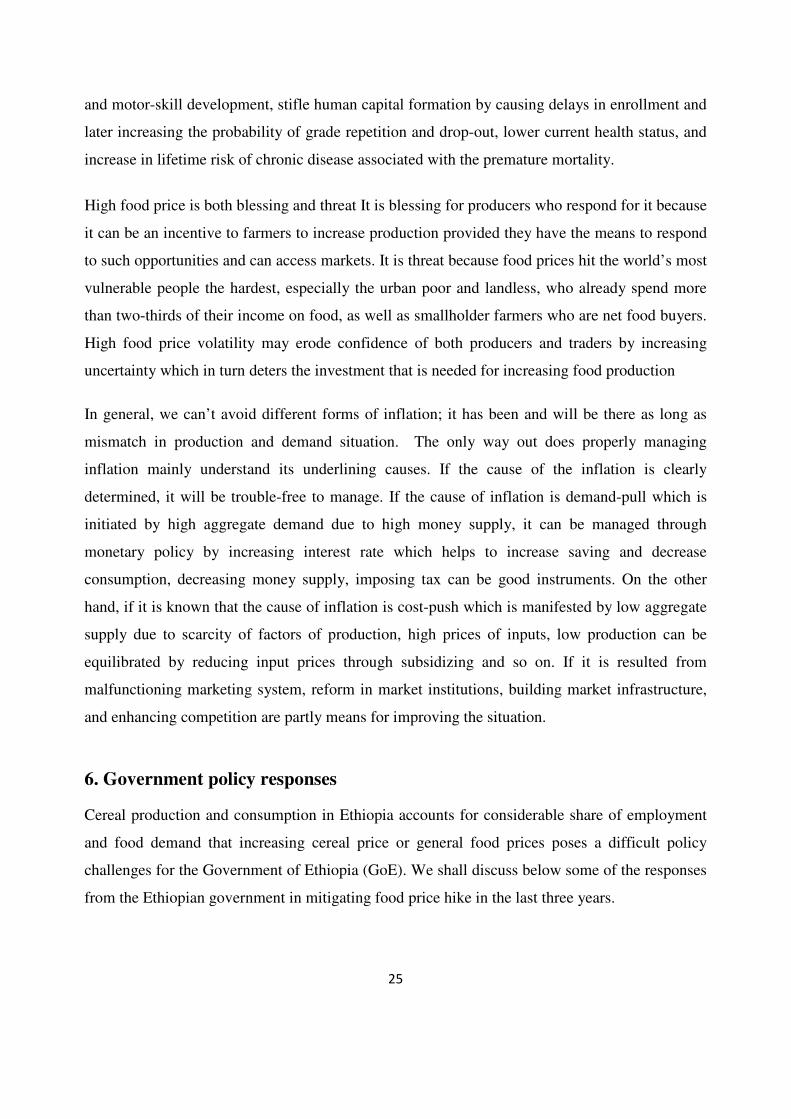
25
and motor-skill development, stifle human capital formation by causing delays in enrollment and
later increasing the probability of grade repetition and drop-out, lower current health status, and
increase in lifetime risk of chronic disease associated with the premature mortality.
High food price is both blessing and threat It is blessing for producers who respond for it because
it can be an incentive to farmers to increase production provided they have the means to respond
to such opportunities and can access markets. It is threat because food prices hit the world’s most
vulnerable people the hardest, especially the urban poor and landless, who already spend more
than two-thirds of their income on food, as well as smallholder farmers who are net food buyers.
High food price volatility may erode confidence of both producers and traders by increasing
uncertainty which in turn deters the investment that is needed for increasing food production
In general, we can’t avoid different forms of inflation; it has been and will be there as long as
mismatch in production and demand situation. The only way out does properly managing
inflation mainly understand its underlining causes. If the cause of the inflation is clearly
determined, it will be trouble-free to manage. If the cause of inflation is demand-pull which is
initiated by high aggregate demand due to high money supply, it can be managed through
monetary policy by increasing interest rate which helps to increase saving and decrease
consumption, decreasing money supply, imposing tax can be good instruments. On the other
hand, if it is known that the cause of inflation is cost-push which is manifested by low aggregate
supply due to scarcity of factors of production, high prices of inputs, low production can be
equilibrated by reducing input prices through subsidizing and so on. If it is resulted from
malfunctioning marketing system, reform in market institutions, building market infrastructure,
and enhancing competition are partly means for improving the situation.
6. Government policy responses
Cereal production and consumption in Ethiopia accounts for considerable share of employment
and food demand that increasing cereal price or general food prices poses a difficult policy
challenges for the Government of Ethiopia (GoE). We shall discuss below some of the responses
from the Ethiopian government in mitigating food price hike in the last three years.
26
The GoE has shifted from subsidizing oil to grain to ease the spiraling cost of food. To this end,
the government has removed annual subsidy on petroleum products and transferred to smoothen
grain prices hike and as well as eliminated value-added taxes on grains. In addition, the
government has also curtailed export of cereals in a way to stabilize the soaring price that hit
most of the low-income population. Grain export was banned for an indefinite period of time in a
way to stabilize the domestic price of grains.
A subsidized wheat supply of 25kg every month for low-income urban dwellers was introduced
in March 2007. The subsidized price of wheat is about 350 birr per quintal (100 kg) while the
market price of domestic wheat was around 750 birr per quintal at the time. This urban food
transfer served as income transfer for urban poor. This coupled with the removal of domestic
taxes on grains resulted in a decline in price. The government also suspended local procurement
by the World Food Programme (WFP), the Ethiopian Grain Trading Enterprise country’s food
logistic agency has awarded responsibility to carry out major activities.
Since 2008 food price surge, bakeries have been rationed imported wheat for subsidized price.
This is mainly based on the objective of supplying adequate bread for public at large for
relatively stable price. This policy worked well in smoothening bread price throughout the
country. This perhaps reflects the fact that risks of price instability—in term of economic,
human, and political costs. However, the price level is still very high as compared to initial
period in the early 2006.
Apart from the above policy responses, the government has also has increase beneficiaries of
Productive Safety Net program (PSNP) beneficiaries and raised the cash wage rate of the largest
cash-for-work or of (PSNP) by 33% (World Bank, 2008) in a way to increase the purchasing
power of the poor.
The government had imposed price caps in January 2011 in a bid to control major urban food
prices – in selected 17 commodities. It had limited success in bringing prices down as expected
rather created some confusion between traders and consumers. However, after waiting until June
2011, it lifted the caps, seeing no significant change in the prices. This has caused prices to soar
27
again to levels unaffordable for many in the country. Its implication was so hastily with limited
discussion with stakeholders.
In general, the government responded very quickly and adequately with full commitment to
smoothen negative effects of abnormal food price in the welfare of large majority who exhibit
hand to mouth in many instances. The intervention was successful in deckling prices of major
cereals although it was not sustained.
8. Concluding remarks
The aim of this work is to analyze food price trends and underlining causes account for abnormal
surge. Its impacts and future policy options are discussed. The analysis is based on official
monthly data obtained mainly from Ethiopian Grain Trade Enterprises and Central Statistical
Agency.
Ethiopia has successfully raised domestic production of cereals in recent years as part of its
overall development strategy. However, steady production growth has not led to sharp declines
in real food prices. The current food price surge occurred for reasons different from historical
causes – which is mainly emanate from rainfall disturbance and resulting drought. Although
inflation in the growing economy is unavoidable, the extent of current level inflation has
damaging effect unless considerable policy. As depicted in all price trends:
- Food price inflation is much higher in Ethiopia compared to many countries in the region;
- Although it is not direct, food price in Ethiopia somehow followed global food price
hikes;
- Cereals price inflation is one of driving factor for general inflation in Ethiopia;
- Monetary expansion considered unanimously as one of factors aggravated the price
situation in Ethiopia;
- Although the government has made considerable efforts to halt food price inflation, the
current level of food price in Ethiopia is even higher than 2008 peak level.

28
Thus it requires understanding underlining causes and well designed interventions need to be
designed. Some of possible interventions include:
1. Prudent macroeconomic and fiscal policy management;
2. Deeper understanding current marketing structure and designing alternative and
competitive marketing system, mainly for wholesale markets
3. Investing more on agricultural production and productivity, or pursuing more substantive
policy on food production and marketing (more incentive and support for private sector
to engage in agricultural production)
4. promoting diversification in staples consumption( changes in food culture).
References
Ahmed, H.A. (2007). Structural Analysis of Price Drivers in Ethiopia. Mimeo, Ethiopian
Development Research Institute, Addis Ababa.
Durevall Dick, Loening Josef and Birru Yohannes (2010). Inflation Dynamics and Food Prices
in Ethiopia. Working Paper in Economics, No 478. University of Gothenburg.
Jeni Klugman and Josef Loening (2007). Welfare Impacts of Food Price Inflation in Ethiopia.
Explaining Food Price Inflation; Policy Note by the World Nank. December, 2007World Bank
Loening, L.J., Durevall, D., Birru, Y.A. (2009). Inflation Dynamics and Food Prices in an
Agricultural Economy: The Case of Ethiopia, Working Paper 347. Gothenburg: University of
Gothenburg.
IMF. (2008a). Federal Democratic Republic of Ethiopia: Article IV Consultation Staff Report.
IMF Country Report 08/264. Washington, DC: International Monetary Fund.
IMF (2008b). Federal Democratic Republic of Ethiopia: Selected Issues. IMF Country Report
08/259. Washington, DC: International Monetary Fund.
Minot, N. (2010). Transmission of World Food Price Changes to African Markets and its Effect
on Household Welfare. Paper presented at the Comesa policy seminar Food price variability:
Causes, consequences, and policy options, Maputo, Mozambique, January 25-26.
Rashid, S. (2010). Staple Food Prices in Ethiopia. Paper prepared for the Africa Agricultural
Market Program for the Comesa policy seminar Variations i
consequences and policy options, Maputo, Mozambique, January 24
USAID (2010). The United States’ Strategy for Meeting the Millennium Development Goals:
Review of progresses in MDG
Yonas Alem and Söderbom M. (2010). Hous
Impact of Food Price Inflation and Idiosyncratic Shocks. Department of Economics, University
of Gothenburg;
World Bank (2007). Explaining Sources of Food Price Inflation in Ethiopia. Draft, World Bank,
Washington, DC.
Appendices
Source: FAO, April 2012
29
. Staple Food Prices in Ethiopia. Paper prepared for the Africa Agricultural
Market Program for the Comesa policy seminar Variations in staple food prices: Causes,
consequences and policy options, Maputo, Mozambique, January 24-25.
USAID (2010). The United States’ Strategy for Meeting the Millennium Development Goals:
Review of progresses in MDG
Yonas Alem and Söderbom M. (2010). Household-Level Consumption in Urban Ethiopia: The
Impact of Food Price Inflation and Idiosyncratic Shocks. Department of Economics, University
. Explaining Sources of Food Price Inflation in Ethiopia. Draft, World Bank,
Source: FAO, April 2012
. Staple Food Prices in Ethiopia. Paper prepared for the Africa Agricultural
n staple food prices: Causes,
USAID (2010). The United States’ Strategy for Meeting the Millennium Development Goals:
Level Consumption in Urban Ethiopia: The
Impact of Food Price Inflation and Idiosyncratic Shocks. Department of Economics, University
. Explaining Sources of Food Price Inflation in Ethiopia. Draft, World Bank,

ANNUAL FOOD PRICE INDICES Date Food Price
Index
Meat Price
Index
1990 105.4
1991 103.6
1992 108.5
1993 104.6
1994 110.6
1995 123.2
1996 129.1
1997 118.5
1998 107.1
1999 92.4
2000 90.4
2001 93.4
2002 89.9
2003 97.7
2004 112.4
2005 117.3
2006 126.7
2007 158.7
2008 199.8
2009 156.9
2010 185.3
2011 227.6
2012 214.8
Source: FAO, 2012
28.4
19.5
0
5
10
15
20
25
30
Teff
Fig. Average share (%) of area and production of creals
30
ANNUAL FOOD PRICE INDICES (2002-2004=100)Meat Price
Index
Dairy Price
Index
Cereals Price
Index
Oils Price
Index
124.0 74.8 97.7 74.0
125.4 79.6 97.1 79.1
125.2 95.4 102.5 84.3
118.1 84.6 99.5 86.0
115.0 82.3 104.5 113.4
118.4 109.6 119.3 125.0
128.4 109.4 140.8 111.2
123.2 105.1 112.4 112.5
103.2 99.1 99.9 129.9
97.8 86.3 90.6 91.6
95.8 95.4 85.2 67.8
96.5 107.1 86.5 67.6
89.5 82.2 94.4 87.0
96.8 95.1 98.1 100.8
113.7 122.6 107.5 112.2
120.1 135.4 103.5 103.6
118.5 128.0 121.7 112.5
125.1 212.4 166.9 170.0
153.2 219.6 237.8 227.2
132.9 141.6 173.7 150.9
152.2 200.4 182.6 194.2
176.6 220.5 246.8 252.3
178.7 197.9 225.2 242.1
16.9
19.9
11.7
18.218.2
27.2
10.7
Wheat Maize Barely Sorghum
Fig. Average share (%) of area and production of creals
Area (%)
2004=100) Oils Price
Sugar Price
Index
74.0 178.1
79.1 127.2
84.3 128.5
86.0 142.2
113.4 171.8
125.0 188.5
111.2 169.7
112.5 161.4
129.9 126.6
91.6 89.0
67.8 116.1
67.6 122.6
87.0 97.8
00.8 100.6
112.2 101.7
103.6 140.3
112.5 209.6
170.0 143.0
227.2 181.6
150.9 257.3
194.2 302.0
252.3 368.9
242.1 335.6
18.219.2
Sorghum
Fig. Average share (%) of area and production of creals