Fourth Quarter 2020 Residential Market Report Brooklyn
25
Brooklyn Fourth Quarter 2020 Residential Market Report Halstead is now BHSID 20266433
Transcript of Fourth Quarter 2020 Residential Market Report Brooklyn

Broo
klyn
Fourth Quarter 2020Residential Market Report
Halstead is now
BHSID 20266433

BHS 1
BHSID 20388343
Halstead has joined Brown Harris Stevens - which means BHS
now has 2,500 agents and 55 offices in luxury markets across NYC,
the Tristate area, the Hamptons, Palm Beach, and Miami.
Historically ranked among the nation’s top residential firms,
in 2019 both firms combined closed 6,000 transactions
totaling more than $9 billion.
Simply put, we have more resources than ever to
support our trusted clients.
We are here to serve you, and Brown Harris Stevens has never
been stronger. We look forward to working together.
We’re growing!

BHS 2
BHSID 20221010
Message from Bess Freedman CEO of Brown Harris Stevens
The Brooklyn residential market’s recovery gained more steam in the fourth quarter, with both apartment and townhouses prices up compared to a year ago.
Perhaps more impressive was the slight increase in the number of apartment sales from 2019’s fourth quarter. Compare that to the 29% decline in Manhattan apartment sales posted over the past year, and Brooklyn is looking very good. Townhouse closings were 15% lower than a year ago, but that’s not bad considering how hard the market was hit by the coronavirus.
The biggest takeaway from this report is that Brooklyn has already made an incredible comeback from the unprecedented damage of COVID-19, and is getting stronger every day.

BHS 3
Apartment prices averaged
$879,097 in the fourth quarter,
9% more than a year ago.
The number of sales ticked
up 1% compared to 2019’s
fourth quarter.
All
Broo
klyn
BHSID 20325361
Cooperatives & Condominiums
Q4 2020

BHS 4
BHSID 20371018
$145
,159 $1
88,6
35
$50,000
$100,000
$150,000
$200,000
$250,000
4th Q 19 4th Q 20
CooperativeAverage Price Per Room
Condominium Average Price Per Square Foot
Q4 2020
All Brooklyn Cooperatives & Condominiums*
$962
$980
$250
$500
$750
$1,000
$1,250
4th Q 19 4th Q 20
* Includes new development and resale apartments. 4Q20 data is preliminary and subject to revision in future reports. Data from the prior four quarters has been revised to include sales recorded after our initial reports were released.
Cooperatives & CondominiumsAverage & Median Sales Price
$806
,362
$833
,344
$875
,692
$841
,406
$879
,097
$673
,000
$672
,500
$692
,705
$701
,574
$760
,000
$500,000
$600,000
$700,000
$800,000
$900,000
$1,000,000
4th Q 19 1st Q 20 2nd Q 20 3rd Q 20 4th Q 20
Average Price Median Price

BHS 5
All
Broo
klyn
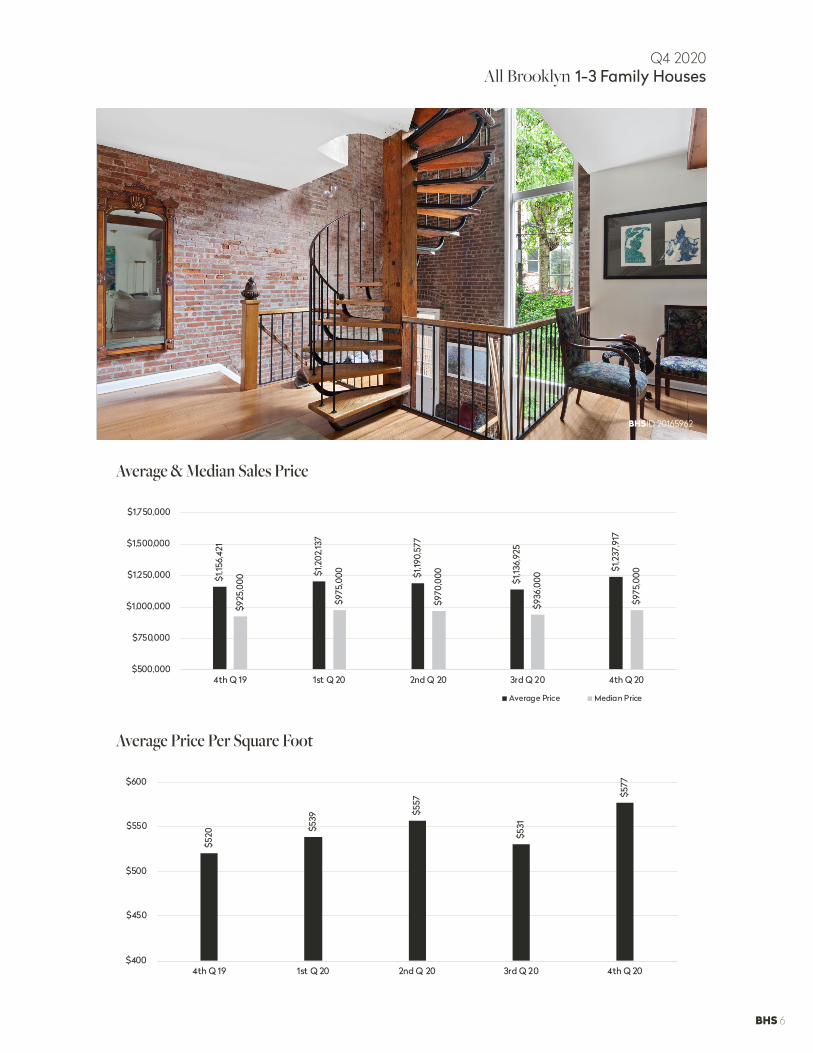
The average 1-3 family house
price rose 7% over the past
year to $1,237,917.
House prices averaged
$577 per square foot, an 11%
improvement from the fourth
quarter of 2019. BHSID 20272051
1-3 Family HousesQ4 2020
BHS 6
$520
$539
$557
$531
$577
$400
$450
$500
$550
$600
4th Q 19 1st Q 20 2nd Q 20 3rd Q 20 4th Q 20
$1,15
6,42
1
$1,2
02,13
7
$1,19
0,57
7
$1,13
6,92
5
$1,2
37,9
17
$925
,000
$975
,000
$970
,000
$936
,000
$975
,000
$500,000
$750,000
$1,000,000
$1,250,000
$1,500,000
$1,750,000
4th Q 19 1st Q 20 2nd Q 20 3rd Q 20 4th Q 20
Average Price Median Price
BHSID 20165962
Q4 2020
All Brooklyn 1-3 Family Houses
Average & Median Sales Price
Average Price Per Square Foot

BHS 7
Brooklyn Market Areas
Q4 2020
BrownstoneBoerum Hill
Brooklyn Heights
Carroll Gardens
Clinton Hill
Cobble Hill
Columbia Street Waterfront District
Ditmas Park
Downtown Brooklyn
Dumbo
Fort Greene
Gowanus
Greenwood Heights
Park Slope
Prospect Heights
Prospect Park South
Prospect-Lefferts Gardens
Red Hook
South Slope
Vinegar Hill
Windsor Terrace
CentralBedford-Stuyvesant
Brownsville
Bushwick
Crown Heights
East New York
Stuyvesant Heights
NorthEast Williamsburg
Greenpoint
Williamsburg North Side
Williamsburg South Side
Bpage 6
Npages 12-15
Spage 12
Cpage 10
Bpages 8-11
Spages 20-23
Cpages 16-19
SouthBath Beach
Bay Ridge
Bensonhurst
Bergen Beach
Borough Park
Brighton Beach
Canarsie
Coney Island
Dyker Heights
East Flatbush
Flatbush
Flatlands
Gerritsen Beach
Gravesend
Kensington
Manhattan Beach
Marine Park
Midwood
Mill Basin
Sea Gate
Sheepshead Bay
Sunset Park

BHS 8
Brow
nsto
ne B
rook
lyn
A sharp rise in co-op prices
helped bring the average
apartment price 6% higher
than a year ago. BHSID 20354553
Cooperatives & Condominiums
Q4 2020

BHS 9
$1,0
71,9
99
$1,13
9,30
3
$1,12
1,957
$1,17
6,94
5
$1,14
0,07
2
$909
,145
$919
,500
$852
,500
$935
,000
$998
,000
$500,000
$750,000
$1,000,000
$1,250,000
$1,500,000
4th Q 19 1st Q 20 2nd Q 20 3rd Q 20 4th Q 20
Average Price Median Price
BHSID 20516435
$221
,438
$268
,560
$125,000
$175,000
$225,000
$275,000
$325,000
4th Q 19 4th Q 20
CooperativeAverage Price Per Room
Condominium Average Price Per Square Foot
Q4 2020
Brownstone Brooklyn Cooperatives & Condominiums
$1,18
9
$1,2
09
$500
$750
$1,000
$1,250
$1,500
4th Q 19 4th Q 20
Cooperatives & CondominiumsAverage & Median Sales Price

BHS 10
Prices for 1-3 family houses
averaged $2,634,86,
9% more than
2019’s fourth quarter.
1-3 Family HousesQ4 2020
Brow
nsto
ne B
rook
lyn
BHSID 20211582

BHS 11
$889
$921
$887
$905
$948
$400
$600
$800
$1,000
$1,200
4th Q 19 1st Q 20 2nd Q 20 3rd Q 20 4th Q 20
$2,4
19,4
02
$2,5
85,2
79
$2,4
98,2
12
$2,18
4,37
3 $2,6
34,8
68
$2,3
00,0
00
$2,2
25,0
00
$2,0
89,2
50
$2,0
00,0
00
$2,12
5,00
0 $1,500,000
$2,000,000
$2,500,000
$3,000,000
$3,500,000
4th Q 19 1st Q 20 2nd Q 20 3rd Q 20 4th Q 20
Average Price Median Price
BHSID 20526031
Q4 2020
Brownstone Brooklyn 1-3 Family Houses
Average & Median Sales Price
Average Price Per Square Foot

BHS 12
The average apartment price
rose 5% over the past year
in North Brooklyn.BHSID 20333386
Cooperatives & Condominiums
Q4 2020
Nor
th B
rook
lyn

BHS 13
$1,14
9
$1,12
6
$500
$750
$1,000
$1,250
$1,500
4th Q 19 4th Q 20
$1,15
5,19
4
$1,15
9,37
9
$1,12
6,81
1
$1,0
78,8
40
$1,2
16,3
75
$993
,988
$990
,000
$985
,000
$948
,500
$1,0
82,5
00
$500,000
$750,000
$1,000,000
$1,250,000
$1,500,000
4th Q 19 1st Q 20 2nd Q 20 3rd Q 20 4th Q 20
Average Price Median Price
BHSID 20537692
Condominium Average Price Per Square Foot
Q4 2020
North Brooklyn Cooperatives & Condominiums
Cooperatives & CondominiumsAverage & Median Sales Price

BHS 14
While the average 1-3 family
house price fell sharply
compared to a year ago,
the relatively small number
of sales in this market can
cause data to vary widely
from quarter-to-quarter.BHSID 20191016
1-3 Family HousesQ4 2020
Nor
th B
rook
lyn

BHS 15
$2,6
61,15
5
$2,11
6,97
9
$1,7
50,9
84
$1,9
65,0
00
$2,0
21,7
31
$1,8
75,0
00
$1,8
67,5
00
$1,6
25,0
00
$1,7
60,0
00
$1,8
50,0
00
$1,000,000
$1,500,000
$2,000,000
$2,500,000
$3,000,000
$3,500,000
4th Q 19 1st Q 20 2nd Q 20 3rd Q 20 4th Q 20
Average Price Median Price
BHSID 20191016
Q4 2020
North Brooklyn 1-3 Family Houses
Average & Median Sales Price
$893
$844
$703
$701
$832
$500
$600
$700
$800
$900
$1,000
4th Q 19 1st Q 20 2nd Q 20 3rd Q 20 4th Q 20
Average Price Per Square Foot

BHS 16
Both the average and
median apartment prices
posted double-digit
increases
from 2019’s fourth quarter.BHSID 20577991
Cooperatives & Condominiums
Q4 2020
Cen
tral
Bro
okly
n

BHS 17
$802
$836
$500
$600
$700
$800
$900
4th Q 19 4th Q 20
$677
,945
$726
,236
$799
,734
$699
,146
$763
,274
$618
,800
$635
,000
$705
,300
$688
,000
$756
,907
$200,000
$400,000
$600,000
$800,000
$1,000,000
4th Q 19 1st Q 20 2nd Q 20 3rd Q 20 4th Q 20
Average Price Median Price
Condominium Average Price Per Square Foot
Q4 2020
Central Brooklyn Cooperatives & Condominiums
Cooperatives & CondominiumsAverage & Median Sales Price
BHSID 20298007

BHS 18
Prices for 1-3 family houses
averaged $1,053,171,
a 6% improvement
from a year ago.BHSID 20499429
1-3 Family HousesQ4 2020
Cen
tral
Bro
okly
n

BHS 19
$995
,751
$1,0
03,5
37
$1,0
42,9
02
$955
,738
$1,0
53,17
1
$850
,000
$871
,500
$871
,170
$845
,000
$912
,500
$600,000
$800,000
$1,000,000
$1,200,000
$1,400,000
4th Q 19 1st Q 20 2nd Q 20 3rd Q 20 4th Q 20
Average Price Median Price
BHSID 20365117
Q4 2020
Central Brooklyn 1-3 Family Houses
Average & Median Sales Price
$415
$429
$460
$423
$462
$250
$350
$450
$550
4th Q 19 1st Q 20 2nd Q 20 3rd Q 20 4th Q 20
Average Price Per Square Foot

BHS 20
The average apartment
price was virtually
unchanged
from 2019’s fourth quarter. BHSID 20537716
Cooperatives & Condominiums
Q4 2020
Sout
h Br
ookl
yn

BHS 21
$96,
513
$103
,053
$40,000
$60,000
$80,000
$100,000
$120,000
4th Q 19 4th Q 20
$470
,084
$454
,225
$499
,084
$457
,568
$470
,391
$405
,300
$407
,500
$440
,000
$399
,000
$430
,291
$100,000
$200,000
$300,000
$400,000
$500,000
$600,000
4th Q 19 1st Q 20 2nd Q 20 3rd Q 20 4th Q 20
Average Price Median Price
CooperativeAverage Price Per Room
Condominium Average Price Per Square Foot
Q4 2020
South Brooklyn Cooperatives & Condominiums
$623
$610
$300
$400
$500
$600
$700
4th Q 19 4th Q 20
Cooperatives & CondominiumsAverage & Median Sales Price
BHSID 20363954

BHS 22
Both the average and median
1-3 family house price were
6% higher than a year ago. BHSID 20504605
1-3 Family HousesQ4 2020
Sout
h Br
ookl
yn

BHS 23
$974
,906
$1,0
35,6
55
$998
,031
$1,0
00,9
71
$1,0
31,8
51
$861
,500
$910
,000
$883
,750
$890
,000
$915
,000
$600,000
$800,000
$1,000,000
$1,200,000
$1,400,000
4th Q 19 1st Q 20 2nd Q 20 3rd Q 20 4th Q 20
Average Price Median Price
Halstead Exclusive 20485726
Q4 2020
South Brooklyn 1-3 Family Houses
Average & Median Sales Price
$494
$514
$531
$503
$540
$400
$450
$500
$550
$600
4th Q 19 1st Q 20 2nd Q 20 3rd Q 20 4th Q 20
Average Price Per Square Foot

©2021 by Brown Harris Stevens. All Rights Reserved. This information may not be copied, used or distributed without Brown Harris Stevens’ consent. While information is believed true, no guaranty is made of accuracy.
212.906.9200
Brooklyn Heights122 Montague StreetBrooklyn, NY 11201718.613.2000
Park Slope160 7th AvenueBrooklyn, NY 11215718.878.1960
Cobble Hill162 Court StreetBrooklyn, NY 11201718.613.2020
Bedford Stuyvesant1191 Bedford Avenue,Brooklyn, NY 11216718.878.1750
South Slope1214 8th AvenueBrooklyn, NY 11215718.878.1888
Fort Greene725 Fulton StreetBrooklyn, NY 1127718.613.2800
Bay Ridge8324 4th AvenueBrooklyn, NY 11209718.878.1880
Brooklyn Heights129 Montague StreetBrooklyn, NY 11201 718.875.1289
Park Slope100 Seventh AvenueBrooklyn, NY 11215 718.230.5500
Halstead is now
Con
tact
UsFourth Quarter 2020
Residential Market Report