Fourth Quarter 2010 Results 24 February 2011 - ir.airasia.com · Malaysia breaks billion ringgit...
24
Fourth Quarter 2010 Results 24 February 2011
Transcript of Fourth Quarter 2010 Results 24 February 2011 - ir.airasia.com · Malaysia breaks billion ringgit...
Fourth Quarter 2010 Results 24 February 2011
Fourth Quarter 2010 Results 24 February 2011
Disclaimer
Information contained in our presentation is intended solely for
your reference. Such
information is subject to change without notice, its accuracy is
not guaranteed and it may not
contain all material information concerning the Company. Neither
we nor our advisors make
any representation regarding, and assumes no responsibility or liability for, the accuracy or
completeness of, or any errors or omissions in, any information contained herein.
In addition, the information may contain projections and forward‐looking statements that
reflect the company’s current views with respect to future events and financial performance.
These views are based on current assumptions which are subject to various risks factors and
which may change over time. No assurance can be given that future events will occur, that
projections will be achieved, or that the company’s assumptions are correct. Actual results
may differ materially from those projected.
This presentation can be distributed without any consent of the Company as this is a publicly
available announcement.
1

FY2010 Remarkable performance for AirAsia Group
Malaysia breaks billion ringgit net profit barrier ‐
Profit after tax of RM1.06 billion up 111% y‐o‐y
‐
Achieved billion ringgit net profit with average fuel price per barrel of US$92 in FY2010 ascompared to US$70 in FY2009
Thailand’s performance soaring‐
Revenue of THB12.4 billion recording 33% y‐o‐y growth
‐
Profit after tax of THB2.85 billion with a growth of 452% y‐o‐y
‐
Passenger volume up 14% y‐o‐y, achieved 78% load factor
Indonesia: Reaching new height‐
Revenue of IDR2,764 billion recording 37% y‐o‐y growth
‐
Profit after tax of IDR474 billion with a growth of 214%
‐
Passenger volume grew by 13% y‐o‐y, achieved 77% load factor
Ancillary spending per pax on the rise
Malaysia = RM43 ↑39%, Thailand = THB310 ↑62% , Indonesia = IDR123,308 ↑60%
Net gearing down to 1.75 from 2.62 y‐o‐y
Further debt reduction by associates as they continue to repay. Full repayments within 1‐
2 years
Strong cash balance
Malaysia = RM1.5 billion, Thailand = RM57 million , Indonesia = RM14 million
Lowest P/E airline with the biggest growth prospects2
FY2010 Financial Results -
AirAsia Group
3
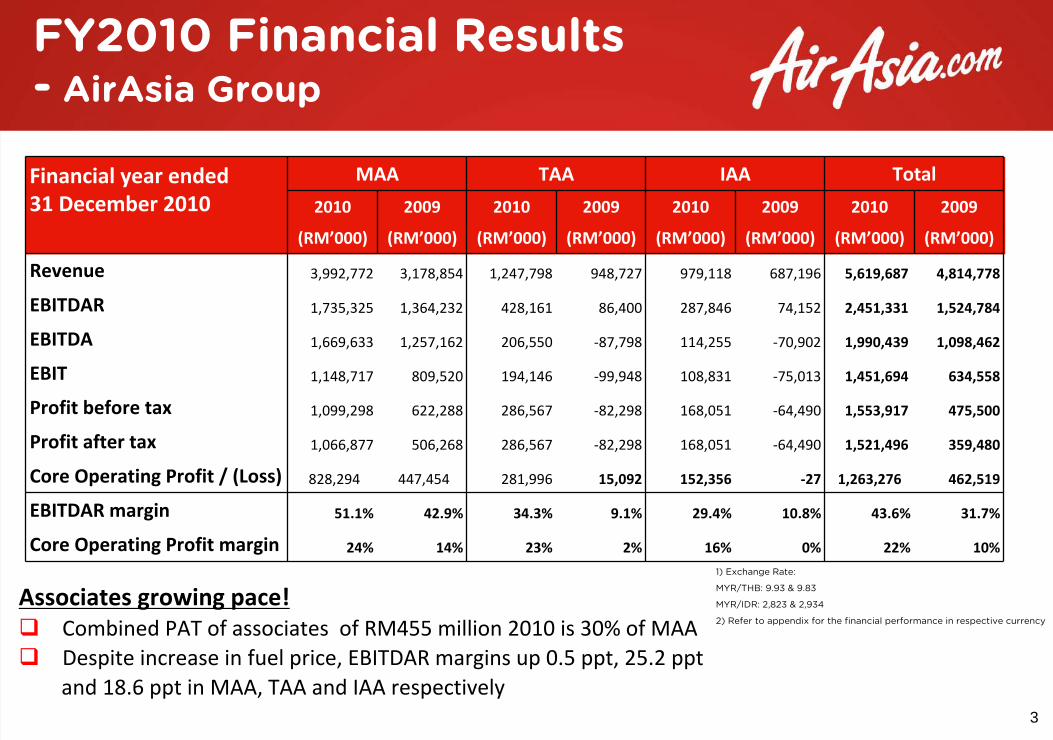
Associates growing pace!
Combined PAT of associates of RM455 million 2010 is 30% of MAA
Despite increase in fuel price, EBITDAR margins up 0.5 ppt, 25.2 ppt and 18.6 ppt in MAA, TAA and IAA respectively
Financial year ended 31 December 2010
MAA TAA IAA Total
2010 2009 2010 2009 2010 2009 2010 2009
(RM’000) (RM’000) (RM’000) (RM’000) (RM’000) (RM’000) (RM’000) (RM’000)
Revenue 3,992,772 3,178,854 1,247,798 948,727 979,118 687,196 5,619,687 4,814,778
EBITDAR 1,735,325 1,364,232 428,161 86,400 287,846 74,152 2,451,331 1,524,784
EBITDA 1,669,633 1,257,162 206,550 ‐87,798 114,255 ‐70,902 1,990,439 1,098,462
EBIT 1,148,717 809,520 194,146 ‐99,948 108,831 ‐75,013 1,451,694 634,558
Profit before tax 1,099,298 622,288 286,567 ‐82,298 168,051 ‐64,490 1,553,917 475,500
Profit after tax 1,066,877 506,268 286,567 ‐82,298 168,051 ‐64,490 1,521,496 359,480
Core Operating Profit / (Loss) 828,294 447,454 281,996 15,092 152,356 ‐27 1,263,276 462,519
EBITDAR margin 51.1% 42.9% 34.3% 9.1% 29.4% 10.8% 43.6% 31.7%
Core Operating Profit margin 24% 14% 23% 2% 16% 0% 22% 10%
1) Exchange Rate:
MYR/THB: 9.93 & 9.83
MYR/IDR: 2,823 & 2,934
2) Refer to appendix for the financial performance in respective
currency
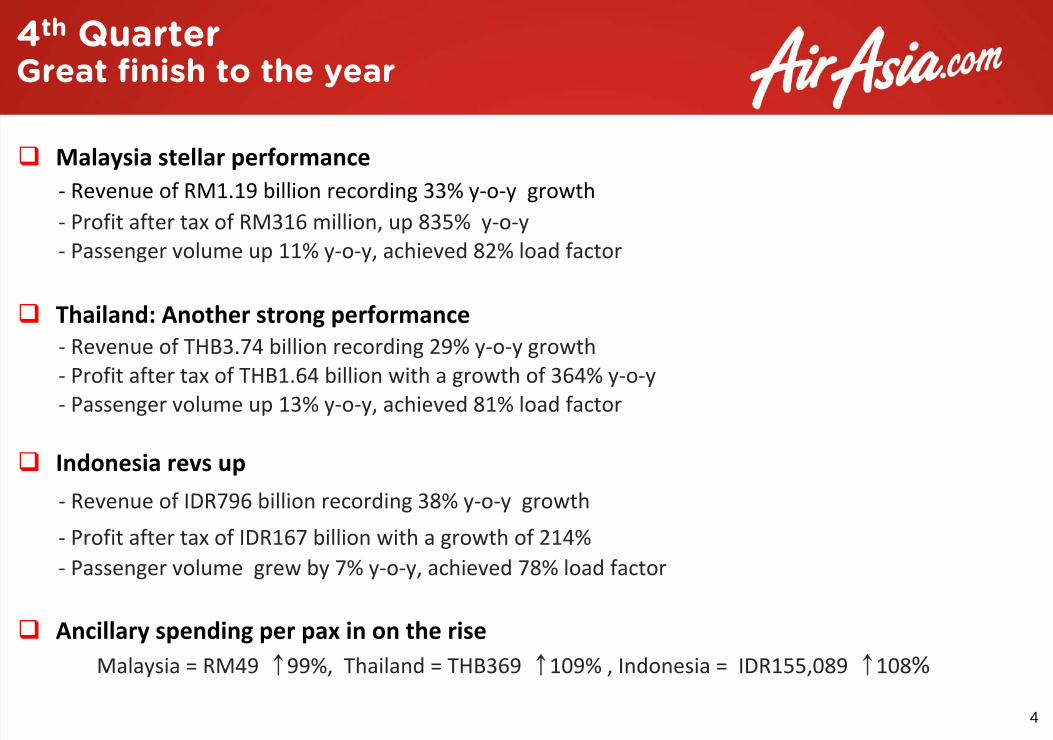
4th Quarter
Great finish to the year
Malaysia stellar performance ‐
Revenue
of RM1.19 billion recording 33% y‐o‐y growth
‐
Profit after tax of RM316 million, up 835% y‐o‐y
‐
Passenger volume up 11% y‐o‐y, achieved 82% load factor
Thailand: Another strong performance‐
Revenue of THB3.74 billion recording 29% y‐o‐y growth
‐
Profit after tax of THB1.64 billion with a growth of 364% y‐o‐y
‐
Passenger volume up 13% y‐o‐y, achieved 81% load factor
Indonesia revs up
‐
Revenue of IDR796 billion recording 38% y‐o‐y growth
‐
Profit after tax of IDR167 billion with a growth of 214%
‐
Passenger volume grew by 7% y‐o‐y, achieved 78% load factor
Ancillary spending per pax in on the rise
Malaysia = RM49 ↑99%, Thailand = THB369 ↑109% , Indonesia = IDR155,089 ↑108%
4
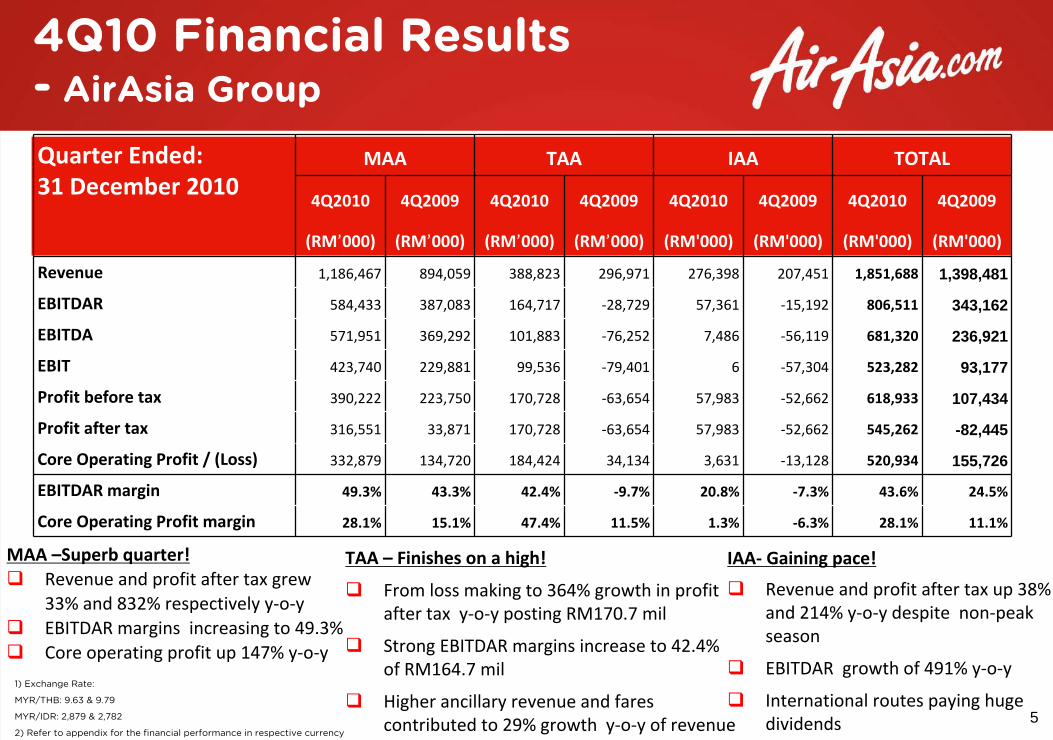
4Q10 Financial Results - AirAsia Group
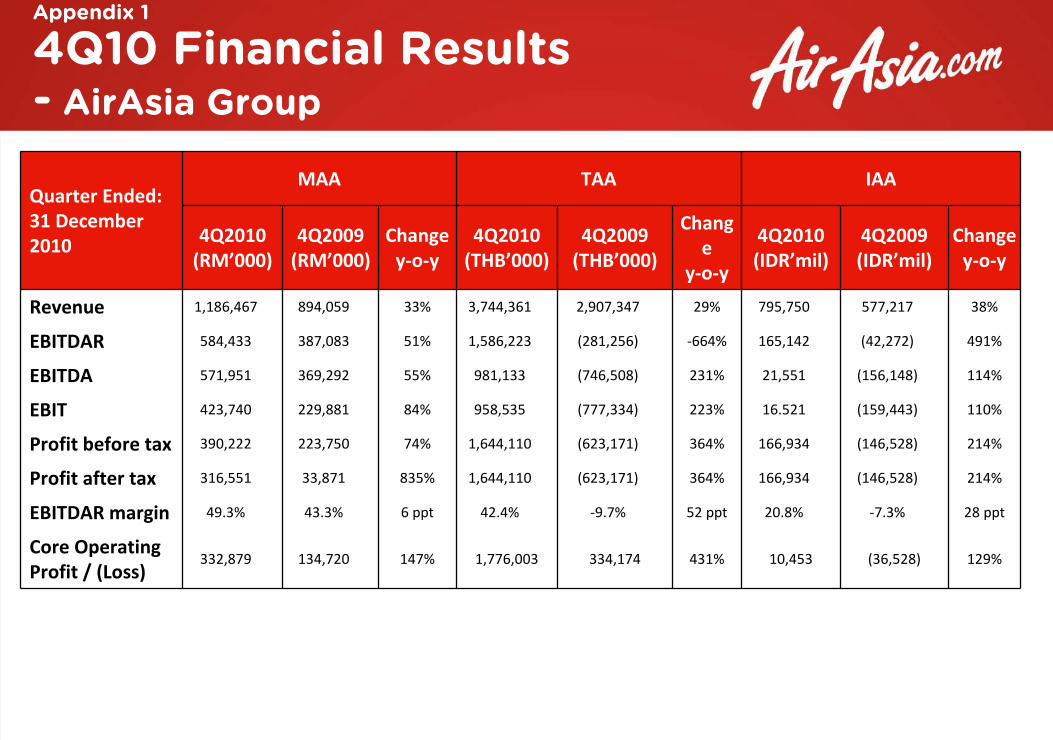
MAA –Superb quarter!
Revenue and profit after tax grew 33% and 832% respectively y‐o‐y
EBITDAR margins increasing to 49.3%
Core operating profit up 147% y‐o‐y
TAA –
Finishes on a high!
From loss making to 364% growth in profit
after tax y‐o‐y posting RM170.7 mil
Strong EBITDAR margins increase to 42.4%
of RM164.7 mil
Higher ancillary revenue and fares
contributed to 29% growth y‐o‐y of revenue
IAA‐
Gaining pace!
Revenue and profit after tax up 38%
and 214% y‐o‐y despite non‐peak
season
EBITDAR growth of 491% y‐o‐y
International routes paying huge
dividends
Quarter Ended: 31 December 2010
MAA TAA IAA TOTAL
4Q2010 4Q2009 4Q2010 4Q2009 4Q2010 4Q2009 4Q2010 4Q2009
(RM’000) (RM’000) (RM’000) (RM’000) (RM'000) (RM'000) (RM'000) (RM'000)
Revenue 1,186,467 894,059 388,823 296,971 276,398 207,451 1,851,688 1,398,481
EBITDAR 584,433 387,083 164,717 ‐28,729 57,361 ‐15,192 806,511 343,162
EBITDA 571,951 369,292 101,883 ‐76,252 7,486 ‐56,119 681,320 236,921
EBIT 423,740 229,881 99,536 ‐79,401 6 ‐57,304 523,282 93,177
Profit before tax 390,222 223,750 170,728 ‐63,654 57,983 ‐52,662 618,933 107,434
Profit after tax 316,551 33,871 170,728 ‐63,654 57,983 ‐52,662 545,262 -82,445
Core Operating Profit / (Loss) 332,879 134,720 184,424 34,134 3,631 ‐13,128 520,934 155,726
EBITDAR margin 49.3% 43.3% 42.4% ‐9.7% 20.8% ‐7.3% 43.6% 24.5%
Core Operating Profit margin 28.1% 15.1% 47.4% 11.5% 1.3% ‐6.3% 28.1% 11.1%
5
1) Exchange Rate:
MYR/THB: 9.63 & 9.79
MYR/IDR: 2,879 & 2,782
2) Refer to appendix for the financial performance in respective
currency

4Q10 Operating Statistics -
AirAsia Group
Quarter Ended:
31 December
2010
MAA TAA IAA
4Q2010 4Q2009 Change
y‐o‐y
4Q2010 4Q2009 Change
y‐o‐y
4Q2010 4Q2009 Change
y‐o‐y
ASK 6,434 5,863 10% 2,043 1,852 10% 1,788 1,604 11%
RPK 5,319 4,409 21% 1,638 1,493 10% 1,392 1,188 17%
Load factor 82% 79% 3 ppt 80% 81% ‐1ppt 78% 74% 4ppt
Rev/ASK (sen/THB/IDR)
18.44 15.25 21% 1.79 1.52 18% 442.27 363.14 22%
Rev/ASK (US cents) 5.92 4.48 32% 5.98 4.57 31% 4.93 3.84 29%
CASK (sen/THB/IDR) 11.85 11.12 7% 0.85 1.99 ‐50% 435.89 459.22 ‐5%
CASK (US cents) 3.81 3.27 16% 4.55 5.97 ‐45% 4.86 4.85 0%
CASK (ex‐fuel) (US
cents)
2.35 1.88 25% 2.85 4.27 ‐62% 2.95 3.12 ‐5%
Average Fare 188 176 7% 1,889 1,789 6% 634,864 545,410 16%
MAA
Average fare up 7% y‐o‐y due to
increased demand in peak season
RASK up 32% y‐o‐y due to increase
in fares and bigger contribution
from ancillary Income
TAA
CASK down 50% due to reduction in
early delivery cost
Average fare still up 6% due the
introduction routes and high peak
season.
Load factor maintained despite
capacity increase
IAA
Average fare up 16% y‐o‐y due strong
performing Australia routes
RASK up 29% y‐o‐y contributed from a high
increase in ancillary spending which rose
108%
Maintaining high load factor of 78% as
passenger growth exceed capacity
6

7
Baggage and cargo revenues continue to soar
Higher take‐ups for in‐flight meals, Hot Seat and AirAsia Insure
Ancillary Income per pax up y‐o‐y across the Group:
Malaysia : ↑99%Thailand : ↑ 109%Indonesia: ↑ 108%
Malaysia (RM)
Ancillary Income -
AirAsia Group
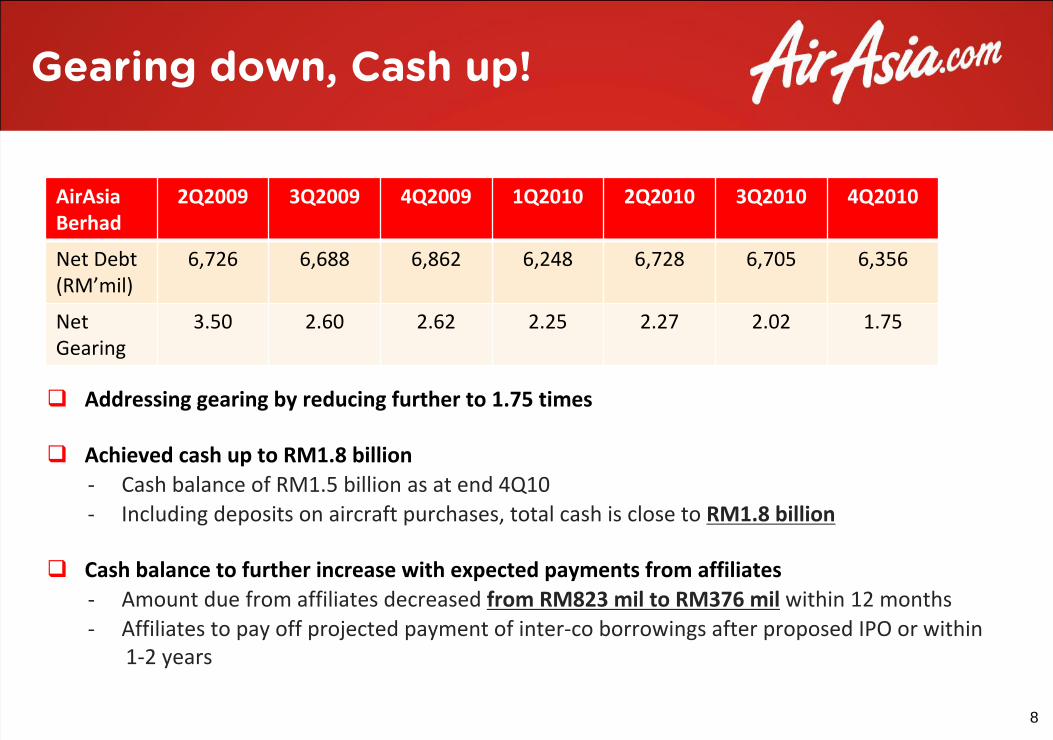
Gearing down, Cash up!
Addressing gearing by reducing further to 1.75 times
Achieved cash up to RM1.8 billion‐
Cash balance of RM1.5 billion as at end 4Q10
‐
Including deposits on aircraft purchases, total cash is close to RM1.8 billion
Cash balance to further increase with expected payments from affiliates‐
Amount due from affiliates decreased from RM823 mil to RM376 mil
within 12 months
‐
Affiliates to pay off projected payment of inter‐co borrowings after proposed IPO or within
1‐2 years
AirAsia
Berhad2Q2009 3Q2009 4Q2009 1Q2010 2Q2010 3Q2010 4Q2010
Net Debt
(RM’mil)6,726 6,688 6,862 6,248 6,728 6,705 6,356
Net
Gearing3.50 2.60 2.62 2.25 2.27 2.02 1.75
8

AirAsia Group has the biggest and youngest fleet among the LCC’s in the region with an average age of 2 years
86 aircraft still on order; In discussions with Airbus to acquire the ‘new engine option’
(“NEO”) Airbus A320 aircraft
Deferment of 2012 aircraft deliveries from 24 to 14 with no penalty from Airbus
Financing for 8 aircraft to be delivered in 2011 is secured
To phase out remaining 4 Boeing B737 in Indonesia upon completion of runway upgrade in Bandung
Fleets of various Asian Airlines
Airlines In Service On Order
AirAsia Group 93 86
Singapore Airlines 110 48
Malaysia Airlines 92 59
Thai Airways 86 21
Garuda Indonesia 81 35
Vietnam Airlines 65 62
Lion Air 57 139
Philippines Airways 40 4
Cebu Pacific 32 19
Bangkok Airways 17 6
Silk Air 18 6
Tiger Airways 25 43
Source: CAPA
200
8
200
9
2010
2011
2012
E
2013
E
2014
E
2015
E
56
19
70
14
86
4
94
4
106130
154175
Boeing B737
Airbus A320
CURRENT AIRASIA GROUP FLEET SIZE PLAN
Fleet Development
9

Attractive Valuations among airlines (as at 22 February 2011)
Source : AirAsia – Actual 2010,
Other airlines ‐
Bloomberg consensus
Largest regional LCC
in terms of market
capitalization
Lowest P/E among theLCCs
Despite P/E is low, there is upside in ROE. Among the highest at 27.99%
10

Into the Second Decade
11
12
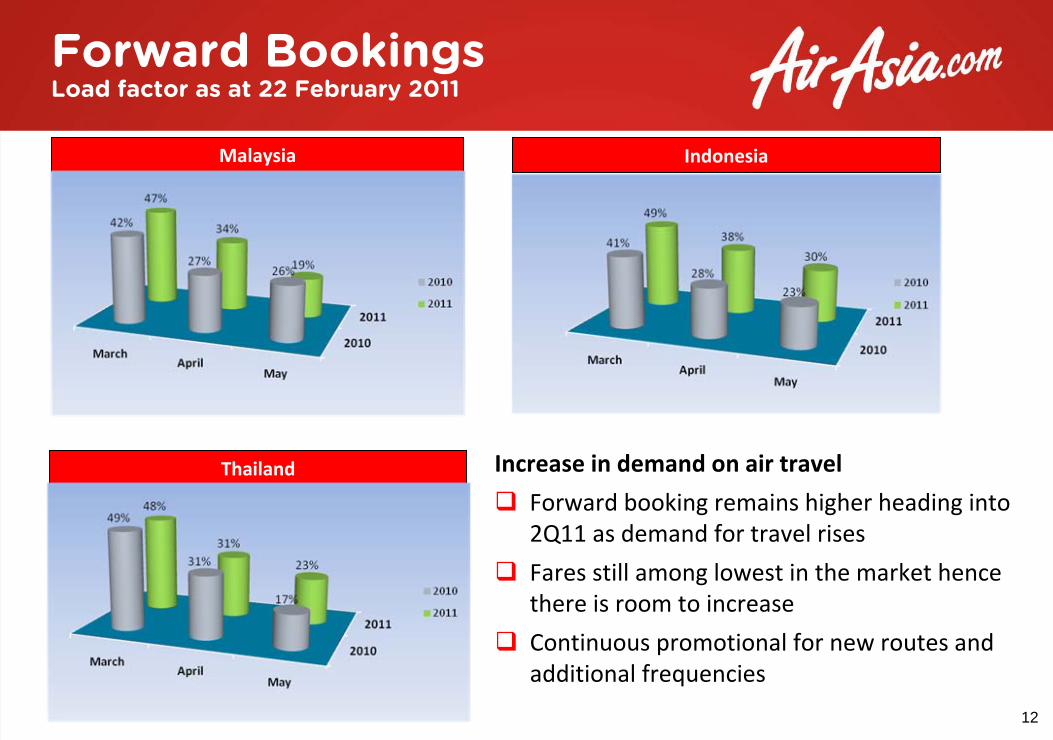
Forward Bookings Load factor as at 22 February 2011
Increase in demand on air travel
Forward booking remains higher heading into
2Q11 as demand for travel rises
Fares still among lowest in the market hence
there is room to increase
Continuous promotional for new routes and
additional frequencies
Thailand
IndonesiaMalaysia
13
Fuel ManagementProven active measures to counter any spike in fuel prices
Record PAT of RM1.06 billion in 2010 at average fuel price of US$92/barrel at fleet size of 90 aircraft
AirAsia was the first airline to be able to remove fuel surcharge in November 2008.
Counter measures amongst others:‐‐
Re‐introduce fuel surcharge
‐
Ancillary initiatives ‐
every RM1/pax spent provides approximately US$1/barrel of buffer
‐
Higher aircraft capacity enables costs to spread across more passengers
Current oil hedging position‐
Hedged up to 21% for up to 2Q11 at average of US$92.31/barrel
(fixed swap WTI)
‐
Hedges have no margin calls impact
‐
Huge lines with several institutions for oil hedging
‐
Ability to hedge through financial markets or physically with oil suppliers
Projected sensitivity analysis shows every ‐/+ US$1/barrel on fuel movements will impact approximately ‐/+RM15 million in EBITDA and PAT.
MALAYSIA
Strengthening Domestic Operations‐
Ramping up frequencies on key East Malaysian routes performing well
‐
Increasing domestic market share of 58% in 2010
‐
International market share of 37% in 2010
Focus on optimizing load factor
[
Increased frequencies on routes that is popular with AirAsia X traffic. AirAsia X acts as a feeder for AirAsia network.
To maintain discipline cost management across the organization
Reduce average stage length and focus on shorter routes within 3.5 hours (i.e. Indian sub‐continents)
AirAsia Group What’s ahead in 2011
THAILAND
To revenue manage key domestic and international routes (i.e. Indian routes)
Developing Chiang Mai as Thailand 3rd
hub to strengthen group network
To increase domestic market share (largest LCC with 43% market share in 2010)
Further expansion into China
INDONESIA
Strengthening dominance in international sector‐
Leader in international market share of 41%
Growing existing hubs such as Bali and Surabaya and introducing
Medan as Indonesia 5th
hub 14
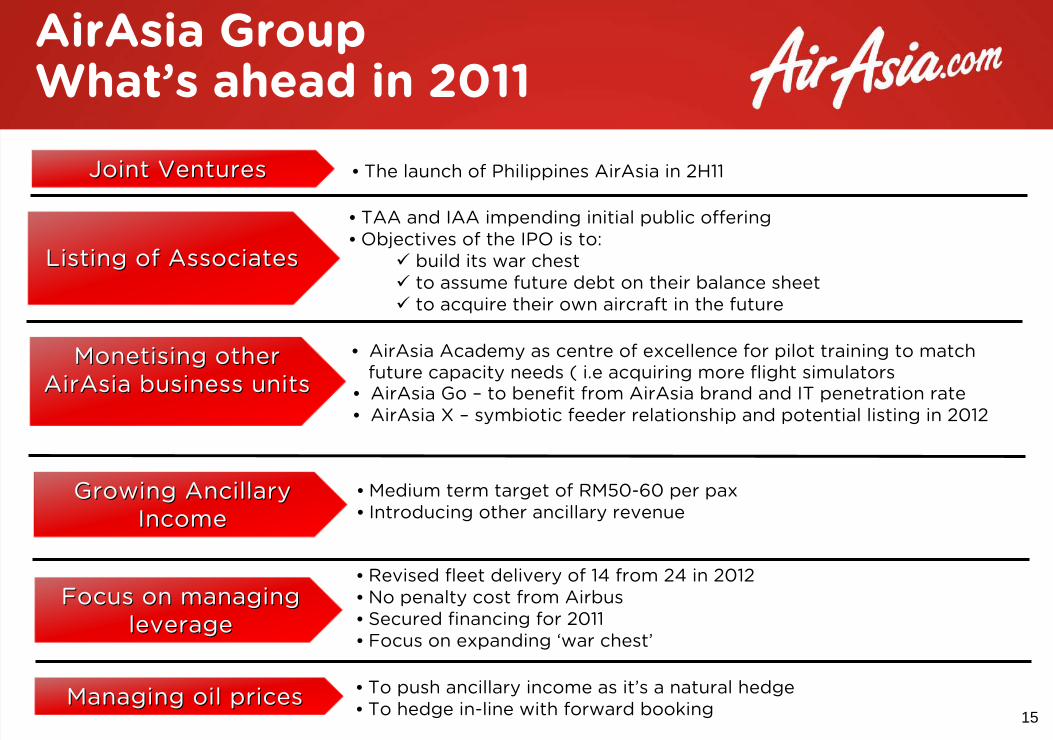
Joint VenturesJoint Ventures
Listing of AssociatesListing of Associates
MonetisingMonetising other other
AirAsiaAirAsia business unitsbusiness units
Growing Ancillary Growing Ancillary IncomeIncome
Managing oil pricesManaging oil prices
• The launch of Philippines AirAsia
in 2H11
• TAA and IAA impending initial public offering• Objectives of the IPO is to:
build its war chest to assume future debt on their balance sheet to acquire their own aircraft in the future
• AirAsia
Academy as centre of excellence for pilot training to match future capacity needs ( i.e
acquiring more flight simulators• AirAsia
Go –
to benefit from AirAsia
brand and IT penetration rate• AirAsia
X –
symbiotic feeder relationship and potential listing in 2012
• Medium term target of RM50-60 per pax• Introducing other ancillary revenue
Focus on managing Focus on managing leverageleverage
• Revised fleet delivery of 14 from 24 in 2012 • No penalty cost from Airbus• Secured financing for 2011• Focus on expanding ‘war chest’
• To push ancillary income as it’s a natural hedge • To hedge in-line with forward booking 15
AirAsia Group
What’s ahead in 2011

Thank You 2010

Appendix
17
Appendix 1
4Q10 Financial Results -
AirAsia
Group
Quarter Ended:
31 December
2010
MAA TAA IAA
4Q2010(RM’000)
4Q2009(RM’000)
Change
y‐o‐y4Q2010(THB’000)
4Q2009 (THB’000)
Chang
e
y‐o‐y
4Q2010(IDR’mil)
4Q2009 (IDR’mil)
Change
y‐o‐y
Revenue 1,186,467 894,059 33% 3,744,361 2,907,347 29% 795,750 577,217 38%
EBITDAR 584,433 387,083 51% 1,586,223 (281,256) ‐664% 165,142 (42,272) 491%
EBITDA 571,951 369,292 55% 981,133 (746,508) 231% 21,551 (156,148) 114%
EBIT 423,740 229,881 84% 958,535 (777,334) 223% 16.521 (159,443) 110%
Profit before tax 390,222 223,750 74% 1,644,110 (623,171) 364% 166,934 (146,528) 214%
Profit after tax 316,551 33,871 835% 1,644,110 (623,171) 364% 166,934 (146,528) 214%
EBITDAR margin 49.3% 43.3% 6 ppt 42.4% ‐9.7% 52 ppt 20.8% ‐7.3% 28 ppt
Core Operating
Profit / (Loss) 332,879 134,720 147% 1,776,003 334,174 431% 10,453 (36,528) 129%
19
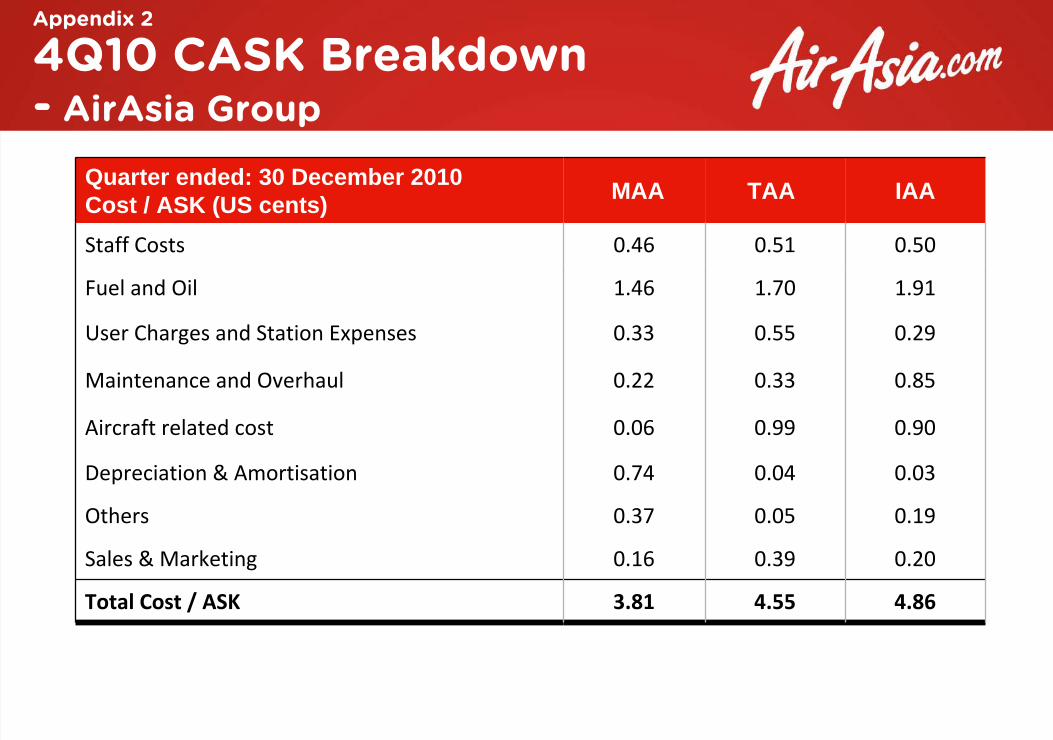
Quarter ended: 30 December 2010Cost / ASK (US cents) MAA TAA IAA
Staff Costs 0.46 0.51 0.50
Fuel and Oil 1.46 1.70 1.91
User Charges and Station Expenses 0.33 0.55 0.29
Maintenance and Overhaul 0.22 0.33 0.85
Aircraft related cost 0.06 0.99 0.90
Depreciation & Amortisation 0.74 0.04 0.03
Others 0.37 0.05 0.19
Sales & Marketing 0.16 0.39 0.20
Total Cost / ASK 3.81 4.55 4.86
Appendix 2
4Q10 CASK Breakdown -
AirAsia
Group
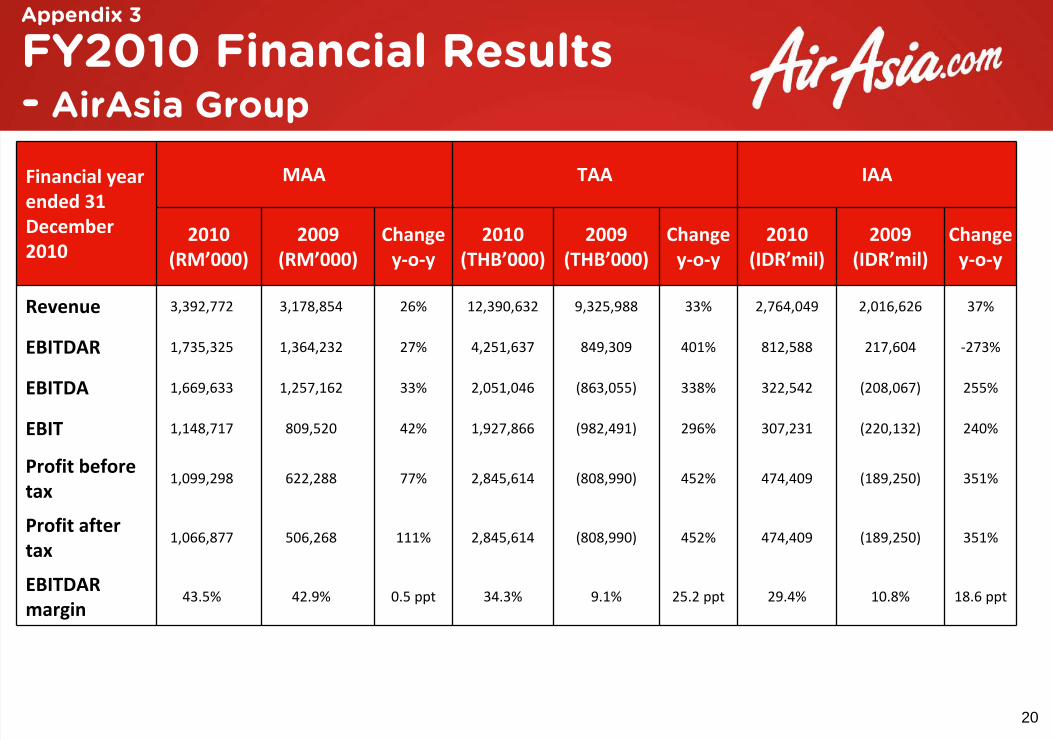
Appendix 3
FY2010 Financial Results -
AirAsia
Group
20
Financial year
ended 31
December
2010
MAA TAA IAA
2010(RM’000)
2009(RM’000)
Change
y‐o‐y2010
(THB’000)2009
(THB’000)Change
y‐o‐y2010
(IDR’mil)2009
(IDR’mil)Change
y‐o‐y
Revenue 3,392,772 3,178,854 26% 12,390,632 9,325,988 33% 2,764,049 2,016,626 37%
EBITDAR 1,735,325 1,364,232 27% 4,251,637 849,309 401% 812,588 217,604 ‐273%
EBITDA 1,669,633 1,257,162 33% 2,051,046 (863,055) 338% 322,542 (208,067) 255%
EBIT 1,148,717 809,520 42% 1,927,866 (982,491) 296% 307,231 (220,132) 240%
Profit before
tax1,099,298 622,288 77% 2,845,614 (808,990) 452% 474,409 (189,250) 351%
Profit after
tax1,066,877 506,268 111% 2,845,614 (808,990) 452% 474,409 (189,250) 351%
EBITDAR
margin43.5% 42.9% 0.5 ppt 34.3% 9.1% 25.2 ppt 29.4% 10.8% 18.6 ppt
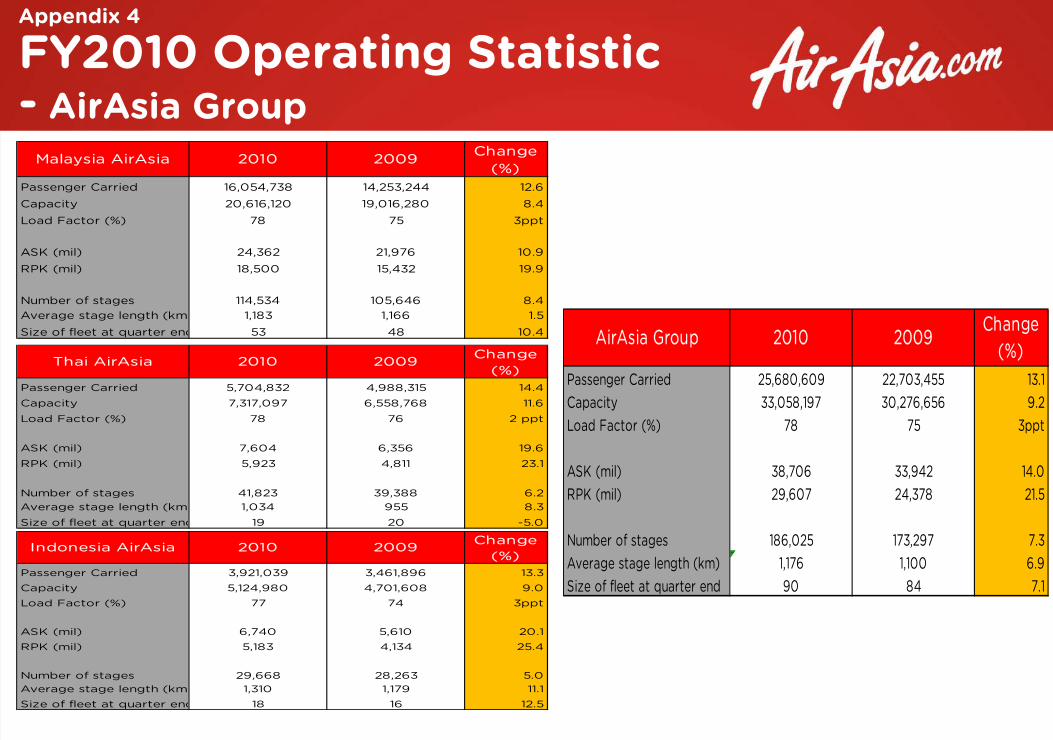
Passenger Carried 13.1Capacity 9.2Load Factor (%) 3ppt
ASK (mil) 14.0RPK (mil) 21.5
Number of stages 7.3Average stage length (km) 6.9Size of fleet at quarter end 7.1
AirAsia Group 2010 2009Change
(%)25,680,609 22,703,45533,058,197 30,276,656
78 75
38,706 33,942
90 84
29,607 24,378
186,025 173,2971,176 1,100
Passenger Carried 13.3Capacity 9.0Load Factor (%) 3ppt
ASK (mil) 20.1RPK (mil) 25.4
Number of stages 5.0Average stage length (km) 11.1Size of fleet at quarter end 12.5
29,668 28,2631,310 1,179
18 16
77 74
6,740 5,6105,183 4,134
Change (%)
3,921,039 3,461,8965,124,980 4,701,608
2010 2009Indonesia AirAsia
Passenger Carried 14.4Capacity 11.6Load Factor (%) 2 ppt
ASK (mil) 19.6RPK (mil) 23.1
Number of stages 6.2Average stage length (km) 8.3Size of fleet at quarter end -5.0
1,034 95519 20
7,604 6,3565,923 4,811
41,823 39,388
Change (%)
5,704,832 4,988,3157,317,097 6,558,768
78 76
2009Thai AirAsia 2010
Passenger Carried 12.6Capacity 8.4Load Factor (%) 3ppt
ASK (mil) 10.9RPK (mil) 19.9
Number of stages 8.4Average stage length (km) 1.5Size of fleet at quarter end 10.4
1,183 1,16653 48
75
24,362 21,97618,500 15,432
114,534 105,646
Change (%)
2010 2009
16,054,738 14,253,24420,616,120 19,016,280
78
Malaysia AirAsia
Appendix 4
FY2010 Operating Statistic -
AirAsia Group
Overview
AirAsia has investments of 48.9% in both TAA and IAA
The aviation laws of Thailand and Indonesia require foreign shareholdings to not exceed 50%
interest in these entities
Based on the shareholders’
agreements for these entities, TAA is considered to be a jointly
controlled entity and IAA is considered to be an associate of AirAsia.
The basis of this consideration is due to the various covenants in the agreements whereby in the
case of TAA, key decisions are taken jointly and in the case of IAA, AirAsia has only significant
influence
Accounting Considerations
AirAsia’s accounting treatment for its investments in IAA and TAA is in full compliance with
International Financial Reporting Standards (“FRS”)
The IFRS applied are FRS 131 “Accounting for Jointy Controlled Entities”
(IFRS 31) which applies to
TAA and FRS 128 “
Accounting for Associates”
(IFRS 28) which applies to IAA
TAA and IAA are accounted for using the equity method of accounting per the respective Standards
Consolidation of TAA and IAA is strictly prohibited by the IFRS unless the shareholder arrangements
change, which result in AirAsia having control. AirAsia can account for all the losses of TAA and IAA if
it assumes obligations for all liabilities of TAA and IAA which will obviously be detrimental to the
shareholders of AirAsia
Appendix 5 Accounting for TAA and IAA
22
23
Equity Accounting
The equity method
is a method of accounting whereby the investment is initially recognised
at cost and adjusted thereafter for the post‐acquisition change in the investor’s share of net
assets of the investee. The profit or loss of the investor includes the investor's share of the
profit or loss of the investee.
FRS 128 and FRS 131 provide that if an investor’s share of losses of an associate or jointly
controlled entity equals or exceeds its interest in the associate, the investor discontinues
recognising its share of further losses unless the investor has incurred legal or constructive
obligations or made payments on behalf of the associate.
Consequently, as the share of losses for both TAA and IAA have exceeded the cost of
investment in these entities, AirAsia has in prior years fully provided for the cost of
investment in both TAA and IAA (amounting to RM12 million and RM4 million respectively), and
discontinued its recognition of share of any further losses, as required by the Standard, as it
has not provided any legal or constructive obligations or made payments on behalf of the
associate or jointly controlled entity.
Accounting for TAA and IAA(continued)


![Mid-Term Business Strategy - Alpine Electronics · Mid-term Business Strategy. 4) Business Plan. Net Sales [unit:¥billion] Operating Profit [unit:¥billion] 15. Title: スライド](https://static.fdocuments.us/doc/165x107/5b8522fd7f8b9a4a488da1bc/mid-term-business-strategy-alpine-mid-term-business-strategy-4-business.jpg)