Fourth Quarter 2002 Preliminary & Unaudited February 6, 2003 Note to Internet viewers: Please use...
27
Fourth Quarter 2002 Preliminary & Unaudited February 6, 2003 o Internet viewers: Please use “NOTES PAGES” view to access all notes and
-
Upload
raymond-whitehead -
Category
Documents
-
view
213 -
download
0
Transcript of Fourth Quarter 2002 Preliminary & Unaudited February 6, 2003 Note to Internet viewers: Please use...

Fourth Quarter 2002Preliminary & Unaudited
February 6, 2003
Note to Internet viewers: Please use “NOTES PAGES” view to access all notes and text.

Agenda - 4th Quarter
• Highlights
• Operating Statistics
• Competitive Environment
• Revenue Highlights
• Income Highlights

(millions)Consol.Q4 2002
Consol.Q4 2001
ChangeFav./(Unfav.)
Oper. Revenue $2,243 $2,117 $ 126
Oper. Expense 2,505 2,425 (80)
Non-recur. Labour Expense 26 - (26)
Oper. Income (Loss) (288) (308) 20
Non-oper. Income (Expense) (71) (66) (5)
Income (Loss) Before FX & Tax (359) (374) 15
FX on Long Term Monetary Items (14) 87 (101)
Income (Loss) Before Tax $ (373) $ (287) $ (86)
Operating Results* Improve By $46 Million Before Non-recur. Labour Charge of $26 mln.
*Preliminary & unaudited

(millions) Q4 2002Change
Fav./(Unfav.)
Net Interest Inc. (Exp.) $ (55) $ 14
Loss on Sale (34) 3Q4’02 acrft.provision of $32mln versus $41mln in Q4’01.
Other Non-Operating Inc. (Exp.) 18 (22)
Total Non-Operating Inc. (Exp.) $ (71) $ (5)
Gain onpurchase ofAC debt:
$15 mln ’02
$27 mln ‘01
Q4 Net Interest Exp.* Improves $14 Million
*Preliminary & unaudited

ASMs RPMs LF Yield RASM Rev
Domestic 6.1% 1.6% 5.4 PP 2.7% 4.7% 1.1%
Transborder 0.2% 5.2% 3.0 PP 0.3% 5.3% 5.5%
Oth. Int’l. 4.8% 11.5% 4.5 PP 5.4% 12.2% 17.5%
Total 4.1% 5.9% 1.1 PP 1.6% 3.3% 7.6%
Total Expense 3.4%
Total Net CASM 1.0%
Q4 Stats At a GlanceMainline Operations

2002
Q4
2002/2001
Q4
2002/2001
Y-T-D
Traffic (RPMs) 9.3 bln +5.9% +3.6%
Capacity (ASMs) 13.2 bln +4.1% +0.4%
Load Factor 70.7% +1.1 PP +2.3 PP
Strength In Transborder U.S. and International Pushes Load Factor Up
Mainline Operating Statistics

Canada and International Capacity Rises While U.S. Remains Unchanged(Y-O-Y Changes in Mainline Capacity)
-20%
-15%
-10%
-5%
0%
5%
10%
Canada U.S. Oth. Int'l Total
Q4 2001/2000 Q1 2002/2001 Q2 2002/2001 Q3 02/Adj Q3 01 Q4 2002/2001
% Change in ASMs

Dom. Trfc. Weak Due to Incr. Competition. U.S. Recovers & Pacific Remains Strong. Comp. is to Particularly Weak Q4 01 Period.(Y-O-Y Changes in Mainline Traffic)
-15%
-10%
-5%
0%
5%
10%
15%
Canada U.S. Oth. Int'l Total
Q4 2001/2000 Q1 2002/2001 Q2 2002/2001 Q3 02/Adj Q3 01 Q4 2002/2001
% Change in RPMs
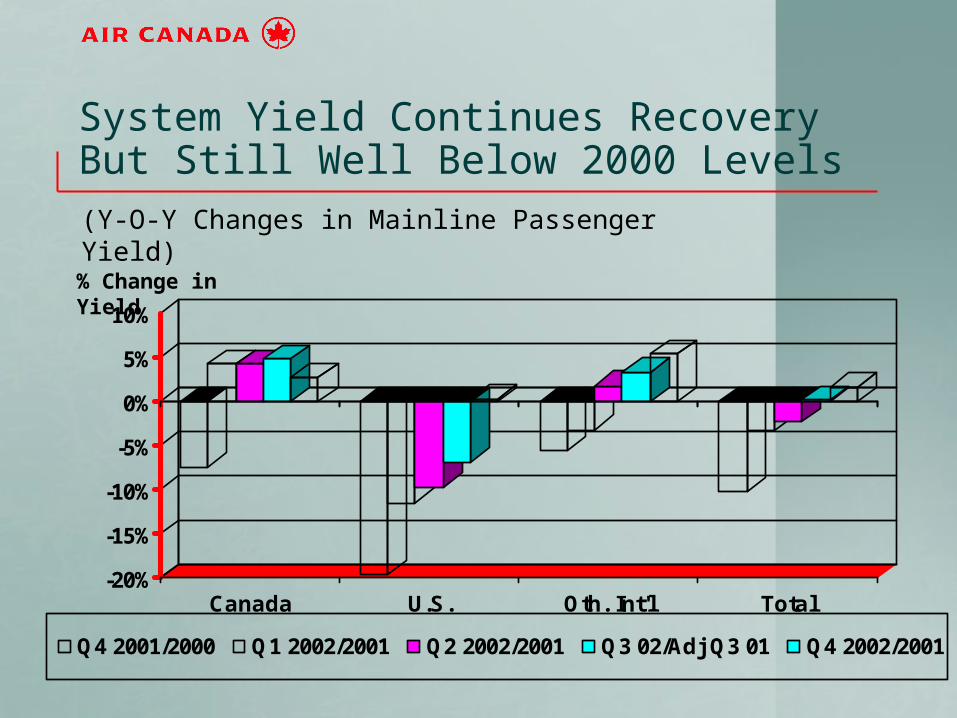
System Yield Continues Recovery But Still Well Below 2000 Levels(Y-O-Y Changes in Mainline Passenger Yield)
-20%
-15%
-10%
-5%
0%
5%
10%
Canada U.S. Oth. Int'l Total
Q4 2001/2000 Q1 2002/2001 Q2 2002/2001 Q3 02/Adj Q3 01 Q4 2002/2001
% Change in Yield

System RASM Up As Higher U.S. & Very Strong Int’l Offsets Weak Canada(Y-O-Y Changes in Mainline Revenue per ASM)
-25%
-20%
-15%
-10%
-5%
0%
5%
10%
15%
Canada U.S. Oth. Int'l Total
Q4 2001/2000 Q1 2002/2001 Q2 2002/2001 Q3 02/Adj Q3 01 Q4 2002/2001
% Change in RASM

Q4 Revenue Up on Recovering U.S. and Continued International Strength(Y-O-Y Changes in Mainline Passenger Revenue)
-30%
-20%
-10%
0%
10%
20%
Canada U.S. Oth. Int'l Total
Q4 2001/2000 Q1 2002/2001 Q2 2002/2001 Q3 02/Adj Q3 01 Q4 2002/2001
% Change in Revenue

Load Factor Decline Pushes RASM Down
-15%
-10%
-5%
0%
5%
10%
Q4’01 Q1’02 Q2’02 Q3’02 Q4’02
Capacity - Canada(Y-O-Y Changes in Capacity)
% Change in ASMs
-10%
-5%
0%
5%
10%
-10%
-5%
0%
5%
10%
Yield - Canada(Y-O-Y Changes in Passenger Yield)
RASM - Canada(Y-O-Y Changes in Revenue per ASM)
Load Factor- Canada(Y-O-Y Changes in Load Factor)
% Change in RASM
PP Change in Load Factor
% Change in Yield
Q4’01 Q1’02 Q2’02 Q3’02 Q4’02 Q4’01 Q1’02 Q2’02 Q3’02 Q4’02
Q4’01 Q1’02 Q2’02 Q3’02 Q4’02-10
-5
0
5
10

Higher U.S. Load Factor & Improving Yield Pushes Up RASM
-5
-3
0
3
5
-15%
-10%
-5%
0%
5%
Q4’01 Q1’02 Q2’02 Q3’02 Q4’02
Capacity - Transborder(Y-O-Y Changes in Capacity)
% Change in ASMs
-30%
-20%
-10%
0%
10%
-25%
-20%
-15%
-10%
-5%
0%
5%
Yield - Transborder(Y-O-Y Changes in Passenger Yield)
RASM - Transborder (Y-O-Y Changes in Revenue per ASM)
Load Factor- Transborder (Y-O-Y Changes in Load Factor)
% Change in RASM
PP Change in Load Factor
% Change in Yield
Q4’01 Q1’02 Q2’02 Q3’02 Q4’02 Q4’01 Q1’02 Q2’02 Q3’02 Q4’02
Q4’01 Q1’02 Q2’02 Q3’02 Q4’02

Other Int’l RASM Up On Continued Higher Load Factor And Yield
-5
0
5
10
-20%
-15%
-10%
-5%
0%
5%
10%
Q4’01 Q1’02 Q2’02 Q3’02 Q4’02
Capacity - Other Int’l(Y-O-Y Changes in Capacity)
% Change in ASMs
-5%
0%
5%
10%
15%
-10%
-5%
0%
5%
10%
Yield - Other Int’l(Y-O-Y Changes in Passenger Yield)
RASM - Other Int’l (Y-O-Y Changes in Revenue per ASM)
Load Factor- Other Int’l (Y-O-Y Changes in Load Factor)
% Change in RASM
PP Change in Load Factor
% Change in Yield
Q4’01 Q1’02 Q2’02 Q3’02 Q4’02 Q4’01 Q1’02 Q2’02 Q3’02 Q4’02
Q4’01 Q1’02 Q2’02 Q3’02 Q4’02

System RASM Up On Higher Load Factor And Improved Yield
-5
0
5
10
-20%
-15%
-10%
-5%
0%
5%
Q4’01 Q1’02 Q2’02 Q3’02 Q4’02
Capacity - Total(Y-O-Y Changes in Capacity)
% Change in ASMs
-10%
-5%
0%
5%
-15%
-10%
-5%
0%
5%
Yield - Total(Y-O-Y Changes in Passenger Yield)
RASM - Total (Y-O-Y Changes in Revenue per ASM)
Load Factor- Total (Y-O-Y Changes in Load Factor)
% Change in RASM
PP Change in Load Factor
% Change in Yield
Q4’01 Q1’02 Q2’02 Q3’02 Q4’02 Q4’01 Q1’02 Q2’02 Q3’02 Q4’02
Q4’01 Q1’02 Q2’02 Q3’02 Q4’02

-30%
-20%
-10%
0%
10%
-10%
-5%
0%
5%
CASM RASM
U.S. & Int’l Services Drive Higher System RASM - Unit Cost Continues Improvement
-10%
-5%
0%
5%
10%
Q4’01 Q1’02 Q2’02 Q3’02 Q4’02
Canada RASM% Change Y-O-Y
-5%
0%
5%
10%
15%
Other Int’l RASM Total System
USA RASM
% Change Y-O-Y
% Change Y-O-Y
% Change Y-O-Y
Q4’01 Q1’02 Q2’02 Q3’02 Q4’02 Q4’01 Q1’02 Q2’02 Q3’02 Q4’02
Q4’01 Q1’02 Q2’02 Q3’02 Q4’02

U.S. Carriers Posted Larger Increases Over The Post 9-11 4th Quarter ‘01 (Y-O-Y Traffic Change)
-30%
-20%
-10%
0%
10%
20%
AC AMR CONT DEL UAL USAIR
Q4 2001/2000 Q1 2002/2001 Q2 2002/2001 Q3 2002/2001 Q4 2002/2001
% Change in RPMs
**Not available
**

2002Q4
2002/2001Q4
2002/2001Y-T-D
Salaries, Wages &Benefits
$692 mln +11.1% +2.7%
Excl. $43 million infavourable Q4 ’01 adj.re pension & otherbenefit expenses and$40 million in S&Waccrual reversals inQ1 ‘01
+3.9% -0.3%
Salaries & Wages: Manpower level up; average salary & benefits cost up
(Air Canada - Mainline)

Average Salary Up 1.5%, Employee Levels Up 594 or 1.7%(Y-O-Y Change - Total Salaries * & Employees*)
-20%
-15%
-10%
-5%
0%
5%
10%
Q4'01 Q1'02 Q2'02 Q3'02 Q4'02
Average Salaries Employees
*Mainline
% Change Y-O-Y

2002Q4
2002/2001Q4
2002/2001Y-T-D
Aircraft Fuel $291 mln -0.3% -17.1%
Fuel: Total price unchanged due favourable hedging comparison to 2001
(Air Canada - Mainline)

-25%
-20%
-15%
-10%
-5%
0%
5%
10%
Q4'01 Q1'02 Q2'02 Q3'02 Q4'02
Fuel Productivity (ASMs/Lt) Fuel Cost (Cdn cts/Lt)
Mainline Cost Per Litre Up 0.4% While Productivity Up 4.9%(Fuel Productivity* & Unit Cost*)
*Mainline
% Change Y-O-Y

-20%
-10%
0%
10%
20%
All Expense Categories Down except Acft. Rent & User Fees - Mtce. & Food & Bar Unchanged
% Change Y-O-Y
Q4 2002/2001
RPMs ASMs COMM. FOOD& BAR
A/CMTCE
USERFEES
A/CRENT
OTHERDEP.

-10%
-5%
0%
5%
Q4'01 Q1'02 Q2'02 Q3'02 Q4'02
Q4 Net Unit Cost Down 1.0%(Cost Per ASM*)
*Mainline, adjusted for non-ASM revenue
% Change Y-O-Y

-4%
-3%
-2%
-1%
0%
1%
2%
3%
Other Reductions (commissions, I.T., bld. rent, crew cycle, workers comp., etc.) Key To Net CASM* Improvement Of 1.0%**
*Mainline** Not adjusted for $43 mln Q4/01one-time reduction in benefits expense
Labour**Labour**& Benefits& Benefits
FuelFuel Unit cost** decrease
net of non-ASM
revenue
OtherEffect of Effect of non-ASM non-ASM revenuerevenue

9.9 9.6 9.810.4
9.3 9.5 9.0 9.0 8.9 9.0 8.5 9.1
7.2 6.8
0
4
8
12
UAL AMR DEL NWEST AC CONT SWEST
Q4'02 Q4'01
Air Canada’s Net Unit Cost At Low End Of N.A. Majors
*Adjusted for non-ASM producing activity.
(Unit Cost* per ASM - Q4‘02 & Q4‘01)
U.S. cents

Dec 31/02$ mlns
Dec 31/01$ mlns
%Change
Cash $ 558 $ 1,067 -47.7% Current Assets $ 1,771 $ 2,235 -20.8% Property & Equip. $ 2,279 $ 2,830 -19.5% Current Liabilities $ 2,597 $ 2,869 -9.5% Long Term Debt $ 4,102 $ 4,580 -10.4% Shareholder’s Equity $ (1,888) $ (1,460) NM Book Value per share $ (15.71) $(12.15) NM
Balance Sheet* - Liquidity is Adequate(Air Canada - Consolidated)
*Preliminary & unauditedNM - not meaningful