Fourier theory made easy (?). 5*sin (2 4t) Amplitude = 5 Frequency = 4 Hz seconds A sine wave.
30
Fourier theory made easy (?)
-
date post
21-Dec-2015 -
Category
Documents
-
view
218 -
download
3
Transcript of Fourier theory made easy (?). 5*sin (2 4t) Amplitude = 5 Frequency = 4 Hz seconds A sine wave.

Fourier theory made easy (?)

0 0.1 0.2 0.3 0.4 0.5 0.6 0.7 0.8 0.9 1-8
-6
-4
-2
0
2
4
6
8
5*sin (24t)
Amplitude = 5
Frequency = 4 Hz
seconds
A sine wave

0 0.1 0.2 0.3 0.4 0.5 0.6 0.7 0.8 0.9 1-8
-6
-4
-2
0
2
4
6
8
5*sin(24t)
Amplitude = 5
Frequency = 4 Hz
Sampling rate = 256 samples/second
seconds
Sampling duration =1 second
A sine wave signal

0 0.2 0.4 0.6 0.8 1 1.2 1.4 1.6 1.8 2-2
-1.5
-1
-0.5
0
0.5
1
1.5
2sin(28t), SR = 8.5 Hz
An undersampled signal
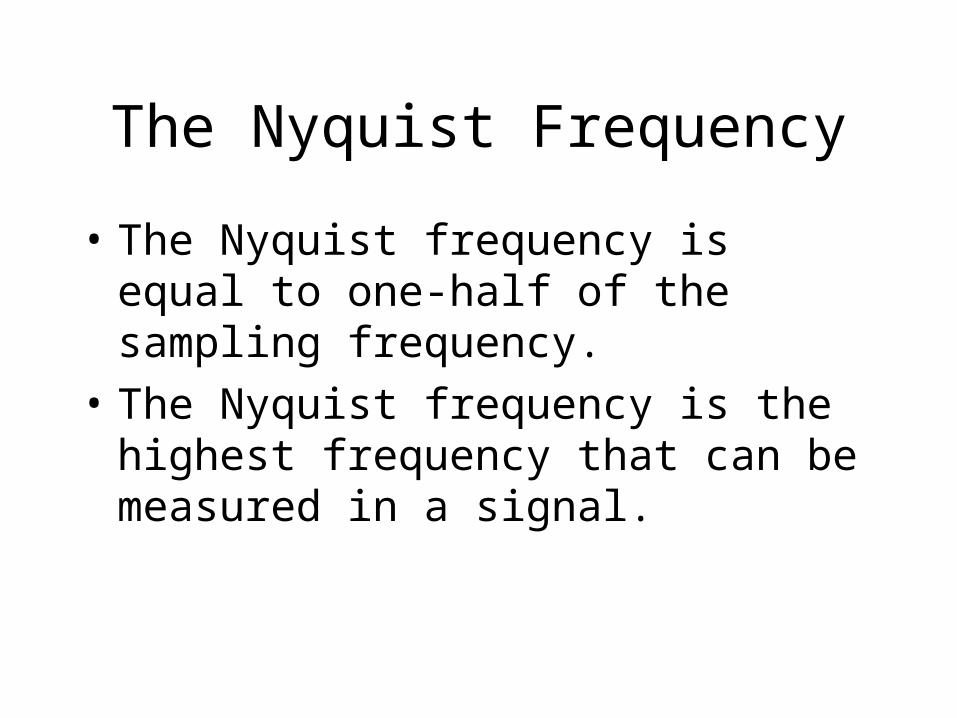
The Nyquist Frequency
• The Nyquist frequency is equal to one-half of the sampling frequency.
• The Nyquist frequency is the highest frequency that can be measured in a signal.

http://www.falstad.com/fourier/j2/
Fourier series
• Periodic functions and signals may be expanded into a series of sine and cosine functions

The Fourier Transform
• A transform takes one function (or signal) and turns it into another function (or signal)

The Fourier Transform
• A transform takes one function (or signal) and turns it into another function (or signal)
• Continuous Fourier Transform:
close your eyes if you don’t like integrals

The Fourier Transform
• A transform takes one function (or signal) and turns it into another function (or signal)
• Continuous Fourier Transform:
dfefHth
dtethfH
ift
ift
2
2
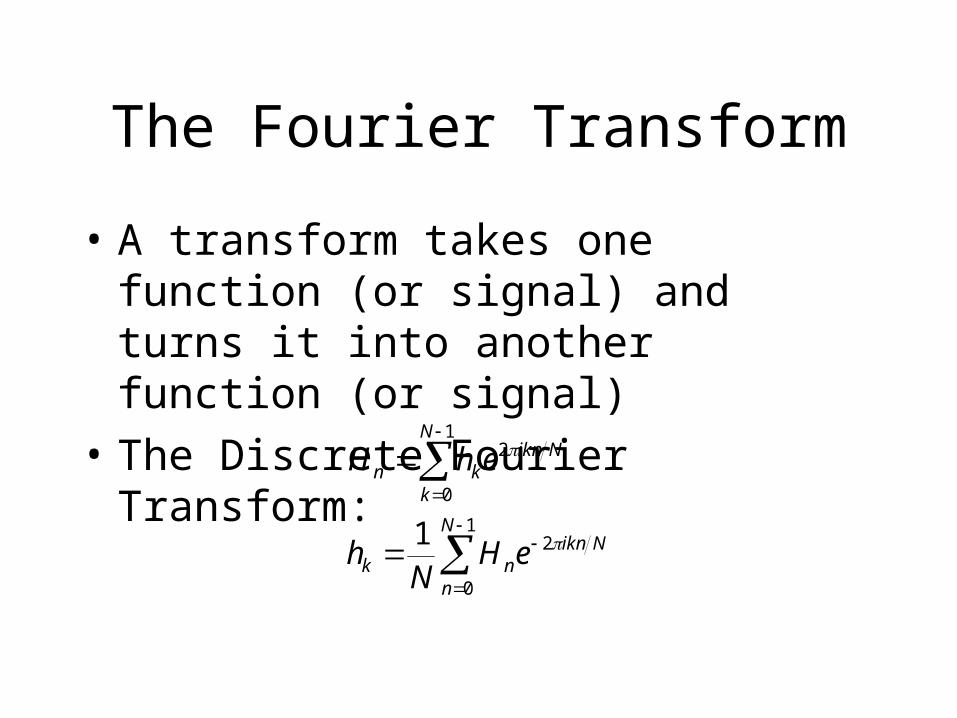
• A transform takes one function (or signal) and turns it into another function (or signal)
• The Discrete Fourier Transform:
The Fourier Transform
1
0
2
1
0
2
1 N
n
Niknnk
N
k
Niknkn
eHN
h
ehH
Fast Fourier Transform
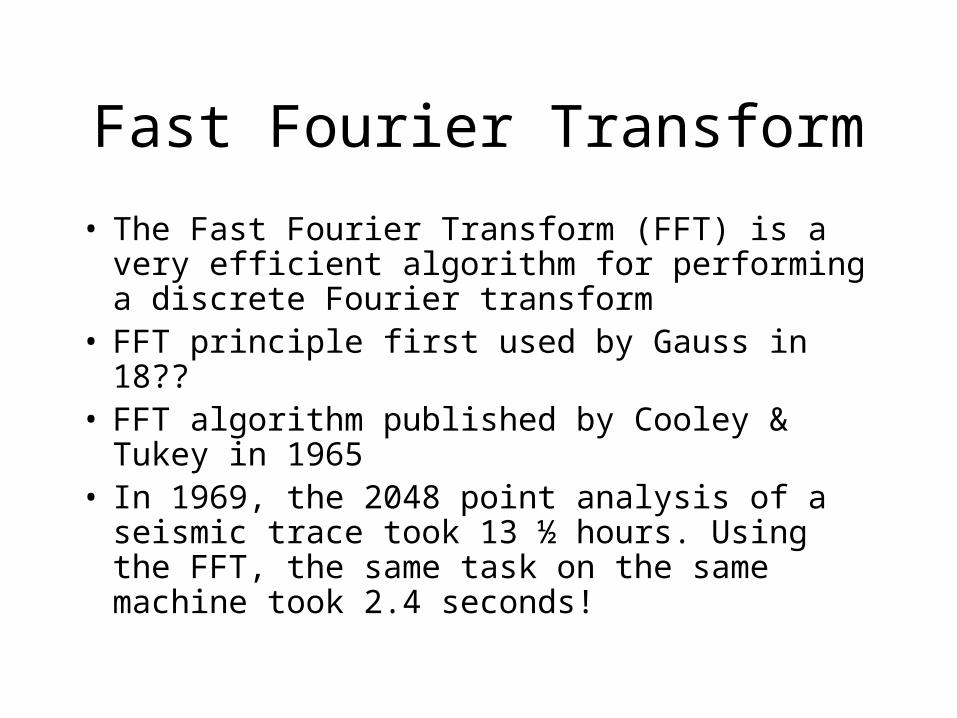
• The Fast Fourier Transform (FFT) is a very efficient algorithm for performing a discrete Fourier transform
• FFT principle first used by Gauss in 18??• FFT algorithm published by Cooley & Tukey in
1965• In 1969, the 2048 point analysis of a seismic trace
took 13 ½ hours. Using the FFT, the same task on the same machine took 2.4 seconds!

0 0.2 0.4 0.6 0.8 1 1.2 1.4 1.6 1.8 2-2
-1
0
1
2
0 20 40 60 80 100 1200
50
100
150
200
250
300
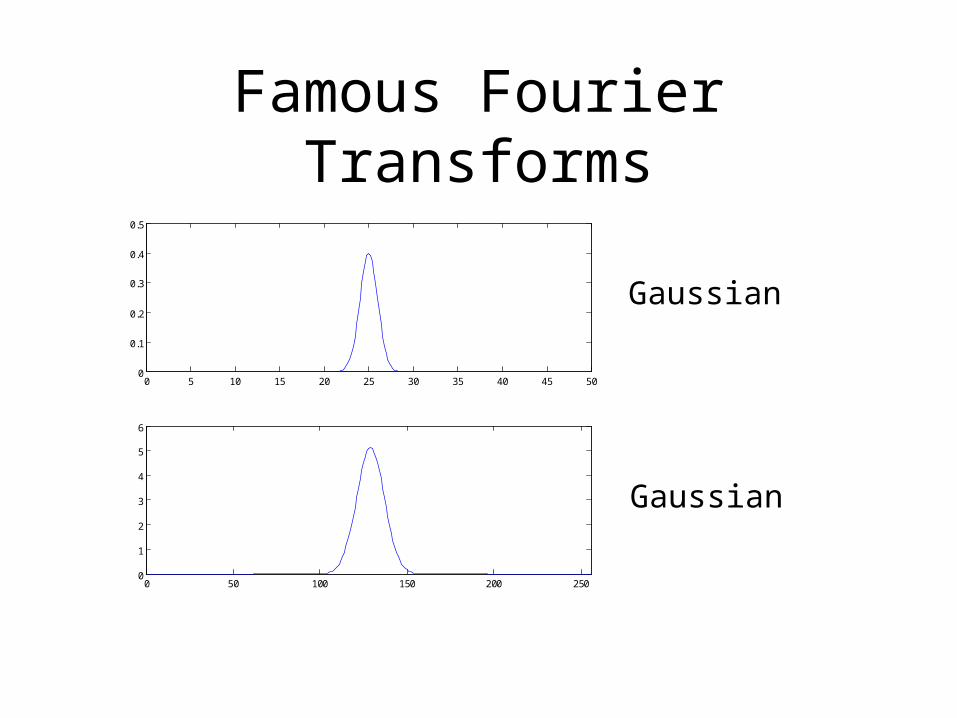
Famous Fourier Transforms
Sine wave
Delta function
Famous Fourier Transforms
0 5 10 15 20 25 30 35 40 45 500
0.1
0.2
0.3
0.4
0.5
0 50 100 150 200 2500
1
2
3
4
5
6
Gaussian
Gaussian

Famous Fourier Transforms
-1 -0.8 -0.6 -0.4 -0.2 0 0.2 0.4 0.6 0.8 1-0.5
0
0.5
1
1.5
-100 -50 0 50 1000
1
2
3
4
5
6
Sinc function
Square wave

Famous Fourier Transforms
Sinc function
Square wave
-1 -0.8 -0.6 -0.4 -0.2 0 0.2 0.4 0.6 0.8 1-0.5
0
0.5
1
1.5
-100 -50 0 50 1000
1
2
3
4
5
6

Famous Fourier Transforms
Exponential
Lorentzian
0 50 100 150 200 2500
5
10
15
20
25
30
0 0.2 0.4 0.6 0.8 1 1.2 1.4 1.6 1.8 20
0.2
0.4
0.6
0.8
1

FFT of FID
0 0.2 0.4 0.6 0.8 1 1.2 1.4 1.6 1.8 2-2
-1
0
1
2
0 20 40 60 80 100 1200
10
20
30
40
50
60
70
f = 8 Hz SR = 256 HzT2 = 0.5 s
2exp2sin
Tt
fttF

FFT of FID
0 0.2 0.4 0.6 0.8 1 1.2 1.4 1.6 1.8 2-2
-1
0
1
2
0 20 40 60 80 100 1200
2
4
6
8
10
12
14
f = 8 HzSR = 256 HzT2 = 0.1 s

FFT of FID
0 0.2 0.4 0.6 0.8 1 1.2 1.4 1.6 1.8 2-2
-1
0
1
2
0 20 40 60 80 100 1200
50
100
150
200
f = 8 Hz SR = 256 HzT2 = 2 s
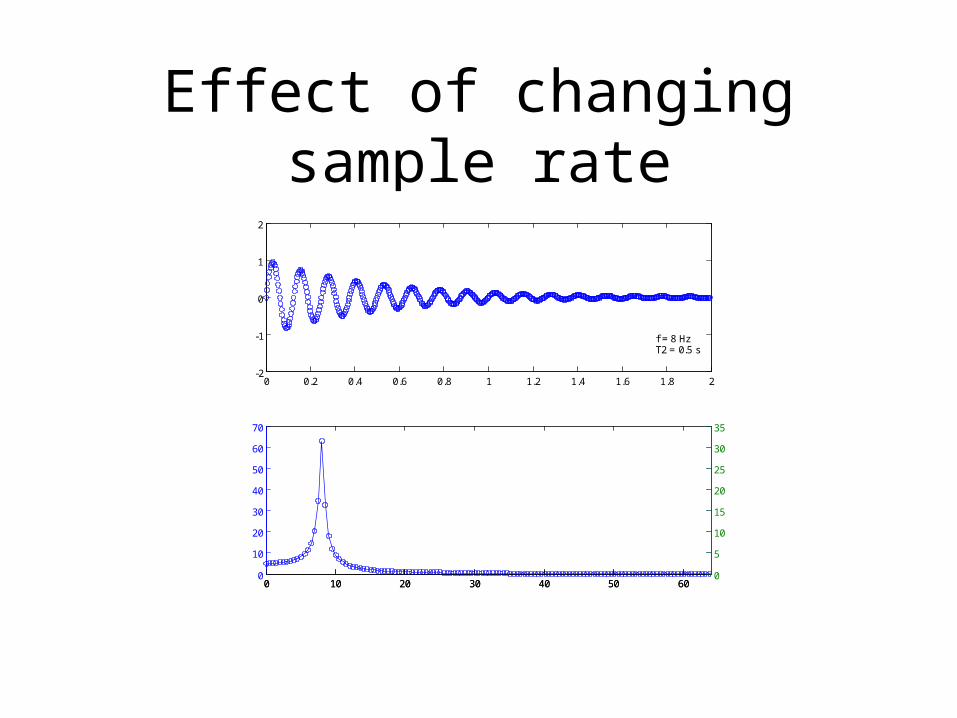
Effect of changing sample rate
0 10 20 30 40 50 600
10
20
30
40
50
60
70
0 0.2 0.4 0.6 0.8 1 1.2 1.4 1.6 1.8 2-2
-1
0
1
2
0 10 20 30 40 50 600
5
10
15
20
25
30
35
f = 8 Hz T2 = 0.5 s

Effect of changing sample rate
0 10 20 30 40 50 600
10
20
30
40
50
60
70
0 0.2 0.4 0.6 0.8 1 1.2 1.4 1.6 1.8 2-2
-1
0
1
2
0 10 20 30 40 50 600
5
10
15
20
25
30
35
SR = 256 HzSR = 128 Hz
f = 8 HzT2 = 0.5 s

Effect of changing sample rate
• Lowering the sample rate:– Reduces the Nyquist frequency, which– Reduces the maximum measurable frequency– Does not affect the frequency resolution

Effect of changing sampling duration
0 0.2 0.4 0.6 0.8 1 1.2 1.4 1.6 1.8 2-2
-1
0
1
2
0 2 4 6 8 10 12 14 16 18 200
10
20
30
40
50
60
70
f = 8 Hz T2 = .5 s
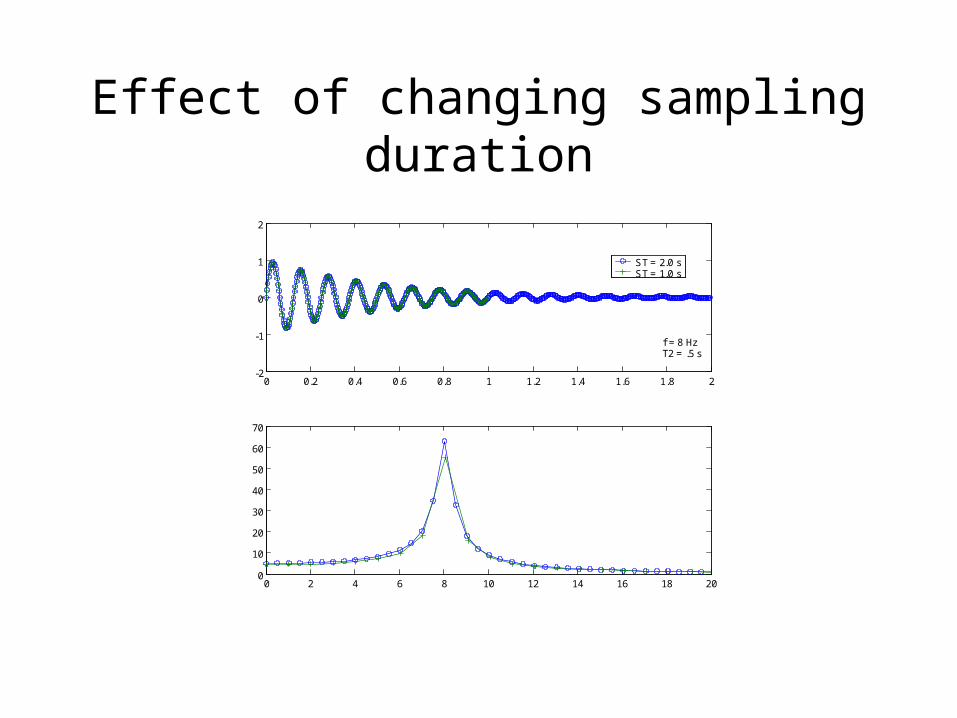
Effect of changing sampling duration
0 0.2 0.4 0.6 0.8 1 1.2 1.4 1.6 1.8 2-2
-1
0
1
2
0 2 4 6 8 10 12 14 16 18 200
10
20
30
40
50
60
70
ST = 2.0 sST = 1.0 s
f = 8 HzT2 = .5 s

Effect of changing sampling duration
• Reducing the sampling duration:– Lowers the frequency resolution– Does not affect the range of frequencies you
can measure
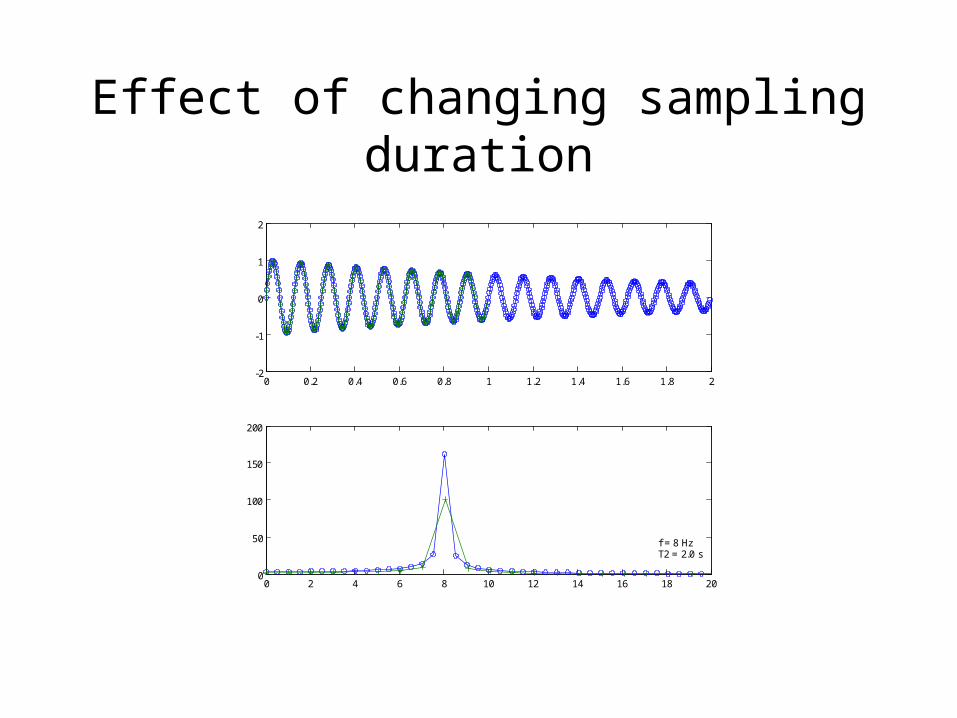
Effect of changing sampling duration
0 0.2 0.4 0.6 0.8 1 1.2 1.4 1.6 1.8 2-2
-1
0
1
2
0 2 4 6 8 10 12 14 16 18 200
50
100
150
200
f = 8 Hz T2 = 2.0 s

Effect of changing sampling duration
0 0.2 0.4 0.6 0.8 1 1.2 1.4 1.6 1.8 2-2
-1
0
1
2
0 2 4 6 8 10 12 14 16 18 200
2
4
6
8
10
12
14
ST = 2.0 sST = 1.0 s
f = 8 Hz T2 = 0.1 s
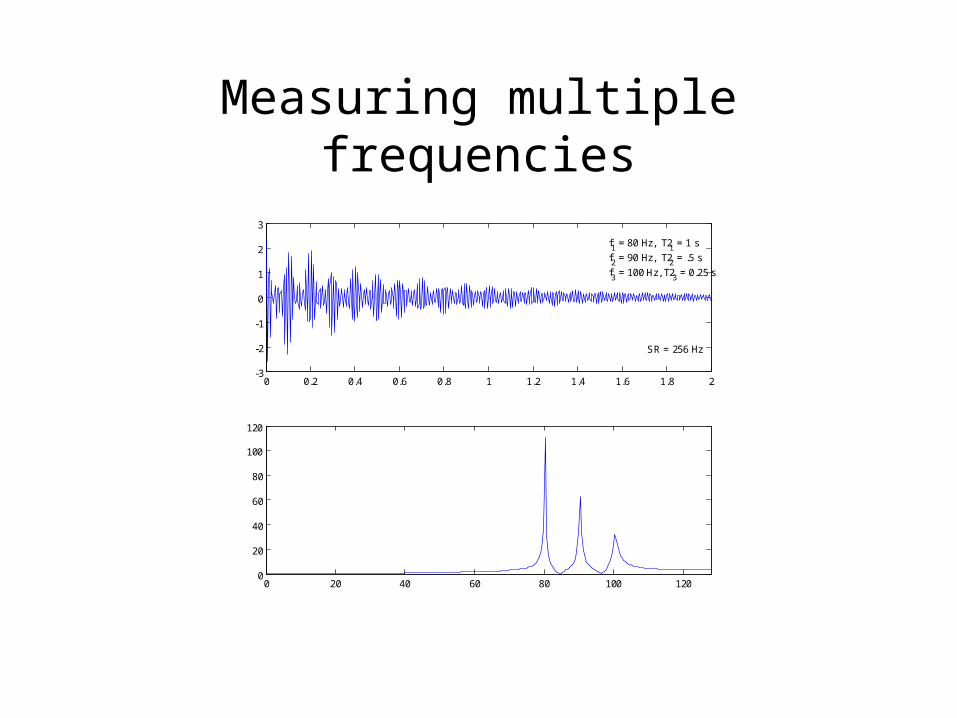
Measuring multiple frequencies
0 0.2 0.4 0.6 0.8 1 1.2 1.4 1.6 1.8 2-3
-2
-1
0
1
2
3
0 20 40 60 80 100 1200
20
40
60
80
100
120
f1 = 80 Hz, T21 = 1 s
f2 = 90 Hz, T22 = .5 s
f3 = 100 Hz, T2
3 = 0.25 s
SR = 256 Hz

Measuring multiple frequencies
0 0.2 0.4 0.6 0.8 1 1.2 1.4 1.6 1.8 2-3
-2
-1
0
1
2
3
0 20 40 60 80 100 1200
20
40
60
80
100
120
f1 = 80 Hz, T21 = 1 s
f2 = 90 Hz, T22 = .5 s
f3 = 200 Hz, T2
3 = 0.25 s
SR = 256 Hz

Some useful links
• http://www.falstad.com/fourier/– Fourier series java applet
• http://www.jhu.edu/~signals/– Collection of demonstrations about digital signal processing
• http://www.ni.com/events/tutorials/campus.htm– FFT tutorial from National Instruments
• http://www.cf.ac.uk/psych/CullingJ/dictionary.html– Dictionary of DSP terms
• http://jchemed.chem.wisc.edu/JCEWWW/Features/McadInChem/mcad008/FT4FreeIndDecay.pdf– Mathcad tutorial for exploring Fourier transforms of free-induction decay
• http://lcni.uoregon.edu/fft/fft.ppt– This presentation