![four7. 02 Twenty 2007 - Crasmantwentyfour7.studio.crasman.fi/pub/web/pdf/magazine... · issue no. 02 Twenty 2007 four7. WÄRTSILÄ TECHNICAL JOURNAL [ ] Cooling Indian offi ces Business](https://static.fdocuments.us/doc/165x107/5a70ec177f8b9abb538c67be/four7-02-twenty-2007-crasmantwentyfour7studiocrasmanfipubwebpdfmagazinepdf.jpg)
four7. 01 Twenty 2010twentyfour7.studio.crasman.fi/pub/web/pdf/magazine... · 01 Twenty 2010 four7....
68
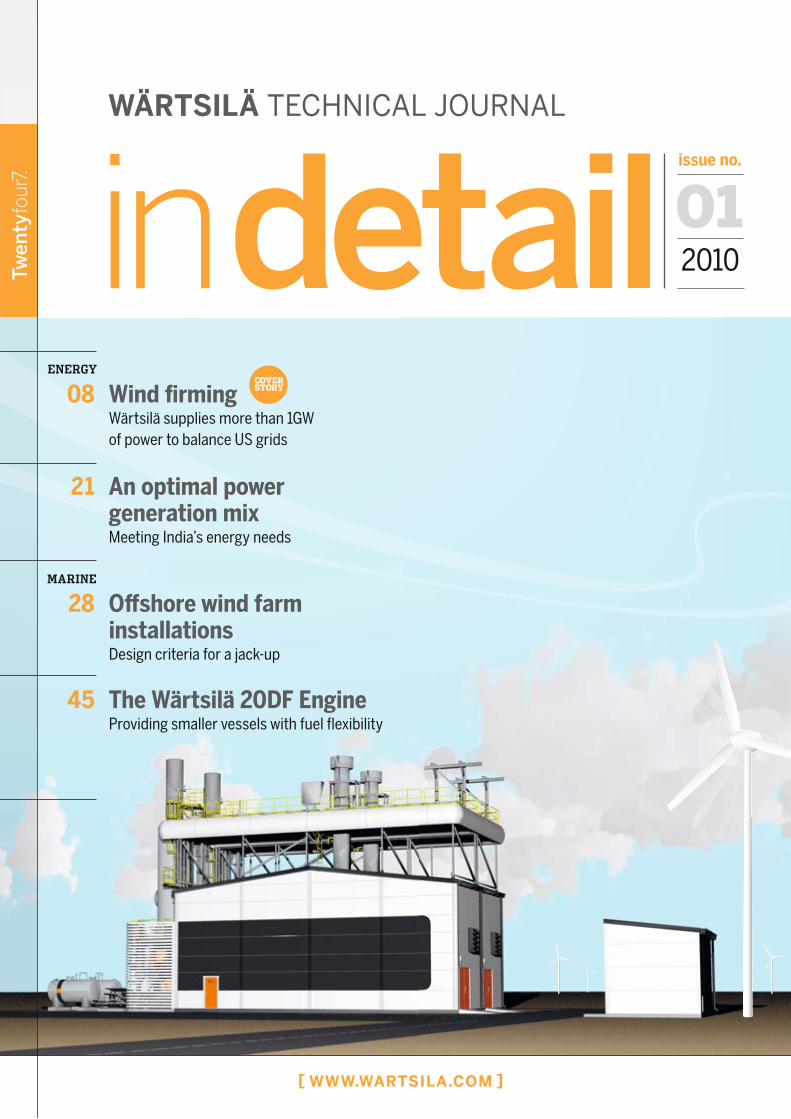
issue no. 01 2010 Twentyfour7. WÄRTSILÄ TECHNICAL JOURNAL [ WWW.WARTSILA.COM ] Wind firming Wärtsilä supplies more than 1GW of power to balance US grids 08 21 ENERGY MARINE 28 An optimal power generation mix Meeting India’s energy needs Offshore wind farm installations Design criteria for a jack-up The Wärtsilä 20DF Engine Providing smaller vessels with fuel flexibility 45 COVER STORY
Transcript of four7. 01 Twenty 2010twentyfour7.studio.crasman.fi/pub/web/pdf/magazine... · 01 Twenty 2010 four7....
issue no.
012010Tw
enty
four
7.
WÄRTSILÄ TECHNICAL JOURNAL
[ WWW.WARTSILA.COM ]
Wind fi rming Wärtsilä supplies more than 1GW of power to balance US grids
08
21
ENERGY
MARINE
28
An optimal power generation mixMeeting India’s energy needs
Off shore wind farm installationsDesign criteria for a jack-up
The Wärtsilä 20DF EngineProviding smaller vessels with fuel fl exibility
45
COVER STORY
Dear Reader
issue no. 01.2010 in detail
E-mail and feedback: [email protected]
2 in detail
THE WORLD WILL still need shipping and energy in the future. Th is is a fact; despite all the challenges the global economy has faced recently, and this need will be further driven by population growth. Shipping is the most effi cient way of transporting cargo, and is a crucial enabler of globalisation. At the same time, globalisation is further increasing the need for shipping.
IN THE ENERGY MARKET, long-term electricity demand is increasing. Furthermore, with greater variations in power expected, the need for fl exible capacity management is increasing. Wind and solar energy need regulating capacity because they are not controllable in terms of availability, and big baseload plants lack the fl exibilityto manage variations in capacity. Decentralized plants,with their high effi ciency and ability to pick up loadvariations quickly, off er a smart solution. Wärtsilä isstrong in this fi eld.
IN THE MARINE MARKET, emission regulations are becoming more stringent. At the same time ship owners are facing overcapacity, low freight rates, and operating cost challenges in general. Wärtsilä aims to improve overall cost effi ciency and profi t levels for its customers. Our development work focuses on fl exibility, both in terms of fuel selection and operation, and on high effi ciency with low emissions. Having all necessary competences, we hold a unique market position. We off er ship design, engines, propulsion equipment, electrical & automation systems, emission abatement technologies, lifecycle service off erings, and now navigation equipment. By combining our know-how with the customer’s own application expertise, we are able to attain savings that are not possible with conventional supplier/client relationships.
MANY OF THESE ISSUES are discussed in this issue of In Detail. Read and enjoy!
Juhani HupliVice President, Ship Power Technology,Wärtsilä Ship Power. Contributing Editor for this issue of In Detail.
Ancillary services . . . . . . . . . . . . . . . . . . . . . . . 04
Wind fi rming in the USA . . . . . . . . . . . . . . . . . 08
Grid dynamics . . . . . . . . . . . . . . . . . . . . . . . . . . 13
Increasing gas engine output . . . . . . . . . . . . 17
An optimal power generation mix . . . . . . . . . 21
Researching alternative fuels . . . . . . . . . . . . 25
Off shore wind farm installations . . . . . . . . . . 28
A new concept for tugs . . . . . . . . . . . . . . . . . . 33
Effi cient FPSO solutions . . . . . . . . . . . . . . . . . 40
The Wärtsilä 20DF engine . . . . . . . . . . . . . . . 45
Propulsion for small vessels . . . . . . . . . . . . . 49
The Wärtsilä LNGPac . . . . . . . . . . . . . . . . . . . . 52
The dynamic maintenance plan . . . . . . . . . . 57
Upgrading of integrated automation . . . . . . 61
Boiler services . . . . . . . . . . . . . . . . . . . . . . . . . . 64
Publisher: Wärtsilä Corporation, John Stenbergin ranta 2, P.O. Box 196, FIN-00531 Helsinki, Finland | Editor-in-Chief: Mikael Simelius | Managing Editor and Editorial Offi ce: Maria Nystrand | English editing: Tom Crockford, Crockford Communications | Editorial team: Stephane Debiastre, Marit Holmlund-Sund, Tom Kreutzman, Virva Äimälä Layout and production: Yhtyneet Kuvalehdet Oy, Kynämies, Helsinki, Finland Printed: April 2010 by PunaMusta, Joensuu, Finland ISSN 1797-0032 | Copyright © 2010 Wärtsilä Corporation | Paper: cover Lumiart Silk 250 g/m² inside pages Berga Classic 115 g/m²
ENERGY
MARINE
Contents
In 2009, Wärtsilä Power Plants openeda specialized laboratoryfor studying the use of vegetable oils, animal fats, and emulsions as fuel sources.(more on page 25)
WÄRTSILÄ TECHNICAL JOURNAL | WWW.WARTSILA.COM
in detail 3
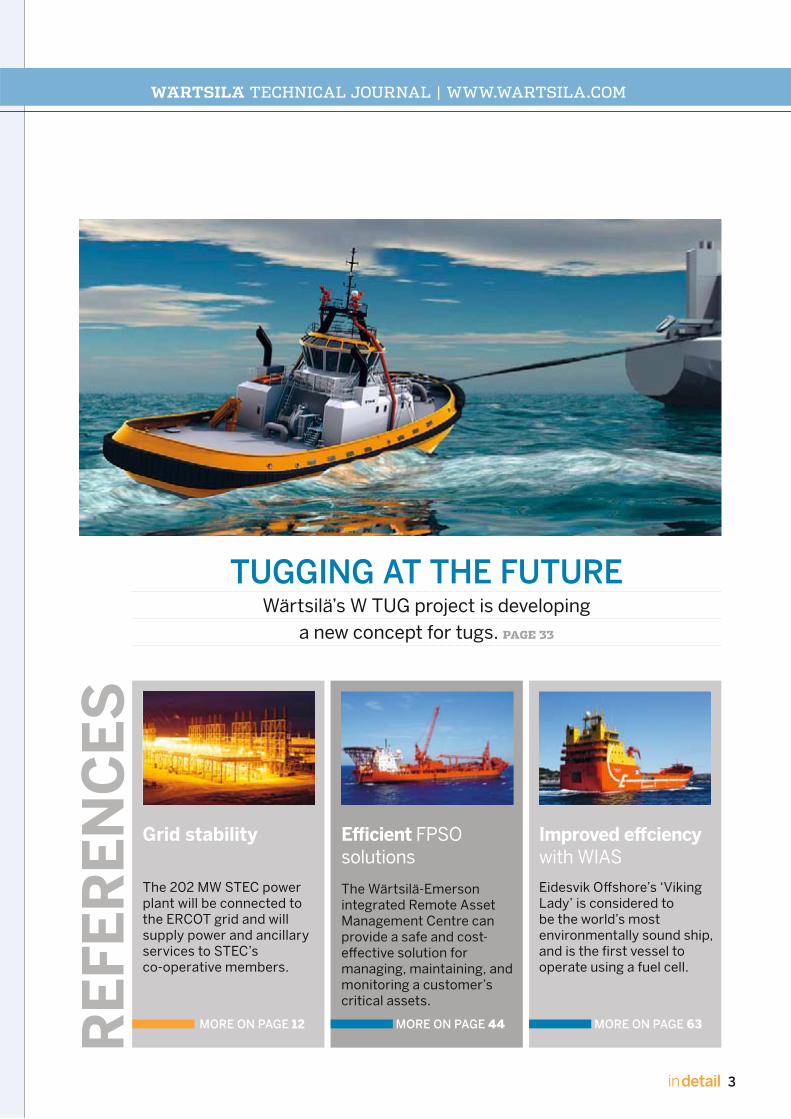
TUGGING AT THE FUTUREWärtsilä’s W TUG project is developing
a new concept for tugs. PAGE 33
Grid stability
The 202 MW STEC power plant will be connected to the ERCOT grid and will supply power and ancillary services to STEC’s co-operative members.
Improved effciency with WIAS
Eidesvik Offshore’s ‘Viking Lady’ is considered to be the world’s most environmentally sound ship, and is the first vessel to operate using a fuel cell.
Efficient FPSO solutions
The Wärtsilä-Emerson integrated Remote Asset Management Centre can provide a safe and cost-effective solution for managing, maintaining, and monitoring a customer’s critical assets.
MORE ON PAGE 12 MORE ON PAGE 44 MORE ON PAGE 63RE
FER
EN
CE
S
4 in detail
[ ENERGY / IN DETAIL ]
[ EN
ER
GY
/ I
N D
ET
AIL
]
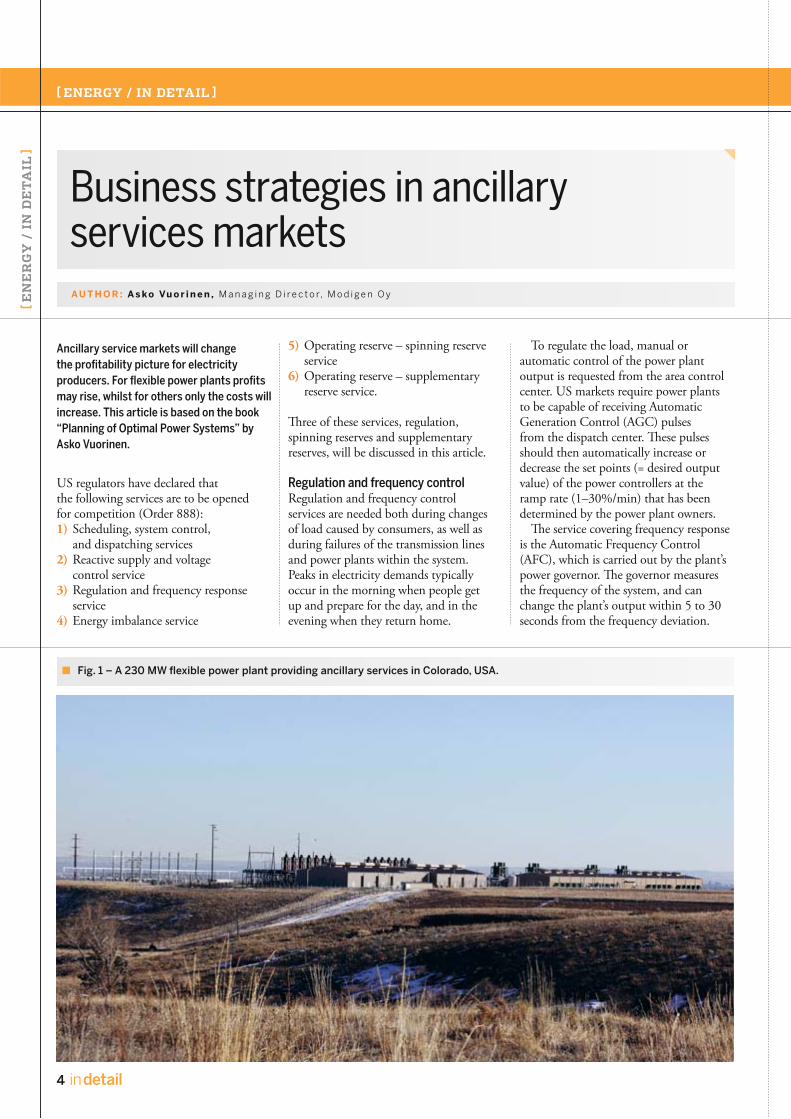
Fig. 1 – A 230 MW flexible power plant providing ancillary services in Colorado, USA.
Business strategies in ancillary services marketsAU T H O R : A s ko Vu o r i n e n , M a n a g i n g D i r e c t o r, M o d i g e n O y
Ancillary service markets will change the profitability picture for electricity producers. For flexible power plants profits may rise, whilst for others only the costs will increase. This article is based on the book “Planning of Optimal Power Systems” by Asko Vuorinen.
US regulators have declared that the following services are to be opened for competition (Order 888):1) Scheduling, system control, and dispatching services2) Reactive supply and voltage control service 3) Regulation and frequency response service4) Energy imbalance service
5) Operating reserve – spinning reserve service6) Operating reserve – supplementary reserve service.
Three of these services, regulation, spinning reserves and supplementary reserves, will be discussed in this article.
Regulation and frequency controlRegulation and frequency control services are needed both during changes of load caused by consumers, as well as during failures of the transmission lines and power plants within the system. Peaks in electricity demands typically occur in the morning when people get up and prepare for the day, and in the evening when they return home.
To regulate the load, manual or automatic control of the power plant output is requested from the area control center. US markets require power plants to be capable of receiving Automatic Generation Control (AGC) pulses from the dispatch center. These pulses should then automatically increase or decrease the set points (= desired output value) of the power controllers at the ramp rate (1–30%/min) that has been determined by the power plant owners.
The service covering frequency response is the Automatic Frequency Control (AFC), which is carried out by the plant’s power governor. The governor measures the frequency of the system, and can change the plant’s output within 5 to 30 seconds from the frequency deviation.
WÄRTSILÄ TECHNICAL JOURNAL 01.2010
5in detail
(US
D/M
W/h
)
1999 2000 2001 2002 2003 2004 2005 2006 2007 2008 average
90
80
70
60
50
40
30
20
10
0
Reg. up
Reg. down
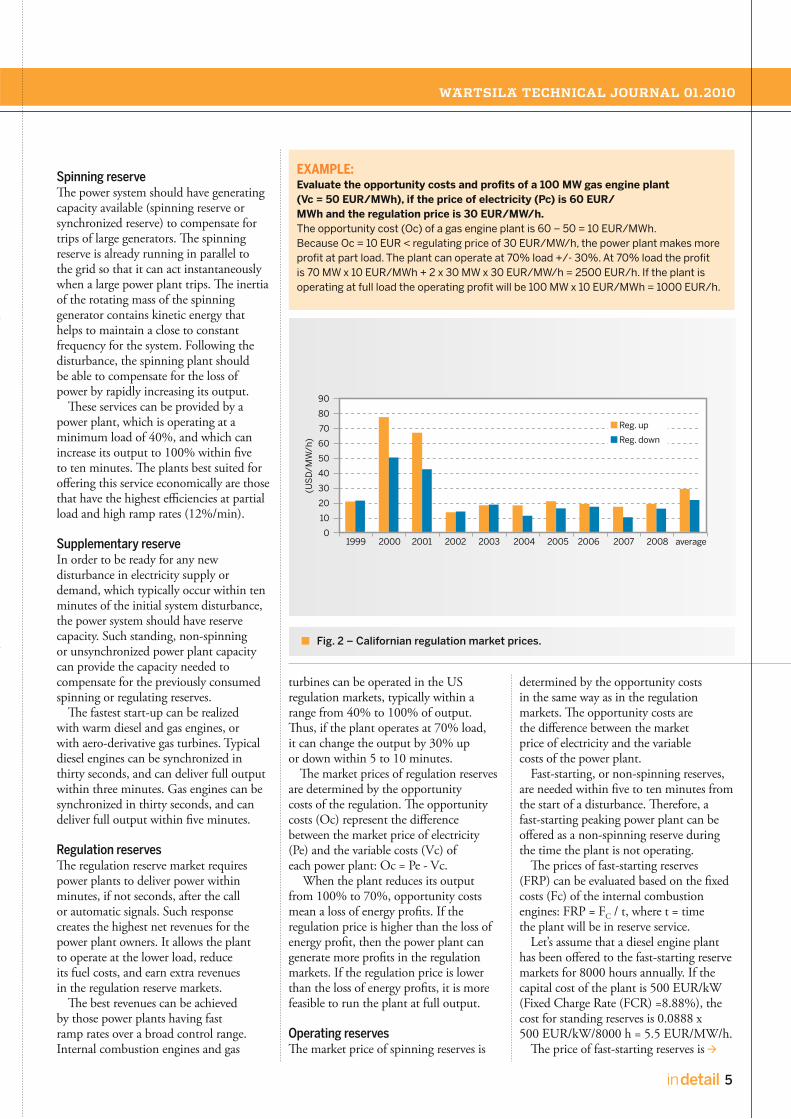
turbines can be operated in the US regulation markets, typically within a range from 40% to 100% of output. Thus, if the plant operates at 70% load, it can change the output by 30% up or down within 5 to 10 minutes.
The market prices of regulation reserves are determined by the opportunity costs of the regulation. The opportunity costs (Oc) represent the difference between the market price of electricity (Pe) and the variable costs (Vc) of each power plant: Oc = Pe - Vc.
When the plant reduces its output from 100% to 70%, opportunity costs mean a loss of energy profits. If the regulation price is higher than the loss of energy profit, then the power plant can generate more profits in the regulation markets. If the regulation price is lower than the loss of energy profits, it is more feasible to run the plant at full output.
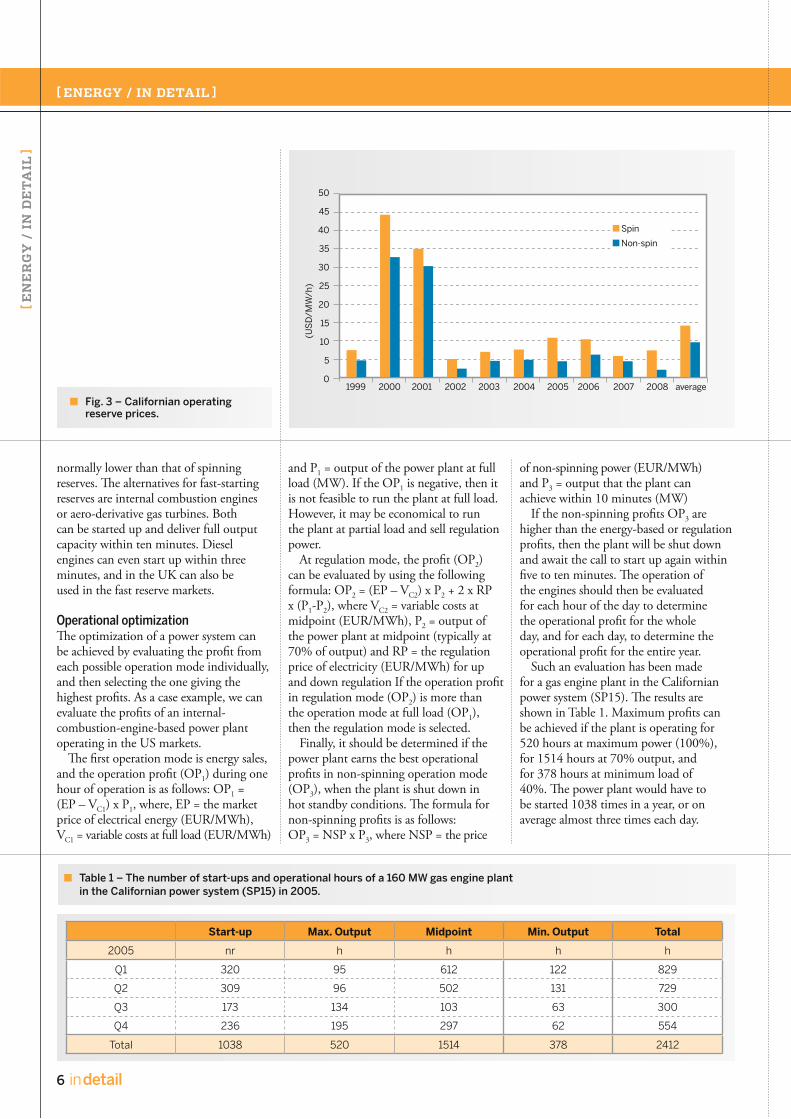
Operating reserves The market price of spinning reserves is
Spinning reserve The power system should have generating capacity available (spinning reserve or synchronized reserve) to compensate for trips of large generators. The spinning reserve is already running in parallel to the grid so that it can act instantaneously when a large power plant trips. The inertia of the rotating mass of the spinning generator contains kinetic energy that helps to maintain a close to constant frequency for the system. Following the disturbance, the spinning plant should be able to compensate for the loss of power by rapidly increasing its output.
These services can be provided by a power plant, which is operating at a minimum load of 40%, and which can increase its output to 100% within five to ten minutes. The plants best suited for offering this service economically are those that have the highest efficiencies at partial load and high ramp rates (12%/min).
Supplementary reserve In order to be ready for any new disturbance in electricity supply or demand, which typically occur within ten minutes of the initial system disturbance, the power system should have reserve capacity. Such standing, non-spinning or unsynchronized power plant capacity can provide the capacity needed to compensate for the previously consumed spinning or regulating reserves.
The fastest start-up can be realized with warm diesel and gas engines, or with aero-derivative gas turbines. Typical diesel engines can be synchronized in thirty seconds, and can deliver full output within three minutes. Gas engines can be synchronized in thirty seconds, and can deliver full output within five minutes.
Regulation reserves The regulation reserve market requires power plants to deliver power within minutes, if not seconds, after the call or automatic signals. Such response creates the highest net revenues for the power plant owners. It allows the plant to operate at the lower load, reduce its fuel costs, and earn extra revenues in the regulation reserve markets.
The best revenues can be achieved by those power plants having fast ramp rates over a broad control range. Internal combustion engines and gas
EXAMPLE: Evaluate the opportunity costs and profits of a 100 MW gas engine plant (Vc = 50 EUR/MWh), if the price of electricity (Pc) is 60 EUR/MWh and the regulation price is 30 EUR/MW/h.The opportunity cost (Oc) of a gas engine plant is 60 – 50 = 10 EUR/MWh. Because Oc = 10 EUR < regulating price of 30 EUR/MW/h, the power plant makes more profit at part load. The plant can operate at 70% load +/- 30%. At 70% load the profit is 70 MW x 10 EUR/MWh + 2 x 30 MW x 30 EUR/MW/h = 2500 EUR/h. If the plant is operating at full load the operating profit will be 100 MW x 10 EUR/MWh = 1000 EUR/h.
determined by the opportunity costs in the same way as in the regulation markets. The opportunity costs are the difference between the market price of electricity and the variable costs of the power plant.
Fast-starting, or non-spinning reserves, are needed within five to ten minutes from the start of a disturbance. Therefore, a fast-starting peaking power plant can be offered as a non-spinning reserve during the time the plant is not operating.
The prices of fast-starting reserves (FRP) can be evaluated based on the fixed costs (Fc) of the internal combustion engines: FRP = FC / t, where t = time the plant will be in reserve service.
Let’s assume that a diesel engine plant has been offered to the fast-starting reserve markets for 8000 hours annually. If the capital cost of the plant is 500 EUR/kW (Fixed Charge Rate (FCR) =8.88%), the cost for standing reserves is 0.0888 x 500 EUR/kW/8000 h = 5.5 EUR/MW/h.
The price of fast-starting reserves is
Fig. 2 – Californian regulation market prices.
6 in detail
[ ENERGY / IN DETAIL ]
[ EN
ER
GY
/ I
N D
ET
AIL
]
Table 1 – The number of start-ups and operational hours of a 160 MW gas engine plant in the Californian power system (SP15) in 2005.
Fig. 3 – Californian operating reserve prices.
(US
D/M
W/h
)
1999 2000 2001 2002 2003 2004 2005 2006 2007 2008 average
50
45
40
35
30
25
20
15
10
5
0
Spin
Non-spin
normally lower than that of spinning reserves. The alternatives for fast-starting reserves are internal combustion engines or aero-derivative gas turbines. Both can be started up and deliver full output capacity within ten minutes. Diesel engines can even start up within three minutes, and in the UK can also be used in the fast reserve markets.
Operational optimization The optimization of a power system can be achieved by evaluating the profit from each possible operation mode individually, and then selecting the one giving the highest profits. As a case example, we can evaluate the profits of an internal- combustion-engine-based power plant operating in the US markets.
The first operation mode is energy sales, and the operation profit (OP1) during one hour of operation is as follows: OP1 = (EP – VC1) x P1, where, EP = the market price of electrical energy (EUR/MWh), VC1 = variable costs at full load (EUR/MWh)
and P1 = output of the power plant at full load (MW). If the OP1 is negative, then it is not feasible to run the plant at full load. However, it may be economical to run the plant at partial load and sell regulation power.
At regulation mode, the profit (OP2) can be evaluated by using the following formula: OP2 = (EP – VC2) x P2 + 2 x RP x (P1-P2), where VC2 = variable costs at midpoint (EUR/MWh), P2 = output of the power plant at midpoint (typically at 70% of output) and RP = the regulation price of electricity (EUR/MWh) for up and down regulation If the operation profit in regulation mode (OP2) is more than the operation mode at full load (OP1), then the regulation mode is selected.
Finally, it should be determined if the power plant earns the best operational profits in non-spinning operation mode (OP3), when the plant is shut down in hot standby conditions. The formula for non-spinning profits is as follows: OP3 = NSP x P3, where NSP = the price
of non-spinning power (EUR/MWh) and P3 = output that the plant can achieve within 10 minutes (MW)
If the non-spinning profits OP3 are higher than the energy-based or regulation profits, then the plant will be shut down and await the call to start up again within five to ten minutes. The operation of the engines should then be evaluated for each hour of the day to determine the operational profit for the whole day, and for each day, to determine the operational profit for the entire year.
Such an evaluation has been made for a gas engine plant in the Californian power system (SP15). The results are shown in Table 1. Maximum profits can be achieved if the plant is operating for 520 hours at maximum power (100%), for 1514 hours at 70% output, and for 378 hours at minimum load of 40%. The power plant would have to be started 1038 times in a year, or on average almost three times each day.
Start-up Max. Output Midpoint Min. Output Total
2005 nr h h h h
Q1 320 95 612 122 829
Q2 309 96 502 131 729
Q3 173 134 103 63 300
Q4 236 195 297 62 554
Total 1038 520 1514 378 2412

WÄRTSILÄ TECHNICAL JOURNAL 01.2010
7in detail
Table 2 – The internal rates of return of different power plants in the ancillary markets.
Profitability evaluation The basic idea of any profitability evaluation is to determine whether a power plant investment is generating enough revenue to cover the investment and fuel costs, and its operation and maintenance costs. The main criteria of such profitability are the internal rates of return (IRR).
The profitability of alternative power plants has been evaluated by using a cash flow analysis, whereby the electricity prices correspond to the variable costs of a coal plant in baseload, a gas engine plant in intermediate load, and a diesel engine plant in peak load. The profitability of the examined power plants, in terms of energy, regulation, spinning, and non-spinning service, has been summarized in Table 2.
In baseload service, combined heat and power (CHP), nuclear and onshore wind
power plants are the most profitable investments. They will give the required internal rate of return of 8%. Coal plants and gas turbine combined cycle plants will become competitive if they can sell regulation services.
In peak and intermediate load service, the most profitable investments are gas and diesel engine plants and aero-derivative gas turbine plants, all of which will generate both regulation and non-spinning reserves. Without ancillary services, all peaking plants yield a negative internal rate of return.
The most profitable plants are combined heat and power plants in energy and non-spinning service (IRR=15.7%). Thus, priority should be given to evaluating their feasibility. Nuclear plants in energy service give the second highest profits (IRR=11.2%), but if they have to buy the
ancillary services, the internal rate of return drops to 8.6%. Gas fired peaking plants in energy and non-spinning service can give the next highest profits (IRR=10.3%).
CONCLUSIONThe new ancillary service markets will have a profound impact on the profitability of power plants. Flexible power plants will be able to increase their internal rate of return by five to ten %-points by selling ancillary services, and the need for ancillary services will only increase in the future because of nuclear and wind power investments. Therefore, the influence of ancillary services should be evaluated in any new capacity planning study.
The book is available at www.optimalpowersystems.com
Type Output (MW) Energy
Energy and
regulation
Energy and
non-spin
Energy+spinning+non-spin
Energy+ regulation+
non-spinNon-spin
Base load plants
Nuclear plant 1500 11.2% - 8.6% - -
Onshore wind power 150 8.8% - 7.5%
Offshore wind power 150 6.9% - 5.8%
Coal fired plants
Coal plant (SC) 500 5.6% 8.3% - - -
Coal plant (USC) 500 7.4% -
Coal plant (CCS) 330 6.5%
Combined cycle plants
DFCC plant 170 1.6% 6.4% - 7.9%
GTCC plant 330 0.7% 2.4% - - -
GTCC plant 500 4.5% 5.3% - - -
Combined heat and power
Gas engine plant 160 11.2% 12.4% 15.7%
Peaking plants
Gas engine plant 160 0.9% 3.9% 10.3% 8.9%
Gas turbine plant 160 0.0% 0.0% 5.1%
Oil-fired peaking plants
Diesel engine plant 160 0.0% 0.0% 4.6% 6.9% 5.1%
Gas turbine plant 160 0.0% 0.0% 0.0% 0.0% 3.3% 4.0%

8 in detail
[ ENERGY / IN DETAIL ]
[ EN
ER
GY
/ I
N D
ET
AIL
]
The Wind Enabler AU T H O R : M i k a e l B a c k m a n , D i r e c t o r, M a r k e t D e v e l o p m e n t , Po w e r P l a n t s , W ä r t s i l ä i n N o r t h A m e r i c a
Balancing power in a grid that has significant variable generation, such as wind or solar, is a challenge for any utility. Some utilities in the USA are finding the efficient and flexible quick start capacity of gas engines to be a good solution.
System balancingUtilities, system operators, and regulators are increasingly faced with the challenge of incorporating large amounts of generation with variable output into regional grids. It is a challenge that is particularly significant in the USA, which installed almost 10,000 MW of wind power generators in 2009 alone. This challenge is not unique, system operators have always had to deal with load variability, but wind generation does add to the aggregate variability.
By nature, load and wind variability are uncorrelated and statistically independent so the addition in aggregate variability is not linear. However, in some areas operators have experienced difficult situations where load may be ramping up, while the wind is ramping down.
While discussions regarding the cost of this wind power integration are still ongoing, it is clear that a number of key measures have to be considered in order to successfully and reliably plan, operate, and balance a system with large amounts of variable generation. This article discusses some major aspects that play a role in the integration issues.
Geographical diversityA geographically and electrically large
balancing area for electricity supply and demand, or co-operation between smaller balancing areas, has several benefits such as:1) The correlation in output variations between multiple wind plants diminishes if they are further apart (geographical diversity).2) A large balancing area will also have more flexible generation installed.3) Since the incremental variability is non-linear, this will result in a lower ratio of reserve capacity required.
Thus, the relative variability in generator output is reduced when the operating area is increased. Several studies have illustrated the benefits of increasing balancing area sizes (Ernst 1999, EWITS 2009, Ahlstrom 2008, Milligan & Kirby 2007, Holttinen
löytyisikö aloitukseen joku yleiskuva? - piristäisi juttua...
WÄRTSILÄ TECHNICAL JOURNAL 01.2010
9in detail
2007). Holttinen, for example, notes that the total reserve requirements in the Nordic countries would double if they operated as separate markets, rather than the combined Nordpool market. Strong connections and good co-ordination between markets can be as effective as a large single balancing area. Denmark, for instance, has strong connections to both the Nordic systems and the German system. Consequently, they can balance wind variability and accommodate high levels of renewable generation. Conversely Ireland, or the ERCOT market in Texas are both electrical islands with weak interconnections, and have to contain enough balancing resources internally. Though there are clear benefits to enlarging the balancing area, this alone cannot provide a single solution. A combination of targeted measures, including a fleet of flexible generation sources, is needed to fully accommodate large amounts of variable generation.
Transmission expansionThe best locations for wind and solar plants are typically not where the majority of the load is, but rather in remote areas with limited transmission resources. In the USA, a number of studies has been conducted on expanding the main transmission lines, and transmission upgrades have already been carried out in western Texas and other areas to mitigate this problem.
Historically, building major transmission lines in the USA has been very difficult, costly, and time consuming, and the regulatory framework regarding cost allocation, especially on interstate lines is still under discussion.
In addition to these difficulties, transmission lines have substantial losses and variable generation will only utilize a small part of the total transmission capacity. This will increase the cost of each kWh delivered over the system. Locating flexible generation plants along these transmission lines could help the line utilization issue, as these plants would be dispatched when the wind or solar plant is not producing. This positioning of flexible generation is new, since many of these plants have typically been located within the load pockets, downstream of the major transmission lines. Their modularity and environmental aspects allowed them to generate power closer to the load, without the need for additional transmission investment or losses.
Variable generation forecastsAs with wind variability, errors in wind forecasts add to system load forecast errors, in the same uncorrelated, non-linear way as output variability. This ultimately increases the flexibility needed within the balancing area. Much work is being done on wind forecasting, both on long-term forecasting to predict the average
output over the year, season or lifetime of the assets, and for short-term forecasting. The short-term forecasts would be used by utilities or balancing areas to forecast the next few hours or days, and continued improvement in these models is expected to provide increasingly accurate forecasts.
Market structuresEnergy market structures and generation scheduling/dispatch are some of the most important means of using the inherent flexibility of existing and future power systems. Sub-hourly energy markets (5 min, 10 min or 15 min clearing) can provide economic incentives for flexible generation to respond to load and wind fluctuations, and also provide future incentives for markets with insufficient flexible generation installed. When this flexible generation is restricted to hourly movements by scheduling rules, it not only results in lost opportunities for the generators, but increases overall generation costs and has a negative effect on system reliability.
Large wind events are relatively slow compared to the instantaneous failure of a large generator or transmission line. The “firming” needs of wind, i.e. counteracting the output change of the wind generation with dispatchable generation, can be met with the capabilities of sub-hourly energy markets and non-spinning reserve. Still, some Balancing Authorities (BA) use
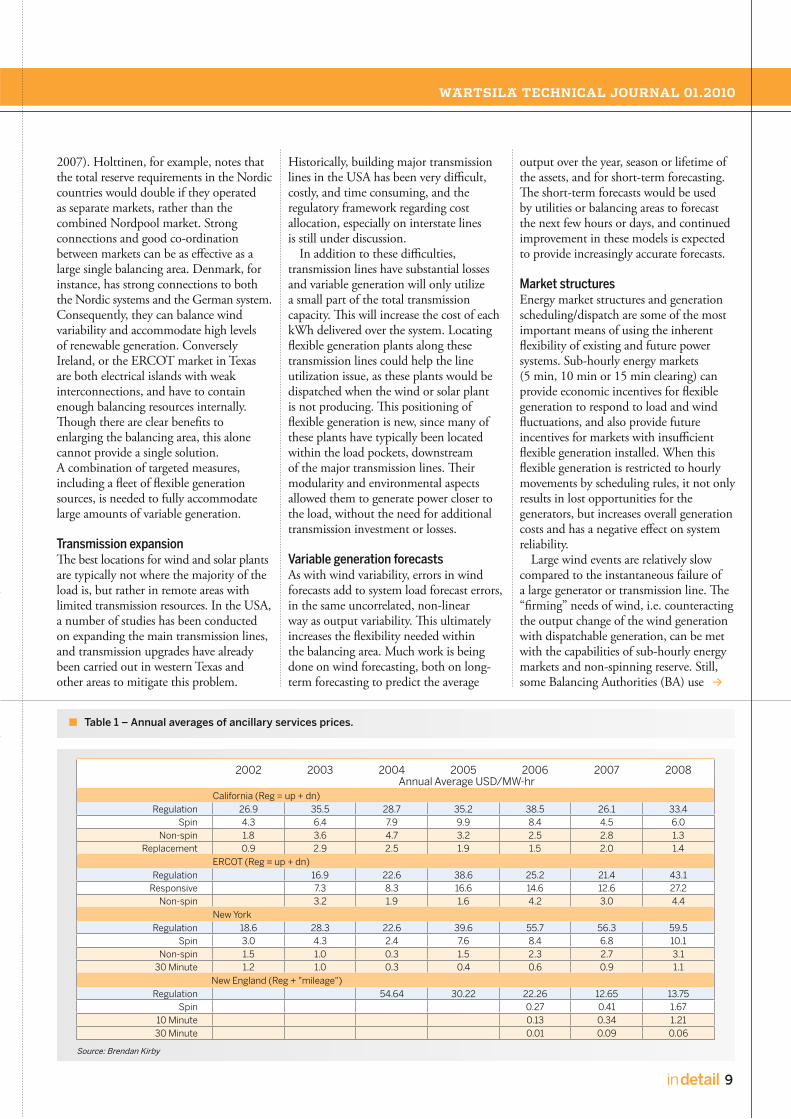
Table 1 – Annual averages of ancillary services prices.
2002 2003 2004 2005 2006 2007 2008 Annual Average USD/MW-hr California (Reg = up + dn)
Regulation 26.9 35.5 28.7 35.2 38.5 26.1 33.4Spin 4.3 6.4 7.9 9.9 8.4 4.5 6.0
Non-spin 1.8 3.6 4.7 3.2 2.5 2.8 1.3Replacement 0.9 2.9 2.5 1.9 1.5 2.0 1.4
ERCOT (Reg = up + dn)Regulation 16.9 22.6 38.6 25.2 21.4 43.1
Responsive 7.3 8.3 16.6 14.6 12.6 27.2Non-spin 3.2 1.9 1.6 4.2 3.0 4.4
New YorkRegulation 18.6 28.3 22.6 39.6 55.7 56.3 59.5
Spin 3.0 4.3 2.4 7.6 8.4 6.8 10.1Non-spin 1.5 1.0 0.3 1.5 2.3 2.7 3.1
30 Minute 1.2 1.0 0.3 0.4 0.6 0.9 1.1 New England (Reg + "mileage")
Regulation 54.64 30.22 22.26 12.65 13.75Spin 0.27 0.41 1.67
10 Minute 0.13 0.34 1.2130 Minute 0.01 0.09 0.06
Source: Brendan Kirby

10 in detail
[ ENERGY / IN DETAIL ]
[ EN
ER
GY
/ I
N D
ET
AIL
]
regulation for firming wind output, even though it is several times more expensive than the other ancillary service (A/S) products (see Table 1). Allowing non-spinning reserve and supplemental operating reserves to firm wind, in combination with a short-term energy market, will decrease wind integration costs dramatically.
In the USA, about half of the load is served through deregulated markets operated by Independent System Operators (ISO’s) or Regional Transmission Organizations (RTO’s). Many of these markets operate short-term energy scheduling in the 5 to 15 min interval range. Energy markets that are not deregulated or organized through an exchange still serve a large geographical part of the country. These are generally bilateral markets or markets without an exchange where power can be bought and sold and generally consist of smaller balancing areas. Wind integration studies typically show lower integration costs for ISO or RTO markets than non-ISO/RTO markets (see Table 2).
Markets with frequently clearing intervals can reduce both costs and the amount of regulation needed, since a more frequent redispatch will enable these regulating units to return to their preferred operating point faster, and optimize the system more frequently. These markets will generally have a lower cost of integrating variable resources, and greater overall
system efficiency. Forecasts improve as you move closer to
real time, and because of improved wind output forecasts, markets utilizing sub-hourly clearing markets also enable a better utilization of the renewable generation installed. They provide conventional generation with greater ability to adjust to changing wind conditions at the optimal system cost and efficiency. Sub-hourly clearing markets have the least total forecast errors, and can avoid situations where the entire market price is “lifted” due to the response required by reserve capacity or expensive regulation services.
Certain generator characteristics are very valuable in firming variable generation, such as quick start, fast ramping, high part- and full load efficiency. Currently there are very few US energy market incentives that reward a generator for having high ramp rate capabilities, or for having a faster start than that required by ancillary service markets for providing non-spinning reserve (currently 10 minutes). There is room for much improvement in future markets, both for cost optimization and efficiency gains, by recognizing the attributes and offering incentives for the use of new, modern generation fleets combined with sub-hourly clearing markets.
Flexible generation Having a deep pool of flexible, quick, and efficient resources that can respond to both load variations and wind variations reduces
the cost of system balancing, and helps increase system reliability. It also makes life a lot easier for the system operator who must continuously balance a system within certain parameters, like an ACE, Area Control Error, that measures the flow in and out of a balancing area over its interchanges to other areas. The ramping capability of this generation will be even more valuable in the future, as transmission construction may not keep up with increases in variable generation. The amount of flexible resources required will depend partly on the magnitude of the ramps resulting from the net load, which considers both the variation of load and wind output, and also on the balancing areas’ ability to forecast the ramps. Flexible generation with high efficiency, low minimum load, quick start, and good ramping capabilities will be an important factor in accommodating large amounts of variable generation.
Future changes Numerous industry working groups, task forces, and regulatory bodies across the USA are currently studying different aspects of integrating large amounts of variable resources, and Wärtsilä is participating in several of these groups. This integration will not only affect the issues discussed above, but also change the way long-term system planning is conducted. Historically, system planning has not considered the same level of quick
Table 2 – Wind integration costs study results.
Date Study ISO/RTOWind capacity
penetrationIntegration cost: USD/MWh
of wind outputEnergy Market
interval
3/05 NYISO ISO/RTO 10% Very low 5 minute
12/06 Minnesota/MISO ISO/RTO 31% USD 4.41 5 minute
2/07 GE/Pier/CAIAP(a) ISO/RTO 33% USD 0– USD 0.69 10 minute
3/07 Avista No 30% USD 8.84 1 hour
3/07 Idaho Power (b) No 30% USD 7.92 1 hour
(a) Includes two-thirds wind and one-third solar and includes cost increases of regulation and load following assigned to regulation.(b) Reduced from USD 16.16 in September, 2007, settlement proceedings.
Source: Brendan Kirby

WÄRTSILÄ TECHNICAL JOURNAL 01.2010
11in detail
start, fast ramping resources as may be needed in the future. Power system variability was addressed in resource planning studies by identifying an economic resource mix to meet a time varying load profile, and reserve and transmission planning by identifying a single loss of source requirements. Higher levels of variable generation will change future planning studies by integrating more variability or ramping requirements within the local area.
Gas engine benefits The natural gas fuelled, lean-burn, medium-speed engine has high reliability, high efficiency, and low emissions, and power plants based on these engines have been optimized for absolute maximum flexibility. Gas engines are much more efficient running at part load than large combustion turbines, and have superior full load efficiency. A plant with multiple Wärtsilä gas engines enables plant owners to operate at a very low minimum plant output, with all of the generator sets in operation, to economically provide spinning reserve and energy. Wärtsilä spark ignited gas engines have an outstanding simple-cycle efficiency, and a gas engine plant will typically have a plant net heat rate of 8600 to 8700 Btu/kWh, HHV (depending on the specific engine choice), and will stay below 10,000 Btu/kWh, HHV even at half load. With a gas turbine, the heat rate increases dramatically at partial load.
Through optimization for absolute flexibility, these plants have no derating at up to very high elevations or extremely warm ambient temperatures. This means there is full performance when really needed on a hot summer day. This is achieved using air-cooled radiators that consume virtually no water.
The engines can provide rapid response to system frequency variations. When required, the gas engine technology can supply grid voltage support through the
generation of reactive power, and these plants also offer black start capability, all at a very competitive capital cost.
In the USA, such gas engine plants usually run in either of two modes; in spinning reserve mode, all the engines will be turned down, ready for ramping up as needed. In efficiency mode, only as many engines as needed to deliver the required power output will be dispatched at full load. This allows optimum plant efficiency to be maintained at any plant output, see Figure 1.
Most of these plants are set to achieve full output in less than 10 minutes from start order, and typically start producing power after about 2 minutes. Wärtsilä is now also offering start sequences that allow full synchronization from start order in 30 seconds, and full plant output in 5 minutes. These starts cause no additional wear on the engines, so there is no starting cost, no limitation on the number of starts per day, nor any minimum or maximum run times or down times.
To conclude, this is a growing market and we at Wärtsilä see a distinct role and market need, now and in the future, for flexible power generation.
Fig. 1 – Efficiency mode vs spinning reserve mode for a 100 MW plant.
Power plants based on Wärtsilä gas engines have been optimized for maximum flexibility.
11,500
11,000
10,500
10,000
9500
9000
8500
Plant output (net) kW
0 20,000 40,000 60,000 80,000 100,000
Hea
t ra
te (
Btu
/kW
h H
HV
net
to
grid
)
50%
60%70%
80% 90%
12 in detail
[ ENERGY / IN DETAIL ]
[ EN
ER
GY
/ I
N D
ET
AIL
]
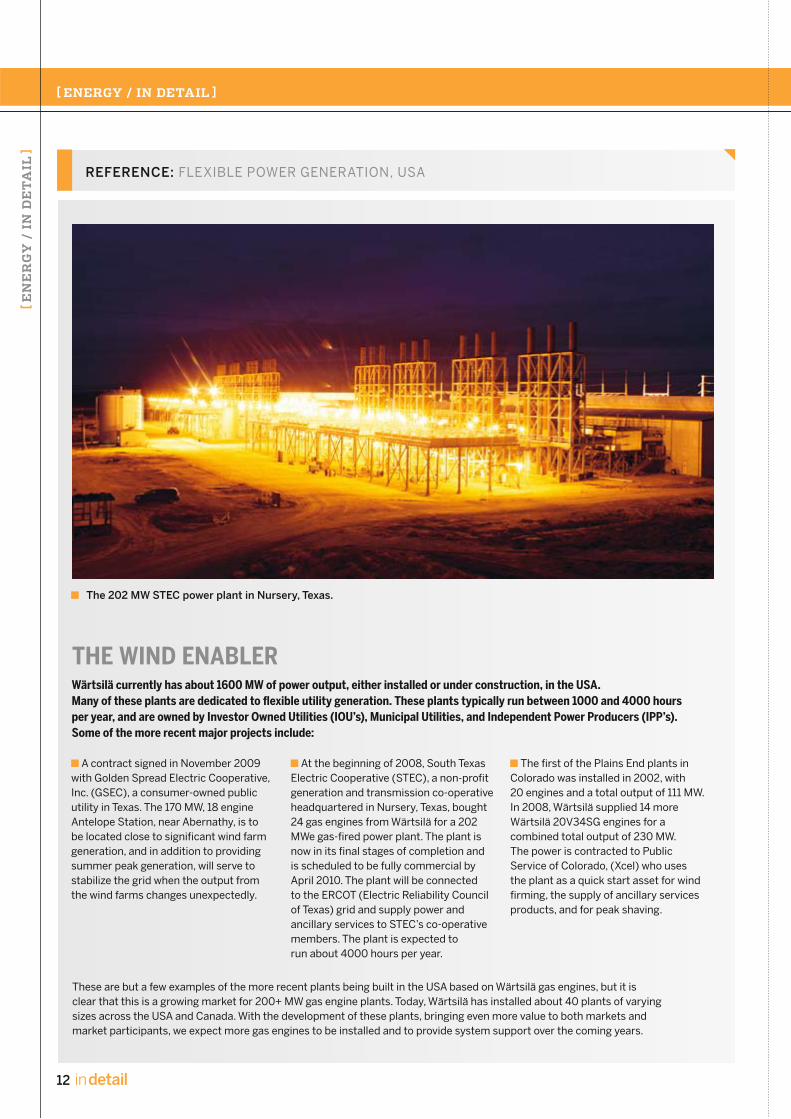
The 202 MW STEC power plant in Nursery, Texas.
REFERENCE: FLEXIBLE POWER GENERATION, USA
THE WIND ENABLERWärtsilä currently has about 1600 MW of power output, either installed or under construction, in the USA. Many of these plants are dedicated to flexible utility generation. These plants typically run between 1000 and 4000 hours per year, and are owned by Investor Owned Utilities (IOU’s), Municipal Utilities, and Independent Power Producers (IPP’s). Some of the more recent major projects include:
A contract signed in November 2009 with Golden Spread Electric Cooperative, Inc. (GSEC), a consumer-owned public utility in Texas. The 170 MW, 18 engine Antelope Station, near Abernathy, is to be located close to significant wind farm generation, and in addition to providing summer peak generation, will serve to stabilize the grid when the output from the wind farms changes unexpectedly.
At the beginning of 2008, South Texas Electric Cooperative (STEC), a non-profit generation and transmission co-operative headquartered in Nursery, Texas, bought 24 gas engines from Wärtsilä for a 202 MWe gas-fired power plant. The plant is now in its final stages of completion and is scheduled to be fully commercial by April 2010. The plant will be connected to the ERCOT (Electric Reliability Council of Texas) grid and supply power and ancillary services to STEC’s co-operative members. The plant is expected to run about 4000 hours per year.
The first of the Plains End plants in Colorado was installed in 2002, with 20 engines and a total output of 111 MW. In 2008, Wärtsilä supplied 14 more Wärtsilä 20V34SG engines for a combined total output of 230 MW. The power is contracted to Public Service of Colorado, (Xcel) who uses the plant as a quick start asset for wind firming, the supply of ancillary services products, and for peak shaving.
These are but a few examples of the more recent plants being built in the USA based on Wärtsilä gas engines, but it is clear that this is a growing market for 200+ MW gas engine plants. Today, Wärtsilä has installed about 40 plants of varying sizes across the USA and Canada. With the development of these plants, bringing even more value to both markets and market participants, we expect more gas engines to be installed and to provide system support over the coming years.

WÄRTSILÄ TECHNICAL JOURNAL 01.2010
13in detail
Fig. 1 – Fortunately most faults in the electrical transmission system are intermittent in nature and involve only one or two phases and ground. Three phase permanent faults are very rare.
Dynamics of the low voltage ride through capabilities of generatorsAUTHOR: Mats Östman, Senior Development Manager, Power Plants Technology, Wärts i lä Power Plants
The ability to support the grid during deep voltage transients caused by network disturbances depends on both the technical features and load of the connected generator, and the dynamic characteristics of the grid. This article looks at the issues involved.
Reciprocating engine sets with synchronous generators are well suited to the modern electrical grid, especially with the increasing penetration of renewable and distributed generation. Reciprocating engine based generation offers a number of inherent features, namely fast start-up and rapid loading times, an unlimited number of starts without service penalties,
and great load following capabilities. These features, combined with a very high electrical efficiency in excess of 44% in electricity generation only or over 85% in CHP applications, make them very well suited to support, dynamically and economically, electrical grids. This type of generation is excellent in balancing natural fluctuations in the network from other

14 in detail
[ ENERGY / IN DETAIL ]
[ EN
ER
GY
/ I
N D
ET
AIL
]
distributed generation like wind and solar. The rapid and efficient addition of generation capacity is also beneficial to cover peak or intermediate loading, hourly, daily or seasonally.
Reciprocating engine based distributed generation can also provide a needed relief to congested transmission and distribution systems. By efficiently producing power close to where it is consumed, the need for costly infrastructure investments will be reduced.
Network disturbances Until recently, network operators in many countries mandated that local generation be quickly disconnected from the network in case of severe network disturbances. However, market deregulation and the increased penetration of distributed generation have spurred this practice to be changed.
To help prevent a potentially larger system impact, distributed generator units are now mostly required to stay connected in case of severe disturbances, in order to support the electrical network during and after a disturbance. As such, this change of practice can be seen as a natural result of the evolution of the modern electrical grid.
Faults and disturbances to the electrical transmission and distribution system can never be completely avoided. Short circuits and earth faults will occur regardless of the efforts of system operators. Therefore,
for a short time prior to the fault being cleared, it may have a severe local impact on the voltage.
The new requirement to stay connected in case of a severe disturbance is typically issued via a simplified form of time-voltage fault ride through (FRT) curves. At the common point of coupling, generators must tolerate a fault voltage above the FRT curve, without losing synchronism.
Today, there are substantial differences in the requirements depending on issuing Transmission System Operators (TSO). Differences can be found even between TSOs that are synchronically connected, as is the case in central Europe.
The ability of the generating set (genset) to remain in synchronism during and after a close in short circuit is attributable to the genset’s construction and control, and the condition of the grid to where it is connected and the specific rules for the interconnection.
System factors Generally speaking, the factors affecting fault ride through that can be said to be attributable to the electrical system and interconnection rules are as follows:
■ Defined shape of the voltage dip ■ Defined absolute level of the voltage dip ■ Defined fault type, (1 phase, 2 phase, 3 phase)
■ Defined fault clearance time ■ Defined fault location
■ Grid strength (short circuit power) ■ Grid architecture (meshed or radial) ■ Active and reactive power conditions prior to the fault
■ Active and reactive power requirements after fault clearance
■ Load characteristics. Generator factors The factors affecting fault ride through that can be said to be attributable to the generating unit are, in general, as follows:
■ Rotating inertia ■ Generator reactance ■ Excitation system design and AVR (autonomic voltage regulator) control
■ Engine response and control.
Transient stabilityThe electrical system can be said to be stable when the synchronous machines connected to it operate in synchronism and in parallel with each other, and there is a balance between the demand and production of both active (P) and reactive (Q) power.
So what then is transient stability? One good definition is that it is the ability of a power system to maintain synchronism when subjected to a severe disturbance in the grid.
The disturbance can be in the form of sudden load changes, faults within the transmission and distribution system, as well as loss of generation, and so forth.
To be able to understand the challenges posed by the different network conditions to the transient stability of generators, a basic understanding of the stability problem is needed.
It is not, however, the intention of this article to go into the complex theory behind the calculations. Rather, the aim is to illustrate by simulation the basic mechanism of a fault ride through incident.
Fig. 2 – Examples of fault ride through requirements.
1
0.9
0.8
0.7
0.6
0.5
0.4
0.3
0.2
0.1
Volt
age
(p.u
)
0 s 0.25 s 0.5 s 0.75 s 1 s 1.25 s 1.5 s 1.75 s 2 s
Fault clearance time (s)
BDEW (Germany) Fingrid (Nordel) France > 225 kV (meshed network) ONS (Brazil)

WÄRTSILÄ TECHNICAL JOURNAL 01.2010
15in detail
Fig. 3 – A generating set’s simulated response to a 3-phase 150 ms short circuit at the high side of the step up transformer.
As an example, in a transient simulation, an 11 MVA genset with a typical inertia constant H = 1.15 s is subjected to a 150 msshort circuit at the grid side of a generatorstep up transformer.
Considering Figure 3, we can assume the generator is initially operating synchronously at an initial generator load angle ( o). Th e load angle is the angleby which the internal voltage (E) of thegenerator leads the grid referencevoltage (V ).
At a constant mechanical input power (Pm) equal to the electrical output power (Pe), acceleration power (Pa) is zero (Pm=Pe) according to Equation [1], and the speed of the generator is equal to the synchronous speed ( s ) of the system.
Swing Equation [1]:
If a 3-phase bolted fault occurs at t=60 s, the voltage at this point will go to zero and thus no electrical power can be transferred to the receiving network, as can be seen from Equation [2] (Pe=0) and the input power (Pm) has not changed.
Th e diff erence in power (Pm - Pe) will lead to an angular acceleration of the rotor with respect to the synchronous reference speed, according to the basic dynamic rule of Equation [1], which states that the accelerating power (Pa) is equal to the moment of inertia of the rotor multiplied by its angular acceleration.
Equation [2]:
Th is is the electrical power transfer equation in transient where Xd’ is the reactance between the generator internal voltage (E) and grid voltage (V).
Th e acceleration of the rotor will advance the rotor (load) angle ( ) furtherwith respect to ( s) until the fault is cleared.When the fault is cleared (t=60.15 s) the electrical power (Pe) will abruptly increase to a value corresponding to the angleat clearing ( cl).
Th e electrical power (Pe) now exceeds the mechanical power (Pm), and the accelerating power (Pa) is negative causing the rotor to decelerate. Th is cannothappen instantaneously and thus the rotorangle will continue to advance to the maximum angle ( s) where the speed willbe synchronous.
Th e accelerating power is still
negative, as (Pe > Pm), and the rotor angle will retard towards the initial load point. However, since the accelerating power is negative it will continue to a point where the speed will again be synchronous, but as re-acceleration occurs, it is now (Pm > Pe).
1
0.5
0
1.1
1
100
50
0
-50
3210-1
Grid voltage [p.u] Green line and Generator voltage [p.u] Blue lineTime [s]
Generating set speed [p.u]Time [s]
Rotor angle deviation [electrical deg.]Time [s]
Active power [p.u] Blue line and Reactive power [p.u] Green lineTime [s]
60 60.5 61 61.5 62 62.5
60 60.5 61 61.5 62 62.5
60 60.5 61 61.5 62 62.5
60 60.5 61 61.5 62 62.5
1 2 3 4
16 in detail
[ ENERGY / IN DETAIL ]
[ EN
ER
GY
/ I
N D
ET
AIL
]
If the system was uncontrolled, and without damping and loss, the rotor would continue to swing indefinitely.
However, in a stable real system and as seen here, the swings will dampen out after a time due to system losses, damping, and engine/generator control actions.
CONCLUSION We can see from the above simulations that a reciprocating engine driven generating set does not easily loose synchronism, even when subjected to such a severe and rare disturbance as a close in 3-phase short circuit, in the high voltage system.
Grid short circuit support is given during the fault and reactive power is exported within a few-hundred milliseconds following a fault clearance. Similarly, the genset will assume its normal operation parameters, exporting active and reactive power at its pre-fault operation point, within a very short time following clearance of the fault.
However, in any system rare combinations of circumstances that may produce instability can always be found. If these occur simultaneously, it might create a situation causing the generating set to lose synchronism, and thus it is important that the conditions required for FRT are reasonable, and well defined.
Looking at the various factors influencing fault ride through capabilities, one can say that due to the short fault times, the
typically prescribed fault clearance times in high voltage networks are 100-150 ms.
The response of the generating set controls will have limited effect. This is due to the inherent time constants in the generator excitation, the generator field and engine controls, and the fuel supply, which may range from a few tens of milliseconds to several seconds.
Thus for the first hundred milliseconds or so, the generating set response is mainly governed by physical factors, like inertia and generator reactance.
The vast majority of the factors are, however, directly introduced by the condition of the electrical system, before, during and after the fault. These conditions are bound to be time and location specific for any given operational state of the system or fictive in the form of a prescribed fault ride through curve.
Unreasonable requirements in such terms as voltage being depressed for a prolonged time after fault clearing, or overly long fault clearance times, in combination with abnormal operation conditions such as operation on overload or under excitation, might lead to FRT conditions that may not be met by commercially viable equipment.
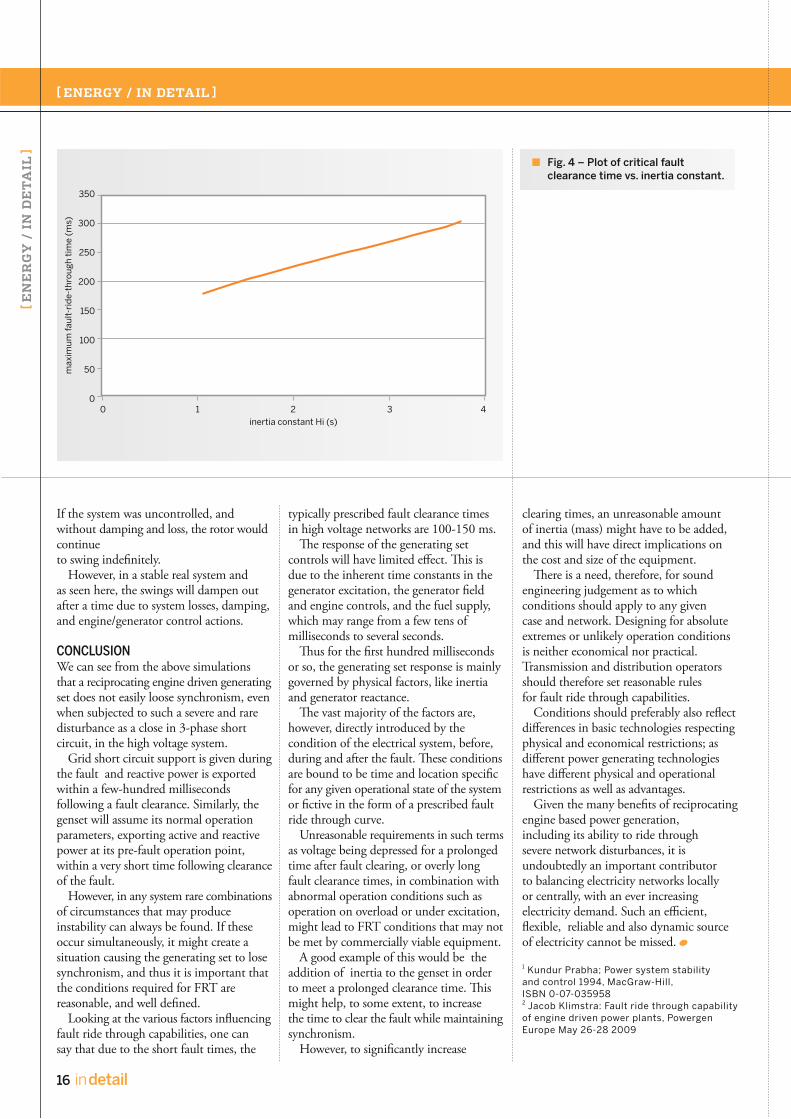
A good example of this would be the addition of inertia to the genset in order to meet a prolonged clearance time. This might help, to some extent, to increase the time to clear the fault while maintaining synchronism.
However, to significantly increase
clearing times, an unreasonable amount of inertia (mass) might have to be added, and this will have direct implications on the cost and size of the equipment.
There is a need, therefore, for sound engineering judgement as to which conditions should apply to any given case and network. Designing for absolute extremes or unlikely operation conditions is neither economical nor practical. Transmission and distribution operators should therefore set reasonable rules for fault ride through capabilities.
Conditions should preferably also reflect differences in basic technologies respecting physical and economical restrictions; as different power generating technologies have different physical and operational restrictions as well as advantages.
Given the many benefits of reciprocating engine based power generation, including its ability to ride through severe network disturbances, it is undoubtedly an important contributor to balancing electricity networks locally or centrally, with an ever increasing electricity demand. Such an efficient, flexible, reliable and also dynamic source of electricity cannot be missed.
1 Kundur Prabha; Power system stability and control 1994, MacGraw-Hill, ISBN 0-07-035958 2 Jacob Klimstra: Fault ride through capability of engine driven power plants, Powergen Europe May 26-28 2009
Fig. 4 – Plot of critical fault clearance time vs. inertia constant.
350
300
250
200
150
100
50
0
max
imum
faul
t-ri
de-t
hrou
gh t
ime
(ms)
inertia constant Hi (s)0 1 2 3 4
WÄRTSILÄ TECHNICAL JOURNAL 01.2010
17in detail
The Wärtsilä 34SG gas engine’s output increased to 10 MW
AU T H O R S : M i k a e l W i d e s ko g , G e n e r a l M a n a g e r G a s P l a n t s , Po w e r P l a n t Te c h n o l o g y, W ä r t s i l ä Po w e r P l a n t s a n d U l f Å s t ra n d , P r o d u c t M a n a g e r, W ä r t s i l ä I n d u s t r i a l O p e r a t i o n s .
By applying the latest type of pressure sensor and a more powerful engine control system the cylinder output of Wärtsilä 34SG engines has been increased from 450 kW to 500 kW. This 11% increase in power makes this gas engine even more competitive, especially in grid stability applications.
For the past ten years, the spark-ignited Wärtsilä 34SG gas engine has been one of Wärtsilä’s best selling engines for stationary applications. The engine is popular for numerous uses, including flexible baseload, grid stability, wind power back-up, combined heat and power, as well as compressor and pump drives.
The Wärtsilä 20V34SG, initially introduced as a 400 kW/cylinder engine,
was later upgraded to a capacity of 450 kW/ cylinder for the 50 Hz version. This increased the output of the 20-cylinder version of the Wärtsilä 34SG engine from 8 MW to 9 MW.
The engine has now been optimized to deliver 500 kW/cylinder from the same engine block, thus providing an even more competitive solution for power plants using this engine. This increases the engine shaft

18 in detail
[ ENERGY / IN DETAIL ]
[ EN
ER
GY
/ I
N D
ET
AIL
]
power output of the 20V version from 9 MW to 10 MW, which means an 11% increase in power output.
The same relative increase in power capacity is also available for the 9-cylinder in-line (9L) and 16-cylinder V-configuration (16V) versions.
Cylinder pressure measurementIncreased demand on gas engine performance, in terms of fuel consumption, emissions and service durations, can be met with more efficient combustion control and real-time onboard diagnostics. Therefore, closed loop engine control based on cylinder-pressure measurement has, for many years, been the subject of research.
Cylinder-pressure measurement is an excellent tool for combustion control as it gives direct insight into the combustion process. Real-time information about the progress of the combustion process, or heat-release process, in the cylinders offers the possibility for optimum control of the fuel supply and ignition timing. This technological advance is the major factor contributing to the increased cylinder output.
During each intake stroke, a mixture of fuel gas and air naturally enters the cylinder. With insufficient fuel gas in the mixture misfiring occurs, which leads to poor
efficiency and instabilities in engine output. If the mixture is too rich in fuel, or if the fuel quality is poor, knocking combustion will occur, ultimately leading to engine damage. Fuel-rich mixtures also cause NOX emissions.
In the past, the cylinder process was monitored and controlled by a combination of different sensors measuring indirect parameters. For example, knocking was detected with accelerometers measuring the vibration on each cylinder head, while misfiring was measured with exhaust-gas- temperature sensors. Engine control based on secondary data, such as knock-induced vibrations, suffers from delays and can create confusion about the underlying cause. Conversely, control based on instantaneous cylinder pressure measurement uses primary data, which enables accurate optimization of the cylinder process between knocking and misfiring.
In the updated engine, each cylinder is equipped with a newly developed pressure sensor. Consequently, there is no longer a need to wait until knocking or misfiring occurs before adjustments can be made. Therefore, the cylinders can be individually set to run at their optimum point to achieve the highest engine power and efficiency. This also applies if operating conditions are changing, as in the case of varying methane
numbers and ambient temperatures. Additionally, this means that the engine can be run with increased safety and reliability, also with the higher power output per cylinder.
Cylinder pressure measurements provide significantly improved engine control. They can be used, for example, for:
■ Ignition timing control ■ Cylinder balancing ■ Knock and pre-ignition detection ■ Misfire detection ■ Air-fuel ratio control ■ Engine load (derating) control ■ Fault detection diagnostics ■ Engine condition diagnostics.
New pressure sensorsFrom the signal emitted by the pressure sensors, one can instantaneously determine the rate of heat release, the magnitude and location of peak pressures and the knock severity. The sensors can also be used to determine the indicated mean effective pressure, which is essentially a measure of the power developed in each cylinder.
Historically, pressure sensors for use inside engine cylinders were expensive and had a relatively short lifespan. They were, therefore, primarily used for laboratory tests. Because of the huge advantages of instantaneous cylinder pressure
Table 1 – The increased output of the Wärtsilä 34SG engine.
Wärtsilä 34SG C2
50 Hz/750 rpm 9L34SG 16V34SG 20V34SG
Power, electrical kW 4378 7784 9730
Heat rate kJ/kWh 7843 7819 7779
Electrical efficiency % 45.9 46.0 46.3
60 Hz/720 rpm 9L34SG 16V34SG 20V34SG
Power, electrical kW 4203 7473 9341
Heat rate kJ/kWh 7843 7819 7779
Electrical efficiency % 45.9 46.0 46.3
WÄRTSILÄ TECHNICAL JOURNAL 01.2010
19in detail
measurement, in 1998 Wärtsilä began to co-operate on validating sensors that were both cost eff ective, and suffi ciently robust for permanent use in engine cylinders.
Th e sensor has been designed to withstand high cylinder temperatures and pressures – up to 300 °C and 300 bar.Th e maintenance interval of the new sensor now equals that for the cylinder head overhaul, i.e. around 16,000 hours.
Th e location of the pressure sensor is alsoimportant. It is possible to have pressure sensors mounted in the indicator bore of the cylinder head. Th is has been done inthe past but it is not ideal, especially in medium and high-speed gas engines. A channel between the sensor and thecylinder wall results in acoustic oscillations, which cause measurement errors. Moreover, such a channel can give rise toirregular combustion because of local hotspots. In the new arrangement, the measuring membrane of each sensor isfl ush-mounted in the combustion chamber,to ensure measurement of correct andreliable data.
Powerful control systemWithout an accurate cylinder control system, there needs to be a large operating window between the knocking and misfi relimits. Better control of the cylinders allows
the engine to be tuned to run closer to these limits. Th is in turn allows a higher output within an acceptable operating window.
Th e rapid sampling of the cylinder pressure signal requires a substantial amount of computer processing power tohandle high data fl ow. Th e engines now usethe latest Wärtsilä UNIC C3 engine controlsystem to provide the necessary processingcapacity to handle all the data. Th e UNIC C3control system uses the data to calculate the correct setpoints of each cylinder. Th ese calculations have to be performed instantly so that the correct gas amount can be injected from cycle to cycle.
Th e Wärtsilä UNIC C3 is an embedded type of automation system designed for engine applications. It handles all tasks related to start/stop management, engine safety, fuel management and speed/load control, and the system utilizes modern bus technologies for reliable transmission of sensor signals and control signals.
More specifi cally, the system is designed to handle the following major tasks and functions:
■ Electronic fuel injection control with dynamic parameterization
■ Ignition timing ■ Engine safety (alarms, shutdowns, emergency stops, load reductions) including fully hardwired safety
for engine over-speed (redundant), lube oil pressure, cooling water temperature and external shutdowns
■ Monitoring of all relevant engineparameters
■ Electronic speed/load control with various operation modes and limiters
■ Providing a local interface for the operator, including a local display indicating all important engine measurements
■ Providing hardwired signals for interfacing plant automation systems/equipment
■ Engine start/stop management, including start block handling
■ Various control functions, such as slow turning, load reduction, waste-gate, LT/HT-thermostat control, etc.
■ Providing integrated system diagnostics and automatic test modes.
New turbochargersTh e increased engine power output naturally requires a higher charge airpressure. Th is means that the engines need new turbochargers that can cope with the higher pressure ratio, especially at highaltitude and high ambient temperatures.
Th e benefi t of the new turbochargers, is that engines with this higher power will still be capable of running at altitudes of
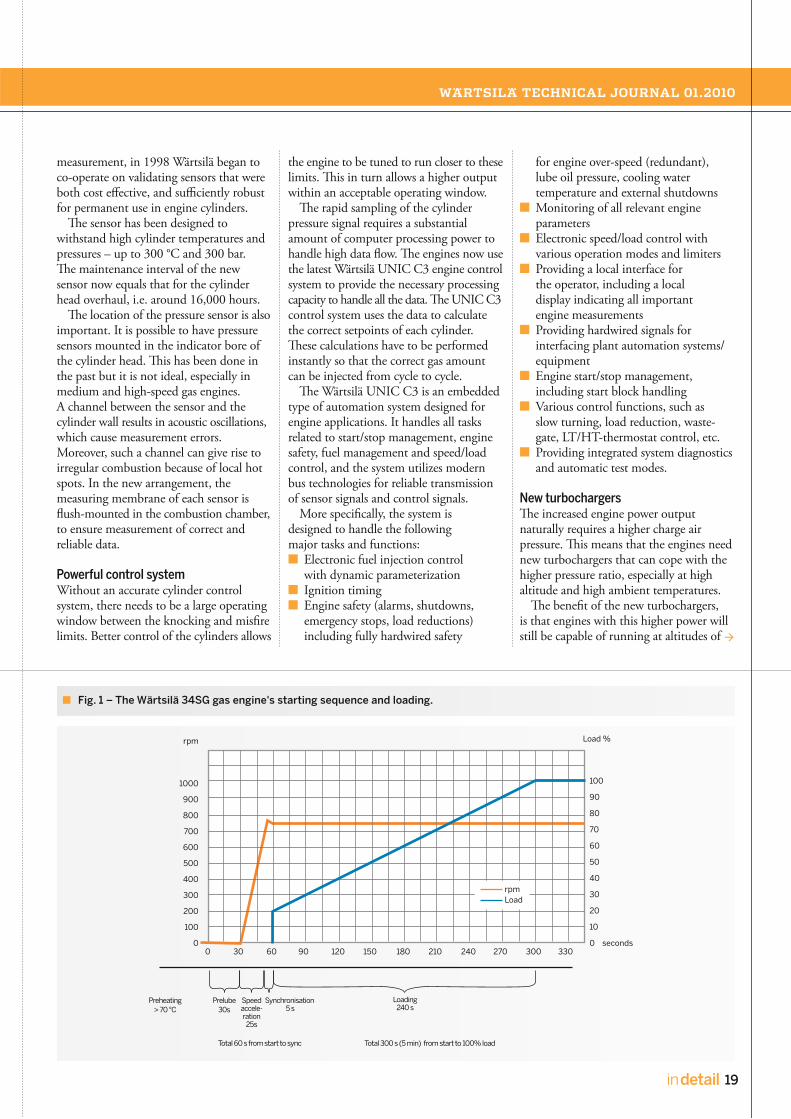
Fig. 1 – The Wärtsilä 34SG gas engine's starting sequence and loading.
1000
900
800
700
600
500
400
300
200
100
0
rpm
100
90
80
70
60
50
40
30
20
10
0 seconds
Load %
0 30 60 90 120 150 180 210 240 270 300 330
Loading240 s
Prelube30s
Total 60 s from start to sync Total 300 s (5 min) from start to 100% load
Preheating> 70 °C
Speedaccele-ration25s
Synchronisation 5 s
rpm Load
20 in detail
[ ENERGY / IN DETAIL ]
[ EN
ER
GY
/ I
N D
ET
AIL
]
50,0
45,0
40,0
35,0
30,0
25,0
20,0
15,0
10,0
5,0
0,0
0 10 20 30 40 50 60 70 80 90
Combined generator power (MW)
10 x Wärtsilä 20V34SG
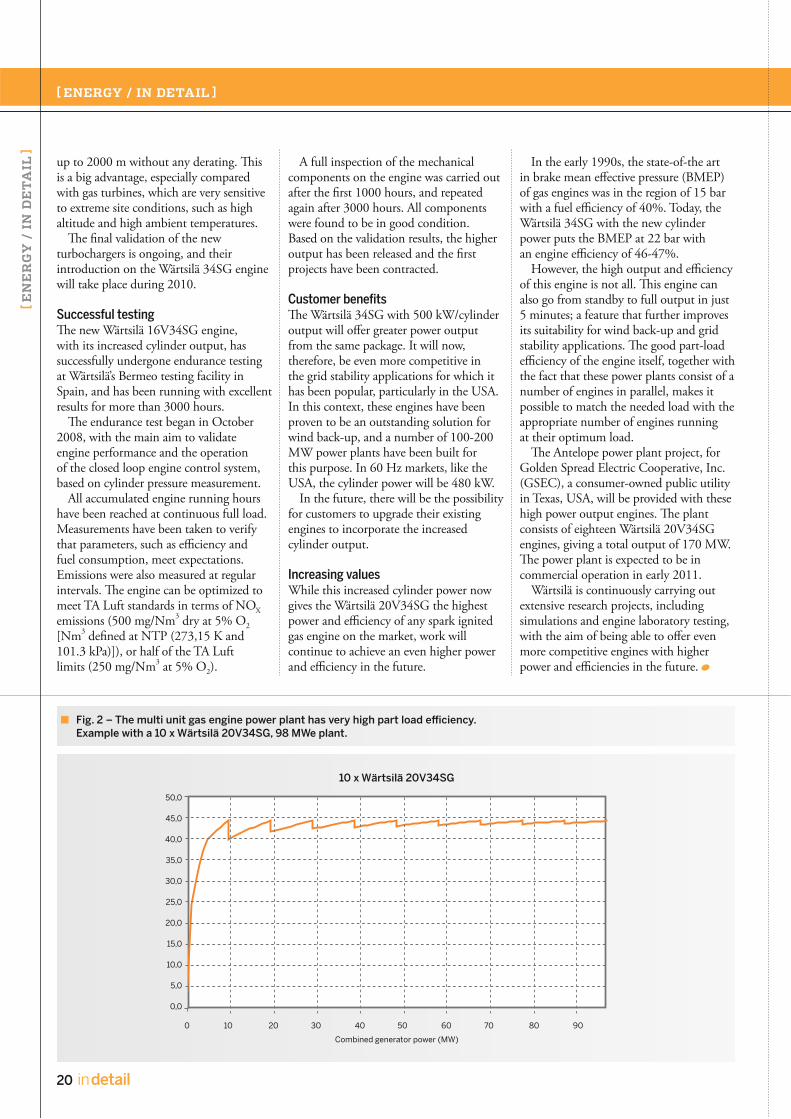
Fig. 2 – The multi unit gas engine power plant has very high part load efficiency. Example with a 10 x Wärtsilä 20V34SG, 98 MWe plant.
A full inspection of the mechanical components on the engine was carried out after the first 1000 hours, and repeated again after 3000 hours. All components were found to be in good condition. Based on the validation results, the higher output has been released and the first projects have been contracted.
Customer benefitsThe Wärtsilä 34SG with 500 kW/cylinder output will offer greater power output from the same package. It will now, therefore, be even more competitive in the grid stability applications for which it has been popular, particularly in the USA. In this context, these engines have been proven to be an outstanding solution for wind back-up, and a number of 100-200 MW power plants have been built for this purpose. In 60 Hz markets, like the USA, the cylinder power will be 480 kW.
In the future, there will be the possibility for customers to upgrade their existing engines to incorporate the increased cylinder output.
Increasing valuesWhile this increased cylinder power now gives the Wärtsilä 20V34SG the highest power and efficiency of any spark ignited gas engine on the market, work will continue to achieve an even higher power and efficiency in the future.
In the early 1990s, the state-of-the art in brake mean effective pressure (BMEP) of gas engines was in the region of 15 bar with a fuel efficiency of 40%. Today, the Wärtsilä 34SG with the new cylinder power puts the BMEP at 22 bar with an engine efficiency of 46-47%.
However, the high output and efficiency of this engine is not all. This engine can also go from standby to full output in just 5 minutes; a feature that further improves its suitability for wind back-up and grid stability applications. The good part-load efficiency of the engine itself, together with the fact that these power plants consist of a number of engines in parallel, makes it possible to match the needed load with the appropriate number of engines running at their optimum load.
The Antelope power plant project, for Golden Spread Electric Cooperative, Inc. (GSEC), a consumer-owned public utility in Texas, USA, will be provided with these high power output engines. The plant consists of eighteen Wärtsilä 20V34SG engines, giving a total output of 170 MW. The power plant is expected to be in commercial operation in early 2011.
Wärtsilä is continuously carrying out extensive research projects, including simulations and engine laboratory testing, with the aim of being able to offer even more competitive engines with higher power and efficiencies in the future.
up to 2000 m without any derating. This is a big advantage, especially compared with gas turbines, which are very sensitive to extreme site conditions, such as high altitude and high ambient temperatures.
The final validation of the new turbochargers is ongoing, and their introduction on the Wärtsilä 34SG engine will take place during 2010.
Successful testingThe new Wärtsilä 16V34SG engine, with its increased cylinder output, has successfully undergone endurance testing at Wärtsilä’s Bermeo testing facility in Spain, and has been running with excellent results for more than 3000 hours.
The endurance test began in October 2008, with the main aim to validate engine performance and the operation of the closed loop engine control system, based on cylinder pressure measurement.
All accumulated engine running hours have been reached at continuous full load. Measurements have been taken to verify that parameters, such as efficiency and fuel consumption, meet expectations. Emissions were also measured at regular intervals. The engine can be optimized to meet TA Luft standards in terms of NOXemissions (500 mg/Nm3 dry at 5% O2 [Nm3 defined at NTP (273,15 K and 101.3 kPa)]), or half of the TA Luft limits (250 mg/Nm3 at 5% O2).

WÄRTSILÄ TECHNICAL JOURNAL 01.2010
21in detail
An optimal power generation mix for India
AU T H O R : R a ke s h S a r i n , V i c e P r e s i d e n t , S a l e s , M i d d l e E a s t & A s i a , W ä r t s i l ä Po w e r P l a n t s
While coal plants provide low cost baseload generation, they lack flexibility and cannot economically meet varying load requirements. Wärtsilä has commissioned a study to determine the optimum generation mix for India, where large coal based power plants dominate.
India’s economy is growing rapidly. It recorded a GDP growth of 6.6% in 2008 and of more than 7% in 2009. With GDP growth directly linked to power demand, the country has struggled to satisfy its hunger for new generating capacity. In fact McKinsey, the global management consultancy firm, has cautioned that by 2017 India could be experiencing a national peak power shortage of 70 GW.
The Indian government expects GDP to grow by around 9% per year for the
next 25 years. To meet this target, and at the same time overcome persistent power shortages, the country will have to increase its power generation capacity five- or six-fold, to nearly 800 GW, by 2030.
In addition to the growth in energy needs, the National Action Plan for Climate Change has also envisioned a sizeable reduction in CO2 emission. The challenge, therefore, is to meet the energy demand of a developing nation, while at the same time keeping the carbon footprint
Meeting the energy needs of a rapidly developing nation is increasingly challenging.

22 in detail
[ ENERGY / IN DETAIL ]
[ EN
ER
GY
/ I
N D
ET
AIL
]
as low as possible. While the objective can be partly achieved through demand side management (energy efficiency and conservation), a bigger opportunity to cut emissions exists on the generation side.
A report entitled “Real Cost of Power” published by Wärtsilä in July 2009 brought out the grim reality and extent of power cuts in 21 cities in India, and the cost incurred by the public in coping with the shortage. The installed cost of back-up mechanisms such as inverters, batteries and gensets was estimated at Rs 100,000 Cr (EUR 15.4 billion), while the annual recurring cost on account of maintenance and fuel was calculated as Rs 30,000 Cr (EUR 4.6 billion). The report pointed out that a small ‘reliability surcharge’ on power would fund investments in ‘efficient peaking’ plants and would enable the nation to do away with inefficient back-up mechanisms.
Matching demand dynamicallyThe problem of tackling power shortages, however, cannot be solved by simply numerically matching the aggregate
annual demand with generation capacity. Electricity demand varies widely according to time of day and season, and since electricity cannot be stored, generation must always match demand dynamically.
The majority of the electricity generated in India comes from coal-fired power plants (53%), followed by hydro (24%), gas (11%), renewables (10%) and nuclear (5%). In the current five-year plan (2007-2011), the planned increase in generating capacity is about 79 GW. Of this, nearly 53 GW will come from coal.
While coal plants offer low cost generation, India’s over-reliance on coal has a serious flipside. The technology is only suited to steady, rigid baseload operation. It lacks both the flexibility to respond efficiently to demand variations, and the ability to be started and stopped quickly. The heavy reliance on these large coal plants will also run counter to the country’s National Action Plan for Climate Change.
Maharashtra caseCountries with well-developed electricity markets have realized that over-reliance on
inflexible coal-fired, baseload generation can lead to a collapse of the system. An electricity system should therefore have a mix of baseload generation and peaking plants, with the baseload plants providing ‘bulk power’ at low cost, and the peaking plants flexibly meeting the system’s peaks and load variations.
In a recently commissioned study called ‘Optimal Power Generation Mix for India’, the state of Maharashtra was analysed since it has a high peaking load, a good mix of customers, and a range of issues that are representative of the challenges facing the Indian power sector in general. The results of the Maharashtra study were extrapolated in order to derive a national picture.
The study analyses the period through to the end of 2017. Two scenarios are envisaged: an ‘as is’ scenario where growth in generating capacity is predominantly through the addition of baseload plants, and an alternative scenario based on a mix of baseload generation and high efficiency, high flexibility, distributed power (HEHFDP) peaking plants with their inherent operational flexibility.
Fig. 1 – With high efficiency, high flexibility distributed power. Generation mix for Maharashtra State: 2016–17.
Load (MW)
30,000
25,000
20,000
15,000
10,000
5000
0
0 3000 60001000 4000 70002000 5000 8000 9000
HEHFDP- 3,708 MW at 20% of time
28,348
28,348
10,205
Time (hrs)
CCGT – 1,232 MWRES for peak load – 1,843 MW
Hydro power – 3,000 MW
Coal based plant( 200 to 249 MW) - 423 MW
Coal based plant (250 to 499 MW) - 1,689 MW
Coal based plant (>= 500 MW) - 6,494 MW
Central allocation – 7,687 MW
RES for baseload (soal equivalent of RES in MU) – 2,273 MW
Note: Additional spinning reserve capacity of 1,814 MW comprises 338 MW (250 – 499 MW coal plants) + 1476 MW (200 to 249 MW coal plants. The above graph and further calculations are based on 80% implementation rate for XII plan.
Source: 17th Electric Power Survey of India, 2007 - CEA, UC Analysis.
Assuming a peaking solution for ~20% of the time, a 3,708 MW of peak & intermediate load capacity is replaced by highly efficient and flexible distributed plants (HEHFDP).

WÄRTSILÄ TECHNICAL JOURNAL 01.2010
23in detail
A three-step approach was undertaken in carrying out the study. In the fi rst instance, a demand side analysis was performed, followed secondly by a supply side analysis. Th e third step quantifi es the benefi ts of an optimal generation mix that includes HEHFDP to meet peak demand compared to an ‘as is’ generation mix.
Th e study showed that creating an optimalgeneration mix to meet peak demand vis-à-vis an ‘as is’ generation mix would deliver savings in fi ve key areas: effi ciency, CO2 emissions, land usage, water consumption and capital expenditure.
Benefi ts of HEHFDPTh e main attributes of HEHFDP are its quick start/stop capability, the ability to closely follow rapid variations (increase or decrease) in load, and near constant higheffi ciency with low emissions at all loads. Starting time, and the ability of the generating plant to reach full load within 5 to 10 minutes, off ers utilities much neededcomfort in the planning and dispatch ofcapacity additions in general, and inaugmenting their renewable energy
absorption in particular. Th e close tracking and matching with
supply of load variations enables utilities to maintain their system voltage and frequency with better stability, and to improve their service level obligations. Furthermore, any improvement in effi ciency with a resulting decrease in emissions is welcome, as this will become mandatory in the future. All of these HEHFDP advantages can be seen in generating plants that employ medium-speed, large bore, reciprocating engines.
Assuming that HEHFDP is used as a peaking solution for 20% of the time each day (1752 hrs/year), it will replace 3.7 GW of peak and intermediate load capacity (see Figure 1). Th is results in changing the proportion contributed by other power sources to the intermediate and peak power requirements of the state in the ‘as is’ scenario.
Firstly, the 3.7 GW of HEHFDP capacity replaces an equivalent capacity of coal and gas plants that are relatively ineffi cient, thus making the power systemmore effi cient (see Figure 2).
Secondly, being a highly fl exible solution, HEHFDP serves the top portion of the peak and intermediate demand. Th is results in pushing other solutions, such as combined cycle gas turbines (CCGT), renewable energy sources and large hydropower plants, which wereearlier serving the upper part of the peakand intermediate load, towards the bottom,enabling them to run for longer intervalsand higher average load. Th is also improvesoperational effi ciency.
Th e increase in the power system’s overall effi ciency during intermediate and peak demand, will have a direct impact onreducing carbon emission levels and theconsumption of primary energy. In addition, the reciprocating engine technology of HEHFDP off ers reducedwater consumption and a very low landfootprint, as compared to the baseload coalplants.
Projecting the results from Maharashtra state to the Indian national power system, national savings in 2016-2017 are calculatedusing an extrapolation factor of 7.7. Th is multiplier is calculated by dividing the
Fig. 2 – Share of peak and intermediate power sources in MW and MU under ‘as is’ and ‘with HEHFDP’ generation mixes.
28,348 MW
18,143 MW 18,143 MW
OCGT
CCGTHEHFDP
CCGT 1,232 MW
RES 1,843 MW
Hydro 3,000 MW
1,232 MW
RES 1,843 MW
Hydro 3,000 MW
300 MW
Coal: 500 MW 1,396 MW
Coal: 100–199 MW
Coal: 200–249 MW
Coal: 200–249 MW 423 MW2,111 MW
28,348 MW 27,772 MU 27,772 MU
HEHFDP
CCGT
RES
Hydro
Coal: 200–249 MW
MU28 000
24000
20000
16000
12000
8000
4000
0
‘As is’ generation mix ‘As is’ generation mix
‘With HEHFDP’ generation mix*
‘With HEHFDP’ generation mix*
324 MW
Peak & intermediate generation capacity mix (MW) – 2016-17
Peak & intermediate generation capacity mix (MU) – 2016-17
Coal: 500 MW
Coal: 100–199 MW
3,708 MW
*HEHFDP will run for 20% of the time (1752 Hrs) in a year.Note: Coal Plants 500 MW in the ‘as is’ scenario belong to the capacity additions in the XII fi ve year plan.Source: UC Analysis.
Introduction of HEHFDP as a peaking solution results in reducing the share of relatively infl exible coal plants and ineffi cient gas plants to meet peak & intermediate demand in 2016-17.

24 in detail
[ ENERGY / IN DETAIL ]
[ EN
ER
GY
/ I
N D
ET
AIL
]
unrestricted peak demand (i.e. if there was no load shedding) for India (218,209 MW) by the unrestricted peak demand for Maharashtra (28,348 MW). The idea of extrapolating was to give a feel for the benefits at a country level, which could form the basis of a more rigorous modelling exercise so policymakers can plan the way forward.
With the introduction of HEHFDP solutions, India would be expected to annually reduce CO2 emissions by 113 megatonnes, as well as provide land savings of more than 24,000 acres, primary energy savings of more than 264,000 billion kcal (105 PJ) and water savings of 470 million m3
(see Figure 3). In overall terms, annual potential revenue savings are Rs 13,000 Cr (EUR 2 billion). Moreover, the state can save capital expenditures of Rs 39,000 Cr (EUR 6 billion).
A deployment of the model with about 29 GW of HEHFDP as peaking solutions to meet the peak demand for approximately 20% of the time during the day, has substantial monetary and other benefits, which can continue to accrue year after year.
Wärtsilä’s calculations show that 80% of the cost of the HEHFDP plants (running mostly on natural gas, and in some cases on heavy fuel oil) can be funded by an additional levy of Rs 0.2/kWh (EUR 0.3 cents/kWh) in consumer tariffs – a small price for the comfort of 24/7 power reliability.
There is a strong possibility that the remaining 20% of the cost could be recovered by introducing the HEHFDP solution as a national initiative to reduce greenhouse gas emissions (to the extent of 113 million tons per year). Positioning the initiative as a coherent national programme will place it favourably for carbon crediting
under some of the proposed new financing schemes of the United Nations Framework Convention on Climate Change.
24/7 reliabilityThe study lends further credence to the prediction in a report by McKinsey that, if India continues to add baseload capacity as planned, by 2017 it will be caught in the paradoxical situation that although it would have excess capacity, power shortages would continue during peak hours.
Limiting baseload generation to a defined, optimal level, and then topping up with high efficiency, high flexibility, distributed power plants beyond this point can prevent this situation. Wärtsilä already has the technology, and it can be rapidly deployed. Such a mix would provide much needed flexibility and, as a result, deliver numerous quantifiable benefits.
x
Fig. 3 – Savings ‘with HEHFDP’ generation mix from Maharashtra extrapolated to the whole of India.
Unrestricted demand (MW)
of India – 2016-17 (17th EPS, CEA)(218,209 MW)
Unrestricted demand (MW)
of Maharashtra – 2016-17 (17th EPS, CEA)
(28,348 MW)
Extrapolation factor(7.7)
Savings-Maharashtra (2016–17)
Savings- India
(2016-17)
Efficiency savings
Energy savings
CO2 emission savings
Water savings
Per annum (recurring savings)
Land savings
Capex savings
Transmission capex savings
One time savings
6.9%
264,191 Bn Kcal
113 Mn Tonnes
470 Mn Cu m
24,483 Acres
Equivalent to Rs. 1,529 Cr (MEUR 250) of primary fuel
Equivalent to Rs. 10,812 Cr (MEUR 1760) of certified emission reduction (CER) or 18% of India’s current per annum CO2 emission from power sector
Equivalent to Rs. 710 Cr (MEUR 115) of industrial water or equivalent to annual domestic water consumption by the city of Mumbai
Equivalent to Rs. 6,365 Cr (MEUR 1035) of industrial land or equivalent to a mid-sized town
Rs. 13,051 Cr (MEUR 2120)
Rs. 26,045 Cr (MEUR 4235)
Rs. 12844 Cr (MEUR 2090)
Rs. 38889 Cr (MEUR 6320)
Source: UC Analysis, 17th EPS projections, CEA.
HEHFDP deployed nationally will take India a step closer to becoming "green".
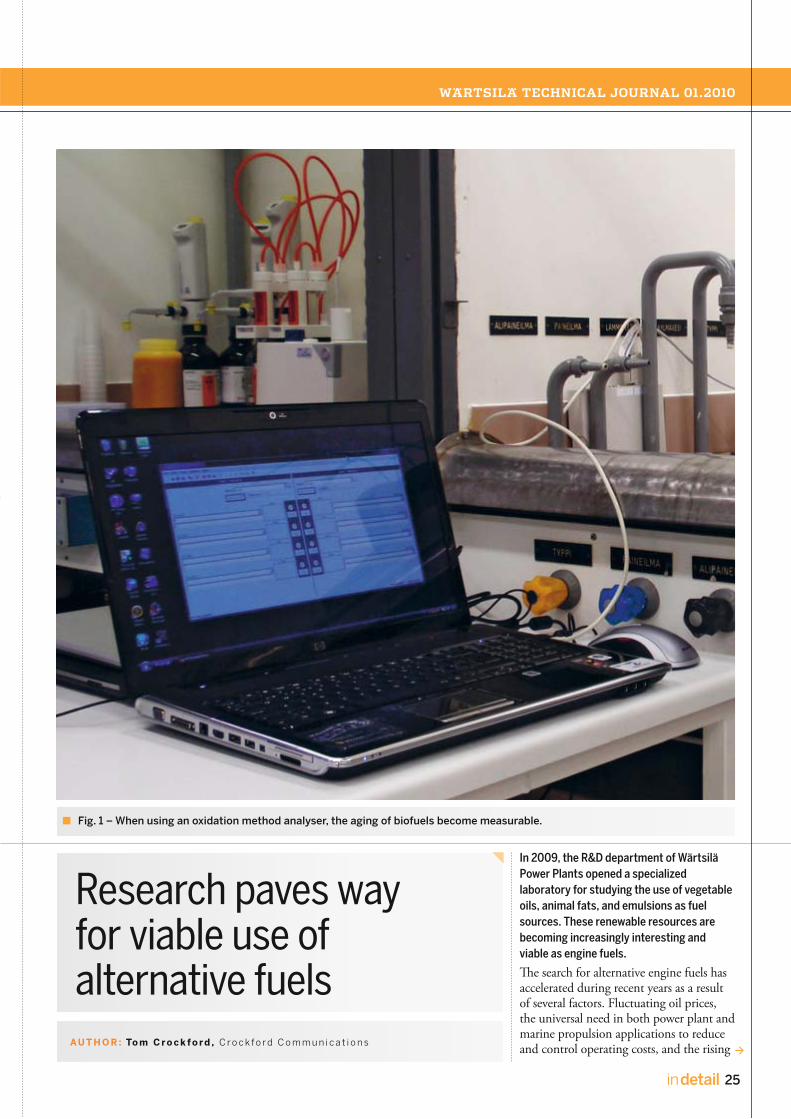
WÄRTSILÄ TECHNICAL JOURNAL 01.2010
25in detail
Research paves way for viable use of alternative fuels
AU T H O R : To m C r o c k fo rd , C r o c k f o r d C o m m u n i c a t i o n s
In 2009, the R&D department of Wärtsilä Power Plants opened a specialized laboratory for studying the use of vegetable oils, animal fats, and emulsions as fuel sources. These renewable resources are becoming increasingly interesting and viable as engine fuels.
The search for alternative engine fuels has accelerated during recent years as a result of several factors. Fluctuating oil prices, the universal need in both power plant and marine propulsion applications to reduce and control operating costs, and the rising
Fig. 1 – When using an oxidation method analyser, the aging of biofuels become measurable.

26 in detail
[ ENERGY / IN DETAIL ]
[ EN
ER
GY
/ I
N D
ET
AIL
]
awareness of environmental concerns, have all hastened the need to reduce reliance on fossil fuels.
As long ago as 1912, Rudolf Diesel wrote: “The use of vegetable oils for engine fuels may seem insignificant today. But such oils may become in the course of time as important as petroleum and the coal tar products of the present time.” Despite this prediction, the use of alternative fuels is, nevertheless, still in its infancy. Wärtsilä, however, carried out its first tests with engines running on a liquid biofuel (LBF) already in 1995, when rapeseed oil was used. Furthermore, Wärtsilä engine power plants have been using palm oil in commercial operation since 2003. In Italy for example, Wärtsilä has delivered 40 power plants operating on liquid biofuels, generating a total of more than 800 MW.
Intensifying the search A large-scale shift from fossil fuels to renewable fuels implies that an extensive range of different feedstock is needed to satisfy demand. In particular, renewable fuels are needed that do not compete with
Fig. 2 – Fuel oil emulsion developed in the Wärtsilä fuel laboratory.
food production. Since reliable information about the production and use of renewable fuels for engines is very limited, Wärtsilä decided to develop its own research capabilities, in order to obtain solutions that are both commercially and technically viable.
As with crude fossil fuels, different crude liquid biofuels exhibit significant variations in fuel quality. Therefore, to achieve high efficiencies and acceptable engine operational reliability when using LBF, research aimed at attaining a better understanding of how engines react to the composition and other characteristics of the LBF, is required. During the past few months, Wärtsilä has spent much effort on enlarging its special fuels laboratory. At the same time, a campaign has been initiated to collect and analyze different kinds of LBF samples.
Figure 2 shows an example of results of the analytical work being carried out in the laboratory. The crystal structure belongs to a palm oil sample. The agglomerate was discovered using an optical microscope with an integrated camera. A totally different fuel is illustrated in Figure 3.
Figure 3 shows a sample of fuel oil emulsion that was developed in the fuel lab. The drops of oil in the water are clearly apparent.
Successful testingA number of tests have been successfully performed to demonstrate the ability of Wärtsilä engines to run on a range of vegetable and animal-based oils. The experiments were carried out at the facilities of VTT, the Technical Research Centre of Finland, using a Wärtsilä Vasa 4R32 engine. Testing was carried out with jatropha oil, fish oil, and chicken oil.
Jatropha oil, which is extracted from the seeds of the jatropha plant, is especially interesting as the seeds are a non-edible, high-energy fruit grown on semi-arid or marginal land in Asia, Africa and Latin America. The fact that this oil cannot be used in the food industry makes it extremely promising as a future fuel source. The first tests with this fuel were carried out in January 2009, with the Wärtsilä engine being operated on a batch of oil delivered from India. Recently more tests have been made using jatropha oil from Tanzania.
The first commercial engine-based power plant capable to run on jatropha oil has recently been installed by Wärtsilä at the Greenpower combined heat and power plant in Merksplas, Belgium.
At the forefrontMuch work remains to be done, however, before the new alternative fuels play a meaningful role in energy production. For example, further investigation needs to be carried out on the primary constituents of certain oils, on some of the components present, and on phenomena like aging that can affect the characteristics of the fuel.
Nevertheless, the progress made this far is extremely promising. Successful tests using fish oil and chicken oil show that the engine performs in much the same way with these animal fats as with vegetable-based oils. It can be concluded, therefore, that most animal fats are similar to conventional diesel fuels in terms of energy content, and ignition and combustion properties. The main differences, amongst

WÄRTSILÄ TECHNICAL JOURNAL 01.2010
27in detail
Fig. 3 – Large agglomerates are one of the characteristics of palm oil.
others, are the pour point, the level of impurities, and the degree of acidity.
Clearly Wärtsilä is, as a result of this R&D initiative, at the forefront of global efforts to reduce reliance on fossil fuels. The new facility, with its dedicated equipment, provides the opportunity to expand upon the knowledge gained earlier by the company.
The fuel supply infrastructures for crude vegetable oils are being developed at a rapid pace, suggesting that the availability of such fuels will be vastly increased during the coming five to ten years.
Wärtsilä is committed to developing the technology for using these new liquid biofuels. The fact that high efficiency and proven power generation equipment can utilize these fuels is to the benefit of both the economy, and the environment.
Fig. 4 – The Greenpower CHP plant in Belgium.
Wärtsilä has delivered an engine-driven combined heat and power (CHP) plant to be fuelled by a variety of liquid biofuels, such as oil extracted from the seeds of the jatropha plant.
REFERENCE: GREENPOWER, BELGIUM
CHP PLANT TO USE CRUDE JATROPHA OIL
The plant utilizes a Wärtsilä 20V32 engine with an electrical output of 9 MW, sufficient to serve approximately 20,000 households. The scope of supply also includes exhaust gas cleaning equipment and heat recovery systems. The plant has a gross electrical efficiency of 44.2% and an overall efficiency of more than 85%, which results in savings of more than 36,000 tons of CO2 per year.
The new CHP power plant is located in an agricultural area in Merksplas, Belgium. Heat from the plant is used in a drying facility for digested biomass recovered from a manure fermentation plant, and for local greenhouse farming operations. Electricity is sold to the local grid.

28 in detail
[ MARINE / IN DETAIL ]
[ M
AR
INE
/ I
N D
ET
AIL
]
Design criteria for an offshore wind farm installation jack-upAU T H O R : H e n n i n g vo n We d e l , S e n i o r M e c h a n i c a l E n g i n e e r, W ä r t s i l ä S h i p D e s i g n i n G e r m a n y
The global search for cleaner energy sources has led to increasing support for offshore wind farm installations. This development has significant implications for the marine industry, as discussed in this article.

WÄRTSILÄ TECHNICAL JOURNAL 01.2010
29in detail
The recent emergence of offshore wind farming as a new maritime industry is something to which the traditional shipping and shipbuilding industries, and especially the offshore sector, are having to adjust. Past attempts of designers to deal with the particular challenges of this new reality were not taken overly seriously. However, in light of the intensifying worldwide debate on global warming and CO2 emissions,governments around the world are showing genuine interest, and are giving concrete support to the new offshore wind industry.
In Europe, an initiative to subsidize offshore wind projects with approximately EUR 4 billion has been launched by the European Union. Leading European utilities engaged in eight offshore wind projects during 2009, providing a combined output of more than 0.5 GW. In 2010, according to the European Wind Energy Association (EWEA), ten more offshore wind farms with an aggregate output of 1 GW will be built. In the USA, investments in this new industry have also started. In June 2009, four offshore wind park projects off the coasts of New Jersey and Delaware, with a combined output exceeding 1 GW, received regulatory approval.
It is not the innovativeness of wind turbine designers alone that is opening the door for this impressive growth in offshore wind harnessing activities. Rather, it is the combined innovative efforts by designers of virtually all the equipment used in the offshore wind value chain. This includes the designers of specialized vessels to install wind turbines, tailored feeder vessels to supply wind turbine components to installation vessels, and dedicated vessels required to operate and maintain offshore wind farms.
Wärtsilä and its Hamburg-based partner IMS Ingenieurgesellschaft, kicked off the development of a new generation of offshore wind farm installation vessels in late 2007. This resulted in a crane jack-up tailored to, and optimized for, the installation of the next generation of offshore wind turbines that can be operated all year round. Two years later, RWE Innogy, the renewables arm of the utility RWE, ordered two Wärtsilä/IMS designed jack-ups from the South Korean shipyard Daewoo Shipbuilding & Marine Engineering (DSME).
At first glance, the Wärtsilä/IMS offshore wind farm installation jack-up is an ugly
square metal box with legs and a crane. However, the beauty of the design lays under its skin in solutions that perfectly match the operating requirements with the technical possibilities. Notably, the jack-up is no larger than necessary, no heavier than necessary, and also no more complicated than necessary. This represents precisely the competitive edge of innovative, high-end Western European design in these days of global competition.
The design process started with the definition of some crucial main particulars and the operational envelope of the vessel with respect to wind, waves, current and seabed soil conditions. The operational envelope was derived from surveying and
analyzing wind, wave, current and soil conditions of 178 potential wind farm locations in the North Sea, Baltic Sea and the Irish Sea. The crucial main particulars, such as crane capacity and dimensions, followed from the dimensions and weights of the latest generation of 6 MW offshore wind turbines, which were just on the drawing board at that stage.
As a next step in the design process, different ship concepts were evaluated, ranging from mono- and multi-hull solutions to semi-submersible concepts (see Figure 1). Taking also building costs into account, the box-shaped jack-up was decided upon.
JACKUP
SUBMERSIBLE
SEM-SUBMERSIBLE
SHIP SHAPE W. HEAVE COMPENSATION
JACKUP SEMI-SUBMERSIBLE
SUBMERSIBLE
SHIP SHAPE W. HEAVE COMPENSATION
CATAMARANCARAMARAN SWATH
SWATH
Fig. 1 – Types of mobile offshore units for wind turbine installation and maintenance.
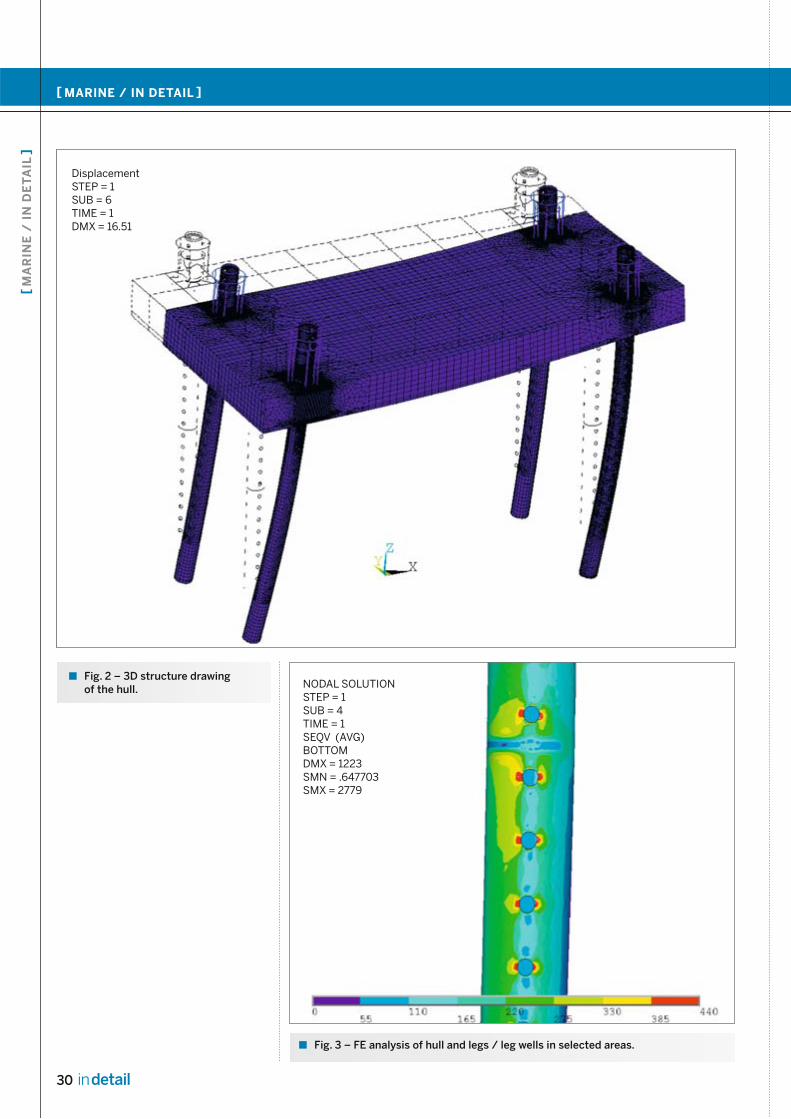
30 in detail
[ MARINE / IN DETAIL ]
[ M
AR
INE
/ I
N D
ET
AIL
]
Fig. 3 – FE analysis of hull and legs / leg wells in selected areas.
Fig. 2 – 3D structure drawing of the hull.
DisplacementSTEP = 1SUB = 6TIME = 1DMX = 16.51
NODAL SOLUTIONSTEP = 1SUB = 4TIME = 1SEQV (AVG)BOTTOMDMX = 1223SMN = .647703SMX = 2779

WÄRTSILÄ TECHNICAL JOURNAL 01.2010
31in detail
From there, the design process continued with the basic geometry of the jack-up’s steel structure, with its compartments and its longitudinal and transverse subdivisions. While detailing this steel structure, “keeping things light” was the overriding philosophy, with girders and openings rather than solid steel walls (see Figure 2).
Then, in several loops, the steel structures were dimensioned according to the results of numerous finite element analyses of the complete vessel with legs. Various other details, like the crane foundation, the leg wells, and of course the legs themselves, also were assessed (Figure 3). In this way, the vessel was designed to meet customer requirements within the bounds of all technical possibilities.
Since the Wärtsilä /IMS jack-up is designed for renewable energy installations, extra attention has been given to its energy
Fig. 4 – Cooling water concept diagram.
efficiency. The USA’s EPA emission standards have been taken into account for the diesel generating sets. In order to push energy efficiency well above 50%, the waste heat from both the exhaust gases and the cooling water of the diesel generating sets is recovered (Figure 4).
The jack-up’s main particulars are impressive. The free deck surface almost matches the dimensions of a football field. Its’ crane can accurately position the nacelle of a latest generation 6 MW offshore wind turbine, with a weight of approximately 500 tonnes, at a height of 100 metres above the water surface, onto the wind turbine’s turret. The vessel’s jacking system can reliably raise 15,000 tons of steel, the vessel’s own weight and that of its cargo, 20 metres above the water surface at water depths of up to 45 metres.
For exact positioning at the wind farm
construction site, six Lips FS 225 steerable thrusters are envisioned. They give the vessel the ability to work independently in highly adverse wind, wave and current conditions. An exact analysis, including model tests, of the effects of these wind and sea conditions on the jack-up in both floating and jack-up mode, was undertaken to dimension the jack-up’s structure and systems.
Upon completion of the construction at DSME, the unit will be able to efficiently set up an offshore wind farm with some 80 wind turbines, including their foundations, in one season. This is substantially better than with a jack-up that is not tailored to the specific requirements of the offshore wind industry, and also substantially better than what can be achieved by today’s offshore wind farm installation jack-ups.
2252.0001
2251.0001
2252.0003
2251.0003
4715.01
5410.0002
4511.0001
HEELING TANK
HEELING TANK
SEACHEST
SEACHEST
4715.03Prov. Cool
ACCOMMODATION BLOCK
HVACABSORPTION CHILLER
FRO
M T
ERM
AL O
IL E
CON
OM
IZER
TO T
ERM
AL O
IL E
CON
OM
IZER
EXPANSIONS TANK
TO CHILLED WATER CIRCUIT
FROM CHILLED WATER CIRCUIT
4715.02
2251.0004
PUMP ROOM
HYDRAULIC ROOM
2252.0004
2154.11
4662.0001 6585.0001
4333.01
6585.00024662.0002
2154.01
TO DIAGRAM OF FIREFIGHTING AND DECKWASH SYSTEM INCL. SPRINKLER SYSTEM DWG. Nr. 4418.01
TO DIAGRAM OF FIREFIGHTING AND DECKWASH SYSTEM INCL. SPRINKLER SYSTEM DWG. Nr. 4418.01
2154.022154.12
2251.0002
2252.0002
ER2 ER1

32 in detail
[ MARINE / IN DETAIL ]
[ M
AR
INE
/ I
N D
ET
AIL
]
This is primarily the result of correctly defining the jack-up’s operational envelope, i.e. its ability to cope with the conditions that can be expected to be encountered where offshore wind farms are likely to be located.
The jack-up is able to position itself in significant wave heights up to 2.5 metres. Tidal currents of up to 3 knots, which are not unusual in for example the Irish Sea, can be coped with. Once jacked-up, it is able to conduct installation work in significant wave heights of up to 5 metres and with wind forces of up to Beaufort 7.
Whilst today’s jack-ups can only work under relatively favourable wind, wave and current conditions during summer time, the Wärtsilä/IMS designed jack-up is capable of coping with nearly all weather conditions throughout the entire year.
The first of the two Wärtsilä/IMS offshore wind farm installation jack-ups is scheduled to be delivered from DSME in the middle of 2011, and the second one slightly later in 2011. From then on, the emerging offshore wind industry will finally have the tailored equipment it needs.
Fig. 5 – Next generation wind turbine installation vessel for 4 x 6 MW complete wind turbines.

WÄRTSILÄ TECHNICAL JOURNAL 01.2010
33in detail
Tugging at the future AU T H O R S : Ko e n Vo n k , M a n a g e r S o l u t i o n E n g i n e e r i n g , S h i p Po w e r, W ä r t s i l ä i n C h i n a a n d Le i f B e c ke r, N a v a l A r c h i t e c t , P r o j e c t M a n a g e r, W ä r t s i l ä S h i p D e s i g n i n N o r w a y
The most common purpose of tugs is to assist other vessels during harbour entry and manoeuvering. To perform this task effectively they need to be compact, highly manoeuverable and powerful. The defining characteristic that determines the tug’s income is its maximum bollard pull; in other words, the pulling force that a tug can exert on a stationary vessel. All tug systems are therefore designed to cost-effectively achieve the highest possible classification- certified rating.
For W TUG, we have focused on a typical harbour tug having a bollard pull of 60 tons, and an LNG terminal escort tug with a bollard pull of 80 tons. These are referred to as the W TUG 60 and W TUG 80 respectively.
Design briefThe standard of today’s modern tugs results from experience gained over many years by designers, owners, yards, equipment suppliers and classification societies. Recognizing this key aspect, the W TUG project solicited valuable comments from several tug operators and equipment suppliers throughout the process. Knowledge gained from joint industry projects, like SAFETUG, has also been implemented. Vessel performance, ease of production, ease of maintenance as well as safety were selected as being the key factors in developing a vessel compliant with tomorrow’s environmental and economic requirements.
The W TUG 60 design targets typical
harbour duties. Compact size, high manoeuvrability, and fire fighting capability are required for this tug with a bollard pull of 60 tons and 12.5 knots trial speed. The total cost should be within reach of all operators, including those in areas with low margins such as developing markets. Accommodation is specified for seven men.
The design brief for the W TUG 80 requires safe operation in exposed areas like offshore terminals. Escorting at high speed, push-pull operations and coastal towing are also typical tasks. This calls for a highly manoeuvrable vessel with good sea-keeping characteristics. The vessel also needs fire fighting capability, the ability to operate 200 nautical miles from the coast and a relocation range of 4000 nautical miles. Bollard pull capacity is 80 tons and the trial speed is 14 knots. The coastal aspect requires accommodation for eight men.
The W TUG project is a Wärtsilä initiative aimed at developing a new concept for tugs. It brings together the company’s Ship Design and Ship Power expertise and aims to design a tug to meet tomorrow’s environmental and economic requirements.

34 in detail
[ MARINE / IN DETAIL ]
[ M
AR
INE
/ I
N D
ET
AIL
]
Fig. 1a – The W TUG 60 Fig. 1b – The W TUG 80, hybrid version
Main parameters:
W TUG60 W TUG80
Length over all LOA 29.5 m 35.40 m
Max breadth 11.8 m 14.00 m
Depth hull (excl skeg) (approx.) 5.6 m 6.65 m
Draft below skeg (approx.) 5.4 m 6.20 m
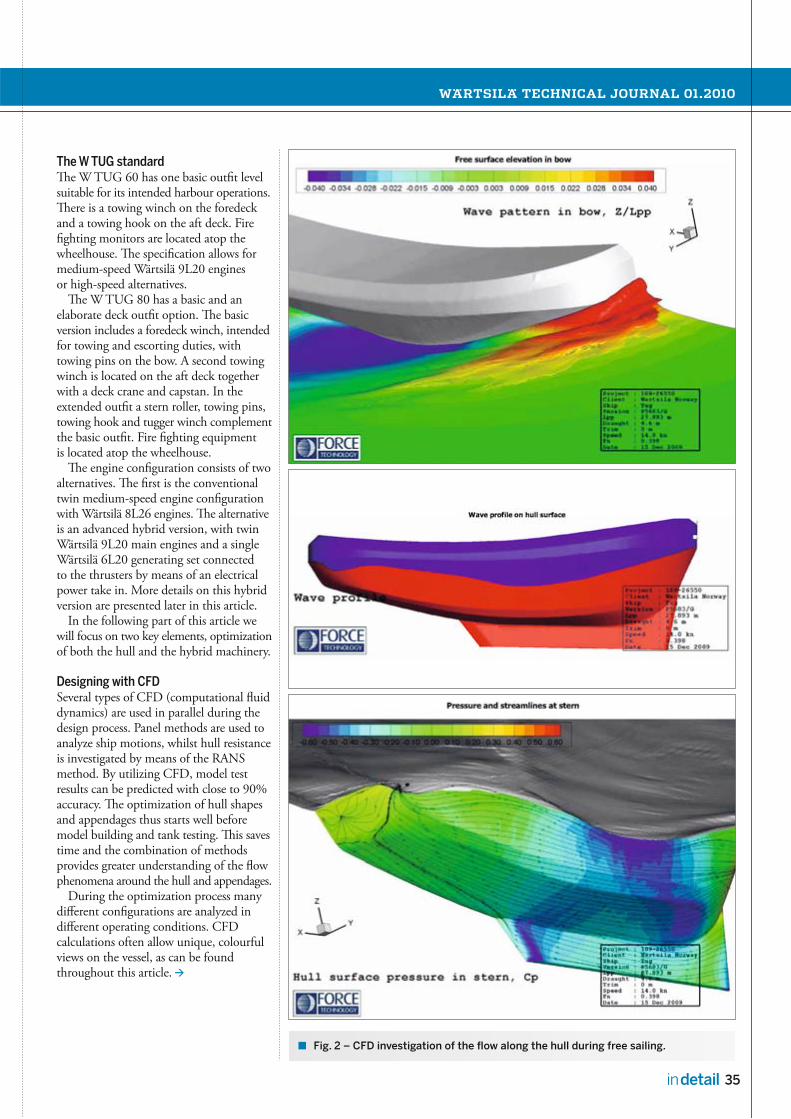
WÄRTSILÄ TECHNICAL JOURNAL 01.2010
35in detail
The W TUG standardThe W TUG 60 has one basic outfit level suitable for its intended harbour operations. There is a towing winch on the foredeck and a towing hook on the aft deck. Fire fighting monitors are located atop the wheelhouse. The specification allows for medium-speed Wärtsilä 9L20 engines or high-speed alternatives.
The W TUG 80 has a basic and an elaborate deck outfit option. The basic version includes a foredeck winch, intended for towing and escorting duties, with towing pins on the bow. A second towing winch is located on the aft deck together with a deck crane and capstan. In the extended outfit a stern roller, towing pins, towing hook and tugger winch complement the basic outfit. Fire fighting equipment is located atop the wheelhouse.
The engine configuration consists of two alternatives. The first is the conventional twin medium-speed engine configuration with Wärtsilä 8L26 engines. The alternative is an advanced hybrid version, with twin Wärtsilä 9L20 main engines and a single Wärtsilä 6L20 generating set connected to the thrusters by means of an electrical power take in. More details on this hybrid version are presented later in this article.
In the following part of this article we will focus on two key elements, optimization of both the hull and the hybrid machinery.
Designing with CFD Several types of CFD (computational fluid dynamics) are used in parallel during the design process. Panel methods are used to analyze ship motions, whilst hull resistance is investigated by means of the RANS method. By utilizing CFD, model test results can be predicted with close to 90% accuracy. The optimization of hull shapes and appendages thus starts well before model building and tank testing. This saves time and the combination of methods provides greater understanding of the flow phenomena around the hull and appendages.
During the optimization process many different configurations are analyzed in different operating conditions. CFD calculations often allow unique, colourful views on the vessel, as can be found throughout this article.
Fig. 2 – CFD investigation of the flow along the hull during free sailing.
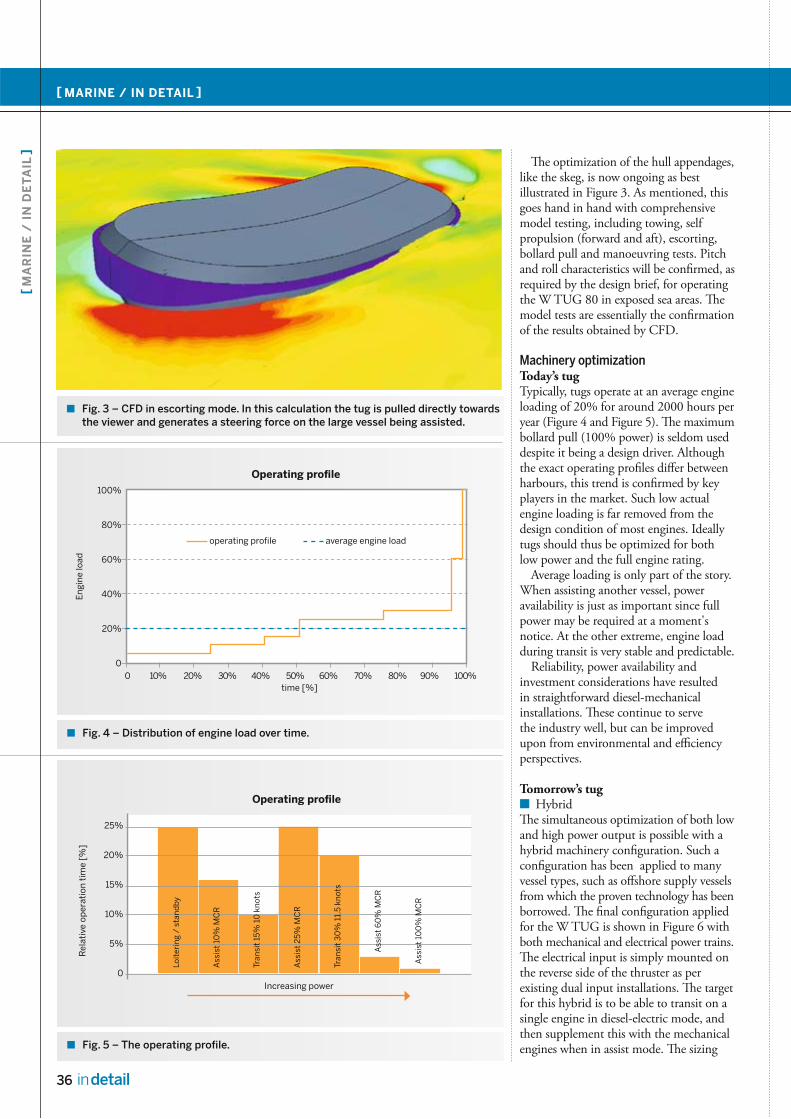
36 in detail
[ MARINE / IN DETAIL ]
[ M
AR
INE
/ I
N D
ET
AIL
]
The optimization of the hull appendages, like the skeg, is now ongoing as best illustrated in Figure 3. As mentioned, this goes hand in hand with comprehensive model testing, including towing, self propulsion (forward and aft), escorting, bollard pull and manoeuvring tests. Pitch and roll characteristics will be confirmed, as required by the design brief, for operating the W TUG 80 in exposed sea areas. The model tests are essentially the confirmation of the results obtained by CFD.
Machinery optimizationToday’s tugTypically, tugs operate at an average engine loading of 20% for around 2000 hours per year (Figure 4 and Figure 5). The maximum bollard pull (100% power) is seldom used despite it being a design driver. Although the exact operating profiles differ between harbours, this trend is confirmed by key players in the market. Such low actual engine loading is far removed from the design condition of most engines. Ideally tugs should thus be optimized for both low power and the full engine rating.
Average loading is only part of the story. When assisting another vessel, power availability is just as important since full power may be required at a moment's notice. At the other extreme, engine load during transit is very stable and predictable.
Reliability, power availability and investment considerations have resulted in straightforward diesel-mechanical installations. These continue to serve the industry well, but can be improved upon from environmental and efficiency perspectives.
Tomorrow’s tug ■ Hybrid
The simultaneous optimization of both low and high power output is possible with a hybrid machinery configuration. Such a configuration has been applied to many vessel types, such as offshore supply vessels from which the proven technology has been borrowed. The final configuration applied for the W TUG is shown in Figure 6 with both mechanical and electrical power trains. The electrical input is simply mounted on the reverse side of the thruster as per existing dual input installations. The target for this hybrid is to be able to transit on a single engine in diesel-electric mode, and then supplement this with the mechanical engines when in assist mode. The sizing
Fig. 3 – CFD in escorting mode. In this calculation the tug is pulled directly towards the viewer and generates a steering force on the large vessel being assisted.
Fig. 4 – Distribution of engine load over time.
Fig. 5 – The operating profile.
Engi
ne lo
ad
Operating profile100%
80%
60%
40%
20%
00 10% 20% 30% 40% 50% 60% 70% 80% 90% 100%
time [%]
operating profile average engine load
Operating profile
25%
20%
15%
10%
5%
0
Rel
ativ
e op
erat
ion
tim
e [%
]
Increasing power
Loit
erin
g /
stan
dby
Ass
ist
10%
MC
R
Tran
sit
15%
10
kno
ts
Ass
ist
25%
MC
R
Tran
sit
30%
11.
5 kn
ots
Ass
ist
60
% M
CR
Ass
ist
100
% M
CR

WÄRTSILÄ TECHNICAL JOURNAL 01.2010
37in detail
Fig. 6 – The hybrid machinery confi guration. The Wärtsilä 9L20 engines are mechanically coupled to the CS300 thruster units by means of a shaft. The components in the blue box are the heart of the hybrid. The electrical power take in (PTI) and frequency drive unit take electrical power from the Wärtsilä 6L20 generating set and the small harbor generating set. The PTI’s can be used to run the thrusters independently in a pure electrical mode or boost the mechanically supplied power. The batteries in the red box can be added to create a completely silent electrical operating mode.
Fig. 7 – Energy consumption per operating condition.
of the engines thus starts from the bollardpull requirement, resistance curve, and theelectrical load balance. Th e aim is tooptimize the resistance curve and equipment effi ciency for the same transit operating speed. A key operator concern is to be able to get out of the way of an assisted vessel in case of a black-out on the tug. Th is intrinsic failsafe of mechanically driven vessels is taken into account in the hybrid. In fact a second, purely electrical failsafe is introduced in case of a mechanical failure.
An indication of where savings can beachieved is shown in the overall energyconsumption for electrical and propulsiveneeds (Figure 7).
Transit between the berth and the area of assist represents almost a third of all energy consumption. Th e main engines operate at less than 30% load in thiscondition. Applying more power does not result in a signifi cant speed increase, but merely generates excessive waves. Together, these facts indicate the potential for improvement.
Loitering, with the engines mostly idling, is typically an ineffi cient operating condition. At least part of the 8% energy consumption should be salvageable.
Electric cross link
Batteries 1000 kW (option)
PTI 1000 kW
CS300-3000 HR
CS300-3000 HR
PTI 1000 kW
Frequency drive
WÄRTSILÄ 9L20
WÄRTSILÄ 6L20
HS Harbour
WÄRTSILÄ 9L20
1800 kWm at 1000 rpm
1055 kWe at 900 rpm
250 kW at 1800 rpm
1800 kWm at 1000 rpm
Harbour Loitering/standby Assist 10% Assist 25%
Assist 60% Assist 80 TBP Transit 15% 10 knots Transit 30% 11.5. knots
Transit 30% 11.5. knots 23%
Harbour 15%
Loitering/standby8%
Assist 10%10%
Assist 25%28%
Assist 60%6%
Assist 80 TBP3%
Transit 15% 10 knots7%
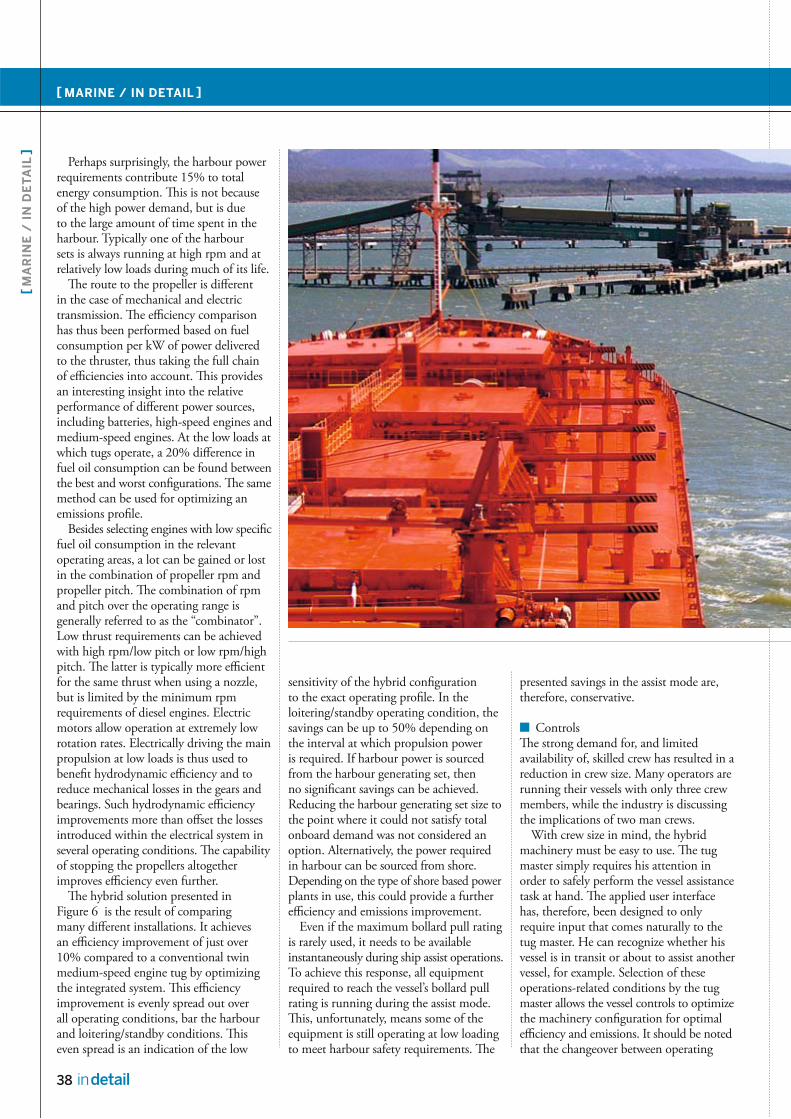
38 in detail
[ MARINE / IN DETAIL ]
[ M
AR
INE
/ I
N D
ET
AIL
]
Perhaps surprisingly, the harbour power requirements contribute 15% to total energy consumption. This is not because of the high power demand, but is due to the large amount of time spent in the harbour. Typically one of the harbour sets is always running at high rpm and at relatively low loads during much of its life.
The route to the propeller is different in the case of mechanical and electric transmission. The efficiency comparison has thus been performed based on fuel consumption per kW of power delivered to the thruster, thus taking the full chain of efficiencies into account. This provides an interesting insight into the relative performance of different power sources, including batteries, high-speed engines and medium-speed engines. At the low loads at which tugs operate, a 20% difference in fuel oil consumption can be found between the best and worst configurations. The same method can be used for optimizing an emissions profile.
Besides selecting engines with low specific fuel oil consumption in the relevant operating areas, a lot can be gained or lost in the combination of propeller rpm and propeller pitch. The combination of rpm and pitch over the operating range is generally referred to as the “combinator”. Low thrust requirements can be achieved with high rpm/low pitch or low rpm/high pitch. The latter is typically more efficient for the same thrust when using a nozzle, but is limited by the minimum rpm requirements of diesel engines. Electric motors allow operation at extremely low rotation rates. Electrically driving the main propulsion at low loads is thus used to benefit hydrodynamic efficiency and to reduce mechanical losses in the gears and bearings. Such hydrodynamic efficiency improvements more than offset the losses introduced within the electrical system in several operating conditions. The capability of stopping the propellers altogether improves efficiency even further.
The hybrid solution presented in Figure 6 is the result of comparing many different installations. It achieves an efficiency improvement of just over 10% compared to a conventional twin medium-speed engine tug by optimizing the integrated system. This efficiency improvement is evenly spread out over all operating conditions, bar the harbour and loitering/standby conditions. This even spread is an indication of the low
sensitivity of the hybrid configuration to the exact operating profile. In the loitering/standby operating condition, the savings can be up to 50% depending on the interval at which propulsion power is required. If harbour power is sourced from the harbour generating set, then no significant savings can be achieved. Reducing the harbour generating set size to the point where it could not satisfy total onboard demand was not considered an option. Alternatively, the power required in harbour can be sourced from shore. Depending on the type of shore based power plants in use, this could provide a further efficiency and emissions improvement.
Even if the maximum bollard pull rating is rarely used, it needs to be available instantaneously during ship assist operations. To achieve this response, all equipment required to reach the vessel’s bollard pull rating is running during the assist mode. This, unfortunately, means some of the equipment is still operating at low loading to meet harbour safety requirements. The
presented savings in the assist mode are, therefore, conservative.
■ ControlsThe strong demand for, and limited availability of, skilled crew has resulted in a reduction in crew size. Many operators are running their vessels with only three crew members, while the industry is discussing the implications of two man crews.
With crew size in mind, the hybrid machinery must be easy to use. The tug master simply requires his attention in order to safely perform the vessel assistance task at hand. The applied user interface has, therefore, been designed to only require input that comes naturally to the tug master. He can recognize whether his vessel is in transit or about to assist another vessel, for example. Selection of these operations-related conditions by the tug master allows the vessel controls to optimize the machinery configuration for optimal efficiency and emissions. It should be noted that the changeover between operating
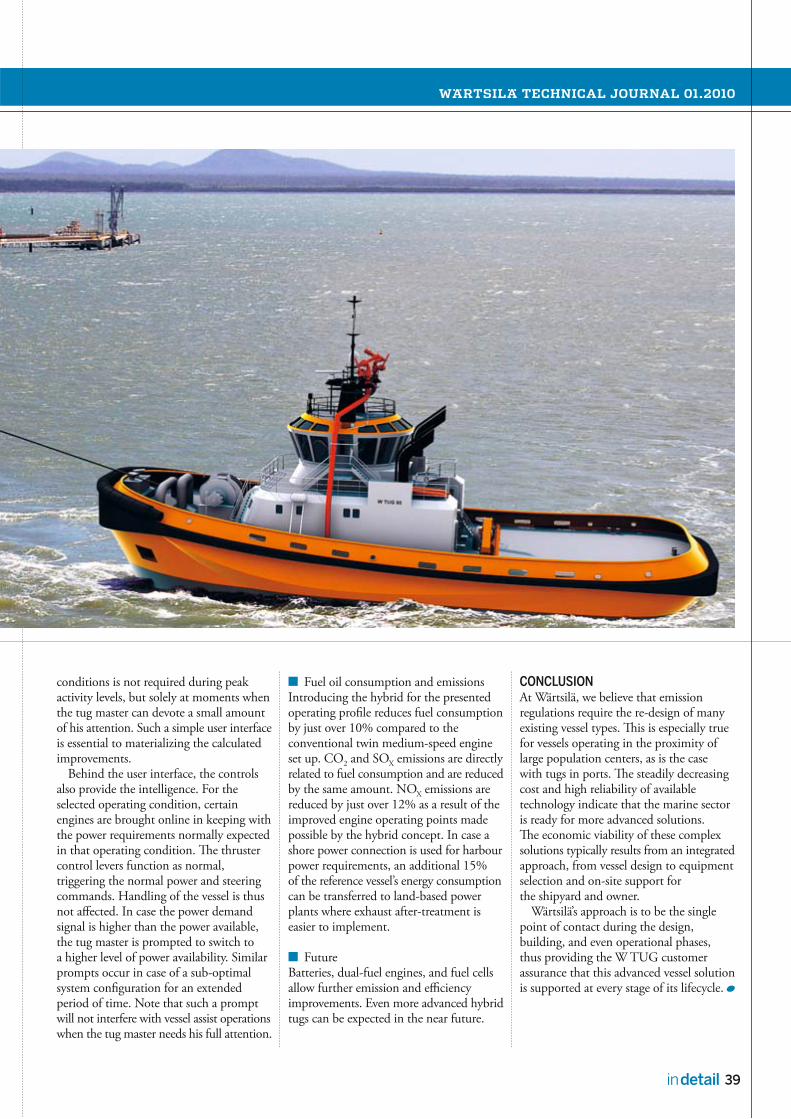
WÄRTSILÄ TECHNICAL JOURNAL 01.2010
39in detail
conditions is not required during peak activity levels, but solely at moments when the tug master can devote a small amount of his attention. Such a simple user interface is essential to materializing the calculated improvements.
Behind the user interface, the controls also provide the intelligence. For the selected operating condition, certain engines are brought online in keeping with the power requirements normally expected in that operating condition. The thruster control levers function as normal, triggering the normal power and steering commands. Handling of the vessel is thus not affected. In case the power demand signal is higher than the power available, the tug master is prompted to switch to a higher level of power availability. Similar prompts occur in case of a sub-optimal system configuration for an extended period of time. Note that such a prompt will not interfere with vessel assist operations when the tug master needs his full attention.
■ Fuel oil consumption and emissionsIntroducing the hybrid for the presented operating profile reduces fuel consumption by just over 10% compared to the conventional twin medium-speed engine set up. CO2 and SOX emissions are directlyrelated to fuel consumption and are reduced by the same amount. NOX emissions are reduced by just over 12% as a result of the improved engine operating points made possible by the hybrid concept. In case a shore power connection is used for harbour power requirements, an additional 15% of the reference vessel’s energy consumption can be transferred to land-based power plants where exhaust after-treatment is easier to implement.
■ FutureBatteries, dual-fuel engines, and fuel cells allow further emission and efficiency improvements. Even more advanced hybrid tugs can be expected in the near future.
CONCLUSIONAt Wärtsilä, we believe that emission regulations require the re-design of many existing vessel types. This is especially true for vessels operating in the proximity of large population centers, as is the case with tugs in ports. The steadily decreasing cost and high reliability of available technology indicate that the marine sector is ready for more advanced solutions. The economic viability of these complex solutions typically results from an integrated approach, from vessel design to equipment selection and on-site support for the shipyard and owner.
Wärtsilä’s approach is to be the single point of contact during the design, building, and even operational phases, thus providing the W TUG customer assurance that this advanced vessel solution is supported at every stage of its lifecycle.
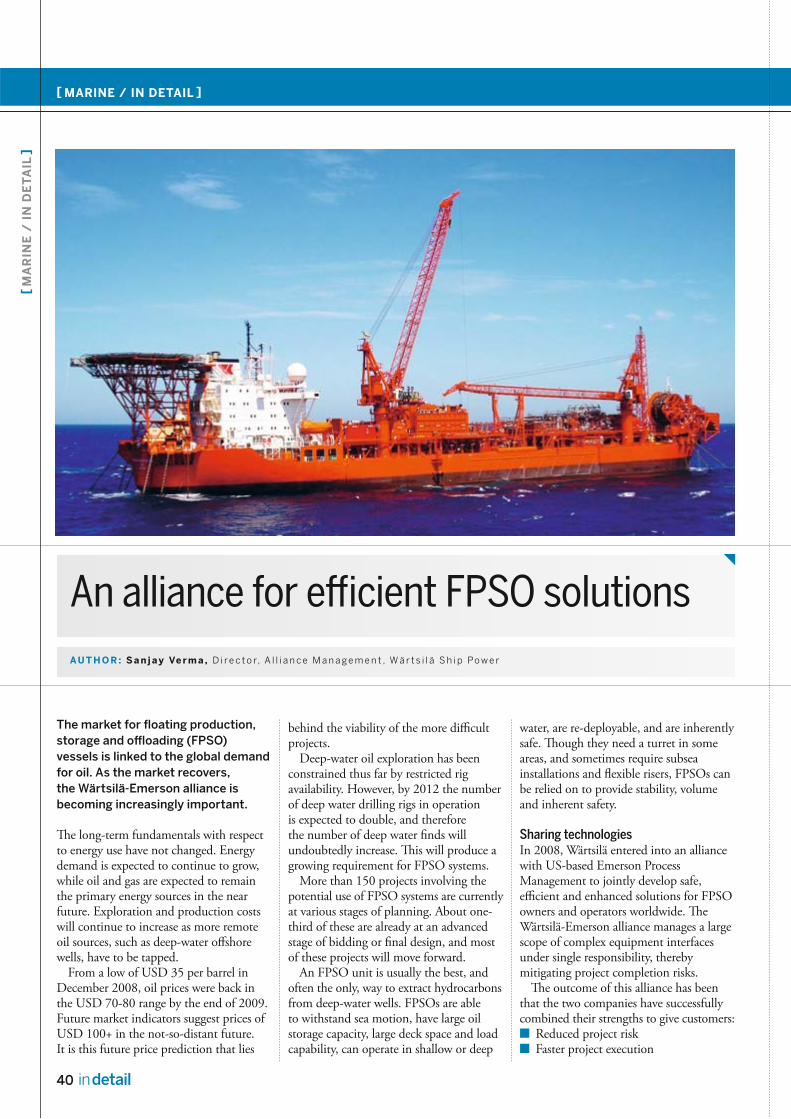
40 in detail
[ MARINE / IN DETAIL ]
[ M
AR
INE
/ I
N D
ET
AIL
]
An alliance for effi cient FPSO solutionsAU T H O R : S a n j a y Ve r m a , D i r e c t o r, A l l i a n c e M a n a g e m e n t , W ä r t s i l ä S h i p Po w e r
The market for fl oating production, storage and offl oading (FPSO) vessels is linked to the global demand for oil. As the market recovers, the Wärtsilä-Emerson alliance is becoming increasingly important.
Th e long-term fundamentals with respect to energy use have not changed. Energy demand is expected to continue to grow, while oil and gas are expected to remain the primary energy sources in the near future. Exploration and production costswill continue to increase as more remoteoil sources, such as deep-water off shorewells, have to be tapped.
From a low of USD 35 per barrel inDecember 2008, oil prices were back inthe USD 70-80 range by the end of 2009.Future market indicators suggest prices ofUSD 100+ in the not-so-distant future.It is this future price prediction that lies
behind the viability of the more diffi cultprojects.
Deep-water oil exploration has been constrained thus far by restricted rig availability. However, by 2012 the number of deep water drilling rigs in operation is expected to double, and therefore the number of deep water fi nds will undoubtedly increase. Th is will produce a growing requirement for FPSO systems.
More than 150 projects involving the potential use of FPSO systems are currentlyat various stages of planning. About one-third of these are already at an advanced stage of bidding or fi nal design, and most of these projects will move forward.
An FPSO unit is usually the best, andoften the only, way to extract hydrocarbonsfrom deep-water wells. FPSOs are able to withstand sea motion, have large oil storage capacity, large deck space and loadcapability, can operate in shallow or deep
water, are re-deployable, and are inherentlysafe. Th ough they need a turret in someareas, and sometimes require subsea installations and fl exible risers, FPSOs canbe relied on to provide stability, volumeand inherent safety.
Sharing technologiesIn 2008, Wärtsilä entered into an alliancewith US-based Emerson Process Management to jointly develop safe, effi cient and enhanced solutions for FPSO owners and operators worldwide. Th e Wärtsilä-Emerson alliance manages a large scope of complex equipment interfaces under single responsibility, thereby mitigating project completion risks.
Th e outcome of this alliance has beenthat the two companies have successfullycombined their strengths to give customers:
■ Reduced project risk ■ Faster project execution
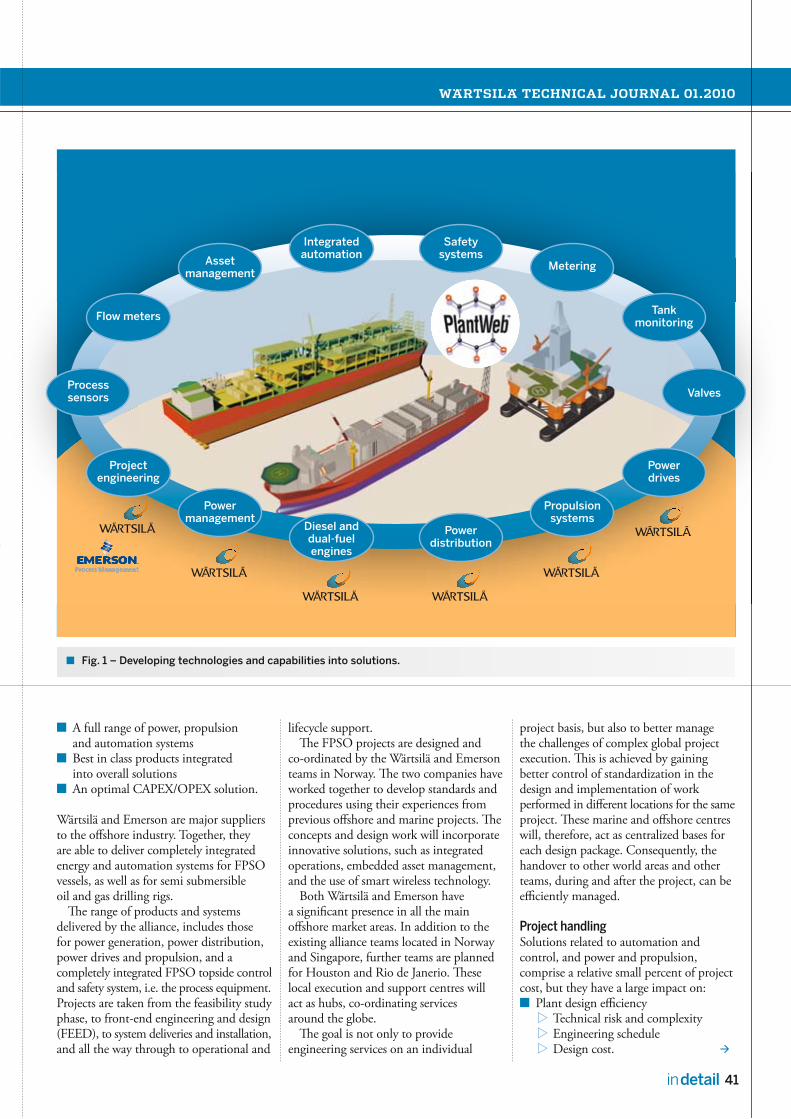
WÄRTSILÄ TECHNICAL JOURNAL 01.2010
41in detail
■ A full range of power, propulsion and automation systems
■ Best in class products integrated into overall solutions
■ An optimal CAPEX/OPEX solution.
Wärtsilä and Emerson are major suppliers to the off shore industry. Together, they are able to deliver completely integrated energy and automation systems for FPSOvessels, as well as for semi submersible oil and gas drilling rigs.
Th e range of products and systems delivered by the alliance, includes those for power generation, power distribution, power drives and propulsion, and a completely integrated FPSO topside controland safety system, i.e. the process equipment.Projects are taken from the feasibility studyphase, to front-end engineering and design(FEED), to system deliveries and installation,and all the way through to operational and
lifecycle support.Th e FPSO projects are designed and
co-ordinated by the Wärtsilä and Emerson teams in Norway. Th e two companies have worked together to develop standards and procedures using their experiences from previous off shore and marine projects. Th e concepts and design work will incorporate innovative solutions, such as integrated operations, embedded asset management, and the use of smart wireless technology.
Both Wärtsilä and Emerson have a signifi cant presence in all the main off shore market areas. In addition to the existing alliance teams located in Norwayand Singapore, further teams are plannedfor Houston and Rio de Janerio. Th eselocal execution and support centres willact as hubs, co-ordinating servicesaround the globe.
Th e goal is not only to provide engineering services on an individual
project basis, but also to better manage the challenges of complex global project execution. Th is is achieved by gaining better control of standardization in the design and implementation of work performed in diff erent locations for the sameproject. Th ese marine and off shore centres will, therefore, act as centralized bases foreach design package. Consequently, the handover to other world areas and otherteams, during and after the project, can beeffi ciently managed.
Project handlingSolutions related to automation and control, and power and propulsion, comprise a relative small percent of project cost, but they have a large impact on:
■ Plant design effi ciency Technical risk and complexity Engineering schedule Design cost.
Fig. 1 – Developing technologies and capabilities into solutions.
Integratedautomation
Safetysystems
Diesel and dual-fuel engines
Powerdistribution
Asset management
Metering
Power management
Propulsionsystems
Flow meters Tank monitoring
Projectengineering
Power drives
Processsensors Valves
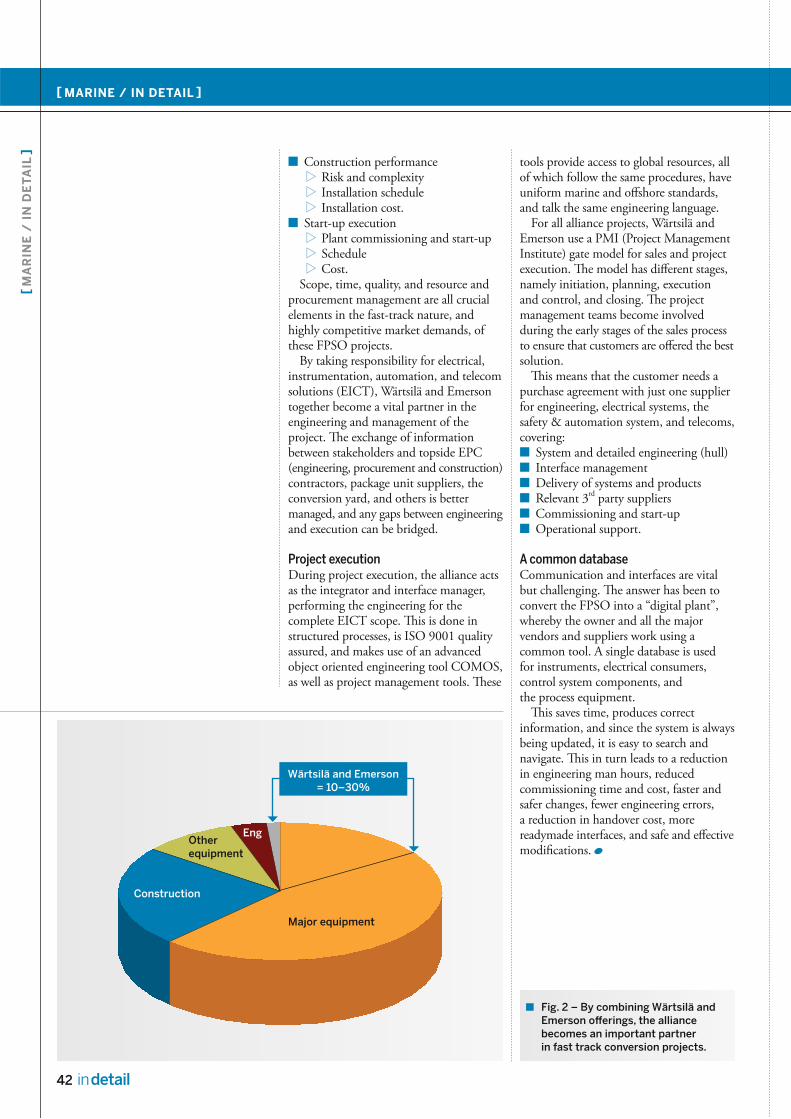
42 in detail
[ MARINE / IN DETAIL ]
[ M
AR
INE
/ I
N D
ET
AIL
]
■ Construction performance Risk and complexity Installation schedule Installation cost.
■ Start-up execution Plant commissioning and start-up Schedule Cost.
Scope, time, quality, and resource and procurement management are all crucial elements in the fast-track nature, and highly competitive market demands, of these FPSO projects.
By taking responsibility for electrical, instrumentation, automation, and telecom solutions (EICT), Wärtsilä and Emerson together become a vital partner in the engineering and management of the project. The exchange of information between stakeholders and topside EPC (engineering, procurement and construction) contractors, package unit suppliers, the conversion yard, and others is better managed, and any gaps between engineering and execution can be bridged.
Project execution During project execution, the alliance acts as the integrator and interface manager, performing the engineering for the complete EICT scope. This is done in structured processes, is ISO 9001 quality assured, and makes use of an advanced object oriented engineering tool COMOS, as well as project management tools. These
tools provide access to global resources, all of which follow the same procedures, have uniform marine and offshore standards, and talk the same engineering language.
For all alliance projects, Wärtsilä and Emerson use a PMI (Project Management Institute) gate model for sales and project execution. The model has different stages, namely initiation, planning, execution and control, and closing. The project management teams become involved during the early stages of the sales process to ensure that customers are offered the best solution.
This means that the customer needs a purchase agreement with just one supplier for engineering, electrical systems, the safety & automation system, and telecoms, covering:
■ System and detailed engineering (hull) ■ Interface management ■ Delivery of systems and products ■ Relevant 3rd party suppliers ■ Commissioning and start-up ■ Operational support.
A common databaseCommunication and interfaces are vital but challenging. The answer has been to convert the FPSO into a “digital plant”, whereby the owner and all the major vendors and suppliers work using a common tool. A single database is used for instruments, electrical consumers, control system components, and the process equipment.
This saves time, produces correct information, and since the system is always being updated, it is easy to search and navigate. This in turn leads to a reduction in engineering man hours, reduced commissioning time and cost, faster and safer changes, fewer engineering errors, a reduction in handover cost, more readymade interfaces, and safe and effective modifications.
Fig. 2 – By combining Wärtsilä and Emerson offerings, the alliance becomes an important partner in fast track conversion projects.
Major equipment
Construction
EngOtherequipment
Wärtsilä and Emerson= 10–30%
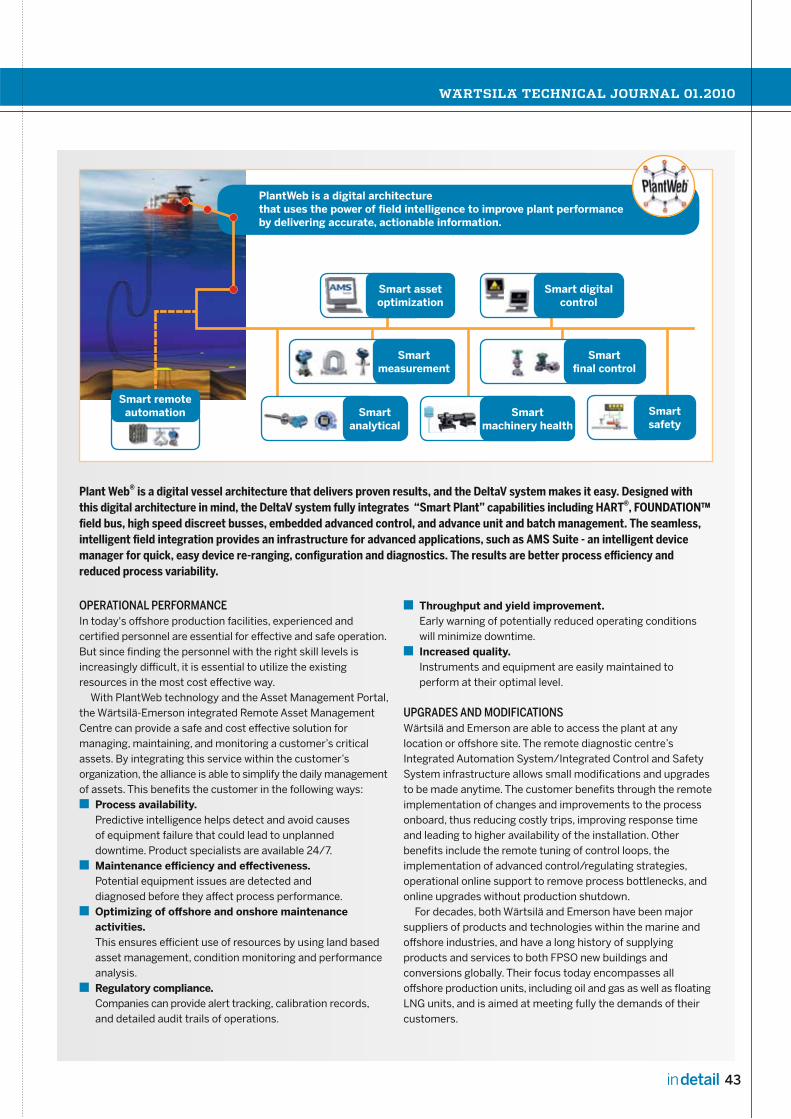
WÄRTSILÄ TECHNICAL JOURNAL 01.2010
43in detail
OPERATIONAL PERFORMANCEIn today's offshore production facilities, experienced and certified personnel are essential for effective and safe operation. But since finding the personnel with the right skill levels is increasingly difficult, it is essential to utilize the existing resources in the most cost effective way.
With PlantWeb technology and the Asset Management Portal, the Wärtsilä-Emerson integrated Remote Asset Management Centre can provide a safe and cost effective solution for managing, maintaining, and monitoring a customer’s critical assets. By integrating this service within the customer’s organization, the alliance is able to simplify the daily management of assets. This benefits the customer in the following ways:
■ Process availability. Predictive intelligence helps detect and avoid causes of equipment failure that could lead to unplanned downtime. Product specialists are available 24/7.
■ Maintenance efficiency and effectiveness. Potential equipment issues are detected and diagnosed before they affect process performance.
■ Optimizing of offshore and onshore maintenance activities. This ensures efficient use of resources by using land based asset management, condition monitoring and performance analysis.
■ Regulatory compliance. Companies can provide alert tracking, calibration records, and detailed audit trails of operations.
■ Throughput and yield improvement. Early warning of potentially reduced operating conditions will minimize downtime.
■ Increased quality. Instruments and equipment are easily maintained to perform at their optimal level.
UPGRADES AND MODIFICATIONSWärtsilä and Emerson are able to access the plant at any location or offshore site. The remote diagnostic centre’s Integrated Automation System/Integrated Control and Safety System infrastructure allows small modifications and upgrades to be made anytime. The customer benefits through the remote implementation of changes and improvements to the process onboard, thus reducing costly trips, improving response time and leading to higher availability of the installation. Other benefits include the remote tuning of control loops, the implementation of advanced control/regulating strategies, operational online support to remove process bottlenecks, and online upgrades without production shutdown.
For decades, both Wärtsilä and Emerson have been major suppliers of products and technologies within the marine and offshore industries, and have a long history of supplying products and services to both FPSO new buildings and conversions globally. Their focus today encompasses all offshore production units, including oil and gas as well as floating LNG units, and is aimed at meeting fully the demands of their customers.
Plant Web® is a digital vessel architecture that delivers proven results, and the DeltaV system makes it easy. Designed withthis digital architecture in mind, the DeltaV system fully integrates “Smart Plant” capabilities including HART®, FOUNDATION™field bus, high speed discreet busses, embedded advanced control, and advance unit and batch management. The seamless, intelligent field integration provides an infrastructure for advanced applications, such as AMS Suite - an intelligent device manager for quick, easy device re-ranging, configuration and diagnostics. The results are better process efficiency and reduced process variability.
PlantWeb is a digital architecture that uses the power of field intelligence to improve plant performance by delivering accurate, actionable information.
Smart asset optimization
Smart remote automation
Smart digital control
Smart measurement
Smart final control
Smart safety
Smart machinery health
Smart analytical

44 in detail
[ MARINE / IN DETAIL ]
[ M
AR
INE
/ I
N D
ET
AIL
]
REFERENCE: THE WÄRTSILÄ-EMERSON ALLIANCE FPSO PROJECTS
FPSO CONVERSION “PETROJARL CIDADE DE RIOS DAS OSTRAS”
FPSO CONVERSION “PIPA 2”
FPSDO VESSEL “MPF-01”
FPSO CONVERSION “YÙUM K'AK'NÁAB”
Scope of supply: Power station Power distribution Integrated control system, incl. PMS and safety systems Electrical propulsion system AC Drives for drilling applications Shipowner: MPF Corp. Shipyard: To be decided Delivery: 2008
The world’s fi rst purpose built DP FPSO.
Scope of supply: Power distribution and control Power management Low Voltage switchboards and UPS Shipowner: Bergesen Worldwide Off shore Shipyard: Sembawang Shipyard Delivery: 2006
The world’s largest FPSO conversion. The fi rst FPSO to be deployed in the Gulf of Mexico, serving as a hub in the area and acting as an export terminal.
Scope of supply: Integrated engineering Diesel engines and generators Thruster systems Power distribution Safety and automation system Commissioning / start-up Shipowner: Dynamic Producer Inc. Shipyard: Sembawang Shipyard Delivery: 2009
The world’s largest drill ship and multipurpose FPSDO.
Scope of supply: Power station Power distribution Safety & automation system Telecommunication incl. navigation Total responsible for EI&T Commissioning /start-up Shipowner: Teekay PetroJarl Shipyard: Remotova Gdansk Shiprepair Yard Delivery: October 2007
The fi rst Wärtsilä-Emerson FPSO in Brazil.
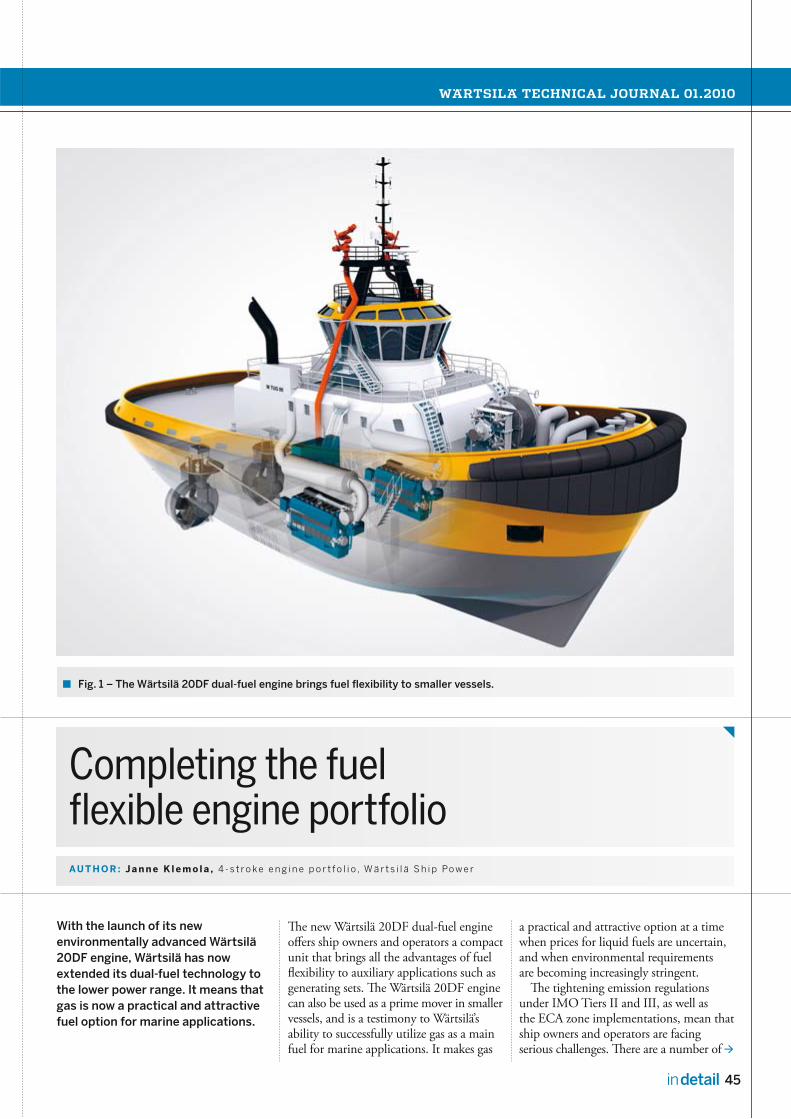
WÄRTSILÄ TECHNICAL JOURNAL 01.2010
45in detail
Completing the fuel flexible engine portfolioAU T H O R : J a n n e K l e m o l a , 4 - s t r o k e e n g i n e p o r t f o l i o , W ä r t s i l ä S h i p Po w e r
With the launch of its new environmentally advanced Wärtsilä 20DF engine, Wärtsilä has now extended its dual-fuel technology to the lower power range. It means that gas is now a practical and attractive fuel option for marine applications.
The new Wärtsilä 20DF dual-fuel engine offers ship owners and operators a compact unit that brings all the advantages of fuel flexibility to auxiliary applications such as generating sets. The Wärtsilä 20DF engine can also be used as a prime mover in smaller vessels, and is a testimony to Wärtsilä’s ability to successfully utilize gas as a main fuel for marine applications. It makes gas
a practical and attractive option at a time when prices for liquid fuels are uncertain, and when environmental requirements are becoming increasingly stringent.
The tightening emission regulations under IMO Tiers II and III, as well as the ECA zone implementations, mean that ship owners and operators are facing serious challenges. There are a number of
Fig. 1 – The Wärtsilä 20DF dual-fuel engine brings fuel flexibility to smaller vessels.
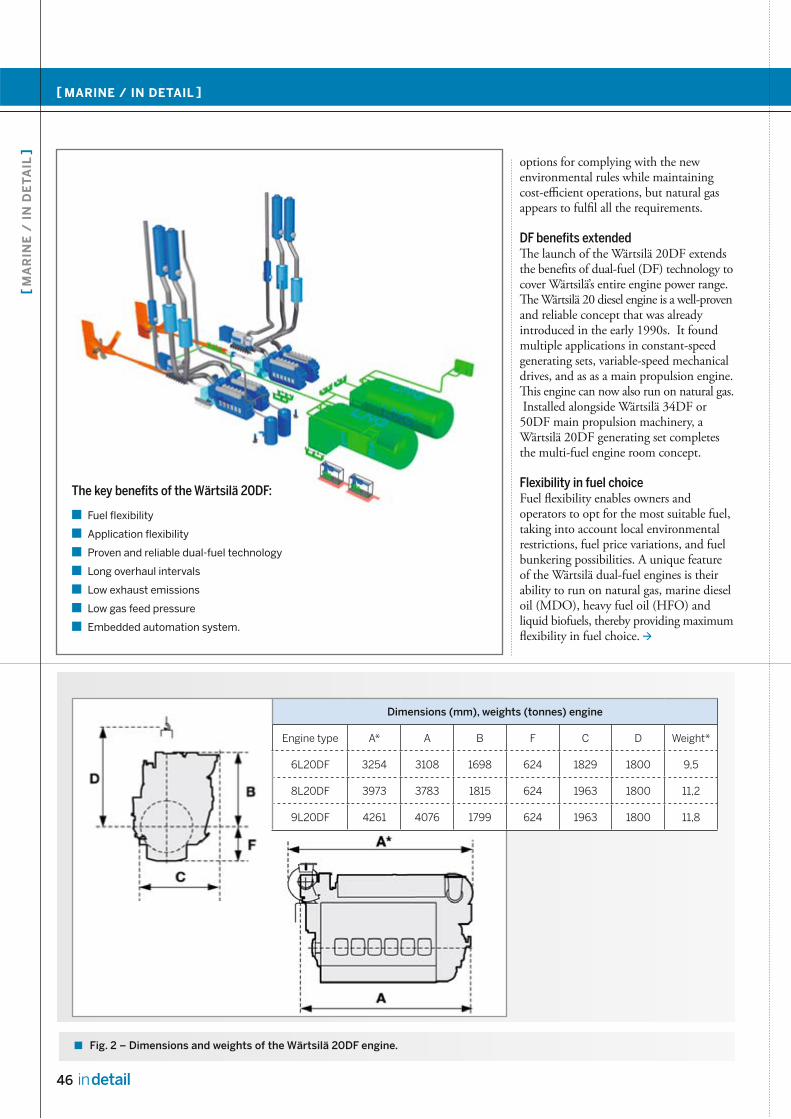
46 in detail
[ MARINE / IN DETAIL ]
[ M
AR
INE
/ I
N D
ET
AIL
]
options for complying with the new environmental rules while maintaining cost-efficient operations, but natural gas appears to fulfil all the requirements.
DF benefits extended The launch of the Wärtsilä 20DF extends the benefits of dual-fuel (DF) technology to cover Wärtsilä’s entire engine power range. The Wärtsilä 20 diesel engine is a well-proven and reliable concept that was already introduced in the early 1990s. It found multiple applications in constant-speed generating sets, variable-speed mechanical drives, and as as a main propulsion engine. This engine can now also run on natural gas. Installed alongside Wärtsilä 34DF or 50DF main propulsion machinery, a Wärtsilä 20DF generating set completes the multi-fuel engine room concept.
Flexibility in fuel choiceFuel flexibility enables owners and operators to opt for the most suitable fuel, taking into account local environmental restrictions, fuel price variations, and fuel bunkering possibilities. A unique feature of the Wärtsilä dual-fuel engines is their ability to run on natural gas, marine diesel oil (MDO), heavy fuel oil (HFO) and liquid biofuels, thereby providing maximum flexibility in fuel choice.
Fig. 2 – Dimensions and weights of the Wärtsilä 20DF engine.
The key benefits of the Wärtsilä 20DF:
■ Fuel flexibility
■ Application flexibility
■ Proven and reliable dual-fuel technology
■ Long overhaul intervals
■ Low exhaust emissions
■ Low gas feed pressure
■ Embedded automation system.
Dimensions (mm), weights (tonnes) engine
Engine type A* A B F C D Weight*
6L20DF 3254 3108 1698 624 1829 1800 9,5
8L20DF 3973 3783 1815 624 1963 1800 11,2
9L20DF 4261 4076 1799 624 1963 1800 11,8

WÄRTSILÄ TECHNICAL JOURNAL 01.2010
47in detail
Fig. 3 – Dimensions and weights of the Wärtsilä 20DF generating set.
Rated power
60 Hz 50 Hz
Engine type176, kW/cyl, 1 200 rpm 146 kW/cyl, 1 000 rpm
Engine kW Alternator kW* Engine kW Alternator kW*
6L20DF 1056 1014 876 841
8L20DF 1408 1352 1168 1121
9L20DF 1584 1521 1314 1261
* Assumed alternator efficiency 96%
Dimensions (mm), weights (tonnes)
Engine type A* E I* K L* Weight*
6L20DF 5325 2070 900/980/1030 1800 2688 17
8L20DF 6030 2070 1030/1080 1800 2824 20,9
9L20DF 6535 2300 1080/1130 1800 2874 24
* Preliminary: depends on generator type
WÄRTSILÄ 20DF GENERATING SET
Main data:Cylinder bore .........................................200 mmPiston stroke .........................................280 mmCylinder output ..........................146/176 kW/cylEngine speed ..........................1 000/1 200 rpmMean effective pressure ....................... 20.0 barPiston speed ..................................9.3/11.2 m/sGenerator voltage .............................0.4-13.8 kVGenerator efficiency .......................... 0.95-0.96
Fuel oil specification: ISO-F-DMX, DMA and DMB ISO 8217:2005(E)
SFOC 194/199 g/kWh at ISO conditions. Without engine driven pumps.Tolerance 5 %.
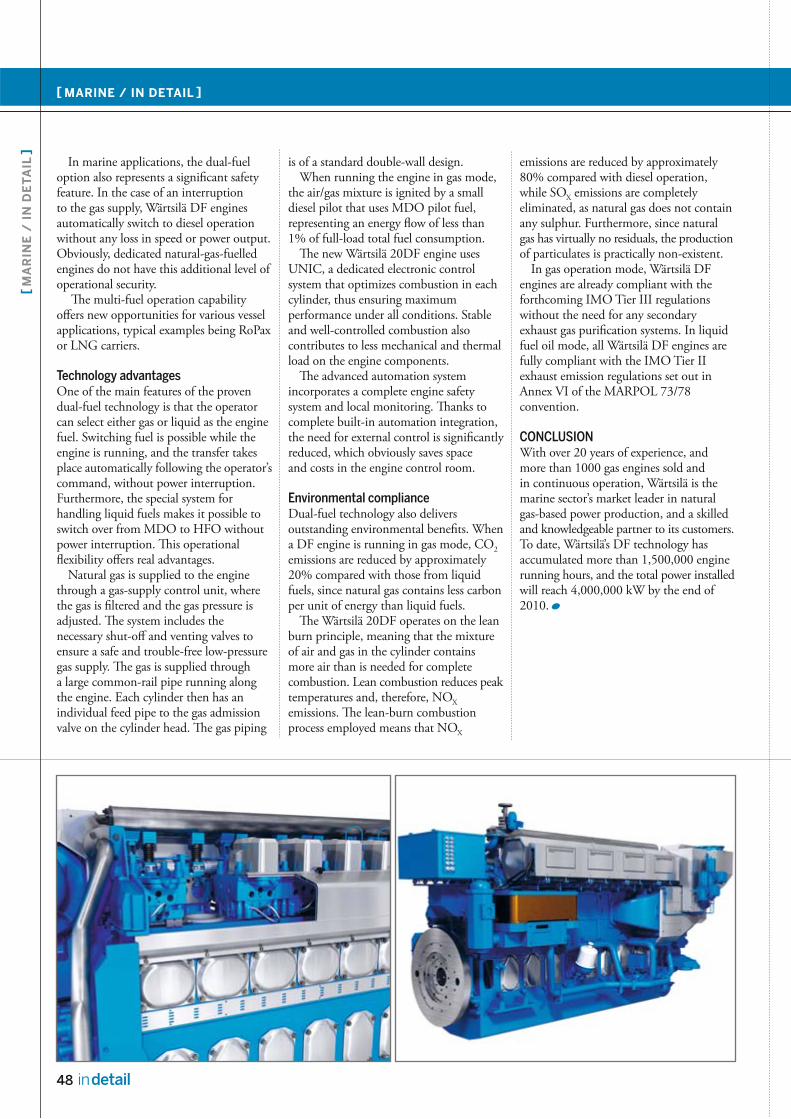
48 in detail
[ MARINE / IN DETAIL ]
[ M
AR
INE
/ I
N D
ET
AIL
]
In marine applications, the dual-fuel option also represents a significant safety feature. In the case of an interruption to the gas supply, Wärtsilä DF engines automatically switch to diesel operation without any loss in speed or power output. Obviously, dedicated natural-gas-fuelled engines do not have this additional level of operational security.
The multi-fuel operation capability offers new opportunities for various vessel applications, typical examples being RoPax or LNG carriers.
Technology advantagesOne of the main features of the proven dual-fuel technology is that the operator can select either gas or liquid as the engine fuel. Switching fuel is possible while the engine is running, and the transfer takes place automatically following the operator’s command, without power interruption. Furthermore, the special system for handling liquid fuels makes it possible to switch over from MDO to HFO without power interruption. This operational flexibility offers real advantages.
Natural gas is supplied to the engine through a gas-supply control unit, where the gas is filtered and the gas pressure is adjusted. The system includes the necessary shut-off and venting valves to ensure a safe and trouble-free low-pressure gas supply. The gas is supplied through a large common-rail pipe running along the engine. Each cylinder then has an individual feed pipe to the gas admission valve on the cylinder head. The gas piping
is of a standard double-wall design.When running the engine in gas mode,
the air/gas mixture is ignited by a small diesel pilot that uses MDO pilot fuel, representing an energy flow of less than 1% of full-load total fuel consumption.
The new Wärtsilä 20DF engine uses UNIC, a dedicated electronic control system that optimizes combustion in each cylinder, thus ensuring maximum performance under all conditions. Stable and well-controlled combustion also contributes to less mechanical and thermal load on the engine components.
The advanced automation system incorporates a complete engine safety system and local monitoring. Thanks to complete built-in automation integration, the need for external control is significantly reduced, which obviously saves space and costs in the engine control room.
Environmental complianceDual-fuel technology also delivers outstanding environmental benefits. When a DF engine is running in gas mode, CO2 emissions are reduced by approximately 20% compared with those from liquid fuels, since natural gas contains less carbon per unit of energy than liquid fuels.
The Wärtsilä 20DF operates on the lean burn principle, meaning that the mixture of air and gas in the cylinder contains more air than is needed for complete combustion. Lean combustion reduces peak temperatures and, therefore, NOX emissions. The lean-burn combustion process employed means that NOX
emissions are reduced by approximately 80% compared with diesel operation, while SOX emissions are completely eliminated, as natural gas does not contain any sulphur. Furthermore, since natural gas has virtually no residuals, the production of particulates is practically non-existent.
In gas operation mode, Wärtsilä DF engines are already compliant with the forthcoming IMO Tier III regulations without the need for any secondary exhaust gas purification systems. In liquid fuel oil mode, all Wärtsilä DF engines are fully compliant with the IMO Tier II exhaust emission regulations set out in Annex VI of the MARPOL 73/78 convention.
CONCLUSIONWith over 20 years of experience, and more than 1000 gas engines sold and in continuous operation, Wärtsilä is the marine sector’s market leader in natural gas-based power production, and a skilled and knowledgeable partner to its customers. To date, Wärtsilä’s DF technology has accumulated more than 1,500,000 engine running hours, and the total power installed will reach 4,000,000 kW by the end of 2010.
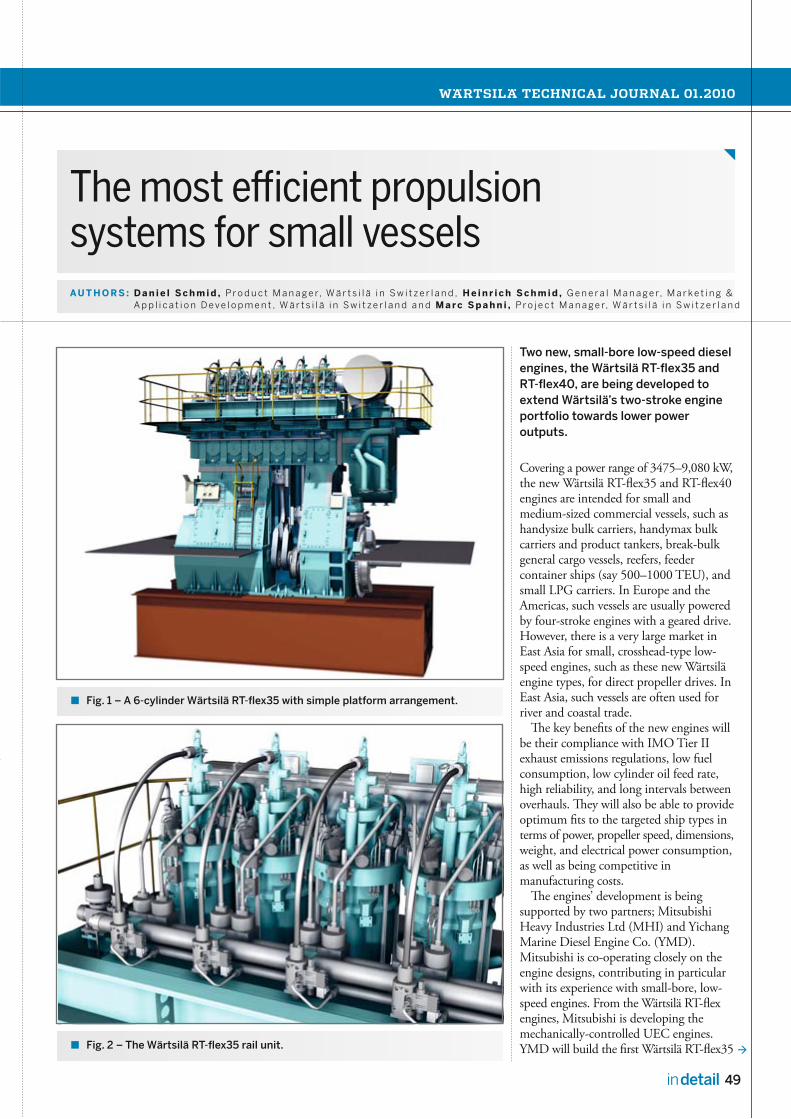
WÄRTSILÄ TECHNICAL JOURNAL 01.2010
49in detail
Fig. 1 – A 6-cylinder Wärtsilä RT-flex35 with simple platform arrangement.
Fig. 2 – The Wärtsilä RT-flex35 rail unit.
The most efficient propulsion systems for small vesselsAU T H O R S : D a n i e l S c h m i d , P r o d u c t M a n a g e r, W ä r t s i l ä i n S w i t z e r l a n d , H e i n r i c h S c h m i d , G e n e r a l M a n a g e r, M a r k e t i n g & A p p l i c a t i o n D e v e l o p m e n t , W ä r t s i l ä i n S w i t z e r l a n d a n d M a rc S p a h n i , P r o j e c t M a n a g e r, W ä r t s i l ä i n S w i t z e r l a n d
Two new, small-bore low-speed diesel engines, the Wärtsilä RT-flex35 and RT-flex40, are being developed to extend Wärtsilä’s two-stroke engine portfolio towards lower power outputs.
Covering a power range of 3475–9,080 kW, the new Wärtsilä RT-flex35 and RT-flex40 engines are intended for small and medium-sized commercial vessels, such as handysize bulk carriers, handymax bulk carriers and product tankers, break-bulk general cargo vessels, reefers, feeder container ships (say 500–1000 TEU), and small LPG carriers. In Europe and the Americas, such vessels are usually powered by four-stroke engines with a geared drive. However, there is a very large market in East Asia for small, crosshead-type low-speed engines, such as these new Wärtsilä engine types, for direct propeller drives. In East Asia, such vessels are often used for river and coastal trade.
The key benefits of the new engines will be their compliance with IMO Tier II exhaust emissions regulations, low fuel consumption, low cylinder oil feed rate, high reliability, and long intervals between overhauls. They will also be able to provide optimum fits to the targeted ship types in terms of power, propeller speed, dimensions, weight, and electrical power consumption, as well as being competitive in manufacturing costs.
The engines’ development is being supported by two partners; Mitsubishi Heavy Industries Ltd (MHI) and Yichang Marine Diesel Engine Co. (YMD). Mitsubishi is co-operating closely on the engine designs, contributing in particular with its experience with small-bore, low-speed engines. From the Wärtsilä RT-flex engines, Mitsubishi is developing the mechanically-controlled UEC engines. YMD will build the first Wärtsilä RT-flex35
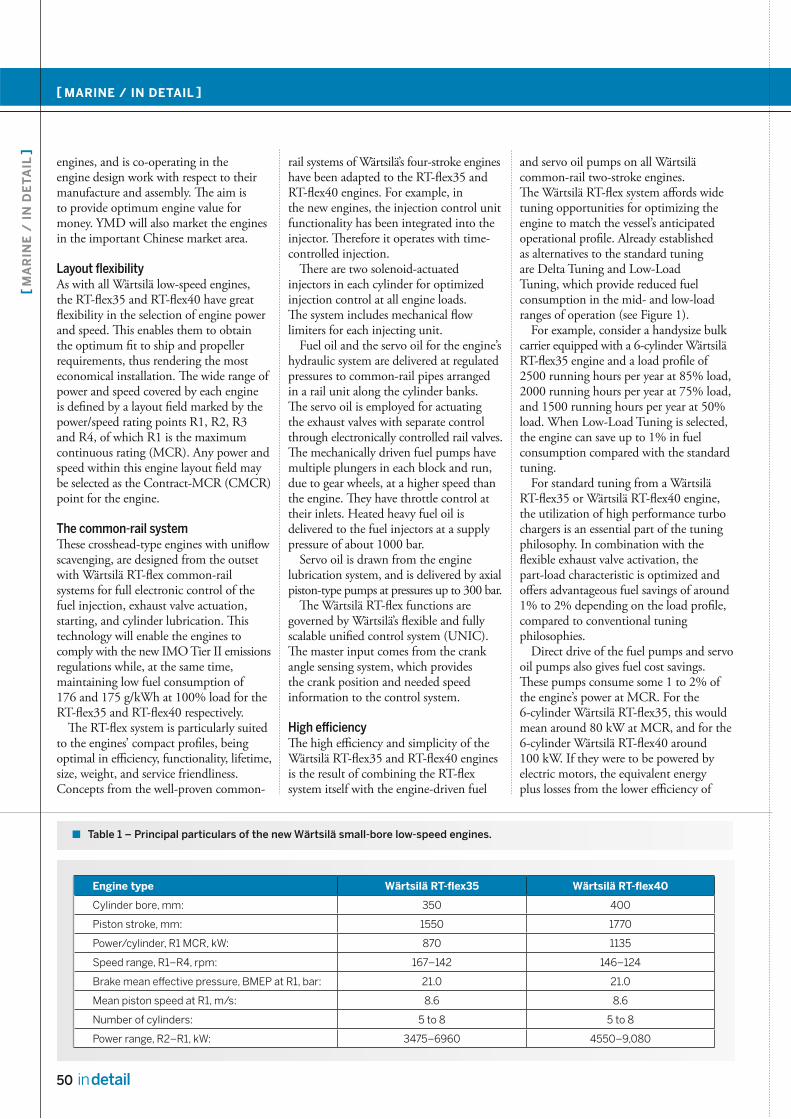
50 in detail
[ MARINE / IN DETAIL ]
[ M
AR
INE
/ I
N D
ET
AIL
]
engines, and is co-operating in the engine design work with respect to their manufacture and assembly. The aim is to provide optimum engine value for money. YMD will also market the engines in the important Chinese market area.
Layout flexibilityAs with all Wärtsilä low-speed engines, the RT-flex35 and RT-flex40 have great flexibility in the selection of engine power and speed. This enables them to obtain the optimum fit to ship and propeller requirements, thus rendering the most economical installation. The wide range of power and speed covered by each engine is defined by a layout field marked by the power/speed rating points R1, R2, R3 and R4, of which R1 is the maximum continuous rating (MCR). Any power and speed within this engine layout field may be selected as the Contract-MCR (CMCR) point for the engine.
The common-rail systemThese crosshead-type engines with uniflow scavenging, are designed from the outset with Wärtsilä RT-flex common-rail systems for full electronic control of the fuel injection, exhaust valve actuation, starting, and cylinder lubrication. This technology will enable the engines to comply with the new IMO Tier II emissions regulations while, at the same time, maintaining low fuel consumption of 176 and 175 g/kWh at 100% load for the RT-flex35 and RT-flex40 respectively.
The RT-flex system is particularly suited to the engines’ compact profiles, being optimal in efficiency, functionality, lifetime, size, weight, and service friendliness. Concepts from the well-proven common-
rail systems of Wärtsilä’s four-stroke engines have been adapted to the RT-flex35 and RT-flex40 engines. For example, in the new engines, the injection control unit functionality has been integrated into the injector. Therefore it operates with time- controlled injection.
There are two solenoid-actuated injectors in each cylinder for optimized injection control at all engine loads. The system includes mechanical flow limiters for each injecting unit.
Fuel oil and the servo oil for the engine’s hydraulic system are delivered at regulated pressures to common-rail pipes arranged in a rail unit along the cylinder banks. The servo oil is employed for actuating the exhaust valves with separate control through electronically controlled rail valves. The mechanically driven fuel pumps have multiple plungers in each block and run, due to gear wheels, at a higher speed than the engine. They have throttle control at their inlets. Heated heavy fuel oil is delivered to the fuel injectors at a supply pressure of about 1000 bar.
Servo oil is drawn from the engine lubrication system, and is delivered by axial piston-type pumps at pressures up to 300 bar.
The Wärtsilä RT-flex functions are governed by Wärtsilä’s flexible and fully scalable unified control system (UNIC). The master input comes from the crank angle sensing system, which provides the crank position and needed speed information to the control system.
High efficiencyThe high efficiency and simplicity of the Wärtsilä RT-flex35 and RT-flex40 engines is the result of combining the RT-flex system itself with the engine-driven fuel
and servo oil pumps on all Wärtsilä common-rail two-stroke engines. The Wärtsilä RT-flex system affords wide tuning opportunities for optimizing the engine to match the vessel’s anticipated operational profile. Already established as alternatives to the standard tuning are Delta Tuning and Low-Load Tuning, which provide reduced fuel consumption in the mid- and low-load ranges of operation (see Figure 1).
For example, consider a handysize bulk carrier equipped with a 6-cylinder Wärtsilä RT-flex35 engine and a load profile of 2500 running hours per year at 85% load, 2000 running hours per year at 75% load, and 1500 running hours per year at 50% load. When Low-Load Tuning is selected, the engine can save up to 1% in fuel consumption compared with the standard tuning.
For standard tuning from a Wärtsilä RT-flex35 or Wärtsilä RT-flex40 engine, the utilization of high performance turbo chargers is an essential part of the tuning philosophy. In combination with the flexible exhaust valve activation, the part-load characteristic is optimized and offers advantageous fuel savings of around 1% to 2% depending on the load profile, compared to conventional tuning philosophies.
Direct drive of the fuel pumps and servo oil pumps also gives fuel cost savings. These pumps consume some 1 to 2% of the engine’s power at MCR. For the 6-cylinder Wärtsilä RT-flex35, this would mean around 80 kW at MCR, and for the 6-cylinder Wärtsilä RT-flex40 around 100 kW. If they were to be powered by electric motors, the equivalent energy plus losses from the lower efficiency of
Table 1 – Principal particulars of the new Wärtsilä small-bore low-speed engines.
Engine type Wärtsilä RT-flex35 Wärtsilä RT-flex40
Cylinder bore, mm: 350 400
Piston stroke, mm: 1550 1770
Power/cylinder, R1 MCR, kW: 870 1135
Speed range, R1–R4, rpm: 167–142 146–124
Brake mean effective pressure, BMEP at R1, bar: 21.0 21.0
Mean piston speed at R1, m/s: 8.6 8.6
Number of cylinders: 5 to 8 5 to 8
Power range, R2–R1, kW: 3475–6960 4550–9,080

WÄRTSILÄ TECHNICAL JOURNAL 01.2010
51in detail
electrical drive would need to be provided by auxiliary engines. For the 6-cylinder Wärtsilä RT-flex35 it can be estimated that the fuel savings are around 0.5%. With the above engine’s load profile, 450 MWh per year would eventually need to be provided by the auxiliary engine if electrical pump drives were used.
Total fuel savings of 2.5% to 3% are achievable through the combination of the tuning opportunity, the high performance turbo charger with optimized exhaust valve activation, and the direct driven fuel and servo oil pumps. For the mentioned load profile, this results in savings of around 115 tonnes of heavy fuel oil per year. This gives cost savings of around USD 70,000 per year, assuming a price of USD 600 per tonne for heavy fuel oil.
In summary, there are significant savings in lifecycle costs to be obtained by opting for the Wärtsilä RT-flex35 and Wärtsilä
RT-flex40 engines in small and medium-sized ships powered by two-stroke engines:
■ Few cylinders for low maintenance costs ■ Low fuel consumption as standard for low operating costs
■ Delta Tuning or Low-Load Tuning for further reduced fuel costs
■ Direct propeller drive with fixed-pitch propeller for high propulsion efficiency, or with controllable-pitch propeller for high manoeuvrability
■ Engine-driven fuel and servo oil pumps for minimum electrical demand.
ApplicationsThe application range for the Wärtsilä RT-flex35 and RT-flex40 engines is quite broad as already mentioned.
The global fleet of handysize and handymax bulk carriers consists of some 3900 vessels. They have a typical speed in the range of 13.5–15 knots. Consider the
case of a typical handysize bulk carrier of 30,000 dwt. Its principal particulars could be:
■ Length overall = 178.0 m ■ Length bp = 170.0 m ■ Beam = 27.6 m ■ Draught = 10.2 m ■ Speed = 12.2 knots ■ Main engine: A 6-cylinder Wärtsilä RT-flex35, 5220 kW at 167 rpm
■ Daily fuel consumption at 85% load = 18.33 tonnes
If we consider also the application of these new, compact engines in small container vessels (less than 1000 TEU), the global fleet consists of about 1100 vessels. Their typical speeds are in the range of 16–19 knots. An 800 TEU vessel could have the following particulars:
■ Length overall = 140.0 m ■ Length bp = 132.0 m ■ Beam = 21.8 m ■ Draught = 7.4 m ■ Speed = 17.5 knots ■ Main engine: A 6-cylinder Wärtsilä RT-flex40, 6810 kW at 146 rpm
■ Daily fuel consumption at 85% load = 23.77 tonnes
Another application is for Handysize and Handymax tankers. The global fleet consists of about 2400 vessels. Their typical speed is in the range of 14-15 knots. An 35,000 dwt product tanker could have the following particulars:
■ Length overall = 176.0 m ■ Length bp = 169.0 m ■ Beam = 29.8 m ■ Draught = 10.6 m ■ Speed = 15.0 knots ■ Main engine: A 7-cylinder Wärtsilä RT-flex40, 7945 kW at 146 rpm
■ Daily fuel consumption at 85% load = 27.13 tonnes
First orders The first Wärtsilä RT-flex35 engine is due to be delivered in mid 2011, while the first Wärtsilä RT-flex40 engine is planned by the end of the first quarter 2012.
The first order for five 6-cylinder Wärtsilä RT-flex35 engines is already confirmed. YMD has signed a contract with Ningbo Donghai Shipping Co Ltd to deliver the engines for five new 17,000 dwt chemical tankers. The delivery of the first of the five engines is scheduled for August 2011.
Fig. 3 – Tuning opportunities and break specific fuel consumption (BSCF) of the Wärtsilä RT-flex35.
Fig. 4 – Turbo-charging system and supply pump unit of the Wärtsilä RT-flex35.
bsfc
, g/k
Wh
40% 50% 60% 70% 80% 90% 100%
load
Wärtsilä RT-flex35 R1 (Tier II)
182
180
178
176
174
172
170
168
166
Wärtsilä RT-flex Standard Wärtsilä RT-flex Delta Wärtsilä RT-flex Low-load
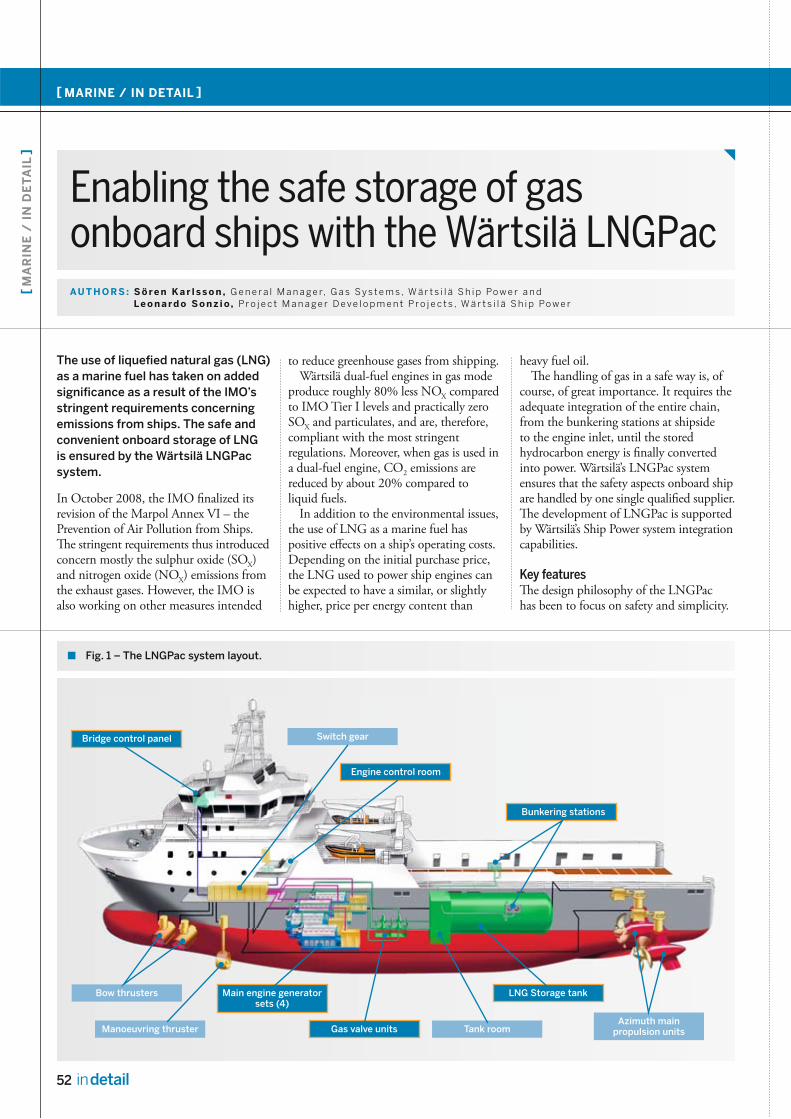
52 in detail
[ MARINE / IN DETAIL ]
[ M
AR
INE
/ I
N D
ET
AIL
]
Enabling the safe storage of gas onboard ships with the Wärtsilä LNGPac AU T H O R S : S ö re n K a r l s s o n , G e n e r a l M a n a g e r, G a s S y s t e m s , W ä r t s i l ä S h i p Po w e r a n d Le o n a rd o S o n z i o, P r o j e c t M a n a g e r D e v e l o p m e n t P r o j e c t s , W ä r t s i l ä S h i p Po w e r
The use of liquefi ed natural gas (LNG) as a marine fuel has taken on added signifi cance as a result of the IMO’s stringent requirements concerning emissions from ships. The safe and convenient onboard storage of LNG is ensured by the Wärtsilä LNGPac system.
In October 2008, the IMO fi nalized itsrevision of the Marpol Annex VI – the Prevention of Air Pollution from Ships.Th e stringent requirements thus introducedconcern mostly the sulphur oxide (SOX) and nitrogen oxide (NOX) emissions from the exhaust gases. However, the IMO is also working on other measures intended
to reduce greenhouse gases from shipping.Wärtsilä dual-fuel engines in gas mode
produce roughly 80% less NOX comparedto IMO Tier I levels and practically zeroSOX and particulates, and are, therefore,compliant with the most stringent regulations. Moreover, when gas is used ina dual-fuel engine, CO2 emissions are reduced by about 20% compared toliquid fuels.
In addition to the environmental issues,the use of LNG as a marine fuel has positive eff ects on a ship’s operating costs.Depending on the initial purchase price,the LNG used to power ship engines canbe expected to have a similar, or slightlyhigher, price per energy content than
heavy fuel oil.Th e handling of gas in a safe way is, of
course, of great importance. It requires the adequate integration of the entire chain,from the bunkering stations at shipside to the engine inlet, until the stored hydrocarbon energy is fi nally converted into power. Wärtsilä’s LNGPac system ensures that the safety aspects onboard shipare handled by one single qualifi ed supplier.Th e development of LNGPac is supportedby Wärtsilä’s Ship Power system integrationcapabilities.
Key featuresTh e design philosophy of the LNGPac has been to focus on safety and simplicity.
Fig. 1 – The LNGPac system layout.
Bridge control panel Switch gear
Engine control room
Bunkering stations
Bow thrusters
Manoeuvring thruster
Main engine generator sets (4)
Gas valve units Tank room
LNG Storage tank
Azimuth main propulsion units
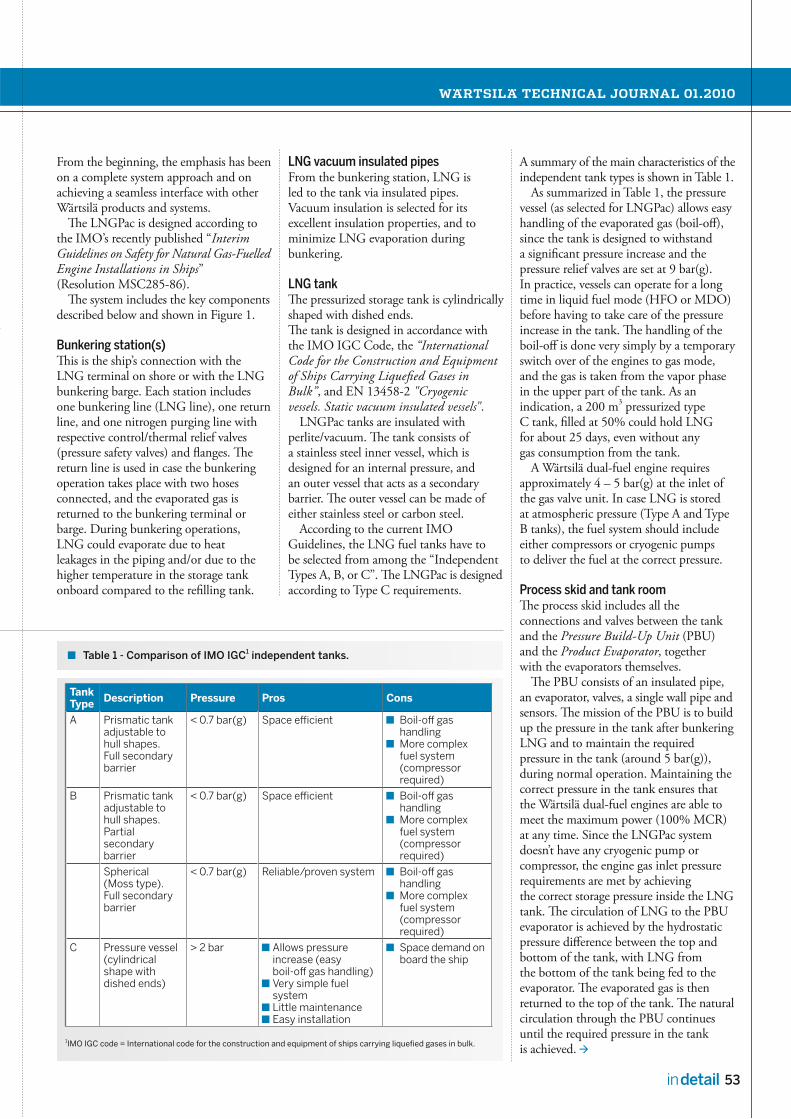
WÄRTSILÄ TECHNICAL JOURNAL 01.2010
53in detail
From the beginning, the emphasis has been on a complete system approach and on achieving a seamless interface with other Wärtsilä products and systems.
The LNGPac is designed according to the IMO’s recently published “Interim Guidelines on Safety for Natural Gas-FuelledEngine Installations in Ships” (Resolution MSC285-86).
The system includes the key components described below and shown in Figure 1.
Bunkering station(s)This is the ship’s connection with the LNG terminal on shore or with the LNG bunkering barge. Each station includes one bunkering line (LNG line), one return line, and one nitrogen purging line with respective control/thermal relief valves (pressure safety valves) and flanges. The return line is used in case the bunkering operation takes place with two hoses connected, and the evaporated gas is returned to the bunkering terminal or barge. During bunkering operations, LNG could evaporate due to heat leakages in the piping and/or due to the higher temperature in the storage tank onboard compared to the refilling tank.
LNG vacuum insulated pipesFrom the bunkering station, LNG is led to the tank via insulated pipes. Vacuum insulation is selected for its excellent insulation properties, and to minimize LNG evaporation during bunkering.
LNG tankThe pressurized storage tank is cylindrically shaped with dished ends. The tank is designed in accordance with the IMO IGC Code, the “International Code for the Construction and Equipment of Ships Carrying Liquefied Gases in Bulk”, and EN 13458-2 "Cryogenic vessels. Static vacuum insulated vessels".
LNGPac tanks are insulated with perlite/vacuum. The tank consists of a stainless steel inner vessel, which is designed for an internal pressure, and an outer vessel that acts as a secondary barrier. The outer vessel can be made of either stainless steel or carbon steel.
According to the current IMO Guidelines, the LNG fuel tanks have to be selected from among the “Independent Types A, B, or C”. The LNGPac is designed according to Type C requirements.
A summary of the main characteristics of the independent tank types is shown in Table 1.
As summarized in Table 1, the pressure vessel (as selected for LNGPac) allows easy handling of the evaporated gas (boil-off), since the tank is designed to withstand a significant pressure increase and the pressure relief valves are set at 9 bar(g). In practice, vessels can operate for a long time in liquid fuel mode (HFO or MDO) before having to take care of the pressure increase in the tank. The handling of the boil-off is done very simply by a temporary switch over of the engines to gas mode, and the gas is taken from the vapor phase in the upper part of the tank. As an indication, a 200 m3 pressurized type C tank, filled at 50% could hold LNG for about 25 days, even without any gas consumption from the tank.
A Wärtsilä dual-fuel engine requires approximately 4 – 5 bar(g) at the inlet of the gas valve unit. In case LNG is stored at atmospheric pressure (Type A and Type B tanks), the fuel system should include either compressors or cryogenic pumps to deliver the fuel at the correct pressure.
Process skid and tank room The process skid includes all the connections and valves between the tank and the Pressure Build-Up Unit (PBU)and the Product Evaporator, together with the evaporators themselves.
The PBU consists of an insulated pipe, an evaporator, valves, a single wall pipe and sensors. The mission of the PBU is to build up the pressure in the tank after bunkering LNG and to maintain the required pressure in the tank (around 5 bar(g)), during normal operation. Maintaining the correct pressure in the tank ensures that the Wärtsilä dual-fuel engines are able to meet the maximum power (100% MCR) at any time. Since the LNGPac system doesn’t have any cryogenic pump or compressor, the engine gas inlet pressure requirements are met by achieving the correct storage pressure inside the LNG tank. The circulation of LNG to the PBU evaporator is achieved by the hydrostatic pressure difference between the top and bottom of the tank, with LNG from the bottom of the tank being fed to the evaporator. The evaporated gas is then returned to the top of the tank. The natural circulation through the PBU continues until the required pressure in the tank is achieved.
Table 1 - Comparison of IMO IGC1 independent tanks.
Tank Type Description Pressure Pros Cons
A Prismatic tank adjustable to hull shapes. Full secondary barrier
< 0.7 bar(g) Space efficient Boil-off gas handling
More complex fuel system (compressor required)
B Prismatic tank adjustable to hull shapes. Partial secondary barrier
< 0.7 bar(g) Space efficient Boil-off gas handling
More complex fuel system (compressor required)
Spherical (Moss type). Full secondary barrier
< 0.7 bar(g) Reliable/proven system Boil-off gas handling
More complex fuel system (compressor required)
C Pressure vessel (cylindrical shape with dished ends)
> 2 bar Allows pressure increase (easy boil-off gas handling)
Very simple fuel system
Little maintenance Easy installation
Space demand on board the ship
1IMO IGC code = International code for the construction and equipment of ships carrying liquefied gases in bulk.
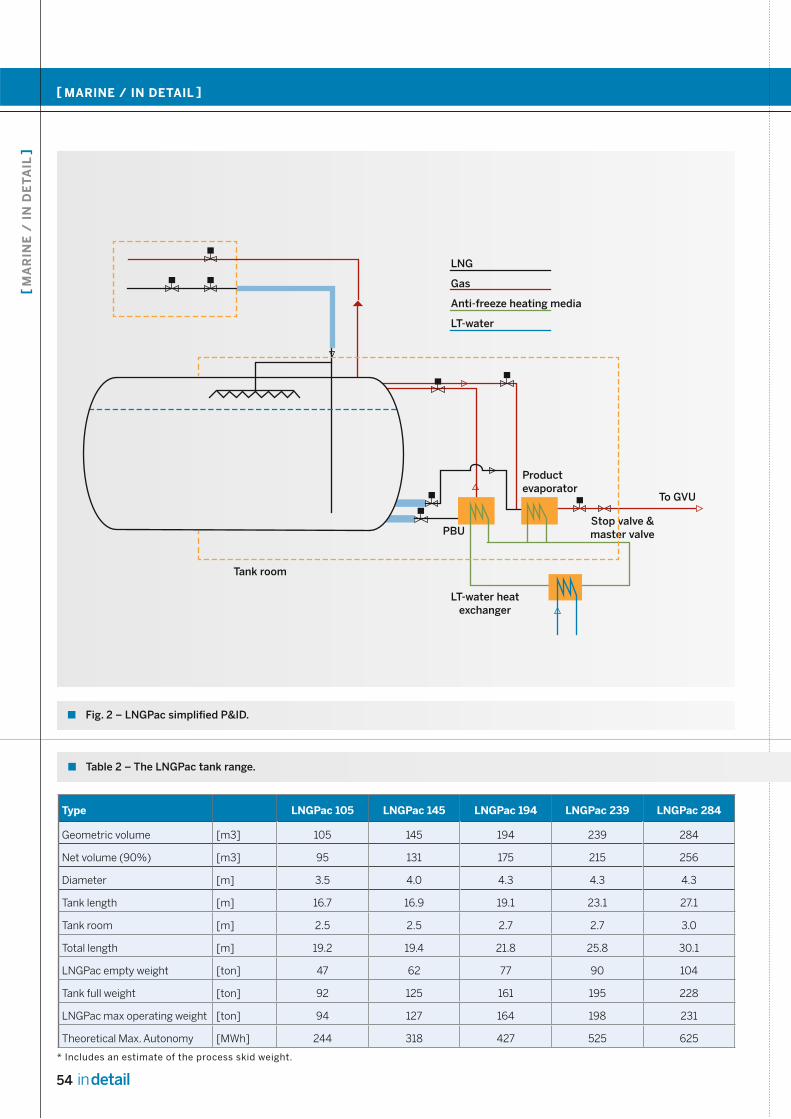
54 in detail
[ MARINE / IN DETAIL ]
[ M
AR
INE
/ I
N D
ET
AIL
]
Type LNGPac 105 LNGPac 145 LNGPac 194 LNGPac 239 LNGPac 284
Geometric volume [m3] 105 145 194 239 284
Net volume (90%) [m3] 95 131 175 215 256
Diameter [m] 3.5 4.0 4.3 4.3 4.3
Tank length [m] 16.7 16.9 19.1 23.1 27.1
Tank room [m] 2.5 2.5 2.7 2.7 3.0
Total length [m] 19.2 19.4 21.8 25.8 30.1
LNGPac empty weight [ton] 47 62 77 90 104
Tank full weight [ton] 92 125 161 195 228
LNGPac max operating weight [ton] 94 127 164 198 231
Theoretical Max. Autonomy [MWh] 244 318 427 525 625
Fig. 2 – LNGPac simplified P&ID.
Table 2 – The LNGPac tank range.
* Includes an estimate of the process skid weight.
Tank room
LT-water heat exchanger
To GVU
LNG
Gas
Anti-freeze heating media
LT-water
PBU
Product evaporator
Stop valve & master valve

WÄRTSILÄ TECHNICAL JOURNAL 01.2010
55in detail
The Product Evaporator circuit consists of an insulated pipe, an evaporator, valves, a single wall pipe, and sensors. The task of the product evaporator is to evaporate the LNG into gas and heat it to a minimum of 0°C as per engine specifications. The gas is then fed to the gas valve unit before the engines.
Both the PBU and Product Evaporator are heated by a water/glycol mixture, which is re-circulated to an external cooler. Here, the mixture is heated by the waste heat from the low temperature engine cooling water circuit.
The process skid has a modular design, making it easy to be selected and assembled for the entire LNGPac product range. The key parameters influencing the modularization of the process skid are the sizes and volume of the tank, and the engines (model and number) connected to the tank.
The tank room is a stainless steel barrier welded to the outer vessel of the tank. The structure contains the process skid and all the pipe penetrations to the tank. In the unlikely event of an LNG leakage, the tank room acts as a barrier that avoids damage to the external compartments, and facilitates the quick ventilation of the evaporated gas. The tank room and ventilation system are to be fire protected to A-60/A-0 insulation class, depending on the safety designation of the adjacent space.
Automation The LNGPac control system is based on Wärtsilä’s vessel automation system platform. When combined with the Wärtsilä Integrated Automation System (IAS), the same hardware and Human Machine Interface can be used throughout the vessel to operate the LNGPac, the dual-fuel (DF) engines, and the propulsion system. In addition, separately delivered features typical of DF-engine applications, have been incorporated into the Wärtsilä IAS. These include the Wärtsilä Operator’s Interface System (WOIS), Condition Based Maintenance (CBM), and monitoring of IMO Tier III* compliance in Emission Control Areas.
The core of the control system is a PLC cabinet placed in a safe area near the tank room. All LNGPac transmitters and intrinsically safe sensors, as well as all interfaces to external systems such as fire & alarm, gas detection, etc., originate from the cabinet. The pneumatic valves are controlled by solenoids placed in a safe area adjacent to the tank room and bunkering station(s).
In the case of ships retrofitted with LNGPac, the control system is able to operate as a separate system with monitors on the bridge and ECR (Engine Control Room), or by being integrated into the existing system.
The LNGPac portfolioLNGPac will be offered in various configurations that allow the installation of multiple tanks and gas valve units (GVUs), i.e. multiple engines. Table 2 below illustrates the most straightforward configuration (i.e. single tank installation).Inherent redundancy of the dual-fuel technologyThe superior redundancy and reliability of the dual-fuel technology has been taken into consideration by authorities when developing their rules for the use of gas as fuel on board ships. The possibility of switching over from gas to liquid fuel is considered as a valid methodology to achieve 100% redundancy in case of a leakage or a failure in the gas supply system.
The main redundancy requirements are summarized as being:
■ For single fuel installations (gas only), the fuel storage should be divided between two or more tanks of approximately equal size. The tanks should be located in separate compartments (Resolution MSC 285-86, 2.6.2.3).
■ In the case of leakage in a gas supply pipe making shutdown of the gas supply necessary, a secondary independent fuelsupply should be available. Alternatively,in the case of multi-engine installations, independent and separate gas supply systems for each engine or group of engines may be accepted. (Resolution MSC 285-86, 2.6.2.2).
* The Wärtsilä DF engine portfolio fulfils IMO Tier III in gas mode.
LNGPac 280 LNGPac 308 LNGPac 339 LNGPac 402 LNGPac 440 LNGPac 465 LNGPac 520 LNGPac 527
280 308 339 402 440 465 520 527
252 277 305 362 396 419 468 474
4.8 4.8 5.0 5.0 5.6 5.0 5.6 5.0
21.3 23.4 23.5 27.5 23.8 31.5 27.8 35.5
3.0 3.0 3.0 3.0 3.0 3.5 3.5 3.5
24.3 26.4 26.5 30.5 26.8 35.0 31.3 39.0
105 113 119 135 142 152 162 168
229 248 267 312 336 357 392 401
233 252 271 316 340 362 397 406
616 677 745 884 967 1022 1143 1159
Note: Data reported in the table are indications only and can be subject to change.
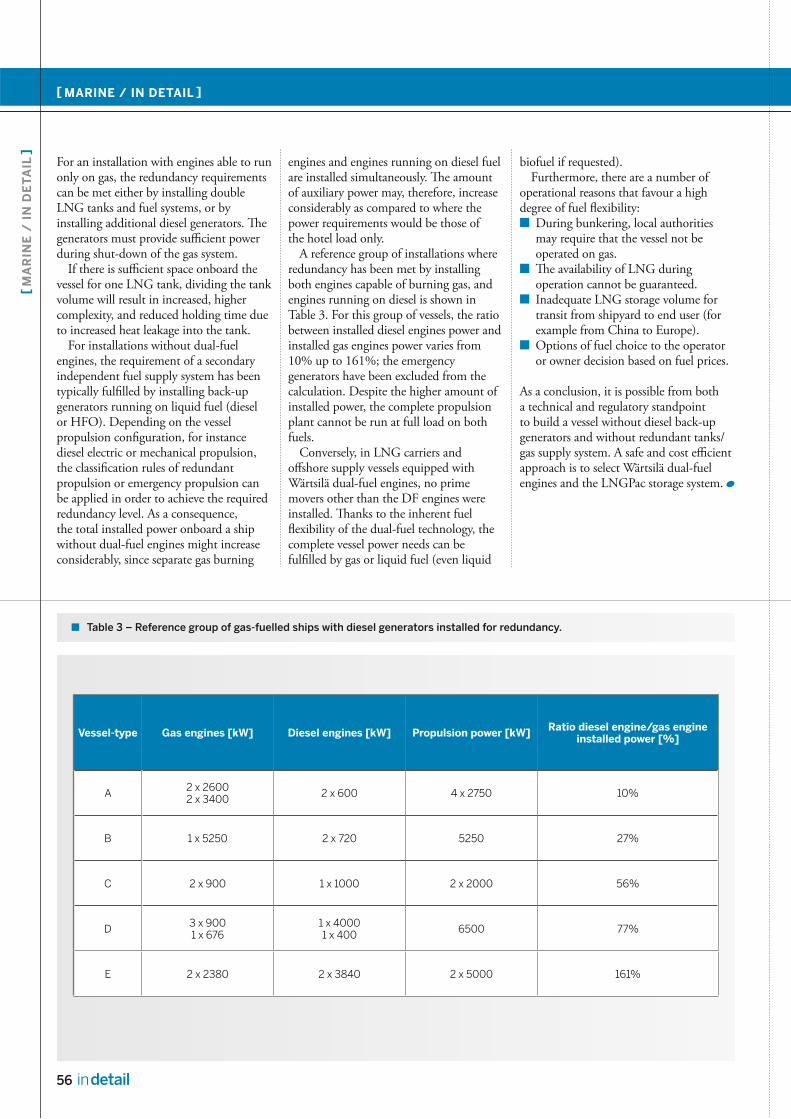
56 in detail
[ MARINE / IN DETAIL ]
[ M
AR
INE
/ I
N D
ET
AIL
]
For an installation with engines able to run only on gas, the redundancy requirements can be met either by installing double LNG tanks and fuel systems, or by installing additional diesel generators. The generators must provide sufficient power during shut-down of the gas system.
If there is sufficient space onboard the vessel for one LNG tank, dividing the tank volume will result in increased, higher complexity, and reduced holding time due to increased heat leakage into the tank.
For installations without dual-fuel engines, the requirement of a secondary independent fuel supply system has been typically fulfilled by installing back-up generators running on liquid fuel (diesel or HFO). Depending on the vessel propulsion configuration, for instance diesel electric or mechanical propulsion, the classification rules of redundant propulsion or emergency propulsion can be applied in order to achieve the required redundancy level. As a consequence, the total installed power onboard a ship without dual-fuel engines might increase considerably, since separate gas burning
engines and engines running on diesel fuel are installed simultaneously. The amount of auxiliary power may, therefore, increase considerably as compared to where the power requirements would be those of the hotel load only.
A reference group of installations where redundancy has been met by installing both engines capable of burning gas, and engines running on diesel is shown in Table 3. For this group of vessels, the ratio between installed diesel engines power and installed gas engines power varies from 10% up to 161%; the emergency generators have been excluded from the calculation. Despite the higher amount of installed power, the complete propulsion plant cannot be run at full load on both fuels.
Conversely, in LNG carriers and offshore supply vessels equipped with Wärtsilä dual-fuel engines, no prime movers other than the DF engines were installed. Thanks to the inherent fuel flexibility of the dual-fuel technology, the complete vessel power needs can be fulfilled by gas or liquid fuel (even liquid
biofuel if requested).Furthermore, there are a number of
operational reasons that favour a high degree of fuel flexibility:
■ During bunkering, local authorities may require that the vessel not be operated on gas.
■ The availability of LNG during operation cannot be guaranteed.
■ Inadequate LNG storage volume for transit from shipyard to end user (for example from China to Europe).
■ Options of fuel choice to the operator or owner decision based on fuel prices.
As a conclusion, it is possible from both a technical and regulatory standpoint to build a vessel without diesel back-up generators and without redundant tanks/gas supply system. A safe and cost efficient approach is to select Wärtsilä dual-fuel engines and the LNGPac storage system.
Table 3 – Reference group of gas-fuelled ships with diesel generators installed for redundancy.
Vessel-type Gas engines [kW] Diesel engines [kW] Propulsion power [kW] Ratio diesel engine/gas engine installed power [%]
A 2 x 26002 x 3400 2 x 600 4 x 2750 10%
B 1 x 5250 2 x 720 5250 27%
C 2 x 900 1 x 1000 2 x 2000 56%
D 3 x 9001 x 676
1 x 40001 x 400 6500 77%
E 2 x 2380 2 x 3840 2 x 5000 161%

WÄRTSILÄ TECHNICAL JOURNAL 01.2010
57in detail
Making the most of perfect maintenance timing
AU T H O R S : Ta ge K l o c k a r s , G e n e r a l M a n a g e r, S e r v i c e A g r e e m e n t s D e v e l o p - m e n t , W ä r t s i l ä S e r v i c e s , A l ex a n d re Ey ke r m a n , S a l e s D i r e c t o r, L N G , C N G , W ä r t s i l ä S h i p Po w e r a n d I r è n e M a y r, A s s i s t a n t , C o m - m u n i c a t i o n s , W ä r t s i l ä S h i p Po w e r i n S w i t z e r l a n d
Wärtsilä’s new technical management concepts cuts costs for ship owners by online monitoring and dynamic maintenance planning
Wärtsilä has developed a condition monitoring (CM) system for its latest design Wärtsilä engines and thrusters. This provides operators with a summarized report enabling corrective actions to be taken onboard.
Wärtsilä feeds the parameters into its database where the data is evaluated by the CM centre. Together with the results of visual checks, forecasting trends are then reviewed by the CM centre. The group analyses the recommendations and makes a risk assessment. Based on this, the tasks are then agreed upon and reports for classification societies are produced.
Fig. 1 – Partners with the same goal, Wärtsilä and customers working together for optimal results.
Data from equipment system
Operating crew reporting
+
Measurements
Send the data to centralized database
Wise LT reportInventoryWork doneUnscheduled
Fuels, lubes analysis
Online report
Risk evaluation with contract manager
and customer
Execution of inspections according to schedule
Report findings
CBM reports Measurements based
on analysis update Work cards Spares scheduling Workforce scheduling Logistics and
coordination report Recommendations
actions needed
Maintenance Planning
When we can measure and analyze, we can optimize the operation and predict the maintenance need.
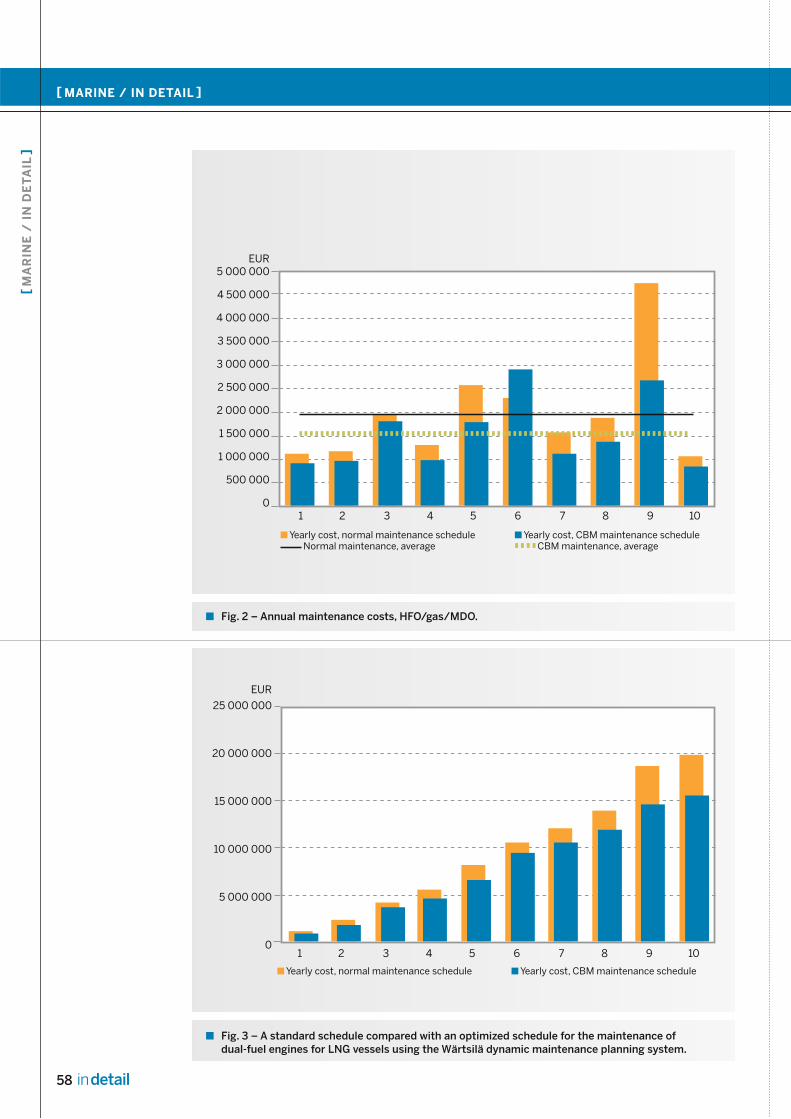
58 in detail
[ MARINE / IN DETAIL ]
[ M
AR
INE
/ I
N D
ET
AIL
]
Fig. 2 – Annual maintenance costs, HFO/gas/MDO.
Fig. 3 – A standard schedule compared with an optimized schedule for the maintenance of dual-fuel engines for LNG vessels using the Wärtsilä dynamic maintenance planning system.
1 2 3 4 5 6 7 8 9 10
EUR 5 000 000
4 500 000
4 000 000
3 500 000
3 000 000
2 500 000
2 000 000
1 500 000
1 000 000
500 000
0
Yearly cost, normal maintenance schedule Normal maintenance, average
Yearly cost, CBM maintenance schedule CBM maintenance, average
1 2 3 4 5 6 7 8 9 10
EUR
25 000 000
20 000 000
15 000 000
10 000 000
5 000 000
0
Yearly cost, normal maintenance schedule Yearly cost, CBM maintenance schedule

WÄRTSILÄ TECHNICAL JOURNAL 01.2010
59in detail
Fig. 4 - DMP makes use of the existing online 24/7 infrastructure.
The dynamic maintenance plan (DMP) is a flexible maintenance schedule designed to extend maintenance intervals and reduce spare parts consumption. The latest Wärtsilä designed engines and thrusters are serviced precisely when, and only when needed, thus reducing costs significantly.
Maintenance is then carried out according to the actual need based on the CBM reports, visual inspections, oil and fuel analyses, other operational information, and regular meetings with the customer.
Dynamic maintenance plans have several advantages over scheduled maintenance. They ensure up to date reporting and regular risk assessments, lower overall maintenance costs and downtime, and they allow the use of existing technology and Wärtsilä’s large database. They are very cost transparent and are available in customized service-packages that fit the exact needs of the ship owner.
Customer benefitsThe customer benefits begin with soft advantages. An engine can have up to
350 set points and up to 90 or even 120 monitoring points. Since the engines are monitored regularly, the collected data supplies a solid basis for reliable analysis and up to date reporting. The ship owner knows exactly in what shape his engines and their components are.
Wärtsilä feeds the parameters into its database where the data is evaluated by CBM. Together with the results of visual checks, forecasting trends are then reviewed by the CM team. The CM team then makes an analysis, prepares a risk assessment and submits recommendations for maintaining ideal running conditions. The necessary tasks are then agreed upon and reports for classification societies are produced.
Major overhaul targets of between 24,000 to 36,000 hours for engines, depending on operations and fuel, and 40,000 to 56,000 hours for thrusters once every 10 years, are realistic.
Quantifiable advantagesThe quantifiable advantages of DMP are reduced operating costs. Average savings are in the 3% range through reduced fuel/lube oil consumption, and from 5% to 15% through reduced maintenance costs. Because components are monitored constantly, dynamic maintenance localises trends in decreasing performance. Service at the appropriate time increases component life.
For example, the Wärtsilä 46 engine’s overhaul target was recently increased from 16,000 to 20,000 hours, running on HFO, and with continuous monitoring the expectation is to reach a target of 24,000 hours.
Dynamic maintenance schedules also reduce the number of unplanned stops. More than 9 years of experience with the CBM tool indicates that unplanned maintenance can be reduced to a level of just 5%, as opposed to a planned schedule. Because trends are monitored and analyzed, any performance decrease can be recognized, located, and rectified before a problem
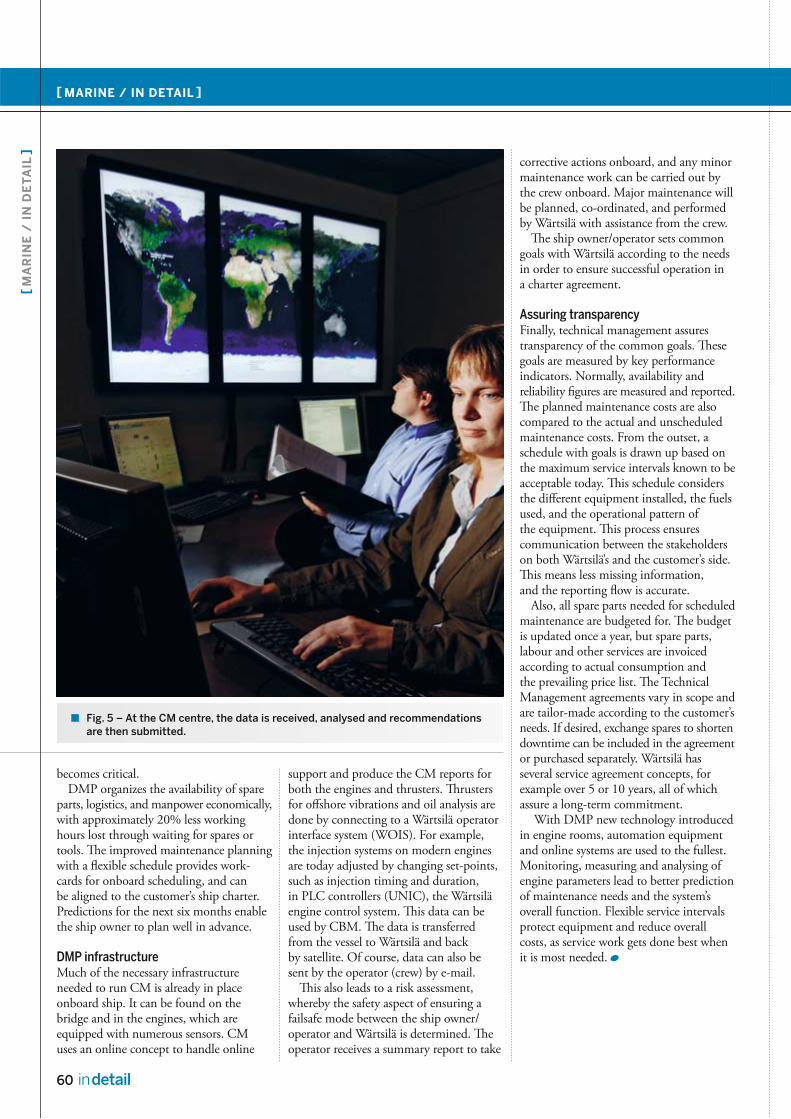
60 in detail
[ MARINE / IN DETAIL ]
[ M
AR
INE
/ I
N D
ET
AIL
]
becomes critical. DMP organizes the availability of spare
parts, logistics, and manpower economically, with approximately 20% less working hours lost through waiting for spares or tools. The improved maintenance planning with a flexible schedule provides work-cards for onboard scheduling, and can be aligned to the customer’s ship charter. Predictions for the next six months enable the ship owner to plan well in advance.
DMP infrastructureMuch of the necessary infrastructure needed to run CM is already in place onboard ship. It can be found on the bridge and in the engines, which are equipped with numerous sensors. CM uses an online concept to handle online
support and produce the CM reports for both the engines and thrusters. Thrusters for offshore vibrations and oil analysis are done by connecting to a Wärtsilä operator interface system (WOIS). For example, the injection systems on modern engines are today adjusted by changing set-points, such as injection timing and duration, in PLC controllers (UNIC), the Wärtsilä engine control system. This data can be used by CBM. The data is transferred from the vessel to Wärtsilä and back by satellite. Of course, data can also be sent by the operator (crew) by e-mail.
This also leads to a risk assessment, whereby the safety aspect of ensuring a failsafe mode between the ship owner/operator and Wärtsilä is determined. The operator receives a summary report to take
corrective actions onboard, and any minor maintenance work can be carried out by the crew onboard. Major maintenance will be planned, co-ordinated, and performed by Wärtsilä with assistance from the crew.
The ship owner/operator sets common goals with Wärtsilä according to the needs in order to ensure successful operation in a charter agreement.
Assuring transparencyFinally, technical management assures transparency of the common goals. These goals are measured by key performance indicators. Normally, availability and reliability figures are measured and reported. The planned maintenance costs are also compared to the actual and unscheduled maintenance costs. From the outset, a schedule with goals is drawn up based on the maximum service intervals known to be acceptable today. This schedule considers the different equipment installed, the fuels used, and the operational pattern of the equipment. This process ensures communication between the stakeholders on both Wärtsilä’s and the customer’s side. This means less missing information, and the reporting flow is accurate.
Also, all spare parts needed for scheduled maintenance are budgeted for. The budget is updated once a year, but spare parts, labour and other services are invoiced according to actual consumption and the prevailing price list. The Technical Management agreements vary in scope and are tailor-made according to the customer’s needs. If desired, exchange spares to shorten downtime can be included in the agreement or purchased separately. Wärtsilä has several service agreement concepts, for example over 5 or 10 years, all of which assure a long-term commitment.
With DMP new technology introduced in engine rooms, automation equipment and online systems are used to the fullest. Monitoring, measuring and analysing of engine parameters lead to better prediction of maintenance needs and the system’s overall function. Flexible service intervals protect equipment and reduce overall costs, as service work gets done best when it is most needed.
Fig. 5 – At the CM centre, the data is received, analysed and recommendations are then submitted.
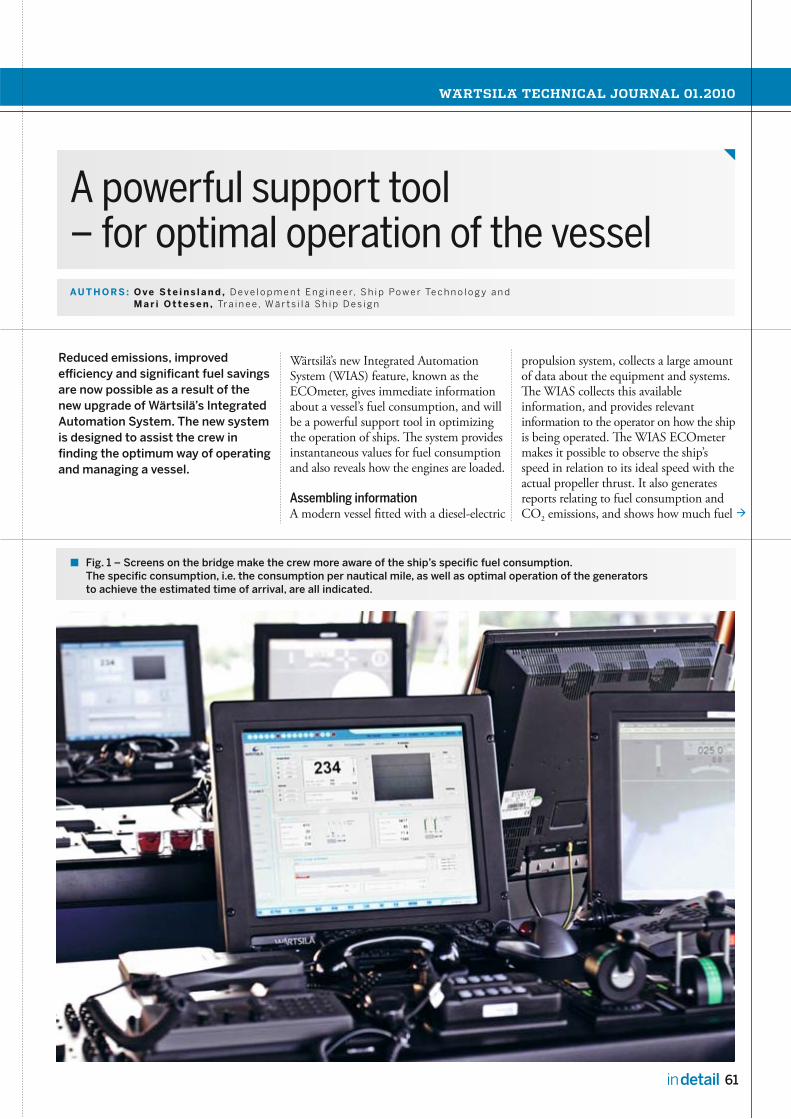
WÄRTSILÄ TECHNICAL JOURNAL 01.2010
61in detail
A powerful support tool – for optimal operation of the vesselAU T H O R S : O ve S t e i n s l a n d , D e v e l o p m e n t E n g i n e e r, S h i p Po w e r Te c h n o l o g y a n d M a r i O t t e s e n , Tr a i n e e , W ä r t s i l ä S h i p D e s i g n
Reduced emissions, improved efficiency and significant fuel savings are now possible as a result of the new upgrade of Wärtsilä’s Integrated Automation System. The new system is designed to assist the crew in finding the optimum way of operating and managing a vessel.
Wärtsilä’s new Integrated Automation System (WIAS) feature, known as the ECOmeter, gives immediate information about a vessel’s fuel consumption, and will be a powerful support tool in optimizing the operation of ships. The system provides instantaneous values for fuel consumption and also reveals how the engines are loaded.
Assembling information A modern vessel fitted with a diesel-electric
propulsion system, collects a large amount of data about the equipment and systems. The WIAS collects this available information, and provides relevant information to the operator on how the ship is being operated. The WIAS ECOmeter makes it possible to observe the ship’s speed in relation to its ideal speed with the actual propeller thrust. It also generates reports relating to fuel consumption and CO2 emissions, and shows how much fuel
Fig. 1 – Screens on the bridge make the crew more aware of the ship’s specific fuel consumption. The specific consumption, i.e. the consumption per nautical mile, as well as optimal operation of the generators to achieve the estimated time of arrival, are all indicated.
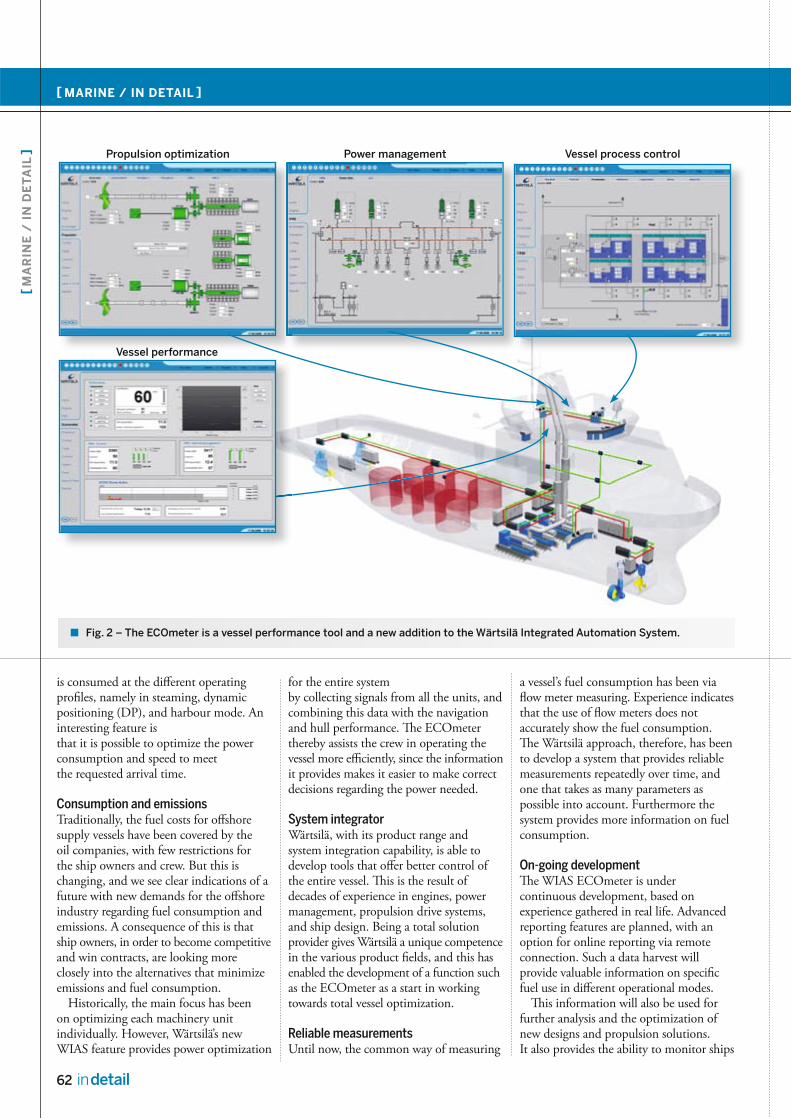
62 in detail
[ MARINE / IN DETAIL ]
[ M
AR
INE
/ I
N D
ET
AIL
]
is consumed at the diff erent operating profi les, namely in steaming, dynamic positioning (DP), and harbour mode. An interesting feature isthat it is possible to optimize the powerconsumption and speed to meet the requested arrival time.
Consumption and emissions Traditionally, the fuel costs for off shore supply vessels have been covered by the oil companies, with few restrictions for the ship owners and crew. But this is changing, and we see clear indications of a future with new demands for the off shore industry regarding fuel consumption andemissions. A consequence of this is thatship owners, in order to become competitive and win contracts, are looking more closely into the alternatives that minimize emissions and fuel consumption.
Historically, the main focus has been on optimizing each machinery unit individually. However, Wärtsilä’s new WIAS feature provides power optimization
for the entire systemby collecting signals from all the units, and combining this data with the navigation and hull performance. Th e ECOmeter thereby assists the crew in operating the vessel more effi ciently, since the informationit provides makes it easier to make correct decisions regarding the power needed.
System integratorWärtsilä, with its product range and system integration capability, is able to develop tools that off er better control ofthe entire vessel. Th is is the result ofdecades of experience in engines, powermanagement, propulsion drive systems,and ship design. Being a total solutionprovider gives Wärtsilä a unique competencein the various product fi elds, and this has enabled the development of a function such as the ECOmeter as a start in working towards total vessel optimization.
Reliable measurements Until now, the common way of measuring
a vessel’s fuel consumption has been viafl ow meter measuring. Experience indicatesthat the use of fl ow meters does not accurately show the fuel consumption. Th e Wärtsilä approach, therefore, has beento develop a system that provides reliablemeasurements repeatedly over time, andone that takes as many parameters aspossible into account. Furthermore the system provides more information on fuelconsumption.
On-going developmentTh e WIAS ECOmeter is under continuous development, based on experience gathered in real life. Advanced reporting features are planned, with an option for online reporting via remote connection. Such a data harvest will provide valuable information on specifi c fuel use in diff erent operational modes.
Th is information will also be used for further analysis and the optimization ofnew designs and propulsion solutions. It also provides the ability to monitor ships
Fig. 2 – The ECOmeter is a vessel performance tool and a new addition to the Wärtsilä Integrated Automation System.
Power managementPropulsion optimization Vessel process control
Vessel performance
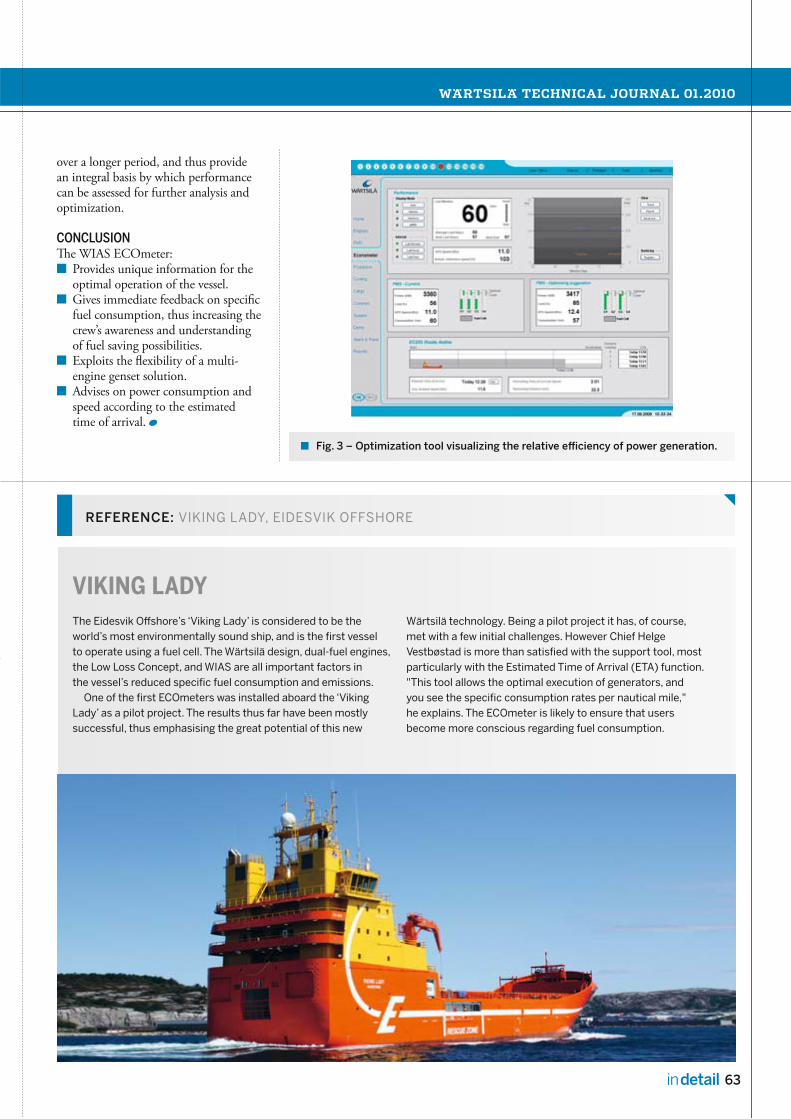
WÄRTSILÄ TECHNICAL JOURNAL 01.2010
63in detail
over a longer period, and thus provide an integral basis by which performance can be assessed for further analysis and optimization.
CONCLUSIONThe WIAS ECOmeter:
■ Provides unique information for the optimal operation of the vessel.
■ Gives immediate feedback on specific fuel consumption, thus increasing the crew’s awareness and understanding of fuel saving possibilities.
■ Exploits the flexibility of a multi-engine genset solution.
■ Advises on power consumption and speed according to the estimated time of arrival.
Fig. 3 – Optimization tool visualizing the relative efficiency of power generation.
REFERENCE: VIKING LADY, EIDESVIK OFFSHORE
VIKING LADY The Eidesvik Offshore’s ‘Viking Lady’ is considered to be the world’s most environmentally sound ship, and is the first vessel to operate using a fuel cell. The Wärtsilä design, dual-fuel engines, the Low Loss Concept, and WIAS are all important factors in the vessel’s reduced specific fuel consumption and emissions.
One of the first ECOmeters was installed aboard the ‘Viking Lady’ as a pilot project. The results thus far have been mostly successful, thus emphasising the great potential of this new
Wärtsilä technology. Being a pilot project it has, of course, met with a few initial challenges. However Chief Helge Vestbøstad is more than satisfied with the support tool, most particularly with the Estimated Time of Arrival (ETA) function. "This tool allows the optimal execution of generators, and you see the specific consumption rates per nautical mile," he explains. The ECOmeter is likely to ensure that users become more conscious regarding fuel consumption.
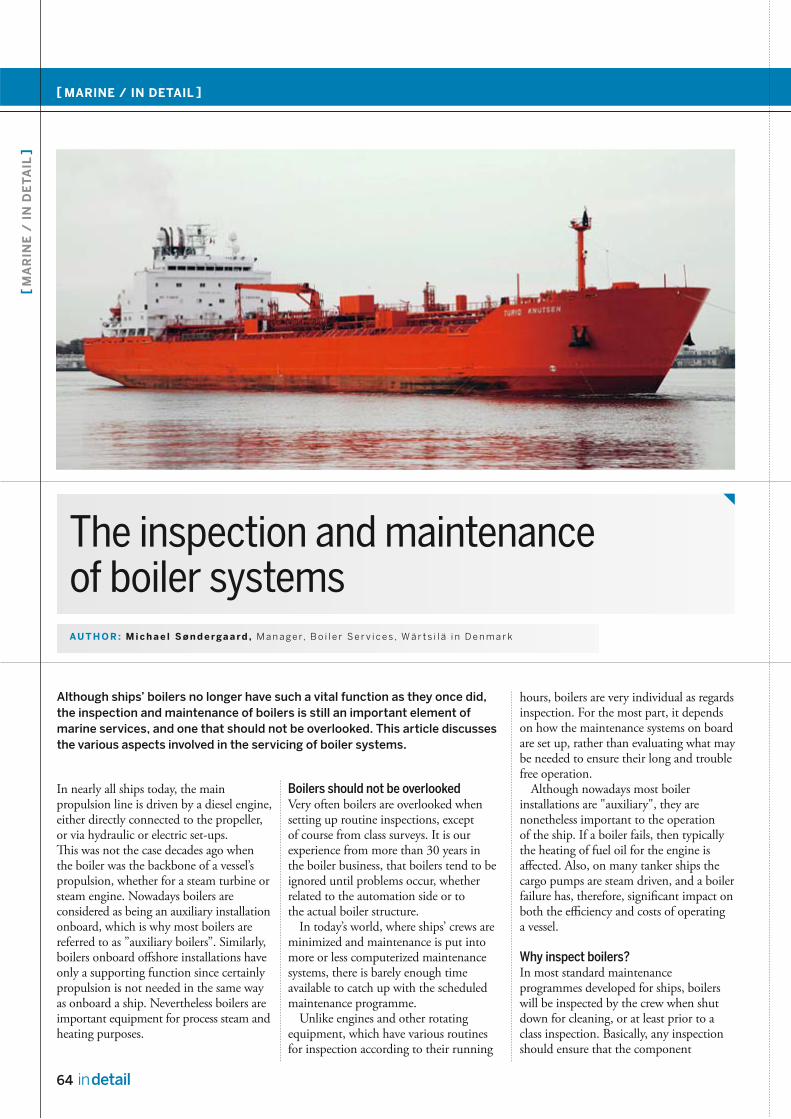
64 in detail
[ MARINE / IN DETAIL ]
[ M
AR
INE
/ I
N D
ET
AIL
]
The inspection and maintenance of boiler systemsAU T H O R : M i c h a e l S ø n d e rga a rd , M a n a g e r, B o i l e r S e r v i c e s , W ä r t s i l ä i n D e n m a r k
In nearly all ships today, the main propulsion line is driven by a diesel engine, either directly connected to the propeller, or via hydraulic or electric set-ups. This was not the case decades ago when the boiler was the backbone of a vessel’s propulsion, whether for a steam turbine or steam engine. Nowadays boilers are considered as being an auxiliary installation onboard, which is why most boilers are referred to as ”auxiliary boilers”. Similarly, boilers onboard offshore installations have only a supporting function since certainly propulsion is not needed in the same way as onboard a ship. Nevertheless boilers are important equipment for process steam and heating purposes.
Boilers should not be overlooked Very often boilers are overlooked when setting up routine inspections, except of course from class surveys. It is our experience from more than 30 years in the boiler business, that boilers tend to be ignored until problems occur, whether related to the automation side or to the actual boiler structure.
In today’s world, where ships’ crews are minimized and maintenance is put into more or less computerized maintenance systems, there is barely enough time available to catch up with the scheduled maintenance programme.
Unlike engines and other rotating equipment, which have various routines for inspection according to their running
Although ships’ boilers no longer have such a vital function as they once did, the inspection and maintenance of boilers is still an important element of marine services, and one that should not be overlooked. This article discusses the various aspects involved in the servicing of boiler systems.
hours, boilers are very individual as regards inspection. For the most part, it depends on how the maintenance systems on board are set up, rather than evaluating what may be needed to ensure their long and trouble free operation.
Although nowadays most boiler installations are "auxiliary", they are nonetheless important to the operation of the ship. If a boiler fails, then typically the heating of fuel oil for the engine is affected. Also, on many tanker ships the cargo pumps are steam driven, and a boiler failure has, therefore, significant impact on both the efficiency and costs of operating a vessel.
Why inspect boilers? In most standard maintenance programmes developed for ships, boilers will be inspected by the crew when shut down for cleaning, or at least prior to a class inspection. Basically, any inspection should ensure that the component

WÄRTSILÄ TECHNICAL JOURNAL 01.2010
65in detail
inspected is checked for any defects and that it is still fit for further operation, and this is true also for boilers.
Boiler designs typically leave very limited possibilities for the crew to carry out an inspection. Consequently, inspections are often limited to just the furnace and gas uptakes as these are opened anyway for cleaning. However, the water and steam areas are equally important but are sometimes ignored as this requires more boiler downtime, and because the access openings are generally quite small and, for many boiler designs, difficult to enter.
Even if the crew does perform an inspection, many defects might not be reported, simply because the crew members lack the knowledge and experience to spot them.
It is a fact that if a small defect in a boiler is not discovered, it will become bigger and over time lead to some form of failure.
When to inspect In addition to inspections and routine maintenance from the crew, a regular inspection plan should be set up by a qualified and specialized company. Wärtsilä Boiler Services provides this service to a number of its clients’ fleets. The service includes scheduled inspections, performance testing, and pre-docking inspections – as well as any repairs found necessary and recommendable.
The recommended frequency of boiler
structural inspections will vary depending on their actual operating conditions. For example, on board some tanker ships the boilers are mainly used for cargo operations in port, whereas when at sea, the steam supply is provided by economizers on the main engine exhaust.
Chemical tankers on the other hand, use the boilers almost continuously at various loads, both in port and at sea, for frequent tank cleaning due to the different types of cargo carried. The recommended frequency of inspection obviously varies when comparing these two operating conditions. In both cases, however, the aim is to ensure trouble-free long-term operation.
In an offshore installation boilers are mostly used in connection with the process equipment, in which case the inspection plan will be slightly different. Because the boilers are in almost constant operation, the inspections should be planned together with a regular shutdown of the plant, or at least a shutdown of that part of the installation which is related to the boilers.
What is included in a service package? Boiler inspection plans carried out by Wärtsilä Boiler Services will be customized according to the boiler design, actual operating conditions, and any relevant background information concerning the plant, such as repairs carried out in the past that need to be checked.
An inspection of the boiler structure
requires the plant to be shut down for some time. Typically, 36 hours is sufficient time to allow for cooling and inspection. Time is also needed to open access points, since there will be some mechanical work involved, and new gaskets etc. will be needed for boxing up after the inspection.
The inspection may be carried out as an independent job, but usually it is timed so that the crew can carry out routine planned maintenance whilst the plant is shut down.
It may be wise, therefore, to have some refractory and insulation materials readily at hand so that everything can be completed at the same time.
Depending on the boiler design, or possibly due to previous experience, it may be necessary to use advanced equipment, such as an endoscope, to inspect areas which otherwise would be impossible to reach due to physical limitations. Wärtsilä has an advanced type of endoscope available at several locations worldwide, including options for video recording and sophisticated measuring using infrared technology. Very often thickness gauging by ultrasonic equipment is used to verify the conditions of the tubes, shell and other pressure parts that are likely to fail.
Often the structural inspection is linked with a so-called performance test of the plant upon start up, or to a regular class survey. This covers the testing of all safety aspects, its operation, and so on.
Many boiler plants also need qualified
Fig. 2 – Checking control panel functions. Fig. 3 – Conducting a boiler performance test.

66 in detail
[ MARINE / IN DETAIL ]
[ M
AR
INE
/ I
N D
ET
AIL
]
adjustments between dry-dockings in order to ensure that they are operating cost-effectively, and that the emissions can be verified as being within given limits. Furthermore, an optimized combustion will lead to fewer deposits in the boiler, again resulting in less need for cleaning and easier maintenance.
Upon completion of the inspection, a report on the findings will be issued together with pictures if relevant and possible. Any recommended repairs will be specified and quoted for separately. For performance testing, a checklist will be followed and any applicable notations made separately. The combustion quality at various loads is verified by print outs from the test equipment. If necessary, a list of needed spares is issued as well.
New 0.1% sulphur limit The MARPOL Annex VI relating to the use of low sulphur fuels in the SECA area, has been further strengthened, and only fuels with a sulphur level of 0.1% or lower will be permitted as from January 2010.
In practice this rules out the use of HFO as a fuel for the boilers since it is not presently available with this low a sulphur limit. It means distillate fuels will be used, including MDO/MGO’s such as the DMA type, as specified in the ISO 8217 fuel standard. This will have a great impact on most boiler installations in operation as this fuel has a very low viscosity, for
which older fuel pumps are not designed. Moreover, the onboard installations are
individually designed for heated fuels, which mean that there may be problems with the new fuels as regards temperature increases. The minimum viscosity is set at 40°C, whereas experience shows that very often temperatures in the fuel line can easily reach 55-60°C. This temperature increase results in an even lower viscosity, even down to 1cSt at which point no standard fuel pump is reliable in operation.
There may also be problems with leaking shaft seals, flanges, valves, etc. due to this fuel being very light and vaporous by nature. Furthermore, the burner unit may need readjusting because of the higher calorific values of these fuels.
In the USA, California has strengthened its regulations, and has enforced a 0.5% sulphur limit within 24 nautical miles of the baseline, effective from July 1, 2009. By January 1, 2012 this will be lowered to 0.1% as is the case in the EU. The MARPOL Annex VI is also proposing that this emission control area should be extended to the full US and Canadian coastal waters.
RecommendationsIt is recommended that a careful inspection of the boiler plant be carried out as there may be safety aspects involved, in addition to operational problems, resulting from the change in fuel type.
The hazards involved in operating a boiler plant with low sulphur fuels should be mapped carefully for the individual plant and its related control system. For some systems, it may not be possible to immediately incorporate a post-purging sequence after firing, which is considered mandatory for safe operation. Any unburned fuel in the furnace will form highly explosive vapours if not ventilated from the entire boiler and smoke stack arrangement.
As most offshore units are stationary, or at least operating for long continuous periods in the same area, there will not be an immediate demand for a switching between distillate and residual fuel oils. The operation of boilers should be based on one fuel or the other, since there are a number of other problems related to switching over between fuels.
Wärtsilä Boiler Services has years of experience in the repair, inspection and service of marine boiler and burner plants, as well as their associated equipment. The company’s experienced engineers for all fields of this service can be contacted 24/7 from Wärtsilä in Denmark and Dubai. Very soon this level of support will also be available from Wärtsilä in China. NOTE: A newsletter is available for downloading from Wärtsilä’s website: http://www.wartsila.com/boilerservices which explains in more detail the problems involved in operating boilers using low sulphur fuels.
Fig. 5 – Restricted access for boiler inspection is not uncommon.
Fig. 4 – Inspecting the burner.

WÄ
RTS
ILÄ
® is
a r
egis
tere
d t
rad
emar
k.
WIND POWER THAT WORKS, EVEN WITHOUT WIND.
We complement alternative energy sources so that you’ll
never be without power. This is just one example of how
Wärtsilä solutions are good for both business and nature on land
and at sea. Read more about what we can do for you and the
environment at wartsila.com.

90°W 45°W 0°
75°N
45°N
0°
45°S
45°E 90°E 135°E
WÄRTSILÄ NETWORK
...
WÄRTSILÄ TECHNICAL JOURNAL | WWW.WARTSILA.COM in detailThe information in this magazine contains, or may be deemed to contain “forward-looking statements”. These statements might relate to future events or our future fi nancial performance, including, but not limited to, strategic plans, potential growth, planned operational changes, expected capital expenditures, future cash sources and requirements, liquidity and cost savings that involve known and unknown risks, uncertainties and other factors that may cause Wärtsilä Corporation’s or its businesses’ actual results, levels of activity, performance or achievements to be materially diff erent from those expressed or implied by any forward-looking statements. In some cases, such forward-looking statements can be identifi ed by terminology such as “may,” “will,” “could,” “would,” “should,” “expect,” “plan,” “anticipate,” “intend,” “believe,” “estimate,” “predict,” “potential,” or “continue,” or the negative of those terms or other comparable terminology. By their nature, forward-looking statements involve risks and uncertainties because they relate to events and depend on circumstances that may or may not occur in the future. Future results may vary from the results expressed in, or implied by, the following forward-looking statements, possibly to a material degree. All forward-looking statements made in this publication are based only on information presently available in relation to the articles contained in this magazine and may not be current any longer and Wärtsilä Corporation assumes no obligation to update any forward-looking statements. Nothing in this publication constitutes investment advice and this publication shall not constitute an off er to sell or the solicitation of an off er to buy any securities or otherwise to engage in any investment activity.