Four Types of Cyclists: A National Look
37
Four Types of Cyclists Jennifer Dill, Ph.D. Professor, Urban Studies & Planning Director, Transportation Research & Education Center (TREC) Portland State University Portland, OR, USA NITC Webinar, August 11, 2015
-
Upload
trec-at-psu -
Category
Education
-
view
52 -
download
1
Transcript of Four Types of Cyclists: A National Look
Four Types of Cyclists
Jennifer Dill, Ph.D.Professor, Urban Studies & PlanningDirector, Transportation Research & Education Center (TREC)Portland State UniversityPortland, OR, USA
NITC Webinar, August 11, 2015
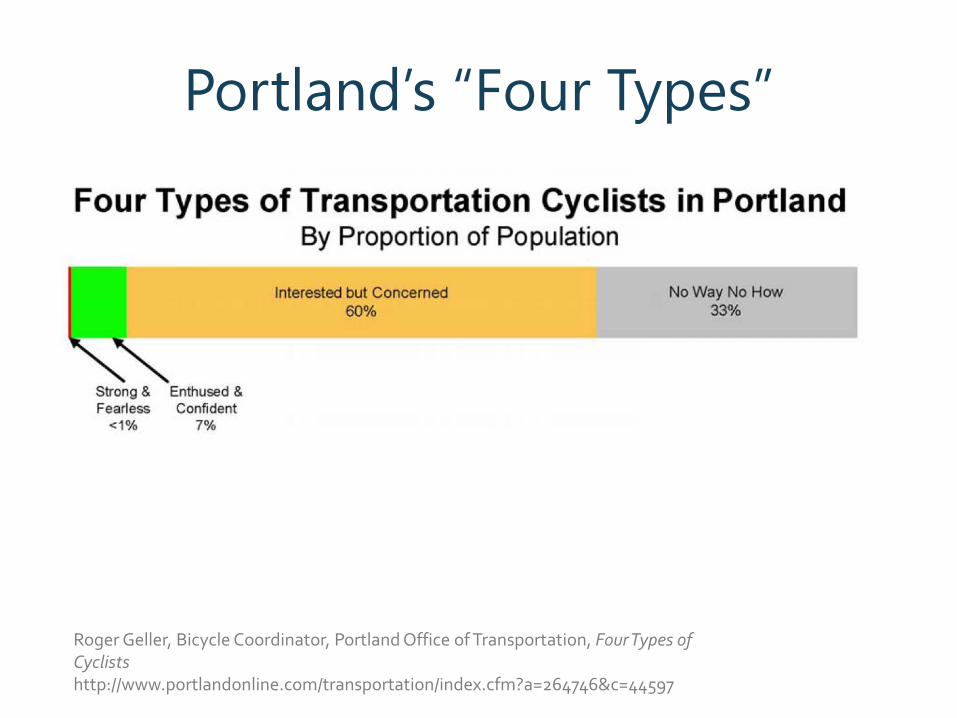
Portland’s “Four Types”
Roger Geller, Bicycle Coordinator, Portland Office of Transportation, Four Types of Cyclistshttp://www.portlandonline.com/transportation/index.cfm?a=264746&c=44597
Where did they come from?
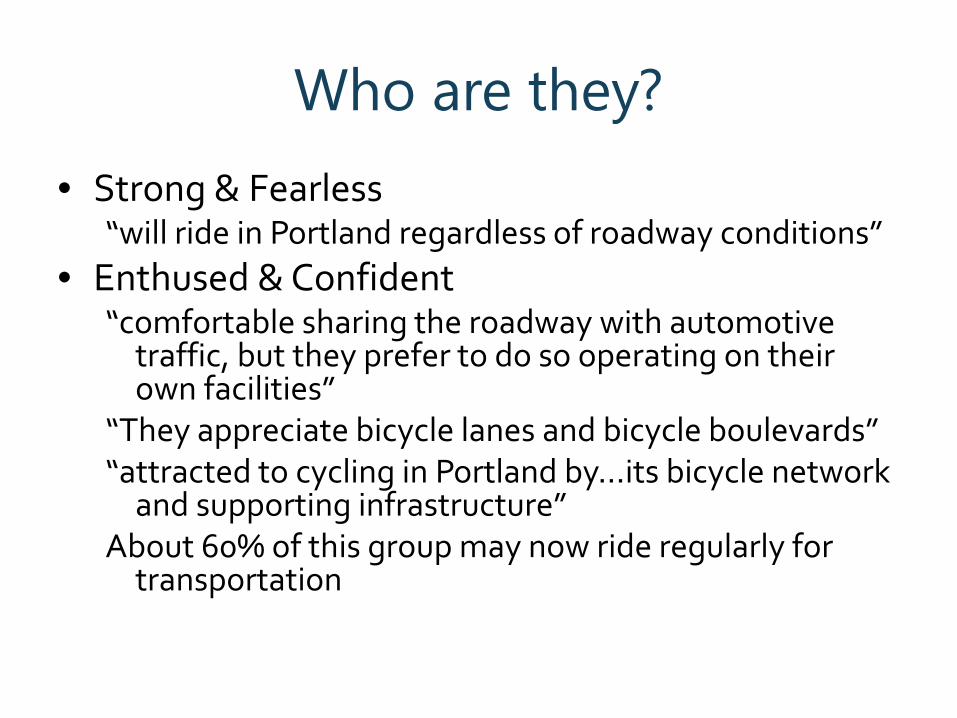
Who are they?• Strong & Fearless
“will ride in Portland regardless of roadway conditions”• Enthused & Confident
“comfortable sharing the roadway with automotive traffic, but they prefer to do so operating on their own facilities”
“They appreciate bicycle lanes and bicycle boulevards”“attracted to cycling in Portland by…its bicycle network
and supporting infrastructure”About 60% of this group may now ride regularly for
transportation

Who are they?• Interested but Concerned
“curious about bicycling…They like riding a bicycle”“But, they are afraid to ride.”“Very few of these people regularly ride bicycles”
• No Way No How“not interested in bicycling at all, for reasons of
topography, inability, or simply a complete and utter lack of interest.”
“The separation between these four broad groups is not generally clear-cut…likely quite a bit of blurring…”

Important!
• The types are defined primarily by comfort level bicycling in different environments, NOT by their current bicycling behavior.

Previous Research: Portland• Random phone survey of ~900 adults in the
Portland, OR metropolitan area (2011)
Type DescriptionCity of
PortlandRest of region All
Strong & Fearless
Very comfortable without bike lanes 6% 2% 4%
Enthused & Confident
Very comfortable with bike lanes 9% 9% 9%
Interested but Concerned
Not very comfortable, interested in biking more
Not very comfortable, currently cycling for transportation but not interested in biking more
60% 53% 56%
No Way No HowPhysically unable or don’t knowVery uncomfortable on pathsNot very comfortable, not interested, not
cycling for transportation
25% 37% 31%
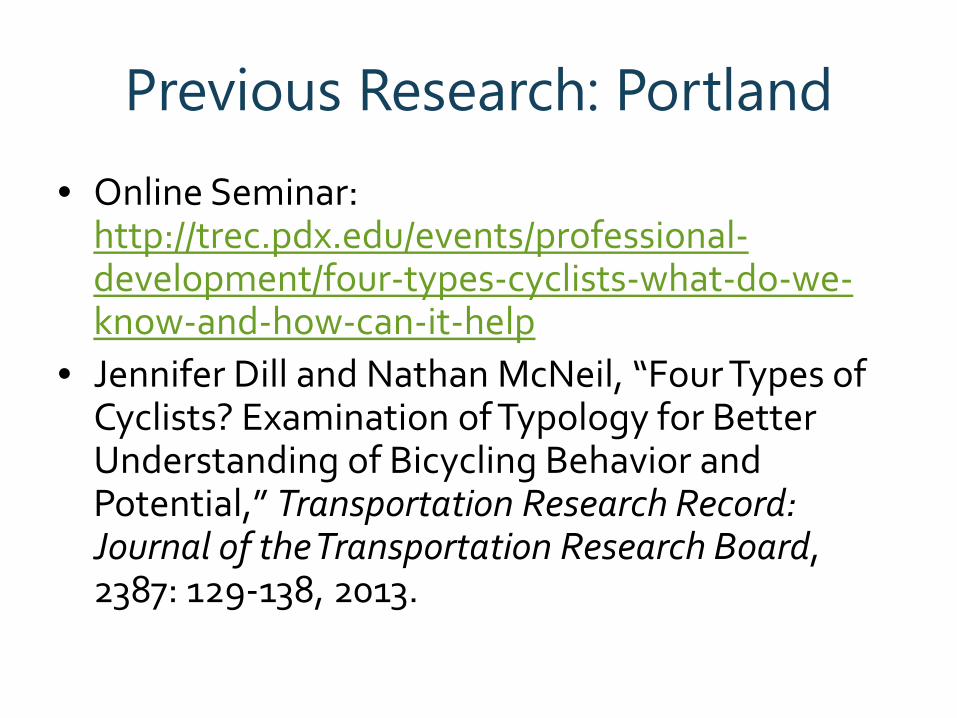
Previous Research: Portland• Online Seminar:
http://trec.pdx.edu/events/professional-development/four-types-cyclists-what-do-we-know-and-how-can-it-help
• Jennifer Dill and Nathan McNeil, “Four Types of Cyclists? Examination of Typology for Better Understanding of Bicycling Behavior and Potential,” Transportation Research Record: Journal of the Transportation Research Board, 2387: 129-138, 2013.
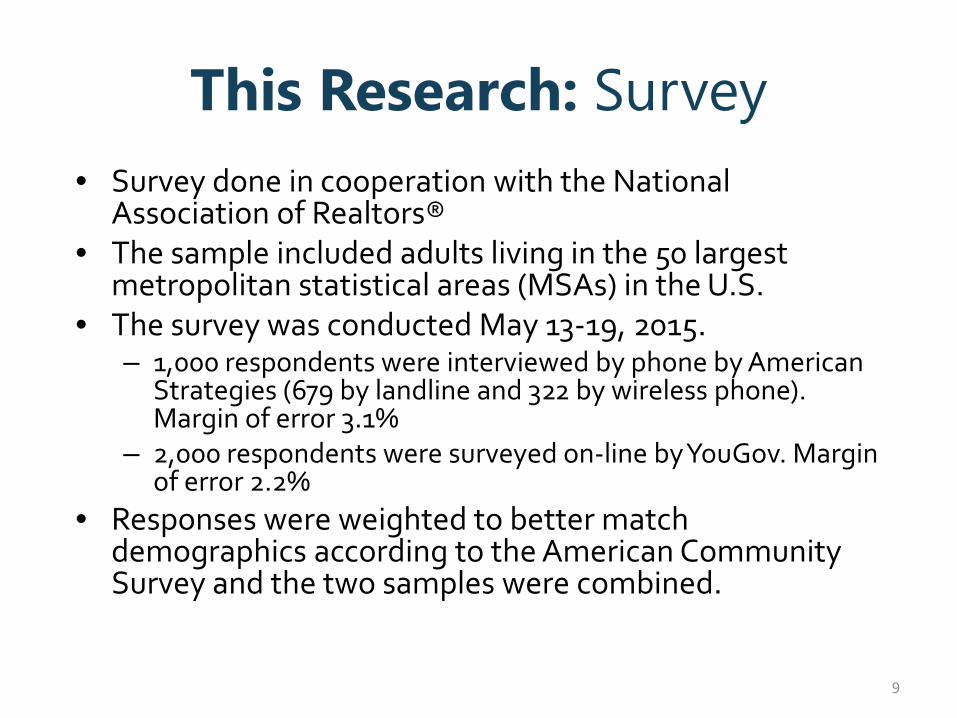
This Research: Survey• Survey done in cooperation with the National
Association of Realtors® • The sample included adults living in the 50 largest
metropolitan statistical areas (MSAs) in the U.S.• The survey was conducted May 13-19, 2015.
– 1,000 respondents were interviewed by phone by American Strategies (679 by landline and 322 by wireless phone). Margin of error 3.1%
– 2,000 respondents were surveyed on-line by YouGov. Margin of error 2.2%
• Responses were weighted to better match demographics according to the American Community Survey and the two samples were combined.
9
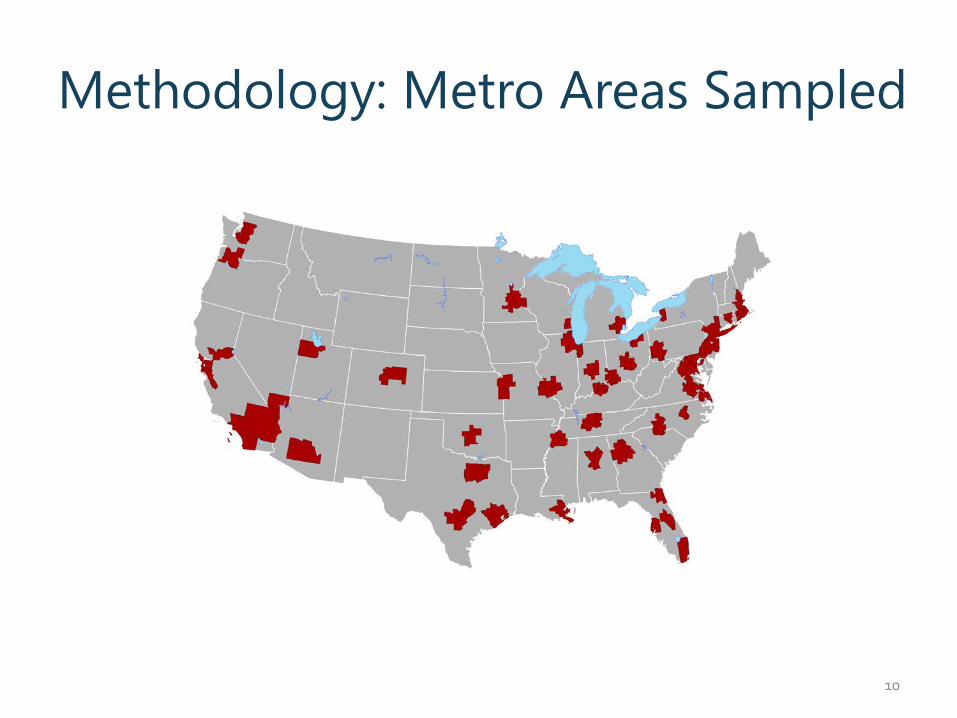
Methodology: Metro Areas Sampled
10
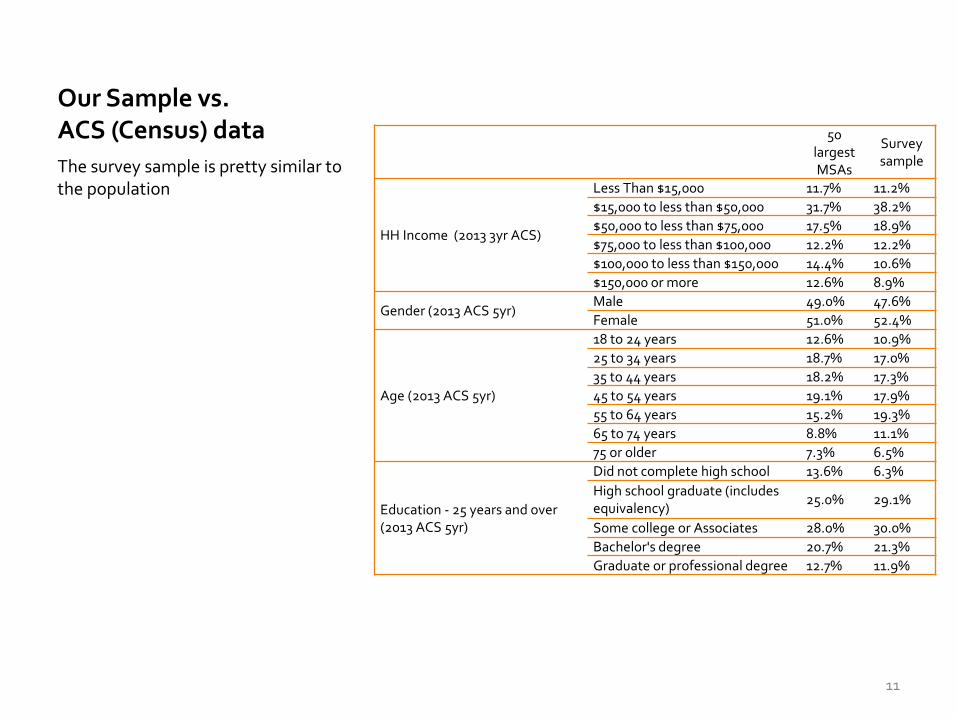
Our Sample vs. ACS (Census) dataThe survey sample is pretty similar to the population
11
50 largest MSAs
Survey sample
HH Income (2013 3yr ACS)
Less Than $15,000 11.7% 11.2%$15,000 to less than $50,000 31.7% 38.2%$50,000 to less than $75,000 17.5% 18.9%$75,000 to less than $100,000 12.2% 12.2%$100,000 to less than $150,000 14.4% 10.6%$150,000 or more 12.6% 8.9%
Gender (2013 ACS 5yr)Male 49.0% 47.6%Female 51.0% 52.4%
Age (2013 ACS 5yr)
18 to 24 years 12.6% 10.9%25 to 34 years 18.7% 17.0%35 to 44 years 18.2% 17.3%45 to 54 years 19.1% 17.9%55 to 64 years 15.2% 19.3%65 to 74 years 8.8% 11.1%75 or older 7.3% 6.5%
Education - 25 years and over (2013 ACS 5yr)
Did not complete high school 13.6% 6.3%High school graduate (includes equivalency)
25.0% 29.1%
Some college or Associates 28.0% 30.0%Bachelor's degree 20.7% 21.3%Graduate or professional degree 12.7% 11.9%
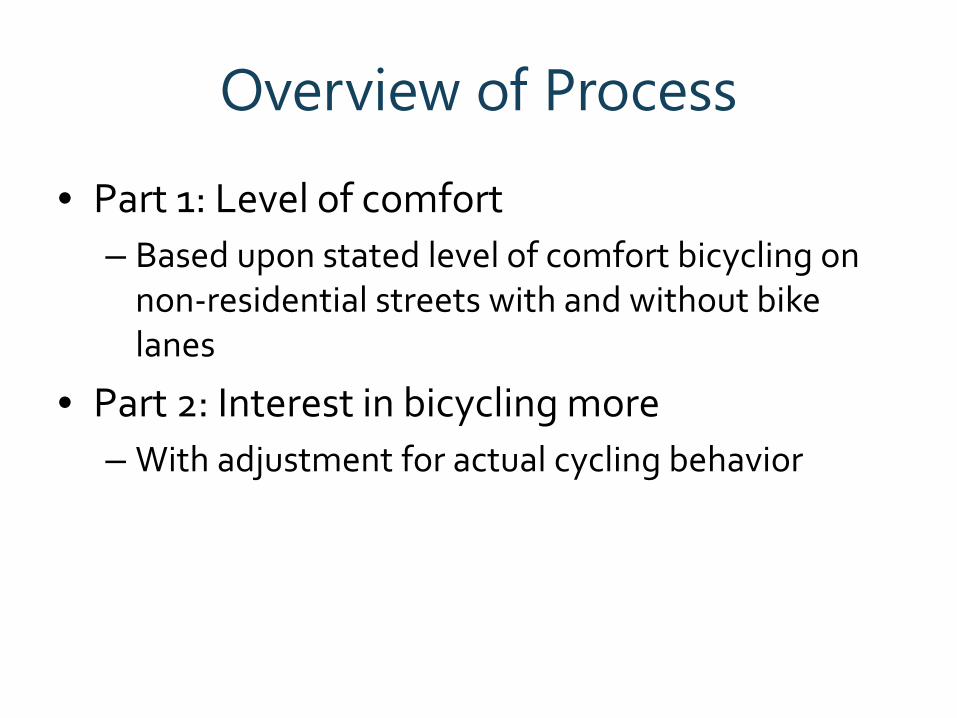
Overview of Process
• Part 1: Level of comfort – Based upon stated level of comfort bicycling on
non-residential streets with and without bike lanes
• Part 2: Interest in bicycling more– With adjustment for actual cycling behavior
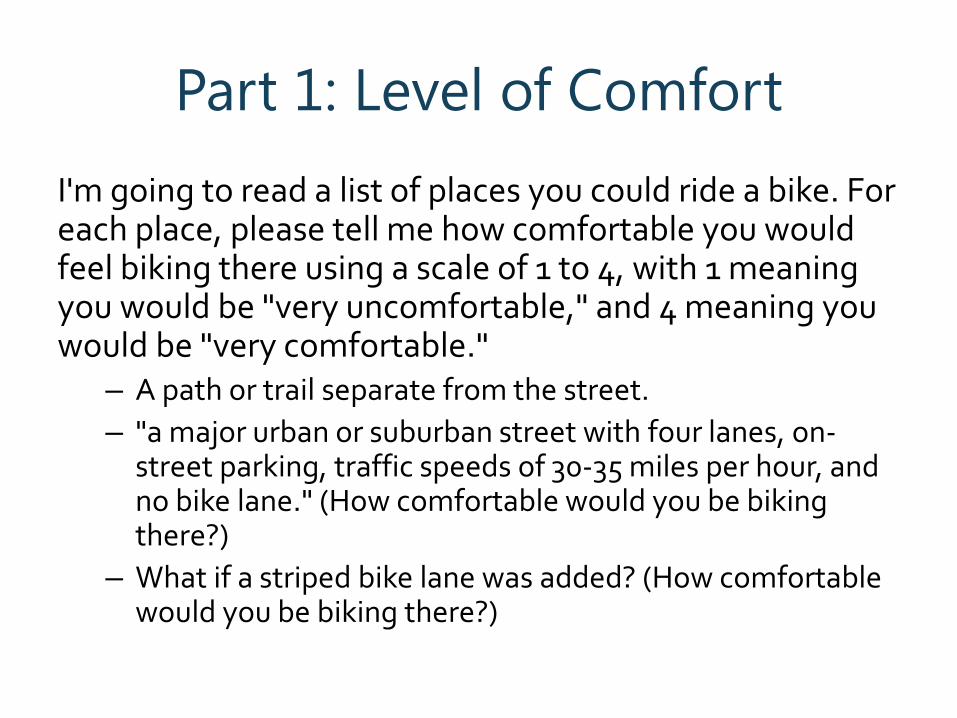
Part 1: Level of ComfortI'm going to read a list of places you could ride a bike. For each place, please tell me how comfortable you would feel biking there using a scale of 1 to 4, with 1 meaning you would be "very uncomfortable," and 4 meaning you would be "very comfortable."
– A path or trail separate from the street.– "a major urban or suburban street with four lanes, on-
street parking, traffic speeds of 30-35 miles per hour, and no bike lane." (How comfortable would you be biking there?)
– What if a striped bike lane was added? (How comfortable would you be biking there?)
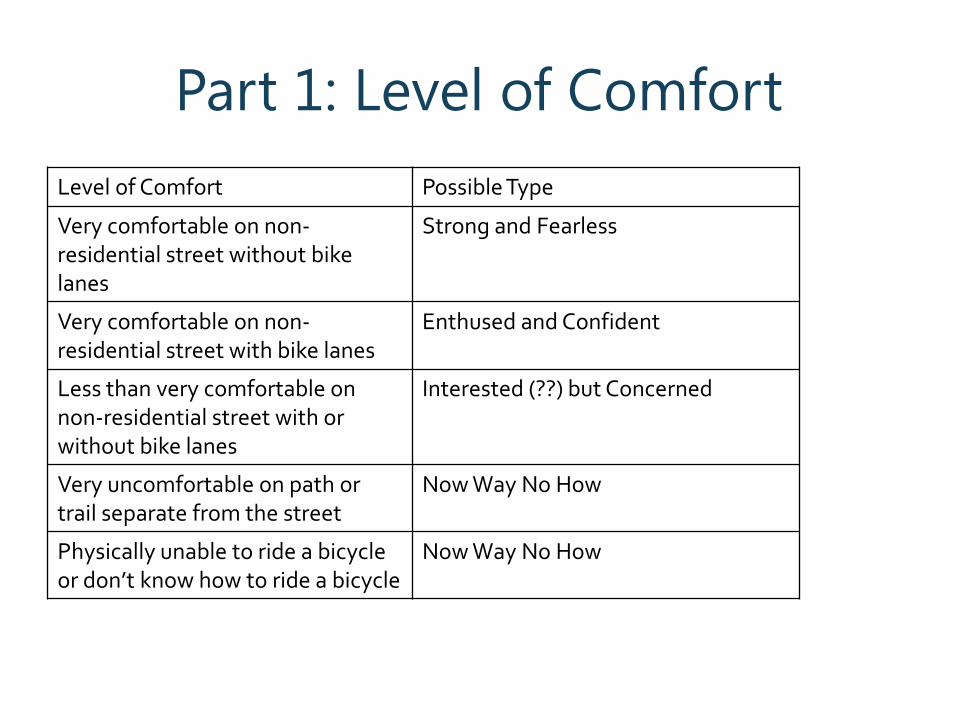
Part 1: Level of ComfortLevel of Comfort Possible Type
Very comfortable on non-residential street without bike lanes
Strong and Fearless
Very comfortable on non-residential street with bike lanes
Enthused and Confident
Less than very comfortable on non-residential street with or without bike lanes
Interested (??) but Concerned
Very uncomfortable on path or trail separate from the street
Now Way No How
Physically unable to ride a bicycleor don’t know how to ride a bicycle
Now Way No How

Part 2: Interest in Cycling
Please tell me if you strongly disagree, somewhat disagree, somewhat agree, or strongly agree.
…I would like to travel by bike more than I do now.
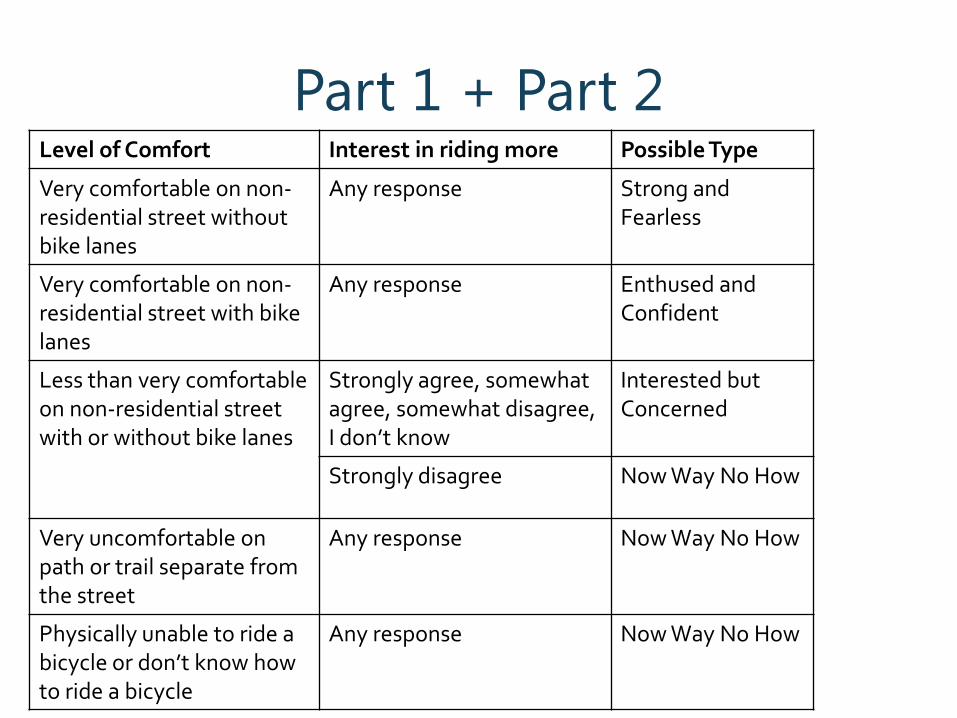
Part 1 + Part 2Level of Comfort Interest in riding more Possible Type
Very comfortable on non-residential street without bike lanes
Any response Strong and Fearless
Very comfortable on non-residential street with bike lanes
Any response Enthused and Confident
Less than very comfortable on non-residential street with or without bike lanes
Strongly agree, somewhat agree, somewhat disagree, I don’t know
Interested but Concerned
Strongly disagree Now Way No How
Very uncomfortable on path or trail separate from the street
Any response Now Way No How
Physically unable to ride a bicycle or don’t know how to ride a bicycle
Any response Now Way No How
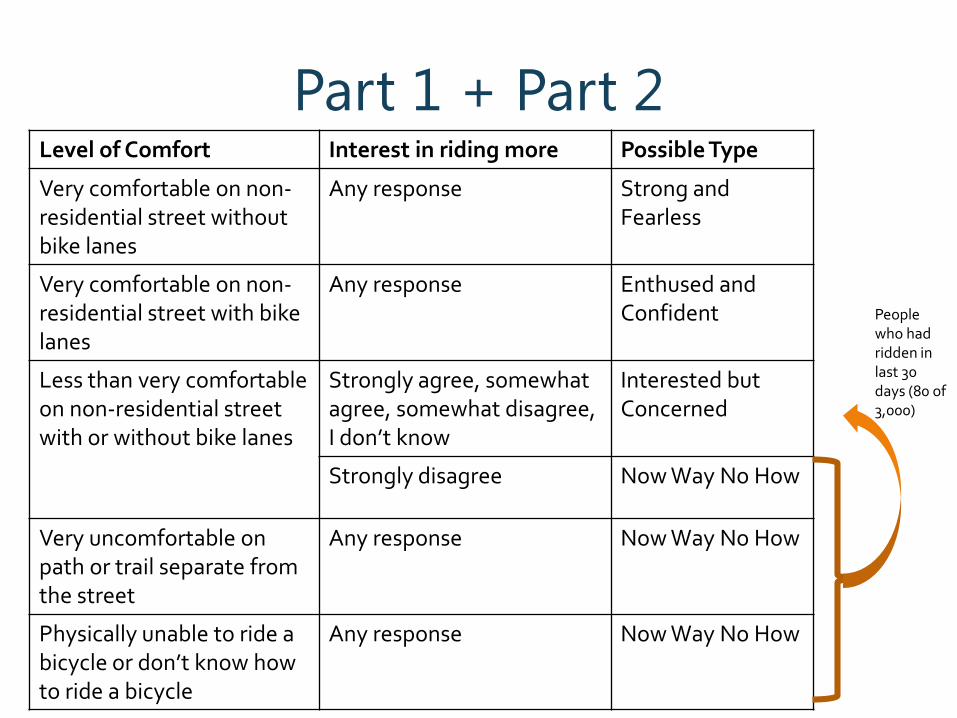
People who had ridden in last 30 days (80 of 3,000)

Results
Type
Geller estimate for
PortlandOur Portland region survey
National Survey
(metro areas)
Strong & Fearless <1% 4% 7%
Enthused & Confident 7% 9% 5%
Interested but Concerned 60% 56% 51%
No Way No How 33% 31% 37%
12%
Why differences?
• There likely are differences geographically• Method was abbreviated in the national
sample (1 comfort question vs. 3) Less stable measure of comfort, particularly for the Strong and Fearless.

More importantly…
• Don’t focus on the exact numbers

Who are they?
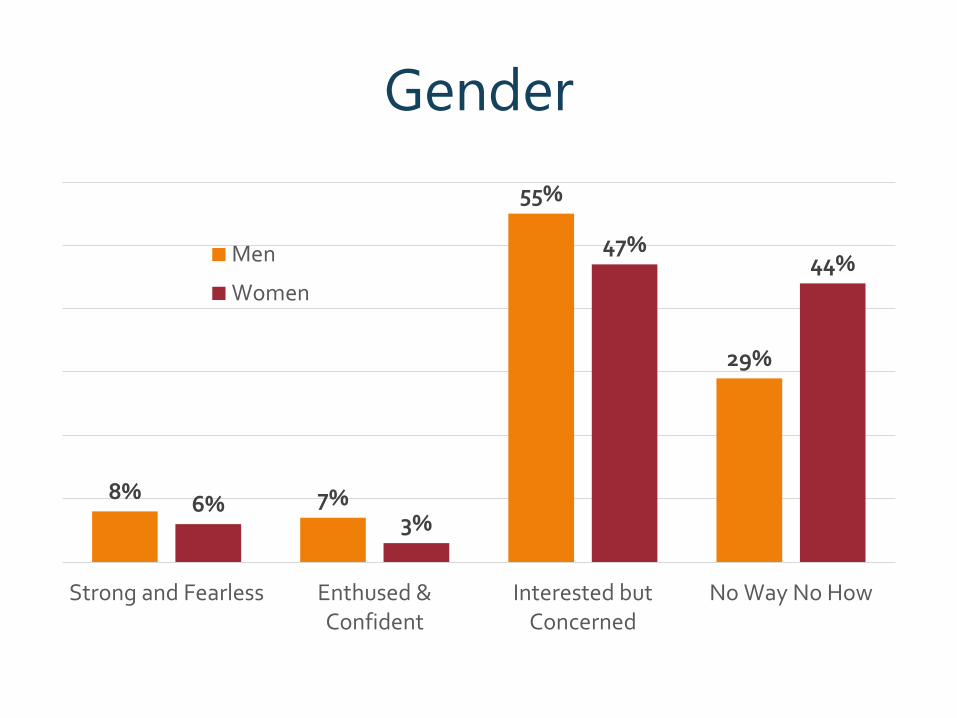
Gender
8% 7%
55%
29%
6%3%
47%44%
Strong and Fearless Enthused &Confident
Interested butConcerned
No Way No How
Men
Women
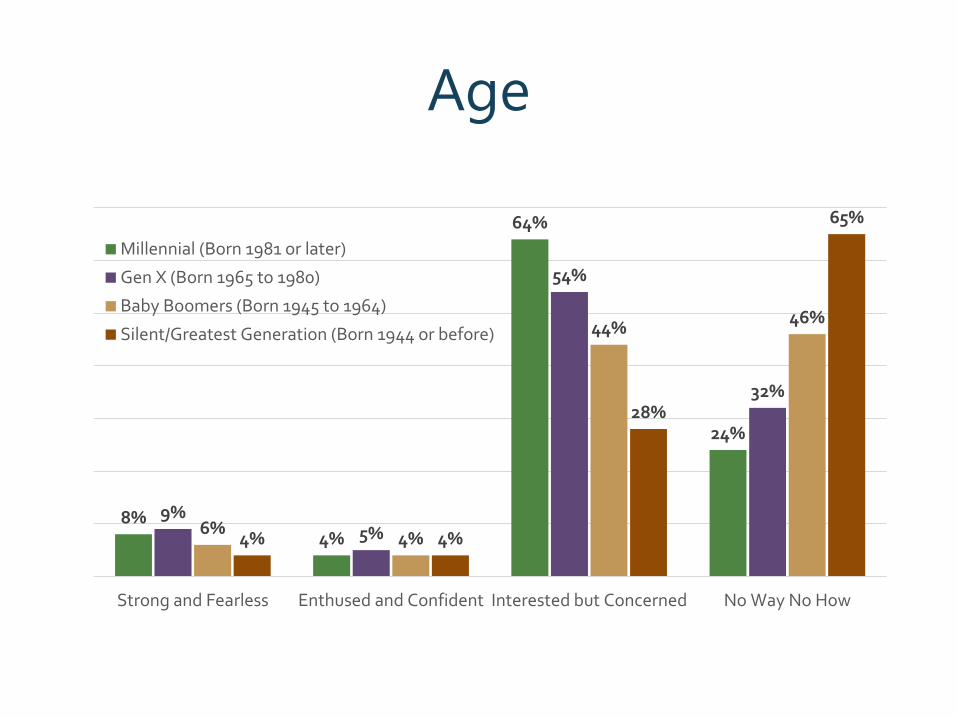
Age
8%4%
64%
24%
9%5%
54%
32%
6% 4%
44% 46%
4% 4%
28%
65%
Strong and Fearless Enthused and Confident Interested but Concerned No Way No How
Millennial (Born 1981 or later)
Gen X (Born 1965 to 1980)
Baby Boomers (Born 1945 to 1964)
Silent/Greatest Generation (Born 1944 or before)
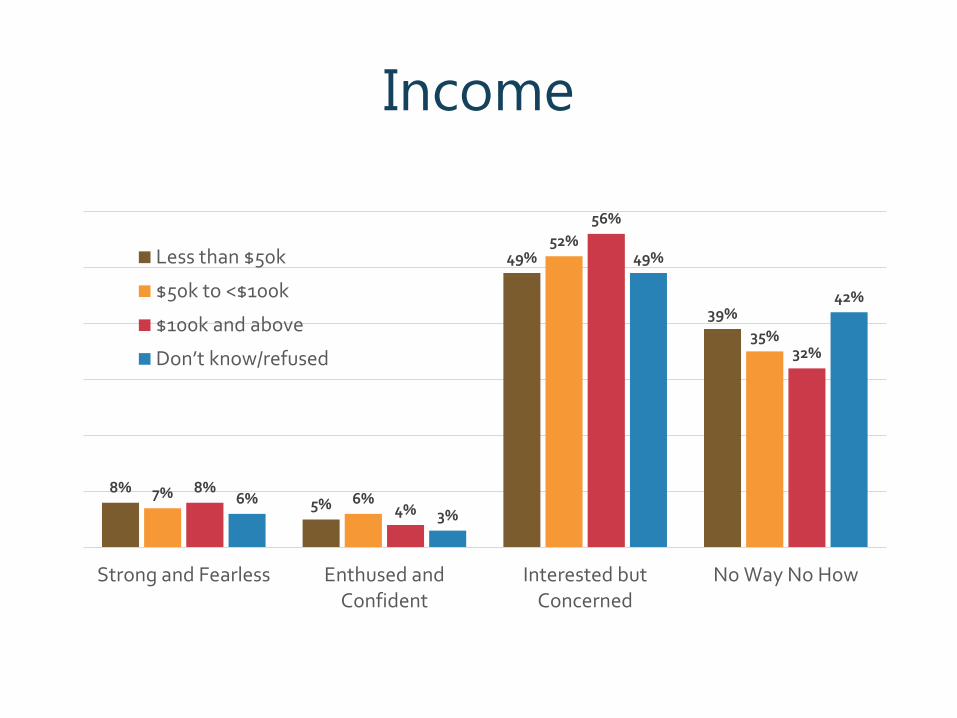
Income
8%5%
49%
39%
7% 6%
52%
35%
8%4%
56%
32%
6%3%
49%
42%
Strong and Fearless Enthused andConfident
Interested butConcerned
No Way No How
Less than $50k
$50k to <$100k
$100k and above
Don’t know/refused
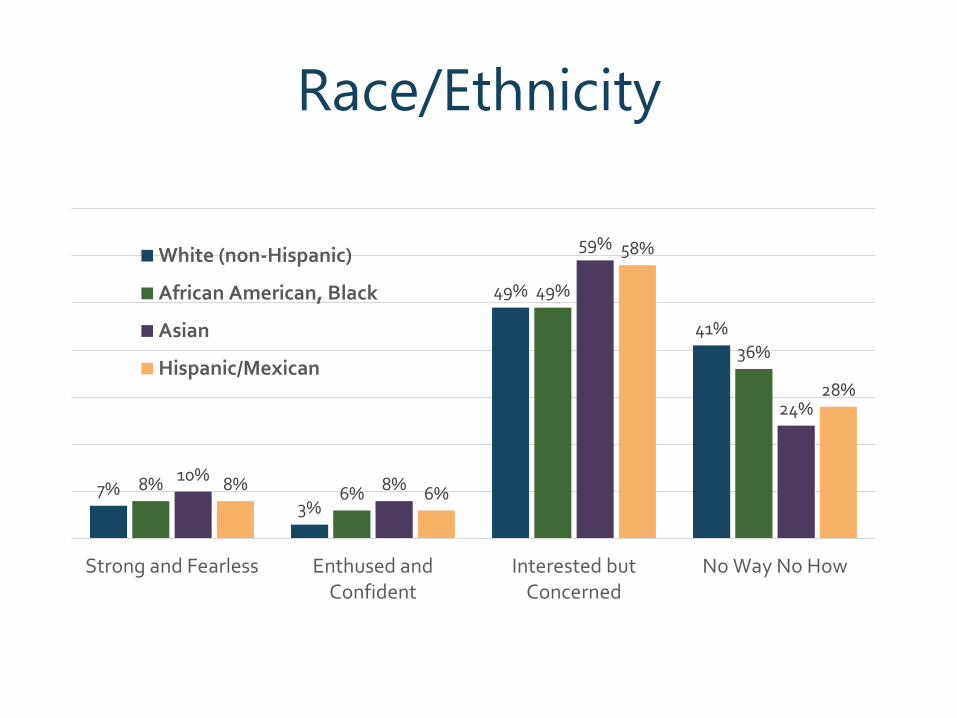
Race/Ethnicity
7%3%
49%
41%
8% 6%
49%
36%
10% 8%
59%
24%
8% 6%
58%
28%
Strong and Fearless Enthused andConfident
Interested butConcerned
No Way No How
White (non-Hispanic)
African American, Black
Asian
Hispanic/Mexican
How much do they bike?
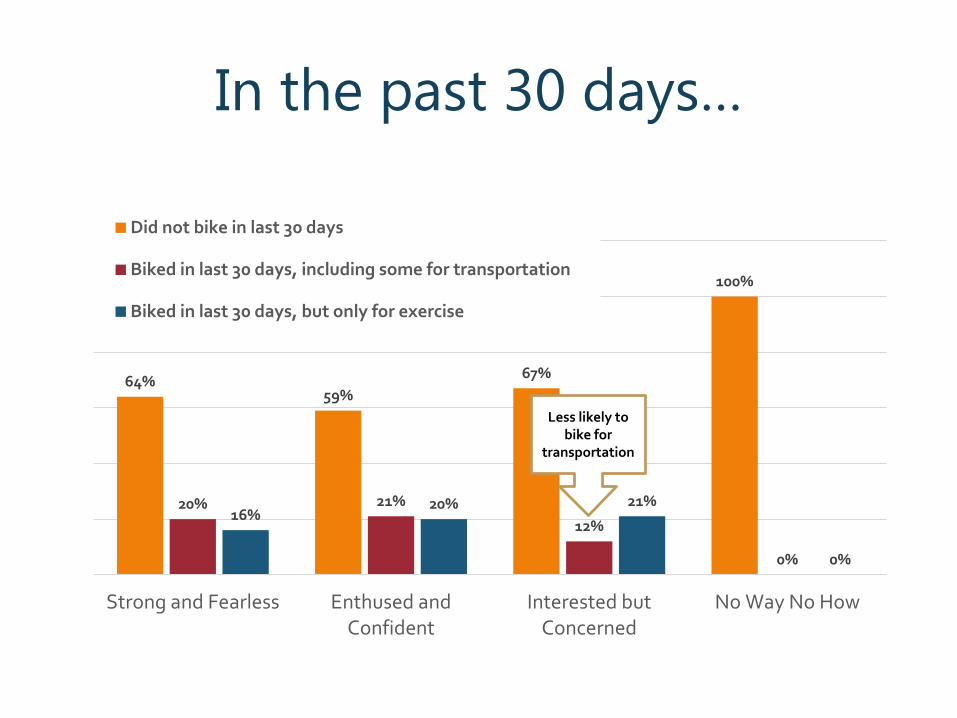
In the past 30 days…
64%59%
67%
100%
20% 21%
12%
0%
16%20% 21%
0%
Strong and Fearless Enthused andConfident
Interested butConcerned
No Way No How
Did not bike in last 30 days
Biked in last 30 days, including some for transportation
Biked in last 30 days, but only for exercise
Less likely to bike for
transportation
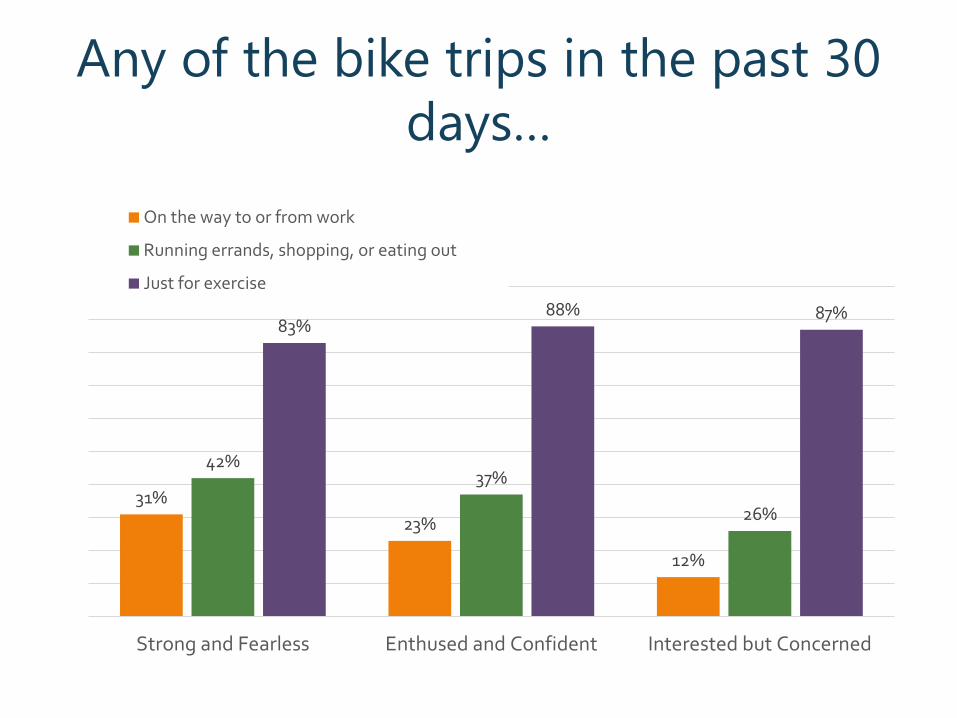
Any of the bike trips in the past 30 days…
31%23%
12%
42%37%
26%
83%88% 87%
Strong and Fearless Enthused and Confident Interested but Concerned
On the way to or from work
Running errands, shopping, or eating out
Just for exercise
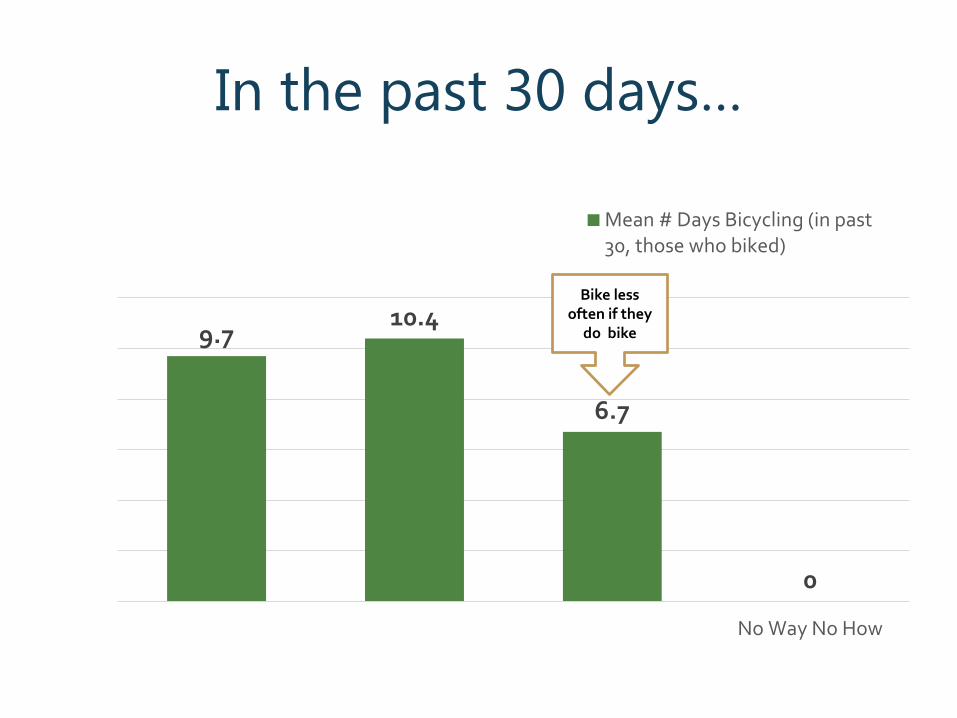
In the past 30 days…
9.710.4
6.7
0
No Way No How
Mean # Days Bicycling (in past30, those who biked)
Bike less often if they
do bike

What might influence future behavior?
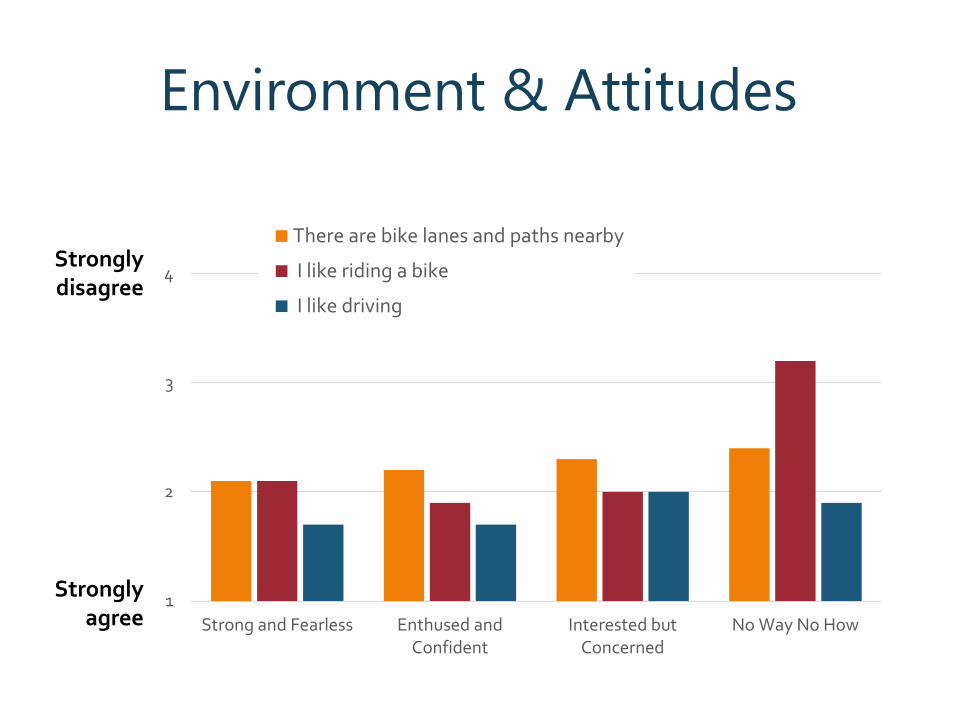
Environment & Attitudes
Strongly agree
Strongly disagree
1
2
3
4
Strong and Fearless Enthused andConfident
Interested butConcerned
No Way No How
There are bike lanes and paths nearby
I like riding a bike
I like driving
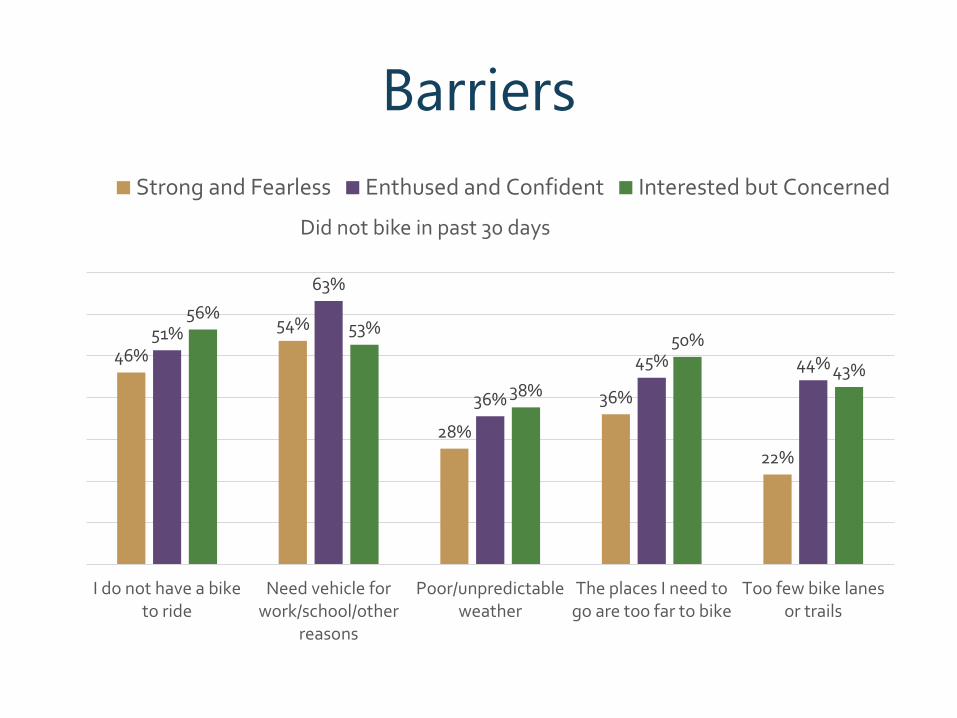
Barriers
46%
54%
28%
36%
22%
51%
63%
36%
45% 44%
56%53%
38%
50%
43%
I do not have a biketo ride
Need vehicle forwork/school/other
reasons
Poor/unpredictableweather
The places I need togo are too far to bike
Too few bike lanesor trails
Did not bike in past 30 days
Strong and Fearless Enthused and Confident Interested but Concerned
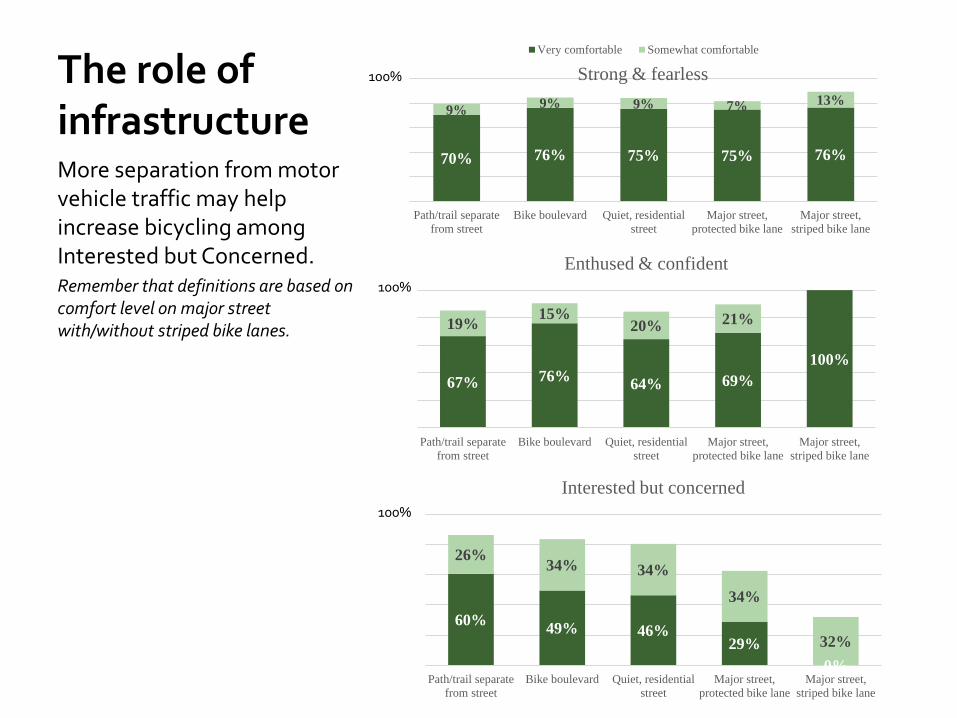
The role of infrastructureMore separation from motor vehicle traffic may help increase bicycling among Interested but Concerned.Remember that definitions are based on comfort level on major street with/without striped bike lanes.
70% 76% 75% 75% 76%
9% 9% 9% 7% 13%
Path/trail separatefrom street
Bike boulevard Quiet, residentialstreet
Major street,protected bike lane
Major street,striped bike lane
Strong & fearlessVery comfortable Somewhat comfortable
67% 76% 64% 69%100%
19% 15%20% 21%
Path/trail separatefrom street
Bike boulevard Quiet, residentialstreet
Major street,protected bike lane
Major street,striped bike lane
Enthused & confident
60% 49% 46%29%
0%
26% 34% 34%
34%
32%
Path/trail separatefrom street
Bike boulevard Quiet, residentialstreet
Major street,protected bike lane
Major street,striped bike lane
Interested but concerned
100%
100%
100%

Conclusions• The general consistency of the typology breakdown
between Portland and this national survey suggests that the overall framework has merit.
• For planning efforts, it appears that around a third of the population is in the no way no how group and a plurality (or majority) in the interested but concerned group.
• The typology does not, in and of itself, indicate whether someone actually rides a bicycle at all.– May be related to frequency and type of riding
Conclusions
• Targeting the Interested but Concerned– Many don’t like driving (more than other groups)– They do like biking equally– Currently bike more for recreation/exercise– Infrastructure needs to address comfort level– Not having a bike is a barrier
Limitations, etc.
• Surveys have inherent limitations• Assignment to a type based on fewer
questions than previous research• Many barriers and motivations for bicycling
not addressed in this survey• More analysis to be done, including linking to
built environment
Questions?
• Funding support from NITC (US DOT National University Transportation Center) and National Association of Realtors®
• Thanks to co-author Nathan McNeil