Fouling Challenge for a Robust, Remote Controlled ...
60
U.S. Department of the Interior Bureau of Reclamation Research and Development Office December 2014 Fouling Challenge for a Robust, Remote Controlled Ultrafiltration/ Reverse Osmosis System Research and Development Office Science and Technology Program Final Report ST-2014-1759-01
Transcript of Fouling Challenge for a Robust, Remote Controlled ...
U.S. Department of the Interior Bureau of Reclamation Research and Development Office December 2014
Fouling Challenge for a Robust, Remote Controlled Ultrafiltration/ Reverse Osmosis System Research and Development Office Science and Technology Program Final Report ST-2014-1759-01
REPORT DOCUMENTATION PAGE Form Approved OMB No. 0704-0188
T1. REPORT DATE
December 2014
T2. REPORT TYPE
Research T3. DATES COVERED
June-December, 2014
T4. TITLE AND SUBTITLE
Fouling Challenge for a Robust, Remote Controlled Ultrafiltration/Reverse Osmosis System
5a. CONTRACT NUMBER
RY1541AW201421759 5b. GRANT NUMBER
5c. PROGRAM ELEMENT NUMBER
1759 (S&T) 6. AUTHOR(S)
Michelle Chapman, 303-445-2264, [email protected] 5d. PROJECT NUMBER
1759 5e. TASK NUMBER
5f. WORK UNIT NUMBER
86-68190 7. PERFORMING ORGANIZATION NAME(S) AND ADDRESS(ES)
Michelle Chapman, U.S. Bureau of Reclamation, Denver, CO 8. PERFORMING ORGANIZATION REPORT NUMBER
ST-2014-1756-01
9. SPONSORING / MONITORING AGENCY NAME(S) AND ADDRESS(ES)
Research and Development Office U.S. Department of the Interior, Bureau of Reclamation, PO Box 25007, Denver CO 80225-0007
10. SPONSOR/MONITOR’S ACRONYM(S) R&D: Research and Development Office BOR/USBR: Bureau of Reclamation DOI: Department of the Interior 11. SPONSOR/MONITOR’S REPORT
NUMBER(S) RY1541AW201421759
12. DISTRIBUTION / AVAILABILITY STATEMENT Final report can be downloaded from Reclamation’s website: https://www.usbr.gov/research/
13. SUPPLEMENTARY NOTES
14. ABSTRACT (Maximum 200 words)
An automated and remote controlled, Ultrafiltration/Reverse Osmosis (UF/RO) system is evaluated for robustness and adaptability to severe changes in feed water quality at the Bureau of Reclamation’s Brackish Groundwater National Desalination Research Facility (BGNDRF) in Alamogordo, New Mexico. A maximum RO system recovery of 83 percent was achieved on the highly scaling well water. Average RO permeate quality remained acceptable with a maximum conductivity of 168 microSiemens per centimeter, despite wide-ranging feed conductivity due to recycling RO concentrate to the RO feed tank to increase recovery and as backwash supply for the UF system. During fouling challenges with separate solutions of natural humic and fulvic acid, blue-green algae, kaolin powder, and sodium alginate, the system recovered easily upon decline in fouling load or with hot water cleanings. Methods are presented for monitoring the onset of, and degree of, fouling in real time using the traditional process sensors. In addition, recommendations are proposed for automating UF maintenance.
15. SUBJECT TERMS
Robust treatment systems, control systems, sensors, fouling, cleaning 16. SECURITY CLASSIFICATION OF:
U 17. LIMITATION OF ABSTRACT
U
18. NUMBER OF PAGES
60
19a. NAME OF RESPONSIBLE PERSON
Michelle Chapman
a. REPORT
U b. ABSTRACT
U c. THIS PAGE
U 19b. TELEPHONE NUMBER 303-445-2264
S Standard Form 298 (Rev. 8/98) P Prescribed by ANSI Std. 239-18

U.S. Department of the Interior Bureau of Reclamation Research and Development Office December 2014
Fouling Challenge for a Robust, Remote Controlled Ultrafiltration/ Reverse Osmosis System Research and Development Office Science and Technology Program Final Report ST-2014-1759-01

Mission Statements
The U.S. Department of the Interior protects America’s natural
resources and heritage, honors our cultures and tribal communities,
and supplies the energy to power our future.
The mission of the Bureau of Reclamation is to manage, develop,
and protect water and related resources in an environmentally and
economically sound manner in the interest of the American public.

Peer Review Documentation Project and Document Information
Project Name::Fouling Challenge for a Robust, Remote Controlled Ultrafiltration/Reverse Osmosis System
WOID:: Z1759
Document:: Final Report No. ST-2014-1759-01
Document Author(s): Michelle Chapman
Document date::December 2014
Peer Reviewer::Miguel Aria-Paic and Andrew Tif enbach
Review Certification
Peer Reviewer: I have reviewed the assigned items/sections(s) noted for the above document and believe them to be in accordance with the project requirements, standards of the profession,dd Reclamation policy.
Reviewer:
Date reviewed:
Reviewer:
Datereviewed:

Acknowledgments
I want to thank Advanced Hydro, Inc. for the use of its system, especially to
J. Rogers for adapting the installation to our facility, and to K. Blohm, who acted
as the remote brains behind the system. Thank you also to the staff at the
Brackish Groundwater National Desalination Research Facility (Randy Shaw,
Steve Holland, Robert Granados, and Dan Lucero) for their welcoming
environment, tenacity in keeping everything in order, and general good cheer.
I am grateful to Rachel Frisz and Valerie Batista-Stariha for their assistance in at
BGNDRF. In addition, I thank the Bureau of Reclamation’s Technical Service
Center staff for review and procurement of goods (Andrew Tiffenbach, Miguel
Arias-Paic, Matt Hirschbeck, and Dan Gonzales). Finally, thanks to
Reclamation’s Research and Development Office for funding this effort, and
to the Office of Naval Research for funding the prior work that made this
contribution possible.

Abbreviations and Acronyms
µmhos/cm micromhos per centimeter
µS/cm microSiemens per centimeter
AHI Advanced Hydro, Inc.
Ave. average
BGNDRF Brackish Groundwater National Desalination
Research Facility
EPA U.S. Environmental Protection Agency
FNC future naval capability
ft feet
gal/d gallons per day
gal/ft2 gallons per square feet
gal/min gallons per minute
hp horsepower
IP/Ksp ion product divided by the solubility product
kW kilowatts
kWh/kgal kilowatthours per thousand gallons
kWh/m3 kilowatthours per cubic meter
L/m2 liters per square meter
L/min liters per minute
LSI Langelier Saturation Index
m meters
m2 square meters
m3 cubic meters
m3/d cubic meters per day
mbar/min millibars per minute
MF microfiltration
mg/L milligrams per liter
mL/min milliliters per minute
ND not detected
NDP net driving pressure
NOM natural organic matter
NPF normalized permeate flow
NTU nephelometric turbidity units

Abbreviations and Acronyms (continued)
ºC degrees Celsius
ONR Office of Naval Research
PBI polybenzimidazole
PVC polyvinyl chloride
PVDF polyvinylidene difluoride
r/min/m3 revolutions per minute per cubic meter
Reclamation Bureau of Reclamation
RO reverse osmosis
SI saturation index
SP salt passage
St. Dev. standard deviation
TDS total dissolved solids
TMP transmembrane pressure
UF ultrafiltration
UMFI Unified Membrane Fouling Index
VFD variable frequency drive

i
Contents
Page
1 Introduction ......................................................................................................1
1.1 Background ...............................................................................................1
1.2 Goals for the Project ..................................................................................3
2 Equipment and Test Facility ..............................................................................5
2.1 The System ................................................................................................5
2.1.1 Membranes ..................................................................................6
2.1.2 Open Architecture and Footprint .................................................7
2.1.3 RO Concentrate Backwash ..........................................................7
2.1.4 Remote Control System ...............................................................7
2.2 BGNDRF ...................................................................................................9
3 Evaluation Methods .........................................................................................11
3.1 Overall Evaluations .................................................................................11
3.2 UF System Evaluation .............................................................................11
3.2.1 Feed Water Quality ...................................................................11
3.2.2 Fouling .......................................................................................11
3.3 RO System...............................................................................................13
3.4 Recovery Tests ........................................................................................14
3.5 Fouling Tests ...........................................................................................16
3.5.1 Orchid Pro .................................................................................16
3.5.2 Blue-green Algae .......................................................................16
3.5.3 Kaolin Powder ...........................................................................17
3.5.4 Sodium Alginate ........................................................................17
4. Results ..............................................................................................................19
4.1 Responsiveness to Changing Conditions ................................................19
4.2 Ease of Use and Reliability .....................................................................21
4.3 RO System...............................................................................................24
4.4 UF System ...............................................................................................28
4.5 Cleaning ..................................................................................................31
4.6 Power Consumption ................................................................................32
5 Discussion ........................................................................................................33
5.1 Robustness ...............................................................................................33
5.2 Automated Monitoring to Evaluate Fouling ...........................................34
5.3 Automated Response to Fouling Indicators ............................................37
6 Conclusions ......................................................................................................41
6.1 Further Investigation Needed ..................................................................41
7 References ........................................................................................................43

ii
Tables Page
1 Summary of Technology Innovations Arising from the ONR
FNC Program ...............................................................................................2
2 Process Control Inputs .......................................................................................8
3 BGNDRF Well Water Analyses (November 2013).........................................10
4 Well Characteristics Required for Estimating Osmotic Potential....................13
5 Saturation Indicators for Wells 2 and 3 ...........................................................15
6 Fouling Events and Their Effect on UF System Performance .........................28
2 Modifications to the Backwash Cycle with Performance Parameter
Values ........................................................................................................31
8 Power Consumption .........................................................................................31
Figures Page
1 Sea.PURe system set up at the BGNDRF (left) and a side image
from AHI (right) .........................................................................................6
2 Main Process Monitoring & Human-Machine Interface ..................................8
3 Back flush cycles 2 and 3 and forward flush cycle for the
UF elements ................................................................................................9
4 Feed conductivity and UF feed pump speed ..................................................20
5. Variation in UF feed conductivity with RO concentrate backwash
during the increasing recovery period ......................................................21
6 UF system filtrate flow and transmembrane pressure ....................................22
7 Fouling challenge: days 1-4 ..........................................................................23
8 Fouling challenge: days 5-8 ..........................................................................23
10 UF system pretreatment separator inlet pressure and pump
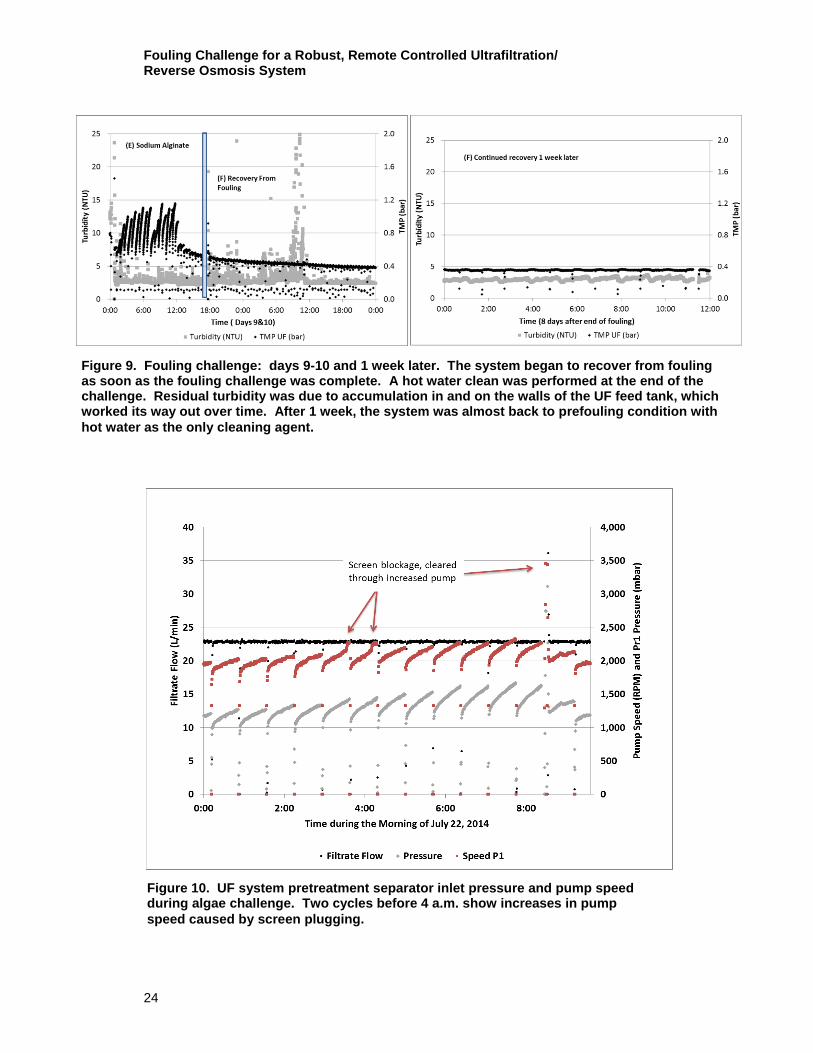
speed during algae challenge ....................................................................24
9 Fouling challenge: days 9-10 and 1 week later .............................................24
12 RO system performance parameters - pressure ..............................................26
11 RO system productivity performance parameters – feed flow
and pressure-temperature normalized permeate flow...............................26
13 Normalized salt passage and recovery ...........................................................27
14 Percent salt passage and NPF during fouling challenge .................................27
16 Evaluation metrics during kaolin powder fouling ..........................................29
15 Evaluation metrics during blue-green algae fouling (C1 and C2) ..................29
17 Change in the inverse of specific flux with production..................................30
18 Simplified decision tree for UF control ..........................................................34
20 Percent change in evaluation parameters at each change in the
backwash cycle .........................................................................................36

iii
Figures (continued) Page
19 Proportionality between UMFI, change in TMP, maximum TMP,
and pump speed. .......................................................................................36
21 Difference between initial TMP following cycle 2 backflush and
subsequent cycle 3 backflush ...................................................................38

Chapter 1: Introduction
1
1 Introduction
According to the U.S. Environmental Protection Agency (EPA, 2013), 77 percent
of community water systems serve populations of less than 10,000 people,
which amounts to 70 million people in the Western United States who receive
their water from medium, small, and very small community, transient, or
nontransient treatment systems. Most of the systems in the West (84 percent)
use groundwater. In large tracts of the West, the groundwater has total dissolved
solids (TDS), iron, and manganese above secondary standards; as well as radon,
uranium, arsenic, and other contaminants that are close to, or exceed,
EPA maximum contaminant level concentrations. Person(s) in charge of
operation and maintenance of treatment systems for these difficult waters often
have other critical responsibilities. Most people would likely agree that the best
situation would be to locate a highly trained treatment process operator onsite
who has experience and knows what to watch for and how to respond to changes;
however, with remote systems, it is not always practical. Industrial water reuse,
remotely produced water treatment, and military applications often have the
same requirements for flexibility and reliability, with a low level of operator
involvement, as small communities. These applications could use a reliable,
robust, automated, and remote controlled treatment system.
Aspects of a treatment system that contribute to robustness include the
construction materials that are used; conservative process design; redundancy in
instrumentation, and control features. Requirements for remote operation and
flexibility include a full monitoring and control system to detect feed water
changes and process response to those changes, automated controls that allow
smart programming or a trained remote operator to modify operations
appropriately, an intuitive human interface, and a secure communication system.
Finally, the programmer needs evaluation parameters, target values, dead band
levels, alert levels, and actions for the system to take at each level for rising and
falling values.
This report focuses on process monitoring during variable feed water conditions,
as well as the magnitude of change in evaluation parameters, with the goal of
providing assistance in setting evaluation parameter values for initiating operation
changes to accommodate changing conditions.
1.1 Background
In 2009, the U.S. Department of Defense Office of Naval Research (ONR)
began investing in future naval capability (FNC) for shipboard desalination for
small- and large-scale applications. During the first few years, the FNC funded
development of key technologies to enable reduced footprint, enhanced energy
efficiency, and remote operations. Research performed under Federal programs

Fouling Challenge for a Robust, Remote Controlled Ultrafiltration/ Reverse Osmosis System
2
often reaches the public as dissertations, patents, or in peer reviewed literature as
papers associated tangentially with the funded project. Table 1 lists categories of
projects funded through the FNC program with references to papers and
patents proceeding from the funded work.
Table 1. Summary of Technology Innovations Arising from the ONR FNC Program
Research Area
Primary Investigator Technology References
Fouling resistance
Advanced Hydro, Inc.
Membrane coating
Agnihotri, Huang, and Li (2012) and Miller, D.J. et al. (2013)
Ohio State University New formulation Zhao and Ho (2013)
Ceramem Corporation
Coated ceramic Goldsmith and Bishop (2010)
Porogen Corporation Fouling resistant hollow fiber
Bikson, Etter, and Ching (2013)
Membrane NanoH2O, (now LG NanoH2O)
Nanocomposite seawater membrane
Kurth et al. (2012)
Sri International PBI hollow fiber membrane
Jayaweera, et al. (2014)
Separation Science Technologies/Bureau of Reclamation
Chlorine resistant, thin film membrane
Murphy, Riley, and Porras Mendoza (2014)
Spiral separation
Palo Alto Research Center
Serpentine separator
Lean, Seo, and Völkel (2012)
Monitoring and control
University of California – Los Angeles
Smart system control
Gao et al. (2014a.; 2014b.)
Note: PBI = polybenzimidazole
Remote communities need the same type of robustness the Navy needs for
shipboard desalination systems: minimal chemical requirements, energy
efficiency, and low maintenance. The Bureau of Reclamation’s (Reclamation)
Science and Technology Program provided funding to evaluate the potential for
developing robust, remote controlled water systems for small, rural communities.
As part of this effort, one of the systems designed and built under the ONR FNC
program was tested at the Reclamation Brackish Groundwater National
Desalination Research Facility
Chapter 1: Introduction
3
(BGNDRF) in Alamogordo, New Mexico, to evaluate its performance under
changing water conditions, a variety of fouling feed waters, and onsite operator
neglect.
1.2 Goals for the Project
The test system should run continuously with little operator interaction.
The ultrafiltration (UF) system should produce filtrate with a turbidity
<0.1 nephelometric turbidity units (NTU) for the reverse osmosis (RO) system,
despite changing feed water quality. It should recover from fouling episodes with
minimal onsite operator involvement. The RO permeate should meet drinking
water standards, and the membranes should maintain productivity and salt
passage characteristics through fouling episodes.

Chapter 2: Equipment and Test Facility
5
2 Equipment and Test Facility
Testing was carried out at Reclamation’s BGNDRF using the system developed
by Advanced Hydro, Inc. (AHI) under the ONR FNC shipboard desalination
program.
2.1 The System
Sea.PURe is a nominal, 5,000-gallon-per-day (gal/d), ultrafiltration/seawater
RO system. This RO system meets the size and weight restrictions for the
FNC’s 4,000-gal/d size. The specific restrictions are 2.3 square meters (m2)
wide by 1.5 meters (m) high (5 feet [ft] by 5 ft by 5 ft) and 910 kilograms
(2,000 pounds). A photo of the Sea.PURe system is shown in figure 1.
Innovative features of the system are summarized below and expanded upon in
subsequent sections:
A patented fouling resistant membrane coating that expands with hot
water (40 degrees Celsius [°C]), allowing most fouling material to be
washed out of the system
Open architecture UF design that allows for any UF or microfiltration
(MF) modules to be accommodated
RO system concentrate repurposed for UF system backwash
Remote control operation with user configurable, UF system backwash
cycles that have options for alternating flow directions, cross flow
velocity, and air scour
The UF system is fed by a 2-horsepower (hp) Goulds pump, with a second
identical pump for backwash (the two center pumps in figure 1). Both pumps
are controlled by a single 2.2-kilowatt (kW), 3-hp Danfoss AquaDrive variable
frequency drive (VFD). The RO system uses a 0.5-hp Goulds forwarding
pump (on the right) and a 15-hp Leeson motor with a 68-liter-per-minute (L/min)
Cat Pump controlled by a 11-kW, 15-hp Danfoss AquaDrive VFD under tanks
in the back. The pump on the left is a spare replacement pump for any of the
three centrifugal pumps. UF feed is degritted with a Lakos centrifugal separator
and dual Lakos TwistIIClean screens. Two chemical feed pumps are used for
chemical cleanings (citric acid and sodium hydroxide). A third antiscalant
.feed pump was added for this application. Low-pressure pipe is schedule 80
polyvinvyl chloride (PVC), and high-pressure pipe is 360 stainless steel.

Fouling Challenge for a Robust, Remote Controlled Ultrafiltration/ Reverse Osmosis System
6
Figure 1. Sea.PURe system set up at the BGNDRF (left) and a side image
from AHI (right) (Advanced Hydro, Inc., 2013).
2.1.1 Membranes As configured for this test, the system used three Dow SFP-2660 UF modules.
These membranes are polyvinylidene difluoride (PVDF), hollow fiber
modules with a nominal pore diameter of 0.03 micrometer [m], configured
for outside-in flow path. Total membrane area is 99 m2. The RO system was
filled with four LC HR-4040, DOW FILMTEC, polyamide thin-film composite
membranes in series. These membranes are rated for 11 cubic meters per day
(m3/d) (2,900 gal/d) with a stabilized salt rejection of 99.7 percent.
AHI coated both types of membrane with a patented, polydopamine based
treatment. The treatment process and formula were developed through a
Reclamation Desalination and Water Purification Research Program cooperative
agreement with the University of Texas at Austin (Ju and Freeman, 2008), and
further advanced under Phase 1 of the ONR FNC program (Agnihotri, Huang, and
Li, 2012; Miller, D.J. et al., 2013). The coating forms a brush-like surface that
expands with high temperature. Treated UF membrane was found to release
foulants more readily than untreated membrane without the use of chlorine
backwashes (chlorine would remove the coating). Hot water was used for
enhanced backwashes, and citric acid and sodium hydroxide were used for
chemical cleaning when necessary.
Because the treated UF membrane worked so well as a pretreatment to the
RO system, it was difficult to determine if the benefit sufficiently justified not
treating the RO membrane as well. However, it was hypothesized that the
treatment may aid in preventing irreversible fouling from scale formation on the
RO membrane surface.

Chapter 2: Equipment and Test Facility
7
2.1.2 Open Architecture and Footprint Free and open competition is such a critical issue for Federal acquisitions
that open architecture design was of paramount importance for the ONR
FNC program. AHI embraced the concept by allowing space and connectibility
for any UF or MF module that would fit within the space allowance.
2.1.3 RO Concentrate Backwash
The Sea.PURe system is designed for seawater desalination using the seawater
concentrate for backwash, which allows for a smaller, 100-percent recovery,
UF system (Advanced Hydro, Inc., 2013). Liberman and Liberman (2005)
advocated direct osmosis - high salinity cleaning solution. They recommended
periodically injecting a 25-percent sodium chloride solution into the RO feed to
create a reverse flow of permeate back through the membrane, lifting fouling
material and causing osmotic shock to biofilms. Periodic extreme changes in
ionic strength would have the same benefit for UF membrane. Seawater
concentrate would be closer to 7.5 to 8 percent salinity, which would still be
sufficient for a moderate cleaning effect. The higher ionic strength would also
then continue, after each backwash, to the RO system for a similar cleansing
effect.
A significant benefit to using the RO concentrate for backwash is that no
UF filtrate is wasted. All production capacity can be used for feeding the
RO system. The limit of backwashing frequency and duration is determined by
the volume of RO concentrate. For seawater systems operating at 40- to
50-percent recovery, at least 50 to 60 percent of the UF filtrate flow is available
for backwash. At BGNDRF, however, operating at up to 80-percent recovery by
recycling part of the RO concentrate to the feed tank limited the available volume
for backwashing.
2.1.4 Remote Control System Once stable operation has been achieved onsite, the system is capable of remote
control from anywhere with Internet service using screen-sharing software.
Figure 2 shows the main process monitoring screen and human-machine
interface. Solid blue lines show the direction of flow during normal operation,
dashed lines show optional backwash direction from P2, and the dotted lines
show optional direction for RO concentrate.
Table 2 lists process control input parameters for each process stream. Control
outputs are automated valves to control direction of flow, actuation and speed of
three chemical feed pumps (acid, base, and antiscalant), and four process pumps.
The control strategy is to keep the RO system running continuously, at constant
UF filtrate and RO permeate flow, by adjusting pump speed. The RO permeate
flow target is set to meet the maximum system production rate of 25 m3/d
(6,700 gal/d). The UF system is set to produce enough filtrate to maintain the
RO feed tank level. RO concentrate fills the UF backwash tank and then

Fouling Challenge for a Robust, Remote Controlled Ultrafiltration/ Reverse Osmosis System
8
overflows to drain. The RO feed tank is sized at 190 liters (50 gallons) to keep
the RO system supplied while the UF system is in backwash mode.
Figure 2. Main Process Monitoring & Human-Machine Interface.
Table 2. Process Control Inputs
Lo
cati
on
Parameter Pressure Flow Turbidity Conductivity Temperature pH
Feed X
Inlet strainer X X
UF feed X
UF filtrate X X X
UF retentate X
UF backwash/ clean-in-place
X X
RO feed X X X
RO permeate X X
RO concentrate X
RO concentrate recycle
X

Chapter 2: Equipment and Test Facility
9
There are a variety of options for the UF backwash cycle besides frequency. It
can be backwashed from the top end of the module, through the fibers, and back
out the top (in at V4 and out at V2) or through the top and out the bottom (in at
V4 and out at V6), with or without air scour, at a specified flow rate which sets
the duration. Figure 3 shows the flow paths for the two directional options and
the forward flush. Two different backwash cycle methods can be specified on the
backwash setup screen. A ratio is set to specify how often to use each method
(for example, 1:1, as used for this test, alternates methods every cycle). The
maximum frequency depends on the available concentrate flow. With brackish
water, it is necessary to recycle part of the RO concentrate to the RO feed tank to
attain higher recovery rates. For this test, with 80-percent recovery, the maximum
backwash frequency was three times per hour.
2.2 BGNDRF
The BGNDRF is located in Alamogordo, New Mexico, 85 miles north of El Paso,
Texas, and 16 miles east of White Sands National Monument. The facility is a
40-acre research service facility. Private parties, universities, and Federal and
State Government agencies carry out research projects at the facility on brackish
water treatment, concentrate management, saline agricultural methods, and
harvesting of alternative energy from wind and sun. There are six test bays
inside the facility and four larger test pads outside. Each test area has access to
four wells at different depths that provide brackish groundwater with a range of
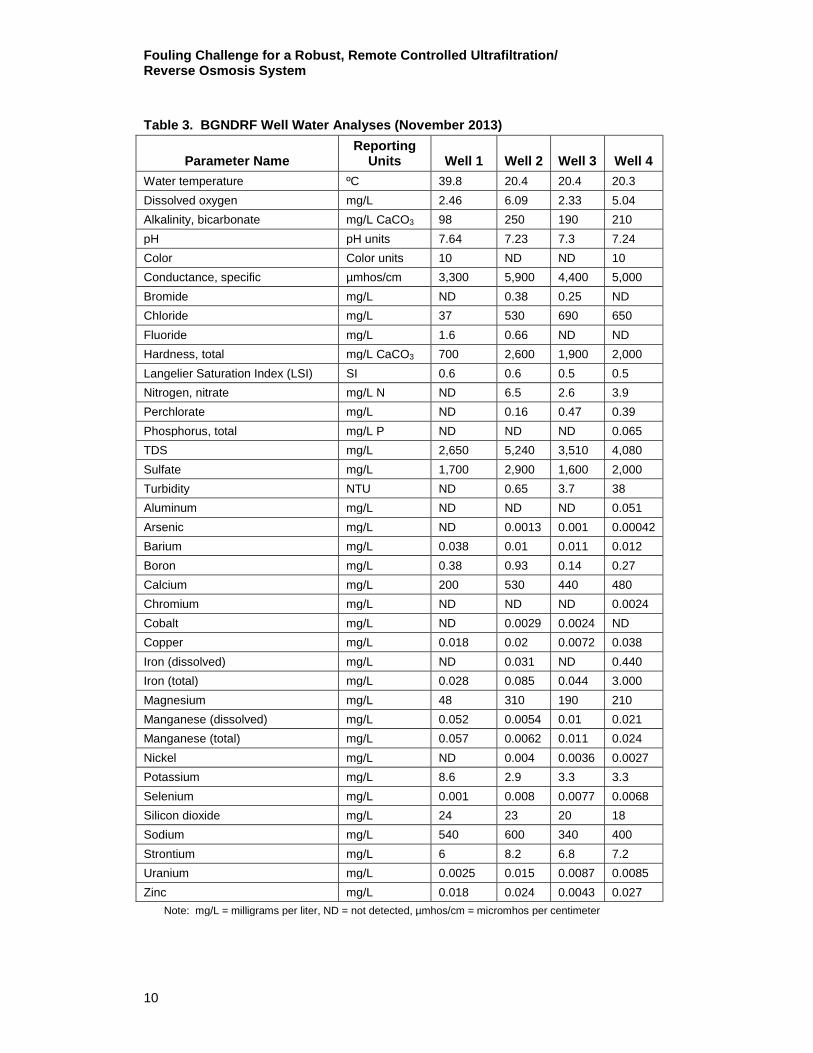
dissolved solids composition. Table 3 provides a summary of the well water
compositions. More detailed information on the facility is available at
http://www.usbr.gov/research/AWT/BGNDRF. The testing for this project
started with Well 2 but, due to technical difficulties, was moved to Well 4,
and then completed with Well 3.
Figure 3. Back flush cycles 2 and 3 and forward flush cycle for the UF elements.
Fouling Challenge for a Robust, Remote Controlled Ultrafiltration/ Reverse Osmosis System
10
Table 3. BGNDRF Well Water Analyses (November 2013)
Parameter Name Reporting
Units Well 1 Well 2 Well 3 Well 4
Water temperature ºC 39.8 20.4 20.4 20.3
Dissolved oxygen mg/L 2.46 6.09 2.33 5.04
Alkalinity, bicarbonate mg/L CaCO3 98 250 190 210
pH pH units 7.64 7.23 7.3 7.24
Color Color units 10 ND ND 10
Conductance, specific µmhos/cm 3,300 5,900 4,400 5,000
Bromide mg/L ND 0.38 0.25 ND
Chloride mg/L 37 530 690 650
Fluoride mg/L 1.6 0.66 ND ND
Hardness, total mg/L CaCO3 700 2,600 1,900 2,000
Langelier Saturation Index (LSI) SI 0.6 0.6 0.5 0.5
Nitrogen, nitrate mg/L N ND 6.5 2.6 3.9
Perchlorate mg/L ND 0.16 0.47 0.39
Phosphorus, total mg/L P ND ND ND 0.065
TDS mg/L 2,650 5,240 3,510 4,080
Sulfate mg/L 1,700 2,900 1,600 2,000
Turbidity NTU ND 0.65 3.7 38
Aluminum mg/L ND ND ND 0.051
Arsenic mg/L ND 0.0013 0.001 0.00042
Barium mg/L 0.038 0.01 0.011 0.012
Boron mg/L 0.38 0.93 0.14 0.27
Calcium mg/L 200 530 440 480
Chromium mg/L ND ND ND 0.0024
Cobalt mg/L ND 0.0029 0.0024 ND
Copper mg/L 0.018 0.02 0.0072 0.038
Iron (dissolved) mg/L ND 0.031 ND 0.440
Iron (total) mg/L 0.028 0.085 0.044 3.000
Magnesium mg/L 48 310 190 210
Manganese (dissolved) mg/L 0.052 0.0054 0.01 0.021
Manganese (total) mg/L 0.057 0.0062 0.011 0.024
Nickel mg/L ND 0.004 0.0036 0.0027
Potassium mg/L 8.6 2.9 3.3 3.3
Selenium mg/L 0.001 0.008 0.0077 0.0068
Silicon dioxide mg/L 24 23 20 18
Sodium mg/L 540 600 340 400
Strontium mg/L 6 8.2 6.8 7.2
Uranium mg/L 0.0025 0.015 0.0087 0.0085
Zinc mg/L 0.018 0.024 0.0043 0.027
Note: mg/L = milligrams per liter, ND = not detected, µmhos/cm = micromhos per centimeter
Chapter 3: Evaluation Methods
11
3 Evaluation Methods
The test plan called for four stages of evaluation: (1) startup, (2) increasing
RO system recovery, (3) fouling, and (4) high recovery. The high recovery stage
was concluded with cleaning and reevaluation of post-cleaning performance.
3.1 Overall Evaluations
In addition to the specific system performance metrics described below, the
overall system was evaluated on responsiveness to changing conditions, ease of
use, reliability, and power consumption (ease of use was subjective). Reliability
was evaluated on the number of incidents related to equipment function. Power
consumption was calculated for the UF system based on the 2-hp pump motor
size, estimated 85-percent combined pump and motor efficiency, pump speed,
and flow; and considering that both the UF feed pump and backwash pump are
the same type of pump and are controlled by the same VFD with 98-percent
efficiency. The RO power is based on flow and pressure, considering the RO feed
pump/motor size is 15 hp with 92.4-percent efficiency driven by a VFD with
98-percent efficiency.
3.2 UF System Evaluation
The UF system was evaluated on its ability to provide continuous flow, of
acceptable quality, to the RO system, despite the fouling challenge. There are
two aspects of such an evaluation: (1) the degree to which the UF membranes
resist fouling, and (2) the effectiveness of the backwash cycle in recovering
performance.
3.2.1 Feed Water Quality Turbidity of the feed solution is measured after the cyclone separator and before
the screen filters. Variation in turbidity during each of the fouling challenges was
due to accumulation in the cyclone separator; adsorption on the sides of the tank,
which periodically sloughed off and plugged the injection line; and exhaustion of
foulant solution.
Conductivity measurements of the UF filtrate were used to monitor changes in
incoming water quality and the degree of change from backwash events.
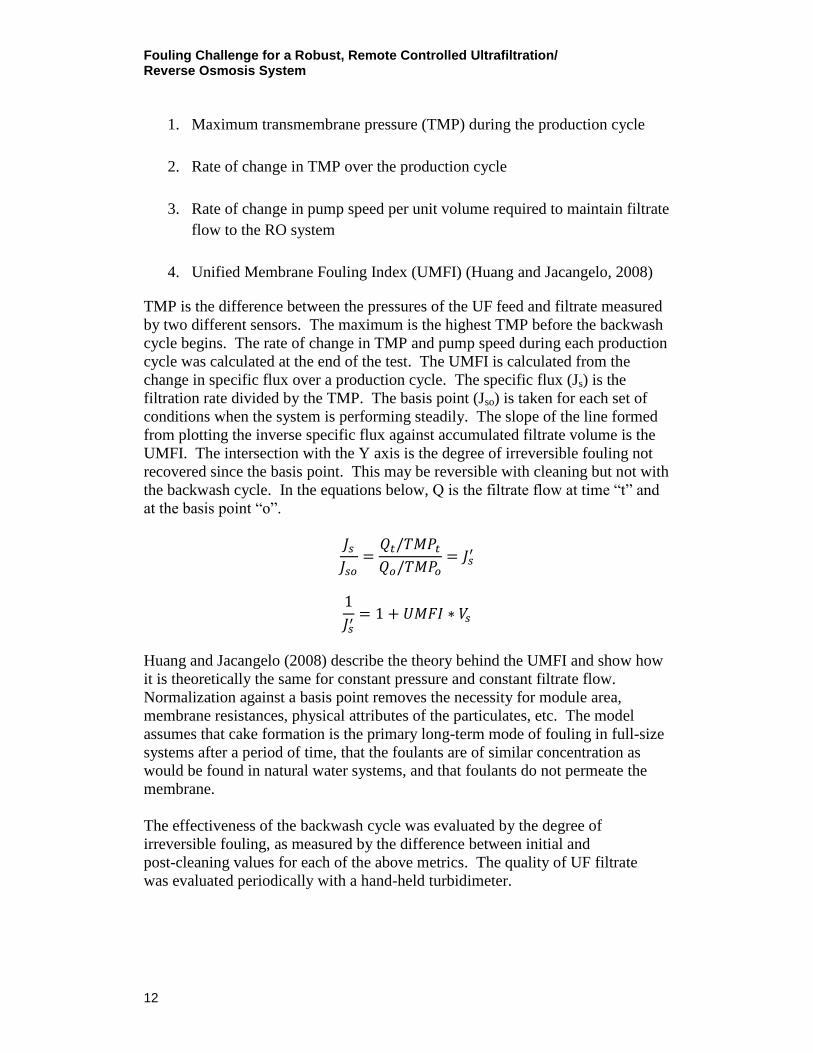
3.2.2 Fouling Degree of fouling was evaluated through:
Fouling Challenge for a Robust, Remote Controlled Ultrafiltration/ Reverse Osmosis System
12
1. Maximum transmembrane pressure (TMP) during the production cycle
2. Rate of change in TMP over the production cycle
3. Rate of change in pump speed per unit volume required to maintain filtrate
flow to the RO system
4. Unified Membrane Fouling Index (UMFI) (Huang and Jacangelo, 2008)
TMP is the difference between the pressures of the UF feed and filtrate measured
by two different sensors. The maximum is the highest TMP before the backwash
cycle begins. The rate of change in TMP and pump speed during each production
cycle was calculated at the end of the test. The UMFI is calculated from the
change in specific flux over a production cycle. The specific flux (Js) is the
filtration rate divided by the TMP. The basis point (Jso) is taken for each set of
conditions when the system is performing steadily. The slope of the line formed
from plotting the inverse specific flux against accumulated filtrate volume is the
UMFI. The intersection with the Y axis is the degree of irreversible fouling not
recovered since the basis point. This may be reversible with cleaning but not with
the backwash cycle. In the equations below, Q is the filtrate flow at time “t” and
at the basis point “o”.
𝐽𝑠
𝐽𝑠𝑜=
𝑄𝑡/𝑇𝑀𝑃𝑡
𝑄𝑜/𝑇𝑀𝑃𝑜= 𝐽𝑠
′
1
𝐽𝑠′
= 1 + 𝑈𝑀𝐹𝐼 ∗ 𝑉𝑠
Huang and Jacangelo (2008) describe the theory behind the UMFI and show how
it is theoretically the same for constant pressure and constant filtrate flow.
Normalization against a basis point removes the necessity for module area,
membrane resistances, physical attributes of the particulates, etc. The model
assumes that cake formation is the primary long-term mode of fouling in full-size
systems after a period of time, that the foulants are of similar concentration as
would be found in natural water systems, and that foulants do not permeate the
membrane.
The effectiveness of the backwash cycle was evaluated by the degree of
irreversible fouling, as measured by the difference between initial and
post-cleaning values for each of the above metrics. The quality of UF filtrate
was evaluated periodically with a hand-held turbidimeter.

Chapter 3: Evaluation Methods
13
3.3 RO System
The RO system is evaluated through changes in normalized permeate flow (NPF)
and salt passage (SP) with increasing recovery rate and through fouling
challenges. The NPF is the permeate flow normalized for net driving pressure
(NDP) and temperature differences through the temperature correction factor.
𝑁𝐷𝑃 = 𝑃𝑎𝑝𝑝 − ∆𝜋 −1
2∆𝑃 − 𝑃𝑝
Where:
∆𝜋: osmotic potential of the feed/concentrate mixture 1
2∆𝑃: one half the pressure difference across the vessel
𝑃𝑝: product backpressure, which in this application is zero as the
product exits into a tank at atmospheric pressure
Bulk osmotic potential is calculated according to the equation below from the
feed water composition and instantaneous recovery rate, which is the permeate
flow divided by the feed flow. When concentrate is not recycled to the RO feed
tank, this is also the overall recovery rate.
∆𝜋 = ∆𝑛𝑅𝑇
Where “n” is the difference between the log mean of the number of moles
of ions in the feed-concentrate solution and the permeate stream. Molar
concentration is calculated from the composition and conductivity of the feed
solutions using the average molar mass and ratio of conductivity to TDS for each
well, as listed in table 4. The magnitude of the permeate concentration is small
enough to be considered insignificant with high rejection brackish water
membranes and brackish source water. “R” is the universal gas constant, and
“T” is temperature in degrees Kelvin.
Table 4. Well Characteristics Required for Estimating Osmotic Potential
Well 1 Well 2 Well 3 Well 4
Ratio of conductivity to TDS [𝐒
𝒄𝒎⁄𝒎𝒈
𝑳⁄] 1.25 1.13 1.25 1.23
Average molar mass (grams per mol) 57.6 51.7 48.4 50.8

Fouling Challenge for a Robust, Remote Controlled Ultrafiltration/ Reverse Osmosis System
14
NPF is calculated according to following equation:
𝑁𝑃𝐹 = 𝑄𝑝 ∗𝑁𝐷𝑃𝑟
𝑁𝐷𝑃𝑡∗
𝑇𝐶𝐹𝑟
𝑇𝐶𝐹𝑡
Where Qp is the RO permeate flow. Subscript “r” indicates the reference data
point at each step change in flow and/or recovery, while “t” is the data point at a
particular time afterwards. The temperature correction factor used is from AHI:
𝑇𝐶𝐹 = exp {1250 ∗ [1
298.15−
1
(𝑇 + 273.15)]}
Where “T” is the temperature in centigrade at time “t”.
Instantaneous recovery is the ratio of RO permeate to RO feed. With recycling of
the concentrate to the RO feed, the overall recovery is calculated as:
𝑅𝑒𝑐𝑜𝑣𝑒𝑟𝑎𝑙𝑙 =𝑄𝑝
(𝑄𝑓 − 𝑄𝑟𝑒𝑐𝑦𝑐𝑙𝑒)
The log mean concentration factor used for calculating SP and osmotic potential
of the feed-concentrate solution is calculated using the instantaneous recovery,
rather than the overall recovery, because the feed conductivity is taken after
recycle mixing:
𝐶𝐹 =𝐿𝑁 [
11 − 𝑅𝑒𝑐𝑖𝑛𝑠𝑡𝑎𝑛𝑡𝑎𝑛𝑒𝑜𝑢𝑠
]
𝑅𝑒𝑐𝑖𝑛𝑠𝑡𝑎𝑛𝑡𝑎𝑛𝑒𝑜𝑢𝑠
SP normalized for temperature and flow is then calculated as:
𝑆𝑃 = [𝐶𝑝
𝐶𝑓 ∗ 𝐶𝐹] ∗
𝑇𝐶𝐹𝑟
𝑇𝐶𝐹𝑡∗
𝑄𝑝(𝑡)
𝑄𝑝(𝑟)
Subscript “p” is the permeate stream, “f” is the feed stream, “r” and “t” are as
defined above. Conductivity “C” is used to estimate concentration of permeate
and feed streams.
3.4 Recovery Tests
From previous work (Chapman, 2013), it is known that recovery greater than
25 percent will result in scaling when using the Well 2 groundwater without
antiscalant. Upon startup, the system was operated for 20 days at 45 L/min

Chapter 3: Evaluation Methods
15
(12 gallons per minute [gal/min]) feed flow at 23- to 25-percent recovery to
ensure the connections were sound and that water quality would be as expected
from Well 2. After 9 days, Well 2 went off-line due to a power failure. The
project was switched between Wells 1, 3, and 4 until pump issues were resolved,
and, eventually, Well 3 was used for the remainder of the testing. The antiscalant
projection software, Avista Advisor (version 3.21; Avista Technologies, 1999),
was used to project maximum recovery, antiscalant selection, and dosing. Table 5
describes the level of saturation from the two primary wells over the range of
recovery rates used during the testing, and recommended antiscalant dose.
Table 5. Saturation Indicators for Wells 2 and 3
Well 2 Well 3 Maximum
Raw 25% Raw 25% 50% 80% 85%
With
Vitec 7000*
LSI 0.59 0.84 0.4 0.53 1.03 2.16 2.53 ≤2.5
S&DSI 0.25 0.41 0.22 0.51 0.91 1.73 2.02
CaSO4 IP/Ksp 1.03 1.47 0.64 0.94 1.58 4.68 6.54 7
BaSO4 IP/Ksp 1.87 2.60 1.51 2.07 3.28 9.24 12.75 300
SrSO4 IP/Ksp 0.88 1.19 0.54 0.73 1.13 3.09 4.21 35
Ca F2 IP/IP maximum 0.40 0.94 ND 0 0 0 0 1,000
Calcium carbonate precipitation potential
37.3 82.2 13.9 35.1 91.1 451.5 692.6 ≤900
Silica (mg/L) 24 31 20.0 26.3 39.9 99.1 133 120
Iron and manganese 0.01 0.02 0.05 0.07 0.10 0.22 0.29 3.94
Recommended dose of
Vitec 7000 (mg/L)
4.08 2.74 2.44 5.44
*Avista Technologies Vitec® 7000 Data Sheet plus maximum recovery for Well 4 is 24 percent due to iron and manganese saturation.
Note: S&DSI = Stiff and Davis Stability Index, IP/Ksp = ion product divided by the solubility product.
A 10-percent solution of Avista’s Vitec 7000 antiscalant was prepared with
RO permeate and dosed at approximately 0.5 milliliter per minute (mL/min) into
the filtrate flow (22.7 L/min) entering the RO feed tank for an average dose of
1.85 mg/L of antiscalant. This is less than the recommended dose identified
above; however, the lower dose was justified because antiscalant was injected into
the RO feed tank, where it would be blended with recycled RO concentrate with
concentrated antiscalant, and the antifouling coating on the RO membrane was
expected to provide some degree of protection.

Fouling Challenge for a Robust, Remote Controlled Ultrafiltration/ Reverse Osmosis System
16
3.5 Fouling Tests
Fouling challenges were conducted for 10 days while the system was operating at
a target of 80-percent recovery using Orchid Pro (20 mg/L), blue-green algae
(20 mg/L and 10 mg/L), Kaolin powder (10 mg/L), and sodium alginate
(20 mg/L). The following sections summarize each of these substances and its
relevance to the study.
3.5.1 Orchid Pro Orchid Pro is a natural fertilizer produced by Turf Pro USA. As described by the
company (Turf Pro USA, 2014), Orchid Pro is a cold water extract of natural
humate that contains trace elements, microorganisms, a full spectrum of humic
and fulvic acids, organic carbon, and lignin, with 3% chelated iron. The solution
is dark brown. These compounds are derived from plant matter and are classified
as allochthonous natural organic matter (NOM). Characterization of NOM
through Fluorescence Excitation-Emission Matrix analysis was used by Lozier
and collaborators to describe different types of NOM and determine their
contribution to low-pressure membrane fouling (Lozier et al., 2008). PVDF UF
membrane (also used in this study) was found to be less susceptible to fouling
from allochtonous NOM than other membrane formulations that were evaluated
(Huang, 2005). The molecular mass range for humic/fulvic/umlic acids from lake
sediment is mostly under 10,000 daltons with 20 to 30 percent under 700 daltons
(Ishiwatari, 1971; Lozier et al., 2008).
Orchid Pro was injected into the UF feed tank as a 2.5-gram-per liter (g/L)
solution at a rate of 170 mL/min to attain an average feed concentration of
20 mg/L as the commercial product. The turbidity increased from an average of
3.3 NTU for the raw well water, to an average of 7.3 NTU the first day, and
8.5 NTU the second day.
3.5.2 Blue-green Algae Chlorella blue-green algae (broken cell) was purchased from Bulk Supplements in
Henderson, Nevada (Bulk Supplements, 2014). The powder was mixed with raw
water in a kitchen blender at high speed for 1 minute, then diluted with raw water
to a concentration of 2.5 grams per liter, and, finally, injected at 170 mL/min into
the UF feed tank for a target concentration of 20 mg/L of the powdered algae. The
turbidity of the UF feed with blue-green algae at 20 mg/L averaged around 13.5
NTU. After dosing the first batch of blue-green algae, the concentration was cut
in half due to intensive fouling. At 10 mg/L, the average turbidity was 5.6 NTU.
Blended blue-green algae could be classified as autochthonous NOM because it is
derived from cell tissues with associated polysaccharides and proteins. This type
of NOM was the most problematic foulant of the types evaluated by Lozier and
collaborators (Lozier et al., 2008; Amy, 2008).

Chapter 3: Evaluation Methods
17
3.5.3 Kaolin Powder Food grade kaolin powder, Al2Si2O5(OH)4, was purchased from the Frontier
Co-op through Amazon’s Web site (Amazon, 2014). It is a fine, whitish-green
powder with a density of 2.6 grams per cubic centimeter (Wenk and Bulakh,
2004). Kaolin powder is used to make white ceramic goods; as a coating agent
for paint; as a filler for paper; as an ingredient in soap, facial products, and baby
powder; as an antacid in Kaopectate; and as a clotting agent in bandages. The
mineral absorbs heavy metals, toxins, and oils. It does not dissolve in water but
forms a slowly settling suspension. It was chosen for this study as a fine
particulate to simulate runoff conditions in surface water treatment.
Kaolin powder was blended with well water in the kitchen blender on high speed
for only 20 seconds, which was sufficient to form a suspension. It was dosed to
produce a feed solution to the UF system of 10 mg/L of kaolin. Turbidity ranged
from 5.2 to 31 NTU, with an average of 8.3 NTU.
3.5.4 Sodium Alginate Sodium alginate, or alginic acid, was purchased from Modernist Pantry. An
extract of brown seaweed, this product is capable of absorbing 200 to 300 times
its weight in water, forming a gelatinous liquid. It is used as a food thickener and
impression material for life casting. In high concentrations, the gel can be molded
and cured by air drying. It was chosen for the fouling study to simulate water
quality during natural algal blooms.
The alginate powder was blended in small quantities into well water to avoid
solidification and then injected into the UF feed tank to produce a concentration
of 20 mg/L of alginate powder. Turbidity during alginate runs ranged from 2 to
23 NTU, with an average of 6.3.

Chapter 4: Results
19
4. Results
Results are presented first for the overall responsiveness to changing conditions
and ease of use. Then, more specific results are presented for the RO and
UF systems during the fouling challenge, cleaning after the fouling challenge,
and, finally, the power consumption.
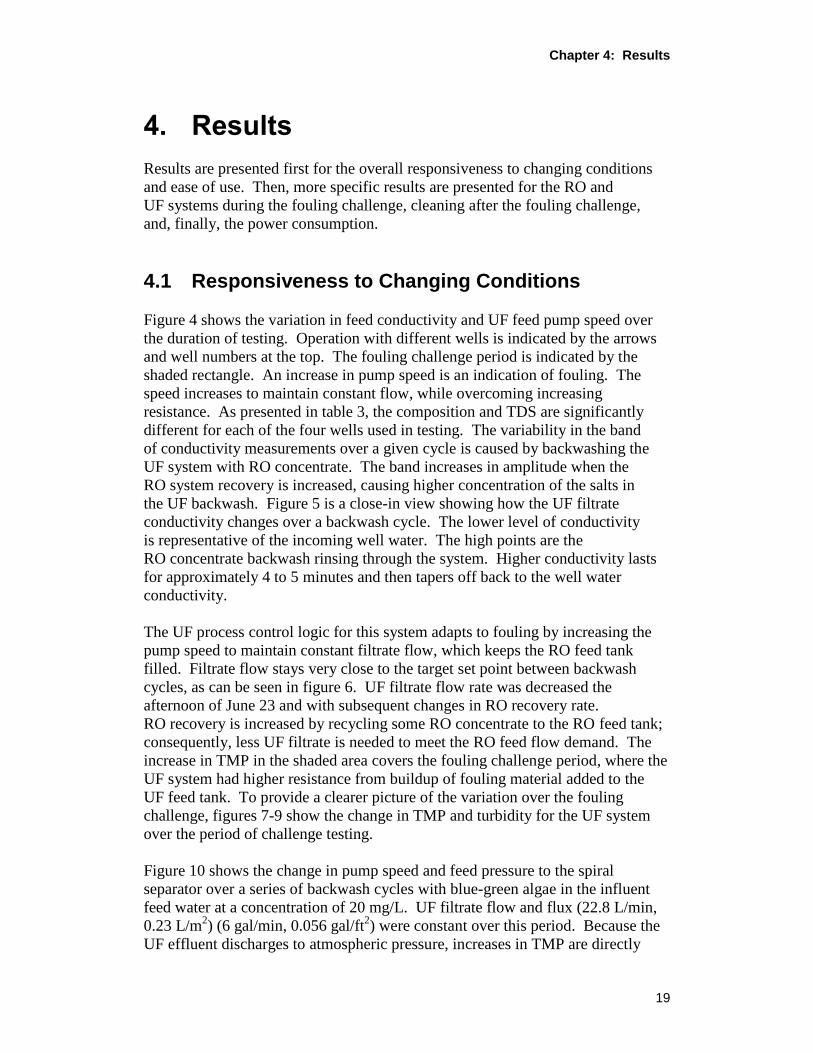
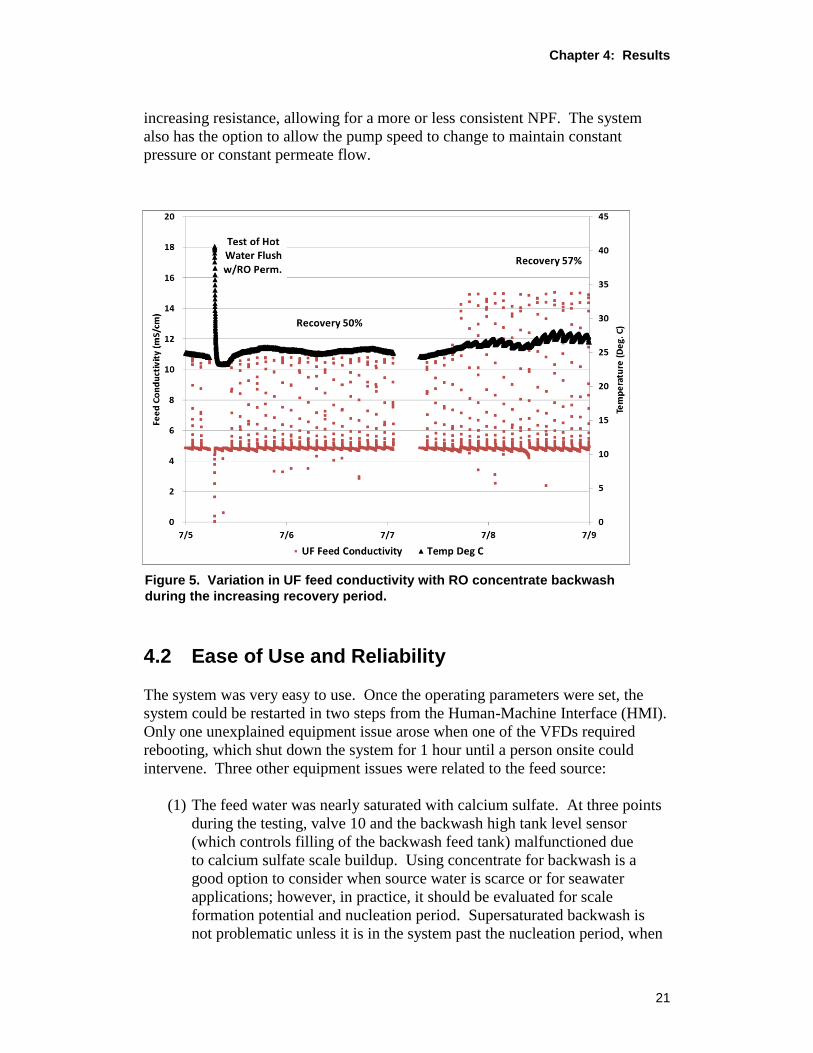
4.1 Responsiveness to Changing Conditions
Figure 4 shows the variation in feed conductivity and UF feed pump speed over
the duration of testing. Operation with different wells is indicated by the arrows
and well numbers at the top. The fouling challenge period is indicated by the
shaded rectangle. An increase in pump speed is an indication of fouling. The
speed increases to maintain constant flow, while overcoming increasing
resistance. As presented in table 3, the composition and TDS are significantly
different for each of the four wells used in testing. The variability in the band
of conductivity measurements over a given cycle is caused by backwashing the
UF system with RO concentrate. The band increases in amplitude when the
RO system recovery is increased, causing higher concentration of the salts in
the UF backwash. Figure 5 is a close-in view showing how the UF filtrate
conductivity changes over a backwash cycle. The lower level of conductivity
is representative of the incoming well water. The high points are the
RO concentrate backwash rinsing through the system. Higher conductivity lasts
for approximately 4 to 5 minutes and then tapers off back to the well water
conductivity.
The UF process control logic for this system adapts to fouling by increasing the
pump speed to maintain constant filtrate flow, which keeps the RO feed tank
filled. Filtrate flow stays very close to the target set point between backwash
cycles, as can be seen in figure 6. UF filtrate flow rate was decreased the
afternoon of June 23 and with subsequent changes in RO recovery rate.
RO recovery is increased by recycling some RO concentrate to the RO feed tank;
consequently, less UF filtrate is needed to meet the RO feed flow demand. The
increase in TMP in the shaded area covers the fouling challenge period, where the
UF system had higher resistance from buildup of fouling material added to the
UF feed tank. To provide a clearer picture of the variation over the fouling
challenge, figures 7-9 show the change in TMP and turbidity for the UF system
over the period of challenge testing.
Figure 10 shows the change in pump speed and feed pressure to the spiral
separator over a series of backwash cycles with blue-green algae in the influent
feed water at a concentration of 20 mg/L. UF filtrate flow and flux (22.8 L/min,
0.23 L/m2) (6 gal/min, 0.056 gal/ft
2) were constant over this period. Because the
UF effluent discharges to atmospheric pressure, increases in TMP are directly

Fouling Challenge for a Robust, Remote Controlled Ultrafiltration/ Reverse Osmosis System
20
related to the pump speed, resistance through the spiral separator, screen, and
UF modules. When there is an extreme blockage, the pump will ramp up to its
maximum 3,450 revolutions per minute (r/min) in an attempt to maintain flow.
At three points in figure 10 (two backwashes before 4 a.m., and one backwash
after 8 a.m.), the pump had to ramp up to overcome increased resistance due to
blockage of the screen and/or UF membrane with blue-green algae. When the
blockage was finally cleared by the self-cleaning mechanism, the flow suddenly
increased until speed controls regained the target set point (as happened after
8:30 a.m. in figure 10).
Figure 4. Feed conductivity and UF feed pump speed.
The alternating back-flush cycles may help the system to overcome fouling
buildup by changing the direction of backflush flow with every cycle. During this
test, the backflush cycle was alternated between cycle 2 and cycle 3, as illustrated
in figure 3. After each backflush, there is a forward flush with air scour.
The RO system was operated at constant speed from the high-pressure, positive
displacement, RO feed pump (P4 in figure 2). Constant speed allows the pressure
to rise with increasing resistance due to fouling or changes in osmotic differential
between the bulk feed and permeate. In this mode, the NDP increases with
Chapter 4: Results
21
increasing resistance, allowing for a more or less consistent NPF. The system
also has the option to allow the pump speed to change to maintain constant
pressure or constant permeate flow.
Figure 5. Variation in UF feed conductivity with RO concentrate backwash
during the increasing recovery period.
4.2 Ease of Use and Reliability
The system was very easy to use. Once the operating parameters were set, the
system could be restarted in two steps from the Human-Machine Interface (HMI).
Only one unexplained equipment issue arose when one of the VFDs required
rebooting, which shut down the system for 1 hour until a person onsite could
intervene. Three other equipment issues were related to the feed source:
(1) The feed water was nearly saturated with calcium sulfate. At three points
during the testing, valve 10 and the backwash high tank level sensor
(which controls filling of the backwash feed tank) malfunctioned due
to calcium sulfate scale buildup. Using concentrate for backwash is a
good option to consider when source water is scarce or for seawater
applications; however, in practice, it should be evaluated for scale
formation potential and nucleation period. Supersaturated backwash is
not problematic unless it is in the system past the nucleation period, when
Fouling Challenge for a Robust, Remote Controlled Ultrafiltration/ Reverse Osmosis System
22
crystals begin to form. After that point, precipitation is catalyzed more
readily. Another option would be to use noncontact level sensors and an
easily accessible screen to keep crystals out of valves and prevent them
from entering the UF system in the backwash process.
Figure 6. UF system filtrate flow and transmembrane pressure. Shaded
column covers the fouling challenge period.
(2) The feed turbidimeter required programming to clean more frequently
during the blue-green algae fouling challenge.
(3) The prefiltration screens had to be taken out of service during the
blue-green algae fouling challenge due to clogging at the time indicated by
a star in figure 4. The screen maintenance alarm was based on the
pressure difference across the screens, but the increase in pressure was
only for one data point before the cycle completed, and the condition was
over. During the worst instance, around 8:30 a.m. (shown in figure 10),
the high pressure lasted for only 3 minutes. The alarm must be “latched”
so that if the event occurs and resolves, the remote operator will still see it
and be able to respond. The issue was noticed by the remote operator
Chapter 4: Results
23
when the pump speed reached its maximum level. New screens were
plugged instantly, so the problem was permanently resolved by removing
the screens from the vessels and allowing the UF membranes to handle the
increased load of algae.
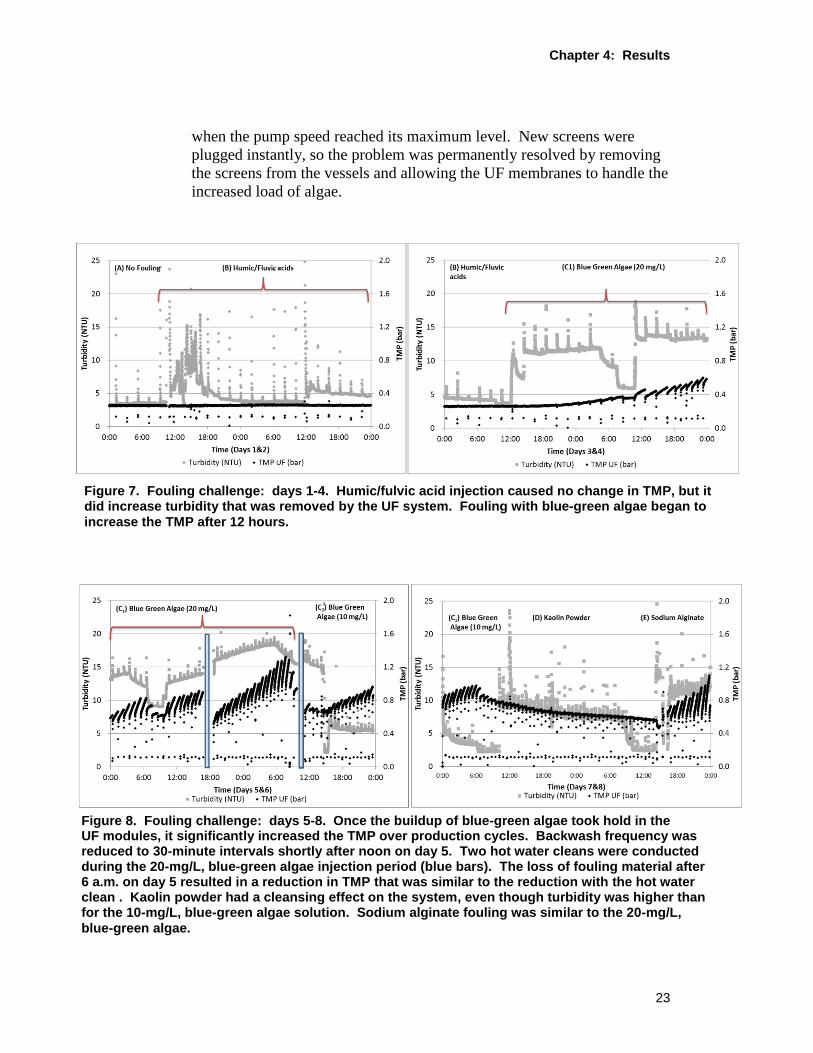
Figure 7. Fouling challenge: days 1-4. Humic/fulvic acid injection caused no change in TMP, but it did increase turbidity that was removed by the UF system. Fouling with blue-green algae began to
increase the TMP after 12 hours.
Figure 8. Fouling challenge: days 5-8. Once the buildup of blue-green algae took hold in the UF modules, it significantly increased the TMP over production cycles. Backwash frequency was reduced to 30-minute intervals shortly after noon on day 5. Two hot water cleans were conducted during the 20-mg/L, blue-green algae injection period (blue bars). The loss of fouling material after 6 a.m. on day 5 resulted in a reduction in TMP that was similar to the reduction with the hot water clean . Kaolin powder had a cleansing effect on the system, even though turbidity was higher than for the 10-mg/L, blue-green algae solution. Sodium alginate fouling was similar to the 20-mg/L,
blue-green algae.
Fouling Challenge for a Robust, Remote Controlled Ultrafiltration/ Reverse Osmosis System
24
Figure 9. Fouling challenge: days 9-10 and 1 week later. The system began to recover from fouling as soon as the fouling challenge was complete. A hot water clean was performed at the end of the challenge. Residual turbidity was due to accumulation in and on the walls of the UF feed tank, which worked its way out over time. After 1 week, the system was almost back to prefouling condition with
hot water as the only cleaning agent.
Figure 10. UF system pretreatment separator inlet pressure and pump speed during algae challenge. Two cycles before 4 a.m. show increases in pump
speed caused by screen plugging.

Chapter 4: Results
25
4.3 RO System
Figures 11 and 12 show RO system flow and pressure parameters. NPF and NDP
are normalized at each level of recovery. RO feed flow was constant because of
the mode of operation with constant pump speed. As described above, this
resulted in fairly constant NPF. The feed pressure and NDP increased with
recovery rate and after the fouling challenge when recovery was over 80 percent.
The steady increase in NDP at the end of the challenge, with increasing recovery,
indicates that scale was building up in the RO system. The cleaning process at the
end of the test brought the NDP back in line with previous levels, though, as
discussed below.
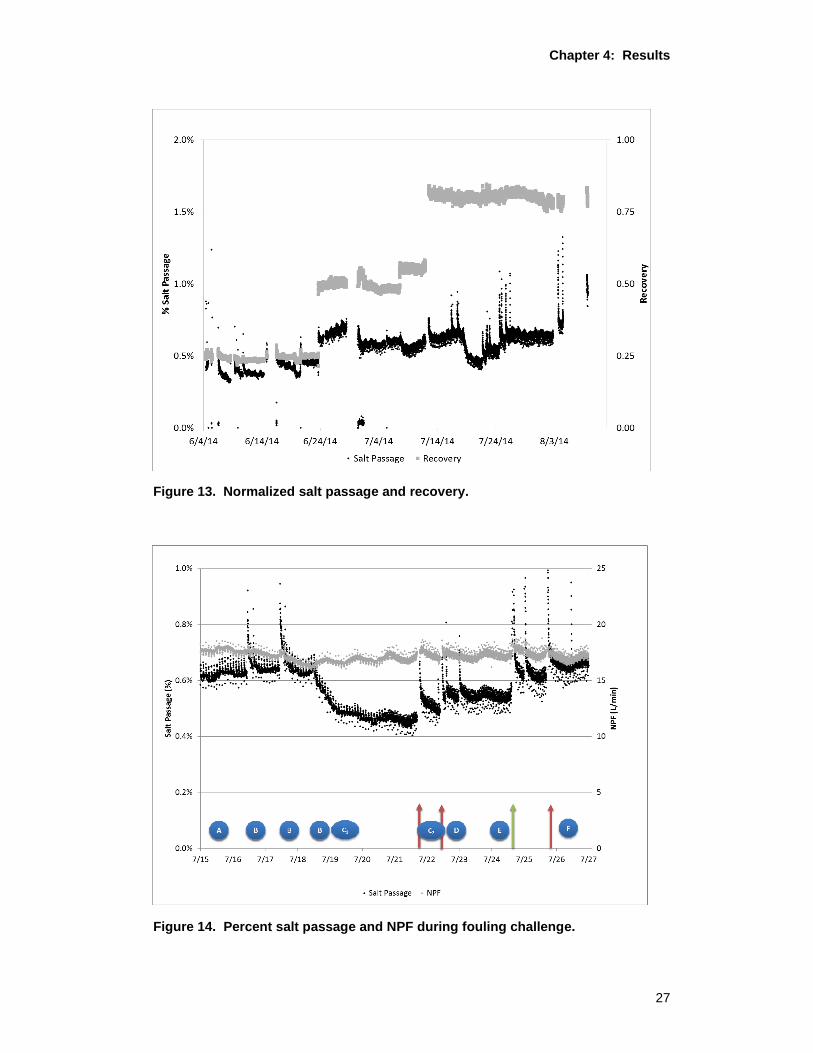
Figure 13 shows SP and recovery. The SP started out near 99.7 percent, which is
the level claimed on the manufacturer’s specification sheet for stabilized salt
rejection (Dow, 2014). SP increased by a few points with the highest recovery,
which could be due to high ionic strength that overwhelmed the charge repulsion
characteristics. Added concentration to the feed water from UF backwashing with
RO concentrate added approximately 3 milliSiemens per centimeter of
conductivity to the RO feed tank, which showed up in the feed conductivity for up
to 10 minutes after each backwash. The added salt loading resulted in an increase
in permeate conductivity of approximately 40 S/cm, which tapered off over
20 minutes.
Figure 14 shows greater detail about the response of SP and NPF to the fouling
challenge and subsequent passive cleaning. Letters in figure 14 correspond to
fouling events described in table 6. Red arrows indicate hot water cleaning of the
UF system, which requires shutting down the RO. The green arrow indicates a
shutdown to remove screen filters. NPF fluctuates with diurnal temperature
changes and with the change in NDP caused by the fluctuation in concentration
with backwash cycles.
SP decreased during the fouling challenge, most likely due to adsorption of
organic matter from the humic and fulvic acids, which are too small to be
removed by UF membrane. On the other hand, the foulant material may have
reacted with calcium, or other components of the well water, while in the RO feed
tank and then formed a coating on the membrane surface, which hindered salt
transport. Detailed analysis was not performed on the RO permeate to determine
if the reduction in SP was specific to any particular ion. SP returned to prefouling
levels by the end of the fouling challenge; however, it then increased by one-third
after the chemical cleaning, which corresponded to a decline in rejection rate from
99.6 percent to 99.1 percent. Other spikes in salt passage were due to system
shutdowns due to loss of feedwater (7/16, 7/26), programming change (7/17), and
scale buildup in the backwash tank (7/23, 7/25).

Fouling Challenge for a Robust, Remote Controlled Ultrafiltration/ Reverse Osmosis System
26
Figure 11. RO system productivity performance parameters – feed flow
and pressure-temperature normalized permeate flow.
Figure 12. RO system performance parameters - pressure.
Chapter 4: Results
27
Figure 13. Normalized salt passage and recovery.
Figure 14. Percent salt passage and NPF during fouling challenge.

Fouling Challenge for a Robust, Remote Controlled Ultrafiltration/ Reverse Osmosis System
28
Table 6. Fouling Events and Their Effect on UF System Performance
Foulant Additive
Dose (mg/L)
Rate of Change in
TMP (mbar/min)
UMFI (m
-3)
Maximum TMP (bar)
Rate of Change in
r/min (r/min/m
3)
Ave. St.
Dev. Ave. St.
Dev. Ave. St.
Dev. Ave. St.
Dev.
A – none 0 -0.005 0.07 -0.004 0.007 0.32 0.07 0.35 10.79
B – humic/ fulvic acids
20 -0.001 0.03 -0.002 0.003 0.26 0.01 2.93 6.95
C1 – blue-green algae
20 2.99 2.41 0.493 0.400 0.74 0.31 124 99.6
C2 – blue-green algae
10 3.12 1.42 0.392 0.188 0.85 0.09 121 53.8
D – kaolin powder
10 1.04 0.53 0.033 0.040 0.66 0.06 41.5 11.9
E – sodium alginate
20 8.32 3.79 1.32 0.59 0.93 0.16 293 121
F – none 0 -0.15 0.19 -0.051 0.065 0.38 0.01 15.4 24.1
G – after cleaning
0 0.43 0.20 0.083 0.026 0.31 0.01 -14.2 8.0
Note: mbar/min = millibars per minute, m-3
= per cubic meter, r/min/m3 = revolutions per minute
per cubic meter, Ave. = average, St. Dev. = standard deviation.
Whenever an RO system is stopped for any length of time without flushing the
feed channel, direct osmosis begins. In this case, direct osmosis caused periodic
spikes in permeate conductivity and apparent SP. Actually, the increase is due to
pure water permeating back into the feed stream, rather than an increase in the
rate of salt permeating to the product side of the membrane. Even with the SP
near 1 percent after cleaning, the RO permeate remained acceptable for drinking
water purposes (near 100 S/cm conductivity), which corresponds to
approximately 90 mg/L of TDS.
4.4 UF System
Table 6 lists the fouling events with average values and standard deviation of the
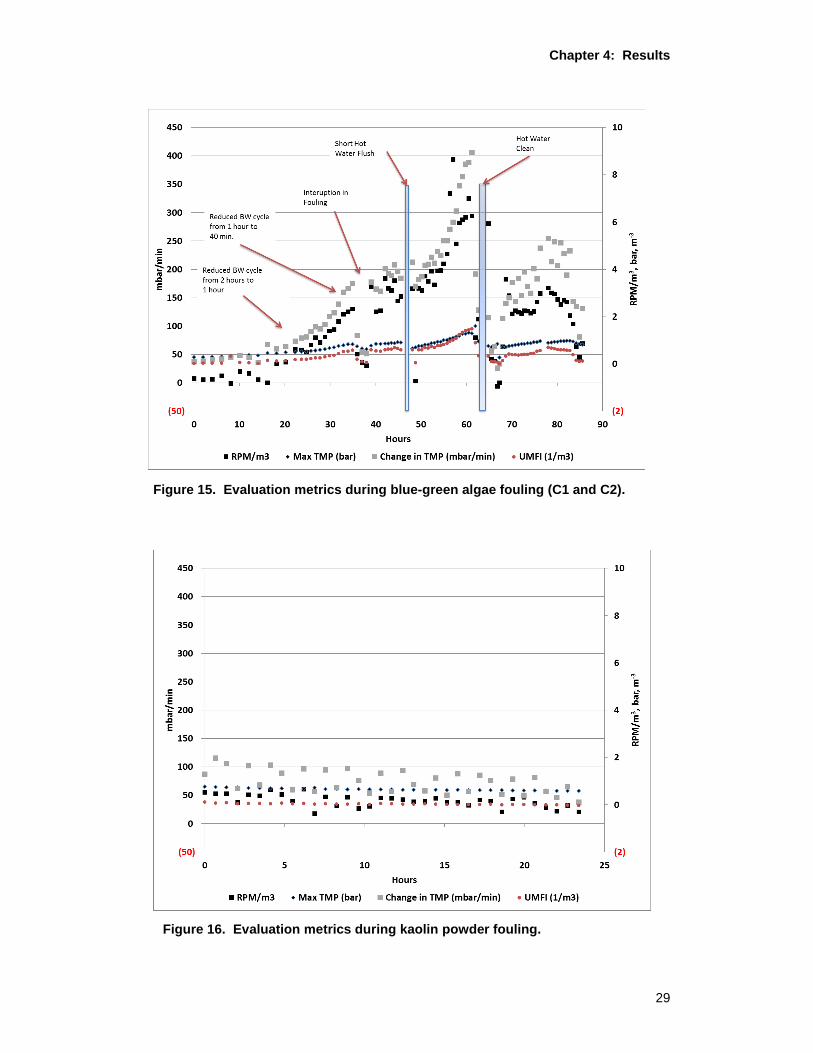
UF system evaluation metrics. Figure 15 shows the range and variation of these
metrics over the duration of the blue-green algae fouling challenge, and figure 16
shows the range and variation for the kaolin powder challenge. The chart for
sodium alginate would be similar to the blue-green algae response, while the
response to the humic/fulvic acid challenge would be flat lines at the values listed
in table 6.
Chapter 4: Results
29
Figure 15. Evaluation metrics during blue-green algae fouling (C1 and C2).
Figure 16. Evaluation metrics during kaolin powder fouling.

Fouling Challenge for a Robust, Remote Controlled Ultrafiltration/ Reverse Osmosis System
30
The UMFI is calculated from the slope of the curves in figure 17 for an
equivalent number of backwash cycles during each of the fouling challenge
stages. The background data is portrayed with the calculated UMFI to illustrate
the significance of the UMFI value. The UMFI before and after the fouling
challenge, during fouling with humic/fulvic acids and kaolin powder, and after
cleaning is close to zero. However, potentially reversible fouling is apparent from
the deviation from unity at the start of each backwash cycle. The percentage of
fouling that is irreversible after final cleaning is approximately 12 to 15 percent.
Figure 17. Change in the inverse of specific flux with production.
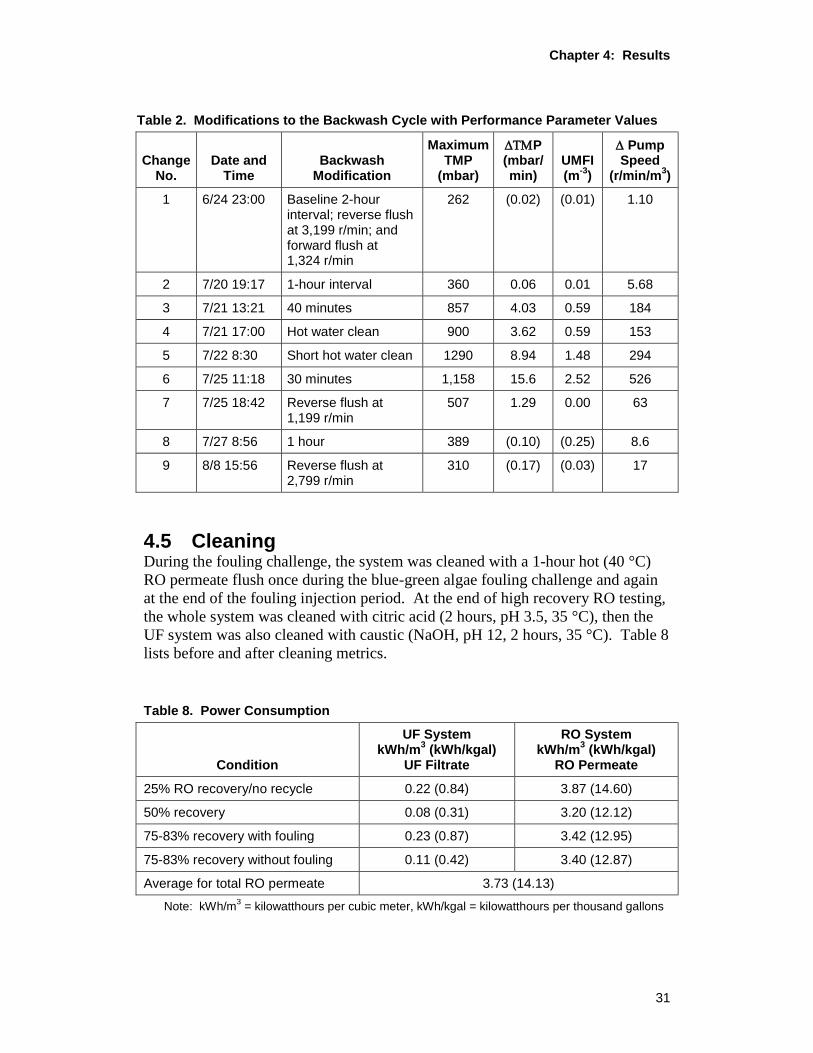
The backwash cycle was modified seven times during the test to address changes
in water quality. Table 7 lists each change and the value of the different
performance metrics just before each change. On June 24, 2014, the change was
made to accommodate lower feed flows and higher RO system recovery with low
fouling groundwater. The last change was made to prepare for long-term storage.
The decision to change the backwash cycle was made through human logic based
on a combination of the rate of change in TMP and the maximum TMP.
Chapter 4: Results
31
Table 2. Modifications to the Backwash Cycle with Performance Parameter Values
Change No.
Date and Time
Backwash Modification
Maximum TMP
(mbar)
P (mbar/ min)
UMFI (m
-3)
Pump Speed
(r/min/m3)
1 6/24 23:00 Baseline 2-hour interval; reverse flush at 3,199 r/min; and forward flush at 1,324 r/min
262 (0.02) (0.01) 1.10
2 7/20 19:17 1-hour interval 360 0.06 0.01 5.68
3 7/21 13:21 40 minutes 857 4.03 0.59 184
4 7/21 17:00 Hot water clean 900 3.62 0.59 153
5 7/22 8:30 Short hot water clean 1290 8.94 1.48 294
6 7/25 11:18 30 minutes 1,158 15.6 2.52 526
7 7/25 18:42 Reverse flush at 1,199 r/min
507 1.29 0.00 63
8 7/27 8:56 1 hour 389 (0.10) (0.25) 8.6
9 8/8 15:56 Reverse flush at 2,799 r/min
310 (0.17) (0.03) 17
4.5 Cleaning During the fouling challenge, the system was cleaned with a 1-hour hot (40 °C)
RO permeate flush once during the blue-green algae fouling challenge and again
at the end of the fouling injection period. At the end of high recovery RO testing,
the whole system was cleaned with citric acid (2 hours, pH 3.5, 35 °C), then the
UF system was also cleaned with caustic (NaOH, pH 12, 2 hours, 35 °C). Table 8
lists before and after cleaning metrics.
Table 8. Power Consumption
Condition
UF System kWh/m
3 (kWh/kgal)
UF Filtrate
RO System kWh/m
3 (kWh/kgal)
RO Permeate
25% RO recovery/no recycle 0.22 (0.84) 3.87 (14.60)
50% recovery 0.08 (0.31) 3.20 (12.12)
75-83% recovery with fouling 0.23 (0.87) 3.42 (12.95)
75-83% recovery without fouling 0.11 (0.42) 3.40 (12.87)
Average for total RO permeate 3.73 (14.13)
Note: kWh/m3 = kilowatthours per cubic meter, kWh/kgal = kilowatthours per thousand gallons

Fouling Challenge for a Robust, Remote Controlled Ultrafiltration/ Reverse Osmosis System
32
4.6 Power Consumption
Table 8 lists average power requirements for each system during each phase
of testing and for the whole system as an average over the testing period.
The RO power use was constant at each recovery rate interval. UF power
consumption was affected by changes in flow rate and fouling load.
Chapter 5: Discussion
33
5 Discussion 5.1 Robustness
The Sea.PURe system demonstrated a high level of robustness during the test
period, despite changes in feed water composition and fouling challenge. While
the UF system exhibited fouling with blue-green algae and sodium alginate, it
recovered sufficiently within the range of allowable backwash frequency settings.
A comparison of the system with the criteria suggested above appears below:
Materials of construction: The float switch that fills the UF backwash
tank became encrusted with scale twice toward the end of the test period.
Noncontact level sensors would help with determining the level, but it
would still be necessary to add a screen or clog/crust proof valve to
prevent solids from entering the UF system during backflushing. Other
materials held up well to the brackish water environment.
Conservative process design: The UF system is capable of delivering
three times the filtrate needed for this test with high recovery RO.
Seawater recoveries between 35 and 45 percent would not require
recirculating concentrate to the RO feed; thus using the full production
level of the UF system. Backwashing the UF with RO concentrate is not a
conservative feature for highly saturated brackish water, but it would be
beneficial in a seawater application. The RO system did not have a single
issue during the test period. The turbidity to the RO was always well
under 0.1 NTU, even during the most difficult fouling solutions.
Redundancy in instrumentation and control features: The system does
not have redundant sensors. Loss of any of the flow or pressure sensors
would shut down the system, although it could be operated in manual
mode. The RO feed turbidimeter was not sensitive enough to register the
UF filtrate turbidity. The applicable turbidity range should cover at least
the double digit milliNTU level.
Adaptable controls: The UF process control is flexible in that
backwashes can be conducted in a variety of modes, with or without air
scour, at a user modifiable interval and duration. Pump speed can be
maintained at a fixed rate, or it can be set to maintain a given filtrate flow.
The RO system can also run at a fixed pump speed or to target a desired
permeate flow and recovery rate.
Algorithm for determining changes in feed conditions: Other than
tracking filtrate and RO permeate flow, the system does not adjust to feed
water conditions. The remote operator monitoring system performance

Fouling Challenge for a Robust, Remote Controlled Ultrafiltration/ Reverse Osmosis System
accomplishes this; however, with additional testing, the next generation of
control programming could easily incorporate backwash cycle control
with existing inputs and outputs.
5.2 Automated Monitoring to Evaluate Fouling
UF process monitoring and control programs need to query a series of yes/no
questions to determine if UF filtrate is performing well and then take appropriate
actions. Figure 18 describes a series of simplified inquiries that is repeated
continuously, usually with timers to wait long enough for the process to stabilize
after any adjustments. Two remaining issues/questions are: (1) what data should
be used to determine if the system is performing well or struggling; and (2) if the
system is struggling, what action should be taken?
34
Figure 18. Simplified decision tree for UF control.
A computer algorithm to determine whether the membrane is fouling can use any
of the inputs to the process discussed above: change in TMP, pump speed,
maximum TMP, or calculated UMFI. Change in TMP or pump speed can be
determined by recording the first reading when the target flow is reached, and
recording the last reading at the end of the production cycles, and then determine
the rate of change over time or with flow. The UMFI requires a further

Chapter 5: Discussion
35
calculation to divide the filtrate flow by the instantaneous TMP at the same two
points. Maximum TMP is also easy to capture with simple logic. It is important
to catch these data points when the flow is at the target level; otherwise, there may
be division by zero errors or very large value results.
As can be seen in figures 15 and 16, each of the evaluation factors respond in the
same manner to changes in filterability; however, the magnitude of the change is
different. The change in pump speed and TMP (in mbar/min) has the greatest
range of response over the change in conditions depicted. Pump speed is
responding to increased resistance in the system. Change in TMP is incorporated
into the UMFI through the normalized specific flux, so it is not surprising that
they are strongly correlated to each other. Figure 19 plots each of these
parameters against change in pump speed per unit volume during the fouling
challenge. UMFI and change in TMP have the strongest correlation to the change
in pump speed and track each other very closely during the clean and fouling
periods. Maximum TMP increases with the other parameters, but it is not
correlated to them in a linear manner; rather, it levels off as it reaches one bar.
The open symbols in figure 19 are the UMFI versus pump speed change after the
fouling period, when the spiral separator was clogged with remaining fouling
material. The UF membranes appeared to be recovering during this period, based
on all other parameters, but the pump was still ramping up to get feed flow
through the pretreatment equipment. Figure 9 shows spikes in turbidity after the
fouling period, with continued improvement in the TMP. These spikes were
caused by the effort of the pump cleaning out the tanks, pipes, and pretreatment
system.
Figure 20 shows the comparative magnitude of change in these parameters before
each process adjustment was made to manage the fouling situation. The
parameters are plotted as a fraction of their highest value over the test period. The
first point is the baseline value in a clean state. The first change from 2-hour
production cycle to 1-hour production cycle was based on a relatively small
change in maximum TMP, while the other evaluation parameters were still very
low. The next three changes were preceded by equivalent changes in all metrics.
The fourth change was a short, hot water flush that did not reverse fouling but
slowed it down for another 10 hours (see figure 15). By the sixth change,
reducing the production cycle to 30 minutes, the maximum TMP had plateaued,
while the other three metrics continued to increase.
The reduction in all metrics after change six occurs with the end of the fouling
period. The last three points represent continued improvement in performance,
followed by reductions in backwash cycle intensity. In the improvement stage,
maximum TMP is a more visible indicator while in its mid-range. Change in
pump speed with volume and change in TMP are very low within their ranges,
while the UMFI plateaus at subzero levels.

Fouling Challenge for a Robust, Remote Controlled Ultrafiltration/ Reverse Osmosis System
36
Figure 19. Proportionality between UMFI, change in TMP, maximum TMP, and
pump speed.
Figure 20. Percent change in evaluation parameters at each change in the
backwash cycle.

Chapter 5: Discussion
37
Perhaps the best control plan would be to use a combination of indicators at
different levels of fouling. The maximum TMP requires no calculation; it only
requires a maximum function to monitor TMP over the production cycle.
However, it apparently reaches its maximum value while the system is still
responding to additional fouling through compaction. When the maximum TMP
reaches its mid-range, the program should begin to monitor the change in TMP
over the production cycle. Monitoring the change in pump speed with volume
would also alert the operator (or control function) to increase maintenance for the
prescreening equipment if it is not keeping pace with the change in TMP.
5.3 Automated Response to Fouling Indicators
After considering the information presented above, at this point, the question
arises: What can be changed in the process to prolong performance through
challenging periods? The changes made in this project were related to flow
direction, backwash frequency, flushing rate, and initiating hot water flushes or
hour-long cleaning cycles. Greater change in fouling indicators drove an increase
in backwash frequency, which is also a decrease in fouling accumulation time.
Backflush cross flow velocity was decreased to keep the pressures down during
the backflush and to transfer part of the cleaning load to the forward flush. Air
scour was used during every forward flush during this test. For less fouling
conditions, the air scour could be reserved for a first-level intensification of
backwash protocol.
Intuitively, it would seem that, for a change to be considered beneficial, the
subsequent production cycle should complete at the target flow rate with a lower
maximum TMP, and a lower rate of increase in pump speed and TMP; however,
as can be seen in figures 15 and 20, none of the changes in backwash cycle during
the fouling challenge had that result until the fouling agent was removed, or when
it was changed to kaolin powder. Then, every subsequent backwash resulted in a
lower value in all indicators. The production cycle is completely governed by the
solids loading of the source water. The backwash cycle can only push out the
accumulation. The metric for determining the success of the backwash is the
condition at the moment the production cycle begins again, the immediate TMP
and pump speed when target flow is reached, and initial change in TMP during
the first few seconds after target flow has been reached. That data can be
captured in the programmable logic controller programming, which cycles much
more frequently than the data was recorded during this test (30-second intervals).
Figure 21 compares initial TMP data from the random production cycles
throughout the fouling period. The initial TMP was chosen at the point when the
target flow reached the average value for the cycle. Cycle 3 backflushes resulted
in overall lower initial TMPs than cycle 2. Comparative testing without
alternating backflush cycles would be necessary to determine if cycle 3 is always

Fouling Challenge for a Robust, Remote Controlled Ultrafiltration/ Reverse Osmosis System
38
a more effective method, or if alternating directions has other benefits for
more completely reaching all areas of the module.
Figure 21. Difference between initial TMP following cycle 2 backflush and
subsequent cycle 3 backflush.
To avoid losing the benefit of any one aspect of the backwash cycle, it would be
better to alternate modifications. The choices are:
Flow direction
Flow velocity
Duration
Pulsation
Air scour
If some feed water quality conditions are getting worse, then the system’s
response can be considered acceptable if it is holding steady in the performance
evaluation metrics, or if the metrics are increased by a small percentage. The next
backwash can be the same in the alternate flow path. If performance metrics are
greatly increased, then a further modification can be initiated for the next
backwash cycle. Specific decision points must be assessed for the system.
Maximum values revealed in figure 19 were used in figure 20. They are specific
for this system. A control program needs set point values based on the system
design and expected conditions. It may be necessary to challenge the system, as
in this study, to find the maximum values that can be expected. More testing is
needed to evaluate the increased longevity of performance using a variety of
performance metrics with different decision point levels to determine the degree

Chapter 5: Discussion
39
of urgency associated with any particular value, as well as to match the degree of
intensity of a change in operation to the level of change in performance metric.


Chapter 6: Conclusions
41
6 Conclusions
The AHI Sea.PURe system appears to be a robust system in that it did not have
any failures that could not be resolved with minor human intervention. The most
severe failure was due to scale formation on the backwash tank level control
switch, which required about 30 minutes of level sensor and tank cleaning.
The fouling challenges were handled well enough to keep the RO system in
operation throughout the test period. There were no problems with the
RO system. It kept producing high quality, low TDS permeate throughout the
fouling challenge.
Programming for automated UF systems with constant filtrate flow control can
effectively use the change in pump speed with cumulative production volume as a
test parameter for modifying the backwash cycle. During this test, change in
pump speed with volume produced was strongly correlated with change in TMP
and UMFI, which were equivalently correlated to each other. Maximum TMP
was not correlated with the other metrics, but it leveled out with higher values of
the other metrics. Efficacy of backwash cycles can be determined by comparing
instantaneous TMP or pump speed at the point when the target flow has been
reached. Increments of the expected maximum value can be used as triggers for
further modification. Further testing of the automation of backwash cycle
modification is necessary to confirm appropriate decision points and dead-band
allowances to prevent overmodification.
The concept of remote control for rural water systems worked well in this case.
With the addition of automated backwash cycle modification and auto dialing
alarms, it should be sufficient for the remote operator to check on the system once
or twice a day in most situations. This method can be adapted to any treatment
process, not just membrane filtration.
6.1 Further Investigation Needed
Maximum TMP was used as the decision indicator for backwash cycle control
in this test with changes made at approximately each factor of the initial
nonfouled maximum TMP. Repeating the test using change in pump
speed/volume would clarify whether this metric results in stable performance.
This would require programming modifications to calculate the metric, as well
as some experimentation to determine how to set limits and dead-band levels.
The universe of backwash conditions needs to be explored. A table of increasing
levels of intensity in the backwash cycle can be developed. An experimental
design matrix of conditions can be tested, using the performance metrics that were
evaluated in this study, to determine an optimum control plan.

Fouling Challenge for a Robust, Remote Controlled Ultrafiltration/ Reverse Osmosis System
42
For this test, only feed water turbidity was used as in indicator of water quality.
In some situations, turbidity may not change significantly with the fouling
capacity of the feed water. In this test, the kaolin powder added turbidity, but it
had a beneficial effect on system performance. The sodium alginate was clear
and, thus, did not significantly increase turbidity; however, it was a severe
foulant. We need to investigate on-line sensors to detect algae bloom situations as
they are developing so that preemptive measures can be taken, rather than simply
reactive measures.
Chapter 7: References
43
7 References
Advanced Hydro, Inc., 2013. Sea.PURE for Advanced Seawater Desalination.
Pflugerville, Texas. Available at: http://www.advancedhydro.net/.
Accessed on September 10, 2014.
Agnihotri, D., X. Huang, J. Li, 2012. Improved Membranes with Polydopamine
Coatings. U.S. Patent No. WO2012158717 A2.
Amazon, 2014. Amazon Web Site. Available at: (http://www.amazon.com).
Amy, G., 2008. “Fundamental Understanding of Organic Matter Fouling of
Membranes,” Desalination 231: 44-51.
Avista Technologies, 1999 “Avista Advisor 3” software to calculate
chemical dosing. Available at:
http://www.avistatech.com/Ancillary/Avista%20Advisor.htm Accessed
on September 10, 2014.
Bikson, B., S. Etter, N. Ching, 2013. Hollow Fiber Apparatus and Use Thereof
for Fluids Separations and Heat and Mass Transfers. U.S. Patent
No. US20130081537 A1. Assigned to Valcor Engineering Corp., May 20,
2014.
Bulk Supplements, 2014. Bulk Supplements Web Site. Available at:
(http://www.bulksupplements.com/).
Chapman, M., 2013. “Evaluation of High Productivity Brackish Desalination
Membrane,” Desalination 308: 41-46.
Dow Chemical Company, 2014. “Filmtec Membranes - System Design:
System Performance Projection” (Form No. 609-02057-604).
Excerpted from Dow Technical Manual. Available at:
http://msdssearch.dow.com/PublishedLiteratureDOWCOM/dh_0036/0901
b803800362e9.pdf?filepath=liquidseps/pdfs/noreg/609-
02057.pdf&fromPage=GetDoc. Accessed on September 10, 2014.
EPA, 2013. Fiscal Year 2011 Drinking Water and Ground Water Statistics.
EPA 816-R13-003, March 2013. Available at:
http://water.epa.gov/scitech/datait/databases/drink/sdwisfed/upload/epa81
6r13003.pdf. Accessed on September 10, 2014.
Fouling Challenge for a Robust, Remote Controlled Ultrafiltration/ Reverse Osmosis System
44
Gao, L., A. Rahardianto, H. Gu, P.D. Christofides, and Y. Cohen, 2014a.
“Energy-Optimal Control of RO Desalination,” Ind. Eng. Chem Res.
53(18): 7409-7420. DOI: 10.1021/ie402304d. Copyright 2013.
American Chemical Society.
Gao, L., A. Rahardianto, H. Gu, P.D. Christofides, and Y. Cohen, 2014b. “Direct
Integration of RO Desalination and UF Pre-Treatment with RO
Concentrate Backwash.” Proceedings of the 2014 AiCHE Annual
Meeting, Atlanta, Georgia, November 16, 2014. Paper No. 386619.
Goldsmith, R.L., and B.A. Bishop, 2010. Separating a Feedstock into Permeate
and Retentate with a Membrane Device: Uniform Pressure Along Entire
Length; Maintaining Stable Flux to Minimize Concentration Polarization
and Fouling. U.S. Patent No. US7854846 B2. Assigned to Veolia Water
Solutions & Technologies, North America, January 10, 2013.
Huang, H., T.A. Young, and J.G. Jacangelo, 2008. “Unified Membrane Fouling
Index for Low Pressure Membrane Filtration of Natural Waters:
Principles and Methodology,” Environ. Sci. Technol. (42): 714-720.
Ishiwatari, R., 1971. “Molecular Weight Distribution of Humic Acids from Lake
and Marine Sediments,” Geochemical Journal 5: 121-132.
Jayaweera, I., G.N. Krishnan, A. Sanjurjo, P. Jayaweera, and S. Bhamidi,
2014. Process for Fabricating PBI Hollow Fiber Asymmetric
Membranes for Gas Separation and Liquid Separation. U.S. Patent
No. US20140175007 A1. Assigned to U.S. Department of Energy,
August 8, 2014.
Ju, H., and B.D. Freeman, 2008. Novel Fouling-Resistant Membranes
for Water Purification. Bureau of Reclamation Desalination and Water
Purification Research Program Report No. 129. Available at:
http://www.usbr.gov/pmts/water/publications/reportpdfs/report129.pdf.
Accessed on November 20, 2014.
Kurth, C.J., J.A. Koehler, M. Ahou, B.A. Holmberk, and R.L. Burk, 2012.
Reverse Osmosis Membranes. U.S. Patent No. US8177978 B2. Assigned
to L.G. Nano H2O, Inc., August 22, 2014.
Lean, M.H., J. Seo, and A.R. Völkel, 2012. Desalination Using Supercritical
Water and Spiral Separation. U.S. Patent No. US20120205320 A1.
Assigned to Palo Alto Research Center, Inc.
Liberman, B., and I. Liberman, 2005. “Replacing Membrane CIP by Direct
Osmosis Cleaning,” D&WR 15: 28-32.
Chapter 7: References
45
Lozier, J., G. Amy, N. Lee, J. Jacangelo, C. Mysore, J-P Croué, and B. Heimann,
2008. Natural Organic Matter Fouling of Low-Pressure Membrane
Systems. Copyright by the AWWA Research Foundation. Project
No. 2952.
Miller, D.J., X. Huang, H. Li, S. Kasemeset, A. Lee, D. Agnihotri, T. Hayes,
D.R. Paul, and B.D. Freeman. 2013. “Fouling-Resistant Membranes for
the Treatment of Flowback Water from Hydraulic Shale Fracturing: A
Pilot Study, JMS 437: 265-275.
Murphy, A.P., R.L. Riley, and Y.E. Porras Mendoza, 2014. Chlorine Resistant
Amides, Polyamides, and Membranes Made From the Same. U.S. Patent
No. US20140042082 A1.
Turf Pro USA, 2014. Orchid Pro. Available at:
http://www.turfprousa.com/orchid_pro_1003a.html Accessed on
9/28/2014
Wenk, H-R., and A. Bulakh, 2004. Minerals: Their Constitution and Origin.
Cambridge University Press. Copyright by Hans-Rudolf Wenk and
Andrei Bulakh.
Zhao, L., and W.S.W. Ho, 2013. “High-Flux Reverse Osmosis Membranes With
Fouling-Resistance for Seawater Desalination.” Proceedings of the 2013
AIChE Annual Meeting, Separations Division (396y).