

FOT200912
30
December 2009 • Volume 3, No. 12 IMPROVING STRATEGY PERFORMANCE with money management p. 6 BETTER BREAKOUT trading p. 10 OPTIONS STRATEGIES: Gamma scalping p. 12 PLAYING RESISTANCE in treasuries p. 28 TRADING THE parabolic SAR with credit spreads p. 17 COMMERCIAL TRADERS forego gold rush p. 21
description
FUTURES & OPTIONS TRADERDecember 2009
Transcript of FOT200912

December 2009 • Volume 3, No. 12
IMPROVING STRATEGYPERFORMANCEwith money management p. 6
BETTER BREAKOUT trading p. 10
OPTIONS STRATEGIES:Gamma scalping p. 12
PLAYING RESISTANCEin treasuries p. 28
TRADING THEparabolic SAR withcredit spreads p. 17
COMMERCIAL TRADERS forego gold rush p. 21
2 December 2009 • FUTURES & OPTIONS TRADER
Contributors . . . . . . . . . . . . . . . . . . . . . . . . . . .5
Trading Strategies
Trading with maximum portfolio risk . . . .6Using a dynamic position-sizing approach turns a
so-so system into a significant winner.
Tuning up the Turtle . . . . . . . . . . . . . . . . .10After two decades, traders are still intrigued by
the trend-following strategy followed by the
Turtles in the 1980s. Does it still work?
By Anthony Garner
The options straddle battle . . . . . . . . . . .12Can two traders succeed if they make completely
opposite bets on market volatility?
By Dan Keegan
Options Trading System Lab
Parabolic SAR with credit spreads . . . .17Trading credit spreads when this indicator
changes direction.
By Steve Lentz and Jim Graham
Futures & Options Calendar . . . . . . . . . . . .19
New Products and Services . . . . . . . . . . . . .20
Futures & Options Watch:
COT extremes . . . . . . . . . . . . . . . . . . . . . . .21A look at the relationship between
commercials and large speculators in all
45 futures markets.
Options Watch . . . . . . . . . . . . . . . . . . . . . .21Vanguard Value ETF components
Futures Snapshot . . . . . . . . . . . . . . . . . . . . . .22Momentum, volatility, and volume
statistics for futures.
CONTENTS
continued on p. 4

a Production of
Gold Sponsors
Media Partner
ATTEND AND GET PROVEN STRATEGIESFROM RENOWNED TRADING EXPERTS.
and much more!
Platinum Sponsor
Silver Sponsors
• Increase your percentage of profitable trades by usingthe pros’ specific trading strategies
• Minimize risk – learn how to appropriately place profit andstop levels before every trade
• Discover new ways of looking at charts – understand thesignals top traders use to identify opportunities and incorporatethem into your trading plan
• Become a more successful trader by using the latest toolsand software
• Learn new markets and securities to trade from forexto futures and options to ETFs – evaluate new marketsand profit from diversifying your trades
Meet Successful Traders & Take HomeTheir Expert Knowledge to:
Martin PringPresidentPring.com
Eric BollingCo-Host
FOX Business Happy Hour
John CarterPresident
Trade The Markets, Inc.
Jea YuCo-Founder & Lead AnalystUndergroundTrader.com
Tom DeMarkFounder
Market Studies, Inc.
Lawrence McMillanFounder & President
McMillan Analysis Corp.
andmanymore!
www.NewYorkTradersExpo.comDiscover complete Expo details, learn how to attend, and
register free online. Or, call 800/970-4355.Mention priority code 016425.
NEW YORK | February 14-17, 2010Marriott Marquis Hotel
ALEXANDERELDER, MD
LINDARASCHKE
Confirmed speakers include:
Denise ShullPresident
Trader Psyches, Inc.
MoneyShow | Githler Center | 1258 North Palm Ave.Sarasota, FL 34236 USA
Rob BookerAuthor
The CurrencyTrader’s Handbook
ActiveTraderAd-NYTE10_Layout 1 11/25/09 11:39 AM Page 1

Options Radar . . . . . . . . . . . . . . . . . . . . . . . . .23Notable volatility and volume
in the options market.
Key Concepts . . . . . . . . . . . . . . . . . . . . . . . . . .24References and definitions.
Managed Money . . . . . . . . . . . . . . . . . . . . .25Top 10 option strategy traders ranked by
August 2009 return.
Events . . . . . . . . . . . . . . . . . . . . . . . . . . . . . . . .26
Futures Trade Journal . . . . . . . . . . . . . . .28Resisting the temptation to fade resistance.
Options Trade Journal . . . . . . . . . . . . . . .29Trading gaps in a range-bound holiday market.
Have a question about something you’ve seen
in Futures & Options Trader?
Submit your editorial queries or comments to [email protected].
Looking for an advertiser?
Click on the company name below for a direct link to the ad
in this month’s issue of Futures & Options Trader.
eSignal
Las Vegas Traders Expo
RS of Houston
CONTENTS
4 December 2009 • FUTURES & OPTIONS TRADER

CONTRIBUTORS
5 December 2009 • FUTURES & OPTIONS TRADER
Editor-in-chief: Mark [email protected]
Managing editor: Molly [email protected]
Senior editor: David Bukey [email protected]
Contributing writers: Keith Schap,Chris Peters
Editorial assistant andwebmaster: Kesha Green
Art director: Laura [email protected]
President: Phil [email protected]
Publisher,Ad sales East Coast and Midwest:
Ad sales West Coast and Southwest only:
Allison [email protected]
Classified ad sales: Mark [email protected]
Volume 3, Issue 12. Futures & Options Trader is pub-lished monthly by TechInfo, Inc., 161 N. Clark St.,Suite 4915, Chicago, IL 60601. Copyright © 2009TechInfo, Inc. All rights reserved. Information in thispublication may not be stored or reproduced in anyform without written permission from the publisher.
The information in Futures & Options Trader magazineis intended for educational purposes only. It is notmeant to recommend, promote, or in any way implythe effectiveness of any trading system, strategy, orapproach. Traders are advised to do their ownresearch and testing to determine the validity of a trad-ing idea. Trading and investing carry a high level ofrisk. Past performance does not guarantee futureresults.
For all subscriber services:www.futuresandoptionstrader.com
A publication of Active Trader®
CONTRIBUTORS
� After Oxford University, Anthony Garner spent a fewformative years as a solicitor with Slaughter and May, a Londoncommercial law practice. He joined Swiss Bank CorporationInternational in the mid-1980s and spent several years as aninvestment analyst, with postings in Tokyo, Hong Kong,Singapore, and Zurich. He left conventional employment in 1995
and began working for himself. Garner now designs, tests, and trades simplemechanical investment strategies. He recently published A Practical Guide toETF Trading Systems (Harriman House). Together with his colleague RoelandPhillippe, Garner provides Zurich-based fund manager IFIT Advisory AGwith mechanical trading strategies. The firm uses Garner’s strategies in itsCardio Angels Fund.
� Dion Kurczek ([email protected]) is a private trader, software engi-neer and trading system researcher. In 2000 he founded Wealth-Lab Inc. andlaunched an interactive trading system development laboratory on the Web(www.wealth-lab.com). He is currently vice president of Wealth-Lab ProductDevelopment at Fidelity Investments.
� Volker Knapp has been a trader, system developer, andresearcher for more than 20 years. His diverse backgroundencompasses positions such as German National Hockey teamplayer, coach of the Malaysian National Hockey team, andpresident of VTAD (the German branch of the InternationalFederation of Technical Analysts). In 2001, he became a partnerin Wealth-Lab Inc. (www.wealth-lab.com), which he still runs.
� Dan Keegan is from Rochester, New York and earned an economicsdegree from Marquette University in 1977. After graduation, Keegan movedto Chicago and soon began working at the Chicago Board Options Exchange(CBOE). The CBOE was only four years old when Keegan began working at aseries of several jobs both on and off the trading floor. In 1982, Keegan begantrading on the CBOE floor with backing from legendary adventurer SteveFossett who made his fortune backing young traders like Keegan. After morethan 20 years as an independent floor trader, Keegan has become an optionseducator and advisor. He frequently guest lectures in options at MarquetteUniversity, is an advisor for i2i Analytics, and a regular contributor to finan-cial trade publications. Keegan is the co-founder and director of options forthe Chicago School of Trading. He and his wife Lesly live in Hinsdale, Ill. with
their three children.
� Jim Graham ([email protected]) is the productmanager for OptionVue Systems and a registered investmentadvisor for OptionVue Research.
� Steve Lentz ([email protected]) is a well-estab-lished options educator and trader and has spoken all over theU.S., Asia, and Australia on behalf of the CBOE’s OptionsInstitute, the Options Industry Council, and the AustralianStock Exchange. As a mentor for DiscoverOptions.com, heteaches select students how to use complex options strategiesand develop a consistent trading plan. Lentz is constantly
developing new strategies on the use of options as part of a comprehensiveprofitable trading approach. He regularly speaks at special events, tradeshows, and trading group organizations.

OPTIONS STRATEGY LABTRADING STRATEGIES
6 December 2009 • FUTURES & OPTIONS TRADER
Trading with maximum portfolio riskA basic price pattern with mediocre results when tested on a single-contract basis takes off
when a dynamic money-management regime is introduced.
Note: A version of this article origi-nally appeared in the November 2003issue of Active Trader magazine.
The two-bar breakout(2BB) system attempts tocapture short trends bygoing long or short
based on the behavior of the twomost recent price bars. It trades fre-quently and has a very brief aver-age holding period — typically oneor two bars on average (six orseven bars when a good trendmove materializes). Also, it uses avery tight stop to limit losses.
Many traders would likely beskeptical that such a basic pricepattern could produce usefulresults. However, such tradersmight overlook the role moneymanagement — specifically, adjust-ing the number of contracts accord-ing to current account equity — can play in making themost of a strategy.
The 2BB essentially looks for a reversal of the immedi-ate directional momentum, buying if price exceeds yester-day’s high if yesterday was a down day, and selling ifprice falls below yesterday’s low if yesterday was a downday. The rules are:
Long trades:1. Go long with a stop order on the next bar
(at the current high plus one tick) if:a. the low is less than the previous bar’s low;b. the high is less than the previous bar’s high;c. the close is less than the open.
Exit long using a trailing stop at the current bar’s low.
Short trades:4. Go short with a stop order on the next bar
(at the current low minus one tick) if:a. the low is greater than the previous bar’s low;
b. the high is greater than the previous bar’s high;c. the close is greater than the open.
2. Cover short using a trailing stop at the current bar’s high.
Figure 1 shows sample trades in natural gas (NG). Thesystem was relatively active, triggering around 20 tradesduring this roughly two-month period. Losing trades arestopped out quickly.
To start, we’ll test the system trading only one contractper position, then evaluate other position-sizing strategieslater in the article. The initial account equity was set to $1million, and $20 was deducted per round-turn trade forslippage and commissions. Testing was conducted ondaily data on the following 19 markets: DAX30 (AX), corn(C), crude oil (CL), German bund (DT), Eurodollar (ED),Eurocurrency (FX), gold (GC), copper (HG), Japanese yen(JY), coffee (KC), live cattle (LC), lean hogs (LH), Nasdaq100 (ND), natural gas (NG), soybeans (S), sugar (SB), sil-ver (SI), S&P 500 (SP) and 10-year T-notes (TY). The test
FIGURE 1 — SAMPLE TRADES
This cross section of long and short trades in natural gas (NG) illustrates howthe system rides short trends nicely, but exits at the first sign of a reversal.
Source for all figures: Wealth-Lab Inc. (www.wealth-lab.com)
FUTURES & OPTIONS TRADER • December 2009 7
spanned September 1993 until December2002.
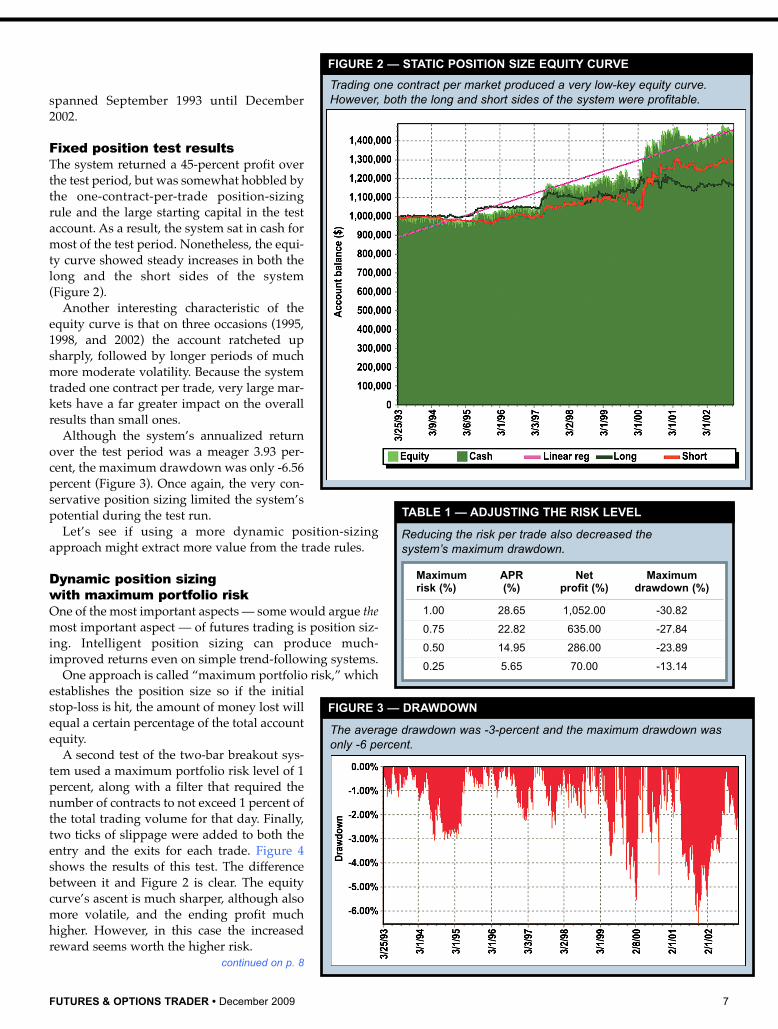
Fixed position test resultsThe system returned a 45-percent profit overthe test period, but was somewhat hobbled bythe one-contract-per-trade position-sizingrule and the large starting capital in the testaccount. As a result, the system sat in cash formost of the test period. Nonetheless, the equi-ty curve showed steady increases in both thelong and the short sides of the system (Figure 2).
Another interesting characteristic of theequity curve is that on three occasions (1995,1998, and 2002) the account ratcheted upsharply, followed by longer periods of muchmore moderate volatility. Because the systemtraded one contract per trade, very large mar-kets have a far greater impact on the overallresults than small ones.
Although the system’s annualized returnover the test period was a meager 3.93 per-cent, the maximum drawdown was only -6.56percent (Figure 3). Once again, the very con-servative position sizing limited the system’spotential during the test run.
Let’s see if using a more dynamic position-sizingapproach might extract more value from the trade rules.
Dynamic position sizing with maximum portfolio riskOne of the most important aspects — some would argue themost important aspect — of futures trading is position siz-ing. Intelligent position sizing can produce much-improved returns even on simple trend-following systems.
One approach is called “maximum portfolio risk,” whichestablishes the position size so if the initialstop-loss is hit, the amount of money lost willequal a certain percentage of the total accountequity.
A second test of the two-bar breakout sys-tem used a maximum portfolio risk level of 1percent, along with a filter that required thenumber of contracts to not exceed 1 percent ofthe total trading volume for that day. Finally,two ticks of slippage were added to both theentry and the exits for each trade. Figure 4shows the results of this test. The differencebetween it and Figure 2 is clear. The equitycurve’s ascent is much sharper, although alsomore volatile, and the ending profit muchhigher. However, in this case the increasedreward seems worth the higher risk.
continued on p. 8
FIGURE 2 — STATIC POSITION SIZE EQUITY CURVE
Trading one contract per market produced a very low-key equity curve.However, both the long and short sides of the system were profitable.
Reducing the risk per trade also decreased the system’s maximum drawdown.
TABLE 1 — ADJUSTING THE RISK LEVEL
Maximum APR Net Maximumrisk (%) (%) profit (%) drawdown (%)
1.00 28.65 1,052.00 -30.82
0.75 22.82 635.00 -27.84
0.50 14.95 286.00 -23.89
0.25 5.65 70.00 -13.14
FIGURE 3 — DRAWDOWN
The average drawdown was -3-percent and the maximum drawdown wasonly -6 percent.

8 December 2009 • FUTURES & OPTIONS TRADER
Table 1 shows the relationshipbetween maximum risk, annualizedreturn, and maximum drawdown. Netprofit increased to an annual rate of 28.65percent, but maximum drawdown alsoincreased dramatically to -30.82 percent.However, the system still boasts ahealthy recovery factor (net profit/maxi-mum drawdown) of 2.58. The draw-down can be reduced by reducing themaximum portfolio risk.
Sizing matters upAn intelligent position sizing strategycan help minimize losses and extract thefull potential out of the strategy.Although the trade setup only uses themost recent two bars of market data, itproved to be robust — and quite prof-itable when combined with dynamicposition sizing. �
—Submitted by Vetri Vel—Compiled by Dion Kurczek
and Volker Knapp of Wealth-Lab Inc.
For information on the author see p. 5.
TRADING STRATEGIES
STRATEGY SUMMARY
Profitability Trade statistics
Net profit: $453,934.00 No. trades: 4,884
Net profit: 45.39% Win/loss: 38.74%
Exposure: 1.86% Avg. gain/loss: 0.08%
Profit factor: 1.21 Avg. hold time: 2.44
Payoff ratio: 1.77 Avg. profit (winners): 2.08%
Recovery factor: 4.67 Avg. hold time (winners): 3.78
Drawdown Avg. loss (losers): -1.18%
Max. DD: -6.56% Avg. hold time (losers): 1.60
Longest flat days: 388 Max. consec. win/loss: 10/14
LEGEND: Net profit — Profit at end of test period, less commission •Exposure — The area of the equity curve exposed to long or short positions,as opposed to cash • Profit factor — Gross profit divided by gross loss •Payoff ratio — Average profit of winning trades divided by average loss oflosing trades • Recovery factor — Net profit divided by max. drawdown •Max. DD (%) — Largest percentage decline in equity • Longest flat days— Longest period, in days, the system is between two equity highs • No.trades — Number of trades generated by the system • Win/Loss (%) — Thepercentage of trades that were profitable • Avg. trade — The average prof-it/loss for all trades • Avg. winner — The average profit for winning trades• Avg. loser — The average loss for losing trades • Avg. hold time — Theaverage holding period for all trades • Avg. hold time (winners) — Theaverage holding time for winning trades • Avg. hold time (losers) — Theaverage holding time for losing trades • Max. consec. win/loss — The max-imum number of consecutive winning and losing trades
STRATEGY SUMMARY (2% RISK)
Avg. Sharpe Best Worst Percentage Max. Max.return ratio return return profitable consec. consec.
periods profitable unprofitable
Weekly 0.08% 0.70 7.90% -3.11% 49.11% 7 6
Monthly 0.33% 0.77 7.02% -3.24% 55.93% 7 5
Quarterly 0.97% 0.76 10.42% -3.13% 65.00% 7 2
Annually 4.01% 0.58 20.20% -2.68% 70.00% 6 2
LEGEND: Avg. return — The average percent-age for the period • Sharpe ratio — Averagereturn divided by standard deviation of returns(annualized) • Best return — Best return for theperiod • Worst return — Worst return for theperiod • Percentage profitable periods — Thepercentage of periods that were profitable • Max.consec. profitable — The largest number of con-secutive profitable periods • Max. consec.unprofitable — The largest number of consecu-tive unprofitable periods
FIGURE 4 — DYNAMIC POSITION SIZE EQUITY CURVE
Normalizing the position size for all contracts by risking 1 percent of accountequity increased returns significantly.

TRADING STRATEGIES
10 December 2009 • FUTURES & OPTIONS TRADER
Tuning up the turtle
Do markets change? Is it necessary toundertake continued research anddevelopment and adapt a trend-fol-lowing system to maintain its prof-
itability over the years?To attempt to answer these questions, the fol-
lowing study tracks the strategy of the “Turtles,” agroup trained by legendary traders RichardDennis and Bill Eckhart in the 1980s. The Turtleswere used to conduct an experiment aboutwhether it was possible to teach people to becomesuccessful traders.
One trading system salesmen recently arguedthat it is “nonsense” and a “specious argument” tosuggest trend-following rules must adapt tochanging market conditions.Others argue a trend-followingsystem does not simply self-adaptbut needs continued monitoringand refining. Some well-knowntrend-followers have indeed statedthey still trade the same system aswhen they started out 30 or 40years ago. But what do those man-agers really mean?
Testing the TurtleBy back testing the original Turtlestrategy, we can ascertain whetherthis one particular system, whichwas highly profitable back in theearly 1980s, has stood the test oftime or needs updating.
At its core, the Turtle strategy isa trend-following system thatattempts to capture short- andmedium-term trends in a portfolioof futures markets (Table 1).
For example, Turtles bought themarket after 20-day highs and soldshort after 20-day lows. Figure 1shows trade examples in cocoafutures (CC), which shows the effect of pyramiding: Units
were entered short on Jan. 6 and 7, 1970, and all units wereexited at the same time on March 5, 1970 as the market pen-
After two decades, traders are still intrigued by the trend-following strategy followed by
the Turtles in the 1980s. This preview of an article in the February 2009 issue of Active Trader tests
their strategy and suggests how to improve it.
FIGURE 1 — TRADE EXAMPLES — TURTLE SYSTEM
The original Turtle strategy sold short in cocoa futures in January 1970 and exited at aprofit in March.
Source: Trading Blox
TABLE 1 — MARKETS TRADED BY TURTLES
Market
Bonds: 30-year T-bonds (US), 10-year T-note (TY), Eurodollar (ED)
Softs: Coffee (KC), cocoa (CC), sugar #11 (SB), cotton (CT)Currencies: Swiss franc (SF), Euro (EC), British pound (BP),
Japanese yen (JY), Canadian dollar (CD)
Stock indices: S&P 500 (SP)Metals: Gold (GC), silver (SI), copper (HG)Energy: Crude oil (CL), unleaded gas (RB), heating oil (HB)
The original trend-following strategy traded by the Turtles included 21futures markets. This test replaces the Deutsche mark and French francwith the Euro and excludes the 90-day T-bill contract.
Source: Way of the Turtle: The Secret Methods that Turned Ordinary People intoLegendary Traders (McGraw-Hill, 2007).
BY ANTHONY GARNER
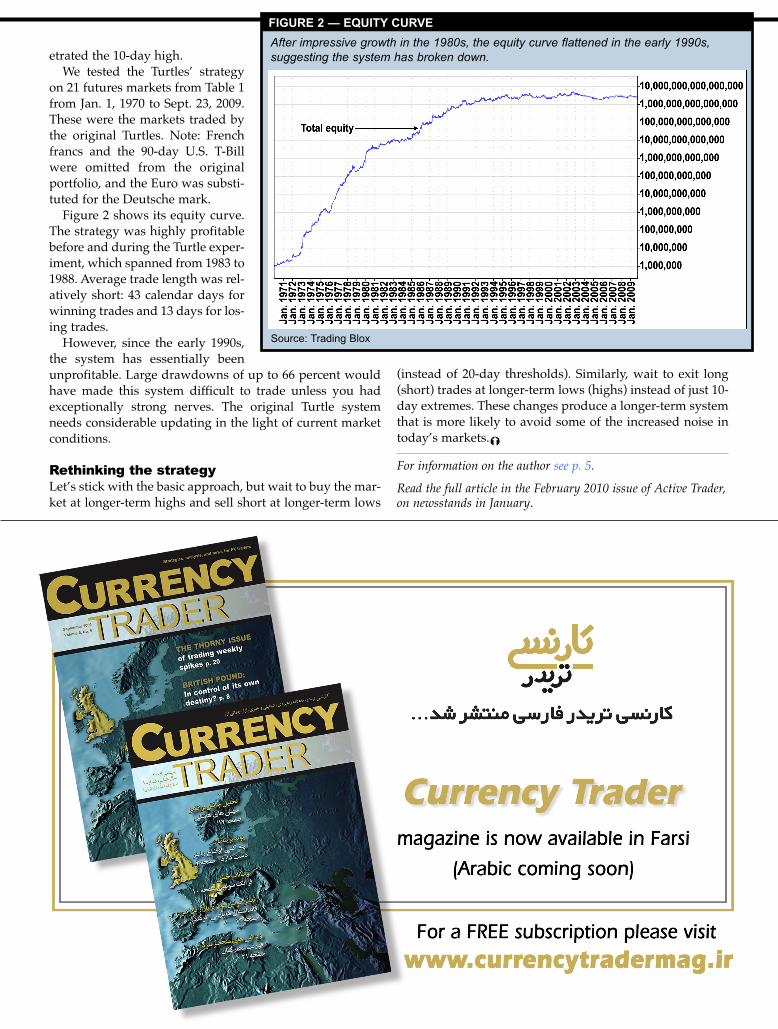
etrated the 10-day high.We tested the Turtles’ strategy
on 21 futures markets from Table 1from Jan. 1, 1970 to Sept. 23, 2009.These were the markets traded bythe original Turtles. Note: Frenchfrancs and the 90-day U.S. T-Billwere omitted from the originalportfolio, and the Euro was substi-tuted for the Deutsche mark.
Figure 2 shows its equity curve.The strategy was highly profitablebefore and during the Turtle exper-iment, which spanned from 1983 to1988. Average trade length was rel-atively short: 43 calendar days forwinning trades and 13 days for los-ing trades.
However, since the early 1990s,the system has essentially beenunprofitable. Large drawdowns of up to 66 percent wouldhave made this system difficult to trade unless you hadexceptionally strong nerves. The original Turtle systemneeds considerable updating in the light of current marketconditions.
Rethinking the strategyLet’s stick with the basic approach, but wait to buy the mar-ket at longer-term highs and sell short at longer-term lows
(instead of 20-day thresholds). Similarly, wait to exit long(short) trades at longer-term lows (highs) instead of just 10-day extremes. These changes produce a longer-term systemthat is more likely to avoid some of the increased noise intoday’s markets.�
For information on the author see p. 5.
Read the full article in the February 2010 issue of Active Trader,on newsstands in January.
FIGURE 2 — EQUITY CURVE
After impressive growth in the 1980s, the equity curve flattened in the early 1990s, suggesting the system has broken down.
Source: Trading Blox
OPTIONS STRATEGY LABTRADING STRATEGIES
12 December 2009 • FUTURES & OPTIONS TRADER
The options straddle battle
Can two traders both make money trading volatil-ity if one of them is short while the other is long?At first glance, that seems unlikelybecause options trading is a zero-sum
game. When you place a trade, someone takes theother side and only one of you will succeed at expi-ration.
However, both traders might be profitable if theyadjust the position correctly. Establishing a tradingposition with an edge is always helpful, but proper-ly managing that position is more important. Thefollowing examples use options straddles (same-strike, same-month puts and calls) on corn futuresto demonstrate this point.
Historical and implied volatilityWhen deciding whether to buy or sell options,traders often use the relationship between historicaland implied volatility (HV and IV) as a guide.
Historical volatility is the realized volatility of theunderlying over a given time period. Generally, thismeasure is calculated by the standard deviation ofreturns in a given period. HV is empirically based.By contrast, implied volatility is the reverse engi-neering process in which the current option pricesimply the underlying’s volatility.
A wide divergence between HV and IV can meanone of two things. Either the relationship is out ofline with past levels, suggesting it might soon revertback to normal, or the relationship has changed andmay stay that way. For example,implied volatility may increase beforean expected announcement while his-torical volatility holds steady. Or IVmay drop well below HV as tradersanticipate a calm market. If youbelieve extremely high or low IV willeventually move back toward HV, youcould sell high-IV “expensive” optionsor buy low-IV “cheap” options.
But the wide divergence could alsoremain intact, and any attempts toexploit a move toward their historicalrelationship could result in losses.Unfortunately, there is no crystal ball.
The long-short debate A common approach to trading volatility is the options
Traders on opposites sides of the market aren’t necessarily locked into a battle for success,
as this comparison of options straddles in corn futures shows.
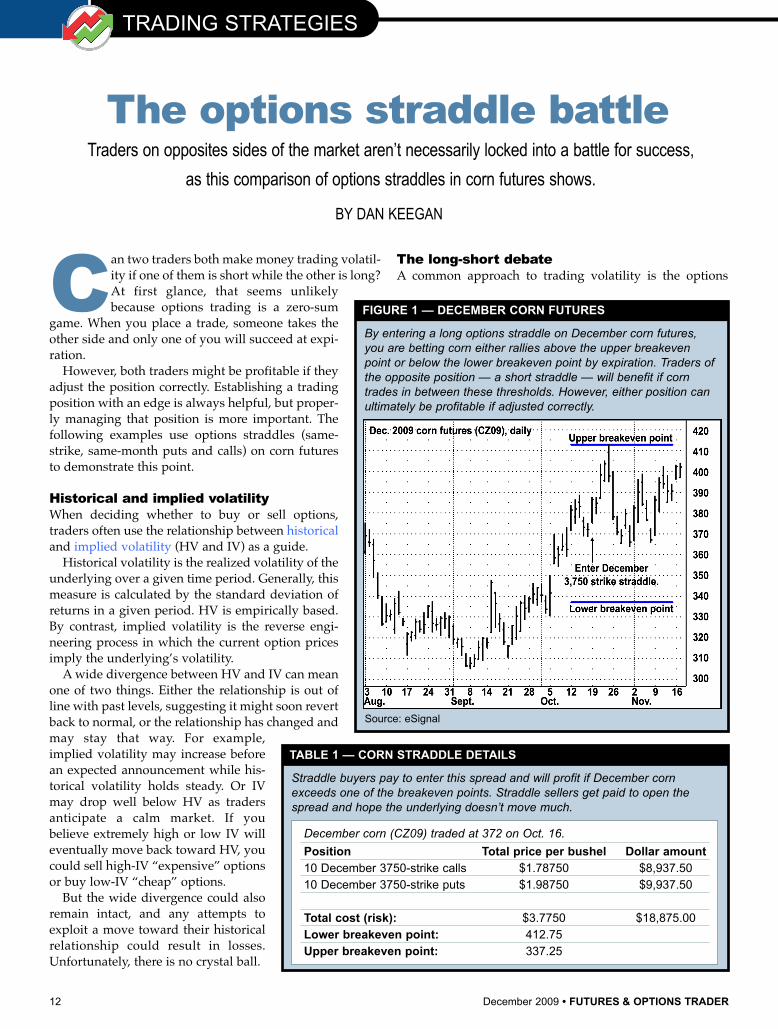
FIGURE 1 — DECEMBER CORN FUTURES
By entering a long options straddle on December corn futures,you are betting corn either rallies above the upper breakevenpoint or below the lower breakeven point by expiration. Traders ofthe opposite position — a short straddle — will benefit if corntrades in between these thresholds. However, either position canultimately be profitable if adjusted correctly.
Source: eSignal
TABLE 1 — CORN STRADDLE DETAILS
December corn (CZ09) traded at 372 on Oct. 16.
Position Total price per bushel Dollar amount10 December 3750-strike calls $1.78750 $8,937.5010 December 3750-strike puts $1.98750 $9,937.50
Total cost (risk): $3.7750 $18,875.00Lower breakeven point: 412.75Upper breakeven point: 337.25
Straddle buyers pay to enter this spread and will profit if December cornexceeds one of the breakeven points. Straddle sellers get paid to open thespread and hope the underlying doesn’t move much.
BY DAN KEEGAN
FUTURES & OPTIONS TRADER • December 2009 13
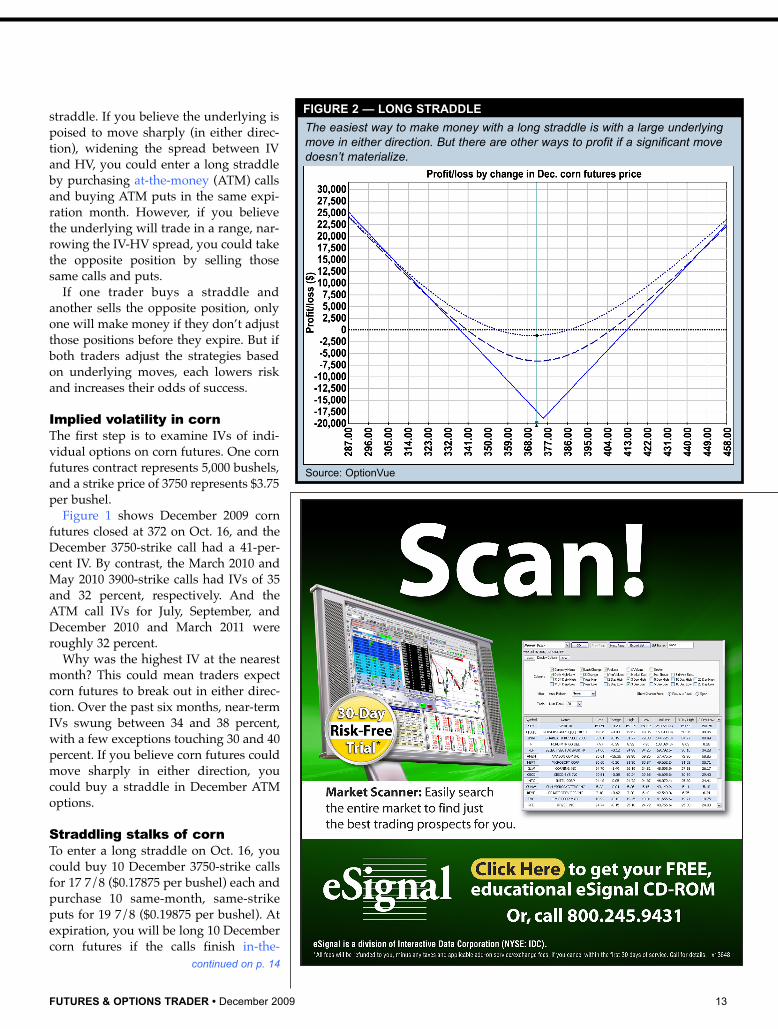
straddle. If you believe the underlying ispoised to move sharply (in either direc-tion), widening the spread between IVand HV, you could enter a long straddleby purchasing at-the-money (ATM) callsand buying ATM puts in the same expi-ration month. However, if you believethe underlying will trade in a range, nar-rowing the IV-HV spread, you could takethe opposite position by selling thosesame calls and puts.
If one trader buys a straddle andanother sells the opposite position, onlyone will make money if they don’t adjustthose positions before they expire. But ifboth traders adjust the strategies basedon underlying moves, each lowers riskand increases their odds of success.
Implied volatility in corn The first step is to examine IVs of indi-vidual options on corn futures. One cornfutures contract represents 5,000 bushels,and a strike price of 3750 represents $3.75per bushel.
Figure 1 shows December 2009 cornfutures closed at 372 on Oct. 16, and theDecember 3750-strike call had a 41-per-cent IV. By contrast, the March 2010 andMay 2010 3900-strike calls had IVs of 35and 32 percent, respectively. And theATM call IVs for July, September, andDecember 2010 and March 2011 wereroughly 32 percent.
Why was the highest IV at the nearestmonth? This could mean traders expectcorn futures to break out in either direc-tion. Over the past six months, near-termIVs swung between 34 and 38 percent,with a few exceptions touching 30 and 40percent. If you believe corn futures couldmove sharply in either direction, youcould buy a straddle in December ATMoptions.
Straddling stalks of corn To enter a long straddle on Oct. 16, youcould buy 10 December 3750-strike callsfor 17 7/8 ($0.17875 per bushel) each andpurchase 10 same-month, same-strikeputs for 19 7/8 ($0.19875 per bushel). Atexpiration, you will be long 10 Decembercorn futures if the calls finish in-the-
continued on p. 14
FIGURE 2 — LONG STRADDLE
The easiest way to make money with a long straddle is with a large underlyingmove in either direction. But there are other ways to profit if a significant movedoesn’t materialize.
Source: OptionVue

14 December 2009 • FUTURES & OPTIONS TRADER
money (ITM) or short 10 December cornfutures if the puts finish ITM.
This long-volatility position costs 376/8 ($0.3775 per bushel, Table 1). Figure2 shows the trade’s potential gains andlosses on three dates: Trade entry (Oct.16, dotted line), halfway until expiration(Nov. 3, dashed line), and expiration(Nov. 21, solid line).
There are three ways to make moneyon this position. First, do nothing andhope December corn finishes above 4126/8 or below 337 2/8. Second, the uncer-tainty surrounding the corn crop couldincrease, inflating implied volatility. Ifthis happens, the straddle will climb invalue and you can exit the position.
But what if December corn neverbreaches either of the straddle’sbreakeven points and implied volatilitystays flat or decreases? You still haveopportunities to make money on thetrade, but it won’t be easy.
If December corn drops lower, thelong puts are more likely to expire ITM,boosting the odds of a short futures posi-tion. (Long put holders have the right tosell the underlying at the strike price.) Inresponse, you can buy the underlyingfutures contracts to reduce the risk ofholding a short position. At that point, ifthe underlying bounces back, you cansell the underlying contracts at a profit.
If December corn rallies, the long callsare more likely to expire ITM, whichcould result in a long futures position.(Long call holders have the right to buythe underlying at the strike price.) Youcan then sell the underlying to lower therisk of holding a long position. And ifDecember corn slips, you can buy backthe underlying at a profit.
You will make money with this tech-nique if the profit earned from theseunderlying trades exceeds the decay inthe option’s time value. This “scalping”approach works best when the underly-ing is range-bound, not when it moves ina straight line.
Short straddle example Let’s compare a long straddle with ashort one in December corn options onOct. 16. The position includes the same
TRADING STRATEGIES
FIGURE 3 — SHORT STRADDLE
The short straddle can only lose money on one side of the market at expiration.However, potential losses are large.
Source: OptionVue
FUTURES & OPTIONS TRADER • December 2009 15
options, but they were sold insteadof bought.
The short straddle’s risk-profilegraph is shown in Figure 3. Notethe risks and rewards are reversed:By selling those options, the maxi-mum profit is 37 6/8 and the totalpossible loss is nearly limitless.And unlike the long straddle, theshort one is profitable if Decembercorn trades within the upper andlower breakeven points.
The short straddle can only losemoney on one side of the market atexpiration. If the short calls moveinto the money, they will convertinto a short underlying position; ifthe short puts move ITM, they willconvert into a long underlyingposition.
If you do nothing until expira-tion, and December corn neverexceeds the upper or lowerbreakeven points (412 6/8 and 3372/8), the position will make money.Another way to profit is to buy back theposition after the underlying trades side-ways and the options’ time value drops.
But what happens if December cornexceeds one of the breakeven points? Asthe underlying declines, the short putswill act more like long underlyingfutures. To hedge against this directionalrisk, you can sell the underlying after itdeclines. This step essentially convertsthe position’s short puts into short calls.The position is now somewhat hedgedagainst market declines.
If December corn increases, then youcan buy futures contracts, which con-verts the short calls into short puts andmitigates the pain of further market ral-lies. If the underlying market is choppy,these trades may lose money. But that’sfine as long as the short options’ dailytime decay exceeds the losses from trad-ing the underlying.
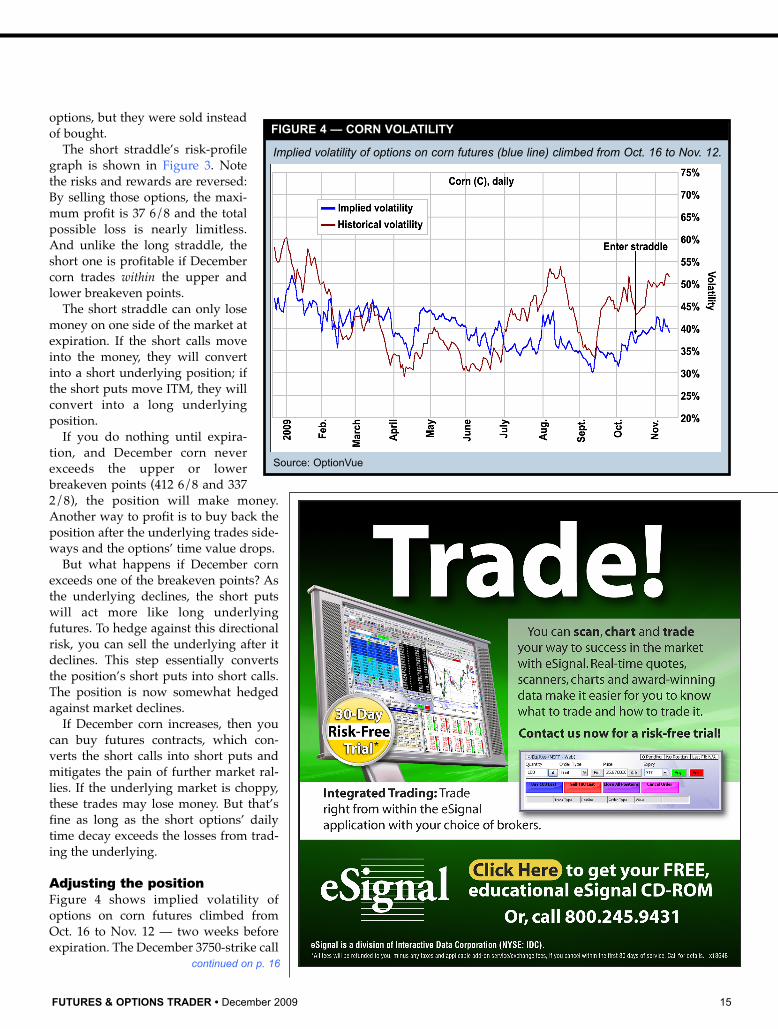
Adjusting the positionFigure 4 shows implied volatility ofoptions on corn futures climbed fromOct. 16 to Nov. 12 — two weeks beforeexpiration. The December 3750-strike call
FIGURE 4 — CORN VOLATILITY
Implied volatility of options on corn futures (blue line) climbed from Oct. 16 to Nov. 12.
Source: OptionVue
continued on p. 16

16 December 2009 • FUTURES & OPTIONS TRADER
IV increased to 47 percent. Does thatspell disaster for the short straddle? Notnecessarily.
Those calls now trade at 19 5/8($0.19625 per bushel) and have a 75-per-cent chance of expiring ITM. The putsnow trade at 4 5/8 ($0.04625 per bushel)with a 25-percent chance of finishingITM (Table 2). A position of 10 short callswith a 75-percent chance combined with10 short puts with a 25-percent chanceadds up to holding five short futurescontracts at expiration [(10 * 75 percent)+ (10 * 25 percent)]. To flatten those prob-abilities, you could have purchased fivefutures contracts along the way. Thus,you are now short 15 puts and five calls.
The overall short position has a -500delta; you could buy five futures (+100deltas each) to lower its total delta tozero.
If you had originally bought the strad-dle for 37 6/8, it has since shrunk to 242/8. To offset that unrealized loss, youcould trade the underlying. For example,December corn opened at 392 on Nov. 12and hit a high of 398 2/8. Suppose yousell three futures at 395 before the under-lying drops to a low of 382 4/8 and youbuy them back. Then you buy anotherfutures contract at 383 and three more at385. Finally, you sold this long underly-ing position at 390. The profit earnedfrom scalping corn futures combinedwith a rise in corn above the 3750 strikemeans you could have made moneyoverall.
How frequently should you trade theunderlying? The answer depends onyour risk tolerance, but some traders usethe overall position’s delta as a guide.For example, the original short straddlehad a basically flat delta (-38) at entry.However, it fell to -500 after the underly-ing gained 6.9 percent within a week. Atthat point, you could have bought fivefutures to bring delta back down to zero,which lowers directional risk.
But you don’t have to wait that long.Other traders might be more comfort-able adjusting the position after deltamoves by 200 or 300 in either direction.�
For information on the author see p. 5.
TRADING STRATEGIES
Related reading:
Corn futures:“A season for volatility in the grains,” Futures & Options Trader, July 2007.Implied volatility extremes help uncover straddle and strangle opportunities inthe soybean and corn futures.
“Corn: The new crude oil?” Futures & Options Trader, April 2007.Corn – it’s not just for dinner any more. This commodity’s expanding economicimportance could make this an exciting year for the July-December futuresspread trade.
Options straddles:“Searching for the short-straddle edge” Futures & Options Trader, December 2008.The difference between implied and actual volatility offers an advantage forselling straddles on the S&P 500.
“Straddling the COT report,” Futures & Options Trader, September 2007.Tracking shifts in large-trader sentiment can signal trade opportunities. Thislong straddle was triggered by an extreme reading in the S&P 500 futures.
“Straddles vs. strangles, round two,” Options Trader, January 2007.To choose between the two, calculate points at which both strategies generateidentical returns and compare them to your underlying price target.
“Seasonal straddles,” Options Trader, December 2006.Long straddles can profit from a price move in either direction, assuming themarket moves enough to overcome the trade’s cost. Finding low-impliedvolatility markets with strong seasonal price tendencies may be your best betfor this trade.
“Long straddles and strangles,” Futures & Options Trader, July 2006.They are popular trades that offer limited risk and unlimited reward, but longstraddles and strangles require large underlying price moves in order to profit.Learn the differences between these positions and discover when they aremost appropriate to trade.
“Long straddles: The importance of buying time”Options Trader, July 2005.Buying options has a bad reputation in some trading circles because you'realways fighting time decay. But knowing how to find options with the bestvolatility characteristics and tapping into LEAPS can allow you to constructhigher-probability long straddles.
“Straddles vs. strangles,” Options Trader, December 2005.It's the volatility-spread decision: Do you trade a straddle or a strangle? Youmight be surprised by the clear advantages one strategy has over the other inmost situations.
TABLE 2 — AND THE VERDICT IS…
December corn (CZ09) traded at 390 4/8 on Nov. 12.Total price Dollar
Position per bushel amount
10 December 3750-strike calls $1.96250 $9,812.5010 December 3750-strike puts $0.46250 $2,312.50
Short straddle gain (without adjustments) $2.4250 $6,750Long straddle loss (without adjustments) -$2.4250 -$6,750
The straddle lost value since Oct. 16, suggesting straddle sellers mademoney while straddle buyers lost money. However, a long straddle couldhave been profitable if you traded the underlying futures against it, sellingafter rallies and buying after declines.

FUTURES & OPTIONS TRADER • December 2009 17
OPTIONS STRATEGY LABOPTIONS TRADING SYSTEM LAB
Market: Options on the S&P 500 index(SPX).
System concept: The most profitableoptions lab we have tested used the direc-tional movement index, developed by WellsWilder in 1978. This lab tests another ofWilder’s indicators — the parabolic SAR.
Sometimes known as the stop-and-reverse system, the parabolic SAR is a calcu-lation that acts as a stop-loss point under-neath long trades and above short trades(Figure 1). The parabolic SAR is often usedto determine the direction of an asset’smomentum and when momentum has ahigher-than-normal probability of switchingdirections.
If the parabolic SAR lies below the currentprice, the market could be bullish, and if it isabove price, the market may be bearish. Inthis lab, all transactions are placed whenprice crosses the parabolic SAR calculation.Bullish signals are triggered at the close afterprice crosses above yesterday’s parabolicSAR value. Bearish signals are triggered atthe close after price crosses below yester-day’s parabolic SAR value. (Standard set-tings were used: an acceleration factor of0.02 with a maximum of 0.20.)
When signals appear, the system enterscredit spreads by selling an option (a put forbullish signals, a call for bearish ones) at thefirst strike beyond one standard deviation.The system also buys a same-type option 10points farther OTM — far enough out-of-the-money (OTM) to ensure the credit is suf-ficient. Note: This distance varies depending on the under-lying and current market conditions.
Ideally, credit spreads make money as time passes. If theunderlying’s price goes nowhere or moves away from theshort strike, the spread’s value will decline toward zero asthe likelihood of the short strike finishing in-the-money(ITM) decreases.
Figure 2 shows the potential gains and losses of aNovember 1030-825 bear call spread entered on Oct. 26,2009 when the S&P 500 index closed at 1067. The trade willbe profitable if the S&P 500 closes below 1130.89 at Nov. 20expiration.
Trade rules:
Bullish signal When price crosses above yesterday’s parabolic SARvalue, enter a bull put credit spread as follows:
1. Sell five puts at the first strike that is beyond one standard deviation.
2. Use the first expiration month with 21 or more days remaining.
3. Buy five puts at a strike price 10 points farther OTM.
OPTIONS TRADING SYSTEM LAB
Parabolic SARwith creditspreads
FIGURE 1 — PARABOLIC SAR CHART
The parabolic SAR works best during strong trending periods, which developer Welles Wilder estimated occur roughly 30 percent of the time.
Source: MetaStock
A November 1030-825 bear call spread was entered on Oct. 26, 2009 whenthe market closed at 1067.
Source: OptionVue
FIGURE 2 — BULL PUT SPREAD RISK PROFILE
continued on p. 18

18 December 2009 • FUTURES & OPTIONS TRADER
Exit: Let the spread expire worthlessunless a bearish trade is triggered.
Bearish signalWhen price crosses below yester-day’s parabolic SAR value, enter abear call credit spread as follows:
1. Sell five calls at the first strike that is beyond one standard deviation.
2. Use the first expiration month with 21 or more days remaining,
3. Buy five puts at a strike price 10 points further OTM.
Exit: Exit if underlying touches theshort option’s strike. Otherwise,allow the credit spread to expireworthless.
Starting capital: $10,000.
Execution: All entries occur at the close when price cross-es yesterday’s parabolic SAR value. The system may holdboth bullish and bearish positions at the same time.However, duplicate signals are ignored until a position clos-es.
Option trades were executed at the average of the bid andask prices at the daily close, if available; otherwise, theoret-ical prices were used. The standard deviation was calculat-ed with a probability calculator using the implied volatility(IV) of the at-the-money call in the relevant month. Eachspread held five contracts per “leg.” Commissions were $5per trade plus $1 per option ($20 per spread). No commis-sions were included when a spread expired worthless.
Test data: The system was tested using options on theS&P 500 index (SPX).
Test period: Jan. 12, 2004 to Nov. 20,2009.
Test results: Figure 3 shows the per-formance of the system, which gained$13,250 (133 percent) in six years, a 22.6-percent annual return. In the test’s first fouryears, the strategy had a winning percent-age of 93 percent. But in the final 18
months, the winning percentage dropped to 70 percent,reducing the overall win rate to 85 percent.
— Steve Lentz and Jim Graham of OptionVue
The parabolic SAR system gained 133 percent since January 2004.
Source: OptionVue
FIGURE 3 — SYSTEM PERFORMANCE
Initial capital: $10,000Net gain: $13,250Percentage return: 133%Annualized return: 22.6%No. of trades: 82Winning/losing trades: 70/12Win/loss: 85%Avg. trade: $161.59Largest winning trade: $1,580.00Largest losing trade: -$2,340.00Avg. profit (winners): 447.93Avg. loss (losers): -1,508.75Avg. hold time (winners): 36Avg. hold time (losers): 19Max consec. win/loss: 29/2
Option System Analysis strategies are testedusing OptionVue’s BackTrader module (unlessotherwise noted).
If you have a trading idea or strategy thatyou’d like to see tested, please send the trad-ing and money-management rules [email protected].
STRATEGY SUMMARY
LEGEND: Net gain — Gain at end of test period.Percentage return — Gain or loss on a percentage basis.Annualized return — Gain or loss on a annualized percentage basis.No. of trades — Number of trades generated by the system.Winning/losing trades — Number of winners and losers generated by the system.Win/loss — The percentage of trades that were profitable.Avg. trade — The average profit for all trades.Largest winning trade — Biggest individual profit generated by the system.Largest losing trade — Biggest individual loss generated by the system.Avg. profit (winners) — The average profit for winning trades.Avg. loss (losers) — The average loss for losing trades.Avg. hold time (winners) — The average holding period for winning trades (in days).Avg. hold time (losers) — The average holding period for losing trades (in days).Max consec. win/loss — The maximum number of consecutive winning and losing trades.
OPTIONS TRADING SYSTEM LAB

December 2009 • CURRENCY TRADER 19
MONTH
Legend
CPI: Consumer price index
ECI: Employment cost index
FDD (first delivery day): Thefirst day on which delivery ofa commodity in fulfillment of afutures contract can takeplace.
FND (first notice day): Alsoknown as first intent day, thisis the first day a clearing-house can give notice to abuyer of a futures contractthat it intends to deliver acommodity in fulfillment of afutures contract. The clearing-house also informs the seller.
FOMC: Federal Open MarketCommittee
GDP: Gross domestic product
ISM: Institute for supply man-agement
LTD (last trading day): Thefirst day a contract may tradeor be closed out before thedelivery of the underlyingasset may occur.
PPI: Producer price index
Quadruple witching Friday:A day where equity options,equity futures, index options,and index futures all expire.
December1 FDD: December crude oil, natural
gas, gold, silver, copper, aluminum, platinum, and palladium futures(NYMEX); December corn, wheat, soybean products, oats, and T-bonds futures (CME); December coffee, cocoa, and cotton futures (ICE)U.S.: Weekly weather report
2 FND: December heating oil, RBOB gasoline, and propane futures (NYMEX)U.S.: Petroleum status report
3 U.S.: Natural gas storage report
4 FDD: December propane futures (NYMEX)LTD: December live cattle options(CME); January cocoa and U.S. dollar index options (ICE); December currency options
567 FND: December live cattle futures
(CME)LTD: January sugar options (ICE)
8 FDD: December heating oil and RBOB gasoline futures (NYMEX)LTD: December cotton futures (ICE)U.S.: Weekly weather report
9 U.S.: Petroleum status report
10 FDD: December live cattle futures (CME)U.S.: Crop production, world agricultural production, and natural gas storage report
11 LTD: January coffee options (ICE)
121314 LTD: December corn, wheat, soybean
products, and oats futures (CME); December U.S. dollar index (ICE); December currency futures
15 FND: December U.S. dollar index futures (ICE)LTD: December cocoa futures (ICE)U.S.: Weekly weather report
16 FDD: December U.S. dollar index (ICE); December currency futuresLTD: January crude oil and platinum options (NYMEX)U.S.: Petroleum status report
17 U.S.: Natural gas storage report
18 LTD: December coffee futures (ICE); December single stock futures (OC); December index futures; January orange juice and cotton options (ICE); December index and equity optionsU.S.: Cattle on feed
1920
21 FND: January crude oil futures(NYMEX)LTD: January crude oil futures(NYMEX); December T-bonds futures (CME)
22 LTD: January sugar futures (ICE)U.S.: Weekly weather report
23 FND: January sugar futures (ICE)U.S.: Petroleum status report
24 LTD: January soybeans, soybean products, and rough rice options (CME)U.S.: Natural gas storage report
25262728 LTD: January natural gas, heating oil,
RBOB gasoline, gold, silver, copper,and aluminum options (NYMEX)
29 LTD: January natural gas futures (NYMEX); December gold, silver, copper, aluminum, platinum, and palladium futures (CME)U.S.: Weekly weather report
30 FND: January natural gas futures (NYMEX)U.S.: Agricultural prices and petroleum status report
31 FND: January gold, silver, copper, aluminum, platinum, and palladium futures (NYMEX); January soybeans, soybean products, and rough rice futures (CME)LTD: January heating oil, RBOB gasoline, and propane futures (NYMEX); December live cattle futures (CME)U.S.: Natural gas storage report
January1 FDD: January crude oil and natural
gas futures (NYMEX); January sugar futures (ICE)
234 FND: January orange juice futures
(ICE)FDD: January gold, silver, copper, platinum, and palladium futures (NYMEX); January soybean, soybean products, and rough rice futures (CME)
5 FND: January heating oil and RBOB gasoline futures (NYMEX)
6 U.S.: Petroleum status report
7 U.S.: Natural gas storage report
8 LTD: January orange juice futures (ICE); February coffee and U.S. dollar index options (ICE); January currency options
DECEMBER/JANUARYFUTURES & OPTIONS CALENDAR
The information on this page issubject to change. Futures &Options Trader is not responsiblefor the accuracy of calendar datesbeyond press time.
JANUARY 2010
27 28 29 30 31 1 2
3 4 5 6 7 8 9
10 11 12 13 14 15 16
17 18 19 20 21 22 23
24 25 26 27 28 29 30
31 1 2 3 4 5 6
DECEMBER 2009
29 30 1 2 3 4 5
6 7 8 9 10 11 12
13 14 15 16 17 18 19
20 21 22 23 24 25 26
27 28 29 30 31 1 2

20 December 2009 • FUTURES & OPTIONS TRADER
� Fidelity Investments (www.fidelity.com) haslaunched a new online stock research center to helpinvestors identify trading and investment ideas by deliver-ing independent expert insights about emerging opportuni-ties, popular stock screening strategies, stocks most fre-quently bought and sold online by Fidelity customers, andemerging topics on the Web. These new enhancements,combined with Fidelity’s current research offering, allowcustomers to understand what is happening in real-timeacross a wide variety of sources, including some top finan-cial blogs. The research center can be used to find emergingtrends and opportunities among the most active stocks inthe market; set predefined expert stock screening criteriathat customers can fine-tune, save, and use; read expertanalysis; track financial events such as earnings and splits;track upgrades and downgrades; and search for investmenttopics on the Web. The stock research center is available toall investors while expanded lists and intraday trading dataare available only to Fidelity customers. Fidelity offersaccess to premium content on a subscription basis, and willbe adding additional providers on an ongoing basis.
� CQG, the order execution, charting, and analyticsprovider for global electronically traded futures markets,has expanded its direct market access to include theAustralian Securities Exchange (ASX), an operator of elec-tricity and natural gas futures and options markets inAustralia and New Zealand. CQG customers will haveaccess to trade ASX’s Australian feed barley, Australiansorghum, Australian milling wheat, and western Australianwheat contracts and the Mini S&P/ASX 50, 200, and 200Property Trust indexes. These contracts are available onboth the CQG Trader and CQG Integrated Client advancedtrading platforms.
In addition, CQG has launched a Certified API PartnerProgram. CQG API Partner Certification provides program-mers, developers, and vendors the opportunity to becomeCertified API Partners with CQG. CQG certification indi-cates the partner has demonstrated expertise in workingwith either the CQG Data API or the CQG Trading API.Certified CQG API Partners will enjoy a host of benefitsincluding joint marketing exposure, discounts on CQG sys-tems, membership in a private social network, and access toLevel III support and CQG developers. For more informa-tion, visit www.cqg.com.
� Futures Truth Magazine and Chicago-basedTrader Kingdom have partnered, sharing viable contentsuch as access to Webinars, articles, newsletters, podcasts,and blogs to enhance subscriber experiences. Futures TruthMagazine subscribers are now able to access TraderKingdom Webinars from the Futures Truth Web site(www.futurestruth.com). Systems trading experts nowhave greater reach to present strategies to education seek-ers. Trader Kingdom (www.traderkingdom.com) is an
interactive trading tool; traders of all abilities are welcometo access the site with a valid email address. Visitors findvaluable information, endorsed by major exchanges, andpresented by veteran educators. Articles, research reports,podcasts, live and archived Webinars, newsletters, blogs,RSS news feeds, and special offers are regularly updated.
� Trading software provider NinjaTrader hasannounced a partnership with Steve Nison’sCandlecharts.com. Nison has selected NinjaTrader(www.ninjatrader.com) as his preferred trading platformfor the Nison Candle Scanner (NCS). The scanner allowstraders to use NinjaTrader to uncover candlestick patternsin real time in any market. NCS users can apply Nison’scustom candlestick filter conditions in NinjaTrader’s pow-erful Market Analyzer. NCS provides updated conditionalerts to traders in real time to identify intraday and dailytrade setups. NinjaTrader makes it easy for traders to reactquickly to these trade setups through its SuperDOM andchart-based order execution features. The orders can be sub-mitted to NinjaTrader’s worldwide network of supportingbrokerages for futures, forex, and equities markets.
� TopCommodityBrokers.com — an interactive com-modity/futures broker directory and educational and socialnetworking Web site — is now up and running. This Website gives commodity brokers the ability to upload a profilephoto and video, include a professional bio, connectinstantly with potential clients via Skype, link to their com-pany Web site and external blog, add detailed informationabout their organization, services and specialties, uploadtheir company logo, and allow potential clients and fellowbrokers to follow them on Twitter and Facebook. Registeredcompanies will be listed within the Top CommodityBrokers searchable database. TopCommodityBrokers.com istargeted to commodity brokers as well as investors. The sitealso has a Community Blogosphere with a variety of topicsincluding interviews with commodity brokers, broker com-missions, commodity broker trade shows, career classifieds,and weekly commentaries.
�United-ICAP — a leader in technical analysis-basedprice risk assessment for institutional hedgers and profes-sional energy traders — has launched new product offer-ings and a revamped Web site (www.united-icap.com). Thenew site offers a suite of customizable tools and technicalanalysis including daily, weekly, and monthly reports andemails, larger in-depth topical reports, live daily and week-ly Webcasts, and full analyst support to discuss any of thereport contents, investment ideas, or methodologies.
Note: The New Products and Services section is a forum for industry businesses to announce new products and upgrades. Listings are adapted frompress releases and are not endorsements or recommendations from the Active Trader Magazine Group. E-mail press releases to [email protected]. Publication is not guaranteed.
NEW PRODUCTS AND SERVICES

FUTURES & OPTIONS TRADER • December 2009 21
Options Watch: Vanguard value ETF components (as of Nov. 30) Compiled by Tristan Yates
The following table summarizes the expiration months available for the 20 top holdings of the Vanguard Value ETF (VTV). It also shows eachstock’s average bid-ask spread for at-the-money (ATM) December options. The information does NOT constitute trade signals. It is intended onlyto provide a brief synopsis of potential slippage in each option market.
spread as %Stock of underlying
Stock Ticker price Call Put priceExxon Mobil Corp. XOM X X X X X X 75.07 0.03 0.03 0.04%Coca Cola Co. KO X X X X X X 57.20 0.03 0.03 0.05%Proctor & Gamble Co. PG X X X X X X 62.35 0.03 0.03 0.05%Chevron Corp. CVX X X X X X X 78.04 0.03 0.05 0.05%Verizon Communications Inc. VZ X X X X X X 31.46 0.02 0.02 0.06%Johnson & Johnson JNJ X X X X X X 62.84 0.03 0.05 0.06%JP Morgan Chase JPM X X X X X X 42.49 0.03 0.03 0.07%Goldman Sachs Group Inc. GS X X X X X X 169.66 0.10 0.14 0.07%ConocoPhilips COP X X X X X X 51.77 0.04 0.04 0.07%AT&T Inc. T X X X X X X 26.94 0.02 0.03 0.08%Wells Fargo & Co. WFC X X X X X X 28.04 0.02 0.02 0.08%Intel Corp. INTC X X X X X X 19.20 0.02 0.01 0.08%Bank of America BAC X X X X X X 15.85 0.01 0.02 0.09%Merck & Co. MRK X X X X X X X X 36.21 0.04 0.03 0.09%Pfizer Inc. PFE X X X X X X 18.17 0.02 0.02 0.10%General Electric Co. GE X X X X X X 16.02 0.02 0.02 0.11%United Technologies UTX X X X X X X 67.24 0.10 0.09 0.14%3M Co. MMM X X X X X X 77.44 0.13 0.11 0.15%Walt Disney Co. DIS X X X X X X 30.22 0.08 0.09 0.27%Citigroup Inc. C X X X X X X 4.11 0.02 0.01 0.33%
Legend:Call: Three-day average difference between bid and ask prices for the front-month ATM call.Put: Four-day average difference between bid and ask prices for the front-month ATM put.Bid-ask spread as % of underlying price: Average difference between bid and ask prices for front-month, ATM call, and put divided by the underlying’s closing price.
Dec
.
Jan.
Feb.
Mar
ch
Apr
il
May
June
July
Jan.
Jan.
2009 2010 2011 2012
The Commitments of Traders (COT) report is publishedeach week by the Commodity Futures TradingCommission (CFTC). The report divides the open posi-tions in futures markets into three categories: commer-cials, non-commercials, and non-reportable.
Commercial traders, or hedgers, tend to operate in thecash market (e.g., grain merchants and oil companies thateither produce or consume the underlying commodity).
Non-commercial traders are large speculators (“largespecs”) such as commodity trading advisors and hedgefunds — professional money managers who do not dealin the underlying cash markets but speculate in futureson a large-scale basis. Many of these traders are trend-fol-lowers. The non-reportable category represents smalltraders, or the general public.
Figure 1 shows the relationship between commercials and large speculators onNov. 24. Positive values mean net commercial positions (longs minus shorts) arelarger than net speculator holdings, based on their five-year historical relation-ship. Negative values mean large speculators have bigger positions than thecommercials.
In November, commercial positions in gold futures (GC) were overwhelming-ly short, a bearish dynamic that has recently intensified. Similar relationshipsexisted in platinum (PL) and palladium (PA) futures. On the other side, com-mercial long positions have outnumbered speculator long holdings in naturalgas futures (NG) for several months. �
— Compiled by Floyd Upperman
The commercials in November were overwhelmingly short in gold futures (GC).
FIGURE 1 — COT REPORT EXTREMES
For a list of contract names, see “Futures Snapshot.” Source: www.upperman.com
Is gold hot? The commercials think not
Legend: Figure 1 shows the difference between net commer-cial and net large spec positions (longs minus shorts) for all 45futures markets, in descending order. It is calculated by subtract-ing the current net large spec position from the net commercialposition and then comparing this value to its five-year range. The formula is:
a1 = (net commercial 5-year high - net commercial current)b1 = (net commercial 5-year high - net commercial 5-year low)
c1 = ((b1 - a1)/ b1 ) * 100
a2 = (net large spec 5-year high - net large spec current)b2 = (net large spec 5-year high - net large spec 5-year low)
c2 = ((b2 - a2)/ b2 ) * 100
x = (c1 - c2)
Option contracts traded
FUTURES & OPTIONS WATCH
Bid-ask

22 December 2009 • FUTURES & OPTIONS TRADER
LegendVolume: 30-day average daily volume, in thou-sands (unless otherwise indicated).OI: Open interest, in thousands (unless other-wise indicated). 10-day move: The percentage price move fromthe close 10 days ago to today’s close.20-day move: The percentage price move fromthe close 20 days ago to today’s close.60-day move: The percentage price move fromthe close 60 days ago to today’s close.The “rank” fields for each time window (10-
day moves, 20-day moves, etc.) show the per-centile rank of the most recent move to a certainnumber of the previous moves of the same sizeand in the same direction. For example, therank for 10-day move shows how the mostrecent 10-day move compares to the past twen-ty 10-day moves; for the 20-day move, the rankfield shows how the most recent 20-day movecompares to the past sixty 20-day moves; forthe 60-day move, the rank field shows how themost recent 60-day move compares to the pastone-hundred-twenty 60-day moves. A readingof 100 percent means the current reading is
larger than all the past readings, while a read-ing of 0 percent means the current reading issmaller than the previous readings. These fig-ures provide perspective for determining howrelatively large or small the most recent pricemove is compared to past price moves.Volatility ratio/rank: The ratio is the short-termvolatility (10-day standard deviation of prices)divided by the long-term volatility (100-day stan-dard deviation of prices). The rank is the per-centile rank of the volatility ratio over the past60 days.
This information is for educational purposes only. Futures & Options Trader provides this data in good faith, but it cannot guarantee its accuracy or timeliness. Futures & OptionsTrader assumes no responsibility for the use of this information. Futures & Options Trader does not recommend buying or selling any market, nor does it solicit orders to buyor sell any market. There is a high level of risk in trading, especially for traders who use leverage. The reader assumes all responsibility for his or her actions in the market.
FUTURES SNAPSHOT (as of Nov. 27)
The following table summarizes the most actively traded U.S. futures contracts. The information does NOT constitute trade signals. It is intendedonly to provide a brief synopsis of each market’s liquidity, direction, and levels of momentum and volatility. See the legend for explanations of the dif-ferent fields. Volume figures are for the most active contract month in a particular market and may not reflect total volume for all contract months. Note: Average volume and open-interest data includes both pit and side-by-side electronic contracts (where applicable). Price activity for CME futures is based onpit-traded contracts.
10-day move/ 20-day move/ 60-day move/ VolatilityMarket Symbol Exchange Volume OI rank rank rank ratio/rankE-Mini S&P 500 ES CME 2.02 M 2.49 M -0.18% / 0% 5.47% / 89% 8.76% / 32% .17 / 24%10-yr. T-note TY CME 863.5 1.20 M 2.31% / 100% 3.24% / 100% 2.55% / 85% .49 / 95%5-yr. T-note FV CME 436.9 756.3 1.53% / 100% 2.43% / 94% 0.87% / 40% .41 / 73%Crude oil CL CME 341.2 288.9 -0.39% / 0% -1.23% / 22% 11.90% / 32% .23 / 23%E-Mini Nasdaq 100 NQ CME 310.4 323.5 -1.62% / 29% 5.63% / 86% 9.68% / 23% .23 / 58%Eurodollar* ED CME 276.4 841.7 0.22% / 35% 0.53% / 84% 0.65% / 55% .18 / 10%30-yr. T-bond US CME 268.8 690.8 4.03% / 100% 4.09% / 97% 1.66% / 34% .55 / 88%Eurocurrency EC CME 262.1 166.4 0.65% / 36% 0.78% / 12% 4.82% / 52% .24 / 32%2-yr. T-note TU CME 259.1 938.4 0.11% / 35% 0.86% / 93% 0.11% / 37% .33 / 50%Gold 100 oz. GC CME 158.4 296.2 6.11% / 71% 12.14% / 97% 20.00% / 93% .29 / 33%Mini Dow YM CME 152.3 64.6 0.49% / 7% 6.50% / 98% 9.29% / 40% .13 / 8%E-Mini Russell 2000 TF CME 146.0 387.7 -2.00% / 25% 2.12% / 24% 1.04% / 6% .35 / 82%Corn C CME 142.3 397.8 1.74% / 23% 4.69% / 30% 24.44% / 92% .25 / 43%British pound BP CME 127.3 97.7 -0.46% / 40% -0.32% / 4% 1.31% / 17% .43 / 52%Natural gas NG CME 113.1 115.2 18.21% / 80% 2.91% / 11% 90.32% / 98% .45 / 62%Japanese yen JY CME 94.0 118.2 4.06% / 100% 5.44% / 100% 6.19% / 89% .40 / 82%Australian dollar AD CME 93.6 113.9 -1.59% / 50% -0.93% / 100% 8.38% / 26% .20 / 43%Soybeans S CME 91.9 194.4 6.36% / 64% 6.86% / 58% 10.73% / 30% .35 / 72%Canadian dollar CD CME 76.9 90.2 -0.74% / 11% 0.33% / 5% 4.07% / 30% .31 / 47%Swiss franc SF CME 55.4 53.1 0.92% / 30% 1.10% / 30% 5.33% / 64% .25 / 43%Wheat W CME 51.2 128.9 3.20% / 8% 8.94% / 54% 12.97% / 80% .35 / 52%Sugar SB ICE 43.9 361.1 0.35% / 25% -0.18% / 7% -3.84% / 40% .20 / 23%Silver 5,000 oz. SI CME 39.9 73.0 6.01% / 38% 9.89% / 58% 19.11% / 57% .20 / 13%E-Mini S&P MidCap 400 ME CME 38.8 107.2 -2.35% / 30% 3.56% / 64% 4.50% / 11% .29 / 67%Heating oil HO CME 36.7 49.2 -0.20% / 6% -2.14% / 17% 13.10% / 38% .26 / 50%RBOB gasoline RB CME 35.8 49.6 0.52% / 57% -1.70% / 12% 7.44% / 35% .21 / 13%Soybean oil BO CME 35.2 77.4 4.51% / 47% 6.88% / 61% 16.91% / 92% .24 / 30%Soybean meal SM CME 28.4 55.6 8.47% / 73% 10.57% / 93% 8.72% / 32% .31 / 78%Copper HG CME 26.7 68.6 4.95% / 46% 2.11% / 17% 9.47% / 22% .23 / 68%Mexican peso MP CME 23.8 84.0 2.08% / 54% 1.11% / 28% 5.39% / 82% .36 / 12%S&P 500 index SP CME 19.4 387.8 -0.17% / 0% 5.47% / 87% 7.46% / 20% .17 / 24%U.S. dollar index DX ICE 15.8 36.0 -0.51% / 17% -1.88% / 75% -4.00% / 42% .24 / 38%Live cattle LC CME 14.5 65.8 0.42% / 17% -3.56% / 61% -4.12% / 71% .23 / 13%Lean hogs LH CME 13.3 53.0 8.40% / 92% 3.19% / 13% 20.89% / 71% .31 / 88%Coffee KC ICE 12.5 59.4 5.30% / 80% 1.88% / 9% 14.28% / 84% .14 / 0%Crude oil e-miNY QM CME 11.2 5.2 -0.39% / 0% -1.23% / 21% 11.81% / 34% .23 / 27%Mini-sized gold YG CME 9.6 5.1 6.59% / 82% 12.33% / 97% 20.05% / 93% .29 / 30%Nikkei 225 index NK CME 9.3 31.6 -5.73% / 94% -8.26% / 98% -10.00% / 88% .55 / 87%Cocoa CC ICE 8.2 50.5 6.48% / 83% -0.76% / 14% 11.94% / 24% .40 / 82%Fed Funds** FF CME 6.9 50.0 0.04% / 0% 0.19% / 73% 0.28% / 46% .07 / 13%New Zealand dollar NE CME 5.6 22.6 -3.13% / 62% -3.45% / 92% 5.20% / 3% .32 / 90%E-Mini eurocurrency ZE CME 3.5 2.5 0.45% / 33% 1.59% / 47% 4.55% / 46% .24 / 28%Natural gas e-miNY QG CME 3.4 4.0 18.21% / 83% 2.91% / 11% 90.32% / 98% .43 / 60%Nasdaq 100 ND CME 2.3 20.7 -1.62% / 29% 5.63% / 86% 9.68% / 23% .24 / 60%Mini-sized silver YI CME 2.3 2.4 6.33% / 38% 9.77% / 57% 19.03% / 56% .20 / 14%Feeder cattle FC CME 1.1 7.5 -0.48% / 8% -2.22% / 39% -6.19% / 46% .14 / 0%Dow Jones Ind. Avg. DJ CME 0.7 14.4 1.01% / 7% 3.93% / 80% 10.94% / 60% .12 / 8%*Average volume and open interest based on highest-volume contract (December 2010). **Average volume and open interest based on highest-volume contract (May 2010).
FUTURES & OPTIONS TRADER • December 2009 23
LEGEND:Options volume: 20-day average daily options volume (in thousands unless otherwise indicated).Open interest: 20-day average daily options open interest (in thousands unless otherwise indicated).IV/SV ratio: Overall average implied volatility of all options divided by statistical volatility of underlying instrument.10-day move: The underlying’s percentage price move from the close 10 days ago to today’s close.20-day move: The underlying’s percentage price move from the close 20 days ago to today’s close. The “rank” fields for each time window (10-day moves, 20-daymoves) show the percentile rank of the most recent move to a certain number of previous moves of the same size and in the same direction. For example, the “rank”for 10-day moves shows how the most recent 10-day move compares to the past twenty 10-day moves; for the 20-day move, the “rank” field shows how the mostrecent 20-day move compares to the past sixty 20-day moves.
OPTIONS RADAR (as of Nov. 30)
MOST-LIQUID OPTIONS*Indices Symbol Exchange Options Open 10-day move / 20-day move / IV / IV / SV ratio —
volume interest rank rank SV ratio 20 days agoS&P 500 index SPX CBOE 143.4 1.74 M 0.20% / 0% 5.74% / 89% 21.6% / 17.1% 21.6% / 19.1%S&P 500 volatility index VIX CBOE 142.2 2.40 M 4.92% / 14% -20.14% / 97% 105.5% / 112.5% 80.6% / 100.9%Russell 2000 index RUT CBOE 43.0 524.9 -1.12% / 40% 3.01% / 40% 30.6% / 24.1% 29.1% / 25.3%E-Mini S&P 500 futures ES CME 34.1 161.8 0.30% / 7% 5.98% / 93% 21.7% / 20% 21.9% / 21.3%Nasdaq 100 index NDX CBOE 19.0 191.5 -1.18% / 14% 6.02% / 88% 23.2% / 17.6% 22.8% / 19%
StocksBank of America BAC 135.7 4.20 M -0.81% / 0% 8.71% / 100% 43.1% / 39.5% 46.5% / 47.3%Citigroup C 124.4 9.14 M 1.48% / 30% 0.49% / 9% 50.9% / 35.9% 51.7% / 53.2%Apple Inc AAPL 83.3 998.0 -2.22% / 43% 6.05% / 42% 32.2% / 24.3% 29.9% / 29.9%Microsoft MSFT 73.8 1.85 M -0.74% / 100% 6.06% / 53% 24.9% / 19.2% 24.8% / 25.5%Research in Motion RIMM 72.7 792.7 -7.66% / 33% -1.43% / 2% 55.8% / 46.3% 45.1% / 35.8%
FuturesEurodollar ED CME 190.1 4.94 M -0.01% / 0% 0.03% / 9% 115.7% / 51.8% 110.9% / 38.8%10-year T-notes TY CME 58.5 665.8 0.84% / 39% 0.93% / 45% 6.4% / 4.5% 7.7% / 6%Corn C CME 41.6 583.2 6.92% / 100% 14.04% / 79% 35.4% / 44.8% 40.2% / 50.3%E-Mini S&P 500 futures ES CME 34.1 161.8 0.30% / 7% 5.98% / 93% 21.7% / 20% 21.9% / 21.3%Sugar SB ICE 21.1 377.8 -0.35% / 7% -0.75% / 21% 43.4% / 39.6% 46.5% / 50.2%
VOLATILITY EXTREMES**Indices - High IV/SV ratio
S&P 100 index OEX CBOE 11.0 92.1 0.52% / 0% 5.89% / 93% 21% / 15.9% 20.7% / 16.5%Nasdaq 100 index NDX CBOE 19.0 191.5 -1.18% / 14% 6.02% / 88% 23.2% / 17.6% 22.8% / 19%Russell 2000 index RUT CBOE 43.0 524.9 -1.12% / 40% 3.01% / 40% 30.6% / 24.1% 29.1% / 25.3%S&P 500 index SPX CBOE 143.4 1.74 M 0.20% / 0% 5.74% / 89% 21.6% / 17.1% 21.6% / 19.1%Dow Jones index DJX CBOE 5.5 205.7 0.73% / 7% 6.51% / 98% 19.3% / 15.6% 18.7% / 16.9%
Indices - Low IV/SV ratioMini Nasdaq 100 index MNX CBOE 5.8 223.6 -1.19% / 14% 6.02% / 88% 22.1% / 47.3% 22.6% / 42.2%S&P 500 volatility index VIX CBOE 142.2 2.40 M 4.92% / 14% -20.14% / 97% 105.5% / 112.5% 80.6% / 100.9%
Stocks - High IV/SV ratioFed Home Loan Bank FRE 1.3 284.8 -8.85% / 67% -16.26% / 49% 298.1% / 68.6% 48.8% / 113.1%Burlington Northern BNI 5.3 175.2 0.34% / 6% 30.51% / 100% 11.4% / 5% 31.6% / 32.5%Chimera Invest CIM 1.1 96.1 4.13% / 43% 15.47% / 100% 77.5% / 34.5% 81% / 43.5%Apollo Group APOL 8.1 170.8 5.96% / 100% -0.05% / 0% 57.3% / 29.7% 49.2% / 49.4%Fannie Mae FNM 2.8 682.1 -12.00% / 89% -18.52% / 53% 98.7% / 57.3% 117.7% / 108.1%
Stocks - Low IV/SV ratio3Com COMS 4.7 46.2 -1.86% / 14% 43.39% / 100% 15.2% / 22.2% 54.8% / 45.5%LDK Solar Co. LDK 5.3 174.6 22.07% / 11% 15.04% / 93% 74.4% / 106.2% 81.4% / 54%Ambac Financial Group ABK 2.6 149.6 0.00% / 0% -33.04% / 76% 152.1% / 195.8% 138.2% / 92.4%
Futures - High IV/SV ratioEurodollar ED CME 190.1 4.94 M -0.01% / 0% 0.03% / 9% 115.7% / 51.8% 110.9% / 38.8%2-year T-notes TU CME 2.2 54.1 -0.65% / 100% 0.04% / 15% 1.5% / 0.8% 2% / 1.1%5-year T-notes FV CME 4.4 86.7 0.68% / 21% 0.81% / 39% 4.1% / 2.5% 5% / 3.4%Japanese yen JY CME 1.0 12.9 3.94% / 95% 4.30% / 85% 16% / 11.1% 13.9% / 13.3%10-year T-notes TY CME 58.5 665.8 0.84% / 39% 0.93% / 45% 6.4% / 4.5% 7.7% / 6%
Futures - Low IV/SV ratioCorn C CME 41.6 583.2 6.92% / 100% 14.04% / 79% 35.4% / 44.8% 40.2% / 50.3%Soybean meal SM CME 2.8 60.8 4.68% / 56% 6.13% / 70% 29.1% / 36% 30.4% / 37%Wheat W CME 9.7 135.2 9.20% / 77% 19.10% / 97% 38.8% / 44.4% 37% / 55.6%Soybean oil BO CME 4.0 111.2 5.10% / 47% 11.48% / 90% 29% / 30.4% 29.7% / 29.6%30-year T-bonds US CME 13.5 132.0 2.59% / 92% 1.82% / 75% 11.4% / 11.7% 13.2% / 12.2%
* Ranked by volume ** Ranked based on high or low IV/SV values.

24 December 2009 • FUTURES & OPTIONS TRADER
American style: An option that can be exercised at anytime until expiration.
Assign(ment): When an option seller (or “writer”) isobligated to assume a long position (if he or she sold a put)or short position (if he or she sold a call) in the underlyingstock or futures contract because an option buyer exercisedthe same option.
At the money (ATM): An option whose strike price isidentical (or very close) to the current underlying stock (orfutures) price.
Backspreads and ratio spreads are leveraged posi-tions that involve buying and selling options in differentproportions, usually in 1:2 or 2:3 ratios. Backspreads con-tain more long options than short ones, so the potentialprofits are unlimited and losses are capped. By contrast,ratio spreads have more short options than long ones andhave the opposite risk profile.
Note: These labels are not set in stone. Some tradersdescribe either position as option trades with long andshort legs in different proportions.
Bear call spread: A vertical credit spread that consistsof a short call and a higher-strike, further OTM long call inthe same expiration month. The spread’s largest potentialgain is the premium collected, and its maximum loss is lim-ited to the point difference between the strikes minus thatpremium.
Bear put spread: A bear debit spread that contains putswith the same expiration date but different strike prices.You buy the higher-strike put, which costs more, and sellthe cheaper, lower-strike put.
Bull call spread: A bull debit spread that contains callswith the same expiration date but different strike prices.You buy the lower-strike call, which has more value, andsell the less-expensive, higher-strike call.
Bull put spread (put credit spread): A bull creditspread that contains puts with the same expiration date, butdifferent strike prices. You sell an OTM put and buy a less-expensive, lower-strike put.
Calendar spread: A position with one short-term shortoption and one long same-strike option with more timeuntil expiration. If the spread uses ATM options, it is mar-ket-neutral and tries to profit from time decay. However,OTM options can be used to profit from both a directionalmove and time decay.
Call option: An option that gives the owner the right, butnot the obligation, to buy a stock (or futures contract) at afixed price.
The Commitments of Traders report: Publishedweekly by the Commodity Futures Trading Commission(CFTC), the Commitments of Traders (COT) report breaksdown the open interest in major futures markets. Clearing
members, futures commission merchants, and foreign bro-kers are required to report daily the futures and optionspositions of their customers that are above specific report-ing levels set by the CFTC.
For each futures contract, report data is divided into three“reporting” categories: commercial, non-commercial, andnon-reportable positions. The first two groups are thosewho hold positions above specific reporting levels.
The “commercials” are often referred to as the largehedgers. Commercial hedgers are typically those who actu-ally deal in the cash market (e.g., grain merchants and oilcompanies, who either produce or consume the underlyingcommodity) and can have access to supply and demandinformation other market players do not.
Non-commercial large traders include large speculators(“large specs”) such as commodity trading advisors (CTAs)and hedge funds. This group consists mostly of institution-al and quasi-institutional money managers who do not dealin the underlying cash markets, but speculate in futures ona large-scale basis for their clients.
The final COT category is called the non-reportable posi-tion category — otherwise known as small traders — i.e.,the general public.
Covered call: Shorting an out-of-the-money call optionagainst a long position in the underlying market. An exam-ple would be purchasing a stock for $50 and selling a calloption with a strike price of $55. The goal is for the marketto move sideways or slightly higher and for the call optionto expire worthless, in which case you keep the premium.
Credit spread: A position that collects more premiumfrom short options than you pay for long options. A creditspread using calls is bearish, while a credit spread usingputs is bullish.
Debit spread: An options spread that costs money toenter, because the long side is more expensive that the short
KEY CONCEPTSThe option “Greeks”
Delta: The ratio of the movement in the option price forevery point move in the underlying. An option with adelta of 0.5 would move a half-point for every 1-pointmove in the underlying stock; an option with a delta of1.00 would move 1 point for every 1-point move in theunderlying stock.
Gamma: The change in delta relative to a change in theunderlying market. Unlike delta, which is highest fordeep ITM options, gamma is highest for ATM optionsand lowest for deep ITM and OTM options.
Rho: The change in option price relative to the changein the interest rate.
Theta: The rate at which an option loses value each day(the rate of time decay). Theta is relatively larger forOTM than ITM options, and increases as the option getscloser to its expiration date.
Vega: How much an option’s price changes per a one-percent change in volatility.

FUTURES & OPTIONS TRADER • December 2009 25
side. These spreads can be verticals, calendars, or diagonals.
Delivery period (delivery dates): The specific timeperiod during which a delivery can occur for a futures con-tract. These dates vary from market to market and are deter-mined by the exchange. They typically fall during themonth designated by a specific contract — e.g. the deliveryperiod for March T-notes will be a specific period in March.
Diagonal spread: A position consisting of options withdifferent expiration dates and different strike prices — e.g.,a December 50 call and a January 60 call.
European style: An option that can only be exercised atexpiration, not before.
Exercise: To exchange an option for the underlyinginstrument.
Expiration: The last day on which an option can be exer-cised and exchanged for the underlying instrument (usual-ly the last trading day or one day after).
Extrinsic value: The difference between an option'sintrinsic value and it's current price (premium). For exam-ple, with the underlying instrument trading at 50, a 45-strike call option with a premium of 8.50 has 3.50 of extrin-sic value.
Front month (or “nearest month”): The contractmonth closest to expiration.
In the money (ITM): A call optionwith a strike price below the price ofthe underlying instrument, or a putoption with a strike price above theunderlying instrument’s price.
Intrinsic value: The differencebetween the strike price of an in-the-money option and the underlyingasset price. A call option with a strikeprice of 22 has 2 points of intrinsicvalue if the underlying market is trad-ing at 24.
Naked option: A position thatinvolves selling an unprotected call orput that has a large or unlimitedamount of risk. If you sell a call, forexample, you are obligated to sell theunderlying instrument at the call’sstrike price, which might be below themarket’s value, triggering a loss. If yousell a put, for example, you are obligat-ed to buy the underlying instrument atthe put’s strike price, which may bewell above the market, also causing aloss.
Given its risk, selling naked optionsis only for advanced options traders,and newer traders aren’t usually
allowed by their brokers to trade such strategies.
Naked (uncovered) puts: Selling put options to collectpremium that contains risk. If the market drops below theshort put’s strike price, the holder may exercise it, requiringyou to buy stock at the strike price (i.e., above the market).
Near the money: An option whose strike price is closeto the underlying market’s price.
Open interest: The number of options that have notbeen exercised in a specific contract that has not yet expired.
Out of the money (OTM): A call option with a strikeprice above the price of the underlying instrument, or a putoption with a strike price below the underlying instru-ment’s price.
Parabolic SAR (stop-and-reverse): The parabolicstop is a trailing stop technique developed by Welles Wilderand explained in his book New Concepts in Technical Trading(Trend Research, 1978). It is the primary component of whathe called the “Parabolic Time/Price” trading system. Thebasic principle behind the parabolic stop is a calculationthat automatically raises (in the case of a long trade) or low-ers (in the case of a short trade) a stop-loss order that pro-tects existing profits in a trade.
For simplicity, the following discussion is given in termsof long trades. The rules are inverted for short trades. Theformula for calculating the parabolic stop level (P) for
continued on p. 26
Source: Barclay Hedge (www.barclayhedge.com) Based on estimates of the composite of all
accounts or the fully funded subset method. Does not reflect the performance of any single account.
PAST RESULTS ARE NOT NECESSARILY INDICATIVE OF FUTURE PERFORMANCE.
Top 10 option strategy traders ranked by October 2009 return.
(Managing at least $1 million as of Oct. 31, 2009.)
Oct. 2009 YTD $ underRank Trading advisor return return mgmt.
1. CKP Finance Associates (Masters) 14.87% 256.69% 4.3
2. Zephyr Investment (Defined Risk) 13.30% -9.71% 2.5
3. Carter Road 12.00% 49.52% 2.1
4. ACE Investment Strategists (DPC) 9.86% 94.24% 24.2
5. Financial Comm Inv (Option Selling) 7.45% 28.73% 12.8
6. Kingsview Capital Ptnrs 5.48% 8.76% 2.0
7. JPS Capital Mgmt (JPS Fund) 3.96% -14.11% 2.9
8. Oak Investment Group (Ag Options) 3.75% 57.29% 4.6
9. Washington (Singleton Fund) 2.83% 35.99% 56.9
10. Reynoso Asset Mgmt. (Options Arb.) 2.63% -4.42% 1.8
MANAGED MONEY

26 December 2009 • FUTURES & OPTIONS TRADER
tomorrow’s trading day (when using daily price bars) is:
Ptomorrow = Ptoday + AF(EPtrade - Ptoday)where:Ptoday = Today’s parabolic stop value.AF = Acceleration factor, the default value of which
begins at 0.02 and increases in 0.02 increments (for eachbar that establishes a new high during the trade) to a max-imum of 0.20. The greater the acceleration factor, the more“tightly” the stop follow prices.
EP = The extreme price since the trade was initiated(highest high if long, lowest low if short).
Assume a long trade was established yesterday in stockXYZ at 25, with an initial stop-loss of 23 that is still in effecttoday. Today’s high of 26.50 was higher than yesterday’shigh, which means it is the extreme price (EP in the previ-ous formula) since the trade began. The calculations fortomorrow’s parabolic stop level are then:
Ptomorrow = Ptoday + AF(Htoday – Ptoday)where:Ptoday = Today’s parabolic stop value
AF = Acceleration factorHtoday = Today’s high (the extreme price)
Because this is the first day of the calculation, there is noparabolic stop level for today. This means we must use theinitial stop for the trade (23) as Ptoday in the formula.Plugging in the hypothetical values results in:
Ptomorrow = 23 + 0.02(26.50 - 23)Ptomorrow = 23 + 0.07 = 23.07
If tomorrow the stock rallies to a new high of 28, the par-abolic stop level for the following day would be:
Ptomorrow = 23.07 + 0.04(28 - 23.07)Ptomorrow = 23.07 + 0.1972 = 23.27
Note that the acceleration factor increased from 0.02 to0.04, and that the previous day’s parabolic value is nowused in the formula. The AF increases by 0.02 only for a barthat establishes a new EP (high price) in the trade. If thestock had not made a new high, the previous high of 26.50would have been used as the EP and the AF would haveremained at 0.02.
Parity: An option trading at its intrinsic value.
Physical delivery: The process of exchanging a physicalcommodity (and making and taking payment) as a result ofthe execution of a futures contract. Although 98 percent ofall futures contracts are not delivered, there are market par-ticipants who do take delivery of physically settled con-tracts such as wheat, crude oil, and T-notes. Commoditiesgenerally are delivered to a designated warehouse; T-notedelivery is taken by a book-entry transfer of ownership,although no certificates change hands.
Premium: The price of an option.
Put option: An option that gives the owner the right, butnot the obligation, to sell a stock (or futures contract) at afixed price.
Put ratio backspread: A bearish ratio spread that con-tains more long puts than short ones. The short strikes arecloser to the money and the long strikes are further from themoney.
For example, if a stock trades at $50, you could sell one$45 put and buy two $40 puts in the same expiration month.If the stock drops, the short $45 put might move into themoney, but the long lower-strike puts will hedge some (orall) of those losses. If the stock drops well below $40, poten-tial gains are unlimited until it reaches zero.
Put spreads: Vertical spreads with puts sharing the same
EVENTS
Event: International Traders ExpoDate: Feb. 13-16Location: Marriott Marquis Hotel, New York, N.Y.For more information: www.tradersexpo.com
Event: 26th Annual Risk Management ConferenceDate: March 7-9Location: The Ritz-Carlton Golf Resort, Naples, Fla.For more information: Visit www.cboe.com/rmc
Event: 35th Annual International Futures Industry ConferenceDate: March 10-13Location: Boca Raton Resort & Club, Fla.For more information: Go to www.futuresindustry.org
Event: The 17th Forbes Cruise for InvestorsDate: March 18-30Location: Crystal Symphony, Sydney to AucklandFor more information: Go towww.moneyshow.com/events/Investment_Cruises.asp
Event: The World MoneyShow Vancouver 2010Date: April 6-8Location: Hyatt Regency VancouverFor more information: Go towww.moneyshow.com/events/World_MoneyShows.asp
Event: FIA/FOA International Derivatives ExpoDate: June 8-9Location: The Brewery, Chiswell Street, LondonFor more information: Go to www.idw.org.uk
KEY CONCEPTS

FUTURES & OPTIONS TRADER • December 2009 27
expiration date but different strikeprices. A bull put spread containsshort, higher-strike puts and long,lower-strike puts. A bear put spread isstructured differently: Its long putshave higher strikes than the short puts.
Simple moving average: A sim-ple moving average (SMA) is the aver-age price of a stock, future, or othermarket over a certain time period. Afive-day SMA is the sum of the fivemost recent closing prices divided byfive, which means each day’s price isequally weighted in the calculation.
Straddle: A non-directional optionspread that typically consists of an at-the-money call and at-the-money putwith the same expiration. For example,with the underlying instrument trad-ing at 25, a standard long straddlewould consist of buying a 25 call and a25 put. Long straddles are designed toprofit from an increase in volatility;short straddles are intended to capital-ize on declining volatility. The strangleis a related strategy.
Strangle: A non-directional optionspread that consists of an out-of-the-money call and out-of-the-money putwith the same expiration. For example,with the underlying instrument trad-ing at 25, a long strangle could consistof buying a 27.5 call and a 22.5 put.Long strangles are designed to profitfrom an increase in volatility; shortstrangles are intended to capitalize ondeclining volatility. The straddle is arelated strategy.
Strike (“exercise”) price: Theprice at which an underlying instru-ment is exchanged upon exercise of anoption.
Time decay: The tendency of timevalue to decrease at an accelerated rateas an option approaches expiration.
Time spread: Any type of spreadthat contains short near-term optionsand long options that expire later. Bothoptions can share a strike price (calen-dar spread) or have different strikes(diagonal spread).
Time value (premium): Theamount of an option’s value that is afunction of the time remaining until
expiration. As expiration approaches,time value decreases at an acceleratedrate, a phenomenon known as “timedecay.”
True range (TR): A measure ofprice movement that accounts for thegaps that occur between price bars.This calculation provides a more accu-rate reflection of the size of a pricemove over a given period than thestandard range calculation, which issimply the high of a price bar minusthe low of a price bar. The true rangecalculation was developed by WellesWilder and discussed in his book NewConcepts in Technical Trading Systems(Trend Research, 1978).
True range can be calculated on anytime frame or price bar — five-minute,hourly, daily, weekly, etc. The follow-ing discussion uses daily price bars forsimplicity. True range is the greatest(absolute) distance of the following:
1. Today’s high and today’s low.2. Today’s high and yesterday’s close.3. Today’s low and yesterday’s close.
Average true range (ATR) is simplya moving average of the true rangeover a certain time period. For exam-ple, the five-day ATR would be theaverage of the true range calculationsover the last five days.
Variance and standard devia-tion: Variance measures how spreadout a group of values are — in otherwords, how much they vary.Mathematically, variance is the aver-age squared “deviation” (or differ-ence) of each number in the groupfrom the group’s mean value, dividedby the number of elements in thegroup. For example, for the numbers 8,9, and 10, the mean is 9 and the vari-ance is:
{(8-9)2 + (9-9)2 + (10-9)2}/3 = (1 + 0 + 1)/3 = 0.667
Now look at the variance of a morewidely distributed set of numbers: 2, 9,and 16:
{(2-9)2 + (9-9)2 + (16-9)2}/3 = (49 + 0 + 49)/3 = 32.67
The more varied the prices, the high-er their variance — the more widelydistributed they will be. The more var-
ied a market’s price changes from dayto day (or week to week, etc.), the morevolatile that market is.
A common application of variance intrading is standard deviation, which isthe square root of variance. The stan-dard deviation of 8, 9, and 10 is: sq. rt.0.667 = .82; the standard deviation of 2,9, and 16 is: sq. rt. 32.67 = 5.72.
Vertical spread: A position consist-ing of options with the same expira-tion date but different strike prices(e.g., a September 40 call option and aSeptember 50 call option).
Volatility: The level of price move-ment in a market. Historical (“statisti-cal”) volatility measures the price fluc-tuations (usually calculated as thestandard deviation of closing prices)over a certain time period — e.g., thepast 20 days. Implied volatility is thecurrent market estimate of futurevolatility as reflected in the level ofoption premiums. The higher theimplied volatility, the higher theoption premium.
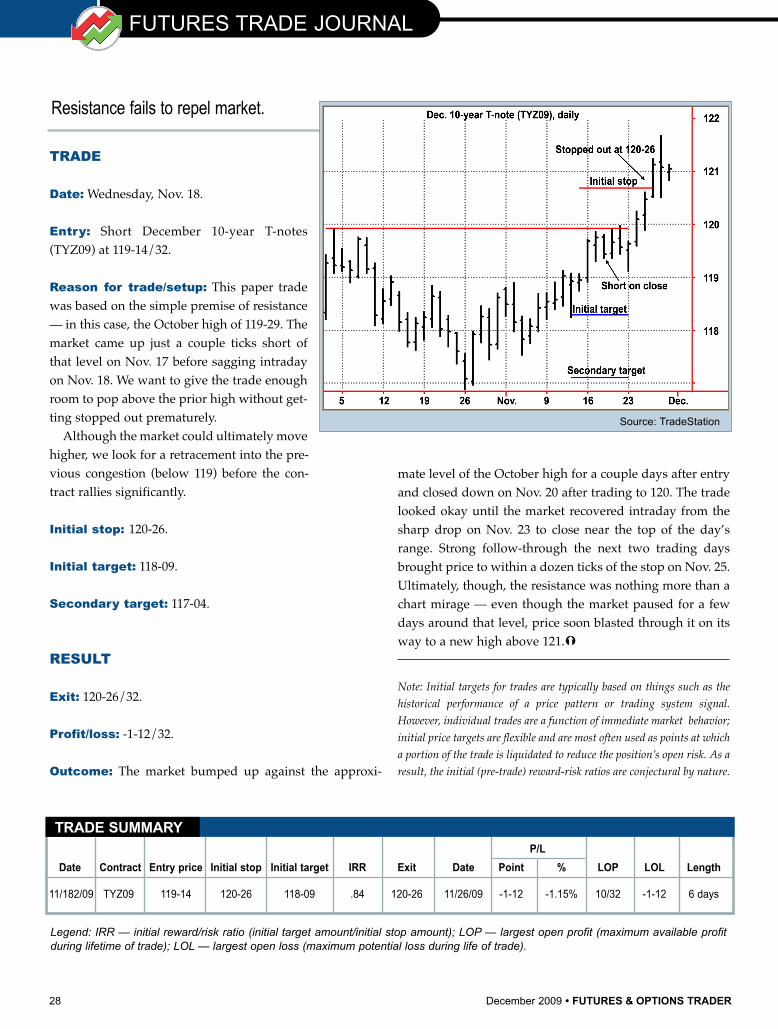
28 December 2009 • FUTURES & OPTIONS TRADER
Legend: IRR — initial reward/risk ratio (initial target amount/initial stop amount); LOP — largest open profit (maximum available profitduring lifetime of trade); LOL — largest open loss (maximum potential loss during life of trade).
TRADE
Date: Wednesday, Nov. 18.
Entry: Short December 10-year T-notes(TYZ09) at 119-14/32.
Reason for trade/setup: This paper tradewas based on the simple premise of resistance— in this case, the October high of 119-29. Themarket came up just a couple ticks short ofthat level on Nov. 17 before sagging intradayon Nov. 18. We want to give the trade enoughroom to pop above the prior high without get-ting stopped out prematurely.
Although the market could ultimately movehigher, we look for a retracement into the pre-vious congestion (below 119) before the con-tract rallies significantly.
Initial stop: 120-26.
Initial target: 118-09.
Secondary target: 117-04.
RESULT
Exit: 120-26/32.
Profit/loss: -1-12/32.
Outcome: The market bumped up against the approxi-
mate level of the October high for a couple days after entryand closed down on Nov. 20 after trading to 120. The tradelooked okay until the market recovered intraday from thesharp drop on Nov. 23 to close near the top of the day’srange. Strong follow-through the next two trading daysbrought price to within a dozen ticks of the stop on Nov. 25.Ultimately, though, the resistance was nothing more than achart mirage — even though the market paused for a fewdays around that level, price soon blasted through it on itsway to a new high above 121.�
Note: Initial targets for trades are typically based on things such as thehistorical performance of a price pattern or trading system signal.However, individual trades are a function of immediate market behavior;initial price targets are flexible and are most often used as points at whicha portion of the trade is liquidated to reduce the position’s open risk. As aresult, the initial (pre-trade) reward-risk ratios are conjectural by nature.
Resistance fails to repel market.
P/L
Date Contract Entry price Initial stop Initial target IRR Exit Date Point % LOP LOL Length
11/182/09 TYZ09 119-14 120-26 118-09 .84 120-26 11/26/09 -1-12 -1.15% 10/32 -1-12 6 days
TRADE SUMMARY
FUTURES TRADE JOURNAL
Source: TradeStation
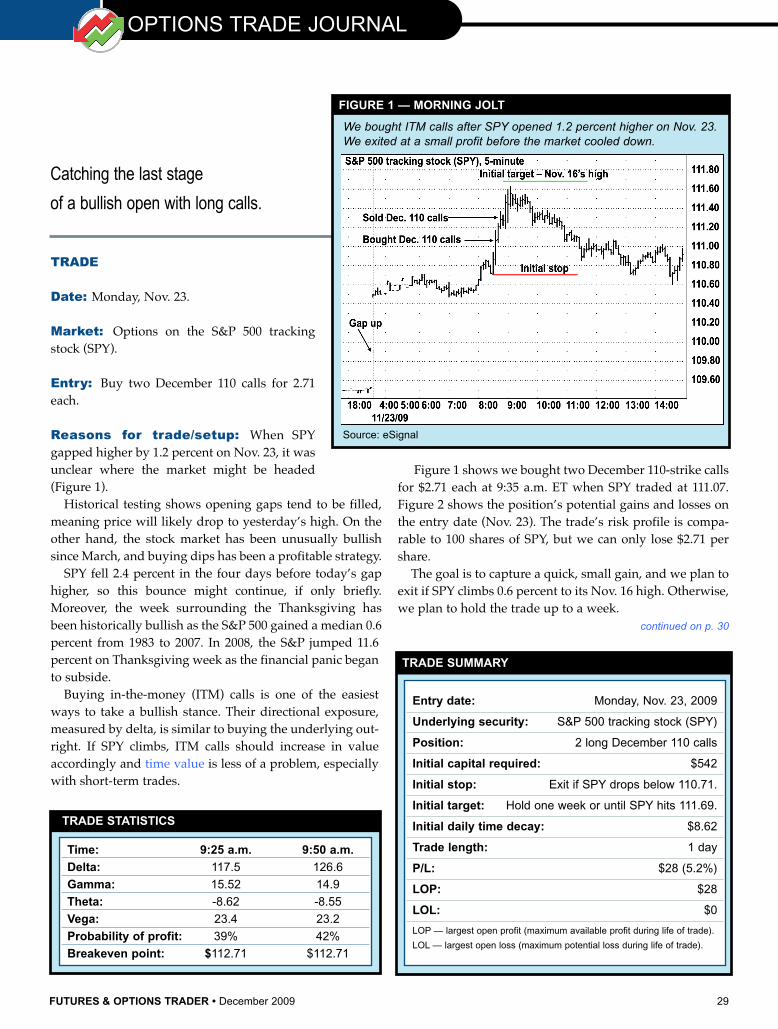
FUTURES & OPTIONS TRADER • December 2009 29
TRADE
Date: Monday, Nov. 23.
Market: Options on the S&P 500 trackingstock (SPY).
Entry: Buy two December 110 calls for 2.71each.
Reasons for trade/setup: When SPYgapped higher by 1.2 percent on Nov. 23, it wasunclear where the market might be headed(Figure 1).
Historical testing shows opening gaps tend to be filled,meaning price will likely drop to yesterday’s high. On theother hand, the stock market has been unusually bullishsince March, and buying dips has been a profitable strategy.
SPY fell 2.4 percent in the four days before today’s gaphigher, so this bounce might continue, if only briefly.Moreover, the week surrounding the Thanksgiving hasbeen historically bullish as the S&P 500 gained a median 0.6percent from 1983 to 2007. In 2008, the S&P jumped 11.6percent on Thanksgiving week as the financial panic beganto subside.
Buying in-the-money (ITM) calls is one of the easiestways to take a bullish stance. Their directional exposure,measured by delta, is similar to buying the underlying out-right. If SPY climbs, ITM calls should increase in valueaccordingly and time value is less of a problem, especiallywith short-term trades.
Figure 1 shows we bought two December 110-strike callsfor $2.71 each at 9:35 a.m. ET when SPY traded at 111.07.Figure 2 shows the position’s potential gains and losses onthe entry date (Nov. 23). The trade’s risk profile is compa-rable to 100 shares of SPY, but we can only lose $2.71 pershare.
The goal is to capture a quick, small gain, and we plan toexit if SPY climbs 0.6 percent to its Nov. 16 high. Otherwise,we plan to hold the trade up to a week.
TRADE STATISTICS
Time: 9:25 a.m. 9:50 a.m.
Delta: 117.5 126.6
Gamma: 15.52 14.9
Theta: -8.62 -8.55
Vega: 23.4 23.2
Probability of profit: 39% 42%
Breakeven point: $112.71 $112.71
TRADE SUMMARY
Entry date: Monday, Nov. 23, 2009
Underlying security: S&P 500 tracking stock (SPY)
Position: 2 long December 110 calls
Initial capital required: $542
Initial stop: Exit if SPY drops below 110.71.
Initial target: Hold one week or until SPY hits 111.69.
Initial daily time decay: $8.62
Trade length: 1 day
P/L: $28 (5.2%)
LOP: $28
LOL: $0
LOP — largest open profit (maximum available profit during life of trade).
LOL — largest open loss (maximum potential loss during life of trade).
OPTIONS TRADE JOURNAL
We bought ITM calls after SPY opened 1.2 percent higher on Nov. 23.We exited at a small profit before the market cooled down.
FIGURE 1 — MORNING JOLT
Source: eSignal
Catching the last stage
of a bullish open with long calls.
continued on p. 30

Initial stop: Exit if SPY falls belowtoday’s low of 110.71.
Initial target: Hold overThanksgiving week unless SPY hitsits Nov. 16 high of 111.69.
RESULT
Outcome: Figure 2 shows SPY con-tinued to rally after we entered, butwe had second thoughts as the mar-ket climbed above Nov. 19’s high.SPY stalled around 111.50 last week,and holding a long position near thisresistance level made us nervous.
We sold the calls at a per-shareprofit of 0.14. In hindsight, the tradedidn’t make much sense, but exitingearly helped us avoid losses.�
Buying ITM calls is an easy and cheap way to exploit brief rallies.
FIGURE 2 — RISK PROFILE — LONG CALLS
Source: OptionVue
30 December 2009 • FUTURES & OPTIONS TRADER
Click on these boxes
to link directly
to these advertisers’
web sites
THIS MONTH’S ADVERTISERSTHIS MONTH’S ADVERTISERS
TRADING STRATEGIES


