Fossil-free living within one generation...Fossil-free living within one generation At Vattenfall we...
184
Annual and Sustainability Report 2018 Fossil-free living within one generation
Transcript of Fossil-free living within one generation...Fossil-free living within one generation At Vattenfall we...

Annual and Sustainability Report 2018
Fossil-free living within one
generation

At Vattenfall we exist to help our customers power their lives in ever climate smarter ways. The goal is to be free
from fossil fuels within one generation.
The future is fossil free
Contents
Overview2 This is Vattenfall4 The year in numbers6 CEO’s message8 Important events
10 Targets and target achievement
12 Market trends
Business model14 Business model
Strategic direction18 Strategy22 Investment plan
Markets and regulations24 Markets and regulations
Operating segments30 Operating segment overview32 Operating segments54 Research & Development
About the reportThe 2018 Annual and Sustainability Report for Vattenfall AB (publ) is submitted by the Board of Directors and describes the company’s overall targets and strategy as well as the year’s results. The administration report and accounts are found on pages 2–5, 8–11, 62–147 and are assured by our auditors. Pages 10–11, 14–17, 58–79, and 152–163 include Vattenfall’s statutory sustainability report according to the Swedish Annual Accounts Act. Vattenfall has been reporting in accordance with the Global Reporting Initiative’s (GRI) Guidelines annually since 2003 and for 2018 has applied the GRI Standards, “Core” option. Vattenfall uses the GRI framework as a basis for reporting and is inspired
by the Integrated Reporting Framework with the ambition that the report will reflect how sustainability is embedded in the overall strategy as well as in the daily work. Vattenfall uses the Annual and Sustainability Report as its Communication on Progress for the UN Global Compact (UNGC).Further information about Vattenfall’s operations and sustainability work can be found at: vattenfall.com/sustainability.
Administration report and financial statements Statutory sustainability report
Our people58 Our people
Risks and risk management 62 Risks and risk management
Corporate governance 70 Corporate Governance Report80 Board of Directors82 Executive Group Management84 AGM proposal
Financial information86 Financial performance93 Consolidated accounts99 Notes to the consolidated
accounts133 Parent Company accounts136 Notes to the Parent Company
accounts148 Audit Report
Non-financial information153 Materiality analysis154 Stakeholders155 Social information160 Environmental information164 GRI Index168 Combined Assurance Report168 Auditor’s statement
More on Vattenfall170 Five-year overview,
sustainability data171 Quarterly overview173 Ten-year overview174 Definitions and calculations
of key ratios176 Facts about Vattenfall’s
markets
Glossary 179 Glossary181 Contacts and financial
calendar

What this means for Vattenfall
Wind power continues to grow in all of Vattenfall’s markets, both offshore and onshore.
Hydro power will continue to play a key role as a large-scale, on-demand and renewable energy source.
Energy storage systems such as batteries and pumped storage power plants are hel-ping to manage the challenges presented by renewable and weather-dependent energy like wind and solar power.
Solar power will play an ever-greater role in the future energy system, in small customer installations as well as large-scale installations.
Electrification of roads andtransportation will contribute to significant reductions in CO2 emissions and noise in cities.
The city of the future is an emissions-free environment with sustainable heating solu-tions, solar panels on rooftops, a secure and flexible electricity grid, and electric vehicles on the streets.
Nuclear power will continue to play an important role in Sweden until it is decom-missioned in the 2040s as a climate-neutral, cost-effective source of base load electricity.
Electrification of industries like steel, cement, chemicals, and refineries has the potential to dramatically reduce CO2 emissions from industrial processes.
Fossil fuels will be phased out within one generation, and we are continuing on our path towards a complete phase-out of coal in our heat production by 2030.
Digitalisation is enabling de velopment of better customer offerings along with more efficient operations and management of assets.
New competences, speed in learning and diverse and inclusive teams are critical for serving our customers in the energy transition.
Customer centricity and sustainability are key for us in attracting customers, talent and investors. Customers are increasingly considering climate impact, social and environmental performance, and energy efficiency when choosing energy solutions and suppliers.
Innovative energy sharing platforms will enable custo-mers to sell and purchase renewable electricity.
Market trends
More decentralised energy solutions
Changing demands on competences and capabilities
High cost efficiency requirements
Electrification
Digitalisation
Sustainability and customer focus
Vattenfall is passionate about driving the transformation of the energy sector. Falling technology costs and greater focus on climate change are accelerating the development of renewable energy and incentivising electrification as a means of reducing CO2 emissions. This entire development is underpinned by
digitalisation, enabling companies to work smarter, faster, and more efficiently. Cost efficiency is a prerequisite for value creation and growth in an increasingly competitive market, and to that end companies need new competences, speed in learning and inclusive teams.
VATTENFALL ANNUAL AND SUSTAINABILITY REPORT 2018 1

This is Vattenfall
2,140,000Heat customers
3,310,000Electricity network customers
2,350,000Gas customers
We are one of Europe’s largest producers and retailers of electricity and heat. Vattenfall’s main markets are Sweden, Germany, the Netherlands, Denmark,
and the UK. The Group has approximately 20,000 employees. The Parent Company, Vattenfall AB, is 100% owned by the Swedish
state, and its headquarters are in Solna, Sweden.
Operating segments – percentage share of underlying operating profit1 2018
6,550,000Electricity customers
20,000Employees
Customers & Solutions Power Generation Heat Distribution
6% 44%
Wind
18% 4% 29%
SEK 19,883 million
1 Operating profit excluding items affecting comparability.
2 VATTENFALL ANNUAL AND SUSTAINABILITY REPORT 2018
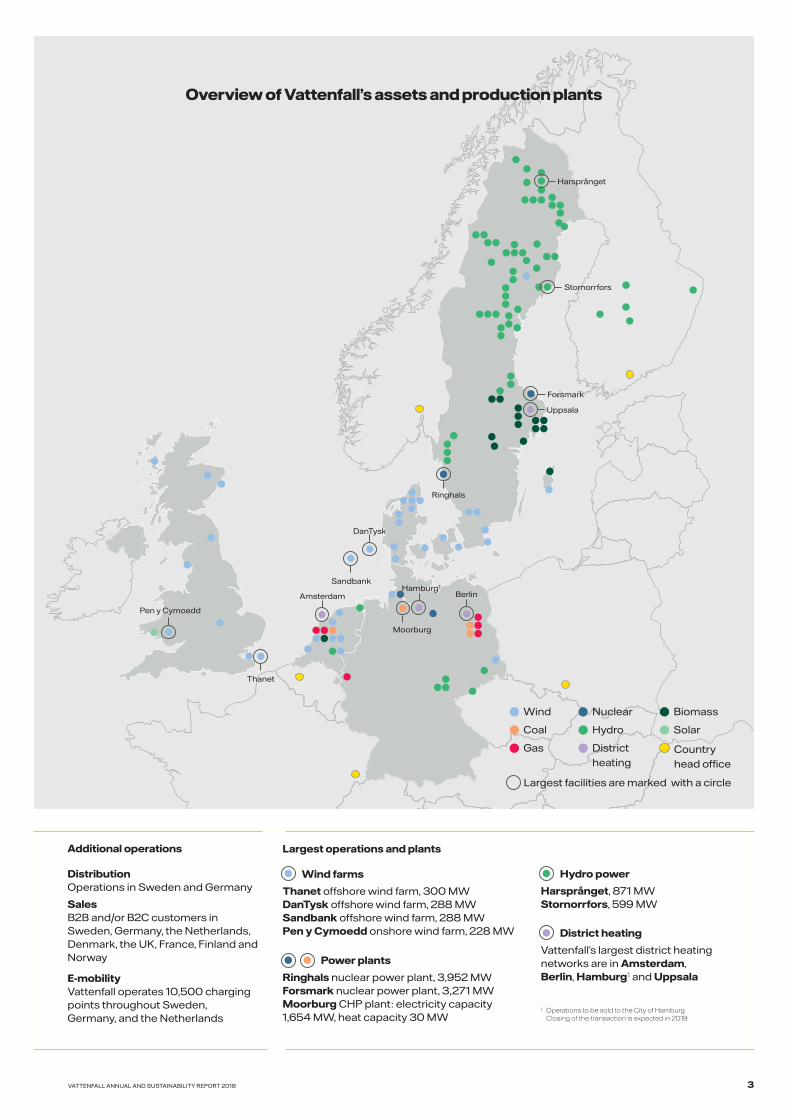
Additional operations
DistributionOperations in Sweden and Germany
Sales B2B and/or B2C customers in Sweden, Germany, the Netherlands, Denmark, the UK, France, Finland and Norway
E-mobilityVattenfall operates 10,500 charging points throughout Sweden, Germany, and the Netherlands
Largest operations and plants
Wind farms
Thanet offshore wind farm, 300 MWDanTysk offshore wind farm, 288 MW Sandbank offshore wind farm, 288 MWPen y Cymoedd onshore wind farm, 228 MW
Power plants
Ringhals nuclear power plant, 3,952 MWForsmark nuclear power plant, 3,271 MWMoorburg CHP plant: electricity capacity 1,654 MW, heat capacity 30 MW
Hydro power
Harsprånget, 871 MWStornorrfors, 599 MW
District heating
Vattenfall’s largest district heating networks are in Amsterdam, Berlin, Hamburg1 and Uppsala
1 Operations to be sold to the City of Hamburg. Closing of the transaction is expected in 2019.
DanTysk
Forsmark
Harsprånget
Stornorrfors
Uppsala
Sandbank
Amsterdam Berlin
Moorburg
Hamburg1
Pen y Cymoedd
Ringhals
Thanet
Nuclear
District heating
Hydro
Gas
Coal
Wind
Largest facilities are marked with a circle
Solar
Biomass
Country head office
Overview of Vattenfall’s assets and production plants
VATTENFALL ANNUAL AND SUSTAINABILITY REPORT 2018 3

Environmental
22.0 Mtonnes (22.6)CO2 emissions
694 GWh (511)Energy efficiency improvements1
101 MW (354)Added renewables capacity
75% (75)Share of fossil-free electricity generation
Social
64% (64)Employee Engagement Index
1.9 (1.5)LTIF (Lost Time Injury Frequency)
24% (23)Share of female managers
+1 (+2)Net Promoter Score (NPS)1
1 NPS is a tool for measuring customer loyalty.
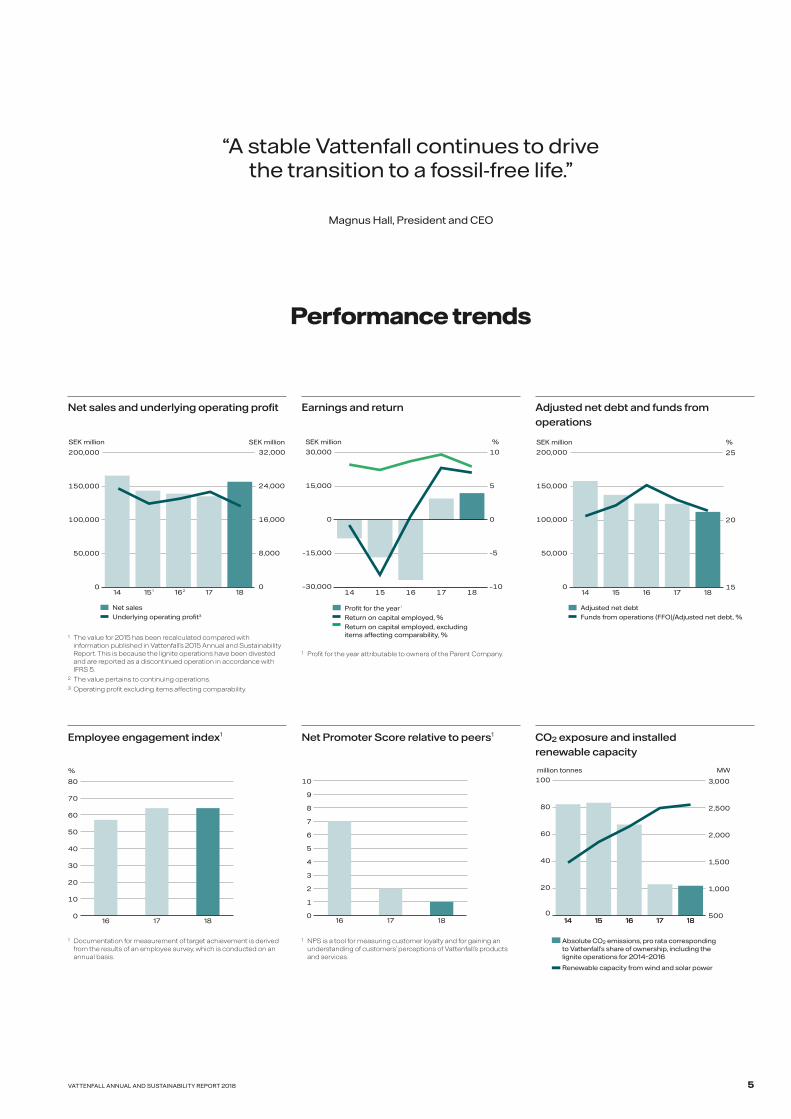
156,824 (135,114) Net sales
19,883 (23,203)Underlying operating profit1
17,619 (18,524) Operating profit
12,007 (9,484)Profit for the year
FinancialSEK million
1 Operating profit excluding items affecting comparability. 1 Cumulative energy efficiency improvements since 2016.
The year in numbers
4 VATTENFALL ANNUAL AND SUSTAINABILITY REPORT 2018
Net sales and underlying operating profit Earnings and return
0
50,000
100,000
150,000
200,000
18171615140
8,000
16,000
24,000
32,000
SEK million
Net salesUnderlying operating profit3
SEK million
1 20
50,000
100,000
150,000
200,000
181716151415
20
25
%SEK million
Adjusted net debtFunds from operations (FFO)/Adjusted net debt, %
–30,000
–15,000
0
15,000
30,000
1817161514–10
–5
0
5
10
SEK million
Profit for the year 1
Return on capital employed, %Return on capital employed, excluding items affecting comparability, %
%
1 The value for 2015 has been recalculated compared with information published in Vattenfall’s 2015 Annual and Sustainability Report. This is because the lignite operations have been divested and are reported as a discontinued operation in accordance with IFRS 5.
2 The value pertains to continuing operations.3 Operating profit excluding items affecting comparability.
1 Profit for the year attributable to owners of the Parent Company.
Adjusted net debt and funds from operations
Employee engagement index1
0
20
40
60
80
100
1817161514500
1,000
1,500
2,000
2,500
3,000
1817161514
million tonnes MW
0
10
20
30
40
50
60
70
80
181716
%
0
1
2
3
4
5
6
7
8
9
10
181716
Net Promoter Score relative to peers1 CO2 exposure and installed renewable capacity
“A stable Vattenfall continues to drive the transition to a fossil-free life.”
Magnus Hall, President and CEO
Performance trends
Absolute CO2 emissions, pro rata corresponding to Vattenfall’s share of ownership, including the l ignite operations for 2014–2016
Renewable capacity from wind and solar power
1 NPS is a tool for measuring customer loyalty and for gaining an understanding of customers’ perceptions of Vattenfall’s products and services.
1 Documentation for measurement of target achievement is derived from the results of an employee survey, which is conducted on an annual basis.
VATTENFALL ANNUAL AND SUSTAINABILITY REPORT 2018 5

For more than 100 years Vattenfall has been a driver of electrification of society, which has contributed to a higher living standard, economic growth and modern life. We can be proud of our heritage and our leading role in this development. Much has changed through the years, but the benefits of electrification remain. Today we view it not only as a driving force behind further technological and economic progress. We are also con-vinced that continued electrification based on fossil-free electricity is a basic precondition for Vattenfall’s customers to be fossil free within one generation. During 2018 we consciously imple-mented our strategy with the purpose of making this possible.
ResultsProfit for the year amounted to SEK 12 billion, an increase of SEK 2.5 billion. The Board of Directors proposes a dividend of SEK 2 billion. The underlying operating profit decreased by SEK 3.3 billion to SEK 19.9 billion. Vattenfall made important progress during the year, but we also faced
a number of challenges. We had very good production in both our nuclear and hydro power operations, but the high electric-ity prices did not have a corresponding impact on our earnings. This is because of the hedges we take out to ensure price stability over time. Last year they made a positive contribution, but not this year. Earnings from our heat operations were significantly lower due to higher prices of fuel and CO2 emission allowances. This was partially offset by a profit increase in our wind operations.
The market is moving towards a fossil-free futureDespite sharp swings in the markets for fuel and CO2 in 2018, structurally there is no doubt about the future direction. The Paris Agreement and the EU’s climate goals are driving the shift towards more fossil-free power generation and lower carbon emissions. The Swedish energy agreement, which ensures that we make optimal use of our nuclear and hydro power generation resources, and the future ban on coal-fired power generation
in the Netherlands, are further examples of initiatives that have been taken at the national level. Another is the coal phase-out proposal in Germany. Parallel with this, plans are being drawn for new renewable electricity generation with significant capacity entirely without government sup-port. Vattenfall’s winning bid for the Hol-landse Kust Zuid 1 & 2 offshore wind farm (~700 MW) in the Netherlands is a prime example. The project has excellent pros-pects and is very attractive for Vattenfall at the same time that it supports the energy shift in the Netherlands.
In the energy industry we have thus already achieved a strong level of competitiveness for renewable energy sources, and growth has also exceeded many expectations. The challenges we see looking at tomorrow’s energy system are now mainly a matter of meeting the demands that renewable energy sources inherently give rise to. The energy system must be made more flexible to be able to handle a large share of weather-dependent generation. This will require more energy storage, the ability to steer demand, higher
A fossil-free future unites us
6 CEO's message VATTENFALL ANNUAL AND SUSTAINABILITY REPORT 2018

transmission capacities between markets, and an adaptation of the electricity grids. Vattenfall has strength through its large-scale and flexible hydro power generation in Sweden, but from a system perspec-tive, major investments are needed in our electricity networks to accommodate the transition. We regret the Swedish govern-ment’s decision on regulated revenues for Swedish electricity grid operators that will begin to take effect in 2020. This new regulation chokes the willingness to invest at a time when it is needed most.
At Vattenfall we continue to operate our hydro and nuclear power plants with ever-greater efficiency. Nuclear power generation achieved a record year, with 55 TWh of generation and 88.9% availability. Hydro power generation was stable at 35.5 TWh, in spite of volatile inflows follow-ing a very warm summer which was later compensated by a rainy autumn. We are dismantling our nuclear power plants in Germany in accordance with political deci-sions, and we are preparing for the respon-sible closure of Ringhals 1 and 2 at the end of 2020 and 2019, respectively. Sweden’s climate goal of zero net emissions by 2045 is a challenging but possible mission. Our remaining reactors in Ringhals and Forsmark, together with our hydro power assets, are key to making this a reality.
Collaboration for changeNo one alone can meet the challenges presented by climate change. Nations, cities, politicians, civil society and companies must all work together to achieve results. Over time Vattenfall has built up very strong ties and partnerships in society. We have a long-standing produc-tive and rewarding partnership with the City of Berlin, for example. Together we set a target in 2009 to halve our carbon emissions by 2020 compared with 1990. We were happy to note earlier in 2018 that we had already achieved this goal three years earlier than promised. In Hamburg we would have preferred to continue as a partner, but now respect the city’s decision to buy back Vattenfall’s majority stake in the city’s district heating network.
The list of Vattenfall’s strategic partner-ships today is long. Our vision of a life free from fossil fuels within one generation guides us in our active search for new partnerships. At the same time we see that these clearly strengthen our customer offerings. A superb example is InCharge, the European charging network for e-vehicles and plug-in hybrids, which today has more than 10,500 charging points. The initiative is owned by Vattenfall, but is now growing with participation by new partners. During the year, we expanded together with car maker Volvo Cars, the
car-sharing service aimo, and the property companies Klövern and Diös, among others. Vattenfall has also entered into an agreement with McDonald’s to install fast EV chargers in the Netherlands.
Vattenfall is also a driver in a number of industrial collaborations with great poten-tial to reduce carbon emissions. Last sum-mer we broke ground on a pilot plant for fossil-free steel production in Luleå, Swe-den. Conducted under the name HYBRIT, the collaboration is a joint venture we are engaged in together with the mining company LKAB and the steel maker SSAB. With support from the Swedish Energy Agency, Vattenfall is also conducting project planning together with Preem on a large hydrogen gas plant in Gothenburg to enable fossil-free production of biofuels.
In March we formed an alliance in France to participate in a tendering process for
offshore wind power in Dunkirk. This is being conducted together with the finan-cial institution Caisse des Dépôts and the development company WPD. We are now also taking a step into the French end cus-tomer market. In Scotland I had the honour in September, together with First Minister Nicola Sturgeon, to inaugurate Vattenfall’s European Offshore Wind Development Centre (97 MW), a testing and development centre in Aberdeen Bay. The project is sup-ported by the Aberdeen Renewable Energy Group with co-financing from the EU. The wind turbines have an impressive size and feature what is today the world’s highest commercial turbine capacity (8.8 MW).
Our employees and their safety firstIn September a tragic accident took place outside Kungsbacka, Sweden, in which an employee lost his life while attending to a downed power line during a storm. In Octo-ber we received additional, tragic news that an employee died in connection with a routine work matter in Kiruna. My thoughts go out to these individuals’ families and loved ones. Every workplace accident is an accident too many and requires both reflection and an exhaustive investigation to make sure it never happens again. A safe and sound work environment shall always be a matter of fact in our company,
and together with suppliers and subcon-tractors, we must now work even harder to sharpen our focus on safety.
Responsibility to respect human rightsVattenfall supports the UN’s 17 Sustainable Development Goals and respects human rights, which is an important component of these goals. We are continuing our work to manage the most critical risks related to human rights, including work conditions in our supply chain in high-risk countries. For example, we have further elaborated upon the questions we use in our third-party audits of products and services in order to more thoroughly cover all human rights. The work coupled to our own fuel supply has also been made more in-depth. Among other things, we paid a follow-up visit related to our supply of coal from Colombia in order to continue the dialogue surrounding the measures we recommended in connection with our visit in 2017. We also conducted an evaluation and dialogue on human rights in connec-tion with our audit of a Russian uranium supplier. This served as a pilot that will form the foundation for our continued work.
Well-positioned for a fossil-free life within one generationIt is clear and gratifying that our vision of a fossil-free future unites us all as employees, partners and customers. With continued stable production of district heating and fossil-free electricity from nuclear and hydro power, the expansion of renewable generation, digitalisation of our entire value chain, the phase-out of fossil fuels and increasingly attractive and com-petitive customer offerings, Vattenfall is well-positioned for the future. We welcome new collaborations along our journey that will make it possible to live free from fossil fuels within one generation. In clos-ing I would like to extend great thanks to all our employees, customers and other stakeholders, who share in Vattenfall’s successes.
Magnus Hall, President and CEO
“No one alone can meet the challenges
presented by climate change. Nations, cities, politicians,
civil society and companies must all work together
to achieve results.”
VATTENFALL ANNUAL AND SUSTAINABILITY REPORT 2018 7CEO's message

Q1 2018Winning bid for Hollandse Kust Zuid 1 & 2 offshore wind farm in the Netherlands – Vattenfall won the permit for what will be the first non-subsidised offshore wind farm in the Netherlands, Hollandse Kust Zuid 1 & 2. The wind farm has a planned capacity of approximately 700 MW and will be able to supply 1 to 1.5 million Dutch households with renewable energy.
Lease purchase agreement for solar panels in the Netherlands – Arrangement of the first lease purchase agreement for solar panels for a business customer in the Netherlands, where nearly 2,000 solar panels have been installed on a commercial building in the city of Harlingen.
Supply contract with Swedish food retailer Axfood – Vattenfall concluded a new supply contract with Axfood, Sweden’s second largest food retailer. Starting 1 April 2018 Vattenfall will be deliver-ing an annual volume of 280 GWh of renewable electricity to all of Axfood’s Snabbgross, Hemköp and Willys stores in Sweden.
Vattenfall forms alliance for the French wind market – In early March Vattenfall took a further step into the European wind power market by forming an alliance with the finance group Caisse des Dépôts (CDC) and the developer WPD for the bid preparation in an offshore wind tender in Dunkirk, France.
Expansion of InCharge with Bilprovningen – The Swedish motor vehicle inspection company Bilprovningen chose to partner with Vattenfall InCharge to offer public charging at its inspection sta-tions. The sites will be connected to Vattenfall InCharge, giving e-vehicle customers access to an extensive charging network.
Q2 2018
Agreement with Facebook on supply of renewable electricity and power balancing – Vattenfall entered into a supply agree-ment with Facebook for supply of renewable electricity to two of Facebook’s data centres in the Nordic countries. As part of the deal, Vattenfall will also provide market access and power balancing of electricity generation from three new Norwegian wind farms.
Construction start of the Blakliden/ Fäbodberget wind farm – Construction started on the Blakliden/Fäbod berget onshore wind farm in Åsele and Lycksele municipalities in northern Sweden. Vattenfall is partnering with the Danish turbine manufacturer Vestas and the Danish pension fund PKA for ownership of the wind farm. The wind farm will have a capacity of 353 MW, and approximately 60% of production will be sold to Norsk Hydro.
Planned early closure of Hemweg 8 coal-fired power plant in the Netherlands – The Dutch government introduced a law that pro-hibits the use of coal as a fuel for electricity generation. As a result of this, Vattenfall’s Hemweg 8 coal-fired power plant would need to be closed by year-end 2024 at the latest, which is ten years earlier than the plant’s technical life span. This decision was later changed in March 2019 when the Dutch Government announced that Hemweg 8 should stop using coal as fuel by the end of 2019.
Partnership with Volvo Cars in Sweden on e-vehicle charging – Together with Volvo Cars in Sweden, Vattenfall entered into a new partnership on charging infrastructure. Volvo customers who purchase an electric hybrid car now have the option to choose the “InCharge Smart Hemma” charging solution.
Installation of a 22 MW battery at Pen y Cymoedd wind farm in the UK – Vattenfall’s 22 MW battery installation became opera-tional at the Pen y Cymoedd onshore wind farm in the UK in May. This is the largest co-located battery installation at a wind farm in the UK and will contribute to a stable and reliable network for British consumers.
Construction start of unique pilot plant for fossil-free steel pro-duction – Construction started on HYBRIT’s pilot plant for manu-facturing fossil-free steel in Luleå, Sweden. The plant is expected to be ready by 2020. Vattenfall, together with SSAB, LKAB and the Swedish Energy Agency, will invest a total of SEK 1.4 billion in the pilot plant. The goal is to have an industrial process for fossil-free steel production in place by 2035.
Important events
Vattenfall arranged the first lease purchase agreement for solar panels for a business customer in the Netherlands where nearly 2,000 solar panels have been installed.
700 MWplanned capacity for
Hollandse Kust Zuid 1 & 2
Vattenfall entered into a partnership with Volvo Cars in Sweden where Volvo customers who buy an electric hybrid can choose the “InCharge Smart Hemma” charging solution.
8 Important events VATTENFALL ANNUAL AND SUSTAINABILITY REPORT 2018

Q3 2018Vattenkraftens Miljöfond Sverige AB established – In September 2018 Vattenkraftens Miljöfond Sverige AB was established by eight hydro power companies with the purpose to provide SEK 10 billion in financing for environmental mitigation measures accord-ing to a national plan during the coming 20 years.
Inauguration of Aberdeen Bay offshore wind farm in Scotland – The wind farm has an installed capacity of 97 MW and can supply 80,000 British households with renewable energy. The wind tur-bines have the largest turbine capacity in commercial operation in the world (8.8 MW) and use a new type of jacket foundation, so-called suction buckets.
Long term agreement with Novo Nordisk and Novozymes on supply of renewable electricity – Vattenfall entered into a long-term agreement with the global healthcare company Novo Nor-disk and the biotechnology company Novozymes on the supply of renewable energy from the Kriegers Flak wind farm in Denmark. The agreement covers roughly a fifth of the wind farm’s total anticipated generation.
Gold rating for sustainability performance – Vattenfall once again received a Gold rating for its corporate social responsibility (CSR) performance from EcoVadis, an independent agency that provides CSR ratings and scorecards. A total of 73 points were achieved, which is well above the industry average of 42 points.
Halving of CO2 emissions in Berlin three years earlier than pledged – In Berlin, Vattenfall achieved the goal of halving its CO2 emissions from combined heat and power plants three years earlier than pledged. Work is now continuing to phase out hard coal by 2030.
Vattenfall enters French retail market – In October Vattenfall entered the French retail market, offering households climate-smart solutions including electricity and gas at competitive prices.
Power purchase agreement for renewable wind power and balancing services for Aquila Capital’s Kråktorpet wind farm in Sweden – German-based Aquila Capital and Vattenfall signed a 15-year agreement for the purchase of renewable electricity from the Kråktorpet wind farm (163 MW) west of Sundsvall, Sweden. Vattenfall will also provide balancing services, market access and management of green certificates (Guarantees of Origin).
Q4 2018
Nuon adopts the Vattenfall name – Vattenfall took a further step to strengthen its brand in Europe by changing the name of its Dutch subsidiary Nuon to Vattenfall. Nuon has been an integrated part of Vattenfall since 2009.
Generation record by Ringhals nuclear power plant – Ringhals nuclear power plant generated 30 TWh of fossil-free electricity in 2018, which is the highest level of annual electricity generation by a Nordic power plant ever and corresponds to 17% of Swedish electricity generation in 2018.
City of Hamburg to repurchase Vattenfall’s stake in district heating system – The City of Hamburg decided to exercise its call option to take over Vattenfall’s 74.9% stake in the city’s district heating system, effective 1 January 2019. The contracted price is EUR 625 million, and the transaction is expected to close in 2019.
Acquisition of Vargträsk wind power project in Sweden – Vattenfall acquired the Vargträsk wind power project in Åsele and Lycksele municipalities in Sweden. The wind farm will have an installed capacity of approximately 80 MW and the potential to generate renewable energy for around 50,000 homes. The plan is for the wind farm to be operational in 2021/2022.
Industry leader sustainability award to Vattenfall – Vattenfall was rated as the most sustainable energy company in the Sustainable Brand Index B2B, the Nordic region’s largest sustain-ability study. Vattenfall came in seventh place in the overall cross-sector ranking – a strong improvement from last year’s twentieth position.
New heating plant in Uppsala – Vattenfall decided to invest in a new heating plant in Uppsala, Sweden, to provide residents of the city with fossil-free heating. A total of SEK 3.5 billion will be invested in production facilities and grid infrastructure in Uppsala.
Final investment decision for Kriegers Flak offshore wind farm – Vattenfall took the final investment decision for the Kriegers Flak offshore wind farm in Denmark. The investment amounts to approximately SEK 10.4 billion, and the wind farm will have a total capacity of 605 MW.
Vattenfall and Norwegian Elkem sign long-term electricity supply deal – Vattenfall and the Norwegian industrial group Elkem signed a long-term electricity supply agreement for the period 2020–2026. The deal is the first major supply agreement with Elkem and includes supply of 260 GWh yearly or a total of approxi-mately 1.8 TWh.
–50%Halving of CO2 emissions in Berlin three years
earlier than pledged
Vattenfall decided to invest in a new heating plant in Uppsala and a total of SEK 3.5 billion will be invested in production facilities and grid infrastructure in Uppsala.
VATTENFALL ANNUAL AND SUSTAINABILITY REPORT 2018 9Important events

Targets and target
achievement
At Vattenfall we aspire to contribute to a sustainable energy system in all parts of the value chain. Our goal is to be a truly customer-centric
company as we change over to a long-term sustainable production portfolio. Vattenfall’s Board of Directors has set six strategic targets,
and Vattenfall’s owner has set three financial targets for the Group.
Strategic targetsVattenfall’s strategy is built upon four strategic objectives. Vattenfall will be 1) Leading towards Sustainable Consumption and 2) Leading towards Sustainable Production. To achieve this, we must have 3) High Performing Operations and 4) Empowered and Engaged People. Effective 1 January 2016 Vattenfall’s Board of Directors adopted the six strategic long-term targets for 2020 to better reflect our strategy.
Financial targetsThe financial targets pertain to profitability, capital structure and the dividend policy, and were set by Vattenfall’s owner at an extra-ordinary general meeting in December 2017. These targets are intended to ensure that Vattenfall creates value and generates a market rate of return, that the capital structure is efficient, and that financial risk is kept at a reasonable level.
10 Targets VATTENFALL ANNUAL AND SUSTAINABILITY REPORT 2018

Strategic objective Strategic targets for 2020 2018 2017 Comment
Leading towards Sustainable Consumption
Customer engagement, Net Promoter Score (NPS) relative1 (custo-mer satisfaction relative to competitors):
+2 +1 +2 Continued improvements at a slower pace. The Customers & Solutions operating segment achieved an NPS of +1 (+2) relative to competitors.
Leading towards Sustainable Production
Commissioned new renew ables capacity 2016–2020:
≥ 2,300 MW
752 MW2
652 MW
A total of 101 MW (354) of new renewable capacity was installed in 2018. The Aberdeen Bay offshore wind farm (97 MW) in Scotland was commissioned. In addition, 4 MW of solar power was installed.
Absolute CO2 emissions pro rata:
≤ 21 MT
22.0 MT
22.6 MT
Absolute CO2 emissions decreased in 2018 to 22.0 Mtonnes (22.6). The reduction is mainly explained by lower generation volumes.
High Performing Operations
Return On Capital Employed (ROCE)3: ≥ 8% 7.0%4 7.7%4 Return on capital employed was 7.0% (7.7%).
A lower underlying operating profit had a nega-tive impact on return on capital employed.
Empowered and Engaged People
Lost Time Injury Frequency5 (LTIF): ≤1.25 1.9 1.5 Lost Time Injury Frequency (LTIF) was 1.9 (1.5).
Two tragic fatalities took place in 2018, and a stronger focus on safety is required going forward.
Employee Engagement Index6:
≥70% 64% 64% The Employee Engagement Index was unchanged at 64% (64%).
Financial targets Targets over a business cycle7 2018 2017 Comment
Profitability Return On Capital Employed (ROCE)3: ≥ 8% 7.0%8 7.7%8 Return on capital employed was 7.0% (7.7%). A
lower underlying operating profit had a negative impact on return on capital employed.
Capital structure
Funds from opera-tions (FFO)/adjusted net debt:
22–27% 20.7% 21.4% FFO/adjusted net debt decreased compared to 2017 and amounted to 20.7% (21.4%). FFO decreased due to lower underlying EBITDA.
Dividend policy
Dividend, share of the year’s profit after tax:
40–70% 2 SEK billion9
2 SEK billion
The Board of Directors proposes a discretionary dividend of SEK 2 billion for 2018.
7 5–7 years.8 The key ratio is based on average capital employed.9 The proposed dividend will be voted on at the Annual General Meeting on 11 April 2019.
1 NPS is a tool for measuring customer loyalty and for gaining an understanding of customers’ perceptions of Vattenfall’s products and services. The target is a positive NPS in absolute terms +2 compared to Vattenfall’s peer competitors.
2 Pertains only to wind and solar farms completed and commissioned between 1 January 2016 and 31 Decem-ber 2018.
3 The target for Return On Capital Employed (ROCE) was changed from 9% to 8% by Vattenfall’s owner at an extraordinary general meeting in December 2017.
4 The key ratio is based on average capital employed. 5 Lost Time Injury Frequency (LTIF) is expressed in terms of the number of lost time work injuries
(per 1 million hours worked), i.e., work-related accidents resulting in absence longer than one day, and accidents resulting in fatality. The ratio pertains only to Vattenfall employees.
6 Documentation for measurement of target achievement is derived from the results of the My Opinion employee survey, which is conducted on an annual basis.
Strategic targets
Financial targets
Notes to strategic targets Notes to financial targets
VATTENFALL ANNUAL AND SUSTAINABILITY REPORT 2018 11Targets

Central to our strategy is the context in which we operate. Below we highlight six major trends that will shape the energy sector
going forward and that Vattenfall is basing its strategy on.
Customer centricity and sustainability are key to attracting customers, talent and investors Global attention on climate change driven by the IPCC report, the Paris Agreement and the UN’s Global Sustainable Development Goals (SDGs) means that sustainability is critical for attracting customers, talent and investors. Customers are increasingly considering climate impact, social and environmental impacts, and energy efficiency when choosing energy solutions and sup-pliers. They want to minimise their carbon footprint both directly, through their choices of transportation and energy supply, and indirectly, through the businesses they support and engage with.
Further electrification is a key enabler for reduced CO2 emissions Electrification represents an opportunity to reduce CO2 emissions in transportation, heating and industry. In the Nordic countries, elec-tricity generation is already almost fossil free, while on the Continent, fossil fuels need to be phased out from the electricity system in parallel with further electrification. The key driver for electrification is a combination of cost efficiency and sustainability. Electricity has an increasingly important role to play in society, while suppliers of renewable electricity and heat play a key role in the work on combat-ing climate change.
Market trends
12 Market trends VATTENFALL ANNUAL AND SUSTAINABILITY REPORT 2018

The future energy system will consist of both centralised and decentralised energy solutions We will need both centralised and decentralised energy solu-tions. Lower costs and improved functionality are driving a shift towards decentralisation, which is creating opportunities for new competitors and business models along various parts of the value chain. The importance of flexible technologies such as batteries is increasing, and market shares for conventional and centralised generation are decreasing. However, centralised production and distribution will remain a system anchor for utilities also in the years ahead.
The entire energy value chain is being digitalisedEnergy consumption is becoming increasingly smart, and new technologies are enabling loads to be steered to times when energy supply is high and price is low to relieve grid constraints. Efficient operation of energy utilities will require better data on the status and predictions of various loads and infrastructure, sophis-ticated forecasting techniques, and more powerful and complex algorithms for turning data into insights. Customers expect instant information, access and feedback, and customer service and interaction is moving from call centres to smartphone applica-tions and internet-based solutions. Digitalisation and control of data, combined with advanced data analytics, are driving these developments.
New competences, speed in learning and diverse and inclusive teams are critical in the energy transitionAs our industry transitions to new ways of interacting with cus-tomers, technology and society, new skill sets and competences are constantly required. Speed in learning and the ability to adapt to new ways of working are key competitive advantages that allow us to deliver new products and more efficient processes. To foster this learning environment and attract new talent, we are focusing on creating an inclusive company culture that is open to diverse viewpoints: we want to be the employer of choice. It is also key that we leverage external competence through partnerships and outsourcing of non-core processes.
Cost efficiency is a prerequisite for value creation and growth in an increasingly competitive marketGlobalised markets and lower perceived risk in renewable energy have resulted in an increasingly competitive environment, which is putting pressure on margins in our industry. This is tempering return expectations in both our core and new businesses. Value creation is increasingly derived from improved efficiency through-out the value chain. Efficient operations require high utilisation of people and assets, lean and digital processes and high cost awareness. Being able to deliver more in the same time and with the same resources is essential.
VATTENFALL ANNUAL AND SUSTAINABILITY REPORT 2018 13Market trends

Vattenfall is an integrated energy company with the customer at the centre. Sustainable growth is guiding us into the future. The following section
describes our business model and the value we generate for our stakeholders by applying the six capital inputs of the International Integrated Reporting
(IR) Framework. On pages 16 and 17 we describe our total impacts and our contributions to the UN’s Global Sustainable Development Goals.
Business model
Vattenfall’s business activities
Energy services and decentralised generationVattenfall offers energy services, including battery storage, network services, e-vehicle charging solu-tions, solar panels, heat pumps and smart meters. We also provide market services and access to marketplaces where customers can buy and sell electricity, as well as solutions for customers to opti-mise their energy use and gain access to convenient and smart energy solutions.
Power generation Vattenfall generates electricity from many types of energy sources, including hydro, nuclear, coal, natural gas, wind, solar, biomass, and waste. We are actively phasing out fossil fuels and investing in a greater share of renewable generation.
Sales of electricity, heat and gas Vattenfall sells electricity, heat and gas to consumers and business customers. We focus on optimising the customer experience by offering various price and service models and by giving customers opportunities to reduce their environmental impact.
Customers & Markets
District heating Vattenfall is one of Europe’s largest producers and distributors of district heating, supplying house-holds and industries in metropoli-tan areas. In partnership with cities and regions we are driving the shift to fossil-free heating solutions, such as by integrating surplus or waste heat from third parties in our district heating networks.
Electricity distribution Being able to guarantee secure supply requires well-functioning distribution networks and develop-ment of smart network solutions. Vattenfall enables customers to feed self-generated electricity into the grid, thereby becoming so-cal-led prosumers who both buy and sell electricity. Vattenfall conducts electricity grid operations in Swe-den and Germany. Electricity distri-bution is a regulated monopoly business that is supervised by national grid authorities.
14 Business model VATTENFALL ANNUAL AND SUSTAINABILITY REPORT 2018
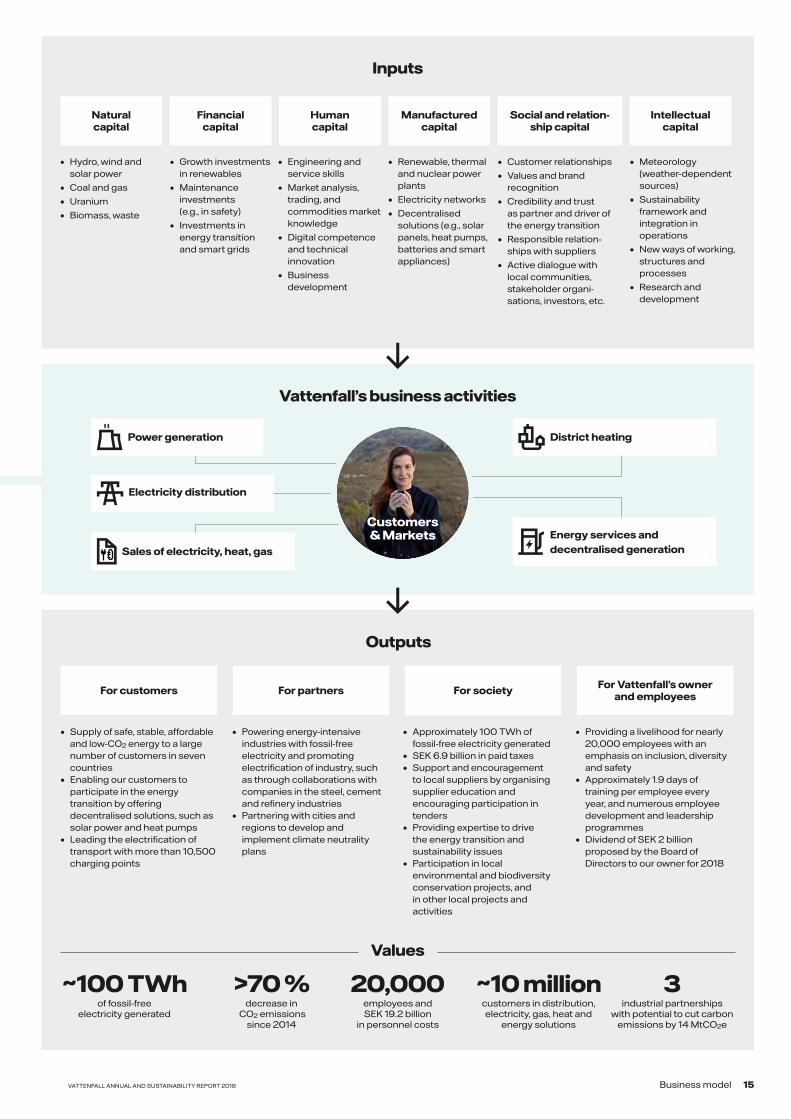
Outputs
Inputs
• Approximately 100 TWh of fossil-free electricity generated
• SEK 6.9 billion in paid taxes• Support and encouragement
to local suppliers by organising supplier education and encouraging participation in tenders
• Providing expertise to drive the energy transition and sustainability issues
• Participation in local environmental and biodiversity conservation projects, and in other local projects and activities
• Supply of safe, stable, affordable and low-CO2 energy to a large number of customers in seven countries
• Enabling our customers to participate in the energy transition by offering decentralised solutions, such as solar power and heat pumps
• Leading the electrification of transport with more than 10,500 charging points
• Powering energy-intensive industries with fossil-free electricity and promoting electrification of industry, such as through collaborations with companies in the steel, cement and refinery industries
• Partnering with cities and regions to develop and implement climate neutrality plans
• Providing a livelihood for nearly 20,000 employees with an emphasis on inclusion, diversity and safety
• Approximately 1.9 days of training per employee every year, and numerous employee development and leadership programmes
• Dividend of SEK 2 billion proposed by the Board of Directors to our owner for 2018
For societyFor customers For partners For Vattenfall’s owner and employees
• Hydro, wind and solar power
• Coal and gas
• Uranium
• Biomass, waste
Natural capital
• Growth investments in renewables
• Maintenance investments (e.g., in safety)
• Investments in energy transition and smart grids
Financial capital
• Engineering and service skills
• Market analysis, trading, and commodities market knowledge
• Digital competence and technical innovation
• Business development
Human capital
• Renewable, thermal and nuclear power plants
• Electricity networks
• Decentralised solutions (e.g., solar panels, heat pumps, batteries and smart appliances)
Manufactured capital
• Customer relationships
• Values and brand recognition
• Credibility and trust as partner and driver of the energy transition
• Responsible relation-ships with suppliers
• Active dialogue with local communities, stakeholder organi-sations, investors, etc.
Social and relation-ship capital
• Meteorology (weather-dependent sources)
• Sustainability framework and integration in operations
• New ways of working, structures and processes
• Research and development
Intellectual capital
Vattenfall’s business activities
Values
~100 TWhof fossil-free
electricity generated
>70 %decrease in
CO2 emissions since 2014
20,000employees and SEK 19.2 billion
in personnel costs
~10 millioncustomers in distribution, electricity, gas, heat and
energy solutions
3industrial partnerships
with potential to cut carbon emissions by 14 MtCO2e
Power generation District heating
Energy services and decentralised generation
Electricity distribution
Customers & Markets
Sales of electricity, heat, gas
VATTENFALL ANNUAL AND SUSTAINABILITY REPORT 2018 15Business model

Outcomes
Vattenfall’s total value creation
The calculation of total value creation is a tool for describing the full impact of Vattenfall’s operations, and for improving decision-making by raising awareness of the risks and opportunities related to impacts from a social and environmental perspective. It is not intended as a statement of reported financial development.
In 2017, we made a first attempt to quantify our full impacts on people and society – both positive and negative – from economic, social, and environmental perspectives. In 2018, we refined our methodology to also include other material, quantifiable aspects, namely “Training” and “Other emissions”. 2017 data has been updated accordingly to provide an accurate comparison. We intend to further develop our approach as it is increasingly integrated into the company’s decision-making processes and influences how we contribute towards various sustainability initiatives, such as the UN’s Global Sustainable Development Goals.
Updating 2017 for comparability, value creation increased from SEK 25.4 billion in 2017 to SEK 26.3 billion in 2018.
EconomicOur economic calculation follows standard accounting procedures and is based on net sales with remaining items deducted. Vattenfall’s net economic contribution recorded here is equal to the company’s profit. An increase in both electricity prices and sales was offset by higher fuel prices and the effects of our hedging. Lower corporate taxes also contributed to the increase in profit.
Economic value: SEK 12.0 billionChange from 2017: + SEK 2.4 billionProfit for the year
SocialWe strive to capture our impacts on people and society, although many social values we create – e.g., investments in community improvements – and the costs we incur – e.g., impacts on people’s health – can be difficult to quantify. We have included taxes and wages1 from the financial reporting as well as costs for accidents in the calculation and have quantified the cost of an employee or contractor involved in an accident2.
Investments in employee training are included to reflect the value of increased human capital.
The amount of value generated decreased in 2018. Personnel costs increased slightly, while taxes paid decreased. Unfortunately, LTI3 increased for the first time in years, and there were two fatalities among Vattenfall’s employ-ees. Exhaustive investigations are being conducted, the results of which will be used to refocus our work to ensure it does not happen again.
Social value: SEK 26.0 billion Change from 2017: – SEK 2.6 billion Taxes + wages – (Number of accidents (LTI) x cost per accident) – (Number of fatalities x cost of fatality) + training
EnvironmentalDirect (Scope 1) emissions continue to be our most material environmental aspect. We have calculated the negative costs related to our emissions based on the CO2 price in the EU and the ETS. The value given here is an additional negative value4. In 2018 we added the costs of
“Other emissions” – specifically NOx, SO2, and particulates – to the calculation5, and are developing a methodology to evaluate Scope 3 emissions as well. The quantifica-tion of certain benefits, such as renewable electricity generation or contributions to biodiversity and ecosystem research, remains under review, as do potential negative impacts including land use, ecosystem alterations, and others.
The amount of value generated in 2018 increased by SEK 1.1 billion, driven largely by the decrease in CO2 emissions. As Vattenfall decarbonises on its path to make fossil-free living possible within one generation, the costs associated with CO2 and other emissions will decrease in tandem. The effects of this will be gradual. Meanwhile, we are implementing best available technologies and ensuring that our power plants emit less than the legal limits for non-CO2 emissions.
Environmental value: – SEK 11.7 billion Change from 2017: + SEK 1.1 billionCost of purchased emission allowances – (Cost of CO2 x emissions) – (Cost of other emissions x emissions)
1 For more information on taxes and wages, see page 158 and Note 42 to the consolidated accounts, Number of employees and personnel costs, respectively.
2 SEK 1 million per accident and SEK 25.4 million per fatality (based on figures from the Swedish National Traffic Authority).
3 LTI: Lost Time Injury. See page 159 for more information.
4 Typical costs are estimated to be in the range of SEK 200–1,000/tonne. Ecofys, “Subsidies and costs of EU energy”, 2014. SEK 500/tonne is used as the baseline value.
5 European Energy Agency, “Revealing the cost of air pollution from industrial facilities in Europe”, 2011. Country-specific values were applied.
0
10,000
20,000
30,000
40,000
50,000
Net valueOtheremissions
Paid for CO2
allowancesCO2
emissionTrainingAccidents and
fatalitiesPersonnel
costTaxesProfit
for the year
SEK million
12,007
26,338
–11,000
–2,406
–18519,157 182
1,705
6,878
Value creation
Economic EnvironmentalSocial
16 Business model VATTENFALL ANNUAL AND SUSTAINABILITY REPORT 2018

The UN’s Global Sustainable Development Goals (SDGs)
Affordable and clean energy – We reduced our emissions intensity by 4%, from 157 to 150 grams CO2 per kWh, and installed an additional 101 MW of new renewable energy in 2018. We also continued to work with the Dutch government to expand an early signalling programme that gives at-risk customers access to government assistance to manage their finances and pay critical bills like rent, heat, and electricity. The programme benefits customers, the government, and Vattenfall.
Sustainable cities and communities – In 2018 we continued to expand our activities in new energy solutions, enabling individual companies, buildings and households to become more sustainable through the use of solar panels, heat pumps, batteries, and other decentralised solu-tions. Further, we greatly expanded our e-mobility activities, adding more than 2,000 new charging points across our core markets to enable electri-fied transport based on fossil-free electricity.
Partnership for the goals – We continue to seek ways to maximise our positive impact through collaboration. In 2018 a number of partnerships in which we are active pro-duced results, including establishment of the WindEurope Industry Principles. We also continued our partnerships to electrify industries, as we broke ground on the HYBRIT project2, which we are conducting together with LKAB and SSAB to develop a fossil-free steel manufacturing process. We also dedicated resources to scaling up and spreading industrial partnerships to other sectors.
Sustainable consumption and production – Responsibility starts at home, and in 2018 we took a number of steps to ensure we meet expectations. We revised our Sustainability Policy and our Code of Conduct and Integrity. We also pub-lished our new Human Rights Policy, which outlines our com-mitment to respect human rights and details how we iden-tify, assess, and manage human rights risks. We invested to minimise the impacts of our operations on biodiversity, for example in hydro and wind. We also increased operational efficiency, achieving 183 GWh of additional energy savings.
Industry, innovation and infrastructure – We under-took a massive electric grid modernisation programme for the Swedish island of Gotland, improving the capac-ity to integrate renewables and adapt to future energy system conditions. Unfortunately this modernisation caused a number of unplanned outages. We also began offering district heating and cooling in the UK, providing a less carbon intensive alternative to the standard natu-ral gas boilers. In addition, our work in partnerships on industrial decarbonisation has continued.
Climate action – Our commitment to enable a fossil-free life within one generation is the founda-tion of our climate action. We are also working closely with communities, customers, suppliers, and partners to support them in their climate work. We are on track or ahead of schedule to meet our climate commitments to our city part-ners in Berlin, Uppsala and Amsterdam.
Vattenfall’s activities contribute to the achievement of the UN’s Global Sustainable Development Goals (SDGs), which are a collec-tion of 17 global goals that were adopted in 2015 by more than 150 countries. Though adopted by governments, our strong belief is that businesses and industries play a decisive role in the extent to which these goals are achieved. In 2016 we identified six SDGs that are most relevant for Vattenfall and where we can have the greatest global impact, and these remain valid internally, as reflected in our strategy, as well as for our stakeholders, as confirmed by our 2018 materiality analysis. Our contribution to these six goals is described below. Vattenfall also contributes to many other SDGs, including those in support of human rights, at the local level and indirectly through our supply chain1.
1 See the website vattenfall.com/sustainability/un-sustainable-development-goals/2 See page 57 for more details.
VATTENFALL ANNUAL AND SUSTAINABILITY REPORT 2018 17Business model

StrategyVattenfall has formulated a strategy with the purpose to Power Climate Smarter
Living and enable fossil-free living within one generation. This commitment to our customers, stakeholders and employees provides clear direction, engagement and focus
as well as significant business opportunities.
18 Strategic direction VATTENFALL ANNUAL AND SUSTAINABILITY REPORT 2018

Fossil-free living within one generation – a powerful message and clear directionVattenfall has been electrifying industries, powering homes and transforming lives through innovation and collaboration for over a hundred years, and we are now focused on the challenge of transitioning to fully fossil-free energy supply.
Vattenfall engages with customers, business leaders, govern-ments and non-governmental organisations to define and visualise the road ahead – through R&D partnerships, policy discussions and innovative business endeavors. This brings a holistic under-standing of customer needs, energy markets, the value chain and our social impact. Together with our partners we are taking respon-sibility for finding new, sustainable and innovative ways to power the lives of our customers and electrify the transportation sector, heating and cooling, core industrial manufacturing processes and other areas beyond our industry, to ultimately reduce or eliminate the use of fossil fuels in society.
We believe that electrification is a key enabler for reducing CO2 emissions from heating and cooling, transportation, and the manufacturing industry, in turn leading to increased electricity demand. In combination with the phase-out of fossil-based elec-tricity generation in our markets, this points to a strong, long-term market for fossil-free electricity generation. Therefore, a growing, sustainable and cost effective generation portfolio is strategi-cally attractive. The build-out of our renewables portfolio and the CO2 roadmap for phasing out coal in our heat operations are key components of the strategy. In addition, hydro and nuclear power generation play a key role in supporting the energy transition, stabilising the grid and supplying electricity based on fossil-free power generation. Electricity grids support the electrification of new sectors while ensuring reliable supply to our customers.
New business opportunitiesWe also see significant new business opportunities in decentral-ised, integrated and customised energy and network solutions. This is our response to customers wanting sustainable, affordable and convenient energy solutions, combined with significantly lower costs for solar panels and batteries and a growing need for reliable power.
New businesses mean new ways of interacting with custom-ers, technology and society. Additional skills and competences are therefore required. In a highly dynamic environment we foster an inclusive company culture that encourages individual and organisational learning and that is open to diverse viewpoints and
promotes active collaboration. We are also focusing on recruiting and retaining critical talent in a number of areas.
Cost and capital efficiency are prerequisites for success in an increasingly competitive environment. To increase efficiency Vattenfall is conducting a programme to cut costs of SEK 2 billion in staff and support functions by 2020. This is being implemented according to plan, and at year-end we had reduced the workforce by 400 full-time positions. Our existing businesses serve as our financial anchor for the period ahead while we invest in new opportunities.
Vattenfall’s strategy drives our contribution to the UN’s Global Sustainable Development Goals
Our strategy and our purpose reflect the UN’s Agenda 2030, in particular the Sustainable Development Goals for Affordable and clean energy (#7), Industry, innovation and infrastructure (#9), Sustainable cities and communities (#11), Responsible consumption and production (#12), Climate action (#13), and Partnerships for the goals (#17).
VATTENFALL ANNUAL AND SUSTAINABILITY REPORT 2018 19Strategic direction

Vattenfall is committed to continually accelerat-ing and powering the transition to further elec-trification and renewable energy. Our promise to our customers is that we will provide sustainable and fit-for-purpose energy solutions and that we will take the first step ourselves towards a fossil-free future.
These milestones are intended to show our contribution and commitment to a fossil-free future, and as our journey unfolds, more proof points will be added along the way.
Our milestones towards fossil-free living within one generation
We are developing our existing business while building the new
Vattenfall’s strategy builds on the goals set in our purpose, on future trends and on the competitive landscape in which we operate, combined with the requirements that are put on our business. Our updated materiality analysis confirms that our strategy is aligned with our stakeholders’ expectations1. Vattenfall’s strategy can be summarised in four strategic objectives:
Power Climate
Smarter Living
Su
stai
nabl
e Consumption
Lead
ing to
wards Sustainable Production
Leading toward
s
High Perform
ing
Operatio
ns
Empow
ered and
Engaged People
Empowered and engaged people by being an attractiveemployer, developing an engaging and inclusive company culture and securing necessary competence through recruitment and continuous learning.
Leading towards sustainable consumption by increasingcustomer centricity, building a sizeable position in decentralised energy and promoting electrification and a climate-smart society.
High performing operations by improving operational efficiency, accelerating digitalisation and taking social and environmental responsibility throughout the value chain.
Leading towards sustainable production by growing in renewables and implementing our CO2 roadmap to make fossil-free living possible within one generation.
2020Fossil-free energy solutions available for all our customers.
2023More renewable genera-tion enabled by 600 MW of additional flexible hydro capacity.
1 Read more on page 153.
Additional information about the strategy for each operating segment is presented on pages 32–51.
20 Strategic direction VATTENFALL ANNUAL AND SUSTAINABILITY REPORT 2018

Innovating for the future
Digitalisation has become one of the most important elements in any busi-ness strategy. Vattenfall has made great strides in recent years to stay ahead of the curve in being digitally well-equipped for the future. Extensive work has been carried out to explore new digital busi-ness opportunities in our rapidly chang-ing energy landscape. We are advancing
in many areas that can be grouped into ten trends that are currently shaping our business: Digital platforms, the Internet of Things (IoT), Big Data & Advanced Analytics, Artificial Intelligence (AI) & Deep Learning, Robotic Process Auto-mation (RPA), Virtual & Augmented Reality, Cloud Computing, Blockchain, Drones, and Digital Trust. One example
of our work with digitalisation is so-called battery peak shaving, where a control mechanism is used to steer the optimal use of battery power to minimise unex-pected peak load. Another example is a customer engagement platform that enables our customers to combine their own apps with our services.
2030Coal is phased out from all our heat production.
Fossil-free Nordic electric-ity generation.
2035More milestones under development…
2025Entirely coal-free operations in the Netherlands1.
We generate fossil-free energy to power more than 30 million homes.
We pilot 100 MW of green hydrogen gas pro-duction from fossil-free electricity.
1 According to a decision from the Dutch Government in March 2019, Vattenfall’s coal-fired power plant Hemweg 8 should stop using coal as fuel by the end of 2019, which means that the operations in the Netherlands would be coal-free at the same time.
VATTENFALL ANNUAL AND SUSTAINABILITY REPORT 2018 21Strategic direction

Total planned investments in 2019 and 2020 are expected to amount to SEK 56 billion, with growth investments account-ing for nearly 58% (SEK 32 billion). The investment strategy reflects our commit-ment to drive the transition to a fossil-free society.
Around SEK 24 billion of investments are planned for new wind farms, of which nearly SEK 18 billion is dedicated to off-shore wind, mainly the Danish projects Kriegers Flak (605 MW), Vesterhav Syd and Vesterhav Nord (350 MW), and Horns Rev 3 (407 MW). The biggest onshore projects are Wieringermeer (180 MW) and Wieringermeer Extension (118 MW) in the Netherlands, Nørrekær Enge 2 (119 MW) and Nørre Økse Sø (54 MW) in Denmark, and South Kyle (212 MW) in the UK.
Vattenfall is also investing more than SEK 1 billion in solar and battery projects, including a large-scale solar plant in Har-ingvliet with 39 MW capacity. In addition, nearly SEK 2 billion will be invested in new energy solutions, mainly distribution network solutions and decentralised heat solutions, but also in a large power-to-heat storage plant in Germany (120 MWth) and
in e-mobility. Growth investments in elec-tricity and heat grids, mainly to connect new customers and areas, amount to over SEK 5 billion.
Vattenfall is also investing heavily in main-tenance and replacement of the existing assets, with planned investments of close to SEK 24 billion in 2019 and 2020. We are modernising the heat portfolio in line with our strategy to enable fossil-free living within one generation. This entails building a new waste wood-fired steam heat-only boiler in Uppsala (112 MWth) and investing in two highly efficient gas-fired CHP plants in Berlin (in total 560 MWel, 452 MWth).
We continue to invest in the infrastructure of the new energy landscape by improving the quality and flexibility of our electricity net-works in Sweden and Berlin (SEK 10 billion, included in maintenance and replacement investments). Further, we are securing the safe operation of our Swedish nuclear and hydro power plants (SEK 5 billion, included in maintenance and replacement investments) by completing nuclear safety measures at Ringhals and Forsmark and upgrading our hydro power plants to maintain availability and dam safety.
Investment plan
Vattenfall’s investment plan 2019–2020
Vattenfall continues to invest heavily in growth with a clear focus on renewable production, enabled by our successful efforts to reduce costs and achieve a stable capital structure.
Growth investments per country
Denmark, 17
Netherlands, 8
Germany, 3
Sweden, 2
UK, 2
32SEK billion
Growth investments per technology
Wind power, 24
Heat grids, 3
Distribution, 2
Solar & batteries, 1
New businesses, 22
32SEK billion
Total investments per type
Growth investments, 32
Maintenance investments, 13
Replacement investments, 11
56SEK billion1
Vattenfall is building a new waste wood-fired steam heat-only boilder in Uppsala.
1 Of which, SEK 0.5 billion pertains to investments during 2019 in the divested district heating business in Hamburg.2 Mainly decentralised solutions, energy storage and e-mobility.
22 Strategic direction VATTENFALL ANNUAL AND SUSTAINABILITY REPORT 2018

Major investment projects – decided on and in progress
Project Country Type Capacity
Estimated CO2
reduction1
(ktonnes)Vattenfall’s
interest CompletionTotal
investment
Total invest-ment, SEK
million2
Slufterdam Netherlands Wind, onshore 29 MW 35 100% 2019 35 MEUR 360
Wieringermeer Netherlands Wind, onshore 180 MW 300 100% 2020 215 MEUR 2,200
Wieringermeer Extension Netherlands Wind, onshore 118 MW 200 100% 2021 147 MEUR 1,500
Horns Rev 3 Denmark Wind, offshore 407 MW 450 100% 2019 7,500 MDKK 10,300
Kriegers Flak Denmark Wind, offshore 605 MW 670 100% 2022 7,600 MDKK 10,400
Vesterhav Syd and Nord Denmark Wind, offshore 350 MW 390 100% 2020 5,200 MDKK 7,100
Lichterfelde CHP Germany Gas 300 MWel 170 100% 2019 390 MEUR 4,000
222 MWth
Marzahn CHP Germany Gas 260 MWel 350 100% 2020 305 MEUR 3,100
230 MWth
Replacement Reuter C Germany Gas/Electricity 240 MWth 170 100% 2019 95 MEUR 970
Uppsala Carpe Futurum Sweden Biofuel 112 MWth n.a. 100% 2022 1,686 MSEK 1,6861 Estimated CO2 reductions are based on expected annual CO2 reductions from the respective projects in Vattenfall’s portfolio or potential reductions outside of Vattenfall. For wind projects the reductions are based
on a comparison of expected generation and average CO2 emissions from the grid, thus representing expected CO2 reductions in the grid. For heat projects the reductions are expressed as the expected CO2 reduction in Vattenfall’s portfolio.
2 Year-end exchange rate as per 31 December 2018.
Vattenfall is planning to invest around SEK 24 billion in both onshore and offshore wind power in 2019 and 2020.
VATTENFALL ANNUAL AND SUSTAINABILITY REPORT 2018 23Strategic direction

Markets and regulations
24 Markets and regulations VATTENFALL ANNUAL AND SUSTAINABILITY REPORT 2018

European UnionFinalisation of the Clean Energy Package dominated discussions also in 2018. The final outcomes of the 2030 target review are 32% renewable energy share and 32.5% improved energy efficiency. Follow-ing final adoption at EU level, the legislative files of the package will now be transposed into national legislation in the EU Member States. In addition, the Clean Mobility Pack-age has widened decarbonisation goals to the transport sector. The EU institutions are scheduled to adopt all legislative files by spring 2019 at the latest.
EU ETS directive – On 8 April 2018 the revised EU ETS directive for Phase 4 (2021–2030) entered into force. In particular, it pro-vides for a steeper annual decline of the ETS allowance cap from 2021, a faster removal of surplus ETS allowances into the Market
Stability Reserve (MSR) from 2019, and a permanent cancellation of a large amount of ETS allowances by 2024. The reforms are far-reaching and have caused the European CO2 price to increase by more than 200% since the agreement was reached, even though Phase 4 has not yet begun.
EU long-term climate strategy – In Novem-ber 2018 the European Commission pre-sented a new non-legislative initiative on an EU 2050 climate and energy strategy, updat-ing the 2011 roadmap and offering a view of how to reach a carbon-neutral EU economy by 2050. Alignment with the 2015 Paris Agreement is one of several new precondi-tions for the EU as well as for many countries in other parts of the world. According to the Paris Agreement the EU is expected to com-municate a new international climate pledge
(NDC) and a mid-century low-CO2 develop-ment strategy to the UNFCCC during the course of 2020.
European gas package – In 2017 the European Commission announced the introduction of a so-called gas package, reviewing the existing gas policy in the light of the Clean Energy Package. Apart from gas-related topics such as retail issues and tariff regulation, the gas pack-age will include legislative proposals on the role of gas in the European energy transition as well as on hydrogen and sec-tor coupling. Due to the appointment of the next European Commission in November 2019, a legislative proposal is expected at the end of 2019 at the earliest.
DenmarkNew energy policy 2020–30 – In 2018 all parties in the Danish Parliament agreed on a new energy policy towards 2030 which is to ensure that 55% of total energy con-sumption comes from renewable energy by 2030. The agreement further outlines three offshore wind farms with combined minimum capacity of 2.4 GW, and yearly technology-neutral tenders for solar and wind until 2024. In addition, the tax on electricity will be reduced to promote electrification especially in the heating sector.
Focus on fossil-free transportation in the government’s Climate and Clean Air Plan – In 2018 the Danish government announced a new Climate and Clean Air Plan that outlines how Denmark will reach its EU 2030 39% CO2 reduction target in transportation, agriculture and heating. Focus is on transportation, and the Parlia-ment subsequently approved a delay in the previously announced phasing in of a registration tax for e-vehicles on 1 January 2019. This means that electric vehicles with a value of up to EUR 53,000 will be
exempted from the newly phased-in regis-tration tax in 2019 and 2020.
Probing for new offshore wind sites – The Danish Energy Agency is probing potential areas in the North Sea and the Baltic Sea, close to the Kriegers Flak offshore wind farm for a suitable site to develop an 800 MW wind farm. The probing is expected to be completed in early 2019, and the tender process is expected to start later the same year.
SwedenFocus on climate and energy transi-tion – Following the general elections to the Swedish Parliament in September 2018, a new government took office in January 2019. The government is a coali-tion between the Social Democrats and the Green Party supported by the Center Party and the Liberals. As one of its priori-ties the new government stated that the energy policy agreement from 2016 will be implemented. Moreover, the government announced that the climate policy frame-work, adopted by the Parliament in 2017, will remain.
Hydro power regulatory framework to improve environmental performance – New legislation to upgrade hydro power plants to modern environmental standards according to the EU Water Framework Directive entered into force on 1 January 2019. A national assessment mitigation plan for hydro power aims to ensure
a proper balance between environmental and energy interests, recognising the importance of hydro power as a renewable energy source and its ability to regulate the entire electricity system. Together with seven hydro power operators, Vattenfall has established the Hydro Power Environ-mental Fund to help implement the plan.
New revenue framework regulation affects Distribution System Operators – As a consequence of the government’s decision in 2018 on a new revenue frame-work regulation for Distribution System Operators (DSOs) for the period starting in 2020, Vattenfall Distribution’s revenue framework will be substantially reduced. This will unfortunately impact Vattenfall’s investment programme at a time when major networks upgrades and build-outs are needed to cope with growth of urban areas, a growing energy-intensive industry and more renewables.
Nuclear fuel waste management – The Swedish Radiation Safety Authority (SSM) recommends that the government grant a licence for a final repository for spent nuclear fuel at the Forsmark nuclear power plant. In January 2018 the Land and Envi-ronment Court submitted its opinion to the government. The court was positive in several important respects, for example, it approved issues relating to the Forsmark site, the bedrock, the buffer, the environ-mental impact statement and the facili-ties in Oskarshamn, but it calls for more documentation by the Swedish Nuclear Fuel and Waste Management Company (SKB) on the copper canisters, which serve as one of the protective barriers for the method of final storage. SKB expects to provide the required information to the government in April 2019.
VATTENFALL ANNUAL AND SUSTAINABILITY REPORT 2018 25Markets and regulations
UK Decarbonisation – The UK continues to decarbonise its economy, although not fast enough to meet statutory targets. Progress in the power sector is masked by a failure to significantly reduce emissions in other sectors including transport and buildings. New schemes have been intro-duced to boost progress, including more funding to roll-out electric vehicles and heat networks, as well as an extension of the UK’s Contracts for Difference scheme to support 1–2 GW of additional offshore wind capacity every year in the 2020s.
Brexit – Preparations continued for the UK to exit the EU including the passing of withdrawal legislation. A Transition Agree-ment was reached between the European Council and the UK in November, but was subsequently rejected by the UK Parlia-ment. Prime Minister Theresa May has struggled to achieve a consensus on how to proceed, with the treatment of Northern Ireland a key sticking point. Parliament is split between those that want a “hard”, “soft” or “No” Brexit, and there has been little clarity on when or how the UK will leave the EU. After Brexit, the UK and EU
will start to negotiate their future trading arrangement.
Energy retail market – Following the intro-duction of a retail price cap for domestic prepayment customers in 2017, the regula-tor Ofgem extended the cap to around 1 million additional vulnerable customers in February 2018 and introduced a new cap on all standard variable tariffs (SVT) on 1 January 2019, which covers around 11 million households. The methodology used to set the SVT cap is subject to a legal challenge.
GermanyNew German government – The coalition agreement between the Conservatives (CDU/CSU) and Social Democrats (SPD) provides a stable framework for Vattenfall’s business investments with a predictable legislative framework. A binding climate protection law to ensure the 2030 sectoral climate targets is also planned. Germany’s renewable target is set to be raised from an average 50% to 65% electricity share from renewable sources in 2030. The government will continue to implement the energy transition for reducing green-house gases and take decisions regarding a coal phase-out. Decarbonisation of the transport sector is progressing very slowly, but e-mobility will continue to be a political focus area. The increased renewable share
will be discussed in the context of impacts on grid extension and optimisation require-ments.
Coal phase-out – A special commission with a broad variety of stakeholders was established to devise a plan for the gradual reduction and an end date for coal-fired power generation. The commission pre-sented its findings in early 2019, including its recommendation for 2038 as the final year of decommission and necessary financial support in the regions affected by the coal phase-out. The CHP Act support-ing a fuel switch to gas is preferred, as it will cost society less than compensating coal operators with tax money.
Nuclear compensation – The nuclear phase-out legislation is unfavourable for Vattenfall as owner of the Brunsbüttel and Krümmel nuclear power plants. In 2018 the regulation allowed applications for certain financial compensation after 2022. Vattenfall considers the new legislation to be inadequate to remedy violations of the German Constitution and is considering further legal action. In a separate process, Vattenfall has sought compensation via the International Centre for Settlement of Investment Disputes (ICSID). No deci-sion has yet been made on Vattenfall’s case. In August 2018 the Court rejected Germany’s objection that the ICSID lacks jurisdiction for this internal EU dispute.
NetherlandsConcept Climate Agreement following a year of negotiations – The Dutch cabinet requested societal parties to come up with a climate agreement that contains meas-ures that will jointly result in a CO2 reduc-tion of 49% by 2030. The agreement can be seen as a follow-up to the Energy Agreement of 2013 that runs until 2020. More than 100 parties from the private sector have joined the Climate Agreement negotiations along with civil society organi-sations and local authorities. The negotia-tions have taken place at five different sector tables, representing the various key segments in the energy landscape: elec-tricity, built environment, industry, mobility and agriculture. The agreement creates opportunities for investments in renewa-bles, sustainable heating, e-mobility and services. It should lead to more than 70% renewable power generation, 2 million electric cars and 1.5 million houses free of natural gas. The measures proposed
by each sector table will be quantitatively assessed, and negotiations will continue in 2019. When adopted, the proposed meas-ures of the Climate Agreement will be put into practice by the government through the introduction of new policy instruments, rules and regulations.
Ban on coal for electricity generation and Urgenda ruling – In May 2018 the Minister of Economic Affairs and Climate Policy announced that the Netherlands is moving to ban all coal in electricity generation. The direct ban on coal will be introduced by law and will come into force immediately. How-ever, a transition period has been provided for in the draft act: the newest coal-fired power plants will be closed by 1 January 2030 at the latest. The two oldest plants, including Vattenfall’s Hemweg 8 plant in Amsterdam, would need to close by year-end 2024. This decision was later changed in March 2019 when the Dutch Govern-
ment announced that Hemweg 8 should stop using coal as fuel by end of 2019.
In October 2018 the Court of Appeal in the Hague upheld an earlier ruling order-ing the Dutch government to reduce the country’s CO2 emissions by 25% by 2020 compared with 1990, the so-called Urgenda ruling. The Dutch government has announced that it will come up with addi-tional measures to comply with this ruling.
Continuation of tender system for the Hollandse Kust Zuid 3 & 4 offshore wind farms – Vattenfall won the Hollandse Kust Zuid 1 & 2 tender with a zero-subsidy bid. In late 2018 the government opened the tender process for Hollandse Kust Zuid 3 & 4, and the process is again based on qualitative criteria. Subsequent tenders are to be based on auctioning after the new Offshore Wind Act has entered into force.
26 Markets and regulations VATTENFALL ANNUAL AND SUSTAINABILITY REPORT 2018
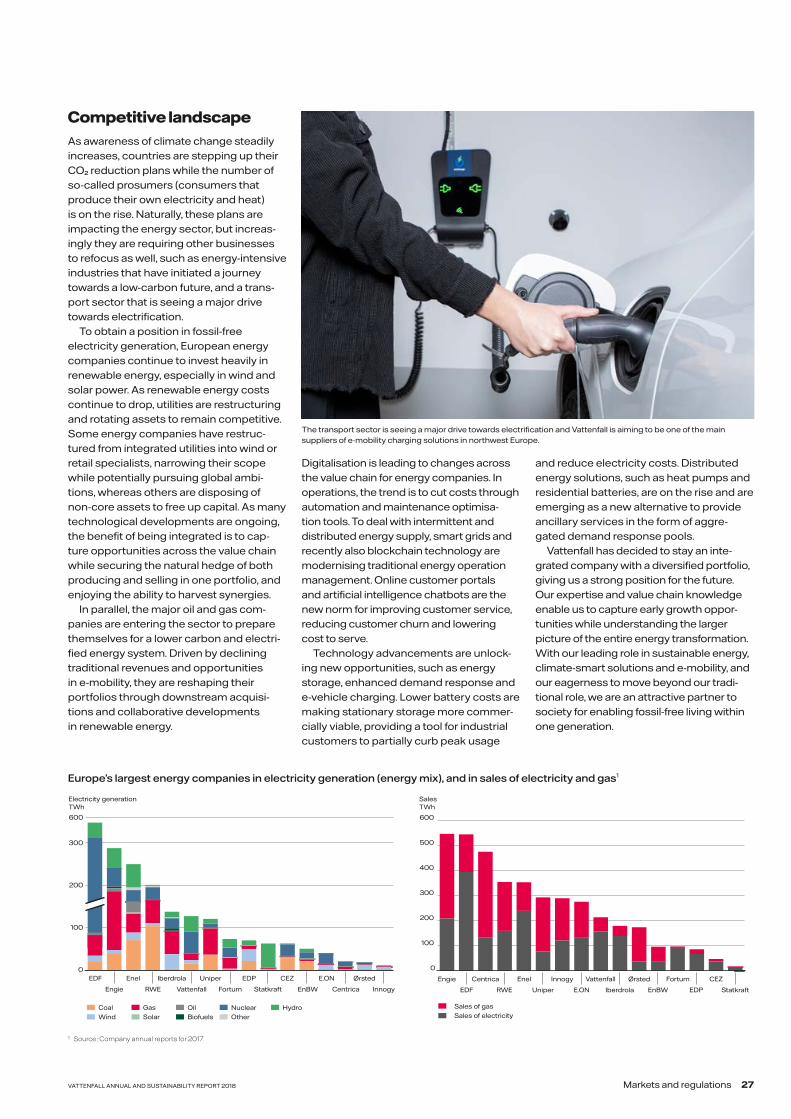
Competitive landscapeAs awareness of climate change steadily increases, countries are stepping up their CO2 reduction plans while the number of so-called prosumers (consumers that produce their own electricity and heat) is on the rise. Naturally, these plans are impacting the energy sector, but increas-ingly they are requiring other businesses to refocus as well, such as energy-intensive industries that have initiated a journey towards a low-carbon future, and a trans-port sector that is seeing a major drive towards electrification.
To obtain a position in fossil-free electricity generation, European energy companies continue to invest heavily in renewable energy, especially in wind and solar power. As renewable energy costs continue to drop, utilities are restructuring and rotating assets to remain competitive. Some energy companies have restruc-tured from integrated utilities into wind or retail specialists, narrowing their scope while potentially pursuing global ambi-tions, whereas others are disposing of non-core assets to free up capital. As many technological developments are ongoing, the benefit of being integrated is to cap-ture opportunities across the value chain while securing the natural hedge of both producing and selling in one portfolio, and enjoying the ability to harvest synergies.
In parallel, the major oil and gas com-panies are entering the sector to prepare themselves for a lower carbon and electri-fied energy system. Driven by declining traditional revenues and opportunities in e-mobility, they are reshaping their port folios through downstream acquisi-tions and collaborative developments in renewable energy.
Digitalisation is leading to changes across the value chain for energy companies. In operations, the trend is to cut costs through automation and maintenance optimisa-tion tools. To deal with intermittent and distributed energy supply, smart grids and recently also blockchain technology are modernising traditional energy operation management. Online customer portals and artificial intelligence chatbots are the new norm for improving customer service, reducing customer churn and lowering cost to serve.
Technology advancements are unlock-ing new opportunities, such as energy storage, enhanced demand response and e-vehicle charging. Lower battery costs are making stationary storage more commer-cially viable, providing a tool for industrial customers to partially curb peak usage
and reduce electricity costs. Distributed energy solutions, such as heat pumps and residential batteries, are on the rise and are emerging as a new alternative to provide ancillary services in the form of aggre-gated demand response pools.
Vattenfall has decided to stay an inte-grated company with a diversified portfolio, giving us a strong position for the future. Our expertise and value chain knowledge enable us to capture early growth oppor-tunities while understanding the larger picture of the entire energy transformation. With our leading role in sustainable energy, climate-smart solutions and e-mobility, and our eagerness to move beyond our tradi-tional role, we are an attractive partner to society for enabling fossil-free living within one generation.
Europe’s largest energy companies in electricity generation (energy mix), and in sales of electricity and gas1
1 Source: Company annual reports for 2017.
600
Electricity generationTWh
CoalWind
GasSolar
OilBiofuels
NuclearOther
Hydro
0
100
200
300
Fortum Statkraft InnogyCentrica
EDP CEZ
EnBW
Iberdrola
VattenfallRWE
E.ONEnel
Engie
EDF Uniper Ørsted
0
100
200
300
400
500
600
SalesTWh
Sales of gasSales of electricity
E.ON
CEZ
Iberdrola
Ørsted
Uniper
Fortum
EDF EDP
Vattenfall
EnBW
Enel
RWE
CentricaEngie Innogy
Statkraft
The transport sector is seeing a major drive towards electrification and Vattenfall is aiming to be one of the main suppliers of e-mobility charging solutions in northwest Europe.
VATTENFALL ANNUAL AND SUSTAINABILITY REPORT 2018 27Markets and regulations

Topical issue
Preparations for the upcoming decommis-sioning of Vattenfall’s nuclear power plants in Germany and Sweden are proceeding as planned. The time for a decision on the issue of the final repository for spent nuclear fuel in Sweden is also nearing as the Swedish Nuclear Fuel and Waste Management Com-pany (SKB) is expected to submit additional information to the Government in April 2019.
There are two key elements of end-of-life planning for nuclear power plants: decommis-sioning and waste disposal. When operating nuclear reactors, by-products in the form of spent nuclear fuel and radioactive waste are produced. Due to the hazardous nature of this waste, both decommissioning and disposal are thoroughly regulated and must be done in a safe, long-term manner, with the safety of people and the environment being prioritised above all else.
SwedenExtensive analysis and planning work is under way ahead of the upcoming decommissioning and dismantling of Vattenfall’s Ringhals 1 and 2 reactors, where electricity generation will cease at the end of 2020 and 2019, respectively. Ringhals 3 and 4 as well as Forsmark 1, 2 and 3 are being upgraded to ensure safe, long-term operation, which places high demands on the planning of on-site operations going forward. These reactors will continue to provide a vital share of Sweden’s fossil-free electricity genera-tion for decades to come. High levels of safety and stable generation are a priority.
Vattenfall formed a special business unit for nuclear decommissioning in 2015, responsi-ble for decommissioning the nuclear plants that Vattenfall will shut down. The unit brings together leading experts tasked with manag-ing and leading safe, efficient, and responsible decommissioning.
Any organisation in Sweden with a permit to own or run a nuclear installation is obligated to
finance the costs for dismantling and manage-ment of spent nuclear fuel. The financing is handled by payment of fees for each generated kWh to the Swedish Nuclear Waste Fund, which manages paid-in funds. For Vattenfall, the average fee was 5.0 öre/kWh in 2018, with 3.3 öre/kWh for Forsmark and 5.2 öre/kWh for Ringhals, as decided by the government. More than 95% of the funding will thus be covered by the Swedish Nuclear Waste Fund, leaving only post-operational costs to be covered by Vattenfall. The fair value of the Vattenfall Group’s share in the Swedish Nuclear Waste Fund was SEK 42 billion as of 31 December 2018. Owners of nuclear reactors are also required to provide financial guarantees for costs that are not covered by already paid-in capital, see Note 29 to the Parent Company accounts, Contingent liabilities, for further details.
SKB is owned by the nuclear power com-panies and is responsible for the long-term, safe handling of radioactive waste. It is an international role model thanks to the research
Nuclear decomissioning
in Sweden and Germany
28 Markets and regulations VATTENFALL ANNUAL AND SUSTAINABILITY REPORT 2018

and development work it is conducting to establish a storage site and safe handling method for radioactive waste, having in recent years developed a world-leading method and conducted thorough site investigations to con-struct a final repository that meets extremely high demands for at least 100,000 years. The method, called KBS-3, is based on three fundamental barriers which isolate the spent nuclear fuel and protect the surroundings. The technology has been developed and refined in a full-scale bedrock laboratory in Äspö, north of Oskarshamn in Sweden.
The Swedish Nuclear Waste Fund reimburses the owners of the reactors for payments to SKB as their obligations pursuant to Swedish law have been met. The Swedish National Debt Office decides on any payments from the Swed-ish Nuclear Waste Fund and proposes future fee levels to be decided by the government.
GermanyFollowing the nuclear accident in the Japanese town of Fukushima in 2011, Germany’s govern-ment decided to shut down all of Germany’s 17 nuclear power plants by 2022. Eight of these were ordered to be shut down by 2011, including Vattenfall’s two plants in Krümmel and Bruns-büttel, while the remaining nine are scheduled to be shut down at different dates up to 2022. Vattenfall is responsible for the decommission-ing and dismantling of Krümmel and Brunsbüt-tel, and provisions for future costs amounted to SEK 17.8 billion as of 31 December 2018.
Vattenfall’s shutdowns in Germany have passed important milestones, as Brunsbüttel obtained the necessary decommissioning and dismantling licence, and all fuel from Brunsbüt-tel, as well as all but a few fuel pins and a dozen unused fuel elements from Krümmel, have been removed and put into interim storage. The next step will be the dismantling of the Brunsbüttel reactor internals, which is planned to start in 2019 subsequent to obtaining the
required demolition permit. Decommission-ing of Krümmel is planned to start in 2020 after defuelling has been completed and the decommissioning and dismantling licence has been granted.
The German state took over the responsibil-ity for interim and final storage of low- and intermediate-level spent nuclear fuel (and other radioactive waste) in 2017, funded by the contributions that the country’s nuclear power plant operators paid to a state-controlled fund. Vattenfall’s contribution amounted to SEK 17.3 billion (EUR 1.8 billion).
The German Federal Council must agree on a suitable location for the permanent storage of spent nuclear fuel by 2031, and a final repository is scheduled to be completed by 2050. A final repository site for low- and intermediate-level waste has been decided on, and the facility is currently under construction. Until these are ready, spent nuclear fuel and radioactive waste must be stored in interim storage close to the nuclear power plants.
Financial implications EBIT
Funds from operations (FFO)
Adjusted net debt (AND)
Valuation of nuclear provisions
Provision value depreciated over operating life-time of nuclear power plant
N/A Included in AND
Payments to the Swedish Nuclear Waste Fund
No impact Negative impact through pay-ment to the Swedish Nuclear Waste Fund
Increase fund balance (offset AND)
Decommission-ing activities
No impact FFO neutral AND neutral
Financial implications EBIT
Funds from operations (FFO)
Adjusted net debt (AND)
Valuation of nuclear provisions
Non-operating plants – change in provision valuation directly impacts EBIT
N/A Included in AND
Decommission-ing activities
N/A Negative impact AND neutral
Financial implications of the various steps in the financing systems in Sweden and Germany
The financing system for post-operational nuclear costs
Nuclear power operators
Swedish Nuclear Waste Fund
German state
Payments based on generated kWh
Swedish National Debt Office decides on disbursements
from the fund
Nuclear power operators
Decommissioning and dismantling
TransportIntermediate storage
Final repository
The fair value of the Vattenfall Group’s share in the Swedish Nuclear
Waste Fund was SEK 42 billion as of 31 December 2018
Sweden
Germany
Final repositoryDecommissioning and dismantling2
Encapsulation Intermediate storage (Clab)
Other
Swedish Nuclear Fuel and Waste Management Company (SKB)
39 % 28 % 13 % 11 % 9 %
106SEK billion1
Remaining post-operational costs for the entire Swedish nuclear fleet
1 Remaining costs based on the latest calculation (Plan 2016).2 Decommissioning and dismantling are the responsibility of the nuclear power operators and are not included in SKB’s operations.
VATTENFALL ANNUAL AND SUSTAINABILITY REPORT 2018 29Markets and regulations
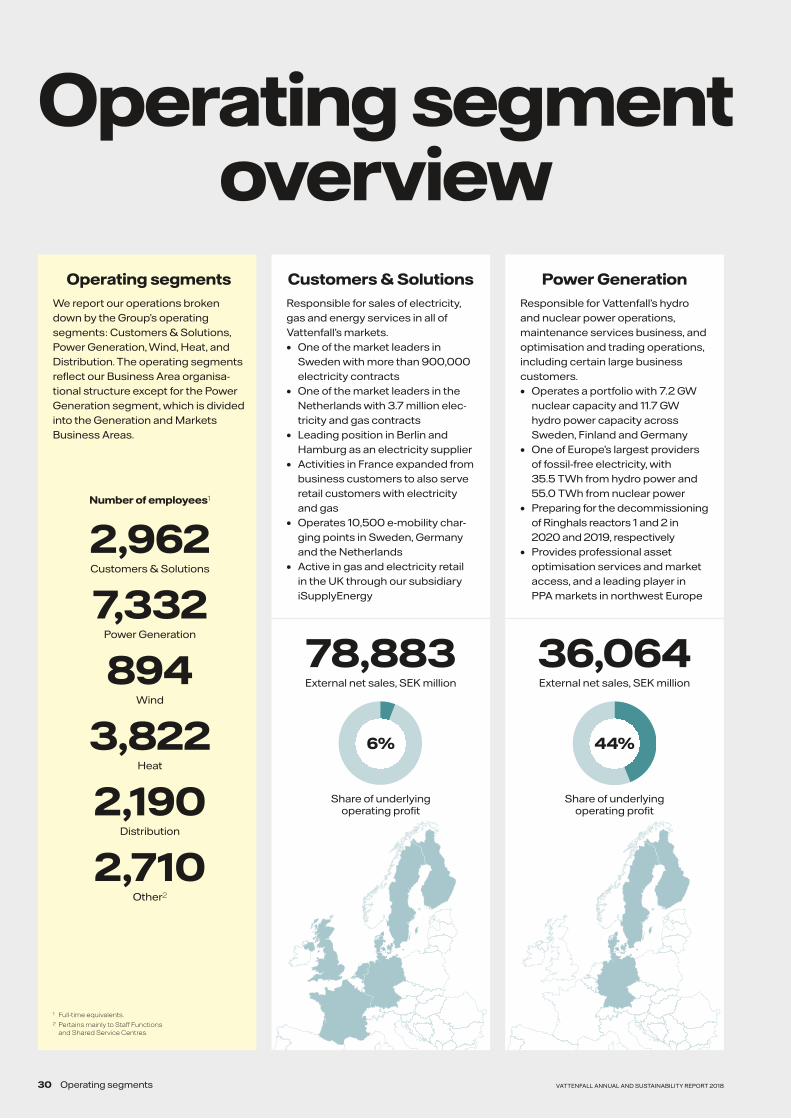
Operating segment overview
Operating segmentsWe report our operations broken down by the Group’s operating segments: Customers & Solutions, Power Generation, Wind, Heat, and Distribution. The operating segments reflect our Business Area organisa-tional structure except for the Power Generation segment, which is divided into the Generation and Markets Business Areas.
Customers & SolutionsResponsible for sales of electricity, gas and energy services in all of Vattenfall’s markets.
• One of the market leaders in Sweden with more than 900,000 electricity contracts
• One of the market leaders in the Netherlands with 3.7 million elec-tricity and gas contracts
• Leading position in Berlin and Hamburg as an electricity supplier
• Activities in France expanded from business customers to also serve retail customers with electricity and gas
• Operates 10,500 e-mobility char-ging points in Sweden, Germany and the Netherlands
• Active in gas and electricity retail in the UK through our subsidiary iSupplyEnergy
Power GenerationResponsible for Vattenfall’s hydro and nuclear power operations, maintenance services business, and optimisation and trading operations, including certain large business customers.
• Operates a portfolio with 7.2 GW nuclear capacity and 11.7 GW hydro power capacity across Sweden, Finland and Germany
• One of Europe’s largest providers of fossil-free electricity, with 35.5 TWh from hydro power and 55.0 TWh from nuclear power
• Preparing for the decommissioning of Ringhals reactors 1 and 2 in 2020 and 2019, respectively
• Provides professional asset optimisation services and market access, and a leading player in PPA markets in northwest Europe
Share of underlying operating profit
78,883External net sales, SEK million
36,064External net sales, SEK million
1 Full-time equivalents. 2 Pertains mainly to Staff Functions
and Shared Service Centres.
Share of underlying operating profit
6% 44%
Number of employees1
2,962Customers & Solutions
7,332Power Generation
894Wind
3,822Heat
2,190Distribution
2,710Other2
30 Operating segments VATTENFALL ANNUAL AND SUSTAINABILITY REPORT 2018

Operating segment overview
WindResponsible for development and operation of Vattenfall’s wind farms as well as large-scale and decentrali-sed solar power and batteries.
• One of the largest producers of offshore wind power in the world
• One of the largest producers of onshore wind power in Denmark and the Netherlands
• Inauguration of the Aberdeen Bay offshore wind farm (97 MW) in Scotland
• Winning bid for what will be the first non-subsidised offshore wind farm, Hollandsee Kust Zuid 1 and 2, in the Netherlands with a capacity of approximately 700 MW
HeatResponsible for Vattenfall’s heat ope-rations including sales, decentralised solutions and gas- and coal-fired condensing.
• One of Europe’s leading producers and distributors of heat with more than 2 million end customers
• The City of Hamburg has decided to exercise its call option to take over Vattenfall’s 74.9% stake in the city’s district heating system
• Establishment of the Energy Solutions business unit, offering innovative, low CO2-emitting energy solutions to real estate and commercial companies as well as municipalities
• Halving of CO2 emissions in Berlin three years earlier than pledged
Distribution Responsible for Vattenfall’s electri-city distribution operations in Swe-den, Germany (Berlin) and the UK.
• Leading owner and operator of electricity distribution networks in Sweden
• Approximately 3.3 million busi-ness and retail customers in Swe-den and Berlin, Germany
• New legislation in Sweden resul-ting in significantly lower revenue frameworks starting with the next regulatory period, which starts in 2020
• Received final approval of a licence to operate as an Independent Distribution Network Operator (IDNO) in the UK
Share of underlying operating profit
Share of underlying operating profit
Share of underlying operating profit
8,003External net sales, SEK million
15,828External net sales, SEK million
17,845External net sales, SEK million
18% 4% 29%
VATTENFALL ANNUAL AND SUSTAINABILITY REPORT 2018 31Operating segments

OperationsVattenfall’s Customers & Solutions business supplies electricity, gas and energy solutions to retail and business customers, with 9.7 million customer contracts in Europe. We are one of the market leaders in the retail and business segments in Sweden (with over 900,000 electricity contracts) and in the Netherlands (3.7 million electricity and gas contracts). In Germany we supply electricity and gas to retail customers (3.6 million contracts) and to the business segment with a focus on property companies. In the cities of Berlin and Hamburg we are market leader in the electricity retail segment. In Denmark, Finland, France and the UK our position is that of a challenger in sales of electricity and gas. We offer a broad range of energy solutions in most of our markets and are one of the largest solution providers in the Netherlands through our subsidiary Feenstra, with 830,000 customer contracts.
Key data2018 2017
Net sales (SEK million) 81,318 68,953
External net sales (SEK million) 78,883 67,402
Underlying operating profit1 (SEK million) 1,269 1,866
Sales of electricity (TWh) 88.3 84.0
– of which, private customers 27.4 27.1
– of which, resellers 4.9 5.1
– of which, business customers 56.0 51.8
Sales of gas (TWh) 55.5 55.3
Net Promoter Score (NPS) relative to competitors2 +1 +21 Operating profit excluding items affecting comparability.2 NPS was reported for the first time in 2016. For definition, see page 11.
Customers & Solutions
Operating segment
32 Operating segments VATTENFALL ANNUAL AND SUSTAINABILITY REPORT 2018

Developments in 2018Sales of electricity and gas increased compared with 2017. The underlying operating profit decreased compared with 2017 mainly due to increased pressure on margins in the UK and growth activity in energy solutions. Our retail customer base grew by 973,000 contracts during the year, of which 830,000 were Feen-stra contracts that are now included in Vattenfall’s customer base. The customer base in Germany showed strong growth by 115,000 contracts. Powerpeers, Vattenfall’s peer-to-peer platform for sharing renew-able energy in the Netherlands, grew substantially from 16,000 contracts to more than 60,000. We improved our abso-lute Net Promoter Score (NPS2) during the year and stayed ahead of our average peer competitors as evidenced by our relative NPS of +1.
In anticipation of the abolition of regulated tariffs in the coming years in the French electricity and gas retail segment, we have extended our activities in France from busi-ness customers to also offer retail custom-ers electricity and gas. In the UK, a price cap for variable tariffs was introduced and several energy obligation schemes were extended to smaller suppliers, effectively making the market more challenging.
Significant progress has been made in digitalisation, both for our customers and
our internal operations. We further devel-oped our digital energy sharing platform Powerpeers, and the virtual assistant Nina was launched in the Netherlands, featuring energy-related advice, fun and innovative challenges to save energy, and 100% mobile self-service. In Sweden, OneTon-neFuture was launched – an app that helps consumers increase their awareness about their carbon footprint and how to reduce it through their daily choices as well as through offsets. In Germany we entered digital partnerships in city mobility with Berlin’s public transport provider BVG, the electric scooter sharing service Emmy and the parking app We (a Volkswagen startup) to strengthen our position in Berlin and Hamburg and to make mobility in the cities more accessible and sustainable for our customers.
In 2018 we continued our work with smart energy solutions that improve customer access to fossil-free energy, help them increase their energy efficiency, and contrib-ute to their safety and comfort. We increased
our investment in the startup company tink to offer state-of-the-art smart home tech-nologies to customers in Germany. We also increased our sales of e-mobility solutions in the Netherlands, Germany and Sweden, and started operations in the UK. We now operate more than 10,500 charging points, making the transition to sustainable, electri-fied transport easier.
During the year, agreements were con-cluded with Volvo Cars, the car-sharing service aimo, and the property companies Klövern and Diös. The Swedish motor vehi-cle inspection company Bilprovningen also chose Vattenfall’s charging solution to offer public charging at its inspection stations, and we entered into an agreement with McDonald’s to install fast e-vehicle chargers in the Netherlands.
Our sales of solar panels had very strong growth in Sweden and the Netherlands. In Germany we have begun selling solar panels directly to retail customers and see encouraging sales volumes. A partnership was entered into with BMW to combine our offer for solar panels, batteries and charging wallboxes with a leasing discount for electric cars, which can be charged with solar power from customers’ roofs.
2 NPS is a tool for measuring customer loyalty and for gaining an understanding of customers’ perceptions of Vattenfall’s products and services.
Strategy Our ambition is to be a leading customer-centric company, supplying a wide range of sustainable energy solutions and servi-ces to retail and business customers.
The following focus areas have been iden-tified for Customers & Solutions:
• We aspire to help our customers live a climate-smart life by helping them reduce their carbon footprint. Our custo-mers are offered products and services for sustainable, efficient and fossil-free
energy consumption and production based on their individual energy needs. Our focus is on areas like smart data-based solutions, decentralised energy solutions and new customer interaction models. We are aiming for a top-three position in e-mobility charging solutions in northwest Europe.
• We are striving to optimise the customer experience by accelerating digitalisation and offering bundled, integrated and climate-smarter solutions. We want our customers to enthusiastically promote
us as a means to maintain and grow our business.
• We are increasing the profitability of our commodity sales business by growing our customer base while reducing the cost to serve. Also, a diversified com-modity portfolio is offered ranging from renewable electricity to products with certified environmental product declara-tions (EPD)1.
1 https://corporate.vattenfall.com/sustainability/policies-and- management/environmental-policy-and-management/life-cycle-management/
Planned activitiesWe are promoting customer centricity by focusing on customers’ experiences and acting on customer feedback. Our portfolio of energy solutions will be scaled by estab-lishing sales channels that support our growth targets coupled with automated low-cost operations. We are considering expanding our smart home offering from Germany to other selected markets and continue to grow our customer base while
also working on retention initiatives. We will also act upon acquisition opportunities when they arise.
We plan to extend our e-mobility servi-ces to all our current customer markets, capturing significant benefits of scale and enhancing value for our customers and key partners, such as leasing companies and car makers. We will continue to meet and exceed our customers’ sustainability
expectations by promoting fossil-free energy, offering innovative energy solu-tions and services and by enabling our customers to switch to electric cars. We take sustainability into account in our procurement and we are engaging with internal and external partners to learn from each other.
Vattenfall’s partnerships to improve and digitalise city mobility are mak-ing mobility more accessible and sustainable, and are strengthening our position in our core markets.
VATTENFALL ANNUAL AND SUSTAINABILITY REPORT 2018 33Operating segments

Smart Energy Partner
34 Operating segments VATTENFALL ANNUAL AND SUSTAINABILITY REPORT 2018

Vattenfall has a clear goal of helping its customers and partners to become fossil free within one generation. As the main sponsor of the Swedish Ski
Association, Vattenfall has become the “Smart Energy Partner”, joining forces with the association to make the sport more climate smart.
Vattenfall supports skiing in becoming more climate smart
–50%The national ski team’s goal of
reduced carbon footprint by 2022.
Sweden’s Alpine national team has set the target to cut its carbon footprint in half by 2022. At the start of Vattenfall’s partner-ship the Alpine national team’s carbon emissions were four times higher per person than for an average Swede.
“We know that our sport is threatened by climate change and that we are contrib-uting to this ourselves, since competing requires that we fly all over the world. Plus we have no control over the food we eat at hotels,” says Tommy Eliasson Winter, Alpine director. “So, we want to help to reduce our carbon footprint and to learn from people who work with this issue on a daily basis.”
Climate change is real for skiersThe reduction in the amount of snow on glaciers as a result of climate change affects skiers’ opportunities to train and compete.
“In some places where I trained when I was active twenty years ago you can’t train any longer,” says Tommy Eliasson Winter.
Vattenfall is advising the Alpine national team, who have now started to climate compensate for their air travel, eat climate-smart food and take “eco-driving” courses.
The Cross-Country national team is also working to reduce its carbon footprint.
“Our cooperation with Vattenfall dates back 24 years, which by itself is sustain-able and unique,” says Johan Sares, Cross-
Country director. The Cross-Country national team has called for the assistance of Vattenfall’s climate coach Lasse Ejeklint on a number of occasions. One project involves selling used racing and train-ing equipment and using the proceeds for continued climate work. The Cross-Country team also has plans for an entirely new World Cup tour with the Norwegian Ski Association, “Tour 2020”, with the aim of creating the most sustainable Cross-Country events ever.
Personal responsibilityAll skiers have a personal responsibility for their carbon footprint, but it can be hard for a person to appreciate how his or her lifestyle has an impact. This is where Vattenfall’s app OneTonneFuture comes in handy. The app calculates a footprint based on the user’s answers to questions about housing, travel, eating habits and consumption. Each answer shows imme-diately how big the carbon impact is. By means of personal advice, tips and chal-lenges, users can find out how to be more climate smart in their everyday lives.
“What we’re doing might seem like a drop in the ocean,” says Alpine star Sara Hector, “but we have 60,000 members in Alpine associations around Sweden. And when the national team starts to talk, our young members listen. We’re also look-ing at how we can get other associations
to take notice. Then our efforts take on a whole new dimension.”
Vattenfall’s Peter Holmgrene is the driv-ing force behind the project, and responsi-ble for OneTonneFuture:
“The app is a tool for anyone who wants to get to grips with their climate impact: individuals, companies, municipalities, schools and organisations. With the app you can form groups and compete with other people. The competitive element motivates you to do more and help one another.”
From personal competition to a climate-neutral Alpine World Championship in SwedenAt the Alpine Ski World Championship in Åre, Sweden, Vattenfall worked with the organisers in various ways to make the championship climate neutral. In addi-tion to a 380 square metre solar cell roof on the World Cup organisation’s office building, Vattenfall helped with charging infrastructure and new technology for sus-tainable energy consumption. Vattenfall’s contribution included a smart energy stor-age facility where batteries cut capacity peaks when electric vehicles were being charged: electric cars, electrically-driven snow scooters, and service vehicles.
VATTENFALL ANNUAL AND SUSTAINABILITY REPORT 2018 35Operating segments

OperationsVattenfall is one of the largest producers of fossilfree electricity in Europe. Safe, reliable and efficient electricity generation by hydro and weatherindependent nuclear power plants serve as the backbone for northern Europe’s electricity system. In 2018 the Power Generation operating segment produced a total of 90.5 TWh of electricity, where the Swedish part accounted for more than 55% of Sweden’s total electricity generation. Optimisation and distribution of reliable and flexible power to the market is provided by the Markets Business Area, which handles hedging, sourcing and trading to ensure security of supply to Vattenfall’s customers. Our service business develops and delivers maintenance services to both internal and external customers in the Nordic energy market.
Key data2018 2017
Net sales (SEK million) 99,970 79,566
External net sales (SEK million) 36,064 28,797
Underlying operating profit1 (SEK million) 9,371 10,820
Electricity generation (TWh) 90.5 87.5
Sales of electricity (TWh) 28.7 23.7
– of which, resellers 24.6 20.5
– of which, business customers 4.1 3.21 Operating profit excluding items affecting comparability.
Power Generation
Operating segment
36 Operating segments VATTENFALL ANNUAL AND SUSTAINABILITY REPORT 2018

Strategy The Swedish energy agreement that was reached in 2016 enables our fossil-free and cost-effective nuclear power to play a key role in the phase-out of fossil fuels from the energy system. Our flexible hydro power is becoming increasingly important as a tool for balancing the growing share of weather-dependent electricity generation.
The following focus areas have been identified for Power Generation:
• Provide safe, reliable, and efficient hydro and nuclear power generation while proactively preventing incidents and
accidents and mitigating the conse-quences of any accidents to employees, the general public and the environment. A target cost level of 19 öre/kWh has been set for 2021
• Ensure flexible operations that deliver high availability in our power plants and allow us to deliver electricity in periods with low production from weather-dependent energy sources
• Ensure effective dismantling of decom-missioned nuclear power plants and develop systems and facilities for
management and final disposal of spent nuclear fuel and radioactive waste
• Be a market leader in services and main-tenance of Nordic power grids
• Be a leading provider of renewable energy to business customers in Europe and build up a portfolio of power pur-chase agreements (PPAs). The PPA portfolio currently amounts to nearly 5 GW, and the goal is to increase this to 7 GW by 2020
• Utilise digital technology to improve asset optimisation and drive cost effi-ciency through process automation
Planned activitiesThe investment plan for our Swedish hydro power assets calls for plant refurbishment, maintenance and dam safety measures in the coming years.
The German hydro power organisation will further implement identified measures, such as automation and organisational changes, that are necessary for cost reductions and performance improve-ments.
SKB will submit additional information to the government regarding the final reposi-tory of spent nuclear fuel before the end of April 2019, and the government’s decision is expected in the first quarter of 2020.
The investment plan for our Swedish nuclear power reactors includes inde-pendent core cooling and investments to ensure availability of the nuclear power plants until the 2040s.
We will continue to identify the compe-tences needed to ensure long-term opera-tion of all our assets.
We will also continue to digitalise the business by implementing efficient IT process tools, using drones for remote inspection and inspection in hazardous environments, creating a virtual reality control room for simulations in the nuclear operations, and strengthening IT infra-
structural interlinks to improve efficiency, optimise the business, and share critical competences.
Vattenfall is also developing a platform to operate and optimise small-scale decentralised energy solutions. These assets will then be aggregated into one combined virtual asset which will facilitate access to the wholesale markets. Automa-tion and digitalisation of trading and asset optimisation activities, including support-ing processes will further contribute to meeting customer demands as well as a higher level of efficiency.
Developments in 2018Net sales increased mainly as a result of higher electricity prices and higher nuclear power generation combined with higher sales of electricity and gas, and positive currency effects. However, the underlying operating profit decreased mainly due to hedging.
Hydro powerOur hydro power generated 35.5 TWh of electricity (35.6) in 2018. A rainy autumn partly compensated for an unusually dry summer, restoring Nordic reservoir levels to 55% (65%) of capacity by year-end 2018, which is 2 percentage points below normal. Investments have been focused on refurbishments and upgrades that increase availability, flexibility and dam safety. We continue to increase operational efficiency with new digital tools, such as remote condition assessment of equip-ment and mobile work management. We are undertaking a great number of initiatives to reduce the negative effects of hydro power on ecosystems and biodiver-sity, with the aim of maximising ecological benefit while minimising the impact on electricity generation.
Among activities are research studies of downstream migration of fish at our
research facility in Älvkarleby, measures to improve migration of salmon and sea trout at Stornorrfors hydro power station, and development of new ways to attract fish to the fish passages, ensuring efficient path-ways. Read more on page 39.
In Germany we finalised a major review of our hydro power operations, identified measures to ensure future profitability and are currently in the process of implement-ing them.
Nuclear powerOur nuclear power generation in 2018 amounted to 55.0 TWh of electricity (51.9). The average availability was 88.9% (84.9%).
In January 2018 the Swedish Radiation Safety Authority (SSM) recommended approval of the Swedish Nuclear Fuel and Waste Management Company’s (SKB) licence application to build an encapsula-tion facility and a final repository for spent nuclear fuel. On the same day, the Land
and Environmental Court stated that it could not approve SKB’s application and requested more information about the copper canisters.
For information on the decommissioning of the Ringhals 1 and 2 reactors in Sweden and the Brunsbüttel and Krümmel nuclear power plants, see pages 28–29.
The work to secure operation of our remaining Swedish nuclear power plants continued during the year, including identi-fication and mapping of competences and suppliers needed for operation until the 2040s.
Markets2018 was characterised by high volatility in many of the markets where Vattenfall trades in spot and forward markets. Our diversified trading operations allowed us to benefit from these price movements. Vattenfall signed its first solar PPAs to buy the output from three solar farms in the Netherlands with a combined capacity of 38 MW. In May 2018 Vattenfall also signed an agreement with Facebook to provide market access and power balancing of electricity generation from three new Norwegian wind farms.
Vattenfall undertakes many initiatives to ensure it minimises or mitigates the impacts of its operations. In hydro, focus is on maximising the ecological value of each initiative we undertake.
VATTENFALL ANNUAL AND SUSTAINABILITY REPORT 2018 37Operating segments

Topical issue
The changing role of Swedish
hydro power
The increased focus in society on climate change and CO2 emissions is having a sig-nificant impact on the way Sweden’s hydro power is used. Flexible hydro power plays an instrumental role in an energy system with more and more wind and solar power. Through interconnectors, this flexibility can be applied in other markets.
Since the first hydro power plant was built in Trollhättan in southern Sweden in 1909, hydro power has been a cornerstone in the Swedish energy system, generating base load electricity for industry, infrastructure and households. This role was maintained up through the 1950s, ’60s and ’70s, when more, large-scale hydro power plants were built to supply base load and cover daily and seasonal fluctuations in the demand for electricity. When nuclear power entered the scene in the 1970s and ’80s, it took over a big part of the base load supply.
The intensified focus on climate change and CO2 emissions has contributed to signifi-cant growth in installed capacity of renewable energy sources such as wind and solar power in Europe. However, the intermittent nature of these energy sources makes it necessary to have back-up capacity. Flexible hydro power can offer its huge reservoirs of stored water as a giant “green” battery for the Nordic region as well as internationally. Nordic water reservoirs
hold 50% of the total hydro storage volume in Europe, providing unique flexibility through all time frames – from seconds to months – as well as grid stability services in the Nordic region.
Interconnectors vital for the energy transitionInterconnecting Nordic hydro power with neighbouring systems will offer flexible cross-border capacity, provide security of supply, improve market stability and enable the renewable agenda. This pertains especially to its potential for coping with the growing volumes of intermittent renewable generation in Germany and the UK. During times of low renewable generation on the Continent and in the UK, Nordic hydro power can be exported and thereby reduce dependence on flexible fossil fuels in these markets. Conversely, during times of surplus generation by Continental and UK renewables, the flow can be reversed, and any excess power generation can be sent to the Nordic market, thereby offering a remedy to overcapacity situations. A key initiative in this context is the 1,400 MW NorthConnect link that is planned between Norway and Scotland, a joint venture between Vattenfall and three Norwegian companies.
Strengthening the all-important flexibility Harnessing the water in Swedish rivers is a highly efficient and cheap way to generate
electricity. At the same time it is imperative that we deepen our understanding of the rivers, future precipitation trends, environmental considerations and technical ways to meet the new demands for fast response to fluctuations in electricity demand and generation.
Following a recent revision of waterflow mod-els and data on the rivers in which Vattenfall has hydro power, it seems that we can expect to see a rise in the volume of steadily inflowing water. We have made necessary, precaution-ary investments in dam strength and height to make a worst-case scenario of a flood that could statistically be expected to happen every 10,000 years manageable. Based on available information, the hydro power plants will never-theless be able to handle such a development with existing facilities and systems. Dam safety is always paramount in considering how to run turbines and reservoirs with a greater level of flexibility. Going forward it will therefore be nec-essary to regulate water flows a bit differently and apply stricter safety margins during parts of the year, especially for the plants highest up in the mountains.
Cutting edge technologyVattenfall’s R&D activities are key to ensuring the adaptability of hydro power in the evolving energy landscape. Covering for intermittent wind and solar power generation requires higher flexibility.
38 Operating segments VATTENFALL ANNUAL AND SUSTAINABILITY REPORT 2018

This entails relatively rapid operational changes with starts and stops and corresponding vari-ations in reservoir water levels, with resultant wear and tear on dams, turbines and water-ways inside the power plants.
Vattenfall’s R&D work has resulted in a number of development strategies for hydro power in the future. While no new hydro power plants are likely to be built in Sweden, the capacity of existing stations can be increased to reach Vattenfall’s goal of adding 600 MW of hydro power capacity by 2023. Monitoring and surveillance techniques are being improved through, among other things, machine learning and switching from periodic to predictive maintenance. Toward this end, Vattenfall’s hydro power turbine test rig at the Älvkarleby R&D centre has been modified to test equipment that is exposed to this more flexible and transient mode of operation.
Maximising ecological benefit from environmental investmentsThe environmental adaptation to higher flex-ibility with larger fluctuations in water flows is a challenge for Sweden’s hydro power plants and involves a trade-off between environmen-tal considerations and the ability to provide society with renewable energy.
Against the backdrop of the stricter future requirements set out in the EU Water Frame-
work Directive and the coming 2019 revision of the Swedish Environmental Code, Vattenfall has taken the initiative to set up a hydro power environmental fund together with seven other hydro power operators. The fund will invest SEK 10 billion over a period of 20 years, while making sure that environmental investments are made where the ecological benefit is the greatest and the impact on renewable electric-ity generation is as low as possible.
A biodiversity R&D programme has been developed to identify measures that improve biodiversity in relation to eels, salmon, trout, birds and habitats near Vattenfall’s hydro power plants while maintaining high generation and regulation capacity. It is based on a stepwise process that allows a continuous assessment of the biological benefit of each measure.
Vital role in Europe’s future energy systemWith the strengthened flexibility, investments in new technology and targeted environ-mental measures, Vattenfall’s hydro power plants will be able to maintain their role as the cornerstone of a Nordic and European energy system that features increasing amounts of renewable energy.
Laxelerator – By combining its expertise in hydraulics and biology, Vattenfall is gaining a greater understanding of fish behaviour. The “Laxelerator” test flume is a recent example of Vattenfall’s environmental research work and has been built at Vattenfall’s Älvkarleby R&D centre. The flume can be used to measure up- and downstream migration of fish and has two test sections that are 25 metres long and 4 metres wide and can reach water flows up to 16 m3/second. It is a unique flume accredited to perform full-scale studies and tests with live fish and other aquatic organisms. For instance, tests have been performed to determine the optimal spacing between bars in grids designed to prevent fish from entering the turbines while at the same time avoiding accumulation of waste material that will reduce the plant’s performance.
Vattenfall is one of the leading hydro power producers in the Nordic region with some 90 hydro power plants.
Generation: 30–35 TWh/year Nordic capacity: 8,800 MW
VATTENFALL ANNUAL AND SUSTAINABILITY REPORT 2018 39Operating segments

Power purchase agreements
40 Operating segments VATTENFALL ANNUAL AND SUSTAINABILITY REPORT 2018

15-year PPA for KråktorpetIn September 2018 Vattenfall and German-based Aquila Capital signed a 15-year PPA for renewable electricity from the Kråktorpet wind farm in northern Sweden. Vattenfall will also provide balancing services, market access and management of green certificates (Guarantees of Origin).
“The agreements with Vattenfall are important parts in the realisation of the Kråktorpet wind farm project. The new wind
farm will add 163 MW to our portfolio of renewable Nordic wind power, which already has surpassed 1 GW,” says Roman Rosslenbroich, CEO and Co-Founder of Aquila Capital.
The Kråktorpet wind farm is currently under construction and is planned to be operational in October 2019.
New wind and solar farms are being built throughout northwest Europe to meet the rising demand for renewable electric-ity from businesses and consumers. The important task of bringing customers and renewable production together is directly in line with Vattenfall’s goal to enable a life free from fossil fuels within one generation. This is something that we can facilitate with our position as a major developer of renewable electricity generation and our large customer base. PPAs are an increasingly important tool that bridges the gap between custom-ers and producers through contracts for stable, long-term supply and offtake of renewable electricity.
Long-term access to renewable energyErik Suichies, Head of Vattenfall’s Busi-ness Unit Customers in the Markets Business Area explains: “Buying and sell-ing electricity via power purchase agree-ments is nothing new in our industry. For decades we have had supply agreements in place with energy-intensive customers who want to fix their electricity prices long-term. What is new is that more
and more customers have an interest in gaining access to renewable energy to meet their sustainability targets.”
In addition to connecting customers to Vattenfall’s own renewable electricity generation, Vattenfall can leverage its expertise and customer relationships to benefit other renewable energy develop-ers as well.
Erik Suichies continues: “Third-party developers of renewable energy are interested in bringing their energy to the market to secure a long-term stable return. Most often they do not have any energy customers themselves, while we can con-nect our customers to renewable electric-ity generation for periods of up to ten years or even longer with corporate PPAs.”
Vattenfall has contracted nearly 5 GW of renewable energy from third parties and aims to increase this to 7 GW by 2020.
Increased importance for PPAs“Corporate PPAs will be an important tool for buying and selling renewable energy,” notes Raija Seppälä, Senior Originator in Business Unit Customers. “A decrease in subsidies for renewable electricity
production in many European countries or even zero subsidies in the offshore wind sector is driving the interest in PPAs from developers of renewable electricity generation. By selling their future produc-tion to a business customer, developers can unlock capital and hedge a large portion of their investment risk.”
An attractive counterpartySeppälä also stresses that Vattenfall is an attractive counterparty due to its clear purpose to make fossil-free living possi-ble within one generation in combination with the company’s high credit rating and large portfolio of renewable electricity generation. And risks are many in the energy sector.
“As part of the PPAs, we can take over risks such as power price, credit and imbalance costs for a fee. We have long experience in renewables, techni-cal know-how and a large portfolio of renewables, on top of which we are a major trader in the power markets. We are therefore able to offer a full-service package to third-party developers as well as customers,” Seppälä concludes.
Power purchase agreements (PPAs) are increasingly used as an instrument for developers of renewable energy projects to secure long-term revenue
and for companies to get a sustainable supply of energy for their businesses.
Rapidly growing interest in power purchase agreements
VATTENFALL ANNUAL AND SUSTAINABILITY REPORT 2018 41Operating segments
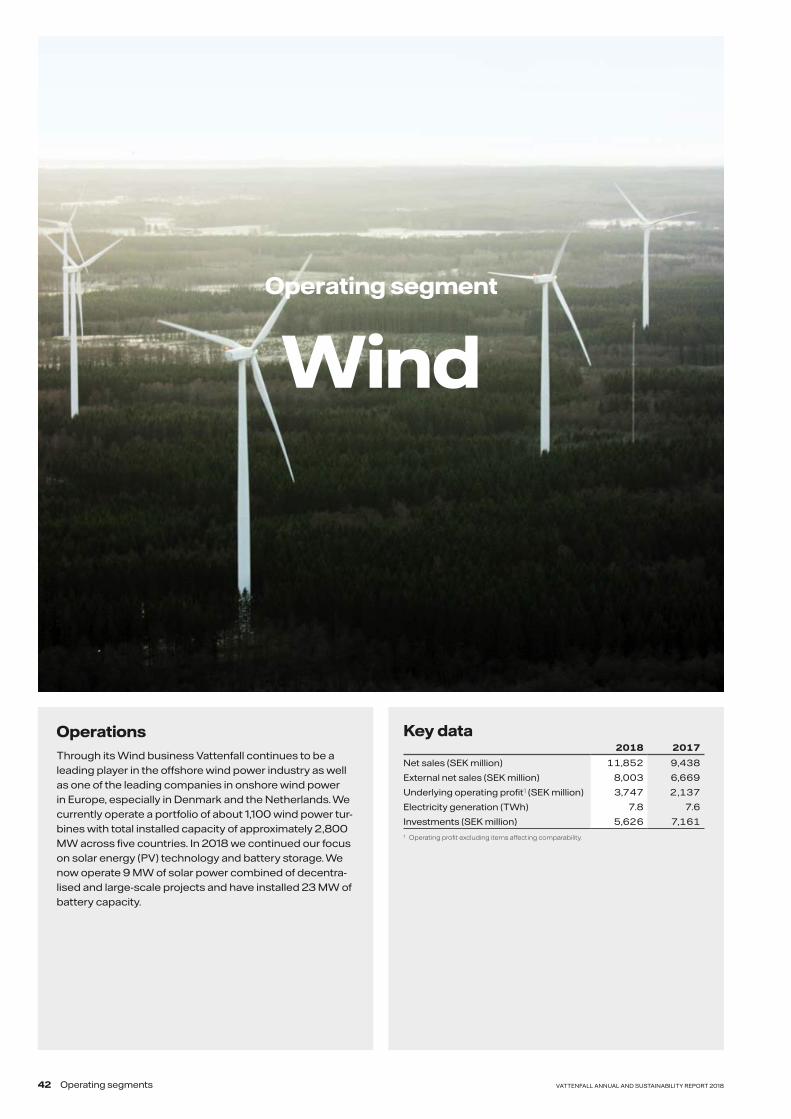
OperationsThrough its Wind business Vattenfall continues to be a leading player in the offshore wind power industry as well as one of the leading companies in onshore wind power in Europe, especially in Denmark and the Netherlands. We currently operate a portfolio of about 1,100 wind power tur-bines with total installed capacity of approximately 2,800 MW across five countries. In 2018 we continued our focus on solar energy (PV) technology and battery storage. We now operate 9 MW of solar power combined of decentra-lised and large-scale projects and have installed 23 MW of battery capacity.
Key data2018 2017
Net sales (SEK million) 11,852 9,438
External net sales (SEK million) 8,003 6,669
Underlying operating profit1 (SEK million) 3,747 2,137
Electricity generation (TWh) 7.8 7.6
Investments (SEK million) 5,626 7,1611 Operating profit excluding items affecting comparability.
WindOperating segment
42 Operating segments VATTENFALL ANNUAL AND SUSTAINABILITY REPORT 2018

Strategy Development and deployment of renew-able power generation are key to achieving a sustainable energy system, unlocking the climate benefits of widespread electri-fication of society and ultimately reducing CO2 emissions. We want to be a leader in the development, construction and opera-tion of on- and offshore wind power. Our target is to add an additional 2,300 MW of commissioned wind and solar capacity between 2016 and 2020, bringing our estimated total capacity to 4,100 MW by
2020. To achieve this ambition and suc-ceed in an increasingly competitive market environment, the following focus areas have been identified for Wind:
• Further strengthen the project pipeline by acquiring project development rights or entering into joint development agree-ments
• Become a leader in Levelised Energy Cost (LEC), for instance by leveraging procurement scale, standardising pro-
cesses and improving site selection and design capabilities
• Innovate in operations and maintenance and keep focus on the digitalisation of our entire value chain to reduce costs and improve availability
• Use the potential of combining solar, wind and battery technology for renew-able hybrid power plants and to a greater extent decouple the electricity delivery from the actual production
Planned activitiesRenewable energy is the key to support-ing Vattenfall’s purpose to Power Climate Smarter Living and realise the transition to a fossil-free energy system. We will con-tinue to bid for tenders and invest in wind, solar, and battery projects in the coming years as well as optimise our operations to maximise renewable electricity generation in a sustainable manner. With respect to our existing wind farms, costs will be low-ered by raising the level of standardisation, digitalisation, and data analysis for predic-tive maintenance and optimised marketing of the electricity produced. While renew-able energy sources have a largely positive
impact on the environment by replacing fossil-fuelled alternatives, they also have environmental impacts. We are working to minimise these impacts by continuously optimising our operations and technolo-gies both internally and together with our suppliers and contractors. We want to go beyond just being compliant. Environmen-tal and sustainable performance is more than merely following guidelines: it is a proactive mindset and a personal respon-sibility for each individual.
Investments are being made in research and development to better understand and be able to mitigate the impacts of our oper-
ations on the environment. The already running Vattenfall Environmental protec-tion and wind power (ENWI) programme and the European Offshore Wind Deploy-ment Centre (EOWDC) scientific research programme are assessing the impact of wind power on birds and bats as well as on marine mammals. The programmes are identifying whether – and if so, which – miti-gation measures are meaningful to ensure an environmentally responsible renewable energy transition. Both programmes will continue their work throughout 2019 and beyond. Read more about our biodiversity initiatives on pages 160–161.
Developments in 20182018 was a highly successful year for Vattenfall’s Wind business. Net sales and the underlying operating profit for 2018 increased compared with 2017 mainly as a result of positive price and currency effects and additional capacity. Electricity generation was stable compared to 2017 and amounted to 7.8 TWh (7.6).
In Scotland, off the coast of Aberdeen, Vattenfall inaugurated the offshore wind farm Aberdeen Bay. The wind farm con-sists of turbines with a capacity of 8.8 MW, which is the largest turbine capacity in commercial operation worldwide. All of the wind turbines have been installed using a newly deployed foundation design – the suction bucket foundation – to minimise the impact on noise-sensitive marine ani-mals. The first electricity from the 97 MW offshore wind farm was generated three months ahead of schedule.
In March we won the tender for the Hol-landse Kust Zuid 1 & 2 offshore wind farm with planned capacity of approximately 700 MW, which will be the first offshore wind farm worldwide with no guaranteed
feed-in tariff. This is proof that our con-tinuous efforts to reduce costs along our entire value chain are working successfully. The project has triggered keen interest from Dutch industry for renewable power purchase agreements (PPAs), which will further drive decarbonisation of Dutch industry.
In May, construction started on the 353 MW Blakliden/Fäbodberget wind farm in northern Sweden. Once commissioned in 2021/2022 it will be one of Sweden’s larg-est onshore wind farms.
In Denmark, we took the final investment decision and signed the main contracts to start construction of the Kriegers Flak offshore wind farm (605 MW) in 2019. Installation of the Horns Rev 3 wind farm (407 MW) has started and will be com-pleted in 2019.
We also decommissioned one of our oldest and smallest offshore wind farms in Sweden. All seven turbines and founda-tions of the Utgrunden wind farm (10 MW) were successfully removed from the site within two months.
Next to our wind activities, solar power and battery projects were developed during the year. Our 22 MW battery installation at the Pen y Cymoedd onshore wind farm in the UK became operational in 2018. This is the largest co-located battery installa-tion at a wind farm in the UK. The battery will help the UK National Grid to enhance frequency response services, which will contribute to a stable and reliable electricity network for British consumers. Vattenfall is currently also installing solar panels at existing solar farms in Velsen, Eemshaven and Hemweg in the Nether-lands with total capacity of 10 MW as well as 2 MW in Germany.
Vattenfall’s efforts to reduce the cost of renewable electricity generation enabled us to win the tender for the world’s first offshore wind farm with no guaranteed feed-in tariff.
VATTENFALL ANNUAL AND SUSTAINABILITY REPORT 2018 43Operating segments

Optimising wind farm design
44 Operating segments VATTENFALL ANNUAL AND SUSTAINABILITY REPORT 2018
Wind power is a fast-evolving field that has attracted a lot of attention and investment in recent decades. Its development into a more mature and competitive market is making cost reduction and maximisation of power generation imperative already in the design phase of new wind farms.
“Lower costs and increased power generation can be achieved through the use of optimisation tools based on mathematical models. We have therefore introduced Operational Research (OR) methods to identify the optimal location of wind turbines in a given site in order to maximise performance and ultimately pro-fits,” says Martina Fischetti, PhD and Lead Engineer from the System Design Group in Vattenfall’s Wind business.
As her doctoral dissertation, Martina Fischetti developed a new wind farm layout optimiser in close cooperation between the Technical University of Denmark and Vattenfall. The position of each turbine in a wind farm and the routing and choice of cabling are extremely important and must be optimised to take into account such various factors as water depths, erosion zones, foundation costs, physical obsta-cles, types of cables, cable loss and – most importantly – the wake effect, where one turbine casts a “wind shadow” on other turbines. All these factors can now be fully optimised and have a significant impact on the final layout and business case.
From a multi-step to an all in one processPreviously, wind farm design at Vattenfall was a multi-step process that was heavily dependent on the engineers’ experience and standard tools. A preliminary layout was generated and checked for certain factors, the turbine locations were adap-ted, the layout was passed to another team for checking and adaptation of other factors and so on. This process was time consuming and could even cancel out the previous work done on optimisation of other factors. Now the process has been streamlined, as all factors are coded into the layout optimiser which runs overnight, making thousands of simulations conside-ring all factors, and delivering the optimal layout and cable routing to be checked and finalised by experts.
To date the optimiser has been used for the two offshore wind power projects Kriegers Flak in Denmark and Hollandse Kust Zuid in the Netherlands, for example, and it was instrumental in winning both projects in international tenders.
Thomas Hjort, Head of System Design in the Offshore Wind Business Unit, explains: “I had never seen these techniques used for this type of problem before, and the results achieved compared to those of well-established tools are remarkable. What is very exciting about these OR-based tools is the momentum they gave to the team, giving us time to experiment and think out of the box, testing entirely
new ideas and solutions by running the optimiser with various new design factors as input. Furthermore, we can now engage with suppliers in a new way and drive innovation in a longer perspective. Having such comprehensive optimisation tools is allowing us to test new ideas and alterna-tive options straight away, and not least to quantify the impact of new design choices from the very first stages, which would not be possible in the more manual process.”
Smarter way to increase profitabilityAll in all, the novel layout optimiser has contributed substantially to Vattenfall’s competitiveness in offshore tenders by creating better layouts, quantifying the impact of new design choices and deliver-ing alternative business case options for each wind farm. The layout optimiser can become an important tool in Vattenfall’s ambitious plans for expansion in the wind sector.
Vattenfall’s CFO, Anna Borg, summari-ses: “The use of these tools developed by Martina Fischetti and her colleagues in the Wind business can contribute more than EUR 10 million in increased productivity and reduced costs over the lifetime of each wind farm, allowing us to be more competitive in the energy market. This is a good example of a smarter way to increase our profitability while also reducing our costs, and it is the way we need to work going forward.”
Layout optimiser driving increased efficiency and revenue
Identifying the optimal location of wind turbines has significantly improved offshore wind farm design at Vattenfall.
Fast simulations deliver results – Thousands of simulations are performed overnight by the wind farm layout optimiser, saving months of working hours and increasing profitability.
VATTENFALL ANNUAL AND SUSTAINABILITY REPORT 2018 45Operating segments

OperationsVattenfall is active in district heating and decentralised energy solutions, and operates condensing and waste-to-energy plants. We are a leading supplier of heat in Berlin, Amsterdam and Uppsala, serving around 1.8 million end consumers. The district heating business in Hamburg, which accounts for approximately 0.5 million customers, will be sold to the city of Hamburg in 2019. District heating supply is mainly based on operation of large combined heat and power plants (CHPs). Our decentralised opera-tions comprise more than 500 installed energy solutions in the range of 100 kWth up to 10,000 kWth. It includes customised combinations of e.g., mini-CHPs, heat pumps, boilers, storage options and solar panel installations.
Key data2018 2017
Net sales (SEK million) 33,970 30,724
External net sales (SEK million) 15,828 14,882
Underlying operating profit1 (SEK million) 771 3,371
Sales of heat (TWh) 18.3 18.9
Electricity generation (TWh) 32.0 32.2
CO2 emissions2 (Mtonnes) 22.0 22.6
Nitrogen oxide, NOx (ktonnes) 9.9 9.8
Sulphur dioxide, SO2 (ktonnes) 4.2 4.1
Particulates (ktonnes) 0.2 0.31 Operating profit excluding items affecting comparability.2 CO2 emissions are pro rata.
HeatOperating segment
46 Operating segments VATTENFALL ANNUAL AND SUSTAINABILITY REPORT 2018

Strategy Society is increasingly demanding low-carbon energy solutions. We want to be the partner of choice for customers and com-munities to power their lives in ever climate smarter ways. Our Heat business will phase out coal by 2030 and will be fossil free by 2040. Accordingly, the focus areas for Heat include two major decarbonisation steps:
• Phase-out of coal and peat
• Replace fossil gas with renewable gas
Achievement of both of these steps will be possible by sector coupling to integrate
renewable power generation (wind, solar) with Third Party Integration (waste heat) and renewable heat sources (biomass, solar, geothermal).
For our target heat and cooling customers – real estate owners and developers (e.g., municipalities, commercial companies, tenant-owner housing cooperatives) – we want to be the preferred energy solutions provider by offering integrated, decentral-ised energy solutions with an improved customer focus based on modern digital solutions. We will focus on developing climate-smart energy solutions for these segments with the needs and expecta-tions of their end customers (tenants and apartment owners) in mind.
Planned activitiesOur coal-fired Reuter C unit in Berlin will be replaced by a 120 MWth electric heat-only-boilier (HOB) and a 120 MWth gas HOB by 2020. A joint feasibility study for the phase-out of coal by 2030 at the latest has been started together with the City of Berlin and covers the replacement of the Reuter West and Moabit coal-fired power plants.
We are managing the carve-out process of the district heating business in Hamburg in a responsible manner while still growing our decentralised energy solutions busi-ness in the city. A feasibility study of power-to-heat at the Moorburg CHP plant has been successfully conducted and will be further investigated in 2019. With this power-to-
heat solution, an additional 70,000 tonnes of CO2 can be saved per year.
In the Netherlands, Vattenfall will stop production at the Hemweg 8 coal-fired plant by the end of 2019, fifteen years earlier than the plant’s technical end of life, contributing to the CO2 objectives of the Netherlands. The early closure is a result of the decision by the Dutch government in March 2019 that Hemweg 8 should stop using coal as a fuel for electricity produc-tion by the end of 2019.
In Sweden, our goal and promise to Uppsala Municipality is to reduce CO2 emissions by 50% by 2020 compared to 2013. In early 2019 the existing hot water boiler will be converted from peat to wood
pellets and the 2020 goal will thus be met already in 2019. The Carpe Futurum pro-ject with its new 112 MWth waste wood-fired steam HOB will provide the Uppsala heat cluster with a diversified, low cost, and sustainable fuel mix. It will be taken into commercial operation in 2021 and ensure the necessary heat supply. We are also looking into generating electricity in the future by adding a steam turbine.
During 2019 the Heat operating segment will test several new customer products. One example is the installation of more than 200 sensors at a real estate cus-tomer’s properties and applying advanced analytics to reduce waste heat while improving the indoor climate for tenants.
Developments in 2018Net sales increased as a result of higher electricity prices and positive currency effects. The underlying operating profit decreased mainly due to higher costs for CO2 emission allowances and fuel, and positive one-off effects in 2017.
In 2018 the City of Hamburg decided to exercise its call option for the city’s district heating system and purchase Vattenfall’s 74.9% share, with financial effect from 1 January 2019. Closing of the transac-tion is expected to take place in 2019. We regret this decision, as we were eager to remain and show our ambition in the shift of heat systems in Hamburg. Neverthe-less, we are investing in many other areas in Hamburg and in Germany in general, which continues to be one of our core markets.
In Moorburg, the supply of process heat to a nearby refinery saved more than 5,000 tonnes of CO2 in 2018. In Berlin, Vattenfall achieved the goal of halving its coal-based CO2 emissions from CHP plants
three years earlier than pledged. A new heat-only-boiler (60 MWth) in which oil has been replaced with gas was commis-sioned in May 2018 in Berlin Wilmersdorf.
In the Netherlands, the municipality of Amsterdam has decided to renovate the city’s northwest district. This provides growth opportunities, as this concession area is served mainly by gas heating sys-tems but will now be connected to the joint municipal and Vattenfall district heating network.
In Sweden we finalised the conver-sion of two boilers from fossil fuel-based oil to bio-oil in Uppsala. Together with a hot water boiler conversion project and the phase out of peat, the project will reduce CO2 emissions by more than 50%, from approximately 380,000 tonnes in 2013 to 156,000 tonnes in 2020.
SamEnergi is a Third Party Integration (TPI) initiative that focuses on teaming up with industrial and commercial facilities to capture surplus heat from their operations
and connect them to the district heating network. Two pilots are ongoing, one with Dagab in Drefviken and one with Lindvalls Kaffe in Uppsala, and software is currently being developed for pricing of surplus heat.
During 2018, the Energy Solutions Busi-ness Unit was formed, with presence in Sweden, Germany, the Netherlands and the UK. The product portfolio includes an offering of reliable and sustainable heat and cooling, storage solutions and digital submetering services that are com-plemented with solar power and smart charging options for electric cars, either one by one or as fully integrated solutions.
With the launch of the Digital Accelera-tor Programme in 2018, the Heat operating segment has committed itself to accelerat-ing the digital transformation and offering Vattenfall customers a comfortable home environment that takes into account their personal heating preferences as well as their environmental and cost concerns.
Vattenfall’s Heat business will phase out all fossil fuels by 2040. As a first step, coal will be phased out by 2030.
VATTENFALL ANNUAL AND SUSTAINABILITY REPORT 2018 47Operating segments

Smart heat meters in Berlin
48 Operating segments VATTENFALL ANNUAL AND SUSTAINABILITY REPORT 2018

Vattenfall is currently installing smart heat meters free of charge to some 1.2 million users throughout Berlin’s district heating network for a capital expenditure of more than EUR 9 million. The business case for the smart meter project is based on improved load management and the resulting fuel savings, among other things, with the provision of consumption data for customers as a byproduct.
The first smart meters were installed in late January 2018 in Berlin’s city hall, Rotes Rathaus, and will help customers, the City of Berlin and Vattenfall make the district heating system even more efficient. The meters are supplied by Berlin-based meter manufacturer Samson.
From 60 to 20,000 measuring pointsSmart heat meters are the digital key to boosting energy efficiency and they enable a new level of energy management that will help the State of Berlin achieve its goal of becoming climate-neutral by 2050. The number of network data points in the district heating network will go from 60 in early 2018 to nearly 20,000 by year-end 2019, which will improve control of the close to 2,000 kilometres of piping in the district heating network.
Gunther Müller, CEO of Vattenfall Wärme Berlin, explains: “I regard smart heat
meters as the key to efficient control of climate-smart district heating in Berlin. Household-specific heat consumption data such as temperature, pressure and flow are provided every 15 minutes via the mobile phone network to the district heat control centre, which then knows how much heat is needed at any given time and can precisely match supply and demand. This saves fuel, which again means lower CO2 emissions.”
The smart heat meters are thus putting an end to the era of manual meter reading. The acquired data simplifies billing, helps identify defective meters and enables bet-ter customer support. And additionally, the meters provide customers with the infor-mation necessary to optimise their energy consumption, leading to greater efficiency and lower costs.
Cooperation partners and customers welcome the new metersVattenfall’s cooperation partner Björn Böh-ning, Governing Mayor of Berlin at the time of installation at the Rotes Rathaus, adds: “In an increasingly digitalised world, smart solutions for control of energy consump-tion are both necessary and possible. This applies equally well to private households and public buildings. Now we are putting this into action here at the Rotes Rathaus.
In many regards, energy efficiency is an important topic in Berlin, as along with reducing harmful substances that pollute the air in Berlin, we can conserve precious resources. In this way, we are makíng a contribution to reach our goal of becoming a climate-neutral city by 2050.”
Private sector customers also recognise the benefit of stepping into the digitalised world. Jörg Buberl, Building Services Manager of the Friedrichshain Building Society, which manages and maintains 7,500 flats in Berlin, welcomes the conver-sion to smart heat meters: “Naturally it makes things a lot easier when the heat meters can be read remotely. There are also advantages to making the data avail-able on the online customer portal, so that heat quantities can be clearly understood for operating cost allocation. Access to the meter data gives us more transparency, since it allows us to monitor the fulfilment of our contractual heat delivery to our ten-ants even better.”
With the new smart meters, the entire heating concept in Berlin is taking a huge step in a more sustainable direction by reducing production and the consequent emissions through an exact matching of supply and demand.
Vattenfall is introducing smart district heat meters in Berlin’s district heating network to improve energy efficiency, increase customers’ energy consumption awareness
and help the State of Berlin achieve its goal of climate neutrality by 2050.
Boosting energy efficiency in Berlin with smart heat meters
2050The State of Berlin’s target date
for climate neutrality.
VATTENFALL ANNUAL AND SUSTAINABILITY REPORT 2018 49Operating segments

OperationsVattenfall’s Distribution business owns and operates electric-ity distribution networks in Sweden and Germany (Berlin) and has approximately 3.3 million business and household customers. A new business has also been established in the UK which will work towards operation and ownership of new networks. Electricity distribution is primarily a regulated business that is supervised by the network regulators in the respective countries. In Sweden the revenue regulation will be stricter, and the revenue frameworks will be significantly lower from the next regulatory period, which starts 2020. Vattenfall has reviewed its investment plans to adjust to the new conditions while at the same time maintain focus on maximising the efficiency of investments.
We strive to minimise our impact on biodiversity in our distribution operations and make best use of the areas around our assets to aid protected or threatened species. Sustainable nature conservation and the protection of species are impor-tant aspects in the construction and operation of our electricity networks. We therefore place high demands on our suppliers and contractors to work according to our environmental policy.
Key data2018 2017
Net sales (SEK million) 22,374 21,430
External net sales (SEK million) 17,845 16,840
Underlying operating profit1 (SEK million) 6,250 6,075
Investments (SEK million) 6,554 5,4831 Operating profit excluding items affecting comparability.
DistributionOperating segment
50 Operating segments VATTENFALL ANNUAL AND SUSTAINABILITY REPORT 2018

Strategy Electricity distribution and its related infrastructure are essential for a sustain-able society. Our customers and society have high expectations for the security and quality of their power supply. Even though we have made major investments in electricity networks for many years, we must continue to improve the quality of supply by reducing the average frequency of outages and their average duration. Fur-thermore, we need to increase the capac-ity of the network in many areas to be able to connect more customers and enable growth in society. The ageing network must be modernised to manage the grow-ing volume of decentralised renewable
power generation that needs to be con-nected. The Distribution System Operators (DSOs) are committed to enabling the adoption of smart meters, digital solutions and related customer information.
The following focus areas have been identified for Distribution:
• Continue with investments to improve availability and quality of supply, increase customer satisfaction, and accommo-date renewable energy sources
• Be a digital DSO with smart, sustainable and customer-centric solutions such as digitalisation of customer interfaces and increased automation in the electricity network
• Safety has the highest priority in Dis-tribution. We strive for a healthy and safe workplace for our employees and contractors through leadership and a culture of high health and safety aware-ness. We continously work with safety inspections of our facilities to prevent risks. In the event of incidents in the electricity grid, we report and cooperate with the relevant authorities and take the necessary measures to prevent similar events from occurring again. This is a continuous process with the long-term goal to have zero accidents
Planned activitiesWe will continue to invest in improved security of supply and in digitalisation of the network to ensure that we operate a smart, efficient and stable grid. This will improve our offering to customers, support the development of new business models and enable continued integration of renew-able energy sources. We will continue to develop relationships with local stake-holders to foster an understanding of our social responsibility as a network owner. Environmental focus areas in the coming
years include further proactive manage-ment of biodiversity in maintenance and construction activities, responsible handling of equipment to avoid oil spills, and the ambition to adopt new isolating technologies for high voltage breakers , with the purpose of avoiding the use of the greenhouse gas SF6, when such technolo-gies become commercially available. In Sweden, demand for electricity is grow-ing faster in several areas than electricity generation capacity is being expanded.
Vattenfall is developing innovative solu-tions that use demand and supply flexibility to connect customers as quickly as pos-sible, despite the lack of available capacity. In Berlin we are continuing our commit-ment to the “WindNODE – showcase smart energy” project with the aim of integrating large amounts of renewable electricity into the energy system and at the same time keeping the power grids stable.
Developments in 2018Net sales increased mainly due to higher tariffs in the local grid and higher revenues from the regional grid in Sweden. This was partly countered by lower net sales in Germany, with lower prices as a result of lower grid tariffs. The underlying operating profit increased over 2017 as a result of the higher revenues in Sweden. In 2018 we invested SEK 6.6 billion in electricity networks, of which SEK 4.7 billion in Swe-den and SEK 1.7 billion in Berlin. A large share of investments in Sweden pertained to weatherproofing the electricity grid, particularly in the countryside, and improv-ing the grid in growing cities. Measures such as insulating overhead power lines or
replacing them with underground cables will reduce outage frequency and the dura-tion of outages.
To further increase reliability of the electricity grid in Berlin, investments are being made to renew assets, for instance through substation upgrades and asset automation. During the year we announced a 6% increase in the electric-ity network price in Sweden and a slight decrease in Berlin, which are both effective from 1 January 2019. We won the contract for the operation, maintenance and repair of the public lighting system in Berlin. The process for the award of the electricity grid concession in Berlin is expected to con-tinue in 2019. Meanwhile, we remain com-mitted to guarantee the security of supply in Berlin, and we will continue our work on digitalising and modernising the network.
In Sweden, a major project to upgrade the control equipment for the link between Västervik on the mainland and Ygne on the island of Gotland was completed in
the autumn. The new control equipment will provide higher operational reliability, reduce the risk of power outages, enable integration of renewable energy sources, and allow more than 20 years of additional operation. We regret that the repair work resulted in several outages for our custom-ers. However, the project was needed to secure future stable supply to the island. Read more on page 53.
During the year, we established a new business in the UK which will work towards operation and ownership of new networks as an Independent Distribution Network Operator (IDNO) within the Private Net-works Market. Code compliance that is required by the British energy regulator Ofgem was achieved during 2018. This now allows the IDNO to own and operate public electricity distribution networks. In addi-tion to new networks we are also focusing on establishing Vattenfall as a provider of smart energy solutions in distribution and private electricity networks.
Vattenfall’s investment to upgrade the infrastructure linking Gotland to the Swedish mainland will improve reliability, reduce outages, enable integration of more renewables, and allow more than 20 years of additional operation.
VATTENFALL ANNUAL AND SUSTAINABILITY REPORT 2018 51Operating segments

Distribution Gotland
52 Operating segments VATTENFALL ANNUAL AND SUSTAINABILITY REPORT 2018

To ensure secure and reliable electricity supply on Gotland, Vattenfall has replaced the equipment that controls the high-volt-age direct current (HVDC) cables located between Västervik on the mainland and Ygne on Gotland. The control station is the heart of the Gotland link and ensures reliable energy transmission with the right amount of energy transferred between the mainland and the island. The old control station from the mid-1980s was approach-ing the end of its technical life, and the island was facing the risk of major disrup-tions in the future.
Modernisation of the control system involved replacing the old analogue tech-nology with new digital technology, which was necessary for continued stable opera-tion of the two cables. The actual replace-ment of the control system was done between mid-July and the end of Septem-ber, as electricity consumption is relatively low during that period. Unfortunately, the work resulted in several outages that had a negative impact on our customers, which Vattenfall regrets. The modernisa-tion has contributed to a more stable electricity grid and has made it possible to generate more local, renewable energy on Gotland in the future.
“With the new control station, we have obtained a very robust, safe and modern system that provides improved monitor-ing and faster troubleshooting in case of equipment failure,” says Magnus Sundell, project manager for the rebuilding work at Vattenfall. “We will also be able to start up the Gotland cables remotely, which will shorten the shutdown time in the event of a cable failure.”
Through the investments, which in total amount to approximately SEK 350 million, the Gotland link is equipped for more than 20 years of secure and reliable operation.
Innovation creates new opportunitiesThere is a great deal of interest from both solar and wind power developers to expand renewable power generation on Gotland. However, this requires additional capacity in the electricity network, and for Gotland, the cables to the mainland are the major limiting factor. On behalf of the Swedish Energy Agency, Vattenfall, together with its subsidiary Gotlands Energi AB, has conducted a study on how to both integrate more renewable energy and increase security of supply on Got-land. This will essentially turn Gotland into a pilot project for the transition to a renew-able energy system in Sweden.
The study shows that if the existing electricity connections were supplemented with a battery pack in combination with a voltage increase in the power network from today’s 70 kV to 130 kV, it would be possible to increase the installed amount of renew-able capacity on Gotland by 150 MW and to increase security of supply as well. This will require different solutions consisting of battery storage, controllable wind power production and controllable electricity consumption, where for example larger business customers can disconnect their electricity consumption during a certain time period. The intention is to establish a digital marketplace for system services where customers can receive compensa-tion for being flexible and thereby reduce power peaks, which in turn can reduce the lack of capacity in the network.
Karl Bergman, Vice President Research & Development, Vattenfall AB, summa-rises: “It is very positive that the study shows the possibilities of conversion to a renewable energy system on Got-land. The new smart technology offers immense potential, which will enable Gotland to contribute with renewable electricity generation to the Swedish electricity system on a larger scale.”
Investments have been made on the island of Gotland in Sweden to ensure more reliable electricity supply. Modernisation of the grid is a precondition for
the transition to a renewable energy system on the island.
Securing electricity supply on Gotland
20The Gotland link is equipped for more
than 20 years of secure and reliable operation.
VATTENFALL ANNUAL AND SUSTAINABILITY REPORT 2018 53Operating segments

Through innovative research activities, Vattenfall is driving development towards the goal of making fossil-free living possible within one
generation, not only for ourselves, but also for our partners.
Research and development
Through research and development (R&D), Vattenfall is accelerating the journey towards becoming fossil free, as well as other aspects of our strategy. More than ever before, R&D activities involve the use of digital technologies, including data ana-lytics, machine learning and artificial intel-ligence. Digitalisation is not an end in itself,
but a valuable tool that helps us develop new solutions for customers, optimise and improve our grid and production assets, and solve technical problems.
Around 120 people of more than 30 nationalities work in Vattenfall’s dedicated R&D organisation, in addition to many more in the various Business Areas. Together
they cover a very wide area of expertise. But partnering with others, including customers, suppliers, public stakeholders, universities, and institutes is also critical for successful innovation. During 2018 Vattenfall spent the equivalent of SEK 494 million on research and development.
Analytics
The R&D Data Analytics team supports Vattenfall’s sustainability endeavors through machine learning and advanced analytics.
Reduction of NOx emissions Recently, the R&D Data Analytics team modelled an optimisation of the operation
of the catalytic NOx reduction process at a district heating plant in Uppsala. This pro-cess uses ammonia to catalytically convert nitrogen oxides in flue gas into nitrogen and water. But the efficiency of the cata-lytic converter drops as residue builds up, and eventually it needs to be taken offline and regenerated. The team began by pre-
dicting the efficiency loss in the process over time, and based on this it modelled an optimal schedule for regenerations, given the cost of the efficiency loss and the cost of regenerating the converter. The result-ing model resulted in a 3% reduction in NOx emissions while also cutting the cost of the entire process.
54 Operating segments VATTENFALL ANNUAL AND SUSTAINABILITY REPORT 2018

Optimising wind assets
Strengthening synergies of combined wind and solar farms through optimisationTo further increase the amount of sustain-able electricity, Vattenfall is combining new solar farms with existing wind farms, among other measures. This reduces production costs for the solar farms, since they can share the grid connections and infrastructure. The combined farm can also be equipped with storage batteries (accu-mulators), which creates extra flexibility and enables other sources of income from network services or from preventing imbal-ances in the electricity grid.
Since such a combined system quickly becomes complex, Vattenfall’s R&D department is continuously striving to develop new solutions to optimise and control future hybrid power plants to allow maximum use of network connections or offer different network-stability related
services. For the optimisation and control algorithms to function effectively, they must have reliable electricity generation forecasts for the wind and solar farms as well as for demand, both of which depend heavily on the weather.
Weather-based forecasts Along with the shift to intermittent renewable energy sources like wind and solar, Vattenfall’s activities are becoming increasingly weather dependent. The variability of weather compounds the challenge of forecasting both demand and production. For the most accurate predic-tions, we must be able to use as much relevant data as possible and to continu-ously improve the techniques for interpret-ing that data. To address this, Vattenfall has built a database with both historical weather data and weather forecasts. The database consolidates different sources
of information, simplifying the use of data and creating the possibility to analyse large amounts of information. To improve interpretation of data, forecasts for wind power generation are based on advanced algorithms and machine learning, among other things, which are both components of artificial intelligence. In machine learn-ing, computers learn from their experi-ences and improve their own performance.
The ability to combine wind and solar power assets – and in some cases batteries – coupled with reliable forecasts of electric-ity demand, is enabling Vattenfall to plan better before a spike in demand and thus improve the stability of the electricity grid.
Using artificial intelligence to reduce maintenance at hydro power plants In parallel with digitalisation of Vattenfall’s hydro power plants, the R&D Data Analyt-ics team is performing numerous tasks to increase plant efficiency and reduce envi-ronmental impacts.
To identify and possibly avoid degrada-tion of the cooling system in a hydro power plant, a warning system has been imple-mented where the optimal range of param-eters for running the system is monitored in real time. The resulting machine learning
model distinguishes the periods of time when heat starts to build up in the genera-tor and issues timely warnings to avoid overheating especially in the summer months, when river water temperatures rise and the system’s cooling ability drops dramatically.
Predictive maintenance of the raw water heat exchanger in such cooling systems and detection of any oil leakage events in turbine control systems are two other examples currently in focus. In the former case, accumulative deposits of impurities
from river water in the heat exchanger tubes result in a reduction of efficiency. Both of these events can be measured and monitored by computers, which in turn will eliminate the need for periodic inspections and increase reliability of the system. The models are currently being refined and adjusted to achieve this goal as additional historical data continues to be collected.
Sjöängen
Microgrid project shows lower costs and reduction in electricity capacity peaks Sjöängen is one of Vattenfall’s microgrid projects, where 600 square metres of solar panels connected to a battery stor-age are powering the Sjöängen Knowl-edge and Cultural Centre in the Swedish town of Askersund. The intelligent steering combines solar energy, battery storage, energy management and electric car charging in a locally integrated microgrid system.
The Soldrift Sjöängen (“Solar Operation at Sjöängen”) project is a joint venture between Vattenfall, Askersund Municipal-ity, the Swedish Energy Agency and the
company Sustainable Innovation. The pro-ject is testing various operating strategies for the microgrid. Electricity peak shaving is being tested at Sjöängen’s catering facility, where electricity is supplied from the battery as opposed to the grid, when capacity peaks arise. This enables the facility to use their own stored electricity, instead of buying electricity at times when it is expensive.
Sjöängen is a pilot project for what microgrid systems may look like in the future with decentralised energy solutions, electric car charging and energy storage, and has provided valuable insights for future microgrids and controlling strate-
gies. These include how to control the charging and discharging of the energy storage facility, how to reduce the costs of power output from the electricity grid, and how to do all of this without wearing the battery out unnecessarily.
The project results show that the sys-tem can contribute to renewable power generation, backup power and lower power peaks, without adversely affecting operational reliability or power quality, for example. Thanks to the project, Askersund Municipality is seeing great interest in microgrids. In the coming years, the munic-ipality plans to install solar power systems at several other properties.
VATTENFALL ANNUAL AND SUSTAINABILITY REPORT 2018 55Operating segments

Fossil-free steel production
56 Operating segments VATTENFALL ANNUAL AND SUSTAINABILITY REPORT 2018

Electrification can reduce industry’s carbon footprint dramatically. A new steel manufacturing method that Vattenfall is developing in
cooperation with steel maker SSAB and mining company LKAB may reduce CO2 emissions by more than 98%.
The world’s steel industry alone accounts for 7% of all carbon dioxide emissions. Together with SSAB and LKAB, Vattenfall is developing HYBRIT, a pioneering fossil-free method of steel manufacturing that uses hydrogen gas produced from fossil-free electricity.
After two years of preparations, con-struction of the world’s first fossil-free steelworks began in Luleå, Sweden in June 2018.
“We’re really pleased that we’ve come a step closer to our goal of fossil-free steel manufacturing. The HYBRIT initiative is giving us an opportunity to reduce emis-sions and achieve the climate goals. In the pilot plant, we’ll develop the technology closer to an industrial scale,” says Mårten Görnerup, CEO of the joint venture com-pany Hybrit Development.
The pilot plant in Luleå will go into operation in 2020, and the plan is to have an industrial process for fossil-free steel manufacturing ready by 2035.
Water replaces CO2 emissionsSSAB is already the world’s most CO2-efficient steel manufacturer. Despite this, steel manufacturing accounts for more than 10% of CO2 emissions in Sweden.
Traditionally, iron for steelmaking is manu-factured using coal to reduce the oxygen in iron ore. In a blast furnace, the carbon in the coal combines with the oxygen in the ore and forms carbon dioxide. With the HYBRIT initiative, the oxygen will instead react with hydrogen, and the emissions will herefore consist of pure water.
All in all, HYBRIT can lower the CO2 emissions from the manufacturing of one tonne of ore-based steel from about 1,600 kg to about 25 kg, a reduction of more than 98%.
Hydrogen gas and renewable energy – an ideal combinationHydrogen gas, in turn, is produced by conducting direct current through water, so-called electrolysis. Vattenfall is now developing an efficient process for produc-ing and storing hydrogen gas using fossil-free electricity, and to extend its applica-tion to other industries.
“Hydrogen production can be used to balance the demand for electricity when needed. This makes it ideal in a future energy system with a greater proportion of renewable and weather-dependent energy sources such as sun and wind,” says Mikael Nordlander, portfolio manager
at Vattenfall R&D with responsibility for HYBRIT and other energy-intensive indus-try partnership projects.
Sweden – a pioneering countryElectrification of industrial processes is an important part of Vattenfall’s strategy of enabling a life free from fossil fuels within one generation. Vattenfall’s current projects to electrify the manufacturing of steel (HYBRIT), cement (with Cementa) and biofuel (with Preem) have the potential to reduce Sweden’s CO2 emissions by a total of 30%.
“Sweden’s energy system today is already nearly fossil-free, which makes Sweden an ideal forerunner for other countries when it comes to replacing fos-sil fuels with electrical power,” says Mikael Nordlander. “Last autumn we noted that the European Commission’s 2050 roadmap as well as reports from the Energy Transitions Commission (ETC) and Eurelectric have the same view as we do of the role of electrifica-tion to meet the Paris Agreement targets. This is highly encouraging for the future.”
HYBRIT spearheading electrification of industry
98%Potential reduction of CO2 emissions from
steel manufacturing with HYBRIT.
Vattenfall’s current projects to electrify basic industry have the potential to reduce Sweden’s CO2 emissions by a total of 30%, and similar plans are being drawn up for other core markets as well.
VATTENFALL ANNUAL AND SUSTAINABILITY REPORT 2018 57Operating segments

Vattenfall is building a new people-driven future. We believe that we will be successful in our effort to Power Climate
Smarter Living through our people.
StrategyThe foundation of our success is built on skilled and engaged people who thrive in a company that thinks more broadly than others and cares about individuals and our communities. We rely on a broad mix of people who each bring their unique talents to the team, forming a diversity that fuels our passion for enabling our customers to live fossil free within one generation.
To succeed with our purpose, we need both freshly graduated and experienced professionals with the right mindset. We offer our employees opportunities for con-tinuous learning across the entire energy chain and vital, purposeful work together with bright colleagues in a supporting and inclusive work environment.
In general we are working actively with the following focus areas:
• Provide a safe and healthy work environment
• Secure the right and diverse competence
• Enable an engaging high-performance culture
Our people
58 Our people VATTENFALL ANNUAL AND SUSTAINABILITY REPORT 2018

Developments during 2018
Ensuring a safe and healthy work environmentOur goal is to have zero accidents. Despite our utmost efforts and relentless work on increasing strategic proactiveness in health and safety, sadly two fatal accidents occurred in 2018. Such accidents are unacceptable, and we are making every effort to identify the underlying causes and act to prevent similar accidents in the future. During 2018 we had a strong focus on organisational and social health (topics such as stress, burn out, management from a distance, etc.), including our goal to have zero harassment. At the same time, we made safety improvements through health and safety leadership initiatives. We monitor health and safety development both for our employees and our contrac-tors. Lost Time Injury Frequency (LTIF) increased to 1.9 (1.5) in 2018. Sickness-related absences decreased slightly to 4.0% in 2018 from 4.1% in 2017, largely owing to development and improvements in our proactive health and safety work. Considering that sick leave rate in north-west Europe showed an upward trend in recent years, the decreasing trend in Vattenfall last year is a good result.
We can see the results of our con-tinuous efforts to ensure that our people are treated fairly, regardless of gender, transgender identity or expression, ethnic-ity, religion or other faith, disability, sexual orientation or age. Harassment is clearly unacceptable, and Vattenfall takes all forms of harassment seriously. Routines for reporting and dealing with undesirable behaviour, including sexual harassment, have been in place for years. We have zero tolerance for all forms of harassment. During 2018 managers received extensive training and conducted team workshops to support anti-harassment work in their teams. A live-streamed session with an external presenter received over 3,000 views, indicating a high interest in working together to reach the zero harassment target. All Vattenfall employees in all our countries are free to join trade unions.
Securing the right and diverse competenceThe number of employees decreased in 2018, from 20,041 to 19,910 full-time equivalents (FTEs).
To meet the challenge of attracting talent, we have sharpened our employer value proposition to attract people who share our purpose – to Power Climate Smarter Living. We are aiming to attract both local
and global talent, welcoming people with the right skills and attitude, no matter their background. Particularly sought-after competences lie in the areas of digital know-how, nuclear power technology, ana-lytics and various engineering specialties. A pilot campaign using our new Employer Brand was launched at the end of 2018 in Sweden, using different methods and channels to find and attract people with the competences that we are looking for. A new career website is also being devel-oped. Vattenfall’s transformation is both narrowing and expanding the business at the same time, which requires the ability to re-skill and re-train people in many different areas – which for many teams is one of the highest business priorities.
To meet this, Vattenfall promotes job rotation, talent networking, trainee and leadership programmes and transparent career paths for specialists, project man-agers and leaders. We run and participate in various programmes and initiatives that support broad aspects of diversity and inclusion, which we believe strengthen us as an employer and also enable us to better understand our customers’ expec-tations and make us a better partner in the communities we serve.
We support career development and employability by making career opportuni-ties transparent to help our employees find the next career step within Vattenfall when possible, or even outside the company when necessary. Staff reductions resulting from our transformation and rightsizing decisions will be handled in a socially responsible way. An example is Finance
Accounting Services in Jokkmokk, whose tasks were outsourced during 2018. In this case, Vattenfall made a promise to come up with replacement jobs for the 32 affected employees. As a result, Vattenfall Distribution established a network-specific customer service centre in Jokkmokk, helping these employees get trained for the new jobs.
Enabling an engaging, high-performance culture In 2017 we set out on a journey to trans-form our culture towards being more open, active and positive in a work environ-ment committed to safety. We are now continuing our activation programme to drive change in the company culture and strengthen our employees’ engagement. The programme strives to help each and every one of our people find their own role in driving the transition to a fossil-free society. It aims to unite all employees around our purpose and strategy, so they feel proud of our past but even prouder of our future. Cultural change and a high-performance organisation require a con-stant dialogue on goals and continuous feedback. In Vattenfall’s annual employee survey, employee engagement was stable at 64% in 2018, the same as in 2017. Work still remains to be done to reach the target of 70% employee engagement in 2020, but we are moving in the right direction. When our employees are proud they talk about us in a positive light, which has a ripple effect on our business.
We work for an open and inclusive culture where our employees find their own role in driving the transition to a fossil-free society.
VATTENFALL ANNUAL AND SUSTAINABILITY REPORT 2018 59Our people

IntegrityOperating our business with integrity is essential for ensuring that we live up to our stakeholders’ expectations. They depend on us to conduct our business in a fair and responsible manner. We have a zero tolerance policy for bribery and corruption, and we are a member of the Partnering Against Corruption Initiative (PACI), a cross-industry collaboration launched by the World Economic Forum, as well as of
Transparency International Sweden. We require that all employees take personal responsibility to act in accordance with the company’s ethical guidelines, which are laid out in the Vattenfall Code of Conduct and Integrity. Tailor-made face to face training programmes and e-learning tools support these ambitions.
We expect our suppliers and business partners to act ethically and in full compli-
ance with the applicable rules in every country they do business, as outlined in the Vattenfall Code of Conduct for Suppli-ers. Read more about Vattenfall’s integrity organisation in the Corporate Governance Report on page 77.
Code of Conduct and IntegrityA new and updated version of the Vattenfall Code of Conduct and Integrity
Strategy execution is an integral part of Vattenfall Management Institute (VMI), our internal training organisation. According to the employee survey, this has resulted in a clear and continued improvement in the understanding and appreciation of Vattenfall’s strategy and purpose. It is particularly gratifying that our employees feel they truly can make a difference in the
success of our business, because they are the ones who will make fossil-free living within one generation possible.
We are working consciously to pro-mote an open and inclusive culture that increases awareness throughout the com-pany. Our goal is to have the same gender balance in management positions as in the company as a whole, thus enhancing
equal leadership by narrowing the gap between female and male managers. In 2018 we came one step closer to our goal, as women represented more than 33% of all managerial hires, increasing the share of female managers to 24% from 23% in 2017, 22% in 2016 and 19% in 2015.
Vattenfall is working actively to provide a safe and healthy work environment and our goal is to have zero accidents.
60 Our people VATTENFALL ANNUAL AND SUSTAINABILITY REPORT 2018

Reporting of incidents
Vattenfall encourages every employee to report any violation of law or the Vattenfall Code of Conduct and Integrity. Reports may be made to the employee’s immediate manager, a national integrity coordinator or the Internal Audit department.
Additionally, an informant who suspects a serious violation but does not wish to report it internally may contact one of the external ombudsmen through the whistleblowing function. Whistleblowing is a procedure that is voluntarily implemented by Vattenfall. The
ombudsmen are experienced external lawyers independent from the Vattenfall Group.
Reporting to the external ombudsmen provides the option to remain anonymous. Personal data and other information that an ombudsman receives from a whistleblower will be handled with strict confidentiality until the informant allows the ombudsman to pass on all or part of this information to the ombudsman’s contact person at Vattenfall. It is prohibited to attempt to determine the identity of the inform-ant in a whistleblowing matter.
The reports are most often investigated internally by the Internal Audit department. Every investigation is conducted under strict confidentiality. The investigation is concluded with a written report, sent to a member of the Executive Group Management (EGM) as well as to other relevant people in the organisation. The informant is always informed about the outcome.
Investigations may lead to recommenda-tions on appropriate measures, including disciplinary actions.
was launched in August 2018. Substantial awareness activities were conducted in connection with the launch of the new Code. All employees must be familiarised with the new Code, both in text form and through e-learning.
Integrity trainingAll managers who have extensive contact with competitors are required to partici-pate in the Vattenfall Integrity Programme (VIP). The VIP includes both e-learning and instructor-led training on the Code of Con-duct and Integrity, antitrust/competition issues, anti-bribery and anti-corruption, conflicts of interest and inside information. The purpose of the VIP is to raise the level of awareness, ensure that all employees understand our integrity standards, and ensure a common compliance culture throughout the Group. 957 employees attended the VIP in 2018 (2017: 698; 2016: 1,100), corresponding to nearly 3,900 hours of education. Integrity content is also part of our leadership programmes.
Awareness and monitoringIt is the responsibility of every manager to lead by example and to ensure their team members understand our way of working. More than 400 managers complete the Vattenfall Integrity Survey every year. Based on the survey responses and various inter-views, a range of activities may be initiated, such as monitoring compliance with our governing rules or providing tailor-made
information material. One specific action in 2018 was to further educate employees in Finland and Denmark on integrity-related issues and to raise their awareness about the whistleblowing function.
IncidentsAll suspected incidents are to be reported to the employee’s immediate manager, to the Integrity organisation or to the Internal Audit department. Additionally, we have a Group-wide whistleblowing function with locally appointed external ombudsmen (lawyers) to whom employees, consultants and suppliers can anonymously report suspected improprieties.
All incident investigations are led by Vattenfall’s Internal Audit unit. A total of 46 integrity-related incidents were reported in 2018 (2017:47; 2016: 40), of which 11 (2017:15; 2016: 10) led to disciplinary action. None of the incidents in 2018 were related to antitrust/competition issues. Currently there are no pending integrity-related cases against Vattenfall in court.
Most of the incidents were reported internally, while four cases were reported via the external ombudsmen (2017:8; 2016: 8). All reported incidents and violations are evaluated and subject to a lessons-learned process to ensure continuous improvement within the company. A description of how incidents are reported and investigated is provided in the box below.
Integrity risksWe have conducted and will continue to conduct risk assessments related to integ-rity. The two greatest integrity risks that we have identified are non-compliance with competition laws and corruption. In 2018 we had six reported incidents in these areas (2017:1; 2016: 7). Accordingly, Vattenfall will continue its work to raise awareness within the company through training and communication to ensure compliance with the rules in these areas. One example of a risk assessment con-ducted in 2018 pertained to the Wind operating segment, which included in-depth interviews with relevant managers.
Code of Conduct for SuppliersOur integrity work is not just an internal issue – we also have corresponding require-ments for our suppliers. We require our suppliers to comply with the Vattenfall Code of Conduct for Suppliers, or an equivalent standard agreed together with us. In the integrity area, the Code of Conduct for Sup-pliers puts special emphasis on business integrity, anti-corruption, conflicts of interest and competition law, as well as information on how to use the whistleblowing function. It is based on, among other things, the UN Global Compact, the UN Guiding Principles for Business and Human Rights, and the OECD Guidelines for Multinational Enter-prises.
VATTENFALL ANNUAL AND SUSTAINABILITY REPORT 2018 61Our people

Risks and risk management
We apply conscious and balanced risk-taking in which business transactions are reviewed from both profitability and risk perspectives. Our risks are managed based on a sound risk
culture throughout the entire company to support our strategy and achieve our long-term goals. In accordance with the Swedish Corporate Governance Code and the Board of Directors’
Rules of Procedure, Vattenfall’s risk management framework ensures thorough identification and management of our risks and an acceptable risk exposure.
62 Risks and risk management VATTENFALL ANNUAL AND SUSTAINABILITY REPORT 2018

Enterprise Risk ManagementThe aim of Enterprise Risk Management (ERM) is to manage risks to which the Group is exposed in order to support value creation, ensure risk awareness, and bal-
ance risk against reward. ERM at Vattenfall involves analysing and monitoring all types of risks. It is based on the risk management standards of the Committee of Sponsoring
Organizations of the Treadway Commis-sion (COSO) and the three lines of defence. ERM combines a top-down with a bottom-up approach.
Risk structureWith the ongoing growth in renewables and continuous changes in the energy market structure (e.g., decentralisation, electrifica-tion and energy storage), as well as changes in energy policies, our risk/return profile is changing. However, these developments entail not only risks but also opportunities. The relative importance of market price risk is increasing for Vattenfall due to dramatic changes in support schemes – especially for offshore wind investments. The further diversification of our portfolio provides a well-functioning risk mitigation measure. In 2018 the Group’s overall risk portfolio posed no threat to the company’s continued existence
based on a single risk or aggregated risk posi-tion. Nor are such risks discernible for 2019.
The likelihood of a hard Brexit arguably increased during 2018. We are assessing what this would mean for our business. While huge political uncertainty remains, the direct risks for Vattenfall are limited based on our initial assessment. The main impact would be at the operational level, mainly in the wind and the trading businesses. In addition, a number of Human Resource–related issues would need to be considered. Indirect effects of macroeconomic consequences are hard to predict at the moment.
The risk structure outlined in the following pages reflects the company’s strategic objec-tives: Leading towards Sustainable Consump-tion, Leading towards Sustainable Production, Empowered and Engaged People, and High Performing Operations. The main risks we are exposed to are presented, as well as how we manage these risks. This section is accom-panied by an example on how we assess and manage impacts caused by climate change. Certain financial risks are associated with more than one of the strategic objectives and are therefore addressed in a separate para-graph in the risk section.
Risks and risk management are part of the financial statements in accordance with the International Financial Reporting Standards (IFRS). Read more on pages 86–155.
ERM processVattenfall’s strategy serves as the basis for setting objectives for the respective business units in the business planning process. When setting these objectives, risks that could hinder their achievement are identified. In our risk management process, risks are quantified and analysed with respect to both financial and non-
financial consequences (e.g., concern-ing the environment, including climate change, as well as health and reputation). These risks are assessed against the company’s risk tolerance and a decision is made on suitable risk measures to avoid, reduce, share or accept the risks. The Business Areas’ most important risks and measures are followed up as part of the
financial monitoring. After aggregating the risks, a composite overview of our risk situ-ation is achieved. The potential financial impact is linked to financial key data that is used for the steering of the company. Information is provided on a regular basis to the Executive Group Management and the Board of Directors.
Power Climate
Smarter Living
Su
stai
nabl
e C
onsumption
Lead
ing to
wards Sustainable Productio
n
Leading toward
s
High Perform
ing
Operatio
nsE
mpow
ered and
Engaged people
ERM process
Internal environment & objective-setting
Risk tolerance
Risk response
Risk assessment
Control activities
Event identification
Information & Communication and Monitoring
VATTENFALL ANNUAL AND SUSTAINABILITY REPORT 2018 63Risks and risk management

Risks related to Sustainable Consumption
We are strongly focused on increasing customer centricity, meeting customer expectations and strengthening our posi-tion as a provider of comprehensive, sus-tainable solutions. This requires that we further improve the customer experience and accelerate digitalisation, which will allow our customers to take control of their consumption and production of electricity and heat.
Risks• Inability to meet customer expectations
(measured by a declining Net Promoter Score, NPS) or to develop and offer the demanded energy-efficient and sustain-able solutions and services, possibly leading to loss of customers and market share.
• Failure to ensure satisfactory security of supply due to ageing and unreliable dis-tribution networks or extreme weather conditions.
• Risk of discontinued concession for the distribution network in Berlin.
Risk management activities during the yearTo be Leading towards Sustainable Con-sumption, we continue to develop energy solutions – such as charging solutions in the InCharge charging network and other digital offerings – to optimise and increase value for customers. A new business unit called Energy Solutions was established in 2018 to better coordinate efforts in decen-tralised energy solutions (e.g., Vattenfall InHouse, solar power and heat pumps). Our focus on hiring and developing digital competences ensures that we can con-tinue to innovate and create climate-smart product solutions that customers value. Our solar and battery business continues to develop various products that enable customers to have solar/battery/charging solutions in their homes. Further, we have partnered with basic industries in Sweden to electrify and decarbonise their industrial processes. For example, in partnership with SSAB and LKAB, Vattenfall is running a hydrogen gas pilot project for a fossil-free steel industry. Read more on page 57. Another example is the production of renewable fuel in collaboration with Preem.
Additionally, we offer corporate power purchase agreements, PPAs as described on page 41 to supply large customers with renewable energy and help them achieve their sustainability goals (e.g., agreement with Novo Nordisk and Novozymes).To meet customer and regulatory demands on quality of supply, our distribution busi-nesses are increasing their investments in networks, primarily in Sweden. In the Nordic region, we are working continuously to make the electricity grid less vulner-able by successively replacing overhead power lines with underground cables and replacing old equipment. In parallel with this, development of smart grid solutions is enabling us to reduce outage frequency and duration while allowing customers to monitor and steer their own energy use. Close cooperation and dialogue with our city partners – Berlin, Amsterdam and Uppsala – is strengthening our ability to develop the right solutions to meet their needs and be regarded as a reliable and trusted partner. One example is the signing of a ten-year contract with the City of Berlin for delivery of heat to municipal buildings.
Risks related to Sustainable Production
We will provide more renewable electric-ity generation and continue to develop, acquire and participate in projects and tenders for onshore and offshore wind farms. Vattenfall is prepared for the energy transition also in the heat and transporta-tion sectors. We have developed a CO2 roadmap with the purpose of fulfilling our commitment to enable a fossil free life within one generation. A key milestone on our journey is to phase out coal in our heat plants by 2030.
Risks• Our competitiveness could be reduced
by insufficient speed in developing our renewable production portfolio and phasing out fossil fuels. The lack of speed in the transition could commit us to less profitable technologies and result in a loss of market share.
• Offshore wind is becoming increasingly exposed to competition, entailing both profitability and growth risks.
• New players are entering the electricity value chain, leading to higher strategic
risks and competition with subsequent squeeze on margins.
• Investment risks, especially long-term market risk, related to a possible delayed phase-out of coal in Germany and/or prices for fossil fuels and carbon emis-sions deviating from our expectations.
Risk management activities during the yearAchieving our strategic target of reducing our CO2 exposure requires a stepwise phase-out of fossil fuels, starting with our most emissions-intensive assets. The switch from coal- to biomass- or gas-fired combined heat and power plants, as well as gas boilers, battery storage, and expansion of power-to-heat solutions, will provide greater flexibility and reduce CO2 emissions. In Berlin, Vattenfall reached the 50% CO2 emission reduction goal already by year-end 2017, three years earlier than initially agreed with the city. In 2018 we started a study on the financial, social, and environmental risks and opportuni-ties associated with switching our coal-
based assets to biomass. Our focus on integration of third-party heat will further decarbonise our district heating networks (e.g., producers of residual heat, such as Königliche Porzellan-Manufaktur in Berlin and data centres). To further diversify in renewables, we continue to invest in tech-nologies other than wind power, including solar power and battery storage, and new business models. In 2018 we built multiple solar farms around existing assets, such as in the Netherlands. In addition, Vattenfall is launching various start-up initiatives and collaborations – internal (e.g., GreenHouse) and external (e.g., Caterva) – as a way of broadening the palette of customised products. As subsidy levels for wind, solar, and battery projects decrease, Vattenfall is using all its expertise (including its past experience in delivering offshore wind farms, combining projects to achieve economies of scale and further deploying operational excellence) to ensure that its Levelised Energy Cost (LEC) remains competitive and declines faster than that of its key competitors.
64 Risks and risk management VATTENFALL ANNUAL AND SUSTAINABILITY REPORT 2018
Risks related to Empowered and Engaged People
We must ensure a safe work environment that attracts, engages and develops peo-ple with the right competences. We will continue to develop our culture, values and brand in our work on strengthening our identity and being clear about who we are, what we stand for, and what our purpose is.
Risks• Work environment risks for accidents
and incidents not only affect the indi-viduals concerned but also threaten workforce productivity and Vattenfall’s attractiveness as an employer.
• An inability to attract and retain people with key competences, and the risk of lower employee engagement for Vattenfall in connection with outsourc-ing and/or cost-cutting.
• Violations of our Code of Conduct and Integrity. Fraud and integrity risks could lead to loss of value and harm to our reputation resulting from incidents related to e.g., the Group’s assets, IT systems, information or personnel. The two greatest integrity risks identified within Vattenfall are non-compliance with competition laws and corruption.
Risk management activities during the yearHealth and Safety (H&S) is crucial and a guiding principle in our day-to-day opera-tions, where the goal is to have zero injuries and no work-related illnesses. Unfortu-nately two fatal accidents occurred during the year, and an increased focus on safety is required going forward. Lost Time Injury Frequency (LTIF) increased to 1.9 (1.5). The methodology for determining LTIF will be further examined in accordance with H&S incidents that occurred during the year. Monitoring and controlling H&S risks are covered in the various risk management systems of the respective Business Areas or Staff Functions. We perform thorough analyses of past accidents and create systems, routines and processes to detect and prevent future ones. To support our strategy of enabling fossil free living within one generation, we have put greater emphasis on hiring and developing talent in digitalisation and project manage-ment, among other areas. The developing digital transformation requires that we make cultural changes from “traditional” expectations (strict work regulations) to
proactive and solutions-oriented behav-iour (changes in working models) in more Vattenfall units. An employee activation programme is being used throughout the organisation to create clarity about our future goals and increase employee engagement.
The updated Code of Conduct and Integrity was adopted in 2018. We have zero tolerance for bribery and corrup-tion. To ensure compliance, we have implemented integrity instructions and conducted training and e-learning pro-grammes to increase awareness. Read more on page 61. The “four eyes principle” is applied to protect assets and informa-tion from improprieties and fraud.
Risks related to High Performing Operations
To be competitive and achieve our strategic objectives, we will intensify our activities. This includes raising our ambitions for efficiency and further reducing costs as well as focusing on sustainability throughout the value chain. Digitalisation will be crucial for achieving financially sustainable results.
Risks• Operational asset risks – for example,
nuclear power availability, dam failure, or damage to distribution networks – could have significant negative financial and non-financial consequences. Climate change also poses a risk for operations. See example on page 66.
• Political risks, e.g., changes in climate-related policy or environmental regula-tions, could negatively affect business development or restrict our operations or permits. This includes the decision on a new revenue regulation for Distribution System Operators in Sweden for the period 2020–2023, long permit proce-dures for wind power and the discussion in Sweden on the licence to build a final repository for spent nuclear fuel.
• Breaches of our Code of Conduct for Sup-pliers, such as human rights violations in the supply chain, could result in supply interruptions that delay construction projects or disrupt operations, negative
impacts on the brand and trust, or could lead to the loss of our licence to operate.
• Environmentally hazardous emissions risks related to, for example, accidents or incidents resulting from an explo-sion, fire, oil spill or leak of hazardous substances, could have financial, non-financial, and regulatory repercussions.
• Given the data we collect, the smart ser-vices we offer and critical infrastructure we operate, we face many forms of cyber risk, including phishing and digital trust, as well as data and privacy breaches.
Risk management activities during the yearThe management of operational asset risks involves a systematic inspection programme, continuous control of plant conditions, and effective maintenance. Our maintenance strategy ensures safe and reliable operations while also reduc-ing maintenance costs. New methods of monitoring and predictive maintenance are being deployed.
Warm weather in Sweden forced us to temporarily shut down the Ringhals 2 nuclear reactor. This and other climate- related risks are managed within the Risk Management Framework.
We have a Code of Conduct for Sup-pliers and perform risk assessments and
reviews of our suppliers. We expanded our human rights efforts internally and throughout our value chain.
Environmental risks are managed by the respective Business Areas. The Vattenfall Environmental Management System is part of our overarching Vattenfall Manage-ment System. See page 76. We monitor local or regional developments concerning environmental permits, which is important as our portfolio continues to diversify by region and technology.
Information is considered a critical asset, and information security is governed by our Information Security Management System. In the course of our activities we collect, store and process personal data about our employees, customers, suppli-ers and other third parties. Vattenfall has implemented appropriate technical and organisational measures to ensure that personal data is processed in accordance with data protection laws and regulations, such as the GDPR. Regarding cyber risk in critical infrastructure, information security and physical security measures are being implemented. These include, for example, separation of critical IT systems from other IT applications, restriction of physical access to selected personnel, background screening (vetting) of personnel and the setting up of Business Continuity Plans.
VATTENFALL ANNUAL AND SUSTAINABILITY REPORT 2018 65Risks and risk management

Market risk – commodities including electricityMarket risk for electricity and commodi-ties refers to the risk of Vattenfall failing to achieve its financial targets as a result of an adverse change in commodity prices. Vattenfall’s price hedging strategy is focused on the Nordic generation assets.
Risk management activitiesThrough our asset ownership and sales activities, we are exposed to electricity, fuel, and CO2 emission allowance prices, which are affected by several fundamental factors, such as the global macroeco-nomic situation, local supply, demand, and political decisions. We are active in the wholesale trading market and hedge our electricity position and fuel require-ments through physical and financial forward contracts and long-term customer contracts. These contracts pertain to time horizons in which there is no pos-sibility to hedge prices in the liquid part of the futures market and stretch as far as 2026. Most volumes are hedged at the beginning of this time horizon, with falling volumes towards the end. The Vattenfall Risk Committee (VRC) decides how much generation is to be hedged within the mandates issued by the Board of Directors. To measure electricity price risk, we use methods such as Value at Risk (VaR) and Gross Margin at Risk along with various stress tests. The price risk for uranium is limited, as uranium accounts for a relatively small share of the total cost of nuclear power generation. With the current portfo-lio structure, the dominant risk exposure is
now coupled to Nordic nuclear and hydro power base load generation. In addition, Vattenfall’s operations generate a substan-tial share of regulated revenue from elec-tricity distribution, heat and wind power, which reduces the total risk exposure on the Continent (Germany, the Netherlands and the UK). Vattenfall continues to have some price exposure between electricity and used fuel/emissions on the Continent. Such exposure has a lower risk profile than the outright power exposure in the Nordic countries. The market price risk of Vattenfall’s production assets and hedges for electricity, fuel prices and emissions as well as the ancillary trading market price risks are monitored daily.
Nordic marketThe table below shows the average prices achieved as per 31 December 2018, while the chart above at right shows the esti-mated achieved financial hedge ratio. The hedge ratio has been estimatee based on an internal risk management model that uses simulations to reflect – in a realistically interlinked way – both future possible price scenarios and the volume risk associated with hydro power generation.
Average indicative Nordic hedge prices as per 31 December 2018
EUR/MWh 2019 2020 2021
Nordic1 29 31 331 Including remaining price hedges on the Continent.
Continental marketDue to the combined effect various commodity price changes have on the Continental portfolio, the table below shows the individual impact of changes in commodity prices on expected future operating profit before tax as well as the observed yearly volatility of relevant com-modities. This sensitivity analysis includes both the expected production and hedge levels. However, it does not reflect pos-sible changes in expected generation in response to changes in price levels nor the interrelationship between fuel and power prices. Both of these factors tend to reduce the impact.
The effect of price movements on future operating profit before tax increases as the share of exposure that is not hedged increases. The exposure for the next-com-ing year is hedged to a higher degree than the exposure that is expected three years ahead. The presented analysis is based on the assumption that risks are independ-ent of each other. Prices and positions are stated as per 29 December 2018. For example, a movement of +10% in the price of electricity in 2019 would have an impact on operating profit of SEK +2,184 million. Observed yearly volatilities during 2018 are shown in the far-right column in the table to the left. The chart on the next page visualises the information shown in the sensitivity table.
Vattenfall’s estimated Nordic hedge ratio (%) as per 31 December 2018
0
20
40
60
80
100
202120202019
%
69%
37%
18%
Rising mean temperatures could lead to reduced revenues due to lower sales of heat
Rising mean temperatures1 for northern and Central Europe could negatively influence heat demand. This can be estimated by looking at the heating degree days (HDDs) in Europe, which decreased on average by 9.9 HDDs (0.45%) per year2 from 1981 to 2014. Fewer HDDs could reduce demand for heat, and therefore sales.
A scenario analysis for 2030 shows a decrease in sales volume of heat by 1–2 TWh,
corresponding to an estimated financial impact of SEK 1 billion (assuming the current European average price of approximately 200 SEK/GJ for district heating).
To compensate for this we are working to increase our customer base in both district heating and decentralised heating solutions and to broaden our product offering (e.g., cool-ing solutions). We have set ambitious targets for climate neutrality and will drive the transition
towards fossil-free heating solutions together with cities and regions. During the period of 2019–2020, Vattenfall will invest SEK 3 billion in growth related to our district heating networks.
1 The mean temperature is expected to increase by 0.5–2°C (2050) in northern and Central Europe depending on geographical loca-tion, according to the German Environmental Agency, UK Climate projections and the Swedish Energy Agency.
2 EEA: https://www.eea.europa.eu/data-and-maps/indicators/ heating-degree-days
Market-quoted risks+/–10% impact on future profit
before tax, SEK million1Observed yearly
volatility2, %
2019 2020 2021
Electricity +/– 2,184 +/– 2,006 +/– 1,962 21%–23%
Coal –/+ 403 –/+ 355 –/+ 293 21%–24%
Gas –/+ 964 –/+ 841 –/+ 790 18%–21%
CO2 –/+ 513 –/+ 575 –/+ 623 46%–48%1 The denotation +/– entails that a higher price affects operating profit favourably, and –/+ vice versa.2 Observed yearly volatility in 2018 for daily price movements for each commodity, based on forward contracts
for the period 2019–2021. Volatility normally declines the further ahead in time the contract pertains to.
66 Risks and risk management VATTENFALL ANNUAL AND SUSTAINABILITY REPORT 2018

Volume riskVolume risk pertains to the risk for deviations between anticipated and actual delivered volume.
Risk management activitiesIn hydro power generation, volume risk is managed by analysing and forecasting historical weather data, including such
factors as precipitation and snowmelt. District heating volumes are managed by improving and developing forecasts for heat consumption. There is a correlation between electricity prices and gener-ated electricity volume. Volume risk also arises in the sales activities as deviations in the anticipated volumes against actual
volumes delivered to customers. Here, too, improved monitoring and forecast-ing capabilities are the most efficient risk management instruments.
Liquidity riskLiquidity risk refers to the risk of Vattenfall not being able to finance its capital needs and arises if asset values at maturity do not match those of liabilities and other deriva-tives.
Risk management activitiesAccess to capital and flexible financing solutions are ensured through several types of debt issuance programmes and credit facilities. The maturity profile of our debt portfolio is shown in the chart below.
The Group has a defined target for its short-term accessibility to capital. The goal is that funds corresponding to no less than 10% of the consolidated net sales, or the equivalent of 90 days’ stressed liquidity needs of the business (whichever is higher) shall be available. As per 31 December 2018, available liquid assets and/or com-mitted credit facilities amounted to 35% (28%) of consolidated net sales. Vattenfall is committed to maintaining financial stability, which is reflected in the company’s
long-term targets for capital structure. On 8 November 2018 Standard & Poor’s affirmed Vattenfall’s long-term BBB+ rating and short-term A-2 rating. On 4 October 2018 Moody’s affirmed Vattenfall’s long-term A3 rating and Baa2 rating for hybrid bonds. The outlook for Vattenfall’s rating was revised from negative to stable by both Moody’s and Standard & Poor’s in 2017. Vattenfall foresees a refinancing need at the end of 2019 at the earliest.
Ancillary tradingIn addition to commodity market risk resulting from our assets and sales activi-ties, Vattenfall’s Board of Directors has given the CEO a risk mandate to allow discretionary risk-taking and trading in the wholesale market. Most of our risk exposure in the ancillary trading portfolio is based on market prices (mark-to-market). In cases where market prices cannot
be observed, modelled prices are used (mark-to-model). Mark-to-model positions arise mainly in asset- and sales-related portfolios, see Note 36 to the consolidated accounts, Financial instruments. Manage-ment of such valuation models is strictly regulated, and approval is required from the risk organisation before they may be used.
Sensitivity analysis – impact of price movements (+/–10%) on operating profit
0
1,000
2,000
3,000
4,000
5,000
202120202019
SEK million
Electricity Coal
Gas CO2
Maturity profile for Vattenfall’s loans as per 31 December 20181
1 Excluding loans from minority owners and associated companies.
0
3,000
6,000
9,000
12,000
15,000
18,000
21,000
>4443424140393837363534333231302928272625242322212019
SEK million
Debt Hybrid capitalCommitted credit facilities (unutilised)
VATTENFALL ANNUAL AND SUSTAINABILITY REPORT 2018 67Risks and risk management
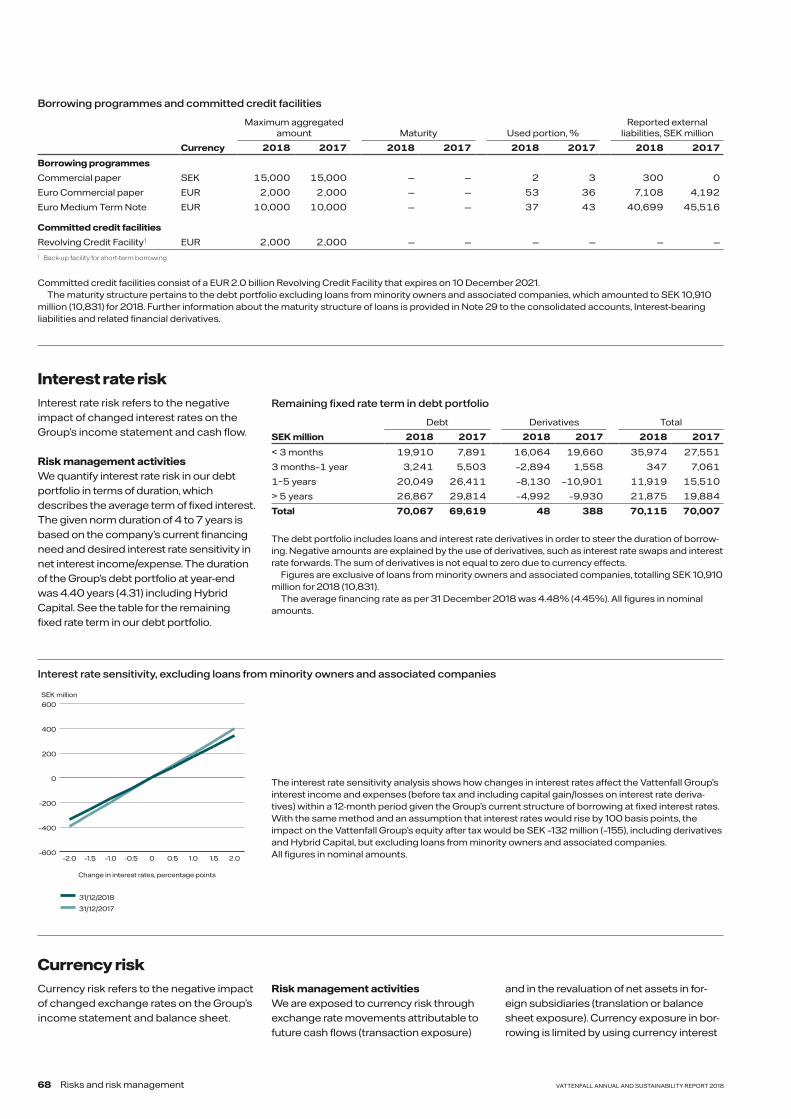
Currency riskCurrency risk refers to the negative impact of changed exchange rates on the Group’s income statement and balance sheet.
Risk management activitiesWe are exposed to currency risk through exchange rate movements attributable to future cash flows (transaction exposure)
and in the revaluation of net assets in for-eign subsidiaries (translation or balance sheet exposure). Currency exposure in bor-rowing is limited by using currency interest
Interest rate sensitivity, excluding loans from minority owners and associated companies
The interest rate sensitivity analysis shows how changes in interest rates affect the Vattenfall Group’s interest income and expenses (before tax and including capital gain/losses on interest rate deriva-tives) within a 12-month period given the Group’s current structure of borrowing at fixed interest rates.With the same method and an assumption that interest rates would rise by 100 basis points, the impact on the Vattenfall Group’s equity after tax would be SEK –132 million (–155), including derivatives and Hybrid Capital, but excluding loans from minority owners and associated companies.All figures in nominal amounts.–600
–400
–200
0
200
400
600
2.01.51.00.50-0.5–1.0–1.5–2.0
SEK million
Change in interest rates, percentage points
31/12/2018
31/12/2017
Interest rate riskInterest rate risk refers to the negative impact of changed interest rates on the Group’s income statement and cash flow.
Risk management activitiesWe quantify interest rate risk in our debt portfolio in terms of duration, which describes the average term of fixed interest. The given norm duration of 4 to 7 years is based on the company’s current financing need and desired interest rate sensitivity in net interest income/expense. The duration of the Group’s debt portfolio at year-end was 4.40 years (4.31) including Hybrid Capital. See the table for the remaining fixed rate term in our debt portfolio.
Remaining fixed rate term in debt portfolio
Debt Derivatives Total
SEK million 2018 2017 2018 2017 2018 2017
< 3 months 19,910 7,891 16,064 19,660 35,974 27,551
3 months–1 year 3,241 5,503 –2,894 1,558 347 7,061
1–5 years 20,049 26,411 –8,130 –10,901 11,919 15,510
> 5 years 26,867 29,814 –4,992 –9,930 21,875 19,884
Total 70,067 69,619 48 388 70,115 70,007
The debt portfolio includes loans and interest rate derivatives in order to steer the duration of borrow-ing. Negative amounts are explained by the use of derivatives, such as interest rate swaps and interest rate forwards. The sum of derivatives is not equal to zero due to currency effects.
Figures are exclusive of loans from minority owners and associated companies, totalling SEK 10,910 million for 2018 (10,831).
The average financing rate as per 31 December 2018 was 4.48% (4.45%). All figures in nominal amounts.
Borrowing programmes and committed credit facilities
Maximum aggregated amount Maturity Used portion, %
Reported external liabilities, SEK million
Currency 2018 2017 2018 2017 2018 2017 2018 2017
Borrowing programmes
Commercial paper SEK 15,000 15,000 — — 2 3 300 0
Euro Commercial paper EUR 2,000 2,000 — — 53 36 7,108 4,192
Euro Medium Term Note EUR 10,000 10,000 — — 37 43 40,699 45,516
Committed credit facilities
Revolving Credit Facility1 EUR 2,000 2,000 — — — — — —1 Back-up facility for short-term borrowing.
Committed credit facilities consist of a EUR 2.0 billion Revolving Credit Facility that expires on 10 December 2021.The maturity structure pertains to the debt portfolio excluding loans from minority owners and associated companies, which amounted to SEK 10,910
million (10,831) for 2018. Further information about the maturity structure of loans is provided in Note 29 to the consolidated accounts, Interest-bearing liabilities and related financial derivatives.
68 Risks and risk management VATTENFALL ANNUAL AND SUSTAINABILITY REPORT 2018

Credit riskCredit risk can arise if a counterparty cannot or fails to meet its obligations and exists in all parts of Vattenfall’s operations.
Risk management activitiesWe have a strict framework for govern-ing and reporting credit risks to ensure
that risks are monitored, measured and minimised so that the total credit exposure is kept within the Group’s risk appetite. The company’s credit risk management involves the analysis of its counterparties, reporting of credit risk exposures, contract negotiations and proposals for risk mitiga-
tion measures (e.g., obtaining collateral). Credit risk exposure per rating class in SEK million is shown in the chart below.
Debt portfolio, breakdown per currency
Debt Derivatives Total
Original currency 2018 2017 2018 2017 2018 2017
DKK 2,148 0 – – 2,148 0
EUR 42,026 43,843 5,830 5,597 47,857 49,440
GBP 11,724 11,457 –3,056 –2,958 8,668 8,500
JPY 1,874 1,925 –1,874 –1,925 0 0
NOK 564 547 –564 –547 0 0
PLN 0 0 – – 0 0
SEK 8,148 8,563 3,294 3,504 11,442 12,068
USD 3,582 3,283 –3,582 –3,283 0 0
Total 70,067 69,619 48 388 70,115 70,007
The table shows currency risk in the debt portfolio and the currencies that Vattenfall is exposed to. The level of debt, and thus the currency risk, decreased in 2018 compared with 2017. Figures above are exclusive of loans from minority owners and associated companies, totalling SEK 10,910 million (10,831). All figures are in nominal amounts.
Consolidated operating income and expenses per currency, %
Income Expenses
Currency 2018 2017 2018 2017
EUR 79% 83% 85% 69%
SEK 13% 14% 3% 11%
GBP 6% 1% 5% 16%
DKK 1% 1% 1% 1%
Other 1% 1% 6% 3%
Total 100% 100% 100% 100%
The values are calculated based on a statistical compilation of external operating income and expenses. Changes in inventories and investments are excluded.
The chart shows exposures to Vattenfall’s counterparties where the exposure is greater than SEK 50 million per counterparty, broken down per rating clas-sification according to Standard & Poor’s rating scale. Counterparties are reviewed and approved in line with Vattenfall’s credit mandates and policies.Smaller exposures are considered to have such a large diversification effect that the net risk for Vattenfall is judged to be low. Exposures in procurement, sales in France, and heat are not included. Other financial assets (that are neither past-due nor impaired) are considered to have good creditworthiness.The values for “Other” in the chart include mostly counterparties covered by policy and limit exceptions, mainly pertaining to long-term sales contracts.
Counterparty exposure per rating class
20182017
0
2,000
4,000
6,000
8,000
10,000
12,000
14,000
OtherBBB-BBBBBB+A-AA+AA-AAAA+AAA
SEK million
rate swaps. We strive for an even maturity structure for derivatives. Derivative assets and derivative liabilities are reported in Note 36 to the consolidated accounts, Financial instruments. We have limited transaction exposure, since most generation, distribu-tion and sales of electricity take place in the respective local markets. Sensitivity to currency movements is therefore relatively low. All transaction exposure that exceeds a nominal value equivalent to SEK 10 million is to be hedged immediately when it arises. The target for hedging translation expo-sure is to, over time, match the currency composition in the debt portfolio with the currency composition of the Group’s funds from operations (FFO). Vattenfall’s largest exposure is in EUR, totalling SEK 76,999 million (2017: 71,333). Of this amount, 39% (43%) was hedged at year-end. For further information, see Note 38 to the consolidated accounts, Specifications of equity. With respect to currency move-ments, a 5% change in exchange rates, for example, would affect the Group’s equity by approximately SEK 2.9 billion (2.7), where a strengthening of the currencies shown in the table in Note 38 to the consolidated accounts, Specifications of equity, would result in a positive change in equity.
VATTENFALL ANNUAL AND SUSTAINABILITY REPORT 2018 69Risks and risk management
The following pages include information on corporate governance during the 2018 financial year, as prescribed by law and the Swedish Corporate Governance Code.
Supported by good corporate governance – with effective organisational structure, internal control and risk management – Vattenfall’s business can be driven towards
the set targets and in accordance with Vattenfall’s principles. The Corporate Governance Report has been reviewed by the company’s external auditor.
Corporate Governance
Report
70 Corporate Governance Report VATTENFALL ANNUAL AND SUSTAINABILITY REPORT 2018

Vattenfall’s corporate governance modelThe Parent Company of the Vattenfall Group, Vattenfall AB, is a Swedish public limited liability company with registered office in Solna. Vattenfall AB is thereby subject to the provisions of the Swedish Companies Act. The main decision-making bodies are the Annual General Meet-ing (AGM), the Board of Directors, and the President. The Board of Directors is elected by the Annual General Meeting. The Board, in turn, appoints the President, who is responsible for the day-to-day administration of the company in accord-ance with the Board’s guidelines and instructions.
Application of the CodeVattenfall adheres to the Swedish Cor-porate Governance Code (“the Code”). However, since Vattenfall is wholly owned by the Swedish state, certain stipulations in the Code are not applicable. This applies to the matter of reporting on board members’ independence, regulated in point 4.4 and 4.5, among other things. In addition, Vattenfall also deviates from the Code with respect to the following points:
Point 1.3, pertaining to the requirement that the nomination committee shall pro-pose a person to serve as AGM chairman. Due to its ownership structure, Vattenfall has no nomination committee. Election
of an AGM chairman is done at the AGM in accordance with the stipulations of the Swedish Companies Act and the Swedish state’s ownership policy.
Chapter 2, pertaining to the requirement that the company shall have a nomination committee. The nomination process for the Board and auditors is conducted in accord-ance with the Swedish state’s ownership policy and is described below. Thus, the references to the nomination committee in points 1.2, 1.3, 4.6, 8.1 and 10.2 are not applicable either. However, information on the nomination of board members for new election or re-election is posted on the com-pany’s website in accordance with point 2.6.
Vattenfall AB’s Articles of Association and continuously updated information about corporate governance at Vattenfall are available on Vattenfall’s website: vattenfall.com (original Swedish documents are available on vattenfall.se). The website is also a source for previous corporate governance reports and documentation from the most recent general meetings, and links to the Swedish state’s ownership policy, the Swedish Corporate Governance Code and Vattenfall’s Code of Conduct and Integrity.
Important external and internal rules and regulations for Vattenfall
External rules and regulations• Swedish and foreign legal rules, particularly the Swedish
Companies Act and the Swedish Annual Accounts Act
• The Swedish state’s ownership policy
• The Swedish Corporate Governance Code (“the Code”)
• Stock exchange rules1
• International Financial Reporting Standards (IFRS) and other accounting rules
• The Global Reporting Initiative (GRI) Standards and UN Global Compact
Internal rules• The Articles of Association
• The Board’s and committees’ Rules of Procedure, including the CEO’s instruction and the instruction for reporting to the Board
• The Vattenfall Management System (VMS), including the Code of Conduct and Integrity, and other internal govern-ance documents
1 Vattenfall follows the stock exchange rules that apply for companies that have fixed-income instruments registered on Nasdaq Stockholm and other marketplaces.
Governance and reporting structure
Business Areas and Staff Functions according to organisational structure
Remuneration Committee
Shareholder via the AGM
Board of Directors
CEO and EGM
Auditor
Audit Committee
Internal Audit
VATTENFALL ANNUAL AND SUSTAINABILITY REPORT 2018 71Corporate Governance Report

Shareholder and general meetingsVattenfall AB is wholly owned by the Swed-ish state. The shareholder’s right to make decisions about Vattenfall’s affairs is exer-cised at the Annual General Meeting and other general meetings. Through a general meeting resolution on the content of the Articles of Association, the owner makes decisions on the company’s operations. The Swedish state’s ownership policy and the guidelines for external reporting in state-owned companies are decided on at the general meeting. In accordance with the Swedish state’s ownership policy, the company’s financial targets are also decided on by a general meeting.
By law, the AGM of Vattenfall AB is to be held yearly within six months after the end of the financial year and not later than 30 April in accordance with the Swedish state’s ownership policy. Notice of the AGM
is issued not earlier than six weeks and not later than four weeks before the meeting is to be held.
Annual General Meeting 2018Vattenfall held its 2018 AGM on 25 April. The company’s owner, the Swedish state, participated at the AGM through its owner representative. The President, auditor and quorumed Board were also in attend-ance. Members of Parliament were given the opportunity to ask questions during the AGM, and an open Q&A session was arranged after the meeting, in accordance with the Swedish state’s ownership policy. The AGM was open to the general public and was aired live via webcast.
The 2019 AGM will be held on 11 April in Solna, Sweden.
Board of Directors
The Board’s dutiesThe Board’s fundamental duties are laid out in the Swedish Companies Act and the Code. Each year, the Board adopts its Rules of Procedure and a number of instructions. The Rules of Procedure and instructions regulate such matters as reporting to the Board, allocation of duties between the Board, the President and the Board’s committees, the Chairman’s duties, the form and content of board meetings, and the evaluation of the work of the Board and the President.
The Board’s Rules of Procedure stipulate that the Board shall set the overarching targets for Vattenfall’s operations, decide on Vattenfall’s strategy for achieving those targets, and ensure that suitable systems are in place for monitoring and controlling Vattenfall’s operations, risks and financial position in respect of the set targets. The
Board is responsible for approving major investments, acquisitions and divestments, and for adopting central policies and instructions. Part of this is to define appro-priate guidelines to govern the company’s conduct in society, with the aim of ensuring its long-term value creation capability. The Board shall also approve certain important contracts, including contracts between Vattenfall and the President and other senior executives. The Board’s duties per-tain to Vattenfall AB as well as the Vattenfall Group. Vattenfall’s General Counsel serves as secretary to the Board of Directors.
The Chairman leads the work of the Board in accordance with the Swedish Companies Act and the Code and is responsible for – among other things – ensuring that the board members receive relevant information, contacts with the owner on ownership matters, and serving as a liaison between the owner and the Board. According to the Rules of Procedure,
the Board – through the Chairman – shall coordinate its views with representatives of the owner when the company is facing particularly important decisions.
Board meetingsAccording to the Board’s Rules of Proce-dure, the Board shall hold eight to twelve regular board meetings every year. In addition to the regular meetings, the Board is convened when necessary. The agenda of every regular meeting shall include the following items of business:
• The Group’s business situation
• Financial report for the Group
• Reports from board committees, when committee meetings have been held
• Matters that are not handled by the Pres-ident in the day-to-day administration
• Other matters of material importance for the Group
The Board’s yearly planning
Report from the auditors, nomination of auditor, annual accounts, dividend, report-ing on major disputes and integrity reports
Annual and Sustainability Report, AGM notice
Brand strategyStrategic sustainability issues
Half-year interim report, reporting on major disputes
Nine-month interim report, report on safety and threat landscape
First quarter interim report, strategic personnel issues, diversity and equal opportu-nity plan, risk mandate and risk policy, and statutory board meeting following the AGM
Strategic plan, R&D strategy, nuclear power and dam safety
Business, investment and financing plans, auditor’s interim review, guidelines for remunera-tion of senior executives, overall remuneration principles within Vattenfall, Internal Audit’s budget and plan, issues regarding human rights and UK Modern Slavery Act statement, tax policy, evaluation of the Board and President
Q1 Q2 Q3 Q4
Duties of the Annual General Meeting • Elect the Board of Directors, the
Chairman of the Board and the auditors, and decide on their fees
• Adopt the income statement and balance sheet for Vattenfall AB and the Vattenfall Group
• Decide on distribution of the com-pany’s profit
• Grant discharge from liability for the board members and the President
• Decide on guidelines for remunera-tion of senior executives
• Decide on other matters of busi-ness prescribed by law or the company’s Articles of Association
72 Corporate Governance Report VATTENFALL ANNUAL AND SUSTAINABILITY REPORT 2018
The Board’s main items of business in 2018• Items according to the Rules of
Procedure
• The energy transition to a fossil-free future
• New Code of Conduct and Integrity
• New Sustainability Policy, Environmen-tal Policy and Human Rights Policy
• Owner’s sustainability analysis of Vattenfall with focus area human rights
• Cost-cutting and cost-cutting targets
• Outsourcing in HR, Finance and Procurement
• Brand strategy
• Financing
• Investments in new wind farms
• District heating investments
• Divestment of the district heating business in Hamburg
• Acquisition items
• Research and development project on fossil-free steel (“HYBRIT”)
• Office locations in Berlin and Hamburg as well as Nordic real estate items
• Issues related to the General Data Protection Regulation (GDPR)
In addition, certain items of business are included on the agenda every year, in accordance with the yearly planning in the Board’s Rules of Procedure. Investments approved by the Board are followed up by the Board one year after their commercial operation date. Strategy issues are dis-cussed in more detail at an annual board seminar. The Executive Group Manage-ment participates at the board seminars.
The Board met ten times in 2018, includ-ing the statutory meeting.
Appointment of the BoardFor companies that are wholly owned by the Swedish state, uniform and joint prin-ciples for a structured nomination process apply. These principles are set forth in the Swedish state’s ownership policy and supersede the Code’s rules on drafting work for decisions on the nomination of board members and auditors.
The board nomination process in the Swedish Government Offices is coordi-nated by the Ministry of Enterprise and Innovation. The competency needs are analysed on the basis of the company’s operations, situation and future challenges as well as the Board’s composition and evaluations of the Board that have been carried out. Included in the Government Offices’ nomination process is a continu-ous evaluation of all state-owned company boards. Thereafter, any recruitment needs are determined and recruitment work is initiated. Once this process has been completed, the nominations are publicly announced in accordance with the Code; however, no account is made regarding directors’ independence vis-à-vis the com-pany, the company’s management and the owner. Vattenfall provides orientation training for new directors who are elected by the AGM.
The Swedish state’s ownership policy, which is the diversity policy applied with regard to the Board, stipulates that the selection of board members shall be made from a broad recruitment pool in the aim of soliciting expertise of both women and men as well as persons with varying back-grounds and experience. Discrimination based on gender, transgender identity or
expression, ethnic origin, religion or other faith, functional disability, sexual orientation or age may not take place.
At the 2018 AGM the owner’s representa-tive presented a motivating statement on the Board’s composition as well as on the changes that had been proposed. In sum-mary, the Board’s composition – in respect of the company’s operations, stage of development and conditions in general – was judged to be suitable and distin-guished by diversity and breadth regarding the directors’ competence, experience and backgrounds, as well as fulfilling the govern-ment’s goal on gender balance.
More detailed information on the board nomination process is provided in the Swedish state’s owner policy, at regeringen.se.
The Board’s compositionVattenfall’s Articles of Association stipulate that the Board of Directors shall have, in addition to the employee representatives, a minimum of five and a maximum of ten members without deputies. The directors are elected annually by the Annual General Meeting, which also elects the Chairman of the Board.
In 2018 the Board was composed of eight directors elected by a general meeting. No member of the Executive Group Manage-ment (EGM) was a director on the Board. Lars G. Nordström was Chairman of the Board. By law, the unions are entitled to appoint three board members plus three deputies, and they exercised this right. All directors were Swedish citizens. Biographi-cal information about the board members is provided on pages 80–81.
Sustainability issues addressed by the BoardBased on a decision by the Swedish Parlia-ment in 2010, Vattenfall AB’s Articles of Association stipulate that Vattenfall shall operate a commercial energy business that enables the company to be among the leaders in developing environmentally sustainable energy production.
The Swedish state’s ownership policy stipulates that companies with state owner-ship shall integrate sustainability in their
corporate governance and act exemplarily in this area. The companies are to operate in a manner that promotes sustainable devel-opment, i.e., “a development that meets the needs of today without jeopardising future generations’ ability to meet their needs”. Of particular importance is that companies with state ownership promote a healthy and safe work environment, respect for human rights, good and decent working conditions, equality and diversity, reduced climate and environmental impact, good business ethics and active work on anti-corruption, and that they ensure that no abuses occur due to their special status of being state-owned and exhibit responsible conduct in the tax area.
The annual planning for the Board and its committees includes recurring items in several of the areas identified by the owner. These areas are furthermore included as an integral part of the handling of concrete Board matters and are also handled by the Executive Group Management. The Board has also stressed that Vattenfall’s four strategic objectives in themselves constitute sustainability objectives and that one aim is that sustainability issues should be an integral part of Vattenfall’s opera-tions. Among others, sustainability issues such as climate related consequences of CO2 emissions are included in the Board’s handling of the strategy and in the business planning process.
The Board has adopted an overarching sustainability policy as a complement to individual policies, such as the human rights policy, the environmental policy and the Code of Conduct and Integrity. The sustainability policy stipulates that for Vattenfall, sustainability entails taking responsibility for future generations by contributing to sustainable development in society – economically, environmentally and socially. Further highlighted is that access to energy is a precondition for our society to function and to develop in a sustainable way. The sustainability policy also stipulates that Vattenfall’s sustainability focus extends throughout its value chain, from suppliers to customers and partners as well. The com-pany shall leverage partnerships to maxim-ise its contribution to a fossil-free society.
VATTENFALL ANNUAL AND SUSTAINABILITY REPORT 2018 73Corporate Governance Report

Guidelines for directors’ feesDirectors’ fees and fees for committee work are set by the owner at the AGM, in accordance with the Swedish state’s ownership policy. The 2018 AGM resolved in favour of increased fees to be paid to the Chairman and the directors on the Board, while the fees to be paid to committee members and chairs were unchanged. Information on directors’ fees in 2018 is provided in the Annual and Sustainability Report, Note 42 to the consolidated accounts, Number of employees and personnel costs.
Evaluation of the Board’s and the President’s workThe Board evaluates its own work and the President’s work once a year as part of efforts to develop the Board’s work forms and effectiveness. This evaluation is conducted under the direction of the Chairman and is reported to the Board and the owner. The most recent board evalu-ation was begun at the board meeting on 29 October 2018. As in previous years, with the support of external consultants, the Board conducted a self-assessment using questionnaires, where the individual board members evaluated both their own and other board members’ performance. This evaluation used a questionnaire for
the Board as a whole, which each of the directors and deputy directors responded to, and a questionnaire for evaluation of the individual directors, responded to by the directors elected by a general meeting. The questions addressed Vattenfall’s current challenges, management and organisation, the Board’s effectiveness, composition and expertise, and its relationship with the owner, the Chairman and the President. The evaluation was reported on and discussed at the board meeting on 6 February 2019. As a follow-up to the written evaluation, the Chairman held discussions individually on a voluntary basis with each of the directors elected by a general meeting and jointly with the employee representatives.
Board committees The Board has established two commit-tees, which are described below, and has established Rules of Procedure for these. At the statutory board meeting, the Board appointed a number of directors elected by a general meeting for each committee, of whom one serves as committee chair. In addition, the Board can, where necessary, establish other board committees or tem-porary work groups to address matters in defined areas. No such additional commit-tees or temporary work groups were active in 2018. Information on the committees’ composition is provided on pages 80–81.
The committees report their work to the Board at the next regular board meeting, whereby the committee chair presents a report accompanied by minutes from the committee meetings. Except for a few mat-ters handled by the Audit Committee, the committees are only drafting bodies and make recommendations to the Board. The Board’s legal responsibility under company law for the company’s organization and administration of the company’s affairs is not constrained by the committees’ work.
Remuneration CommitteeThe Remuneration Committee’s duties include serving as a drafting body to ensure implementation and compliance with guidelines for remuneration of senior exec-utives. Where applicable, it conducts draft-ing work for any special reasons that may exist in an individual case to deviate from the guidelines. It also conducts work for the Board’s report on remuneration of senior executives in the annual report and, ahead of the Annual General Meeting, monitoring and following up the auditors’ review.
The President serves in a reporting role on the Remuneration Committee.
Audit CommitteeThe Audit Committee is responsible for meeting with Vattenfall AB’s external and internal auditors on a regular basis in order to stay informed about the planning, focus and scope of the company’s audit. The Audit Committee is also responsible for discussing coordination of the external and internal audit work and views of the company’s financial risks. The commit-tee prepares Internal Audit’s budget, the Internal Audit Charter and the internal audit plan for resolution by the Board. It has the right, on behalf of the Board, to decide on guidelines for other services than audit-ing that Vattenfall may procure from the Group’s auditors.
The Audit Committee meets prior to Vattenfall’s publication of interim reports and when warranted by the prevailing con-ditions. The CFO and head of Internal Audit serve in a reporting role. The company’s external auditors attend all regular meet-ings and report on their observations of the audit. During the entire year 2018, the committee had at least one member with accounting or auditing competence.
The Audit Committee’s most important duties are:• To oversee Vattenfall’s financial
reporting, including sustainability reporting
• With respect to financial reporting, to monitor the effectiveness of Vattenfall’s internal control, internal audit and risk management
• To stay informed about the audit of the annual report and consolidated accounts as well as about the conclusions of the Supervisory Board of Public Accountants’ (“Revi-sorsnämnden”) quality control of auditing activities performed by the company’s auditor
• To review and monitor the auditor’s impartiality and independence
• To assist in the drafting of recom-mendations for decisions on the election of auditor by the Annual General Meeting
• To review and oversee the manage-ment of market and credit risks
• To conduct an annual evaluation of the external auditors’ work
The Remuneration Committee’s most important duties are:• To conduct drafting work for board
decisions on matters regarding remu-neration principles, and on remunera-tion and other terms of employment for members of the Executive Group Man-agement and other senior executives
• To monitor and evaluate application of the guidelines for remuneration of sen-ior executives, which the AGM, by law, is required to decide on as well as the applicable remuneration structures and levels of remuneration in the company
• To conduct drafting work for the Board’s decisions regarding over-arching remuneration principles in general, such as the general existence of, amount and structure of variable remuneration (for employees who are not senior executives)
74 Corporate Governance Report VATTENFALL ANNUAL AND SUSTAINABILITY REPORT 2018

AuditorThe Swedish state’s ownership policy stipulates that the owner is responsible for election of auditors and that the auditors are to be appointed by the Annual General Meeting. Proposals for election of auditors and for auditors’ fees are submitted by the Board and drafted by the company. The auditors are elected for a mandate period of one year, in accordance with the main rule in the Swedish Companies Act. Vattenfall’s Articles of Association stipulate that the company shall have one or two auditors with or without one or two deputy auditors, or a chartered accounting firm as auditor.
At the 2018 AGM, the accounting firm Ernst & Young AB was re-elected as audi-tor. The accounting firm appointed Author-ised Public Accountant Staffan Landén as auditor-in-charge. He has held this position since the 2015 AGM. Staffan Landén is also the auditor of, among others, Alfa Laval AB, Nederman Holding AB, Semcon AB
and Polygon AB, and is a stock exchange auditor appointed by Nasdaq Stockholm. The auditor has no assignments with companies that affect its independence as auditor of Vattenfall.
The auditor’s audit assignment includes a review of the annual report, the consoli-dated accounts, the corporate governance report and the sustainability reporting. The auditor has access to minutes of board meetings and board committee meetings, as stipulated in the Board’s Rules of Proce-dure. The Audit Committee has approved guidelines for how procurement of other services than auditing shall take place from the auditor. Consulting services provided by Ernst & Young AB from 2016 to 2018 mainly pertained to tax and accounting issues and studies of organisational issues.
At the 2018 AGM the auditor reported on the audit work in 2017 and on its review of compliance with the guidelines for
remuneration of senior executives. The auditor reported on its review of the year-end accounts for 2018 to the entire Board at the board meeting on 6 February 2019 (without the presence of any person from the Executive Group Management), and also reported on its observations at the board meeting on 17 December 2018. In addition, the auditors performed a review of the half-year interim report.
In accordance with the Act on Auditing of State Activities, etc., the Swedish National Audit Office may appoint one or more audi-tors to participate in the annual audit. No such auditor was appointed in 2018.
The auditor’s fees are payable accord-ing to an approved invoice. The Group’s auditing costs are described in more detail in the Annual and Sustainability Report, in Note 15 to the consolidated accounts, Auditor’s fees, and in Note 14 to the Parent Company accounts, Auditor’s fees.
CEO and Executive Group ManagementThe President of Vattenfall AB, who is also Chief Executive Officer (CEO) of the Vattenfall Group, is responsible for the day-to-day administration in accordance with the Swedish Companies Act. The CEO in 2018 was Magnus Hall. An account of the President’s remuneration is provided in the Annual and Sustainability Report, Note 42 to the consolidated accounts, Number of employees and personnel costs.
The CEO has set up internal bodies for governance of the Group and makes deci-sions independently or with the support of these bodies. The most important of these are the Executive Group Management (EGM) and the Vattenfall Risk Committee (VRC). The EGM focuses on the Group’s
overall direction and addresses – within the framework of the CEO’s mandate from the Board of Directors – matters of importance for the Group, such as certain investments. In the EGM, the Head of Strategic Develop-ment is responsible for sustainability issues. The VRC focuses on decisions pertaining to risk mandates and credit limits, among other things, and exercises oversight of the risk management framework.
Both of these bodies conduct prepara-tory drafting work on matters that are to be decided by the Board of Directors. Ahead of decisions made by the President in the EGM or VRC on major investments and transactions, the risk unit performs an inde-
pendent risk analysis, which makes up part of the decision-making documentation.
In addition, the President follows up opera-tions via quarterly Business Performance Meetings. At these meetings, outcomes, forecasts, important events and chal-lenges are analysed (including the status of Vattenfall’s sustainability related targets) with the top management of each business unit, to ensure that the organisation is per-forming in line with set targets and expecta-tions. Yearly deep-dives into sustainability topics (challenges, progress and actions for coming year) are performed with the top management of each Business Area.
Biographical information about the mem-bers of the EGM is provided on pages 82–83.
Internal AuditInternal Audit is an independent and objective function that evaluates, recom-mends and monitors improvements to the effectiveness of Vattenfall’s risk manage-ment, internal controls and governance processes throughout the Group. This also applies to compliance with Vattenfall’s
governance documents, including the Code of Conduct and Integrity. The Internal Audit function is directly subordinate to the Board of Directors and Audit Committee and performs its work in accordance with an established internal audit plan. Internal Audit’s budget, the Internal Audit Charter
and the internal audit plan are drafted by the Audit Committee and decided on by the Board of Directors. The Head of Internal Audit reports administratively to the Presi-dent and informs the management teams of the business units and other units about audit activities that have been performed.
Internal governancePrinciples and strategy Vattenfall has formulated a strategy with the purpose to Power Climate Smarter Living and enable fossil-free living within one generation.
Vattenfall has four strategic objectives: The company shall be 1) Leading towards Sustainable Consumption and 2) Leading towards Sustainable Production. Achieving this requires 3) High Performing Operations and 4) Empowered and Engaged People. These four strategic objectives have been
broken down into strategic targets. In addi-tion to this are the financial targets decided on by the general meeting. The targets are further described in the Annual and Sus-tainability Report on page 11. Group score-cards break down the targets, for instance with regard to absolute CO2 emissions, development of the “CO2 roadmap” and internal energy savings. Reporting back to the Board is then performed as part of the quarterly reporting.
Vattenfall’s strategy is well aligned with the UN’s Agenda 2030 Sustainable Develop-ment Goals and will drive Vattenfall to make an important contribution to the global sustainable development agenda.
Governing business ethicsIn 2018 the Board adopted a new Code of Conduct and Integrity, which replaces the previous code of conduct. The new Code builds upon the four Vattenfall principles – open, active, positive and safety –
VATTENFALL ANNUAL AND SUSTAINABILITY REPORT 2018 75Corporate Governance Report

and contains a number of rules built on the “think first” approach. It includes references to the Vattenfall Management System (VMS), which elaborates on these rules.The Code has been launched in the whole Group and is available on the intranet in several language versions, correspond-ing to the countries where Vattenfall has business operations. Information about the Code is provided in connection with new hiring and training. An e-learning programme on application of the Code has also been launched, which will be manda-tory for all Vattenfall employees.
To ensure that the organisation acts in an ethical and non-corrupt manner, Vattenfall requires all employees to take personal responsibility by acting in accordance with the company’s ethical guidelines, which are set forth in the Code of Conduct and Integrity as well as in internal instructions. Vattenfall believes that competition plays a decisive role for a market to function effec-
tively and has zero tolerance for bribery and corruption. An important step in ensuring this is the training that is conducted within the Vattenfall Integrity Programme, which is described on page 61.
The Code of Conduct and Integrity gives employees the opportunity to report inci-dents anonymously through a whistleblow-ing function staffed by locally appointed external ombudsmen (attorneys), to whom employees, consultants and contractors can turn to report suspected, serious improprieties that the whistleblower does not want to report internally via the normal reporting channels.
Read more about reported incidents in the Annual and Sustainability Report on page 61. Ongoing legal processes are described in Note 40 to the consolidated accounts, Contingent liabilities. Sustain-ability initiatives and principles that Vattenfall has aligned itself with or sup-ports are listed on page 164.
Four strategic objectives
Power Climate
Smarter Living
Su
stai
nabl
e C
onsumption
Lead
ing to
wards Sustainable Productio
n
Leading toward
s
High Perform
ing
Operatio
ns
Em
powered and
Engaged People
Three lines of defenceVattenfall applies the “three lines of defence” model, for management and con-trol of risks in general. The model secures the principle of segregation of duties and includes different roles for risk ownership, control and independent reporting and assurance. In particular, it is applied in the internal control of the financial report-ing and in the integrity organisation, as described further below.
The first line of defence consists of the business operations (Business Units and Staff Functions), which are responsible for managing risks.
The second line of defence consists of, among others, the risk organisation, which is headed by the Chief Risk Officer (CRO). The CRO is accountable for the risk management framework and is responsi-ble for securing risk governance and risk control. Included in this responsibility are processes related to, among other things, new products and certain contracts with long durations. The CRO provides informa-
tion on a regular basis to the Vattenfall Risk Committee and to the Executive Group Management as well as to the Board and the Board’s audit committee.
The third line of defence is made up of internal and external audit. Internal audit is an independent and objective function that oversees and evaluates the first and second lines of defence.
Vattenfall Management SystemThe most important internal rules for gov-erning Vattenfall are found in the Vattenfall Management System (VMS). The VMS is the Group framework that ensures that Vattenfall adheres to formal requirements as well as to requirements made by the Board, the President, the business opera-tions and the Staff Functions. It covers the governance that is necessary in Vattenfall, while local management systems cover specific business governance. The VMS is documented in binding governance documents, consisting of policies and instructions. Certain central documents
are approved by the Board of Directors of Vattenfall AB. The VMS is an integrated management system that applies for the entire Vattenfall Group, with the limitations that may arise from legal requirements, such as regarding the unbundling of the electricity distribution business. Special routines are in place to ensure adherence to the management system also by sub-sidiaries.
The policies lay out the company’s direc-tion and exist in the areas of
• remuneration,
• dam safety,
• nuclear safety and
• riskas well as in the area of Sustainability, where Vattenfall’s governance is based on the sustainability policy along with a num-ber of other policies:
• The environmental policy. This was updated during 2018 and now clearly states Vattenfall’s commitment to become climate neutral, to protection of nature and biodiversity and to sustain-able use of resources. The environmen-tal policy also states the principles for how Vattenfall shall perform its business within these areas.
• The health and safety policy.
• The human rights policy, which was approved in 2018 and addresses Vattenfall’s commitment to respect-ing human rights. The policy identifies Vattenfall’s salient human rights risks and describes how the company identi-fies, assesses, and manages its human rights risks.
• The Code of Conduct and Integrity, which is described above.
• The Code of Conduct for Suppliers, which addresses issues such as human
Three lines of defence
Business units and Staff Functions
Risk organisation and other
control functions
Internal and external audit
First line of defence
Ownership and management of risk
Second line of defence
Independent risk and compliance control
Risks
Third line of defence
Independent review and oversight
76 Corporate Governance Report VATTENFALL ANNUAL AND SUSTAINABILITY REPORT 2018

rights, work conditions, the environment and anti-corruption, based on the UN Global Compact. Vattenfall recognises its growing importance as an actor in a global value chain. With millions of cus-tomers, 25,000 suppliers and countless other stakeholders, Vattenfall’s activities have impacts far beyond the boundaries of the Vattenfall organisation. There-fore, Vattenfall takes responsibility throughout the value chain. The Code of Conduct for Suppliers forms part of this work.
• Also, since 2017, the Board issues a gen-eral statement on Vattenfall’s tax policy.
The Board of Directors approves all poli-cies except the policies on dam safety, nuclear safety and health and safety. How-ever, within these areas, regular reporting takes place to the EGM or to the Board of Directors. The policies are accessible to employees on the intranet and are also communicated externally. Vattenfall does not require any acknowledgement by employees or management that they have read the policies.
The content of the company’s policies is concretised in instructions within the VMS, such as in special instructions for matters concerning competition law and for countering bribery and corruption. For instance, during 2018, work was ongoing on concretising issues concerning the environment, health and safety, and the work environment based on the updated policies. Instructions in the VMS can also include concretisations of the content of the Board’s Rules of Procedure, such as with respect to the issuance of informa-tion as well as allocation of responsibilities and risk mandates. Instructions shall be
implemented in the relevant organisation and acknowledged by the defined target group. Implementation and adherence to the instructions is regularly followed up, and identified issues are addressed.
Vattenfall’s Environmental Manage-ment System is integrated in the VMS. At year-end 2018 nearly 100% of Vattenfall’s production and distribution portfolios had certified environmental management systems in accordance with ISO 14001. In addition, all the Group’s business units are certified for occupational health and safety in accordance with OHSAS 18001 or ISO 45001, and six business units have certified energy management systems in accordance with ISO 50001.
In 2018 continuing updates of the VMS were conducted. The evaluation with respect to knowledge about and compli-ance with the VMS has continuously been in focus, for instance through the annual survey and Subject Area Review, which is a self-assessment within certain areas of the VMS. Results from this evaluation are reported to the EGM and to the Audit Committee. In addition, self-assessments are conducted via the Staff Functions for certain stipulations within the VMS, including matters concerning integrity and competition law. During 2018 a routine was established to ensure that all VMS content is reviewed and updated at least every other year.
OrganisationVattenfall’s organisational structure com-prises six Business Areas: Heat, Wind, Customers & Solutions, Generation, Mar-kets and Distribution. The Business Areas are organised in five operating segments,
where Generation and Markets make up a single operating segment. The central Staff Functions support and direct the business activities. The organisational structure has been formed to reflect Vattenfall’s overall strategy for the coming years. For further information see pages 18–23.
The company structure differs from the business structure. Decisions are made primarily in the business organisation and, to the extent necessary or suitable, by subsidiaries’ boards. Governance is con-ducted financially, non-financially (such as through Staff Functions), and operationally. Unit scorecards and the VMS are the most important governance tools.
Integrity organisationThe aim of integrity work at Vattenfall is to uphold integrity and protect the Group’s reputation. Toward this end, an organisa-tional framework has been created which, within its area of responsibility, is tasked with ensuring transparency, understand-ing of applicable laws, guidelines and standards, and promoting compliance with these in all countries in which Vattenfall operates.
Integrity work at Vattenfall is organised according to the three lines of defence principle:1. Ownership: The line organisation, which
is responsible for compliance with laws and regulations within the unit
2. Control and advice: The integrity organi-sation, with reporting to the Group’s General Counsel
3. Quality assurance: The Internal Audit unit
The Integrity organisation’s area of respon-sibility covers competition matters, bribery and corruption, conflicts of interest, inside information, awareness of Vattenfall’s Code of Conduct and Integrity, and coordination of Vattenfall’s whistleblowing function.
Within its area of responsibility, the Integrity organisation supports Vattenfall in identifying, avoiding, managing and monitoring the risk for non-compliance with laws, other legal stipulations, regula-tions, norms and codes of conduct that are relevant for operations. Work within the Integrity organisation is carried out in accordance with an annual plan, which is approved by an Integrity Committee consisting of EGM members and others. The day-to-day work is aligned at meet-ings within the Integrity organisation and via regular follow-ups. The annual integrity work is summarised in an integrity report to the Board.
Current integrity issues in 2018 are described in more detail in the Annual and Sustainability report on pages 60–61.
Structure for the VMS and other governing rules
PurposeOwner’s
directivesBoard’s
directives
Vattenfall Management System
Culture and behaviour
Culture and principlesCode of Conduct
and Integrity
Units, entities, employees in the Vattenfall Group
Local management systems
VATTENFALL ANNUAL AND SUSTAINABILITY REPORT 2018 77Corporate Governance Report
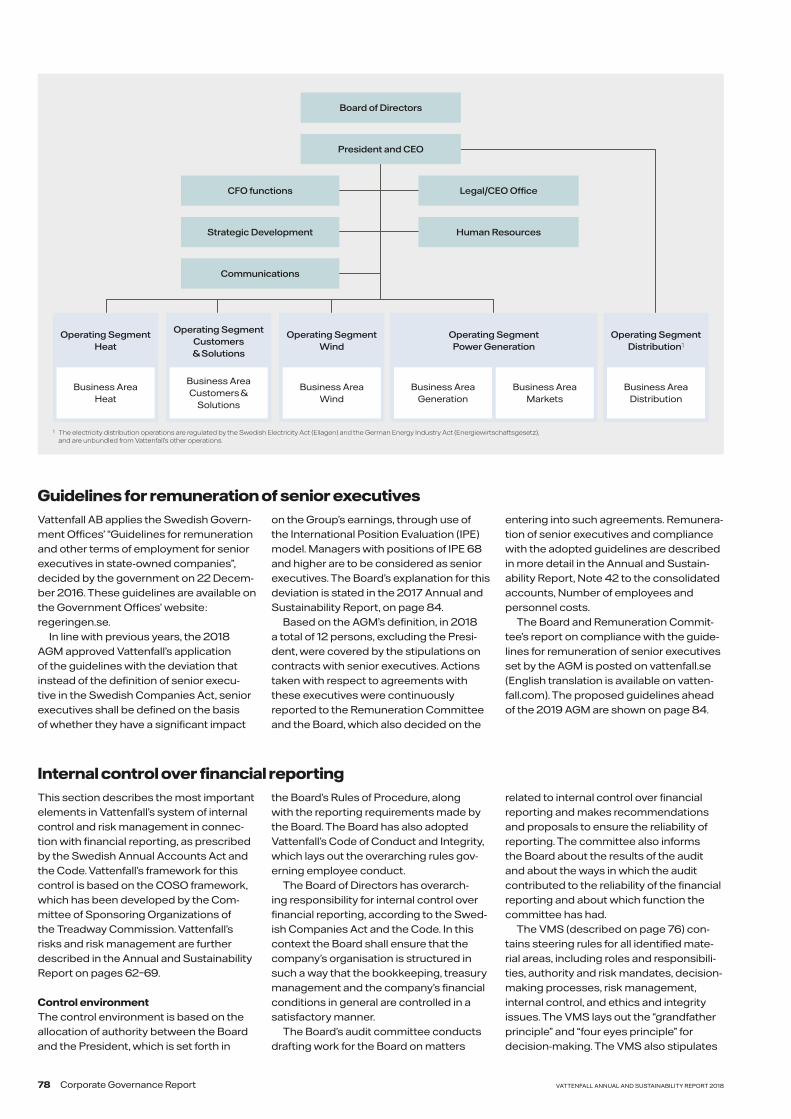
Guidelines for remuneration of senior executivesVattenfall AB applies the Swedish Govern-ment Offices’ “Guidelines for remuneration and other terms of employment for senior executives in state-owned companies”, decided by the government on 22 Decem-ber 2016. These guidelines are available on the Government Offices’ website: regeringen.se.
In line with previous years, the 2018 AGM approved Vattenfall’s application of the guidelines with the deviation that instead of the definition of senior execu-tive in the Swedish Companies Act, senior executives shall be defined on the basis of whether they have a significant impact
on the Group’s earnings, through use of the International Position Evaluation (IPE) model. Managers with positions of IPE 68 and higher are to be considered as senior executives. The Board’s explanation for this deviation is stated in the 2017 Annual and Sustainability Report, on page 84.
Based on the AGM’s definition, in 2018 a total of 12 persons, excluding the Presi-dent, were covered by the stipulations on contracts with senior executives. Actions taken with respect to agreements with these executives were continuously reported to the Remuneration Committee and the Board, which also decided on the
entering into such agreements. Remunera-tion of senior executives and compliance with the adopted guidelines are described in more detail in the Annual and Sustain-ability Report, Note 42 to the consolidated accounts, Number of employees and personnel costs.
The Board and Remuneration Commit-tee’s report on compliance with the guide-lines for remuneration of senior executives set by the AGM is posted on vattenfall.se (English translation is available on vatten-fall.com). The proposed guidelines ahead of the 2019 AGM are shown on page 84.
Internal control over financial reportingThis section describes the most important elements in Vattenfall’s system of internal control and risk management in connec-tion with financial reporting, as prescribed by the Swedish Annual Accounts Act and the Code. Vattenfall’s framework for this control is based on the COSO framework, which has been developed by the Com-mittee of Sponsoring Organizations of the Treadway Commission. Vattenfall’s risks and risk management are further described in the Annual and Sustainability Report on pages 62–69.
Control environmentThe control environment is based on the allocation of authority between the Board and the President, which is set forth in
the Board’s Rules of Procedure, along with the reporting requirements made by the Board. The Board has also adopted Vattenfall’s Code of Conduct and Integrity, which lays out the overarching rules gov-erning employee conduct.
The Board of Directors has overarch-ing responsibility for internal control over financial reporting, according to the Swed-ish Companies Act and the Code. In this context the Board shall ensure that the company’s organisation is structured in such a way that the bookkeeping, treasury management and the company’s financial conditions in general are controlled in a satisfactory manner.
The Board’s audit committee conducts drafting work for the Board on matters
related to internal control over financial reporting and makes recommendations and proposals to ensure the reliability of reporting. The committee also informs the Board about the results of the audit and about the ways in which the audit contributed to the reliability of the financial reporting and about which function the committee has had.
The VMS (described on page 76) con-tains steering rules for all identified mate-rial areas, including roles and responsibili-ties, authority and risk mandates, decision-making processes, risk management, internal control, and ethics and integrity issues. The VMS lays out the “grandfather principle” and “four eyes principle” for decision-making. The VMS also stipulates
Board of Directors
President and CEO
Legal/CEO Office
Human Resources
CFO functions
Strategic Development
Communications
Operating Segment Heat
Business AreaHeat
Operating Segment Customers & Solutions
Business AreaCustomers &
Solutions
Operating Segment Wind
Business AreaWind
Operating Segment Power Generation
Business AreaMarkets
Business AreaGeneration
Operating Segment Distribution1
Business AreaDistribution
1 The electricity distribution operations are regulated by the Swedish Electricity Act (Ellagen) and the German Energy Industry Act (Energiewirtschaftsgesetz), and are unbundled from Vattenfall’s other operations.
78 Corporate Governance Report VATTENFALL ANNUAL AND SUSTAINABILITY REPORT 2018

which decision-making, oversight and advisory bodies exist within the Group, on top of those required by law.
Vattenfall has an internal financial control (IFC) process, organised in Group Finance and whose overall purpose is to ensure that controls are in place in the financial reporting but also in certain non-financial reporting.
Risk assessment The Board addresses the Group’s risk assessment and risk management process for the financial reporting at an overarching level. The Board’s audit committee conducts drafting work for evaluation and monitoring of risks and quality in financial reporting. The Audit Committee maintains continuous and regular contact with the Group’s internal and external audit functions.
A continuous Enterprise Risk Manage-ment (ERM) process makes it possible to quantify and compare both financial and non-financial risks. The risk department reports the findings in the ERM process to the Executive Group Management, to the Vattenfall Risk Committee and ultimately to the Audit Committee and the Board.
For the financial reporting, the IFC pro-cess serves as the framework for internal control that identifies and defines risks for material errors in the reporting. These are overseen by the CFO Function through regular reporting on tests performed of defined control points. The CFO function is also responsible for performing regular analyses of risks related to financial report-ing and for updating this framework.
The external and internal auditors dis-cuss Vattenfall’s risk situation in connec-tion with the planning work ahead of the annual audit.
Control activities and monitoringThe Board monitors and addresses the Group’s financial situation at every regular
board meeting, with a starting point from the financial report submitted by the Presi-dent and the Chief Financial Officer.
The Audit Committee conducts the Board’s monitoring of the effectiveness of internal control and regularly receives sta-tus reports on the Group’s internal control over financial reporting, in accordance with the IFC process. A financial report, includ-ing a report on accounting and sustain-ability issues, is presented at every regular Audit Committee meeting, and tax issues are reported on and followed up on a regular basis. The Audit Committee, in turn, reports to the Board on its most important observations and recommendations. The timing and forms of this reporting are set in the Board’s and Audit Committees’ respec-tive Rules of Procedure.
The Executive Group Management holds regular follow-up meetings with the heads of the Business Areas and Staff Functions regarding the financial outcome. Operations are followed up on a quarterly basis via Business Performance Meetings.
Internally, Vattenfall applies the “three lines of defence” model (described on page 76) for internal control over financial reporting. In this context, the second line of defence includes the Group Internal Finan-cial Control Officer (IFCO), who is respon-sible for monitoring and control of risks in the financial reporting. The Group IFCO is responsible for the IFC process, which aims to strengthen the governance struc-ture and effectiveness of controls. Continu-ous improvements to the IFC process are ensured through an annual evaluation and updating process. Information about inef-fective controls is provided to internal and external audit. Each incidence of ineffec-tiveness is risk-assessed in consultation with the first line of defence. Information about these risks is provided to the risk organisation.
The internal framework for internal control includes processes for self-assessments, monitoring, reporting and improvement of control activities in order to prevent, discover and correct errors in the financial reporting. Written confirmation of adher-ence to internal and external stipulations is part of these processes. This is done in particular through internal Representation Letters to management.
Information and communicationThe Group’s steering documents are accessible via Vattenfall’s intranet. The forms for handling internal and external communication are documented in a VMS instruction which aims to ensure that Vattenfall is in compliance with legal as well as stock exchange rules, the state’s ownership policy (including guidelines for external reporting), and other obligations. Accounting and reporting principles are laid out in a joint manual for the entire Group. Updates and changes in these policies and principles are communicated on a continuous basis via the intranet as well as at meetings with representatives of the Group’s Business Areas and Staff Functions.
Reporting and follow-up reporting to the Board and EGM are part of monitoring activities. Internal and external audit and the CRO also report on their observations to the Board’s audit committee. Financial reporting includes interim reports, the year-end report and the annual report. In addition to these reports, financial informa-tion is provided to the Group’s external stakeholders via press releases and Vattenfall’s websites, in accordance with the Swedish Securities Market Act, among other things. Presentations and confer-ence calls for financial analysts, investors and the media are held as a rule on the same day that reports are published.
The Internal Financial Control (IFC) process
Review and UpdateImplement improvements and
correct errors in the IFC process and the IFC framework (list of IFC controls). Define the IFC scope for
the forthcoming year.
Self Assessment A yearly question naire used to evaluate the status of the IFC
control points and identify the need for corrective action.
ValidationComplementary evaluations of
IFC control points, e.g., via on-site validations.
ReportingQuarterly IFC status reporting
and mid-year/year-end report to Audit Committee.
Annual IFC Process
Assessmen
t
Self
Review and
UpdateR
eporti
ng
Validation
VATTENFALL ANNUAL AND SUSTAINABILITY REPORT 2018 79Corporate Governance Report
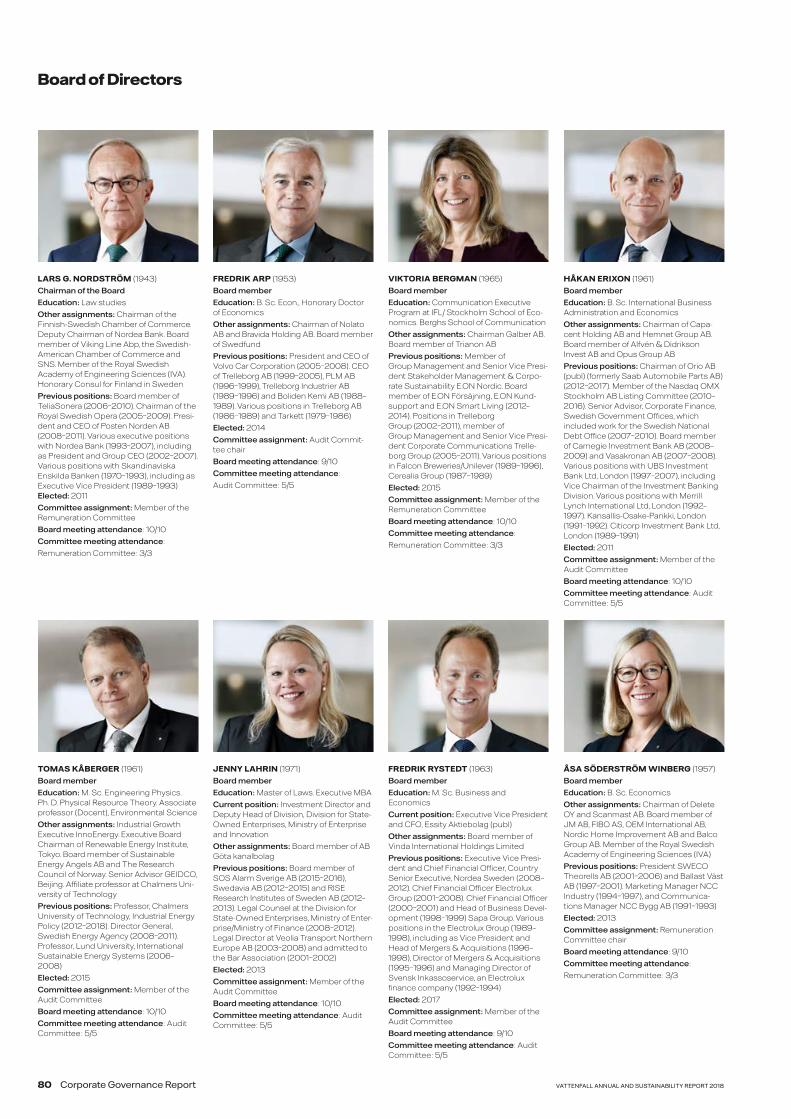
Board of Directors
HÅKAN ERIXON (1961)
Board member
Education: B. Sc. International Business Administration and Economics
Other assignments: Chairman of Capa-cent Holding AB and Hemnet Group AB. Board member of Alfvén & Didrikson Invest AB and Opus Group AB
Previous positions: Chairman of Orio AB (publ) (formerly Saab Automobile Parts AB) (2012–2017). Member of the Nasdaq OMX Stockholm AB Listing Committee (2010–2016). Senior Advisor, Corporate Finance, Swedish Government Offices, which included work for the Swedish National Debt Office (2007–2010). Board member of Carnegie Investment Bank AB (2008–2009) and Vasakronan AB (2007–2008). Various positions with UBS Investment Bank Ltd, London (1997–2007), including Vice Chairman of the Investment Banking Division. Various positions with Merrill Lynch International Ltd, London (1992–1997). Kansallis-Osake-Pankki, London (1991–1992). Citicorp Investment Bank Ltd, London (1989–1991)
Elected: 2011
Committee assignment: Member of the Audit Committee
Board meeting attendance: 10/10
Committee meeting attendance: Audit Committee: 5/5
TOMAS KÅBERGER (1961)
Board member
Education: M. Sc. Engineering Physics. Ph. D. Physical Resource Theory. Associate professor (Docent), Environmental Science
Other assignments: Industrial Growth Executive InnoEnergy. Executive Board Chairman of Renewable Energy Institute, Tokyo. Board member of Sustainable Energy Angels AB and The Research Council of Norway. Senior Advisor GEIDCO, Beijing. Affiliate professor at Chalmers Uni-versity of Technology
Previous positions: Professor, Chalmers University of Technology, Industrial Energy Policy (2012–2018). Director General, Swedish Energy Agency (2008–2011). Professor, Lund University, International Sustainable Energy Systems (2006–2008)
Elected: 2015
Committee assignment: Member of the Audit Committee
Board meeting attendance: 10/10
Committee meeting attendance: Audit Committee: 5/5
JENNY LAHRIN (1971)
Board member
Education: Master of Laws. Executive MBA
Current position: Investment Director and Deputy Head of Division, Division for State-Owned Enterprises, Ministry of Enterprise and Innovation
Other assignments: Board member of AB Göta kanalbolag
Previous positions: Board member of SOS Alarm Sverige AB (2015–2016), Swedavia AB (2012–2015) and RISE Research Institutes of Sweden AB (2012–2013). Legal Counsel at the Division for State-Owned Enterprises, Ministry of Enter-prise/Ministry of Finance (2008–2012). Legal Director at Veolia Transport Northern Europe AB (2003–2008) and admitted to the Bar Association (2001–2002)
Elected: 2013
Committee assignment: Member of the Audit Committee
Board meeting attendance: 10/10
Committee meeting attendance: Audit Committee: 5/5
ÅSA SÖDERSTRÖM WINBERG (1957)
Board member
Education: B. Sc. Economics
Other assignments: Chairman of Delete OY and Scanmast AB. Board member of JM AB, FIBO AS, OEM International AB, Nordic Home Improvement AB and Balco Group AB. Member of the Royal Swedish Academy of Engineering Sciences (IVA)
Previous positions: President SWECO Theorells AB (2001–2006) and Ballast Väst AB (1997–2001). Marketing Manager NCC Industry (1994–1997), and Communica-tions Manager NCC Bygg AB (1991–1993)
Elected: 2013
Committee assignment: Remuneration Committee chair
Board meeting attendance: 9/10
Committee meeting attendance:
Remuneration Committee: 3/3
LARS G. NORDSTRÖM (1943)
Chairman of the Board
Education: Law studies
Other assignments: Chairman of the Finnish-Swedish Chamber of Commerce. Deputy Chairman of Nordea Bank. Board member of Viking Line Abp, the Swedish-American Chamber of Commerce and SNS. Member of the Royal Swedish Academy of Engineering Sciences (IVA). Honorary Consul for Finland in Sweden
Previous positions: Board member of TeliaSonera (2006–2010). Chairman of the Royal Swedish Opera (2005–2009). Presi-dent and CEO of Posten Norden AB (2008–2011). Various executive positions with Nordea Bank (1993–2007), including as President and Group CEO (2002–2007). Various positions with Skandinaviska Enskilda Banken (1970–1993), including as Executive Vice President (1989–1993)Elected: 2011
Committee assignment: Member of the Remuneration Committee
Board meeting attendance: 10/10
Committee meeting attendance:
Remuneration Committee: 3/3
FREDRIK ARP (1953)
Board member
Education: B. Sc. Econ., Honorary Doctor of Economics
Other assignments: Chairman of Nolato AB and Bravida Holding AB. Board member of Swedfund
Previous positions: President and CEO of Volvo Car Corporation (2005–2008). CEO of Trelleborg AB (1999–2005), PLM AB (1996–1999), Trelleborg Industrier AB (1989–1996) and Boliden Kemi AB (1988–1989). Various positions in Trelleborg AB (1986–1989) and Tarkett (1979–1986)
Elected: 2014
Committee assignment: Audit Commit-tee chair
Board meeting attendance: 9/10
Committee meeting attendance:
Audit Committee: 5/5
VIKTORIA BERGMAN (1965)
Board member
Education: Communication Executive Program at IFL/ Stockholm School of Eco-nomics. Berghs School of Communication
Other assignments: Chairman Galber AB. Board member of Trianon AB
Previous positions: Member of Group Management and Senior Vice Presi-dent Stakeholder Management & Corpo-rate Sustainability E.ON Nordic. Board member of E.ON Försäjning, E.ON Kund-support and E.ON Smart Living (2012–2014). Positions in Trelleborg Group (2002–2011), member of Group Management and Senior Vice Presi-dent Corporate Communications Trelle-borg Group (2005–2011). Various positions in Falcon Breweries/Unilever (1989–1996), Cerealia Group (1987–1989)
Elected: 2015
Committee assignment: Member of the Remuneration Committee
Board meeting attendance: 10/10
Committee meeting attendance:
Remuneration Committee: 3/3
FREDRIK RYSTEDT (1963)
Board member
Education: M. Sc. Business and Economics
Current position: Executive Vice President and CFO, Essity Aktiebolag (publ)
Other assignments: Board member of Vinda International Holdings Limited
Previous positions: Executive Vice Presi-dent and Chief Financial Officer, Country Senior Executive, Nordea Sweden (2008–2012). Chief Financial Officer Electrolux Group (2001–2008). Chief Financial Officer (2000–2001) and Head of Business Devel-opment (1998–1999) Sapa Group. Various positions in the Electrolux Group (1989–1998), including as Vice President and Head of Mergers & Acquisitions (1996–1998), Director of Mergers & Acquisitions (1995–1996) and Managing Director of Svensk Inkassoservice, an Electrolux finance company (1992–1994)
Elected: 2017
Committee assignment: Member of the Audit Committee
Board meeting attendance: 9/10
Committee meeting attendance: Audit Committee: 5/5
80 Corporate Governance Report VATTENFALL ANNUAL AND SUSTAINABILITY REPORT 2018
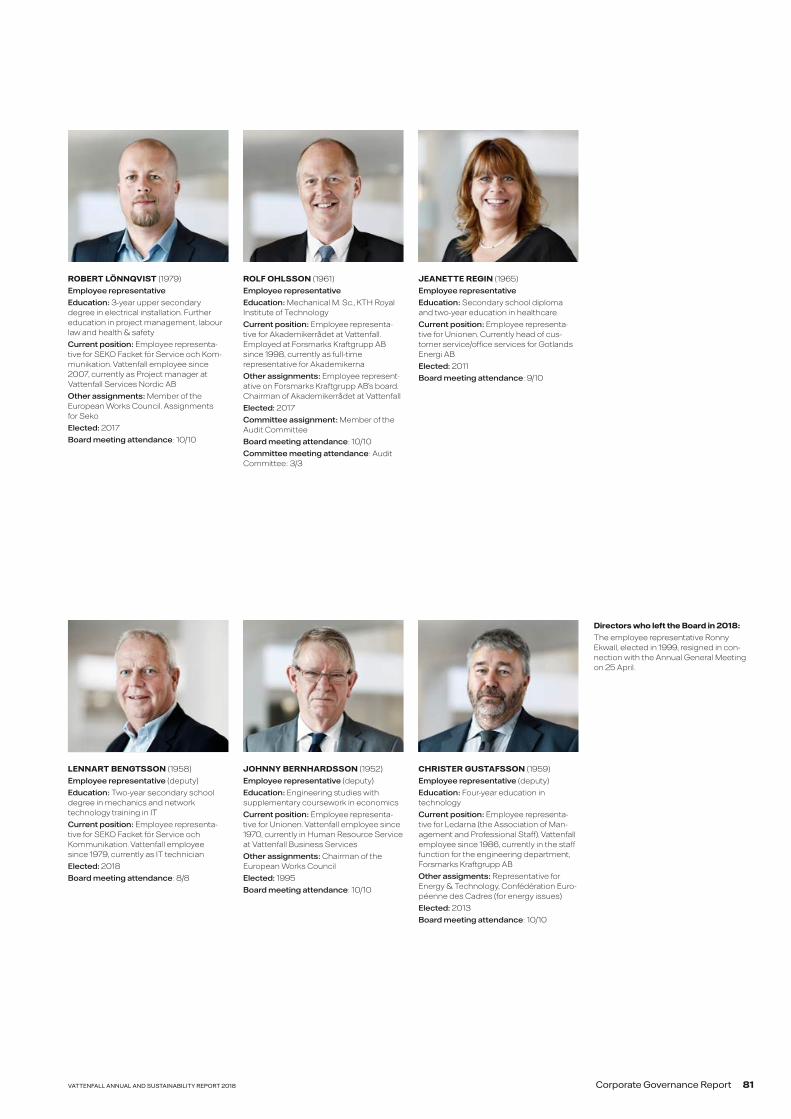
CHRISTER GUSTAFSSON (1959)
Employee representative (deputy)
Education: Four-year education in technology
Current position: Employee representa-tive for Ledarna (the Association of Man-agement and Professional Staff). Vattenfall employee since 1986, currently in the staff function for the engineering department, Forsmarks Kraftgrupp AB
Other assigments: Representative for Energy & Technology, Confédération Euro-péenne des Cadres (for energy issues)
Elected: 2013
Board meeting attendance: 10/10
JOHNNY BERNHARDSSON (1952)
Employee representative (deputy)
Education: Engineering studies with supplementary coursework in economics
Current position: Employee representa-tive for Unionen. Vattenfall employee since 1970, currently in Human Resource Service at Vattenfall Business Services
Other assignments: Chairman of the European Works Council
Elected: 1995
Board meeting attendance: 10/10
LENNART BENGTSSON (1958)
Employee representative (deputy)
Education: Two-year secondary school degree in mechanics and network technology training in IT
Current position: Employee representa-tive for SEKO Facket för Service och Kommunikation. Vattenfall employee since 1979, currently as IT technician
Elected: 2018
Board meeting attendance: 8/8
ROBERT LÖNNQVIST (1979)
Employee representative
Education: 3-year upper secondary degree in electrical installation. Further education in project management, labour law and health & safety
Current position: Employee representa-tive for SEKO Facket för Service och Kom-munikation. Vattenfall employee since 2007, currently as Project manager at Vattenfall Services Nordic AB
Other assignments: Member of the European Works Council. Assignments for Seko
Elected: 2017
Board meeting attendance: 10/10
ROLF OHLSSON (1961)
Employee representative
Education: Mechanical M. Sc., KTH Royal Institute of Technology
Current position: Employee representa-tive for Akademikerrådet at Vattenfall. Employed at Forsmarks Kraftgrupp AB since 1998, currently as full-time representative for Akademikerna
Other assignments: Employee represent-ative on Forsmarks Kraftgrupp AB’s board. Chairman of Akademikerrådet at Vattenfall
Elected: 2017
Committee assignment: Member of the Audit Committee
Board meeting attendance: 10/10
Committee meeting attendance: Audit Committee: 3/3
JEANETTE REGIN (1965)
Employee representative
Education: Secondary school diploma and two-year education in healthcare
Current position: Employee representa-tive for Unionen. Currently head of cus-tomer service/office services for Gotlands Energi AB
Elected: 2011
Board meeting attendance: 9/10
Directors who left the Board in 2018: The employee representative Ronny Ekwall, elected in 1999, resigned in con-nection with the Annual General Meeting on 25 April.
VATTENFALL ANNUAL AND SUSTAINABILITY REPORT 2018 81Corporate Governance Report

Executive Group Management
MAGNUS HALL (1959)
President and CEO
Vattenfall employee since: 2014
Education: M. Sc. Industrial Engineering and Management
Previous positions: President and CEO of the forestry group Holmen
Other assignments: Chairman of NTM AB and Vice President of Eurelectric
In 2018 Magnus Hall did not have any sig-nificant shareholdings in companies with which Vattenfall has business relations.
KERSTIN AHLFONT (1971)
Senior Vice President, Human Resources
Vattenfall employee since: 1995
Education: M. Sc. Eng.
Previous positions: Head of Finance Region Nordic (2014–2015), Vice President Controlling (2012–2013), Acting HR Direc-tor (2011–2012), Head of Project Manage-ment Office (2010–2011), Business Group Pan Europe (2009–2010), various positions and manager positions within Vattenfall (1995–2009)
ANNA BORG (1971)
Senior Vice President, Chief Financial Officer
Vattenfall employee since: 2017 and 1999–2015
Education: Master’s in Economics and Political Science
Previous positions: Senior Vice President, Business Area Markets, Vattenfall (2017); Senior Vice President, Nordic Klarna (2015–2017); Vice President, Marketing and Sales Nordic, Vattenfall (2013–2015); Vice President B2C Sales Europe, Vattenfall (2011–2013); Vice President, Sales Nordic, Vattenfall (2009–2011). Vari-ous management positions in Strategy, Business Development and Project Man-agement, Vattenfall (2003–2009). Head of Strategy and Business Development, Vattenfall Trading (1999–2003)
Other assignments: Board member of Gunnebo AB
ANNE GYNNERSTEDT (1957)
Senior Vice President, General Counsel and Secretary to the Board of Directors
Education: LL. B.
Vattenfall employee since: 2012
Previous positions: General Counsel, Secretary to the Board and member of executive management of SAAB AB (2004–2012). General Counsel and member of executive management of the Swedish National Debt Office (2002–2004). Corporate Legal Counsel, SAS (1987–2002)
Other assignments: Board member of Swedish Space Corporation
MARTIJN HAGENS (1971)
Senior Vice President, Business Area Customers & Solutions
Vattenfall employee since: 2003
Education: M. Sc. Industrial Engineering and Management
Previous positions: Head of Heat Conti-nental/UK, Vattenfall (2014–2015). Head of Customer Service, Vattenfall (2011–2013). Head of Customer Care Centre, Nuon (2008–2010). Program Director Unbun-dling, Nuon (2006–2007). Nuon Consul-tancy Group & Lean Competence Center, Nuon (2005–2006). Head of Customer Care B2B, Nuon (2003–2004). Manage-ment Consultant, Accenture (1996–2002)
Other assignments: COO Nuon Netherlands
TUOMO HATAKKA (1956)
Senior Executive Vice President, Business Area Heat
Vattenfall employee since: 2002
Education: B. Sc. Economics, MBA
Previous positions: Head of Business Division Production (2010–2013). Head of Business Group Central Europe (2008–2010). Head of Business Group Poland (2005–2007)
Other assignments: Board member of PKP Energetyka S.A.
GUNNAR GROEBLER (1972)
Senior Vice President, Head of Wind Business Area
Vattenfall employee since: 1999
Education: Mechanical Engineering
Previous positions: Vice President, Busi-ness Unit Renewables, Region Continen-tal/UK, Vattenfall (2014–2015). Head of Business Unit Hydro Germany, Vattenfall (2011–2013). Head of Corporate Develop-ment & M&A, Business Group Central Europe, Vattenfall Europe AG (2009–2010). Head of Mergers & Acquisitions, Business Group Central Europe, Vattenfall Europe AG (2008–2009). Head of Corporate Restructuring, Vattenfall Europe AG (2007–2008). Head of Purchasing, Vattenfall Europe Hamburg AG (2005–2007)
NIEK DEN HOLLANDER (1973)
Senior Vice President, Business Area Markets
Vattenfall employee since: 2014
Education: Master’s in Financial Econo-metrics. MBA
Previous positions: Head of Business Unit Trading, Vattenfall Energy Trading GmbH (2014–2017). Head of Trading, Statkraft Markets GmbH (2008–2014). Head of Long-term Energy Management, Statkraft Markets B.V. (2006–2006). Head of Asset Management, Statkraft Markets B.V. (2005–2006). Various trading positions, Statkraft Markets B.V. (2002–2005). Vari-ous trading positions in the financial sector (1997–2002)
82 Corporate Governance Report VATTENFALL ANNUAL AND SUSTAINABILITY REPORT 2018

ANDREAS REGNELL (1966)
Senior Vice President, Strategic Development
Vattenfall employee since: 2010
Education: B. Sc. Econ.
Previous positions: Head of Nordic Busi-ness Strategy (2014–2015). Head of Strat-egy and Sustainability (2010–2013). Senior Partner and Managing Director, Managing Partner of Nordic Region, The Boston Con-sulting Group (1992–2010). Analyst and Account Manager, Citibank (1989–1992)
Other assignments: Board member of Svevia AB, Northvolt AB and Hybrit AB
TORBJÖRN WAHLBORG (1962)
Senior Executive Vice President, Business Area Generation
Vattenfall employee since: 1990
Education: M. Sc. Eng.
Previous positions: Head of Business Region Nordic (2014–2015). Head of Busi-ness Division Nuclear (2012–2013). Head of Business Division Distribution and Sales (2010–2012). Head of Business Group Nor-dic (2010). Positions in Vattenfall’s Polish operations (1997–2010), including as coun-try manager (2008–2009)
Other assignments: Board member of the Confederation of Swedish Enterprise. Chairman EnergiFöretagens Arbetsgivareförening (EFA) AB
KARIN LEPASOON (1968)
Senior Vice President, Group Communications
Vattenfall employee since: 2016
Education: LL.M. in Swedish law and an LL.M. in EU law
Previous positions: Director of Sustaina-bility, Communications and HR, Nordic Capital (2015–2016). Executive Vice Presi-dent and member of the Group Senior Executive Team (full member since 2008), Skanska (2006–2015). Vice President Group Communications, Gambro (1999–2006)
Other assignments: Board member of Energiföretagen Sverige – Swedenergy – AB
VATTENFALL ANNUAL AND SUSTAINABILITY REPORT 2018 83Corporate Governance Report

AGM proposal
Proposed principles for compensation and other terms of employ-ment for senior executivesThe Annual General Meeting resolved on 25 April 2018 to adopt the Board’s proposed guidelines for compensation of senior executives. The Board proposes that the 2019 Annual General Meeting resolves to adopt the Board’s proposal which corresponds to the government’s guidelines for terms of employment for senior executives of state-owned companies, adopted by the government on 22 December 2016 (www.regeringen.se), with the deviation set out below.
In accordance with a resolution by the Annual General Meeting on 25 April 2018, Vattenfall deviates from the definition of senior executive of a subsidiary. Instead of using the definition of senior executive set forth in the Swedish Companies Act, senior executives shall be defined based on whether they have significant influence on the Group’s earnings. Through application of the International Position Evaluation (IPE) model, executives with positions of IPE 68 and higher shall be considered to be senior executives.
The Board certifies that the compensation in question is in compli-ance with the guidelines set by the Annual General Meeting, in the fol-lowing respects: Before a decision is made on compensation and other terms of employment for a senior executive, written documentation shall be available that shows the company’s total cost. The proposal for decision shall be drafted by the Board’s remuneration committee and thereafter be put to the Board for a decision. The company’s auditors shall perform a review to ensure that the set compensation levels and other terms of employment have not been exceeded and, in accord-ance with the Companies Act, shall once a year – not later than three weeks before the Annual General Meeting – issue a written statement as to whether the adopted guidelines have been adhered to.
The Board’s explanation for deviations from the guidelinesThe deviation decided on by the owner at the 2018 Annual General Meeting entails use of a generally accepted ranking model instead of the definition of senior executive of a subsidiary in the Swedish Companies Act. The Board is of the opinion that the following, special reasons exist for deviating from the guidelines.
Like other international groups, Vattenfall governs its operations from a commercial perspective and not according to the legal company struc-ture. For commercial and legal reasons, the Vattenfall Group has approximately 300 subsidiaries. Through application of the government’s guidelines for subsidiaries, a very large number of execu-tives would be considered to be senior, without them having any signifi-cant influence on the Group’s earnings.
The proposed deviation reflects these circumstances. The criteria used to define what constitutes a senior executive are the individual subsidiary’s size based on sales, the number of employees and number of steps in the value chain, as well as the requirements on the individual executive for innovation, knowledge, strategic/visionary role and international responsibility.
The International Position Evaluation (IPE) model is used as support for determining in a systematic manner which positions can be considered to be senior. The Board’s conclusion is that, in addition to the members of the Executive Group Management, executives in positions of IPE 68 or higher should be considered to be senior.
Proposed distribution of profitsThe Annual General Meeting has at its disposal retained profits,including the profit for the year, totalling SEK 48,617,698,593. The Board of Directors and President propose that the profits be distributed as follows: To be distributed to the shareholder: SEK 2,000,000,000 To be carried forward: SEK 46,617,698,593
The proposed distribution corresponds to a dividend of SEK 15.19 per share. The dividend is proposed for payment on 25 April 2019.
Statement by the Board of Directors pursuant to the Swedish Compa-nies Act, Chapter 18, Section 4 Based on the Parent Company’s and Group’s financial position, earn-ings and cash position, the Board of Directors is of the opinion that the proposed distribution of profits will not lead to any material limitation of the Parent Company’s or Group’s ability to make any necessary invest-ments or to meet their obligations in the short and long term. In view of the above, the Board of Directors finds the proposed discretionary dividend, totalling SEK 2,000,000,000, to be carefully considered and justified, and that the proposal adheres to the principles of the adopted dividend policy (page 11).
The Board of Directors’ and the President’s assurance upon signing the Annual and Sustainability Report for 2018The undersigned certify that the consolidated accounts and the Annual Report have been prepared in accordance with International Financial Reporting Standards (IFRS), as endorsed by the European Commission, for application within the EU, and generally accepted accounting princi-ples, respectively, and give a true and fair view of the Parent Company’s and the Group’s financial position and earnings, and that the Adminis-tration Report for the Parent Company and the Group presents a fair overview of the development of the Parent Company’s and the Group’s operations, financial position and earnings and describes significant risks and uncertainties that the companies in the Group face. In addition, the undersigned certify that the sustainability data and the statutory sustainability report according to the Swedish Annual Accounts Act Chapter 6 11§, as defined in the GRI Index on pages 164–167, has been prepared in accordance with the GRI Standards, and has been adopted by the Board of Directors.
Solna, 19 March 2019
Lars G. Nordström, Chairman of the Board
Fredrik Arp Viktoria Bergman Håkan Erixon Tomas Kåberger Jenny Lahrin
Robert Lönnqvist Rolf Ohlsson Jeanette Regin Fredrik Rystedt Åsa Söderström Winberg
Magnus Hall, President and CEO
Our auditor’s report was submitted on 19 March 2019
Ernst & Young AB
Staffan Landén, Authorised Public Accountant
84 Corporate Governance Report VATTENFALL ANNUAL AND SUSTAINABILITY REPORT 2018
Contents
Vattenfall’s financial performance 86Consolidated accounts 93Notes to the consolidated accounts 99Parent Company accounts 133Notes to the Parent Company accounts 136Audit Report 148
Financial information
VATTENFALL ANNUAL AND SUSTAINABILITY REPORT 2018 85

Vattenfall’s financial performance
The underlying operating profit was SEK 19.9 billion in 2018, a decrease of SEK 3.3 billion compared with 2017. Lower earnings contributions from the Heat and Power Generation operating segments had a negative
effect on underlying operating profit. This was offset in part by a higher earnings contribution from the Wind operating segment.
Amounts in SEK million 2018 2017
Net sales 156,824 135,114
Operating profit before depreciation, amortisation and impairment losses (EBITDA)1 34,341 34,399
Underlying operating profit before depreciation, amortisation and impairment losses1 36,469 38,644
Operating profit (EBIT)1 17,619 18,524
Underlying operating profit1 19,883 23,203
Profit for the year 12,007 9,484
Funds from operations (FFO)1 23,275 26,643
Net debt1 47,728 59,260
Adjusted net debt1 112,324 124,360
Electricity generation, TWh 130.3 127.3
– of which, hydro power 35.5 35.6
– of which, nuclear power 55.0 51.9
– of which, fossil-based power 31.6 31.9
– of which, wind power 7.8 7.6
– of which, biomass, waste 0.4 0.4
Sales of electricity, TWh2 174.1 157.3
Sales of heat, TWh 18.3 18.9
Sales of gas, TWh 57.2 56.3
CO2 emissions, Mtonnes 22.04 22.64
Work-related accidents, number (LTIF)3 1.9 1.5
Number of employees, full-time equivalents 19,910 20,041
Key ratios
Return on capital employed, % 7.05 7.75
Net debt/equity, % 46.1 64.2
FFO/adjusted net debt, % 20.7 21.4
Adjusted net debt/EBITDA, times 3.3 3.61 See Definitions and calculations of key ratios for definitions of Alternative Performance Measures. 2 Sales of electricity also include bilateral trading on the Nordic electricity exchange.3 Lost time Injury Frequency (LTIF) is expressed in terms of the number of lost time work injuries
(per 1 million hours worked), i.e., work-related accidents resulting in absence longer than one day, and accidents resulting in fatality. The measure pertains only to Vattenfall empolyees.
4 Pro rata values, corresponding to Vattenfall’s share of ownership.5 The key ratio is based on average capital employed.
Sustainability reportingIn addition to reporting on financial performance, Vattenfall also reports on its sustainability performance. In accordance with the Annual Accounts Act, 6 chapter 11§ Vattenfall has chosen to develop the statu-tory sustainability report as a report separated from the annual accounts and consolidated accounts. The statutory sustainability report was delivered to the auditor at the same time as the annual accounts. The statutory sustainability report, which can be found on pages 10–11, 14–17, 58–79 and 152–163, pertains to Vattenfall and its subsidiaries.
86 Vattenfall's financial performance VATTENFALL ANNUAL AND SUSTAINABILITY REPORT 2018
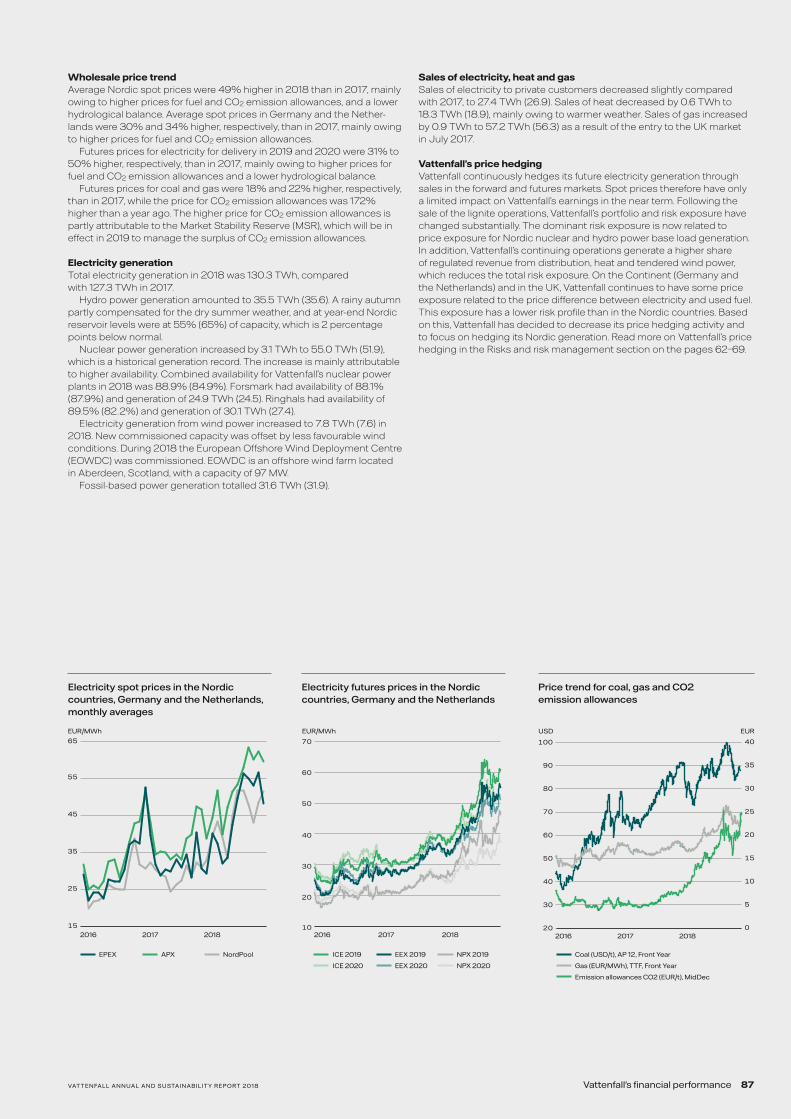
Wholesale price trendAverage Nordic spot prices were 49% higher in 2018 than in 2017, mainly owing to higher prices for fuel and CO2 emission allowances, and a lower hydrological balance. Average spot prices in Germany and the Nether-lands were 30% and 34% higher, respectively, than in 2017, mainly owing to higher prices for fuel and CO2 emission allowances.
Futures prices for electricity for delivery in 2019 and 2020 were 31% to 50% higher, respectively, than in 2017, mainly owing to higher prices for fuel and CO2 emission allowances and a lower hydrological balance.
Futures prices for coal and gas were 18% and 22% higher, respectively, than in 2017, while the price for CO2 emission allowances was 172% higher than a year ago. The higher price for CO2 emission allowances is partly attributable to the Market Stability Reserve (MSR), which will be in effect in 2019 to manage the surplus of CO2 emission allowances.
Electricity generationTotal electricity generation in 2018 was 130.3 TWh, compared with 127.3 TWh in 2017.
Hydro power generation amounted to 35.5 TWh (35.6). A rainy autumn partly compensated for the dry summer weather, and at year-end Nordic reservoir levels were at 55% (65%) of capacity, which is 2 percentage points below normal.
Nuclear power generation increased by 3.1 TWh to 55.0 TWh (51.9), which is a historical generation record. The increase is mainly attributable to higher availability. Combined availability for Vattenfall’s nuclear power plants in 2018 was 88.9% (84.9%). Forsmark had availability of 88.1% (87.9%) and generation of 24.9 TWh (24.5). Ringhals had availability of 89.5% (82.2%) and generation of 30.1 TWh (27.4).
Electricity generation from wind power increased to 7.8 TWh (7.6) in 2018. New commissioned capacity was offset by less favourable wind conditions. During 2018 the European Offshore Wind Deployment Centre (EOWDC) was commissioned. EOWDC is an offshore wind farm located in Aberdeen, Scotland, with a capacity of 97 MW.
Fossil-based power generation totalled 31.6 TWh (31.9).
Sales of electricity, heat and gasSales of electricity to private customers decreased slightly compared with 2017, to 27.4 TWh (26.9). Sales of heat decreased by 0.6 TWh to 18.3 TWh (18.9), mainly owing to warmer weather. Sales of gas increased by 0.9 TWh to 57.2 TWh (56.3) as a result of the entry to the UK market in July 2017.
Vattenfall’s price hedgingVattenfall continuously hedges its future electricity generation through sales in the forward and futures markets. Spot prices therefore have only a limited impact on Vattenfall’s earnings in the near term. Following the sale of the lignite operations, Vattenfall’s portfolio and risk exposure have changed substantially. The dominant risk exposure is now related to price exposure for Nordic nuclear and hydro power base load generation. In addition, Vattenfall’s continuing operations generate a higher share of regulated revenue from distribution, heat and tendered wind power, which reduces the total risk exposure. On the Continent (Germany and the Netherlands) and in the UK, Vattenfall continues to have some price exposure related to the price difference between electricity and used fuel. This exposure has a lower risk profile than in the Nordic countries. Based on this, Vattenfall has decided to decrease its price hedging activity and to focus on hedging its Nordic generation. Read more on Vattenfall’s price hedging in the Risks and risk management section on the pages 62–69.
Electricity spot prices in the Nordic countries, Germany and the Netherlands, monthly averages
15
25
35
45
55
65
201820172016
EUR/MWh
EPEX APX NordPool
Electricity futures prices in the Nordic countries, Germany and the Netherlands
10
20
30
40
50
60
70
201820172016
EUR/MWh
EEX 2019
ICE 2020 EEX 2020
NPX 2019ICE 2019
NPX 2020
Price trend for coal, gas and CO2 emission allowances
20
30
40
50
60
70
80
90
100
2018201720160
5
10
15
20
25
30
35
40
USD EUR
Coal (USD/t), AP 12, Front Year
Gas (EUR/MWh), TTF, Front Year
Emission allowances CO2 (EUR/t), MidDec
VATTENFALL ANNUAL AND SUSTAINABILITY REPORT 2018 87Vattenfall's financial performance

Comments on the consolidated income statement
Sales External net sales Internal net sales Total net sales
2018 2017 2018 2017 2018 2017
Customers & Solutions 78,883 67,4022 2,435 1,551 81,318 68,9532
Power Generation 36,064 28,7973 63,9064 50,7694 99,970 79,5663
Wind 8,003 6,669 3,849 2,769 11,852 9,438
Heat 15,828 14,8822 18,142 15,842 33,970 30,7242
Distribution 17,845 16,8402 4,529 4,590 22,374 21,4302
– of which, Distribution Germany 6,265 5,970 4,053 4,141 10,318 10,111
– of which, Distribution Sweden 11,462 10,8702 493 449 11,955 11,3192
Other1 201 524 5,054 4,427 5,255 4,951
Eliminations — — –97,915 –79,948 –97,915 –79,948
Total 156,824 135,1142 — — 156,824 135,1142
1 “Other” pertains mainly to all Staff functions including treasury activities and Shared Service Centres.2 The amount has been recalculated compared with previously published information in Vattenfall’s 2017
Annual and Sustainability Report as a result of new accounting rules (IFRS 9 and 15) that took effect in 2018. See Note 2 to the consolidated accounts, Important changes in the financial statements compared with the preceding year.
3 Starting in 2018, purchases from the Nordic electricity exchange made under assignment by the sales operations are offset in the Power Generation segment (previously at the Group level) against sales of production to the Nordic electricity exchange.
4 Pertains mainly to Tradings’ sales of electricity, fuel and CO2 emission allowances to other segments within Vattenfall.
Consolidated net sales increased by SEK 21.7 billion (of which, positive currency effects of SEK 6.5 billion) compared with 2017. The increase is mainly attributable to higher sales volumes in Germany, France and the UK. Added to this were positive price effects in the Nordic countries and the Netherlands, and higher nuclear power generation.
Underlying operating profit
Amounts in SEK million 2018 2017
Operating profit (EBIT) 17,619 18,524
Depreciation, amortisation and impairment losses 16,722 15,875
Operating profit before depreciation, amortisation and impairment losses (EBITDA) 34,341 34,399
Items affecting comparability excl. impairment losses and reversed impairment losses 2,128 4,245
Underlying operating profit before depreciation, amortisation and impairment losses 36,469 38,644
Operating profit (EBIT) 17,619 18,524
Items affecting comparability1 2,264 4,679
Underlying operating profit 19,883 23,2031 See Definitions and calculations of key ratios for definition of this Alternative Performance Measure.
The underlying operating profit decreased by SEK 3.3 billion, which is mainly explained by the following:• Lower earnings contribution from the Heat operating segment
(SEK –2.6 billion), mainly owing to lower production margins and positive one-off items in 2017 of approximately SEK 800 million, partly related to subsidies for gas-fired combined heat and power plants in Germany
• Lower earnings contribution from the Power Generation operating seg-ment (SEK –1.4 billion), mainly owing to negative effects of price hedges. Contracts coupled to the Continental market are successively expiring, but together with Nordic price hedges also had negative impact during the year
• Higher earnings contribution from the Wind operating segment (SEK 1.6 billion) as a result of positive price and currency effects
• Other items, net (SEK –0.9 billion)
88 Vattenfall's financial performance VATTENFALL ANNUAL AND SUSTAINABILITY REPORT 2018

Operating segmentsOperating profit (EBIT) Underlying operating profit
2018 2017 2018 2017
Customers & Solutions 1,139 1,7722 1,269 1,8662
Power Generation 6,711 6,138 9,371 10,820
Wind 3,681 1,713 3,747 2,137
Heat 393 3,5332 771 3,3712
Distribution 6,218 6,2762 6,250 6,0752
– of which, Distribution Germany 950 948 985 962
– of which, Distribution Sweden 5,257 5,3352 5,254 5,1202
Other1 –526 –849 –1,528 –1,007
Eliminations 3 –59 3 –59
Total 17,619 18,5242 19,883 23,2032
2018 2017
Underlying operating profit 19,883 23,203
Items affecting comparability –2,264 –4,679
Financial income and expenses –3,616 –5,755
Profit before income taxes 14,003 12,7691 “Other” pertains mainly to all Staff functions including treasury activities and Shared Service Centres.2 The amount has been recalculated compared with previously published information in Vattenfall’s 2017
Annual and Sustainability Report as a result of new accounting rules (IFRS 9 and 15) that took effect in 2018. See Note 2 to the consolidated accounts, Important changes in the financial statements compared with the preceding year.
The underlying operating profit for the Customers & Solutions operating segment decreased by SEK 0.6 billion compared with 2017, mainly owing to higher margin pressure in the UK and growth activities in energy solutions. The underlying operating profit for the Power Generation ope-rating segment decreased by SEK 1.4, mainly due to hedging. Contracts coupled to the Continental market are successively expiring, but together with Nordic price hedges also had a negative impact during the year. The underlying operating profit for the Wind operating segment improved by SEK 1.6 billion, mainly owing to positive price and currency effects and
added capacity. The underlying operating profit for the Heat operating segment decreased by SEK 2.6 billion, mainly owing to higher costs for CO2 emission allowances and fuel, and a positive one-off effect of approximately SEK 800 million in 2017, partly related to subsidies for gas-fired combined heat and power (CHP) plants in Germany. The underlying operating profit for the Distribution operating segment improved by SEK 0.2 billion, mainly owing to higher gross margins in Sweden and lower costs in Germany. Read more about the Group’s operating segments in Note 7 to the consolidated accounts, Operating segments.
Items affecting comparability that affected operating profit
Amounts in SEK million 2018 2017
Capital gains 1,067 728
Capital losses –111 –89
Impairment losses –136 –438
Reversed impairment losses — 4
Provisions –1,649 –2,438
Unrealised changes in the fair value of energy derivatives –156 –3,637
Unrealised changes in the fair value of inventories 61 10
Restructuring costs –554 –348
Other infrequent items affecting comparability –786 1,529
Total –2,264 –4,679
Items affecting comparability amounted to SEK –2.3 billion in 2018. Provisions of SEK –1.6 billion were mainly related to nuclear power decom-missioning, partly owing to adjusted discount rates. Capital gains of SEK 1.1 billion pertain mainly to sales of properties in Hamburg and Berlin, and the sale of 70% of the Blakliden/Fäbodberget wind farm.
Items affecting comparability in 2017 totalled SEK –4.7 billion. Unrea-lised changes in the market value of energy derivatives and inventories
totalled SEK –3.6 billion and were mainly attributable to temporary effects related to sourcing activities. Provisions amounted to SEK –2.4 billion and were mainly related to the nuclear power operations.
Read more about impairment losses in Note 9 to the consolidated accounts, Impairment losses and reversed impairment losses.
VATTENFALL ANNUAL AND SUSTAINABILITY REPORT 2018 89Vattenfall's financial performance

Costs for CO2 emission allowancesCosts for CO2 emission allowances for own use amounted to SEK 2.1 bil-lion in 2018, compared with SEK 1.4 billion in 2017. The increase is mainly attributable to higher prices for CO2 emission allowances.
Research and developmentVattenfall conducts research and development (R&D) to contribute to and support the execution of the company’s strategy in both the short and long term. In 2018 Vattenfall invested SEK 494 million (547) in R&D. For further information on Vattenfall’s R&D activities, see pages 54–55.
Financial itemsFinancial items amounted to SEK 3.6 billion, which is SEK 2.1 billion lower than in 2017. The improvement is mainly attributable to a remeasure-ment of shares in the Swedish Nuclear Waste Fund at fair value and the repurchase of a bond during the fourth quarter of 2017.
Taxes The Group reported a tax expense of SEK 2.0 billion for 2018 and an effective tax rate of 14.3%. The low tax expense and effective tax rate are mainly attributable to two positive one-off effects. The adjusted tax rate in Sweden reduced the tax expense by SEK 0.6 billion as a result of remea-surement of deferred tax assets and deferred tax liabilities to a lower tax rate. In addition, a change in the tax law in Germany that allows for earlier loss-carryforwards can be used retroactively, which reduced the tax expense by SEK 0.5 billion. For 2017 the Group reported a tax expense of SEK 3.3 billion and an effective tax rate of 25.7%. For further information, see Note 13 to the consolidated accounts, Income taxes.
Comments on the consolidated balance sheet
Assets and capital employed
Amounts in SEK million 31 December 2018 31 December 2017
Intangible assets: current and non-current 18,792 20,137
Property, plant and equipment 238,801 227,257
Participations in associated companies and joint arrangements 5,429 4,985
Deferred and current tax assets 14,144 13,332
Non-current noninterest-bearing receivables 3,657 2,910
Contract assets 214 237
Inventories 13,647 15,687
Trade receivables and other receivables 26,003 23,437
Prepaid expenses and accrued income 8,427 7,010
Unavailable liquidity 5,596 6,978
Other 624 1,566
Total assets excl. financial assets 335,334 323,536
Deferred and current tax liabilities –15,969 –16,286
Other noninterest-bearing liabilities –2,305 –2,371
Contract liabilities –7,935 –7,533
Trade payables and other liabilities –29,482 –23,872
Accrued expenses and deferred income –16,485 –13,161
Total noninterest-bearing liabilities –72,176 –63,223
Other interest-bearing provisions not related to adjusted net debt1 –11,589 –11,316
Capital employed2 251,569 248,997
Capital employed, average 250,283 240,7781 Includes personnel-related provisions for non-pension purposes, provisions for tax and legal disputes and
certain other provisions.2 See Definitions and calculations of key ratios for definitions of this Alternative Performance Measure.
Total assets increased by SEK 53.5 billion compared with the level at 31 December 2017, to SEK 462.6 billion (409.1). Short-term derivative assets increased by SEK 12.9 billion. Property, plant and equipment increased by SEK 11.5 billion, mainly owing to investments and exchange rate effects. Cash and cash equivalents increased by SEK 8.3 billion as a result of a positive cash flow after invstements.
90 Vattenfall's financial performance VATTENFALL ANNUAL AND SUSTAINABILITY REPORT 2018

Financial position Amounts in SEK million 2018 2017
Cash and cash equivalents, and short-term investments 40,071 26,897
Committed credit facilities (unutilised) 20,510 19,688
Cash and cash equivalents, and short-term investments increased by SEK 13.2 billion compared with the level at 31 December 2017.
Committed credit facilities consist of a EUR 2.0 billion Revolving Credit Facility that expires on 10 December 2021. As per 31 December 2018, available liquid assets and/or committed credit facilities amounted to 35% of net sales. Vattenfall’s target is to maintain a level of no less than 10% of the Group’s net sales, but at least the equivalent of the next 90 days’ maturities.
Interest-bearing liabilities and net debt as per 31 December
Amounts in SEK million 2018 2017
Hybrid Capital1 –19,832 –19,118
Bond issues, commercial paper and liabilities to credit institutions –50,303 –52,113
Present value of liabilities pertaining to acquisitions of Group companies –51 –161
Liabilities to associated companies –504 –462
Liabilities to owners of non-controlling interests –10,406 –10,369
Other liabilities –7,179 –4,931
Total interest-bearing liabilities1 –88,275 –87,154
Cash and cash equivalents 17,094 8,805
Short-term investments 22,977 18,092
Loans to owners of non-controlling interests in foreign Group companies 476 997
Net debt1 –47,728 –59,2601 See Definitions and calculations of key ratios for definitions of Alternative Performance Measures.
Total interest-bearing liabilities increased by SEK 1.1 billion compared with the level at 31 December 2017. The increase is mainly attributable to the weaker Swedish krona, which had a negative effect on debt by SEK 3.3 billion.
Net debt decreased by SEK 11.5 billion compared with the level at 31 December 2017, mainly owing to a positive cash flow after investments.
Adjusted gross and net debt as per 31 December
Amounts in SEK million 2018 2017
Total interest-bearing liabilities –88,275 –87,154
50% of Hybrid Capital1 9,916 9,559
Present value of pension obligations –39,686 –41,962
Provisions for gas and wind operations and other environment related provisions –7,656 –6,507
Provisions for nuclear power (net)2 –31,920 –30,716
Margin calls received 3,370 3,312
Liabilities to owners of non-controlling interests due to consortium agreements 9,195 9,189
Adjustment related to assets/liabilities held for sale –1,743 —
Adjusted gross debt –146,799 –144,279
Reported cash and cash equivalents and short–term investments 40,071 26,897
Unavailable liquidity –5,596 –6,978
Adjusted cash and cash equivalents and short–term investments 34,475 19,919
Adjusted net debt3 –112,324 –124,3601 50% of Hybrid Capital is treated as equity by the rating agencies, which thereby reduces adjusted net
debt.2 The calculation is based on Vattenfall’s share of ownership in the respective nuclear power plants,
less Vattenfall’s share in the Swedish Nuclear Waste Fund and liabilities to associated companies. Vattenfall has the following ownership interests in the respective plants: Forsmark 66%, Ringhals 70.4%, Brokdorf 20%, Brunsbüttel 66.7%, Krümmel 50% and Stade 33.3%. (According to a special agreement, Vattenfall is responsible for 100% of the provisions for Ringhals.)
3 See Definitions and calculations of key ratios for definitions of Alternative Performance Measures.
In their assessments of a company’s credit strength, the rating agencies and analysts regularly make a number of adjustments of various items on the balance sheet in order to arrive at a figure for adjusted gross and net debt. Vattenfall’s calculations of its adjusted gross and net debt are shown in the table above.
Adjusted net debt decreased by SEK 12.0 billion, mainly owing to the lower level of net debt.
EquityThe Group’s equity increased by SEK 11.3 billion. The increase is mainly attributable to the profit for the year.
VATTENFALL ANNUAL AND SUSTAINABILITY REPORT 2018 91Vattenfall's financial performance

Comments on the consolidated statement of cash flows
Cash flow from operating activities
Amounts in SEK million 2018 2017
Funds from operations (FFO) 23,275 26,643
Cash flow from changes in operating assets and operating liabilities (working capital) 17,779 –915
Cash flow from operating activities 41,054 25,728
Funds from operations (FFO) decreased by SEK 3.4 billion in 2018 to SEK 23.3 billion (26.6), mainly owing to a lower underlying profit before depreciation/amortisation and impairment losses.
Cash flow from changes in working capital amounted to SEK 17.8 billion (–0.9) in 2018, which is mainly explained by a net change in margin calls (SEK 8.9 billion) and changes related to CO2 emission allowances (SEK 4.6 billion). Changes in inventories contributed SEK 1.5 billion, mainly related to consumption of nuclear fuel.
Cash flow from investing activities
Amounts in SEK million 2018 2017
Maintenance/replacement investments 13,479 12 637
Growth investments 8,434 8 657
Total investments 21,913 21,294
Total divestments 1,569 2,795
– of which, shares 99 1,731
Investments are specified in the table below. Divestments in 2018 pertained mainly to properties in Berlin and Hamburg.
Specification of investments
Amounts in SEK million 2018 2017
Hydro power 1,109 1,317
Nuclear power 2,389 1,885
Coal power 305 168
Gas 259 228
Wind power 7,902 5,445
Biomass, waste 112 32
Total electricity generation 12,076 9,075
Fossil-based power 3,028 1,830
Biomass, waste 148 114
Other 1,776 1,515
Total CHP/heat 4,952 3,459
Electricity networks 6,449 5,306
Total electricity networks 6,449 5,306
Purchases of shares, shareholder contributions –223 1,237
Other 1,267 1,359
Total investments 24,521 20,436
Accrued investments, unpaid invoices (–)/release of accrued investments (+) –2,608 858
Total investments with cash flow effect 21,913 21,294
Cash flow from financing activitiesCash flow from financing activities amounted to SEK –9.5 billion (–18.3) in 2018. The majority pertains to dividends to owners and minority owners (SEK –4.6 billion) and a change in short-term investments (SEK –4.5 billion). During 2017 cash flow from financing activities was affected by payment to the German fund for managing radioactive waste (SEK –17.3 billion) and repayment of a large bond issue (SEK –2.8 billion).
92 Vattenfall's financial performance VATTENFALL ANNUAL AND SUSTAINABILITY REPORT 2018

Consolidated income statement
Amounts in SEK million, 1 January–31 December Note 2018 20177
Net sales 6, 7, 8 156,824 135,114
Cost of purchases –85,196 –65,206
Other external expenses 10 –19,375 –19,466
Personnel expenses –19,157 –18,063
Other operating incomes and expenses, net 925 1,655
Participations in the results of associated companies 19 320 365
Operating profit before depreciation, amortisation and impairment losses (EBITDA) 7 34,341 34,399
Depreciation, amortisation and impairments –16,722 –15,875
Operating profit (EBIT)1, 6 7, 8, 9, 14, 15 17,619 18,524
Financial income2, 5 11 2,887 2,670
Financial expenses3, 4, 5 12 –6,503 –8,425
Profit before income taxes 14,003 12,769
Income taxes expense 13 –1,996 –3,285
Profit for the year 12,007 9,484
Attributable to owner of the Parent Company 10,157 8,333
Attributable to non-controlling interests 1,850 1,151
Supplementary information
Underlying operating profit before depreciation, amortisation and impairment losses6 7, 8 36,469 38,644
Underlying operating profit6 7, 8 19,883 23,203
Financial items, net excl. discounting effects attributable to provisions and return from the Swedish Nuclear Waste Fund –3,407 –4,538
1 Including items affecting comparability.6 –2,264 –4,679
2 Including return from the Swedish Nuclear Waste Fund. 2,030 1,138
3 Including interest components related to pension costs. –844 –820
4 Including discounting effects attributable to provisions. –2,239 –2,355
5 Items affecting comparability recognised as financial income and expenses, net. 2,040 7
6 See Definitions and calculations of key ratios for the definitions of the Alternative Performance Measures.
7 Certain amounts for 2017 have been recalculated compared with previously published information in Vattenfall’s 2017 Annual and Sustainability Report as a result of new accounting rules (IFRS 9 and 15) that took effect in 2018. See Note 2 to the consolidated accounts, Important changes in the financial statements compared with the preceding year.
VATTENFALL ANNUAL AND SUSTAINABILITY REPORT 2018 93Consolidated accounts

Consolidated statement of comprehensive income
Amounts in SEK million, 1 January–31 December 2018 2017
Profit for the year 12,007 9,4841
Other comprehensive income
Items that will be reclassified to profit or loss when specific conditions are met
Cash flow hedges – changes in fair value 7,776 4,442
Cash flow hedges – dissolved against income statement –6,066 –2,844
Cash flow hedges – transferred to cost of hedged item 3 1
Hedging of net investments in foreign operations –2,177 –1,147
Translation differences and exchange rate effects net, divested companies 2 17
Translation differences 4,193 2,3601
Income taxes related to items that will be reclassified –2372 –2172
Total Items that will be reclassified to profit or loss when specific conditions are met 3,494 2,612
Items that will not be reclassified to profit or loss
Remeasurement pertaining to defined benefit obligations –415 –659
Income taxes related to items that will not be reclassified –52 1692
Total Items that will not be reclassified to profit or loss –420 –490
Total other comprehensive income, net after income taxes 3,074 2,122
Total comprehensive income for the year 15,081 11,606
Attributable to owner of the Parent Company 12,821 10,228
Attributable to non–controlling interests 2,260 1,3781 The amount has been recalculated compared with previously published information in Vattenfall’s 2017
Annual and Sustainability Report as a result of new accounting rules (IFRS 9 and 15) that took effect in 2018. See Note 2 to the consolidated accounts, Important changes in the financial statements compared with the preceding year.
2 See row Income taxes related to other comprehensive income in the Consolidated statement of change in equity.
94 Consolidated accounts VATTENFALL ANNUAL AND SUSTAINABILITY REPORT 2018

Consolidated balance sheet
Amounts in SEK million Note 31 December 2018 31 December 20171
Assets
Non-current assets
Intangible assets: non-current 16 18,082 18,292
Property, plant and equipment 17 238,801 227,257
Participations in associated companies and joint arrangements 19 5,429 4,985
Other shares and participations 331 148
Share in the Swedish Nuclear Waste Fund 20 42,038 38,591
Derivative assets 36 13,951 12,801
Prepaid expenses 28 20
Deferred tax assets 13 11,719 12,535
Contract assets 6 44 99
Other non-current receivables 5,538 3,964
Total non-current assets 335,961 318,692
Current assets
Inventories 21 13,647 15,687
Intangible assets: current 22 710 1,845
Trade receivables and other receivables 23 26,003 23,437
Contract assets 6 170 138
Advance payments paid 24 2,926 3,600
Derivative assets 36 23,955 11,029
Prepaid expenses and accrued income 25 8,427 7,010
Current tax assets 13 2,425 797
Short-term investments 26 22,977 18,092
Cash and cash equivalents 27 17,094 8,805
Assets held for sale 28 8,313 —
Total current assets 126,647 90,440
Total assets 7 462,608 409,132
Equity and liabilities
Equity attributable to owners of the Parent Company
Share capital 6,585 6,585
Reserve for cash flow hedges 450 –541
Other reserves 2,466 455
Retained earnings incl. profit for the year 78,595 70,586
Total equity attributable to owners of the Parent Company 38 88,096 77,085
Equity attributable to non-controlling interests 15,501 15,247
Total equity 103,597 92,332
Non-current liabilities
Hybrid Capital 29 19,832 19,118
Other interest-bearing liabilities 29 43,981 54,335
Pension provisions 30 39,686 41,962
Other interest-bearing provisions 31 93,222 86,001
Derivative liabilities 36 14,042 12,798
Deferred tax liabilities 13 15,119 15,032
Contract liabilities 6 6,883 6,435
Other noninterest-bearing liabilities 32 2,305 2,371
Total non-current liabilities 235,070 238,052
Current liabilities
Trade payables and other liabilities 33 29,482 23,872
Contract liabilities 6 1,052 1,098
Advance payments received 34 15,293 8,745
Derivative liabilities 36 27,245 13,200
Accrued expenses and deferred income 35 16,485 13,161
Current tax liabilities 13 850 1,254
Other interest-bearing liabilities 29 24,462 13,701
Interest-bearing provisions 31 3,734 3,717
Liabilities associated with assets held for sale 28 5,338 —
Total current liabilities 123,941 78,748
Total equity and liabilities 462,608 409,1321 Certain amounts for 2017 have been recalculated compared with previously published information in
Vattenfall’s 2017 Annual and Sustainability Report as a result of new accounting rules (IFRS 9 and 15) that took effect in 2018. See Note 2 to the consolidated accounts, Important changes in the financial statements compared with the preceding year.
See also information on Collateral (Note 39), Contingent liabilities (Note 40) and Commitments under consortium agreements (Note 41), in the notes to the consolidated accounts.
VATTENFALL ANNUAL AND SUSTAINABILITY REPORT 2018 95Consolidated accounts

Consolidated statement of cash flows
Amounts in SEK million, 1 January–31 December Note 2018 20173
Operating activities
Operating profit before depreciation, amortisation and impairment losses 34,341 34,399
Tax paid –3,698 –3,218
Capital gains/losses, net –956 –639
Interest received 343 289
Interest paid –3,046 –4,896
Other, incl. non-cash items 37 –3,709 708
Funds from operations (FFO)1 23,275 26,643
Changes in inventories 1,549 –481
Changes in operating receivables –790 –3,387
Changes in operating liabilities 8,128 –2,250
Other changes 8,892 5,203
Cash flow from changes in operating assets and operating liabilities 17,779 –915
Cash flow from operating activities 41,054 25,728
Investing activities
Acquisitions in Group companies –31 –1,491
Investments in associated companies and other shares and participations 254 254
Other investments in non-current assets 37 –22,136 –20,057
Total investments –21,913 –21,294
Divestments 37 1,569 2,795
Cash and cash equivalents in acquired companies 5 48
Cash and cash equivalents in divested companies –43 –213
Cash flow from investing activities –20,382 –18,664
Cash flow before financing activities 20,672 7,064
Financing activities
Changes in short-term investments –4,523 5,646
Changes in loans to owners of non-controlling interests in foreign Group companies 562 1,700
Loans raised2 8,720 6,088
Amortisation of other debt –9,562 –13,438
Payment to the nuclear energy fund in Germany — –17,322
Effect of early termination of swaps related to financing activities –122 105
Dividends paid to owners –3,299 –865
Contribution/repaid contribution from owners of non-controlling interests –1,260 –243
Cash flow from financing activities –9,484 –18,329
Cash flow for the year 11,188 –11,265
Cash and cash equivalents
Cash and cash equivalents at start of year 8,805 19,995
Cash and cash equivalents included in assets held for sale –2,992 —
Cash flow for the year 11,188 –11,265
Translation differences 93 75
Cash and cash equivalents at end of year 17,094 8,805
96 Consolidated accounts VATTENFALL ANNUAL AND SUSTAINABILITY REPORT 2018
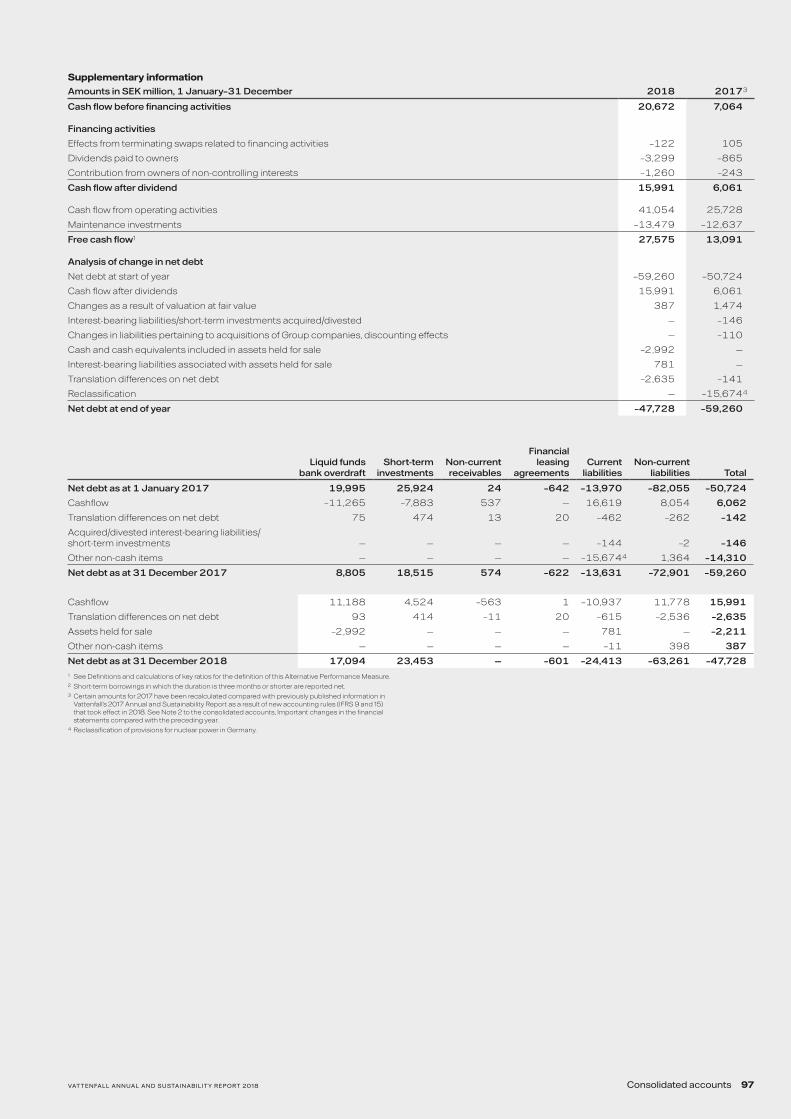
Supplementary informationAmounts in SEK million, 1 January–31 December 2018 20173
Cash flow before financing activities 20,672 7,064
Financing activities
Effects from terminating swaps related to financing activities –122 105
Dividends paid to owners –3,299 –865
Contribution from owners of non-controlling interests –1,260 –243
Cash flow after dividend 15,991 6,061
Cash flow from operating activities 41,054 25,728
Maintenance investments –13,479 –12,637
Free cash flow1 27,575 13,091
Analysis of change in net debt
Net debt at start of year –59,260 –50,724
Cash flow after dividends 15,991 6,061
Changes as a result of valuation at fair value 387 1,474
Interest-bearing liabilities/short-term investments acquired/divested — –146
Changes in liabilities pertaining to acquisitions of Group companies, discounting effects — –110
Cash and cash equivalents included in assets held for sale –2,992 —
Interest-bearing liabilities associated with assets held for sale 781 —
Translation differences on net debt –2,635 –141
Reclassification — –15,6744
Net debt at end of year –47,728 –59,260
Liquid funds bank overdraft
Short-term investments
Non-current receivables
Financial leasing
agreementsCurrent
liabilitiesNon-current
liabilities Total
Net debt as at 1 January 2017 19,995 25,924 24 –642 –13,970 –82,055 –50,724
Cashflow –11,265 –7,883 537 — 16,619 8,054 6,062
Translation differences on net debt 75 474 13 20 –462 –262 –142
Acquired/divested interest-bearing liabilities/ short-term investments — — — — –144 –2 –146
Other non-cash items — — — — –15,6744 1,364 –14,310
Net debt as at 31 December 2017 8,805 18,515 574 –622 –13,631 –72,901 –59,260
Cashflow 11,188 4,524 –563 1 –10,937 11,778 15,991
Translation differences on net debt 93 414 –11 20 –615 –2,536 –2,635
Assets held for sale –2,992 — — — 781 — –2,211
Other non-cash items — — — — –11 398 387
Net debt as at 31 December 2018 17,094 23,453 — –601 –24,413 –63,261 –47,7281 See Definitions and calculations of key ratios for the definition of this Alternative Performance Measure.2 Short-term borrowings in which the duration is three months or shorter are reported net.3 Certain amounts for 2017 have been recalculated compared with previously published information in
Vattenfall’s 2017 Annual and Sustainability Report as a result of new accounting rules (IFRS 9 and 15) that took effect in 2018. See Note 2 to the consolidated accounts, Important changes in the financial statements compared with the preceding year.
4 Reclassification of provisions for nuclear power in Germany.
VATTENFALL ANNUAL AND SUSTAINABILITY REPORT 2018 97Consolidated accounts

Consolidated statement of changes in equity
Attributable to owner of the Parent Company
Attributable to non-
controlling interests
Total equity
Amounts in SEK millionShare
capital
Reserve for
hedgesTranslation
reserveRetained earnings Total
Balance brought forward 2018 6,585 –541 455 70,586 77,085 15,247 92,332
Profit for the year — — — 10,157 10,157 1,850 12,007
Cash flow hedges – changes in fair value — 7,776 — — 7,776 — 7,776
Cash flow hedges – dissolved against income statement — –6,074 — — –6,074 8 –6,066
Cash flow hedges – transferred to cost of hedged item — 3 — — 3 — 3
Hedging of net investments in foreign operations — — –2,177 — –2,177 — –2,177
Translation differences and exchange rate effects net, divested companies — — 2 — 2 — 2
Translation differences — — 3,707 — 3,707 486 4,193
Remeasurement pertaining to defined benefit obligations — — — –310 –310 –105 –415
Income taxes related to other comprehensive income — –714 479 –28 –263 21 –242
Total other comprehensive income for the year — 991 2,011 –338 2,664 410 3,074
Total comprehensive income for the year — 991 2,011 9,819 12,821 2,260 15,081
Dividends paid to owners — — — –2,000 –2,000 –1,299 –3,299
Group contributions from (+)/to (–) owners of non-controlling interests — — — — — 743 743
Contribution to/from minority interest — — — — — –1,260 –1,260
Other changes in ownership — — — 190 190 –190 —
Total transactions with equity holders — — — –1,810 –1,810 –2,006 –3,816
Balance carried forward 2018 6,585 450 2,466 78,595 88,096 15,5011 103,597
Attributable to owner of the Parent Company
Attributable to non-
controlling interests
Total equity
Amounts in SEK millionShare
capital
Reserve for
hedgesTranslation
reserveRetained earnings Total
Balance brought forward 2017 6,585 –1,711 –733 64,131 68,272 15,528 83,800
Transitional effect of adoption of new accounting rules (IFRS 9, 15) — — — –1,550 –1,550 –84 –1,634
Profit for the year — — — 8,333 8,3332 1,151 9,484
Cash flow hedges – changes in fair value — 4,442 — — 4,442 — 4,442
Cash flow hedges – dissolved against income statement — –2,827 — — –2,827 –17 –2,844
Cash flow hedges – transferred to cost of hedged item — 1 — — 1 — 1
Hedging of net investments in foreign operations — — –1,147 — –1,147 — –1,147
Translation differences and exchange rate effects net, divested companies — — 17 — 17 — 17
Translation differences — — 2,065 — 2,0652 295 2,360
Remeasurement pertaining to defined benefit obligations — — — –585 –585 –74 –659
Income taxes related to other comprehensive income — –473 253 149 –71 23 –48
Total other comprehensive income for the year — 1,143 1,188 –436 1,895 227 2,122
Total comprehensive income for the year — 1,143 1,188 7,897 10,228 1,378 11,606
Dividends paid to owners — — — — — –865 –865
Group contributions from (+)/to (–) owners of non-controlling interests — — — — — –153 –153
Contribution to/from minority interest — — — — — –243 –243
Changes as a result of changed ownership — — — — — –179 –179
Total transactions with equity holders — 27 — 108 135 –1,575 –1,440
Balance carried forward 2017 6,585 –541 455 70,586 77,085 15,2471 92,3321 Of which, reserve for hedges SEK 35 million (29).2 The amount has been recalculated compared with previously published information in Vattenfall’s 2017
Interim reports and 2017 Annual and Sustainability Report as a result of new accounting rules (IFRS 9 and 15) that took effect in 2018. See Note 2 to the consolidated accounts.
See also Note 38 to the consolidated accounts, Specifications of equity.
98 Consolidated accounts VATTENFALL ANNUAL AND SUSTAINABILITY REPORT 2018
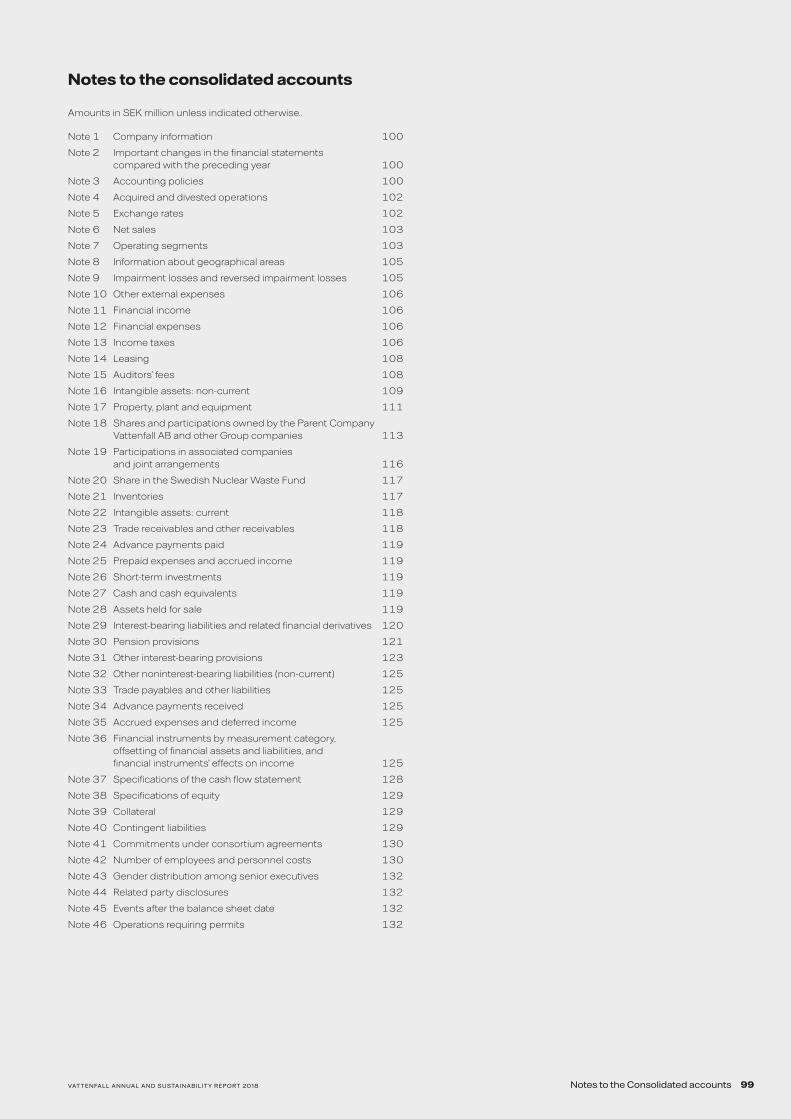
Notes to the consolidated accounts
Amounts in SEK million unless indicated otherwise..
Note 1 Company information 100
Note 2 Important changes in the financial statements compared with the preceding year 100
Note 3 Accounting policies 100
Note 4 Acquired and divested operations 102
Note 5 Exchange rates 102
Note 6 Net sales 103
Note 7 Operating segments 103
Note 8 Information about geographical areas 105
Note 9 Impairment losses and reversed impairment losses 105
Note 10 Other external expenses 106
Note 11 Financial income 106
Note 12 Financial expenses 106
Note 13 Income taxes 106
Note 14 Leasing 108
Note 15 Auditors’ fees 108
Note 16 Intangible assets: non-current 109
Note 17 Property, plant and equipment 111
Note 18 Shares and participations owned by the Parent Company Vattenfall AB and other Group companies 113
Note 19 Participations in associated companies and joint arrangements 116
Note 20 Share in the Swedish Nuclear Waste Fund 117
Note 21 Inventories 117
Note 22 Intangible assets: current 118
Note 23 Trade receivables and other receivables 118
Note 24 Advance payments paid 119
Note 25 Prepaid expenses and accrued income 119
Note 26 Short-term investments 119
Note 27 Cash and cash equivalents 119
Note 28 Assets held for sale 119
Note 29 Interest-bearing liabilities and related financial derivatives 120
Note 30 Pension provisions 121
Note 31 Other interest-bearing provisions 123
Note 32 Other noninterest-bearing liabilities (non-current) 125
Note 33 Trade payables and other liabilities 125
Note 34 Advance payments received 125
Note 35 Accrued expenses and deferred income 125
Note 36 Financial instruments by measurement category, offsetting of financial assets and liabilities, and financial instruments’ effects on income 125
Note 37 Specifications of the cash flow statement 128
Note 38 Specifications of equity 129
Note 39 Collateral 129
Note 40 Contingent liabilities 129
Note 41 Commitments under consortium agreements 130
Note 42 Number of employees and personnel costs 130
Note 43 Gender distribution among senior executives 132
Note 44 Related party disclosures 132
Note 45 Events after the balance sheet date 132
Note 46 Operations requiring permits 132
VATTENFALL ANNUAL AND SUSTAINABILITY REPORT 2018 99Notes to the Consolidated accounts

Note 1 Company information
Vattenfall’s year-end report for 2018 was approved for publication on 6 February 2019 in accordance with a decision by the Board of Directors. The Annual and Sustainability Report was approved in accordance with a decision by the Board of Directors on 19 March 2019. The Parent Com-pany, Vattenfall AB (publ) with corporate identity number 556036-2138, is a limited liability company with its registered office in Solna, Sweden and with the mailing address SE-169 92 Stockholm, Sweden. The consolida-ted balance sheet and income statement included in Vattenfall’s Annual and Sustainability Report will be submitted at the Annual General Mee-ting (AGM) on 11 April 2019. The main activities of the Group are described in Note 7 to the consolidated accounts, Operating segments.
Note 2 Important changes in the financial statements compared with the preceding year
Recalculation of financial statements for 2017As shown in Note 3 to the consolidated accounts, Accounting policies, new accounting rules apply as from 2018 in accordance with IFRS 9 – “Financial Instruments” and IFRS 15 – “Revenue from Contracts with Customers”. The changes in IFRS 9 and 15 entail that the consolidated financial statements for the comparison year 2017 have been recalcula-ted. The effect on the balance sheet total is an increase by SEK 1.1 billion as per 1 January 2017 and an increase by SEK 1.3 billion as per 31 Decem-ber 2017. The effect on the profit for the year 2017 is a decrease by SEK 87 million.
Presentation of Consolidated income statement and Consolidated statement of cash flowsStarting with the first quarter of 2018 Vattenfall has changed the presentation of the income statement from a function of expense method to a nature of expense method. The external presentation of the income statement has thereby been aligned with the internal governance of Vattenfall’s business. In addition, relevant items such as depreciation and amortisation and personnel-related expenses are now directly visible in the income statement. Since operating profit before depreciation, amortisation and impairment losses (EBITDA) is presented as a separate line item in the income statement, EBITDA is now used as the starting point for the consolidated statement of cash flows instead of profit before income taxes. This affects some line items within FFO (funds from operations), but FFO remains unchanged. The comparative figures have been adjusted accordingly.
Note 3 Accounting policies
Conformity with standards and regulations The consolidated accounts have been prepared in accordance with the International Financial Reporting Standards (IFRS) issued by the International Accounting Standards Board (IASB) as well as the interpreta-tions issued by the IFRS Interpretations Committee (IFRSIC) as endorsed by the European Commission for application within the EU. In addition, recommendation RFR 1 – “Supplementary Accounting Policies for Groups”, issued by the Swedish Financial Reporting Board (RFR), has been applied. RFR 1 specifies the additions to the IFRS disclosure requirements that are required by the Swedish Annual Accounts Act.
New IFRSs and interpretations effective as from 2018Presented below are the new accounting standards that have a material impact on the Vattenfall’s Group’s financial statements.
IFRS 9 – “Financial Instruments”IFRS 9 – “Financial Instruments”, which began to be applied on 1 January 2018, replaces IAS 39 – “Financial Instruments: Recognition and Measure-ment”. IFRS 9 includes new principles for classification and measurement of financial instruments, changed principles for impairment of credit los-ses, and new rules for hedge accounting. Vattenfall has chosen to apply IFRS retrospectively and has restated the comparative figures for 2017. The effect on equity of changed accounting policies as per 1 January 2017 was only SEK 1 million and was attributable solely to the changed rules for recognition of impairment losses under IFRS 9. The small effect is due to the counterparties’ good credit ratings. As per 31 December 2017 the effect in the income statement was SEK –1 million and was att-ributable solely to impairment. A small portion of short-term investments has been remeasured. With respect to hedge accounting, no comparison figures have been calculated for 2017. The new hedge accounting rules
have had only a marginal effect on Vattenfall’s financial statements. IFRS 9 has not entailed any change in the reporting of financial liabilities for Vattenfall.
The principles for classification and measurement of financial instruments, recognition of impairments of financial assets and hedge accounting, are described in Note 36 to the consolidated accounts, Financial instruments by measurement category, offsetting of financial assets and liabilities, and financial instruments’ effects on income.
IFRS 15 – “Revenue from Contracts with Customers”IFRS 15 – “Revenue from Contracts with Customers”, which began to be applied on 1 January 2018, is a new revenue recognition standard that provides a single, principles-based model for all revenue recogni-tion, regardless of the type of transaction or sector. IFRS 15 replaces all previously issued standards and interpretations that address revenue recognition, including IAS 11, IAS 18, and the related IFRICs 13, 15 and 18. The core principle in IFRS 15 is that revenue should be recognised in a way that reflects the transfer of control of goods or services to the custo-mers in an amount that reflects the consideration to which we expect to receive. IFRS 15 introduces a five step model to be applied when recognising revenue in accordance with the core principle. The standard also contains special rules concerning the recognition of costs related to the obtaining of contracts with customers.Changes compared with the previous revenue recognition standard, IAS 18 (including IAS 11), are in the following areas:• Discounts and bonuses: Vattenfall offers customers discounts and
bonuses primarily on sales of electricity through various campaigns. Various types of discounts and bonuses are offered in different countries. According to IFRS 15, discounts and bonuses are to be reported when the performance obligation to the customer is satisfied, which in general is when the customer consumes the electricity.
• Cost to obtain contracts: Vattenfall sells its products through various sales channels and incurs various types of costs in connection with this. According to IFRS 15, incremental costs to obtain contracts are to be capitalised and amortised over the terms of the contracts. Prior to implementation of IFRS 15, some of these costs have been expensed.
• Connection fees: Under IFRS 15, the connection fees paid by customers for connecting them to the grid are recognised as revenue over time since Vattenfall is responsible for maintenance and repairs of the assets used in the physical connection. For some of Vattenfall’s units, connec-tion fees were recognised as revenue upon connection under IAS 18.
The combined effects for the Vattenfall Group of implementation of IFRS 15 on the restated financial statements for 2017 are a decrease in revenue by SEK 181 million and a decrease in costs by SEK 62 million, plus certain effects on deferred taxes. The effect on equity as per 1 January 2017 is a decrease by SEK 1,634 million.
New IFRSs and interpretations effective as from 2019 and laterA number of accounting standards and interpretations have been publis-hed, but have not become effective. Below are the changes in standards that will affect the Vattenfall Group’s financial statements. Other revised accounting standards and interpretations are not considered to have a material impact on the Vattenfall Group’s financial statements.
IFRS 16 – “Leases”IFRS 16 – “Leases” replaces IAS 17 – “Leases” along with the accompany-ing interpretations. IFRS 16 becomes effective as from 2019. Vattenfall is transitioning to the new leasing standard by applying the modified retrospective approach, and therefore the 2018 financial statements will not be restated. Starting 1 January 2019, a right-of-use asset along with a lease liability will be recognised on the balance sheet for all lease contracts except for leases for which the underlying asset is of low value and short-term leases. Short-term leases are leasing contracts with a duration of 12 months or less.
As per 1 January 2019, a lease liability will be recognised for leases that were previously classified as operating leases through application of IAS 17. The lease liability is measured as the present value of the remaining lease payments discounted by Vattenfall’s currency and term specific incremental borrowing rate as per 1 January 2019. The right-of-use asset is recognised initially at the same value as the lease liability. In the income statement, the lease expenses will be replaced by depreciation of the right-of-use asset and interest expense on the lease liability. The implementation of IFRS 16 also entails a positive effect on operating cash flows and a negative effect on cash flow from financing activities.
In its capacity as a lessee, Vattenfall mainly has lease contracts relating to real estate leases (42%), land right leases (41%) and car leases (7%).
100 Notes to the Consolidated accounts VATTENFALL ANNUAL AND SUSTAINABILITY REPORT 2018

Definition of a leasePreviously, Vattenfall determined at inception whether a contract con-tained a lease under IAS 17 and IFRIC 4. Starting on 1 January 2019 the Group applies the definition under IFRS 16 to determine whether or not a contract contains a lease.
As a lesseeUnder IAS 17, Vattenfall classified leases as either operating leases or finance leases. Under IFRS 16 this distinction is no longer made for lessees. A right-of-use asset along with a corresponding liability will be created for all leases except for leases for which the underlying asset is of low value and short-term leases.
Impact on the Vattenfall’s Group’s financial statementsImplementation of IFRS 16 entails an increase of the Group’s property, plant and equipment and interest-bearing liabilities by SEK 4.6 billion. IFRS 16 has no effect on equity.
Lease liabilities as per 1 January 2019 amount to SEK 5.2 billion. The difference between the operating lease commitment as per 31 December 2018 according to IAS 17 and lease liabilities as per 1 January 2019 according to IFRS 16 is shown below:
Operating lease commitment as per 31 December 2018 (See note 14) 5,830
Recognition exemption for short-term leases and leases of low-value assets –202
Effect of discounting operating lease commitment –1 ,019
Lease liabilities as a result of IFRS 16 implementation 4,609
Finance lease liabilities recognised as per 31 December 2018 601
Lease liabilities as per 1 January 2019 5,210
In 2019, EBITDA is expected to increase by approximately SEK 750 million and EBIT is expected to increase by approximately SEK 100 million.
As a lessorVattenfall’s lessor accounting remains mainly unchanged with application of the new leasing standard IFRS 16.
Basis of measurement Assets and liabilities are reported at cost or amortised cost, with the exception of certain financial assets and liabilities and inventories held for trading, which are measured at fair value. Fair value is defined as the price that would be received to sell an asset or paid to transfer a liability in an orderly transaction between market participants at the measurement date. Vattenfall uses valuation methods that reflect the fair value of an asset or liability appropriately. Financial assets and liabilities that are measured at fair value are described below according to the fair value hierarchy (levels), which in IFRS 13 is defined as follows:• Level 1: Quoted prices (unadjusted) in active markets for identical assets
or liabilities.• Level 2: Inputs other than quoted prices included in Level 1 that are
observable for the asset or liability, either directly (that is, as prices) or indirectly (that is, derived from prices).
• Level 3: Inputs for the asset or liability that are not based on observable market data (that is, unobservable inputs).
Classification into a level is determined by the lowest level input that is significant for the measurement of the fair value at the end of a reporting period. Vattenfall assesses whether reclassifications between the levels are necessary. Observable input data are used whenever possible and relevant. For assets and liabilities included in Level 3, fair value is model-led either on the basis of market prices with adjustments that consider specific terms of a contract, or on the basis of unobservable inputs such as future cash flows. The assumptions for the estimated cash flows are monitored on a regular basis and adjusted if necessary.
Functional and presentation currencies The functional currency is the currency of the primary economic environment in which each Group entity operates. The Parent Company’s functional currency is Swedish kronor (SEK), which is also the presenta-tion currency of both the Parent Company and the Group. This means that the financial statements are presented in Swedish kronor. Unless otherwise stated, all figures are rounded off to the nearest million Swedish kronor (SEK million).
Significant accounting policies The accounting policies of the Group described below and in each respective note to the consolidated accounts have been applied consis-tently for all periods presented in the consolidated financial statements.
Principles of consolidation The consolidated financial statements cover the Parent Company, subsi-diaries, associated companies, joint ventures and joint arrangements that are reported as a joint operation according to IFRS 11.
Subsidiaries Subsidiaries are all entities over which the Parent Company has control. Control is considered to exist when the following three criteria are met: (1) the investor is exposed to or is entitled to a variable return from the investment, (2) the investor has the opportunity to influence the return through its opportunity to govern the company, and (3) there is a link between the return that is received and the opportunity to govern the company. By influence is meant the rights that allow the investor to govern the relevant business, that is, the business which significantly influences the company’s return. Business combinations are accounted for using the purchase method. Subsidiaries’ financial statements, which are prepared in accordance with the Group’s accounting policies, are included in the consolidated accounts from the point of acquisition to the date when control ceases.
Joint arrangementsA joint arrangement is an arrangement over which two or more parties have joint control. Joint arrangements are classified as a joint operation or joint venture. A joint operation entails that the parties that have joint control of the arrangement have rights to the assets, and obligations for the liabilities, relating to the arrangement. A joint venture entails that the parties that have joint control of the arrangement have rights to the net assets of the arrangement. In a joint operation, the respective owners recognise in relation to their interest in the joint organisation: their assets and liabilities as well as their respective share of assets and liabilities held or incurred jointly. Joint ventures are reported in accordance with the equity method.
Associated companies Associated companies are companies in which the Group has a significant – but not controlling – influence or joint control with other owners over their operational and financial management, usually through shareholdings corresponding to between 20% and 50% of the votes. From the point at which the significant influence is acquired, participa-tions in associated companies are reported in the consolidated accounts in accordance with the equity method.
Transactions that are eliminated upon consolidation Intra-Group receivables and liabilities, income and expenses, as well as gains or losses arising from intra-Group transactions between Group companies, are eliminated in their entirety when preparing the consolida-ted accounts. Gains arising from transactions with associated companies and joint ventures are eliminated to an extent that corresponds to the Group’s holding in the company. Losses are eliminated in the same man-ner as gains, but are treated as an indicator of impairment.
Foreign currenciesTransactions in foreign currencies Transactions in foreign currencies are translated to the functional cur-rency at the exchange rate on the day of the transaction. On the balance sheet date, monetary assets and liabilities in foreign currencies are trans-lated to the functional currency at the exchange rate applicable on that day. Exchange rate differences arising from translation of currencies are reported in the income statement. Operationally derived exchange gains and losses are shown under Other operating income and Other operating expenses, respectively. Financially derived exchange gains and losses are shown as Financial income and Financial expenses, respectively.
Financial reporting of foreign activities Assets and liabilities of foreign activities, including goodwill and other consolidated surplus and deficit values, are translated to SEK at the exchange rate in effect on the balance sheet date. Income and expenses of foreign activities are translated to SEK using an average exchange rate. Translation differences arising from foreign currency translation of foreign activities are reported in Other comprehensive income.
For the Vattenfall Group, key exchange rates applied in the accounts are provided in Note 5 to the consolidated accounts, Exchange rates.
VATTENFALL ANNUAL AND SUSTAINABILITY REPORT 2018 101Notes to the Consolidated accounts

Important estimations and assessments in the preparation of the financial statementsPreparation of the financial statements in accordance with IFRS requires the company’s executive management and Board of Directors to make estimations and assessments as well as to make assumptions that affect application of the accounting policies and the reported amounts of assets, liabilities, income and expenses. These estimations and assessments are based on historic experience and other factors that seem reasonable under current conditions. The results of these estimations and assessments are then used to establish the reported values of assets and liabilities that are not otherwise clearly documented from other sources. The final outcome may deviate from the results of these estimations and assessments. The estimations and assessments are revised on a regular basis. The effects of changes in estimations are reported in the period in which the changes were made if the changes affected this period only or in the period the changes were made and future periods if the changes affect both the current period and future periods.
Important estimations and assessments are described further in the following notes to the consolidated accounts:• Note 13 Income taxes• Note 16 Intangible assets: non-current• Note 17 Property, plant and equipment• Note 28 Assets held for sale• Note 30 Pension provisions• Note 31 Other interest-bearing provisions
Note 4 Acquired and divested operations
Acquired operationsAcquisitions 2018In 2018, no major acquisitions of operations were made by Vattenfall.
Acquisitions 2017The main acquisitions in 2017 were of I Supply Energy Ltd, a gas and electricity supplier based in Bournemouth, UK and Windcollectief Wieringermeer B.V., a wind project in the Netherlands. The total of the net assets acquired in 2017 was SEK 1,439 million and the total purchase consideration paid was SEK 1,561 million.
Divested operationsDivestments in 2018In January 2018 Vattenfall divested Forst Briesnig, a small onshore wind project in Germany. In March 2018, 100% of the shares were sold in Vattenfall Europe Netcom GmbH, a provider of telecommunication services based in Germany. In October 2018, Vattenfall sold 70% of the shares in Blakliden/Fäbodberget onshore wind farms in Sweden. Together with the partners, Vattenfall has joint control over the project and will classify Blakliden/ Fäbodberget as a joint venture.
Total net assets divested in 2018 amount to SEK 88 million. The effect on cash flow for the year was SEK 99 million. A capital gain of SEK 316 mil-lion was recognised, which includes revaluation of remaining holdings of Blakliden/Fäbodberget in accordance with IFRS 10, Consolidated Financial Statements.
Divestments in 2017Divestments in 2017 consisted mainly of the sales of T.A. Lauta GmbH & Co. oHG, IKWR Industriekraftwerk Rüdersdorf GmbH and Västerbergslagens Kraft AB.
Note 5 Exchange rates
Key exchange rates applied in the accounts of the Vattenfall Group:
Average rate Balance sheet date rate
Currency 2018 2017 31 December 2018 31 December 2017
Euro countries EUR 10.2591 9.6392 10.2548 9.8438
Denmark DKK 1.3765 1.2958 1.3733 1.3222
Norway NOK 1.0641 1.0316 1.0308 1.0004
Poland PLN 2.4074 2.2659 2.3841 2.3567
UK GBP 11.5785 11.0311 11.4639 11.0950
USA USD 8.6988 8.5405 8.9562 8.2080
102 Notes to the Consolidated accounts VATTENFALL ANNUAL AND SUSTAINABILITY REPORT 2018

Note 6 Net sales
Accounting policyNet sales include revenue from sales and distribution of electricity and heat, sales of gas, energy trading and other revenues such as service and consulting assignments and connection fees.
Vattenfall offers customers discounts and bonuses on sales of electricity, gas and heat through various campaigns. Various types of discounts and bonuses are offered from country to country. Vattenfall recognises discounts and bonuses when the performance obligation to the customer is satisfied, which in general is when the electricity, gas or heat has been delivered to the customer.
Various sales channels are used to sell Vattenfall’s products, which gives rise to different types of costs associated with sales activities. These costs to obtain a contract related to revenues from contracts with customers are shown in Note 16 to the consolidated accounts, Intangible assets: non-current. The amortisation schedule depends on the contract duration.
Sales and distribution of electricity, heat and gas Sales of electricity, heat and gas and related distribution are recognised as revenue at the time of delivery, excluding value-added tax and excise taxes. Depending on the system for metering of consumption, Vattenfall invoices either based on expected consumption, with a reconciliation when the readout takes place, or based on actual consumption.
Vattenfall’s electricity transactions between Nordic electricity genera-tion and sales activities in the Nordic countries are transactions vis-à-vis the Nordic electricity exchange. The purchases that the sales activities make from the Nordic electricity exchange are, at the Group level, offset against sales of generation to the Nordic electricity exchange.
Connection fees Distribution and Heat are responsible for physical connections of the respective distribution networks to houses and buildings. The fee for the physical connection is paid by the customer when the connection is
established. Revenue from connection fees is recognised over time since Vattenfall handles maintenance and repairs of the assets used in the physical connection, which is satisfied over time. The basis for revenue recognition of connection fees is the useful life of the underlying assets.
Vattenfall recognises revenues from contracts with customers and other revenues through profit or loss.
2018 2017
Sales of electricity 93,384 77,038
Sales of gas 17,212 15,039
Sale of heat and steam 13,315 12,540
Distribution 15,951 15,538
Sale of service and consulting services 5,783 5,027
Total revenues from contracts with customers 145,645 125,182
Other revenues 11,179 9,932
Total 156,824 135,114
Revenue from contracts with customers is recognised when the perfor-mance obligation is satisfied, but the payment recognised may not match the revenue for the period. This results in the recognition of contract assets and contract liabilities.
Contract balances 2018 2017
Contract assets 214 237
– of which, released as cost from opening balance during the year 446 564
Contract liabilities 7,935 7,533
– of which, released as revenue from opening balance during the year 577 425
Note 7 Operating segments
Accounting policyAn operating segment is a component of the Group that engages in business activities from which it may earn revenues and incur expenses and for which discrete financial information is available. An operating segment’s result is reviewed regularly by “the chief operating decision maker”, who in Vattenfall is the Chief Executive Officer, to assess its performance and to make decisions about resources to be allocated to the operating segment.
Financial informationVattenfall is organised in six Business Areas: Customers & Solutions, Generation, Markets, Wind, Heat, and Distribution. The aim with the orga-nisational structure is to increase the Group’s business and performance focus, and to capitalise on cross-border synergies. The segment reporting corresponds with Vattenfall’s organisational structure.
Areas of responsibility for the operating segmentsThe Customers & Solutions operating segment is responsible for sales of electricity, gas and energy services in all of Vattenfall’s markets.
The Power Generation operating segment comprises the Generation and Markets Business Areas. The segment includes Vattenfall’s hydro and nuclear power operations, optimisation and trading operations.
The Wind operating segment is responsible for Vattenfall’s wind power operations.
The Heat operating segment comprises Vattenfall’s heat operations, including all thermal operations.
The Distribution operating segment comprises Vattenfall’s electricity distribution operations in Sweden and Germany (Berlin).
The financial steering key performance indicators for the operating segments are return on capital employed, underlying operating profit, operating expenses and cash flow. The financial information in the IFRS reporting is used to calculate these key performance indicators.
Staff Functions and Shared Service CentresA number of Group-wide Staff Functions direct, administrate and support the business activities. The Staff Functions are centrally placed within the organisation as a whole and in the Business Areas. Shared Service Centres (Shared Services) focus on transaction-related processes and are an integral part of Vattenfall’s business activities. Shared Services are led with a focus on efficiency and utilisation of scale economies. Staff Functions and Shared Services are reported under the heading Other.
External net sales Internal net sales Total net sales
2018 2017 2018 2017 2018 2017
Customers & Solutions 78,883 67,4022 2,435 1,551 81,318 68,9532
Power Generation 36,064 28,7973 63,9064 50,7694 99,970 79,5663
Wind 8,003 6,669 3,849 2,769 11,852 9,438
Heat 15,828 14,8822 18,142 15,842 33,970 30,7242
Distribution 17,845 16,8402 4,529 4,590 22,374 21,4302
– of which, Distribution Germany 6,265 5,970 4,053 4,141 10,318 10,111
– of which, Distribution Sweden 11,462 10,8702 493 449 11,955 11,3192
Other1 201 524 5,054 4,427 5,255 4,951
Eliminations — — –97,915 –79,948 –97,915 –79,948
Total 156,824 135,1142 — — 156,824 135,1142
VATTENFALL ANNUAL AND SUSTAINABILITY REPORT 2018 103Notes to the Consolidated accounts

Operating profit before depreciation, amortisation
and impairment losses (EBITDA)
Underlying operating profit before depreciation,
amortisation and impairment losses
2018 2017 2018 2017
Customers & Solutions 2,650 2,9132 2,663 3,0062
Power Generation 10,170 9,254 12,830 13,936
Wind 8,277 6,404 8,328 6,397
Heat 4,071 7,1142 4,448 6,9512
Distribution 9,260 9,1642 9,292 8,9632
– of which, Distribution Germany 1,923 1,822 1,957 1,835
– of which, Distribution Sweden 7,299 7,3492 7,297 7,1352
Other1 –90 –391 –1,095 –550
Eliminations 3 –59 3 –59
Total 34,341 34,3992 36,469 38,6442
Operating profit (EBIT) Underlying operating profit
2018 2017 2018 2017
Customers & Solutions 1,139 1,7722 1,269 1,8662
Power Generation 6,711 6,138 9,371 10,820
Wind 3,681 1,713 3,747 2,137
Heat 393 3,5332 771 3,3712
Distribution 6,218 6,2762 6,250 6,0752
– of which, Distribution Germany 950 948 985 962
– of which, Distribution Sweden 5,257 5,3352 5,254 5,1202
Other1 –526 –849 –1,528 –1,007
Eliminations 3 –59 3 –59
Total 17,619 18,5242 19,883 23,2032
2018 2017
Underlying operating profit 19,883 23,203
Items affecting comparability (for specification, see page 89) –2,264 –4,679
Financial income and expenses –3,616 –5,755
Profit before income taxes 14,003 12,769
Investments Assets
2018 2017 2018 2017
Customers & Solutions 785 711 51,016 47,1872
Power Generation 3,759 3,419 305,567 263,820
Wind 5,626 7,161 67,505 59,381
Heat 5,125 4,215 106,745 101,3432
Distribution 6,554 5,483 61,900 57,6222
– of which, Distribution Germany 1,735 1,490 16,278 16,076
– of which, Distribution Sweden 4,717 3,993 45,180 41,5462
Other1 127 3112 168,124 148,478
Eliminations –63 –6 –298,2495 –268,6995
Total 21,913 21,2942 462,608 409,1322
1 “Other” pertains mainly to all Staff functions including treasury activities and Shared Service Centres.2 The amount has been recalculated compared with previously published information in Vattenfall’s 2017
Annual and Sustainability Report as a result of new accounting rules (IFRS 9 and 15) that took effect in 2018. See Note 2 to the consolidated accounts, Important changes in the financial statements compared with the preceding year.
3 Starting in 2018, purchases from the Nordic electricity exchange made under assignment by the sales operations are offset in the Power Generation segment (previously at the Group level) against sales of production to the Nordic electricity exchange.
4 Pertains mainly to Tradings’ sales of electricity, fuel and CO2 emission allowances to other segments within Vattenfall.
5 Chiefly concerns Tradings’ liquid assets and financial receivables from other operating segments.
104 Notes to the Consolidated accounts VATTENFALL ANNUAL AND SUSTAINABILITY REPORT 2018

Note 8 Information about geographical areas
External net sales Internal net sales Total net sales
2018 2017 2018 2017 2018 2017
Sweden 47,785 43,3642 8,677 4,417 56,462 47,7812
Germany 75,082 63,4892 56,156 59,824 131,238 123,3132
Netherlands 26,204 22,300 38,713 58,514 64,917 80,814
Other countries 7,753 5,9611 3,626 5,720 11,379 11,681
Eliminations — — –107,172 –128,475 –107,172 –128,4752
Total 156,824 135,1142 — — 156,824 135,1142
Operating profit (EBIT) Underlying operating profit
Intangible assets: non-current, property, plant and equipment
and investment property
2018 2017 2018 2017 2018 2017
Sweden 13,085 11,8612 16,177 14,2752 119,086 113,444
Germany 2,155 6,9802 1,456 7,2832 70,147 71,741
Netherlands 1,235 –7992 1,098 1,0922 35,541 34,3712
Other countries 1,144 482 1,152 553 32,109 25,993
Total 17,619 18,5242 19,883 23,2032 256,883 245,5492
1 Starting in 2018, purchases from the Nordic electricity exchange made under assignment by the sales operations are offset in Other countries (previously at the Group level) against sales of production to the Nordic electricity exchange.
2 The amount has been recalculated compared with previously published information in Vattenfall’s 2017 Annual and Sustainability Report as a result of new accounting rules (IFRS 9 and 15) that took effect in 2018. See Note 2 to the consolidated accounts, Important changes in the financial statements compared with the preceding year.
Note 9 Impairment losses and reversed impairment losses
Accounting policyGeneral principlesAssessments are made throughout the year for any indication that an asset may have decreased in value. If there is an indication of this kind, the asset’s recoverable amount is estimated. For goodwill and other intangible assets with an indefinite useful life and for intangible assets that are still not ready for use, the recoverable amount is calculated at least annually or as soon as there is an indication that an asset has decreased in value.
If the essentially independent cash flow for an individual asset cannot be established for the assessment of any need for impairment, the assets must be grouped at the lowest level where it is possible to identify the essentially independent cash flow (a so-called cash-generating unit). An impairment loss is reported when an asset or cash-generating unit’s reported value exceeds the recoverable amount. Any impairment loss is recognised in profit or loss. Impairment of assets attributable to a cash-generating unit is allocated primarily to goodwill. Thereafter, a proportional impairment loss is conducted of other assets that are part of the unit.
Calculation of the recoverable amountThe recoverable amount is the higher of fair value less costs to sell and value in use. When calculating value in use, the future cash flow is discounted by a discounting rate that takes into consideration risk-free interest and the risk associated with the specific asset.
Reversal of impairment lossesImpairment of goodwill is never reversed. Impairment of other assets is reversed if a significant and lasting change has occurred in the assump-tions that formed the basis for the calculation of the recoverable amount. An impairment loss is reversed only if the asset’s carrying amount after reversal does not exceed the carrying amount that the asset would have had if the impairment loss had not been recognised.
Financial informationProcess for impairment testing The main assumptions that executive management has used in calculating projections of future cash flows in cash-generating units with finite useful lives are based on forecasts of the useful life of the respective assets. The projected cash flows are based on market prices and on Vattenfall’s long-term market outlook. The long-term market outlook is based on internal and external input parameters and is benchmarked against external price projections. Based on the price assumptions, the
dispatch of the power plants is calculated, taking technical, economic and legal constraints into consideration. Technical flexibility of the assets, that is the ability to adapt generation to changes in spot market prices, has been taken into account. Cash flow projections of other cash-genera-ting units are based on the business plan for the coming five years, after which their residual value is taken into account, based on a growth factor of 0%–0.5% (0%–0.5%). If the final year of the business plan horizon does not represent reasonable basis for assessing long-term value, an extended forecast may be required to arrive at a steady-state earnings situation on which to calculate the terminal value.
Future cash flows have been discounted to value in use using the following discount rates:
2018 2017
Before tax After tax Before tax After tax
Discount rate regulated business, % 4.8–6.1 3.8–4.7 5.9 4.5
Discount rate non-regulated business, % 6.6–9.4 4.9–7.0 6.7–9.5 5.1–7.2
The discount rate varies for the various asset classes, depending on their risk. When setting the discount rate for non-regulated business, consi-deration has been given to the extent of exposure this has for changes in wholesale prices of electricity, fuel, CO2 emission allowances, and regulatory risks. An increase in the discount rate by 0.5 percentage points would give rise to a need to recognise additional impairment losses of approximately SEK 1 billion.
Electricity prices and margins for generation assets represent another major value driver. Electricity prices are relevant for hydro and nuclear power plants, while the most important production margins are the “clean spark spread” for gas-fired power plants and the “clean dark spread” for hard coal-fired power plants. Those spreads include electricity prices as well as the respective cost for fuel and CO2 emission allowances to produce the electricity, considering fuel type and efficiency factors. Based on the assumptions used in the impairment testing, a decrease in future electricity prices by 5%, with unchanged costs for fuel and CO2 emission allowances, would lead to a decrease in the value of fossil-based assets in Germany and the Netherlands by between 12% and 22%, depending on the type of asset. This would lead to recognition of further impairment losses of approximately SEK 1 billion. For other assets, such a decrease in electricity prices would not lead to any impairment.
Vattenfall has performed impairment testing by calculating the recoverable amount of the cash-generating units. The structure of the cash-generating units, which represent the smallest group of identifiable
VATTENFALL ANNUAL AND SUSTAINABILITY REPORT 2018 105Notes to the Consolidated accounts

assets that generate continuous cash inflows that are largely inde-pendent of other assets or groups of assets, is based on the Group’s Business Area structure.
Vattenfall closely monitors market developments on a continuous basis and their impact on operations.
Goodwill is not amortised but is instead tested annually for impairment. Impairment testing of goodwill is included in the impairment testing process described above.
No previously recognised impairment losses were reversed in the income statement in 2018.
Impairment losses 2018Impairment losses charged against operating profit in 2018 amounted to SEK 136 million. Of this total, SEK 117 million is attributable to the Customers & Solutions operating segment.
Impairment losses 2017Impairment losses charged against operating profit in 2017 amounted to SEK 438 million. Of this total, SEK 436 million is attributable to the Wind operating segment.
Note 10 Other external expenses2018 2017
Purchased services 10,887 10,286
IT expenses 1,950 1,669
Consulting expenses 4,175 3,686
Rent and lease expenses 1,090 1,039
Marketing and selling expenses 1,209 976
Other 64 1,810
Total 19,375 19,466
Note 11 Financial income
Accounting policyInterest income is reported as it is earned. The calculation is made on the basis of the return on underlying assets in accordance with the effective interest method. Dividend income is reported when the right to receive payment is established. Interest income is adjusted for transaction costs and any rebates, premiums and other differences between the original value of the receivable and the amount received when due.
Financial information2018 2017
Return from the Swedish Nuclear Waste Fund –7 1,138
Revaluation of the Swedish Nuclear Waste Fund to fair value through profit or loss 2,0371 —
Interest income attributable to investments 513 238
Net change in value from remeasurement of derivatives 264 1,194
Dividends 74 88
Capital gains from divestments of shares and participations 6 12
Total 2,887 2,6701 Due to changed investment policy for the Swedish Nuclear Waste Fund in the second quarter of 2018,
the measurement category for Share in the Swedish Nuclear Waste Fund has been changed from amortised cost to fair value through profit or loss.
Note 12 Financial expenses
Accounting policyFor calculation of interest effects attributable to provisions, various discount rates have been used, see Note 30 to the consolidated accounts, Pension provisions, and Note 31 to the consolidated accounts, Other interest-bearing provisions, for the discount rates used. Issue costs and similar direct transaction costs for raising loans are distributed over the term of the loan in accordance with the effective interest method. Borrowing costs directly attributable to investment projects in non-current assets which take a substantial period of time to complete are not reported as a financial expense but are included in the cost of the non-current asset during the construction period. Leasing fees pertaining to finance leases are distributed between interest expense and amortisa-tion of the outstanding debt. Interest expenses are distributed over the leasing period so that each accounting period is charged in the amount corresponding to a fixed interest rate for the reported debt in each period. Variable fees are carried as an expense in the period in which they arise.
Financial information2018 2017
Interest expenses attributable to loans 3,206 5,088
Interest effects attributable to provisions 2,239 2,355
Interest expenses for the net of pension provisions and plan assets 844 820
Exchange rate differences, net 214 144
Net change in value from remeasurement of other financial assets — 18
Total 6,503 8,425
Note 13 Income taxes
Accounting policyIncome taxes comprises current tax and deferred tax. Income tax is reported in the income statement except when the underlying transac-tion is reported in Other comprehensive income or in Equity, whereby also the associated tax effect is reported in Other comprehensive income and Equity, respectively.
Current tax is tax to be paid or received for the current year, with the application of the tax rates that are established or, established in practice as of the balance sheet date. Adjustments of tax paid attributable to previous periods are also included in this.
Deferred tax is calculated in accordance with the balance sheet method on the basis of temporary differences between the reported and taxable values of assets and liabilities. The valuation of deferred tax is based on how the reported value of assets or liabilities is expected to be realised or settled. Deferred tax is calculated in accordance with the tax rates and tax rules that have been established or have been established in practice by the balance sheet date.
Deferred tax assets concerning non-deductible temporary differences and tax-loss carryforwards are only reported to the extent that it will be possible for these to be used. The value of deferred tax assets is reduced when it is no longer considered likely that they can be used.
Important estimations and assessmentsOn its balance sheet, Vattenfall reports deferred tax assets and liabilities that are expected to be realised in future periods. In calculating these deferred taxes, certain assumptions and estimations must be made. The estimations include assumptions about future taxable earnings, that applicable tax laws and tax rates will be unchanged in the countries in which the Group is active, and that applicable rules for utilising tax-loss carryforwards will not be changed. The Group also reports future expen-ses arising out of ongoing tax audits or tax disputes under Provisions. The outcome of these may deviate from the estimations made by Vattenfall.
106 Notes to the Consolidated accounts VATTENFALL ANNUAL AND SUSTAINABILITY REPORT 2018
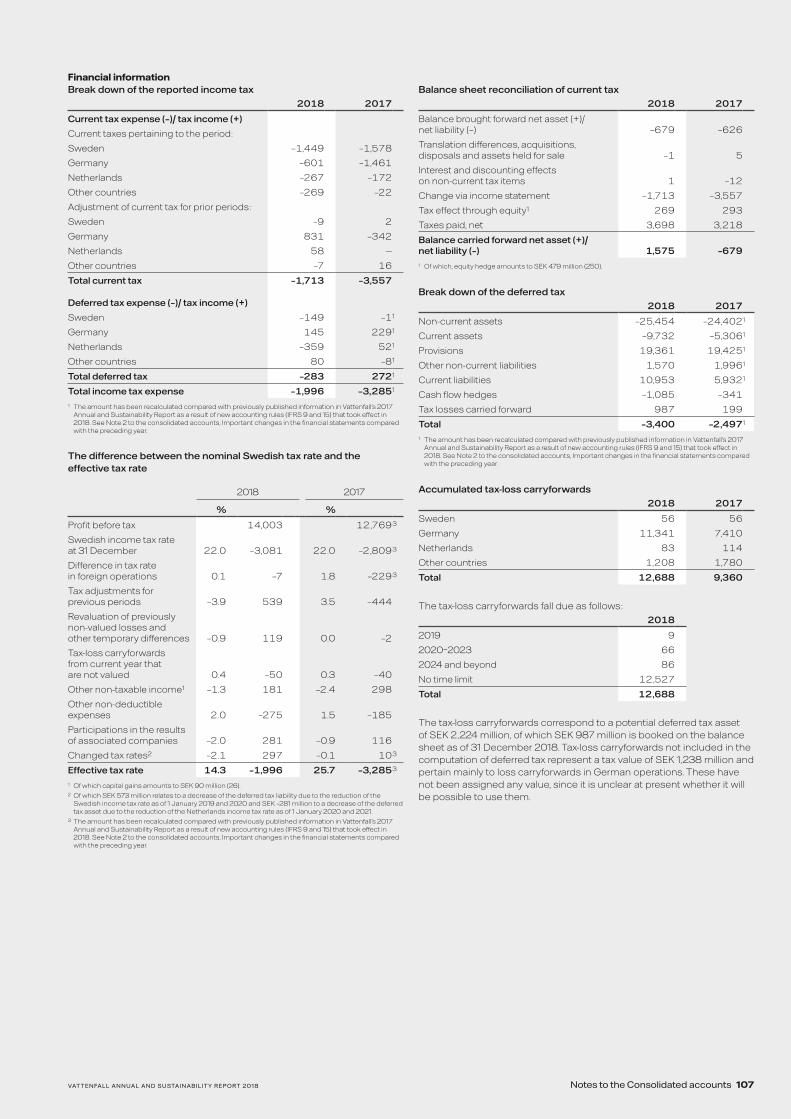
Financial informationBreak down of the reported income tax
2018 2017
Current tax expense (–)/ tax income (+)
Current taxes pertaining to the period:
Sweden –1,449 –1,578
Germany –601 –1,461
Netherlands –267 –172
Other countries –269 –22
Adjustment of current tax for prior periods:
Sweden –9 2
Germany 831 –342
Netherlands 58 —
Other countries –7 16
Total current tax –1,713 –3,557
Deferred tax expense (–)/ tax income (+)
Sweden –149 –11
Germany 145 2291
Netherlands –359 521
Other countries 80 –81
Total deferred tax –283 2721
Total income tax expense –1,996 –3,2851
1 The amount has been recalculated compared with previously published information in Vattenfall’s 2017 Annual and Sustainability Report as a result of new accounting rules (IFRS 9 and 15) that took effect in 2018. See Note 2 to the consolidated accounts, Important changes in the financial statements compared with the preceding year.
The difference between the nominal Swedish tax rate and the effective tax rate
2018 2017
% %
Profit before tax 14,003 12,7693
Swedish income tax rate at 31 December 22.0 –3,081 22.0 –2,8093
Difference in tax rate in foreign operations 0.1 –7 1.8 –2293
Tax adjustments for previous periods –3.9 539 3.5 –444
Revaluation of previously non-valued losses and other temporary differences –0.9 119 0.0 –2
Tax-loss carryforwards from current year that are not valued 0.4 –50 0.3 –40
Other non-taxable income1 –1.3 181 –2.4 298
Other non-deductible expenses 2.0 –275 1.5 –185
Participations in the results of associated companies –2.0 281 –0.9 116
Changed tax rates2 –2.1 297 –0.1 103
Effective tax rate 14.3 –1,996 25.7 –3,2853
1 Of which capital gains amounts to SEK 90 million (26).2 Of which SEK 573 million relates to a decrease of the deferred tax liability due to the reduction of the
Swedish income tax rate as of 1 January 2019 and 2020 and SEK –281 million to a decrease of the deferred tax asset due to the reduction of the Netherlands income tax rate as of 1 January 2020 and 2021.
3 The amount has been recalculated compared with previously published information in Vattenfall’s 2017 Annual and Sustainability Report as a result of new accounting rules (IFRS 9 and 15) that took effect in 2018. See Note 2 to the consolidated accounts, Important changes in the financial statements compared with the preceding year.
Balance sheet reconciliation of current tax
2018 2017
Balance brought forward net asset (+)/ net liability (–) –679 –626
Translation differences, acquisitions, disposals and assets held for sale –1 5
Interest and discounting effects on non-current tax items 1 –12
Change via income statement –1,713 –3,557
Tax effect through equity1 269 293
Taxes paid, net 3,698 3,218
Balance carried forward net asset (+)/ net liability (–) 1,575 –6791 Of which, equity hedge amounts to SEK 479 million (250).
Break down of the deferred tax2018 2017
Non-current assets –25,454 –24,4021
Current assets –9,732 –5,3061
Provisions 19,361 19,4251
Other non-current liabilities 1,570 1,9961
Current liabilities 10,953 5,9321
Cash flow hedges –1,085 –341
Tax losses carried forward 987 199
Total –3,400 –2,4971
1 The amount has been recalculated compared with previously published information in Vattenfall’s 2017 Annual and Sustainability Report as a result of new accounting rules (IFRS 9 and 15) that took effect in 2018. See Note 2 to the consolidated accounts, Important changes in the financial statements compared with the preceding year.
Accumulated tax-loss carryforwards2018 2017
Sweden 56 56
Germany 11,341 7,410
Netherlands 83 114
Other countries 1,208 1,780
Total 12,688 9,360
The tax-loss carryforwards fall due as follows:2018
2019 9
2020–2023 66
2024 and beyond 86
No time limit 12,527
Total 12,688
The tax-loss carryforwards correspond to a potential deferred tax asset of SEK 2,224 million, of which SEK 987 million is booked on the balance sheet as of 31 December 2018. Tax-loss carryforwards not included in the computation of deferred tax represent a tax value of SEK 1,238 million and pertain mainly to loss carryforwards in German operations. These have not been assigned any value, since it is unclear at present whether it will be possible to use them.
VATTENFALL ANNUAL AND SUSTAINABILITY REPORT 2018 107Notes to the Consolidated accounts

Note 14 Leasing
Accounting policyExpenses paid for operating leases are reported in the income statement on a straight-line basis over the leasing period. Leases are classified as either finance or operating leases. A finance lease exists when the economic risks and benefits associated with ownership are, in essence, transferred to the lessee. If this is not the case, it is classified as an operating lease.
The new accounting standard IFRS 16 “Leases” becomes effective as from 2019. See Note 3 to the consolidated accounts, Accounting policies for the new standards effects on Vattenfall.
Leased assets Assets leased under finance leases are reported as assets on the consolidated balance sheet. The commitment to pay future leasing charges is reported as a non-current or current liability. The leased assets are depreciated on a straight-line basis over the shorter of the leasing period or useful life, while the leasing payments are reported as interest and amortisation of the debts.
Operating leases normally entail recognition of the leasing charge as an expense on a straight-line basis over the leasing period.
Assets leased outAssets that are leased out under finance leases are not reported as Property, plant and equipment, since the risks associated with ownership are transferred to the lessee. Instead, a financial receivable is entered for the future minimum lease payments.
Assets leased out under operating leases are reported as Property, plant and equipment and are subject to depreciation.
Financial informationLeasing expensesMachinery and equipment leased by the Group through finance leasing and reported as Property, plant and equipment comprises:
2018 2017
Cost 975 975
Accumulated depreciation according to plan –398 –342
Total 577 633
Future payment commitments, as of 31 December 2018, for leasing contracts and rental contracts are broken down as follows:
Finance leasing, nominal
Finance leasing, present
valueOperating
leasing
2019 77 49 898
2020 572 552 772
2021 — — 591
2022 — — 521
2023 — — 449
2024 and beyond — — 2,599
Total 649 601 5,830
The current year’s leasing expenses amounted to SEK 1,164 mil-lion (1,033).
Leasing revenuesCertain Group companies own and operate power facilities on behalf of customers. Revenues from customers are broken down into two components – a fixed component to cover capital expenses and a variable component based on the quantity delivered. On 31 Decem-ber 2018, cost of assets reported under operating leases amounted to SEK 5,957 million (5,739). Accumulated depreciation amounted to SEK 3,787 million (3,507) and accumulated impairment losses amounted to SEK 318 million (280).
Future payments for this type of facility are broken down as follows:
Operating leasing
2019 1,086
2020 1,050
2021 1,025
2022 995
2023 971
2024 and beyond 1,978
Total 7,105
Note 15 Auditors’ fees2018 2017
Annual audit assignment
EY 39 39
Audit-related activities besides the annual audit assignment
EY 4 3
Tax consulting
EY — 1
Other assignments
EY 26 12
108 Notes to the Consolidated accounts VATTENFALL ANNUAL AND SUSTAINABILITY REPORT 2018

Financial information2018
Development costs Goodwill
Concessions and similar rights with
finite useful lives
Costs to obtain a
contract
Renting rights and similar
rights with finite useful lives Total
Cost
Cost brought forward 2,194 43,356 17,345 941 831 64,667
Acquired companies — –89 — — — –89
Investments 75 — 151 505 1 732
Transfer from development projects in progress –4 — — — — –4
Divestments/disposals — –258 –7 –315 –9 –589
Reclassifications –34 –119 27 52 –619 –693
Assets held for sale –15 — –29 — –31 –75
Divested companies — — –31 — — –31
Translation differences 55 1,792 661 39 5 2,552
Accumulated cost carried forward 2,271 44,682 18,117 1,222 178 66,470
Amortisation according to plan
Amortisation brought forward –1,701 — –11,172 –512 –189 –13,574
Amortisation for the year –45 — –1,092 –371 –5 –1,513
Divestments/disposals — — 5 315 9 329
Reclassifications 16 — 3 –15 112 116
Assets held for sale 15 — 29 — 31 75
Divested companies — — 26 — — 26
Translation differences –53 — –426 –21 –4 –504
Accumulated amortisation according to plan carried forward –1,768 — –12,627 –604 –46 –15,045
Impairment losses
Impairment losses brought forward –212 –30,032 –1,974 — –583 –32,801
Impairment losses for the year — — –82 –35 — –117
Divestments/disposals — 258 — — — 258
Reclassifications — 119 — — 507 626
Translation differences — –1,236 –73 — — –1,309
Accumulated impairment losses carried forward –212 –30,891 –2,129 –35 –76 –33,343
Residual value according to plan carried forward 291 13,791 3,361 583 56 18,082
Note 16 Intangible assets: non-current
Accounting policyGoodwillGoodwill is measured at cost less any accumulated impairment losses. Goodwill is not subject to amortisation but is tested at least annually for impairment. Goodwill that arises on acquisition of associated companies or joint ventures is included in the carrying amount of Participations in associated companies and joint ventures.
Other Intangible non-current assetsOther Intangible non-current assets such as concessions, patents, licences, trademarks and similar rights as well as renting rights, and similar rights are reported at cost less accumulated amortisation and impairment losses.
Principles for amortisation Amortisation of Intangible non-current assets other than goodwill is reported on a straight-line basis in the income statement over the estima-ted useful life of the asset, provided the useful life is not indefinite.
Important estimations and assessmentsIntangible assets are tested for impairment in accordance with the accounting policies described in Note 9 to the consolidated accounts, Impairment losses and reversed impairment losses. The recoverable amount for cash-generating units is determined by calculating the value in use or fair value less costs to sell. For these calculations, certain estimations must be made regarding future cash flows along with other adequate assumptions regarding the required rate of return, for example.
VATTENFALL ANNUAL AND SUSTAINABILITY REPORT 2018 109Notes to the Consolidated accounts

2017
Development costs Goodwill
Concessions and similar rights with
finite useful lives1
Costs to obtain a
contract1
Renting rights and similar
rights with finite useful lives Total
Cost
Cost brought forward 2,026 41,908 15,273 645 896 60,748
Acquired companies 34 232 1,470 — — 1,736
Investments 119 — 201 289 1 610
Transfer from development projects in progress –4 — — — — –4
Divestments/disposals –19 — –52 –18 –69 –158
Reclassifications — –33 31 — — –2
Divested companies — — –1 — — –1
Translation differences 38 1,249 423 25 3 1,738
Accumulated cost carried forward 2,194 43,356 17,345 941 831 64,667
Amortisation according to plan
Amortisation brought forward –1,639 — –9,981 –241 –250 –12,111
Amortisation for the year –44 — –960 –276 –6 –1,286
Divestments/disposals 19 — 60 18 69 166
Reclassifications — — 3 — — 3
Divested companies — — 1 — — 1
Translation differences –37 — –295 –13 –2 –347
Accumulated amortisation according to plan carried forward –1,701 — –11,172 –512 –189 –13,574
Impairment losses
Impairment losses brought forward –212 –29,027 –1,937 — –583 –31,759
Impairment losses for the year — –148 –1 — — –149
Reclassifications — — –2 — — –2
Translation differences — –857 –34 — — –891
Accumulated impairment losses carried forward –212 –30,032 –1,974 — –583 –32,801
Residual value according to plan carried forward 281 13,324 4,199 429 59 18,2921 Certain amounts for 2017 have been recalculated compared with previously published information in
Vattenfall’s 2017 Annual and Sustainability Report as a result of new accounting rules (IFRS 9 and 15) that took effect in 2018. See Note 2 to the consolidated accounts, Important changes in the financial statements compared with the preceding year.
Contractual commitments for acquisitions of non-current intangible assets amounted to SEK 0 million (0) as per 31 December 2018.
Estimated useful life
Development costs 3–4 years
Concessions and similar rights 3–30 years
Costs to obtain a contract 1–6 years
Renting rights and similar rights 3–50 years
Estimated useful lives are unchanged compared with the preceding year.
110 Notes to the Consolidated accounts VATTENFALL ANNUAL AND SUSTAINABILITY REPORT 2018

Financial information2018
Land and buildings1
Plant and machinery and other technical
installations
Equipment, tools, fixtures
and fittingsConstruction
in progress2 Total
Cost
Cost brought forward3 56,367 453,270 12,473 26,467 548,577
Acquired companies — — 1 — 1
Investments4 44 1,557 297 22,022 23,920
Reversed investments — — — –95 –95
Advance payments capitalised — — — 186 186
Capitalised/reversed future expenses for decommissioning, restoration 60 3,134 — 367 3,561
Transfer from construction in progress 1,260 15,305 218 –16,779 4
Divestments/disposals –706 –2,381 –572 –1,592 –5,251
Other reclassifications 4 –10 –35 –8 –49
Assets held for sale –2,071 –18,023 –318 –593 –21,005
Divested companies — –398 –36 –24 –458
Translation differences 1,114 10,893 408 640 13,055
Accumulated cost carried forward 56,072 463,347 12,436 30,591 562,446
Depreciation according to plan
Depreciation brought forward –25,896 –214,688 –8,977 — –249,561
Depreciation for the year –931 –13,482 –661 — –15,074
Divestments/disposals 219 1,912 493 — 2,624
Assets held for sale 1,708 14,333 271 — 16,312
Divested companies — 305 33 — 338
Translation differences –677 –5,234 –296 — –6,207
Accumulated depreciation according to plan carried forward –25,577 –216,843 –9,148 — –251,568
Impairment losses
Impairment losses brought forward –3,813 –65,730 –402 –2,002 –71,947
Impairment losses for the year –4 –15 — — –19
Divestments/disposals 301 78 –6 1,525 1,898
Assets held for sale — — — 158 158
Divested companies — 1 — — 1
Translation differences –122 –2,113 –16 –17 –2,268
Accumulated impairment losses carried forward –3,638 –67,779 –424 –336 –72,177
Residual value according to plan carried forward 26,857 178,725 2,864 30,255 238,701
Advance payments to suppliers 100
Total 238,801
Note 17 Property, plant and equipment
Accounting policyProperty, plant and equipment are reported as assets on the balance sheet if it is likely that there will be future financial benefit for the company and the cost of the asset can be calculated in a reliable manner. Cost includes the purchase price and costs directly attributable to putting the asset in place and in a suitable condition for use in accordance with the management’s intention of the acquisition. Examples of directly attributa-ble expenses included in cost are delivery and handling, installation, land registration and consulting services. Borrowing costs directly attributable to investment projects in property, plant and equipment, which take a substantial period of time to complete, are included in the cost of the asset during the construction period.
In the nuclear power operations cost at the time of acquisition includes a calculated present value for estimated costs for dismantling and removing the plant and restoring the site where the plant is located. The equivalent estimated cost calculated on the basis of the present value is reported initially as a provision. The same principle applies for dismant-ling obligations in Vattenfall’s Wind operations. See also Note 31 to the consolidated accounts, Other interest-bearing provisions.
Subsequent costs Subsequent costs for property, plant and equipment are only added to the acquisition cost if it is likely that there will be future financial benefits associated with the asset for the company and the cost can be calculated in a reliable manner. All other subsequent costs are reported as expenses in the period when they arise. What is decisive for the
assessment when a subsequent cost is added to the acquisition cost is whether the cost concerns the replacement of identified components, or parts of them, whereby such costs are capitalised. Also in cases where new components are created, the cost is added to the cost of the asset. Any undepreciated reported values of replaced components, or parts of components, are retired and carried as an expense in connection with the replacement. Repairs and maintenance are expensed as incurred.
Depreciation principles Depreciation is reported on a straight-line basis in the income statement over the estimated useful life of the asset. The Group applies component depreciation, which means that the components’ estimated useful life provides the basis for the straight-line depreciation. Estimated useful life is described below in this note. Assessments of the residual value and useful life of an asset are conducted annually. Land and water rights are not subject to depreciation.
Important estimations and assessmentsProperty, plant and equipment are tested for impairment in accordance with the accounting policies described in Note 9 to the consolidated accounts, Impairment losses and reversed impairment losses. The recoverable amount for cash-generating units is determined by calcula-ting the value in use or fair value less costs to sell. For these calculations, certain estimations must be made regarding future cash flows along with other adequate assumptions regarding the required rate of return, for example.
VATTENFALL ANNUAL AND SUSTAINABILITY REPORT 2018 111Notes to the Consolidated accounts
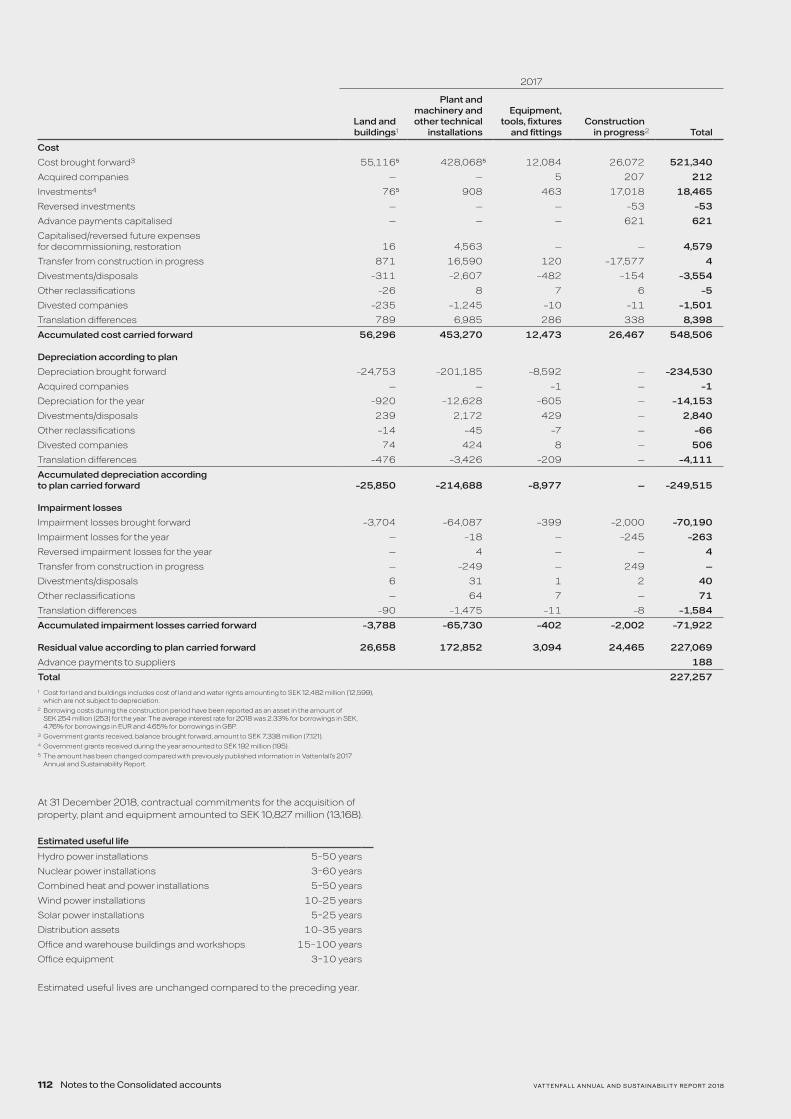
2017
Land and buildings1
Plant and machinery and other technical
installations
Equipment, tools, fixtures
and fittingsConstruction
in progress2 Total
Cost
Cost brought forward3 55,1165 428,0685 12,084 26,072 521,340
Acquired companies — — 5 207 212
Investments4 765 908 463 17,018 18,465
Reversed investments — — — –53 –53
Advance payments capitalised — — — 621 621
Capitalised/reversed future expenses for decommissioning, restoration 16 4,563 — — 4,579
Transfer from construction in progress 871 16,590 120 –17,577 4
Divestments/disposals –311 –2,607 –482 –154 –3,554
Other reclassifications –26 8 7 6 –5
Divested companies –235 –1,245 –10 –11 –1,501
Translation differences 789 6,985 286 338 8,398
Accumulated cost carried forward 56,296 453,270 12,473 26,467 548,506
Depreciation according to plan
Depreciation brought forward –24,753 –201,185 –8,592 — –234,530
Acquired companies — — –1 — –1
Depreciation for the year –920 –12,628 –605 — –14,153
Divestments/disposals 239 2,172 429 — 2,840
Other reclassifications –14 –45 –7 — –66
Divested companies 74 424 8 — 506
Translation differences –476 –3,426 –209 — –4,111
Accumulated depreciation according to plan carried forward –25,850 –214,688 –8,977 — –249,515
Impairment losses
Impairment losses brought forward –3,704 –64,087 –399 –2,000 –70,190
Impairment losses for the year — –18 — –245 –263
Reversed impairment losses for the year — 4 — — 4
Transfer from construction in progress — –249 — 249 —
Divestments/disposals 6 31 1 2 40
Other reclassifications — 64 7 — 71
Translation differences –90 –1,475 –11 –8 –1,584
Accumulated impairment losses carried forward –3,788 –65,730 –402 –2,002 –71,922
Residual value according to plan carried forward 26,658 172,852 3,094 24,465 227,069
Advance payments to suppliers 188
Total 227,2571 Cost for land and buildings includes cost of land and water rights amounting to SEK 12,482 million (12,599),
which are not subject to depreciation.2 Borrowing costs during the construction period have been reported as an asset in the amount of
SEK 254 million (253) for the year. The average interest rate for 2018 was 2.33% for borrowings in SEK, 4.76% for borrowings in EUR and 4.65% for borrowings in GBP.
3 Government grants received, balance brought forward, amount to SEK 7,338 million (7,121). 4 Government grants received during the year amounted to SEK 192 million (195).5 The amount has been changed compared with previously published information in Vattenfall’s 2017
Annual and Sustainability Report.
At 31 December 2018, contractual commitments for the acquisition of property, plant and equipment amounted to SEK 10,827 million (13,168).
Estimated useful life
Hydro power installations 5–50 years
Nuclear power installations 3–60 years
Combined heat and power installations 5–50 years
Wind power installations 10–25 years
Solar power installations 5–25 years
Distribution assets 10–35 years
Office and warehouse buildings and workshops 15–100 years
Office equipment 3–10 years
Estimated useful lives are unchanged compared to the preceding year.
112 Notes to the Consolidated accounts VATTENFALL ANNUAL AND SUSTAINABILITY REPORT 2018

Note 18 Shares and participations owned by the Parent Company Vattenfall AB and other Group companies
Shares and participations owned by Parent Company Vattenfall AB Carrying amount P arent Company
Corporate Identity Number
Registered office
Number of shares 2018
Participation in % 2018 2018 2017
Sweden
Alltid AB 559030-1148 Borås 100 100 39 —
Borås Elhandel AB 556613-7765 Borås 1,000 100 100 100
Chlorout AB 556840-9253 Stockholm 500 100 — —
Forsaströms Kraft AB 556010-0819 Åtvidaberg 400,000 100 48 48
Forsmarks Kraftgrupp AB 556174-8525 Östhammar 198,000 66 198 198
Försäkrings AB Vattenfall Insurance 516401-8391 Solna 200,000 100 524 200
Gotlands Energi AB 556008-2157 Gotland 112,500 75 13 13
Produktionsbalans PBA AB 556425-8134 Stockholm 4,800 100 5 5
Ringhals AB 556558-7036 Varberg 248,572 70 379 379
Svensk Kärnbränslehantering AB 556175-2014 Solna 360 361 — —
Vattenfall Biomass Liberia AB 556809-8809 Stockholm 5,000 100 — —
Vattenfall Business Services Nordic AB 556439-0614 Stockholm 100 100 130 130
Vattenfall Elanläggningar AB 556257-5661 Solna 1,000 100 1 1
Vattenfall Eldistribution AB 556417-0800 Solna 8,000 100 38,000 38,000
Vattenfall France Holding AB 556815-4214 Stockholm 30,500 100 11 11
Vattenfall Kundservice AB 556529-7065 Umeå 100,000 100 30 30
Vattenfall Nuclear Fuel AB 556440-2609 Solna 100 100 96 96
Vattenfall PHEV Holding AB 556785-9383 Stockholm 1,000 100 — —
Vattenfall Power Consultant AB 556383-5619 Stockholm 12,500 100 15 15
Vattenfall Power Management AB 556573-5940 Stockholm 6,570 100 12 12
Vattenfall Research & Development AB Liquidated 556390-5891 Älvkarleby 17
Vattenfall Services Nordic AB 556417-0859 Stockholm 26,000 100 19 19
Vattenfall Vattenkraft AB 556810-1520 Stockholm 1,200 100 1 1
Vattenfall Vindkraft AB 556731-0866 Stockholm 1,000 100 14,000 14,000
Västerbergslagens Energi AB 556565-6856 Ludvika 14,674 51 15 15
Denmark
Vattenfall A/S 213 11 332 Copenhagen 10,040,000 100 33 515
Vattenfall Energy Trading A/S 310 811 81 Copenhagen 500 100 49 49
Vindstød A/S 340 451 43 Århus 1,333,333 702 37 37
Finland
Vattenfall Sähkömyynti Oy 1842073-2 Helsinki 85 100 5 5
Germany
Vattenfall GmbH (HRB) 124048 Berlin 500,000,000 100 51,366 51,366
Poland
Vattenfall IT Services Poland Sp.z.o.o 0000402391 Gliwice 58,000 100 12 12
Netherlands
N.V. Nuon Energy 33292246 Amsterdam 136,794,964 100 44,138 44,138
Other countries
Parc Eolien En Mer des Bancs de Flandre SAS 2018B02593
Boulogne Billancourt 53 13 — —
Vattenfall UK Sales Limited 05461926 London 104,000,400 100 288 288
Vattenfall Reinsurance S.A., Luxembourg Liquidated (B) 49528 Luxembourg — 150
Total 149,564 149,8501 The Group owns a further 30% via Forsmarks Kraftgrupp AB.2 The remaining 30% of the shares will be paid in three tranches: 2019, 2020 and 2022.3 The Group owns a further 79% via Vattenfall Vindkraft AB
VATTENFALL ANNUAL AND SUSTAINABILITY REPORT 2018 113Notes to the Consolidated accounts

Larger shareholdings owned by other Group companies than the Parent Company Vattenfall ABWhen calculating the participation percentages, consideration is taken for the non-controlling interests in the respective companies.
Registered office
Participation in % 2018
Sweden
Vattenfall Indalsälven AB Bispgården 74
Denmark
Vattenfall Vindkraft A/S Esbjerg 100
Vattenfall Vindkraft Nørrekær Enge A/S Esbjerg 100
Germany
DanTysk Sandbank Offshore Wind GmbH & Co. KG Hamburg 51
Fernheizwerk Neukölln AG Berlin 81
Kernkraftwerk Brunsbüttel GmbH & Co. oHG Hamburg 67
Kernkraftwerk Krümmel GmbH & Co. oHG Hamburg 50
MVR Müllverwertung Rugenberger Damm GmbH & Co. KG Hamburg 55
Nuon Epe Gasspeicher GmbH Gronau 100
Stromnetz Berlin GmbH Berlin 100
Vattenfall Energy Trading GmbH Hamburg 100
Vattenfall Europe Business Services GmbH Hamburg 100
Vattenfall Europe Information Services GmbH Hamburg 100
Vattenfall Europe Kundenservice GmbH Hamburg 100
Vattenfall Europe New Energy GmbH Hamburg 100
Vattenfall Europe New Energy Ecopower GmbH Rostock 100
Vattenfall Europe Nuclear Energy GmbH Hamburg 100
Vattenfall Europe Sales GmbH Hamburg 100
Vattenfall Europe Windkraft GmbH Hamburg 100
Vattenfall Smarter Living GmbH Berlin 100
Vattenfall Wärme Berlin AG Berlin 100
Vattenfall Heizkraftwerk Moorburg GmbH Hamburg 100
Vattenfall Wasserkraft GmbH Berlin 100
Vattenfall Wärme Hamburg GmbH Hamburg 75
Registered office
Participation in % 2018
Netherlands
Feenstra N.V. Amsterdam 100
Feenstra Verwarming B.V. Lelystad 100
N.V. Nuon Duurzame Energie Arnhem 100
N.V. Nuon Energy Sourcing Amsterdam 100
N.V. Nuon Klantenservice Arnhem 100
N.V. Nuon Sales Amsterdam 100
N.V. Nuon Sales Nederland Amsterdam 100
N.V. Nuon Warmte Amsterdam 100
Nuon Epe Gas Service B.V. Amsterdam 100
Nuon Power Generation B.V. Utrecht 100
Nuon Power Projects I B.V. Amsterdam 100
Nuon Renewables NSW I B.V. Amsterdam 100
Nuon Storage B.V. Amsterdam 100
Nuon Windpark Wieringermeer EXT B.V. Amsterdam 100
Vattenfall Energy Trading Netherlands N.V. Amsterdam 100
Zuidlob Wind B.V. Amsterdam 100
UK
Kentish Flats Ltd London 100
Nuon UK Ltd Cornwall 100
Pen Y Cymoedd Wind Farm Ltd. Cornwall 100
Thanet Offshore Wind Ltd London 100
Vattenfall Wind Power Ltd London 100
Ormonde Energy Ltd London 51
Aberdeen Offshore Wind Farm Ltd Aberdeen 100
I Supply Energy Ltd Poole 100
114 Notes to the Consolidated accounts VATTENFALL ANNUAL AND SUSTAINABILITY REPORT 2018

Subsidiaries with material non-controlling ownership interests Forsmarks KraftgruppForsmarks Kraftgrupp conducts nuclear power operations from three nuclear reactors in Östhammar municipality, Uppsala County. Forsmarks Kraftgrupp is owned by Vattenfall AB (66.0%) together with Mellan-svensk Kraftgrupp AB (25.5%), with Fortum as the largest owner, and Sydkraft Nuclear Power AB (8.5%). The part-owners have a consortium agreement that regulates how the operations of Forsmarks Kraftgrupp are conducted and how decision-making is done. Forsmarks Kraftgrupp is reported as a Group company in the Vattenfall Group since Vattenfall has control over Forsmarks Kraftgrupp according to IFRS 10 – “Consolidated Financial Statements”.
Sales of the electric power that is generated are made on a pro rata basis to the part owners at cost, pursuant to the consortium agreement. In addition, the consortium agreement entails that the part owners are responsible for the company’s funding on a pro rata basis, and that the company’s operations shall in principle not generate any profit. Genera-tion in 2018 amounted to 24.9 TWh (24.5), and the average availability for Forsmark was 88.1% (88.0%).
RinghalsRinghals conducts nuclear power operations from four nuclear reactors on the Swedish west coast in Varberg municipality. Ringhals is owned by Vattenfall AB (70.4%) and Sydkraft Nuclear Power AB (29.6%). The part-owners have a consortium agreement that regulates how the operations of Ringhals are conducted and how decision-making is done. Ringhals
is reported as a Group company in the Vattenfall Group since Vattenfall has control over Ringhals according to IFRS 10 – “Consolidated Financial Statements”.
Sales of the electric power that is generated are made on a pro rata basis to the part owners at cost, pursuant to the consortium agreement. In addition, the consortium agreement entails that the part owners are responsible for the company’s funding on a pro rata basis, and that the company’s operations shall in principle not generate any profit. Genera-tion in 2018 amounted to 30.1 TWh (27.4), and the average availability for Ringhals was 89.5% (82.2%).
DanTysk Sandbank Offshore WindThe DanTysk offshore wind farm, west of the island of Sylt (Germany) and just over the border with Denmark, was one of the first large marine wind farms built in the German North Sea. The wind farm comprises 80 wind turbines of 3.6 MW each with a total capacity of 288 megawatts. DanTysk began generating electricity in December 2014. The Sandbank wind farm comprises 72 wind turbines of 4 MW each with a total capacity of 288 megawatts. The wind farm is located 90 kilometres off the coast of Schleswig-Holstein (Germany), adjacent to DanTysk. Sandbank was inaugurated in 2017.
Both wind farms are part of the company DanTysk Sandbank Offshore Wind GmbH & Co. KG, in which Vattenfall Europe Windkraft GmbH owns 51% of the shares, and the partner Stadtwerke München holds 49% of the shares. Vattenfall has control over DanTysk Sandbank Offshore Wind in accordance with IFRS 10 – “Consolidated Financial Statements”.
Following is condensed financial information for Forsmarks Kraftgrupp, Ringhals and DanTysk Sandbank Offshore Wind:
2018 2017
Forsmarks Kraftgrupp Ringhals
DanTysk Sandbank
Offshore WindForsmarks Kraftgrupp Ringhals
DanTysk Sandbank
Offshore Wind
Income statements in summary
Net sales 6,132 7,701 5,457 6,535 7,476 4,819
Profit for the year 936 1,711 2,582 606 237 1,705
– of which allocated to non–controlling interests 206 76 1,265 103 24 835
Balance sheets in summary
Non-current assets 57,871 43,545 18,975 53,324 39,875 19,798
Current assets 4,813 4,074 1,082 4,867 3,458 1,245
Total assets 62,684 47,619 20,057 58,191 43,333 21,043
Equity 12,090 435 18,993 10,497 –863 19,793
Liabilities 50,593 47,184 1,064 47,694 44,196 1,250
Total equity and liabilities 62,683 47,619 20,057 58,191 43,333 21,043
Statement of cash flows in summary
Cash flow for the year –64 356 –131 72 –152 61
VATTENFALL ANNUAL AND SUSTAINABILITY REPORT 2018 115Notes to the Consolidated accounts

Note 19 Participations in associated companies and joint arrangements
Shares and participations owned by the Parent Company Vattenfall AB or by other Group companies
Carrying amount Group
Carrying amount Parent Company
Corporate Identity Number
Registered office
Participation in % 2018 2018 2017 2018 2017
Associated companies and joint ventures owned by the Parent Company Vattenfall AB
Sweden
BrainHeart Energy Sweden Holding AB 556813-3846 Stockholm 35 45 41 47 41
Hybrit Development AB 559121-9760 Stockholm 33 7 — 12 —
Norway
NorthConnect KS 996625001 Kristiansand 33 42 14 42 14
NorthConnect AS 995878550 Kristiansand 30 6 2 6 —
Associated companies and joint ventures owned by other Group companies than the Parent Company Vattenfall AB
Sweden
Blakliden Fäbodberget Wind Holding AB 559148-3408 Solna 30 240 — — —
Taggen Vindpark Elnät AB 556701-3981 Gothenburg 50 — — — —
V2 Plug-In Hybrid Vehicle Partnership HB 969741-9175 Gothenburg 50 350 499 — —
UK
East Anglia Offshore Wind Ltd 06990367 Hexham 50 46 45 — —
Germany
Solytic GmbH HRB 190395 B Berlin 36 25 29 — —
DOTI Deutsche Offshore-Testfeld- und Infrastruktur-GmbH & Co. KG HRA 200395 Oldenburg 26 116 155 — —
GASAG Berliner Gaswerke AG HRB 44343 Berlin 32 4,105 3,719 — —
Kernkraftwerk Brokdorf GmbH & Co. oHG HRA 99143 Hamburg 20 — — — —
Kernkraftwerk Stade GmbH & Co. oHG HRA 99146 Hamburg 33 — — — —
Netherlands
B.V. Nederlands Elektriciteit Administratiekantoor 09018339 Arnhem 23 66 76 — —
C.V. Groettocht 37085868 Amsterdam 50 2 2 — —
C.V. Oudelandertocht 37085867 Amsterdam 50 2 3 — —
C.V. Waardtocht 37085866 Amsterdam 50 1 1 — —
C.V. Waterkaaptocht 37085865 Amsterdam 50 2 2 — —
C.V. Windpoort 34122462 Heemskerk 40 5 4 — —
NoordzeeWind C.V. 34195602 Ijmuiden 50 157 196 — —
V.O.F. Windpark Oom Kees 09210903 Amsterdam 13 2 2 — —
Westpoort Warmte B.V. 34121626 Amsterdam 50 101 69 — —
Windpark Hoofdplaatpolder B.V. 22053732 Sluis 70 88 102 — —
V.O.F. Noordpier Wind 51173441 Heemskerk 50 5 4 — —
Vliegasunie B.V. 30123419 De Bilt 20 16 20 — —
Total 5,429 4,985 107 55
116 Notes to the Consolidated accounts VATTENFALL ANNUAL AND SUSTAINABILITY REPORT 2018

Participations in the results of associated companies2018 2017
Sweden
Blakliden Fäbodberget Wind Holding AB –22 —
V2 Plug-In Hybrid Vehicle Partnership HB 315 295
UK
East Anglia Offshore Wind Ltd — 14
Germany
DOTI Deutsche Offshore-Testfeld- und Infrastruktur-GmbH & Co. KG –20 5
GASAG Berliner Gaswerke AG 91 81
Netherlands
B.V. Nederlands Elektriciteit Administratiekantoor –13 —
NoordzeeWind C.V. –48 –34
Westpoort Warmte B.V. 29 14
Windpark Hoofdplaatpolder B.V. –14 –17
Vliegasunie B.V. 6 19
Other associated companies –4 –12
Total 320 365
Note 20 Share in the Swedish Nuclear Waste Fund
2018 2017
Balance brought forward 38,591 36,199
Payments 2,421 1,903
Disbursements –1,004 –649
Returns –7 1,138
Revaluation of the Swedish Nuclear Waste Fund to fair value through profit or loss 2,037 —
Balance carried forward 42,038 38,591
According to the Swedish Nuclear Activities Act (1984:3), any organisa-tion in Sweden with a permit to own or run a nuclear installation is obliged to dismantle the plant in a safe manner, to manage spent fuel and other radioactive waste and to conduct necessary research and development. The permit holder shall also finance this dismantling. The financing of future fees for spent nuclear fuel is currently ensured by Swedish law. The reactor owner is required to pay a generation-based fee to the board of the Swedish Nuclear Waste Fund, which manages paid-in funds. The fund reimburses the owner of the reactor for expenses as the owner’s obligations pursuant to the Swedish law are fulfilled. According to agreements between the Swedish state, Vattenfall AB and E.ON Sve-rige AB, fund assets for Ringhals AB shall be managed by Vattenfall AB. Due to changed investment policy for the Swedish Nuclear Waste Fund in quarter 2 2018, the measurement category for Share in the Swedish Nuclear Waste Fund has been changed from amortised cost to fair value through profit or loss.
As stated in Note 31 to the consolidated accounts, Other interest-bearing provisions, provisions for future expenses for decommissioning within Swedish nuclear power operations amount to SEK 59,904 mil-lion (53,830). Contingent liabilities attributable to the Swedish Nuclear Waste Fund are described in Note 40 to the consolidated accounts, Contingent liabilities.
Note 21 Inventories
Accounting policyInventories (except for inventories held for trading) are valued at the lower of their cost and net realisable value. Net realisable value is the estimated sales price in operating activities, less estimated costs for completion and to bring about a sale. The consumption of nuclear fuel is calculated as a depletion of the energy content of the fuel rods, and is based on the cost of each batch of fuel loaded into the core. The cost of inventories is calculated, depending on the type of inventory, either through applica-tion of the first-in, first-out (FIFO) method or through the application of a method based on average prices. Both methods include costs that arose on acquisition of the inventory assets.
Inventories held for trading are valued at fair value less costs to sell. For CO2 emission allowances that are held for trading, fair value is based on quoted prices (Level 1). For other commodities fair value measurement is derived from an observable market price (API#2 for coal), which means a categorisation into Level 2 of the fair value hierarchy. See Note 3 to the consolidated accounts, Accounting policies.
The value of the energy stored in the form of water in reservoirs is not reported as an asset.
Financial information2018 2017
Inventories held for own use
Nuclear fuel 5,749 6,853
Materials and spare parts 2,818 2,794
Fossil fuel 803 1,377
Biological assets 20 17
Other 402 460
Total 9,792 11,501
Inventories held for trading
Fossil fuel 1,952 1,131
CO2 emission allowances/certificates 1,850 2,997
Biomass 53 58
Total 3,855 4,186
Total inventories 13,647 15,687
Inventories recognised as an expense in 2018 amount to SEK 16,726 mil-lion (23,497). Impairment losses for inventory for own use amounted to SEK 4 million (68) during the year. Reversed impairment amounted to SEK 0 million (15).
VATTENFALL ANNUAL AND SUSTAINABILITY REPORT 2018 117Notes to the Consolidated accounts

Note 22 Intangible assets: current
Accounting policyCO2 emission allowances held for own usePurchased emission allowances held for own use are reported as intan-gible assets under current assets at cost less accumulated impairment losses. As carbon dioxide is emitted, an obligation arises to deliver emis-sion allowances (EUAs, CERs, ERUs) to the authorities in the respective countries. This obligation is reported as an expense and a liability. This liability is valued in the amount at which it is expected to be settled.
Certificates held for own useAccumulated certificates, which are received free of charge, are reported as intangible assets under current assets at fair value when obtained. The corresponding amount is recognised as revenue under Net sales. Purcha-sed certificates held for own use are reported at cost less accumulated impairment losses. When electricity is sold, an obligation arises to deliver certificates to the authorities in the respective countries. This obligation is reported as an expense and as a liability. The liability is valued at the amount at which it is expected to be settled.
Note 23 Trade receivables and other receivables
Accounting policyFor trade receivables calculation of the loss reserve is based on expected credit losses for the remaining term. A collective method is used where the receivables are grouped together based on e.g., the number of days past due including any past-due receivables, and a credit loss percentage is calculated for the respective intervals, where in the model Vattenfall has based its calculations on experience from historic loss levels for similar receivables while taking into account forward-looking macroeconomic conditions that may affect expected cash flows. For individual, significant receivables, an individual assessment may be made. Impairment of trade receivables is reported in operating expenses.
Financial information2018 2017
Accounts receivable – trade 20,334 18,1461
Receivables from associated companies 81 148
Other receivables 5,588 5,143
Total 26,003 23,4371
1 The amount has been recalculated compared with previously published information in Vattenfall’s 2017 Annual and Sustainability Report as a result of new accounting rules (IFRS 9 and 15) that took effect in 2018. See Note 2 to the consolidated accounts, Important changes in the financial statements compared with the preceding year.
Financial informationCO2 emission allowances Certificates Total
2018 2017 2018 20171 2018 20171
Balance brought forward 1,579 10 266 305 1,845 315
Purchases 4,128 3,240 428 408 4,556 3,648
Received free of charge — — 194 111 194 111
Sold –3,745 –481 –8 –82 –3,753 –563
Redeemed –1,705 –1,223 –494 –476 –2,199 –1,699
Translation differences 67 33 — — 67 33
Balance carried forward 324 1,579 386 266 710 1,8451 Values attributable to certificates in 2017 have been adjusted compared with information previously
published in Vattenfall’s 2017 Annual and Sustainability Report.
Age analysisThe collection period is normally between 10 and 30 days.
2018 2017
Receivables, gross
Impaired receivables
Receivables, net
Receivables, gross
Impaired receivables
Receivables, net
Accounts receivable – trade
Not due 18,216 19 18,197 16,559 5 16,554
Past due 1–30 days 1,071 11 1,060 750 9 741
Past due 31–90 days 373 13 360 276 14 262
Past due >90 days 1,517 800 717 1,446 857 589
Total 21,177 843 20,334 19,031 885 18,146
Receivables from associated companies
Not due 80 — 80 148 — 148
Past due >90 days 2 1 1 2 2 —
Total 82 1 81 150 2 148
Other receivables
Not due 5,578 — 5,578 5,123 — 5,123
Past due 1–30 days 2 — 2 1 — 1
Past due 31–90 days — — — 1 — 1
Past due >90 days 27 19 8 35 17 18
Total 5,607 19 5,588 5,160 17 5,143
118 Notes to the Consolidated accounts VATTENFALL ANNUAL AND SUSTAINABILITY REPORT 2018

Note 24 Advance payments paid
2018 2017
Margin calls paid, energy trading 2,330 2,054
Other advance payments 596 1,546
Total 2,926 3,600
A margin call paid is a marginal security (collateral) that Vattenfall pays its counterparty, that is, to the holder of a derivative position to cover the counterpart’s credit risk, either bilaterally via OTC or through an exchange. In Vattenfall’s business activities, margin calls occur in energy trading and in the financing activities.
Margin calls paid within energy trading are recognised on the balance sheet as advance payments paid and are thereby recognised in the statement of cash flows as cash flows from changes in operating assets. Margin calls paid within financing activities are recognised as short-term investments (Note 26 to the consolidated accounts, Short-term investments) and are thereby reported in the statement of cash flows as cash flows from financing activities.
Note 25 Prepaid expenses and accrued income
2018 2017
Prepaid expenses and accrued income, electricity 5,207 4,467
Prepaid expenses, other 1,740 1,374
Accrued income, other 1,480 1,169
Total 8,427 7,010
Note 26 Short-term investments
2018 2017
Interest-bearing investments 20,541 15,343
Margin calls paid, financing activities 2,436 2,749
Total 22,977 18,092
Note 27 Cash and cash equivalents
2018 2017
Cash and bank balances 8,286 6,125
Cash equivalents 8,808 2,680
Total 17,094 8,805
Note 28 Assets held for sale
Accounting policyNon-current assets (or disposal groups) are classified as held for sale if their carrying amount will be recovered principally through a sale transac-tion rather than through continuing use. To be classified as held for sale a number of criteria must be met, see the heading “Important estimations and assessments”. Assets held for sale are valued at the lower of their carrying amount and fair value less costs to sell and are not subject to amortisation or depreciation. Assets (and liabilities) held for sale are classified as current assets (current liabilities) when the sale transaction is expected to be settled within twelve months after the balance sheet date.
Important estimations and assessmentsCertain criteria must be fulfilled to classify an asset as held for sale. The asset must be available for immediate sale in its present condition subject to usual and customary terms. Further, the sale must be highly probable within one year from the date of classification. The last-mentioned criterion means that a plan for the disposal must have been prepared and approved at the appropriate level of management, an active programme for the disposal must have been initiated, and the asset must be marketed for sale at a price that is reasonable in relation to its current fair value. In the event shareholder approval is required before a sale can be carried out, Vattenfall is of the opinion that a transaction cannot be regarded as likely until shareholder approval has been obtained.
Financial informationAssets held for sale as per 31 December 2018 refer to Vattenfall Wärme Hamburg. As per 31 December 2017 there were no assets held for sale.
2018 2017
Property, plant and equipment 4,535 —
Other non-current assets 445 —
Trade receivables and other receivables 341 —
Cash and cash equivalents 2,992 —
Total assets 8,313 —
Other interest-bearing provisions 3,954 —
Deferred tax liabilities 234 —
Trade payables and other liabilities 1,150 —
Total liabilities 5,338 —
VATTENFALL ANNUAL AND SUSTAINABILITY REPORT 2018 119Notes to the Consolidated accounts
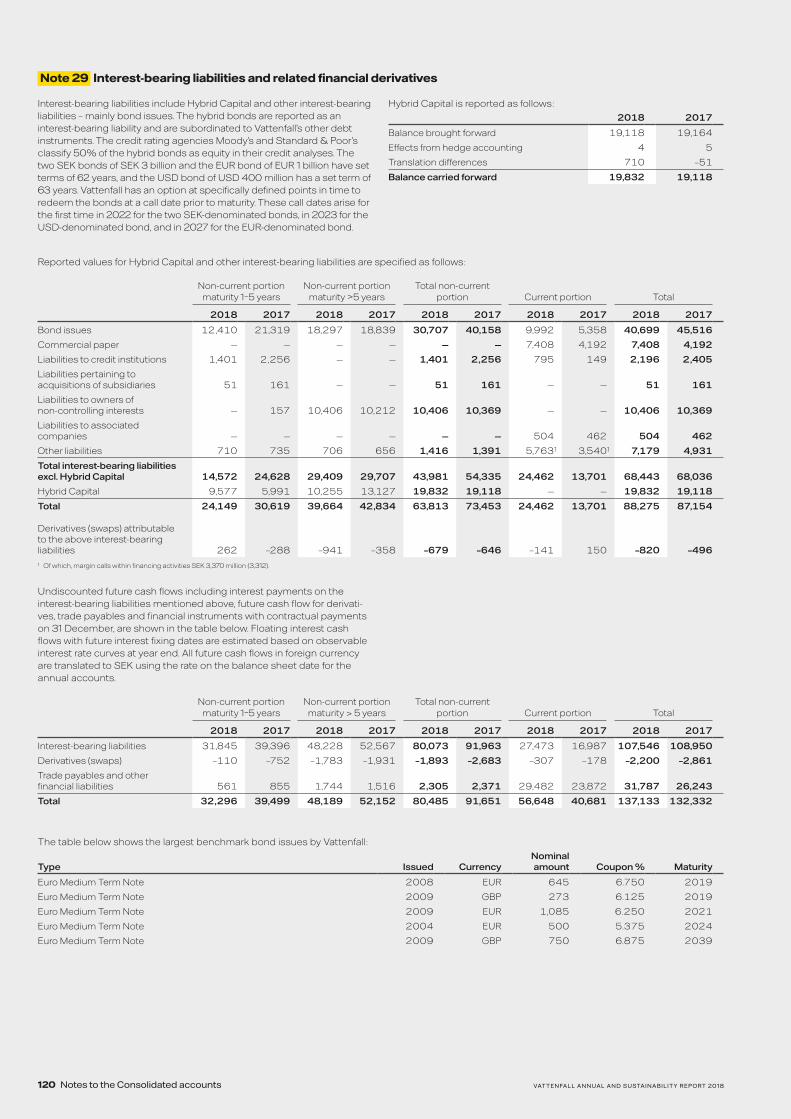
Reported values for Hybrid Capital and other interest-bearing liabilities are specified as follows:
Non-current portion maturity 1–5 years
Non-current portion maturity >5 years
Total non-current portion Current portion Total
2018 2017 2018 2017 2018 2017 2018 2017 2018 2017
Bond issues 12,410 21,319 18,297 18,839 30,707 40,158 9,992 5,358 40,699 45,516
Commercial paper — — — — — — 7,408 4,192 7,408 4,192
Liabilities to credit institutions 1,401 2,256 — — 1,401 2,256 795 149 2,196 2,405
Liabilities pertaining to acquisitions of subsidiaries 51 161 — — 51 161 — — 51 161
Liabilities to owners of non-controlling interests — 157 10,406 10,212 10,406 10,369 — — 10,406 10,369
Liabilities to associated companies — — — — — — 504 462 504 462
Other liabilities 710 735 706 656 1,416 1,391 5,7631 3,5401 7,179 4,931
Total interest-bearing liabilities excl. Hybrid Capital 14,572 24,628 29,409 29,707 43,981 54,335 24,462 13,701 68,443 68,036
Hybrid Capital 9,577 5,991 10,255 13,127 19,832 19,118 — — 19,832 19,118
Total 24,149 30,619 39,664 42,834 63,813 73,453 24,462 13,701 88,275 87,154
Derivatives (swaps) attributable to the above interest-bearing liabilities 262 –288 –941 –358 –679 –646 –141 150 –820 –4961 Of which, margin calls within financing activities SEK 3,370 million (3,312).
Undiscounted future cash flows including interest payments on the interest-bearing liabilities mentioned above, future cash flow for derivati-ves, trade payables and financial instruments with contractual payments on 31 December, are shown in the table below. Floating interest cash flows with future interest fixing dates are estimated based on observable interest rate curves at year end. All future cash flows in foreign currency are translated to SEK using the rate on the balance sheet date for the annual accounts.
Non-current portion maturity 1–5 years
Non-current portion maturity > 5 years
Total non-current portion Current portion Total
2018 2017 2018 2017 2018 2017 2018 2017 2018 2017
Interest-bearing liabilities 31,845 39,396 48,228 52,567 80,073 91,963 27,473 16,987 107,546 108,950
Derivatives (swaps) –110 –752 –1,783 –1,931 –1,893 –2,683 –307 –178 –2,200 –2,861
Trade payables and other financial liabilities 561 855 1,744 1,516 2,305 2,371 29,482 23,872 31,787 26,243
Total 32,296 39,499 48,189 52,152 80,485 91,651 56,648 40,681 137,133 132,332
The table below shows the largest benchmark bond issues by Vattenfall:
Type Issued CurrencyNominal amount Coupon % Maturity
Euro Medium Term Note 2008 EUR 645 6.750 2019
Euro Medium Term Note 2009 GBP 273 6.125 2019
Euro Medium Term Note 2009 EUR 1,085 6.250 2021
Euro Medium Term Note 2004 EUR 500 5.375 2024
Euro Medium Term Note 2009 GBP 750 6.875 2039
Note 29 Interest-bearing liabilities and related financial derivatives
Interest-bearing liabilities include Hybrid Capital and other interest-bearing liabilities – mainly bond issues. The hybrid bonds are reported as an interest-bearing liability and are subordinated to Vattenfall’s other debt instruments. The credit rating agencies Moody’s and Standard & Poor’s classify 50% of the hybrid bonds as equity in their credit analyses. The two SEK bonds of SEK 3 billion and the EUR bond of EUR 1 billion have set terms of 62 years, and the USD bond of USD 400 million has a set term of 63 years. Vattenfall has an option at specifically defined points in time to redeem the bonds at a call date prior to maturity. These call dates arise for the first time in 2022 for the two SEK-denominated bonds, in 2023 for the USD-denominated bond, and in 2027 for the EUR-denominated bond.
Hybrid Capital is reported as follows:2018 2017
Balance brought forward 19,118 19,164
Effects from hedge accounting 4 5
Translation differences 710 –51
Balance carried forward 19,832 19,118
120 Notes to the Consolidated accounts VATTENFALL ANNUAL AND SUSTAINABILITY REPORT 2018
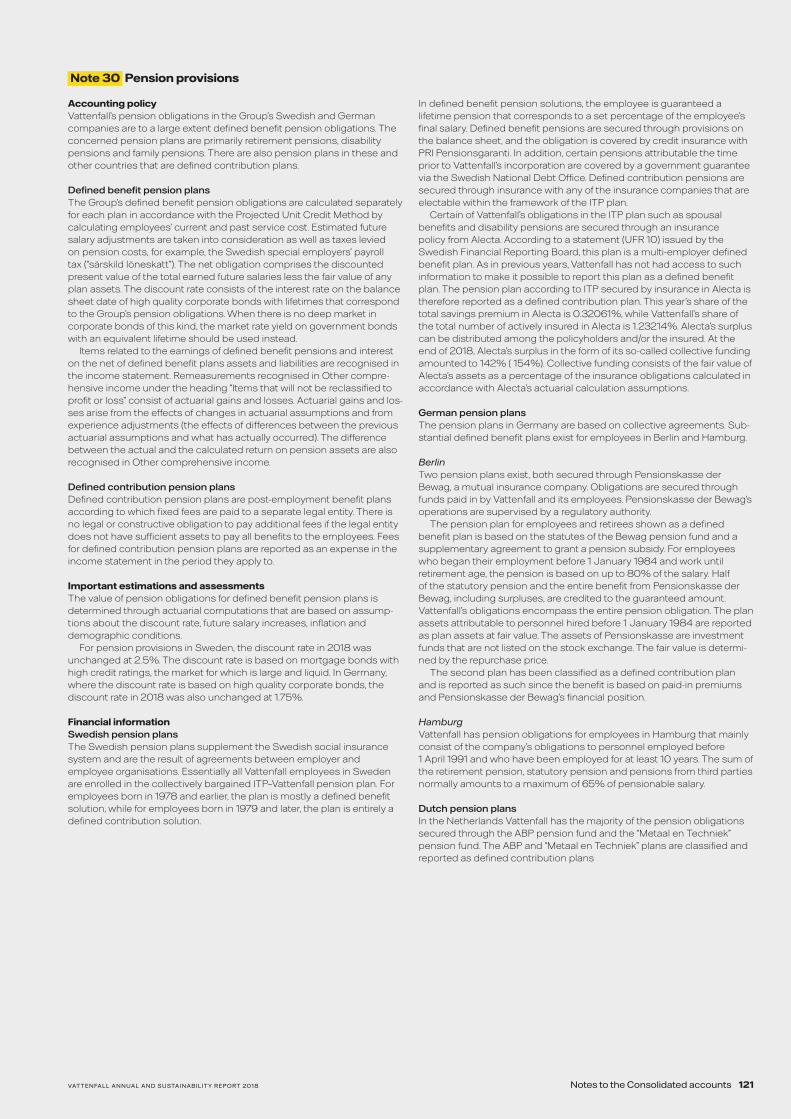
Note 30 Pension provisions
Accounting policyVattenfall’s pension obligations in the Group’s Swedish and German companies are to a large extent defined benefit pension obligations. The concerned pension plans are primarily retirement pensions, disability pensions and family pensions. There are also pension plans in these and other countries that are defined contribution plans.
Defined benefit pension plans The Group’s defined benefit pension obligations are calculated separately for each plan in accordance with the Projected Unit Credit Method by calculating employees’ current and past service cost. Estimated future salary adjustments are taken into consideration as well as taxes levied on pension costs, for example, the Swedish special employers’ payroll tax (“särskild löneskatt”). The net obligation comprises the discounted present value of the total earned future salaries less the fair value of any plan assets. The discount rate consists of the interest rate on the balance sheet date of high quality corporate bonds with lifetimes that correspond to the Group’s pension obligations. When there is no deep market in corporate bonds of this kind, the market rate yield on government bonds with an equivalent lifetime should be used instead.
Items related to the earnings of defined benefit pensions and interest on the net of defined benefit plans assets and liabilities are recognised in the income statement. Remeasurements recognised in Other compre-hensive income under the heading “Items that will not be reclassified to profit or loss” consist of actuarial gains and losses. Actuarial gains and los-ses arise from the effects of changes in actuarial assumptions and from experience adjustments (the effects of differences between the previous actuarial assumptions and what has actually occurred). The difference between the actual and the calculated return on pension assets are also recognised in Other comprehensive income.
Defined contribution pension plansDefined contribution pension plans are post-employment benefit plans according to which fixed fees are paid to a separate legal entity. There is no legal or constructive obligation to pay additional fees if the legal entity does not have sufficient assets to pay all benefits to the employees. Fees for defined contribution pension plans are reported as an expense in the income statement in the period they apply to.
Important estimations and assessmentsThe value of pension obligations for defined benefit pension plans is determined through actuarial computations that are based on assump-tions about the discount rate, future salary increases, inflation and demographic conditions.
For pension provisions in Sweden, the discount rate in 2018 was unchanged at 2.5%. The discount rate is based on mortgage bonds with high credit ratings, the market for which is large and liquid. In Germany, where the discount rate is based on high quality corporate bonds, the discount rate in 2018 was also unchanged at 1.75%.
Financial informationSwedish pension plansThe Swedish pension plans supplement the Swedish social insurance system and are the result of agreements between employer and employee organisations. Essentially all Vattenfall employees in Sweden are enrolled in the collectively bargained ITP–Vattenfall pension plan. For employees born in 1978 and earlier, the plan is mostly a defined benefit solution, while for employees born in 1979 and later, the plan is entirely a defined contribution solution.
In defined benefit pension solutions, the employee is guaranteed a lifetime pension that corresponds to a set percentage of the employee’s final salary. Defined benefit pensions are secured through provisions on the balance sheet, and the obligation is covered by credit insurance with PRI Pensionsgaranti. In addition, certain pensions attributable the time prior to Vattenfall’s incorporation are covered by a government guarantee via the Swedish National Debt Office. Defined contribution pensions are secured through insurance with any of the insurance companies that are electable within the framework of the ITP plan.
Certain of Vattenfall’s obligations in the ITP plan such as spousal benefits and disability pensions are secured through an insurance policy from Alecta. According to a statement (UFR 10) issued by the Swedish Financial Reporting Board, this plan is a multi-employer defined benefit plan. As in previous years, Vattenfall has not had access to such information to make it possible to report this plan as a defined benefit plan. The pension plan according to ITP secured by insurance in Alecta is therefore reported as a defined contribution plan. This year’s share of the total savings premium in Alecta is 0.32061%, while Vattenfall’s share of the total number of actively insured in Alecta is 1.23214%. Alecta’s surplus can be distributed among the policyholders and/or the insured. At the end of 2018, Alecta’s surplus in the form of its so-called collective funding amounted to 142% ( 154%). Collective funding consists of the fair value of Alecta’s assets as a percentage of the insurance obligations calculated in accordance with Alecta’s actuarial calculation assumptions.
German pension plansThe pension plans in Germany are based on collective agreements. Sub-stantial defined benefit plans exist for employees in Berlin and Hamburg.
BerlinTwo pension plans exist, both secured through Pensionskasse der Bewag, a mutual insurance company. Obligations are secured through funds paid in by Vattenfall and its employees. Pensionskasse der Bewag’s operations are supervised by a regulatory authority.
The pension plan for employees and retirees shown as a defined benefit plan is based on the statutes of the Bewag pension fund and a supplementary agreement to grant a pension subsidy. For employees who began their employment before 1 January 1984 and work until retirement age, the pension is based on up to 80% of the salary. Half of the statutory pension and the entire benefit from Pensionskasse der Bewag, including surpluses, are credited to the guaranteed amount. Vattenfall’s obligations encompass the entire pension obligation. The plan assets attributable to personnel hired before 1 January 1984 are reported as plan assets at fair value. The assets of Pensionskasse are investment funds that are not listed on the stock exchange. The fair value is determi-ned by the repurchase price.
The second plan has been classified as a defined contribution plan and is reported as such since the benefit is based on paid-in premiums and Pensionskasse der Bewag’s financial position.
Hamburg Vattenfall has pension obligations for employees in Hamburg that mainly consist of the company’s obligations to personnel employed before 1 April 1991 and who have been employed for at least 10 years. The sum of the retirement pension, statutory pension and pensions from third parties normally amounts to a maximum of 65% of pensionable salary.
Dutch pension plansIn the Netherlands Vattenfall has the majority of the pension obligations secured through the ABP pension fund and the “Metaal en Techniek” pension fund. The ABP and “Metaal en Techniek” plans are classified and reported as defined contribution plans
VATTENFALL ANNUAL AND SUSTAINABILITY REPORT 2018 121Notes to the Consolidated accounts

Defined benefit pension plans2018
Germany
Sweden Plan Berlin Plan Hamburg Total
Present value of unfunded obligations 12,786 448 19,834 33,068
Present value of fully or partly funded obligations — 15,198 160 15,358
Present value of obligations 12,786 15,646 19,994 48,426
Fair value of plan assets — 8,620 120 8,740
Net defined benefit liability 12,786 7,026 19,874 39,686
2017
Germany
Sweden Plan Berlin Plan Hamburg Total
Present value of unfunded obligations 11,624 455 22,607 34,686
Present value of fully or partly funded obligations — 16,052 172 16,224
Present value of obligations 11,624 16,507 22,779 50,910
Fair value of plan assets — 8,824 124 8,948
Net defined benefit liability 11,624 7,683 22,655 41,962
Changes in obligations2018 2017
Balance brought forward 50,910 49,665
Benefits paid by the plan –2,349 –2,164
Service cost 692 667
Contributions by plan participants 4 5
Actuarial gains (–) or losses (+) due to changes in financial assumptions 787 490
Actuarial gains (–) or losses (+) due to changes in demographic assumptions 890 —
Actuarial gains (–) or losses (+) due to plan experience –1,486 105
Current interest expense 1,002 975
Divested companies –62 —
Liabilities associated with assets held for sale –3,604 —
Translation differences 1,642 1,167
Balance carried forward 48,426 50,910
Changes in plan assets2018 2017
Balance brought forward 8,948 9,021
Benefits paid by the plan –521 –458
Contributions by employer 21 21
Contributions by plan participants 4 5
Interest income 158 155
Difference between calculated and actual return –226 –64
Divested companies –18 —
Translation differences 374 268
Balance carried forward 8,740 8,948
Plan assets consist of the following2018 2017
Shares and participations 4,384 4,091
Interest-bearing instruments 2,705 3,368
Property 1,318 1,157
Other 333 332
Total 8,740 8,948
Payments for employer contributions to defined benefit plans during 2019 are estimated at SEK 21 million.
Pension costs2018 2017
Defined benefit plans:
Current service cost 661 644
Interest expenses 1,002 975
Interest income –158 –155
Past service cost 31 23
Total cost for defined benefit plans 1,536 1,487
Cost for defined contribution plans 862 822
Total pension costs 2,398 2,309
122 Notes to the Consolidated accounts VATTENFALL ANNUAL AND SUSTAINABILITY REPORT 2018

In calculating pension obligations, the following actuarial assumptions have been made (%):Sweden Germany
2018 2017 2018 2017
Discount rate 2.50 2.50 1.75 1.75
Future annual salary increases 3.00 3.00 2.50 2.50
Future annual pension increases 2.00 1.50 0.0–2.0 0.0–2.0
Sensitivity to key actuarial assumptionsSweden Germany
2018 2017 2018 2017
% % % %
Impact on the defined benefit obligation at 31 December of a:
Increase by 50 basis points in the discount rate –1,060 –8.3 –950 –8.2 –2,536 –6.5 –2,593 –6.6
Decrease by 50 basis points in the discount rate 1,200 9.4 1,056 9.1 2,843 7.3 2,952 7.5
Increase by 50 basis points in the annual pension increases 1,200 9.4 1,056 9.1 2,109 5.4 2,280 5.8
Decrease by 50 basis points in the annual pension increases –1,060 –8.3 –950 –8.2 –2,025 –5.2 –2,195 –5.6
At 31 December 2018 the weighted duration of pension obligations was 13.9 (14.5) years for Germany and 19.0 (17.3) years for Sweden.
Note 31 Other interest-bearing provisions
Accounting policyA provision is reported on the balance sheet when the Group has a legal or constructive obligation as a result of a past event and it is probable that an outflow of financial resources will be required to regulate the obligation and a reliable estimate of the amount can be made. Where the effect of the time when payment is made is material, provisions are estimated by discounting the anticipated future cash flow at an interest rate before tax that reflects market estimates of time value of money. The discount rate does not reflect such risks that are taken into consideration in the estimated future cash flow.
Changes in discounted provisions for dismantling, restoration or similar measures, which at the time of acquisition have also been reported as tangible non-current assets, are reported as follows: In cases where the change is due to a change in the estimated outflow of resources or a change in the discount rate, the cost of a non-current tangible asset is changed in an amount corresponding to the provision. The periodic change of the present value is recognised as a financial expense.
Provisions are also reported for onerous contracts, that is, where unavoidable costs of meeting the obligations under the contract exceed the economic benefits expected to be received from the contract.
Important estimations and assessmentsProvisions for future expenses for nuclear power operationsProvisions for future expenses for nuclear power operations, which per-tain to future obligations for handling the decommissioning of Vattenfall’s nuclear power plants in Sweden and Germany as well as for handling nuclear waste, are based on long-term cash flow estimations with respect to future expenses. These long-term cash flow estimations mainly pertain to technical plans, estimations on the amount of the expenses, when in time these are expected to fall due, and the discount rate. In many cases, these cash flow estimations must be approved by the pertinent authorities.
For provisions for future expenses for nuclear power operations in Sweden, the discount rate has been reduced to 3.00% (3.25%) and in Germany to 1.00% (1.25%) compared with the preceding year.
Other provisions than pension provisions and provisions for future expenses for nuclear power operations For other types of provisions, such as provisions for future expenses for gas and wind operations and other environmental measures/undertakings, and for personnel-related provisions for non-pension purposes, provisions for tax and legal disputes, or other provisions, the following discount rates are used: Sweden 3.00% (3.25%), Germany 0.50–2.75% (0.75–3.00%), Netherlands 0.75% (1.00%), Denmark 2,75% (3.00%) and the UK 3.50% (3.75%).
Financial informationNon-current portion Current portion Total
2018 2017 2018 2017 2018 2017
Provisions for future expenses of nuclear power operations 75,533 70,104 2,155 1,765 77,688 71,869
Provisions for future expenses of gas and wind operations and other environmental measures/undertakings 7,594 6,465 63 43 7,657 6,508
Personnel-related provisions for non-pension purposes 4,949 4,542 1,330 1,113 6,279 5,655
Provisions for tax and legal disputes 2,268 2,218 118 359 2,386 2,577
Other provisions 2,878 2,672 68 437 2,946 3,109
Total 93,222 86,001 3,734 3,717 96,956 89,718
VATTENFALL ANNUAL AND SUSTAINABILITY REPORT 2018 123Notes to the Consolidated accounts

Provisions for future expenses for nuclear power operationsVattenfall’s nuclear power producers in Sweden and Germany have a legal obligation upon the cessation of production to decommission and dismantle the nuclear power plants and to restore the plots of land where the plants are located.
The Swedish obligation also encompasses the safeguarding and final storage of spent radioactive fuel and other radioactive materials used by the plants. The provisions include future expenses for the handling of low- and intermediate-level radioactive waste. As the permit-holder in Sweden, Vattenfall is responsible for the financing of this handling. As shown in Note 20 to the consolidated accounts, Share in the Swedish Nuclear Waste Fund, Vattenfall’s share in the Swedish Nuclear Waste Fund amounts to SEK 42,038 million (38,591).
Sweden Germany Total
Balance brought forward 53,830 18,039 71,869
Provisions for the period 2,984 1,049 4,033
Interest effects 1,693 235 1,928
Revaluations versus non-current assets 2,730 — 2,730
Reversed provisions — –1,166 –1,166
Provisions used –1,333 –1,127 –2,460
Translation differences — 754 754
Balance carried forward 59,9041 17,7842 77,6881 Of which, approximately 32% (28%) pertains to the dismantling of nuclear power plants
and approximately 68% (72%) to the handling of spent radioactive fuel.2 Of which, approximately 69% (67%) pertains to the dismantling of nuclear power plants
and approximately 31% (33%) to the handling of nuclear waste.
Other provisions than provisions for future expenses for nuclear power operations
Provisions for dismantling and other
environmental measures
Personnel-related provisions for non-pension purposes
Provisions for tax and
legal disputesOther
provisions
Balance brought forward 6,508 5,655 2,577 3,109
Provisions for the period 365 1,565 44 220
Interest effects 190 60 39 1
Reclassified to/from other provision — 153 — –153
Revaluations 831 –9 –159 –89
Provisions used –73 –1,068 –25 –39
Provisions reversed –47 –292 –168 –175
Divested companies — –4 –9 —
Assets held for sale –352 — — —
Translation differences 235 219 87 72
Balance carried forward 7,657 6,279 2,386 2,946
Provisions for future expenses for heat and wind operations and other environmental measures/undertakingsProvisions are made in Germany and the Netherlands for the dismantling and removal of assets and restoration of sites where the Group conducts heat operations. Provisions are also made for restoration of sites where the Group conducts wind operations and for environmental measures/undertakings within other activities carried out by the Group.
Personnel-related provisions for non-pension purposesProvisions are made for future costs pertaining to long-term time accounts, jubilee payments, severance payments related to restructuring measures, and other costs for giving notice to personnel.
Provisions for tax and legal disputesProvisions are made for possible future tax expenses due to ongoing tax audits and for ongoing legal disputes and actions.
Other provisionsOther provisions include, among others, provisions for onerous contracts, restructuring and guarantee commitments.
Future expenses of non-current provisionsWith the current assumptions, provisions are expected to result in outgoing payments as shown below:
Provision for nuclear
Germany
Provision for gas and wind
operations
Personnel- related
provision
Provision for tax and legal
disputesOther
provisions Total
2–5 years 3,881 176 2,381 2,268 2,195 10,901
6–10 years 5,880 984 1,425 — 683 8,972
11–20 years 5,564 4,817 1,056 — — 11,437
Beyond 20 years 303 1,617 87 — — 2,007
Total 15,628 7,594 4,949 2,268 2,878 33,317
Payments of future expenses for nuclear power in Sweden are not included in the amounts reported above, since the owners of the reactors are compensated in corresponding amounts from the Swedish Nuclear Waste Fund.
124 Notes to the Consolidated accounts VATTENFALL ANNUAL AND SUSTAINABILITY REPORT 2018

Note 32 Other noninterest-bearing liabilities (non-current)
Of total liabilities of SEK 2,305 million (2,371), SEK 1,744 million (1,516) falls due after more than five years. Of the total liabilities, SEK 1,905 mil-lion (1,886) pertains to deferred income and SEK 400 million (485) to other liabilities.
Note 33 Trade payables and other liabilities
2018 2017
Accounts payable – trade 20,824 16,198
Liabilities to associated companies 146 136
Other liabilities 8,512 7,538
Total 29,482 23,872
Note 34 Advance payments received
2018 2017
Margin calls received, energy trading 15,293 8,745
Total 15,293 8,745
A margin call received is marginal security (collateral) that Vattenfall’s counterparty pays to Vattenfall as the holder of a derivative position to cover Vattenfall’s credit risk, either bilaterally via OTC or through an exchange. In Vattenfall’s business activities, margin calls occur in energy trading and in the treasury operations.
Margin calls received within energy trading are recognised on the balance sheet as Advance payments received and are thereby recognised in the statement of cash flows as cash flows from changes in operating liabilities while margin calls received within financing activities are recognised on the balance sheet as Current interest-bearing liabilities (Note 29 to the consolidated accounts, Interest-bearing liabilities and related financial derivatives) and are thereby recognised in the statement of cash flows recognised as cash flows from financing activities.
Note 35 Accrued expenses and deferred income
2018 2017
Accrued personnel-related costs 2,333 2,2701
Accrued expenses, CO2 emission allowances 4,744 1,582
Accrued nuclear power-related fees and taxes 397 795
Accrued interest expense 2,134 2,203
Other accrued expenses 4,264 3,676
Deferred income and accrued expenses, electricity 2,359 2,1101
Other deferred income 254 5251
Total 16,485 13,1611
1 The amount has been recalculated compared with previously published information in Vattenfall’s 2017 Annual and Sustainability Report as a result of new accounting rules (IFRS 9 and 15) that took effect in 2018. See Note 2 to the consolidated accounts, Important changes in the financial statements compared with the preceding year.
Note 36 Financial instruments by measurement category, offsetting of financial assets and liabilities, and financial instruments’ effects on income
Accounting policyClassification and measurementFinancial assetsFinancial assets are classified in various categories based in part on the objective (the business model) of holding the financial asset, and in part on the financial instrument’s contractual cash flows, in the event they consist only of principal amounts and interest. The classification is determined at the original point of acquisition. Settlement day accounting is applied for spot purchases and spot sales of financial assets.
Amortised costFinancial assets (debt instruments) are classified in this category if they are held in a business model whose objective is to hold financial assets in order to collect their contractual cash flows, and if the contractual terms of the financial asset give rise on specified dates to cash flows that are solely payments of principal and interest on the principal amount out-standing. These instruments are measured at amortised cost, where the reported gross value is adjusted for expected credit losses. For Vattenfall this category includes Other non-current receivables, Trade receivables and other receivables, Advance payments paid, certain Short-term investments, and Cash and bank balances.
Fair value through profit or lossThis category includes all of Vattenfall’s financial assets (debt instru-ments) that are not measured at amortised cost. This includes assets held for trading, which entails that the objective is that they will be sold in the near term, assets held for sale, and assets that Vattenfall is monitoring and measuring based on fair value. Debt instruments are also classified in this category if the contractual terms do not consist solely of payments of principal and interest. This category also includes Cash equivalents with terms shorter than three months, which Vattenfall monitors and measures based on their fair value. The category also includes certain Short-term investments with original terms in excess of three months.
Derivative assets are always measured at fair value through profit or loss, except for derivative instruments designed as hedge instruments in an effective hedge, where the principles for hedge accounting are used.
Vattenfall classifies holdings of equity instruments at fair value through profit or loss. Vattenfall does not apply the irrevocable option to measure equity instruments that are not held for trading at fair value through other comprehensive income.
The assets in this category are remeasured on a regular basis to fair value with changes in value reported in profit or loss.
Financial liabilitiesFinancial liabilities at fair value through profit or loss Derivative liabilities are always classified in this category. These financial liabilities are measured at fair value with changes in value recognised in profit or loss.
Other financial liabilities In this category, interest-bearing and noninterest-bearing financial liabi-lities that are not held for trading purposes are reported. Other financial liabilities are measured at amortised cost. Trade liabilities have a short anticipated term and are therefore valued at a nominal amount without discounting.
ImpairmentImpairment of financial assets is based on models for expected credit losses. For trade receivables that do not include a significant financing component, a simplified method is used, where calculation of the loss reserve is based on expected credit losses for the remaining term. A collective method is used where the receivables are grouped together based on e.g., the number of days past due including any past-due receivables, and a credit loss percentage is calculated for the respective intervals, where in the model Vattenfall has based its calculations on experience from historic loss levels for similar receivables while taking into account forward-looking macroeconomic conditions that may affect expected cash flows. For individual, significant receivables, an individual assessment may be made. Impairment of trade receivables is reported in operating expenses.
For other financial assets where the policies for impairment are applied, a loss reserve is reported that corresponds to 12 months’ expected credit losses at initial recognition. If the credit risk increases significantly since initial recognition, a reserve corresponding to expected credit losses during the entire term is reported. Vattenfall presumes that the credit risk has not increased significantly if the instrument has a low credit risk on the balance sheet date, such as instruments with an investment grade rating. The credit risk is considered to have increased significantly if the counterparty’s rating has been lowered to a lower rating than investment grade or, alternatively, if the counterparty already had a lower credit rating than investment grade at initial recognition and this rating was significantly lowered further. Expected credit losses are calculated by assessing the probability of default, the loss given default and the exposure at default.
Hedge accountingHedge accounting is applied for derivative instruments that are included in a documented hedge relationship. The reporting of changes in value depends on the type of hedge entered into.
VATTENFALL ANNUAL AND SUSTAINABILITY REPORT 2018 125Notes to the Consolidated accounts
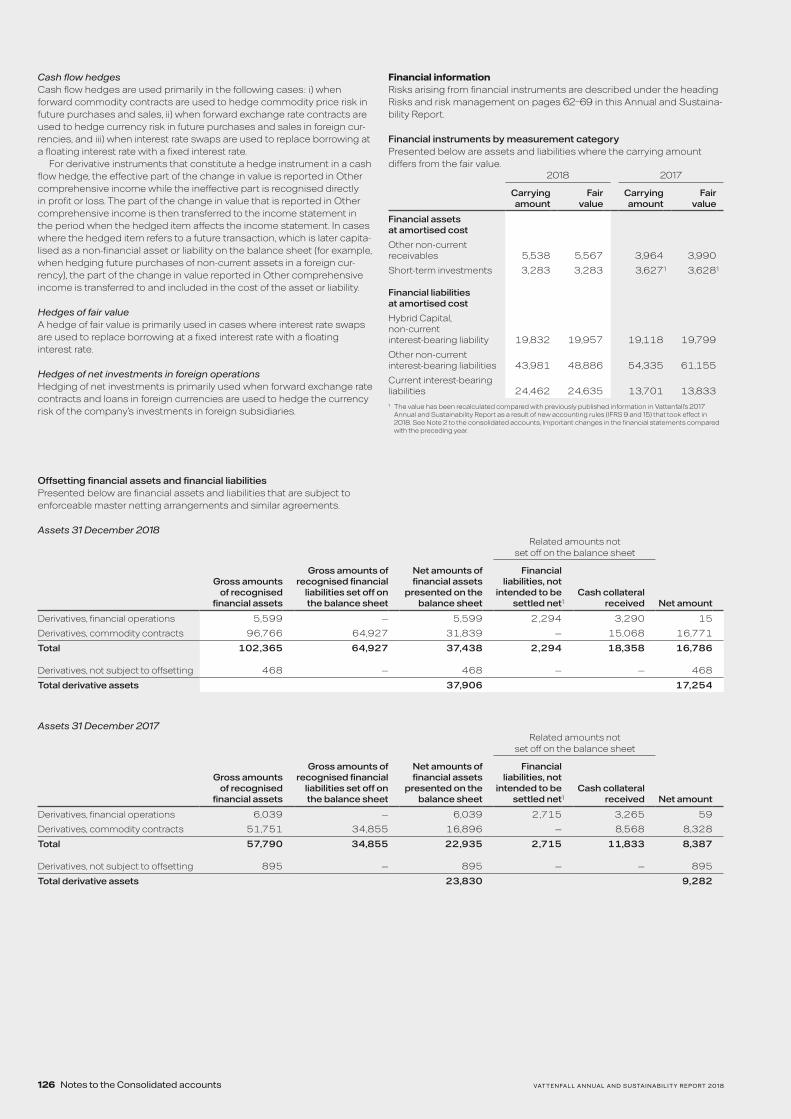
Cash flow hedges Cash flow hedges are used primarily in the following cases: i) when forward commodity contracts are used to hedge commodity price risk in future purchases and sales, ii) when forward exchange rate contracts are used to hedge currency risk in future purchases and sales in foreign cur-rencies, and iii) when interest rate swaps are used to replace borrowing at a floating interest rate with a fixed interest rate.
For derivative instruments that constitute a hedge instrument in a cash flow hedge, the effective part of the change in value is reported in Other comprehensive income while the ineffective part is recognised directly in profit or loss. The part of the change in value that is reported in Other comprehensive income is then transferred to the income statement in the period when the hedged item affects the income statement. In cases where the hedged item refers to a future transaction, which is later capita-lised as a non-financial asset or liability on the balance sheet (for example, when hedging future purchases of non-current assets in a foreign cur-rency), the part of the change in value reported in Other comprehensive income is transferred to and included in the cost of the asset or liability.
Hedges of fair value A hedge of fair value is primarily used in cases where interest rate swaps are used to replace borrowing at a fixed interest rate with a floating interest rate.
Hedges of net investments in foreign operations Hedging of net investments is primarily used when forward exchange rate contracts and loans in foreign currencies are used to hedge the currency risk of the company’s investments in foreign subsidiaries.
Financial informationRisks arising from financial instruments are described under the heading Risks and risk management on pages 62–69 in this Annual and Sustaina-bility Report.
Financial instruments by measurement categoryPresented below are assets and liabilities where the carrying amount differs from the fair value.
2018 2017
Carrying amount
Fair value
Carrying amount
Fair value
Financial assets at amortised cost
Other non-current receivables 5,538 5,567 3,964 3,990
Short-term investments 3,283 3,283 3,6271 3,6281
Financial liabilities at amortised cost
Hybrid Capital, non-current interest- bearing liability 19,832 19,957 19,118 19,799
Other non-current interest-bearing liabilities 43,981 48,886 54,335 61,155
Current interest-bearing liabilities 24,462 24,635 13,701 13,8331 The value has been recalculated compared with previously published information in Vattenfall’s 2017
Annual and Sustainability Report as a result of new accounting rules (IFRS 9 and 15) that took effect in 2018. See Note 2 to the consolidated accounts, Important changes in the financial statements compared with the preceding year.
Offsetting financial assets and financial liabilitiesPresented below are financial assets and liabilities that are subject to enforceable master netting arrangements and similar agreements.
Assets 31 December 2018Related amounts not
set off on the balance sheet
Gross amounts of recognised
financial assets
Gross amounts of recognised financial
liabilities set off on the balance sheet
Net amounts of financial assets
presented on the balance sheet
Financial liabilities, not
intended to be settled net1
Cash collateral received Net amount
Derivatives, financial operations 5,599 — 5,599 2,294 3,290 15
Derivatives, commodity contracts 96,766 64,927 31,839 — 15,068 16,771
Total 102,365 64,927 37,438 2,294 18,358 16,786
Derivatives, not subject to offsetting 468 — 468 — — 468
Total derivative assets 37,906 17,254
Assets 31 December 2017Related amounts not
set off on the balance sheet
Gross amounts of recognised
financial assets
Gross amounts of recognised financial
liabilities set off on the balance sheet
Net amounts of financial assets
presented on the balance sheet
Financial liabilities, not
intended to be settled net1
Cash collateral received Net amount
Derivatives, financial operations 6,039 — 6,039 2,715 3,265 59
Derivatives, commodity contracts 51,751 34,855 16,896 — 8,568 8,328
Total 57,790 34,855 22,935 2,715 11,833 8,387
Derivatives, not subject to offsetting 895 — 895 — — 895
Total derivative assets 23,830 9,282
126 Notes to the Consolidated accounts VATTENFALL ANNUAL AND SUSTAINABILITY REPORT 2018

Liabilities 31 December 2018Related amounts not
set off on the balance sheet
Gross amounts of recognised
financial liabilities
Gross amounts of recognised financial assets set off on the
balance sheet
Net amounts of financial liabilities presented on the
balance sheet
Financial assets, not
intended to be settled net1
Cash collateral pledged Net amount
Derivatives, financial operations 4,659 — 4,659 2,294 2,337 28
Derivatives, commodity contracts 98,637 64,927 33,710 — 2,330 31,380
Total 103,296 64,927 38,369 2,294 4,667 31,408
Derivatives, not subject to offsetting 2,918 — 2,918 — — 2,918
Total derivative liabilities 41,287 34,326
Liabilities 31 December 2017Related amounts not
set off on the balance sheet
Gross amounts of recognised
financial liabilities
Gross amounts of recognised financial assets set off on the
balance sheet
Net amounts of financial liabilities presented on the
balance sheet
Financial assets, not
intended to be settled net1
Cash collateral pledged Net amount
Derivatives, financial operations 5,473 — 5,473 2,715 2,695 63
Derivatives, commodity contracts 52,255 34,855 17,400 — 2,176 15,224
Total 57,728 34,855 22,873 2,715 4,871 15,287
Derivatives, not subject to offsetting 3,125 — 3,125 — — 3,125
Total derivative liabilities 25,998 18,4121 These items cannot be settled net as each transaction has a unique due date and they were not entered
into with the purpose to be settled net. Settlement can be entailed only in case of default.
Financial assets and liabilities that are measured at fair value on the balance sheet at 31 December 2018
Level 1 Level 2 Level 3 Total
Assets
Share in the Swedish Nuclear Waste Fund 42,038 42,038
Derivative assets — 37,905 1 37,906
Short-term investments, cash equivalents, other shares and participations 15,471 13,361 — 28,832
Total assets 57,509 51,266 1 108,776
Liabilities
Derivative liabilities — 41,191 96 41,287
Total liabilities — 41,191 96 41,287
Financial assets and liabilities that are measured at fair value on the balance sheet at 31 December 2017
Level 1 Level 2 Level 3 Total
Assets
Derivative assets — 23,701 129 23,830
Short-term investments, cash equivalents, other shares and participations 10,700 6,5921 — 17,292
Total assets 10,700 30,293 129 41,122
Liabilities
Derivative liabilities — 25,900 98 25,998
Total liabilities — 25,900 98 25,9981 The value has been recalculated compared with previously published information in Vattenfall’s 2017
Annual and Sustainability Report as a result of new accounting rules (IFRS 9 and 15) that took effect in 2018. See Note 2 to the consolidated accounts, Important changes in the financial statements compared with the preceding year.
VATTENFALL ANNUAL AND SUSTAINABILITY REPORT 2018 127Notes to the Consolidated accounts

Note 37 Specifications of the cash flow statement
Other, including non-cash items2018 2017
Undistributed results from participation in associated companies –200 –287
Unrealised foreign exchange gains/losses –22 107
Unrealised changes in values related to derivatives 152 3,494
Changes in the Swedish Nuclear Waste Fund –1,597 –1,254
Changes in provisions –1,908 –1,581
Other –134 229
Total –3,709 708
Dividends received totalled SEK 98 million (166).
Other investments in non-current assets2018 2017
Investments in intangible assets: non- current, including advance payments –731 –609
Investments in property, plant and equip-ment, including advance payments –21,405 –19,448
Total –22,136 –20,057
Divestments2018 2017
Divestments of shares and participations 99 1,731
Divestments of intangible assets: non-current 28 —
Divestments of property, plant and equipment 1,442 1,064
Total 1,569 2,795
Sensitivity analysis for electricity and fuel derivativesThe price of electricity is the main factor impacting the change in fair value recognised in other comprehensive income. Changes in fair value that are recognised in the income statement originate from the prices for gas and oil. The sensitivity analysis is based on volumes and market prices at year-end. The analysis pertains to profit before tax.
Fair valuation on the balance sheet date of 31 December 2018 of +/–10% would change the fair value of Vattenfall’s electricity and fuel deri-vatives by –/+ SEK 664 million (–/+ 387) in other comprehensive income (hedge-accounted derivatives) and +/– SEK 4,987 million (+/–2,902) in the income statement (non-hedge-accounted derivatives).
Sensitivity analysis for Level 3 contractsFor the determination of fair value of financial instruments, Vattenfall strives to use valuation techniques that maximise the use of observable market data where it is available and rely as little as possible on entity-specific estimates.
Entity-specific estimates are based on internal valuation models that are subject to a defined process of validation, approval and monitoring. In the first step the model is designed by the business. The valuation model and calibration of the valuation model is then independently reviewed and approved by Vattenfall’s risk organisation. If deemed necessary, adjustments are required and implemented. Afterwards, Vattenfall’s risk organisation continuously monitors whether the application of the method is still appropriate. This is made by usage of several back-testing tools. In order to reduce valuation risks, the application of the model can be restricted to a limited scope.
Vattenfall’s Level 3 contracts consist of CDM, virtual gas storage cont-racts and gas swing contracts. The net value as per 31 December 2018 has been calculated at SEK –95 million (31) and is most sensitive to the optionality volatility. A change in the value of the daily volatility of +/–5% would affect the total value by approximately +/– SEK 35 million (+/–15).
Financial instruments: Effects on income by categoryNet gains (+)/losses(–) and interest income and expenses for financial instruments recognised in the income statement:
2018 2017
Total VattenfallNet gains/
losses1Interest income
Interest expenses
Net gains/ losses1
Interest income
Interest expenses
Financial assets at fair value through profit or loss –5,866 2,077 56 –3,215 117 –34
Financial assets measured at amortised cost 33 — — 100 1,1382 —
Financial liabilities at fair value through profit or loss –131 106 — –202 1152 —
Financial liabilities measured at amortised cost –377 — –3,246 312 — –5,018
Total –6,341 2,183 –3,190 –3,005 1,370 –5,0521 Exchange rate gains and losses are included in net gains/losses.2 The value has been adjusted compared with information previously published in Vattenfall’s 2017 Annual and Sustainability Report.
Derivative assetsNon-current portion,
maturity 1–5 yearsNon-current portion,
maturity >5 yearsTotal non-current
portion Current portion Total
2018 2017 2018 2017 2018 2017 2018 2017 2018 2017
Financial contracts 1,074 1,549 3,718 3,817 4,792 5,366 808 673 5,600 6,039
Commodity and commodity-related contracts 9,156 7,241 3 194 9,159 7,435 23,147 10,356 32,306 17,791
Total 10,230 8,790 3,721 4,011 13,951 12,801 23,955 11,029 37,906 23,830
Derivative liabilitiesNon-current portion,
maturity 1–5 yearsNon-current portion,
maturity >5 yearsTotal non-current
portion Current portion Total
2018 2017 2018 2017 2018 2017 2018 2017 2018 2017
Financial contracts 1,216 1,199 2,759 3,460 3,975 4,659 685 815 4,660 5,474
Commodity and commodity-related contracts 9,269 7,479 798 660 10,067 8,139 26,560 12,385 36,627 20,524
Total 10,485 8,678 3,557 4,120 14,042 12,798 27,245 13,200 41,287 25,998
128 Notes to the Consolidated accounts VATTENFALL ANNUAL AND SUSTAINABILITY REPORT 2018

Note 38 Specifications of equity
Share capitalAs of 31 December 2018 the registered share capital comprised 131,700,000 shares with a share quota value of SEK 50.
Translation reserveThe translation reserve comprises all exchange rate differences arising from the translation of financial reports from non-Swedish operations that prepare their reports in a currency other than that in which the Group reports. Further, the translation reserve includes exchange rate differen-ces arising from the reassessment of debts raised as hedges for net investments in non-Swedish operations.
Reserve for hedgesThe reserve for hedges comprises mostly unrealised changes in values of commodity derivatives used to hedge future sales (cash flow hedges). The reserve for hedges is expected to affect the income statement and cash flow, respectively, in the periods indicated to the right:
2018 2017
Cash flowIncome
statement Cash flowIncome
statement
Within 1 year –1,475 985 2 416
Between 1–5 years 1,243 1,297 –174 69
Total –232 2,282 –172 485
Other –17 — –191 —
Total –249 2,282 –363 485
The change in the reserve for hedges relating to Cash flow hedges – dis-solved against income statement amounted to SEK 6,066 million (2,844), of which SEK 6,079 million (2,846) has been reported in net sales.
Retained earnings including profit for the yearRetained earnings including profit for the year include earned profits in the Parent Company and its subsidiaries, associated companies and joint ventures, and effects of remeasurements of defined benefit pension plans.
Note 39 Collateral
2018 2017
Shares pledged to PRI Pensionsgaranti, as security for credit insurance in respect of pension obligations in Vattenfall’s Swedish operations 7,295 7,295
Blocked bank funds as security for trading on the Nordic electricity exchange and trading with CO2 emission allowances 5,103 2,235
Blocked bank funds as security for guarantees issued by bank — 1
Total 12,398 9,531
In addition to the collateral mentioned above, Vattenfall has the following significant commitments:
To fulfil the requirements for security in the derivative market, in its energy trading and financial operations Vattenfall has pledged security to counterparties for the negative fair value of derivative positions. As per 31 December 2018 this security amounted to SEK 2,330 mil-lion (2,054) for energy trading and SEK 2,436 million (2,749) for the financial operations. The amounts are reported as assets on the balance sheet under Advance payments (Note 24 to the consolidated accounts, Advance payments paid) and under Short-term investments (Note 26 to the consolidated accounts, Short-term investments). The counterparties are obligated to repay this security to Vattenfall in the event the negative fair value decreases.
In a similar manner, Vattenfall’s counterparties in energy trading and the financial operations have pledged security to Vattenfall. Security received as per 31 December 2018 amounted to SEK 15,293 million (8,745) for energy trading and SEK 3,370 million (3,312) for the financial operations. The amounts are reported as liabilities on the balance sheet under Advance payments received for the energy trading position (Note 34 to the consolidated accounts, Advance payments received) and Interest-bearing liabilities (current) for the financial operations (Note 29 to the consolidated accounts, Interest-bearing liabilities and related financial derivatives).
Note 40 Contingent liabilities
As per 31 December 2018 contingent liabilities amounted to SEK 993 mil-lion (1,086). The contingent liabilities mainly consist of the following:• Vattenfall Wind Power Ltd., together with Scottish Power Renewa-
bles Ltd., takes part in developing up to 7,200 MW of wind capacity off the coast of East Anglia as part of The Crown Estate’s Round Three wind programme, known as East Anglia Offshore Wind Ltd. The issued guarantees related to East Anglia Offshore Wind amounts to SEK 63 million per 31 December 2018
• Pending legal issues• Pension commitments PRI• Various contingent liabilities in relation to eSett Oy, the Swedish Nuclear
Waste Fund, Forsmark, Ringhals and Nord Pool Spot A/S
In addition to the contingent liabilities mentioned above, Vattenfall has the following significant commitments.
In certain rivers, joint regulation facilities exist for several hydro power plants. The owners of the power plants have payment obligations for their share of these regulation costs. Vattenfall has an obligation to compensate certain owners of water rights, in rivers where hydro power stations are built, through the delivery of power. In 2018, such compensa-tion deliveries amounted to 0.8 TWh (0.8), for a value of approximately SEK 354 million (249).
Under Swedish law, Vattenfall has strict and unlimited liability for third-party loss resulting from dam accidents. Together with other hydro power producers in the Nordic countries, Vattenfall has liability insurance that is limited to payment of a maximum of SEK 10,000 million (10,000) in benefits for these types of claims.
In Germany, nuclear power operators have strict and unlimited liability to third parties. By law, nuclear power plants are required to have insurance or other financial guarantees for amounts up to EUR 2,500 mil-lion. Claims of up to EUR 256 million are covered by the German Mutual Atomic Energy Reinsurance Pool. The nuclear power plants and their German parent companies (in Vattenfall’s case, Vattenfall GmbH) are lia-ble for amounts in excess of this, in proportion to the ownership interests the respective parent companies have in the nuclear power plants. It is not until these resources are exhausted that a joint liability insurance agreement (Solidarvereinbarung) takes force between the owners of the German nuclear power plants (Vattenfall GmbH, E.ON, RWE and EnBW), for amounts up to EUR 2,500 million. Since the liability is unlimited, the
Translation exposure of equity in other currencies than SEK
Equity Hedging after tax Net exposure after taxAverage net exposure
after tax
Original currency 2018 2017 2018 2017 2018 2017 2018 2017
EUR 76,999 71,333 30,354 30,392 46,645 40,941 45,521 39,345
DKK 3,450 3,692 — — 3,450 3,692 3,598 3,216
GBP 11,946 15,897 4,471 6,491 7,475 9,406 8,925 6,850
Other currencies — — — — — — — 104
Total 92,395 90,922 34,825 36,883 57,570 54,039 58,044 49,515
VATTENFALL ANNUAL AND SUSTAINABILITY REPORT 2018 129Notes to the Consolidated accounts
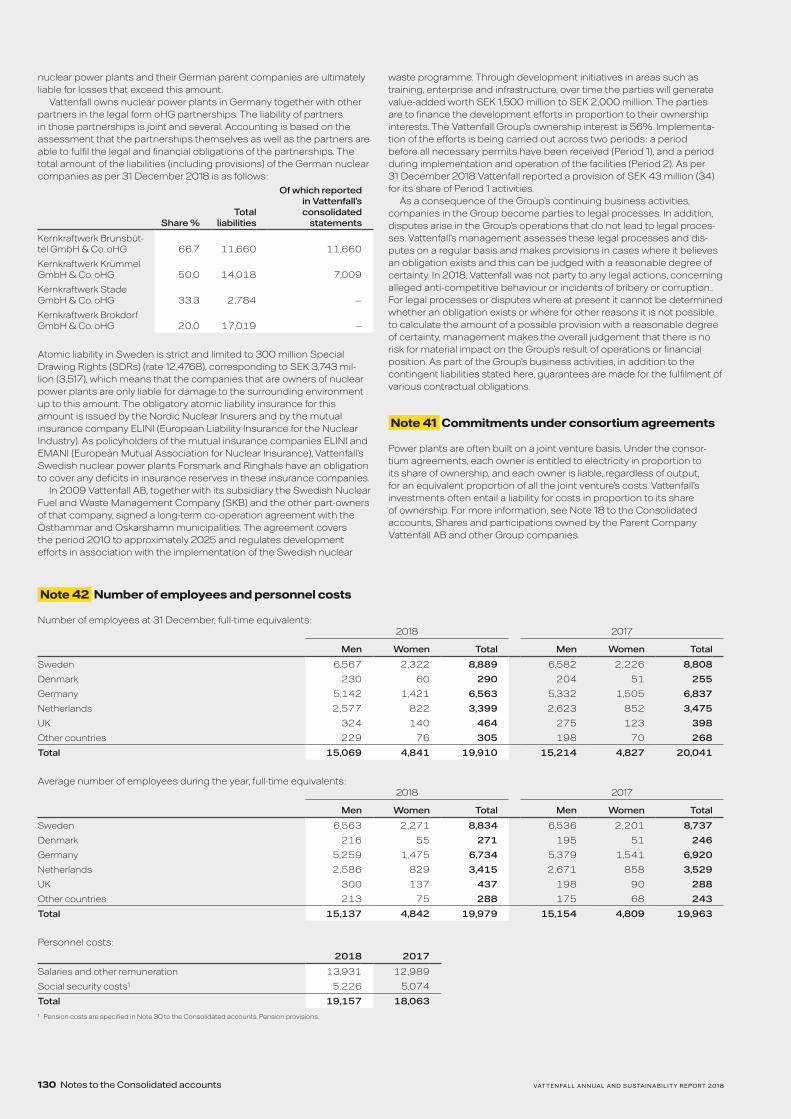
nuclear power plants and their German parent companies are ultimately liable for losses that exceed this amount.
Vattenfall owns nuclear power plants in Germany together with other partners in the legal form oHG partnerships. The liability of partners in those partnerships is joint and several. Accounting is based on the assessment that the partnerships themselves as well as the partners are able to fulfil the legal and financial obligations of the partnerships. The total amount of the liabilities (including provisions) of the German nuclear companies as per 31 December 2018 is as follows:
Share %Total
liabilities
Of which reported in Vattenfall’s consolidated
statements
Kernkraftwerk Brunsbüt-tel GmbH & Co. oHG 66.7 11,660 11,660
Kernkraftwerk Krümmel GmbH & Co. oHG 50.0 14,018 7,009
Kernkraftwerk Stade GmbH & Co. oHG 33.3 2,784 —
Kernkraftwerk Brokdorf GmbH & Co. oHG 20.0 17,019 —
Atomic liability in Sweden is strict and limited to 300 million Special Drawing Rights (SDRs) (rate 12,4768), corresponding to SEK 3,743 mil-lion (3,517), which means that the companies that are owners of nuclear power plants are only liable for damage to the surrounding environment up to this amount. The obligatory atomic liability insurance for this amount is issued by the Nordic Nuclear Insurers and by the mutual insurance company ELINI (European Liability Insurance for the Nuclear Industry). As policyholders of the mutual insurance companies ELINI and EMANI (European Mutual Association for Nuclear Insurance), Vattenfall’s Swedish nuclear power plants Forsmark and Ringhals have an obligation to cover any deficits in insurance reserves in these insurance companies.
In 2009 Vattenfall AB, together with its subsidiary the Swedish Nuclear Fuel and Waste Management Company (SKB) and the other part-owners of that company, signed a long-term co-operation agreement with the Östhammar and Oskarshamn municipalities. The agreement covers the period 2010 to approximately 2025 and regulates development efforts in association with the implementation of the Swedish nuclear
waste programme. Through development initiatives in areas such as training, enterprise and infrastructure, over time the parties will generate value-added worth SEK 1,500 million to SEK 2,000 million. The parties are to finance the development efforts in proportion to their ownership interests. The Vattenfall Group’s ownership interest is 56%. Implementa-tion of the efforts is being carried out across two periods: a period before all necessary permits have been received (Period 1), and a period during implementation and operation of the facilities (Period 2). As per 31 December 2018 Vattenfall reported a provision of SEK 43 million (34) for its share of Period 1 activities.
As a consequence of the Group’s continuing business activities, companies in the Group become parties to legal processes. In addition, disputes arise in the Group’s operations that do not lead to legal proces-ses. Vattenfall’s management assesses these legal processes and dis-putes on a regular basis and makes provisions in cases where it believes an obligation exists and this can be judged with a reasonable degree of certainty. In 2018, Vattenfall was not party to any legal actions, concerning alleged anti-competitive behaviour or incidents of bribery or corruption.. For legal processes or disputes where at present it cannot be determined whether an obligation exists or where for other reasons it is not possible to calculate the amount of a possible provision with a reasonable degree of certainty, management makes the overall judgement that there is no risk for material impact on the Group’s result of operations or financial position. As part of the Group’s business activities, in addition to the contingent liabilities stated here, guarantees are made for the fulfilment of various contractual obligations.
Note 41 Commitments under consortium agreements
Power plants are often built on a joint venture basis. Under the consor-tium agreements, each owner is entitled to electricity in proportion to its share of ownership, and each owner is liable, regardless of output, for an equivalent proportion of all the joint venture’s costs. Vattenfall’s investments often entail a liability for costs in proportion to its share of ownership. For more information, see Note 18 to the Consolidated accounts, Shares and participations owned by the Parent Company Vattenfall AB and other Group companies.
Note 42 Number of employees and personnel costs
Number of employees at 31 December, full-time equivalents:2018 2017
Men Women Total Men Women Total
Sweden 6,567 2,322 8,889 6,582 2,226 8,808
Denmark 230 60 290 204 51 255
Germany 5,142 1,421 6,563 5,332 1,505 6,837
Netherlands 2,577 822 3,399 2,623 852 3,475
UK 324 140 464 275 123 398
Other countries 229 76 305 198 70 268
Total 15,069 4,841 19,910 15,214 4,827 20,041
Average number of employees during the year, full-time equivalents:2018 2017
Men Women Total Men Women Total
Sweden 6,563 2,271 8,834 6,536 2,201 8,737
Denmark 216 55 271 195 51 246
Germany 5,259 1,475 6,734 5,379 1,541 6,920
Netherlands 2,586 829 3,415 2,671 858 3,529
UK 300 137 437 198 90 288
Other countries 213 75 288 175 68 243
Total 15,137 4,842 19,979 15,154 4,809 19,963
Personnel costs:2018 2017
Salaries and other remuneration 13,931 12,989
Social security costs1 5,226 5,074
Total 19,157 18,0631 Pension costs are specified in Note 30 to the Consolidated accounts, Pension provisions.
130 Notes to the Consolidated accounts VATTENFALL ANNUAL AND SUSTAINABILITY REPORT 2018

Benefits for board members of Vattenfall AB and senior executives of the Vattenfall Group2018 2017
Amounts in SEK thousands
Directors’ fees and base
salary including vacation pay
Other remuner- ation and
benefits
Pension and severance
costs
Directors’ fees and base
salary including vacation pay
Other remuner- ation and
benefits
Pension and severance
costs
Board of Directors
Lars G. Nordström, Chairman of the Board 768 — — 710 — —
Fredrik Arp, board member 441 — — 395 — —
Viktoria Bergman, board member 389 — — 365 — —
Håkan Erixon, board member 412 — — 382 — —
Tomas Kåberger, board member 414 — — 382 — —
Jenny Lahrin, board member — — — — — —
Åsa Söderström Jerring, board member 410 — — 380 — —
Fredrik Rystedt, board member 414 — — 267 — —
Employee representatives — — — — — —
Former board members1 — — — 399 — —
Total, Board of Directors 3,248 — — 3,280 — —
2018 2017
Amounts in SEK thousands
Directors’ fees and base
salary including vacation pay
Other remuner- ation and
benefits
Pension and severance
costs
Directors’ fees and base
salary including vacation pay
Other remuner- ation and
benefits
Pension and severance
costs
Executive Group Management
Magnus Hall, President and CEO 15,242 68 4,507 14,876 68 4,375
Anna Borg, CFO 6,625 92 2,020 4,710 — 1,357
Torbjörn Wahlborg, Head of Generation Business Area 7,309 67 2,149 7,129 67 2,107
Tuomo Hatakka, Head of Heat Business Area 13,132 94 2,821 12,242 92 2,651
Kerstin Ahlfont, Head of Human Resources Staff Function 4,283 18 1,274 4,225 18 1,249
Gunnar Groebler, Head of Wind Business Area 5,961 97 1,181 5,494 91 979
Anne Gynnerstedt, Head of Legal & CEO Office Staff Function and Secretary to the Board of Directors 4,802 54 1,438 4,917 55 1,410
Martijn Hagens, Head of Customers & Solutions Business Area 7,181 38 1,7542 6,487 135 774
Niek den Hollander, Head of Business Area Markets 7,181 4,5243 1,293 1,125 2,3834 202
Andreas Regnell, Head of Strategic Development Staff Function 4,575 74 1,354 4,541 42 1,327
Karin Lepasoon, Head of Communication 4,482 28 1,318 4,740 32 1,293
Other senior executives2
Björn Linde, Head of Business Unit Nuclear Generation 2,941 77 878 2,700 58 799
Annika Viklund, Head of Distribution Business Area 4,791 34 1,474 4,768 30 1,405
Former senior executives
Other former senior executives1 — — — 8,913 118 2,193
Total Executive Group Management and senior executives 88,505 5,265 23,461 86,867 3,189 22,121
Total Board of Directors, Executive Group Management and other senior executives 91,753 5,265 23,461 90,147 3,189 22,1211 See Vattenfall’s 2017 Annual and Sustainability Report, pages 137–139.2 The pension cost was higher in 2018 due to a one-time adjustment in 2018 of payments made in 2016 and
2017.3 Of this amount, SEK 4,391 thousand pertains to payment of variable remuneration received in 2018 related
to a previous position at Vattenfall.4 Of this amount, SEK 2,366 thousand pertains to payment of variable remuneration received in December
2017 related to a previous position at Vattenfall.
Board of DirectorsAs of 25 April 2018 the Annual General Meeting resolved in favour of increasing these fees by 8.0% and 6.1%, respectively, entailing that directors’ fees for the period until the end of the next Annual General Meeting shall amount to SEK 740 thousand for the Chairman of the Board and SEK 350 thousand for each of the other directors elected at the Annual General Meeting. In addition, it was resolved that for service on the Audit Committee, a fee of SEK 90 thousand shall be paid to the respective committee chairs and SEK 70 thousand to the other com-mittee members. For service on the Remuneration Committee, a fee of SEK 60 thousand shall be paid to the respective committee chairs and SEK 45 thousand to the other committee members. No directors’ fees are paid to board members who are employed by the Swedish Government Offices or to employee representatives. The fees paid to each individual
board member are shown in the table above. The board members’ respective committee assignments are described in the Corporate Governance section on pages 70–84.
President and Chief Executive OfficerMagnus Hall received a salary of SEK 15,242 thousand in 2018. The value of other benefits in 2018 amounted to SEK 68 thousand and pertains to the benefit of an annual pass with SJ. Magnus Hall has no variable salary component in his employment as President and CEO of Vattenfall AB.
Magnus Hall has a defined contribution pension solution. Premiums paid for 2018 totalled SEK 4,507 thousand, which corresponds to 30% of his 2018 salary excluding benefits. The retirement age for Vattenfall’s CEO is 65 years. Magnus Hall’s term of employment is until further notice, with a mutual notice period of six months. In the event Vattenfall serves notice,
VATTENFALL ANNUAL AND SUSTAINABILITY REPORT 2018 131Notes to the Consolidated accounts

Note 43 Gender distribution among senior executivesWomen, % Men, %
2018 2017 2018 2017
Gender distribution among board members 29 29 71 71
Gender distribution among other senior executives 36 36 64 64
Note 44 Related party disclosures
Vattenfall AB is 100%-owned by the Swedish state. The Vattenfall Group’s products and services are offered to the state, state authorities and state companies in competition with other vendors under generally accepted commercial terms. In a similar manner, Vattenfall AB and its Group com-panies purchase products and services from state authorities and state companies at market prices and otherwise under generally accepted commercial terms. No significant share of the Vattenfall Group’s net sales, purchasing or earnings is attributable to the Swedish state or any of its authorities or companies.
Disclosures of transactions with key persons in executive positions in the company are shown in Note 42 to the Consolidated accounts, Number of employees and personnel costs.
Disclosures of transactions with major associated companies in 2018 and associated receivables and liabilities as per 31 December 2018 are described below.
Kernkraftwerk Brokdorf GmbH & Co. oHGThis is a nuclear power plant from which Vattenfall purchases electricity. Purchases amounted to SEK 446 million (–1,536, of which SEK –1,760 million pertains to refund of Nuclear Fuel tax). Operating revenue from the company amounted to SEK 0 million (0). Vattenfall’s interest expense to the company amounted to SEK 2 million (23). Loan liabilities amounted to SEK 156 million (0).
GASAG Berliner Gaswerke AGThe company sells, distributes and stores natural gas in the Berlin area. Vattenfall received SEK 282 million (213) in operating revenue from the company, and purchases from the company totalled SEK 13 million (12). Trade liabilities amounted to SEK 0 million (98). Vattenfall’s part of contin-gent liabilities of the company amounted to SEK 123 million (127).
Note 45 Events after the balance sheet date
Vattenfall has acquired the Dutch electricity and gas sales company DELTA Energie. DELTA Energie supplies green electricity and gas to households and small and medium-sized companies, mainly in the Dutch province Zeeland. The company has 120 employees and 170,000 customers.
The storm Alfrida, which hit Sweden’s Roslagen region and the Stock-holm archipelago on the night of January 1, had severe consequences and caused major damage to the electricity grid. At most, 65,000 Vat-tenfall customers experienced power outages. The last customers had their electricity service restored on 23 January. Repair work will continue for several months.
On 5 March 2019 the City of Berlin announced that its municipal energy company Berlin Energie will be awarded the new concession for the electricity grid in Berlin. Vattenfall has had the concession rights, through its subsidiary Stromnetz Berlin GmbH and previously Bewag, for more than 20 years. Stromnetz Berlin GmbH today owns and operates the electricity grid in Berlin, which among other things includes around 35,000 kilometres distribution network and more than 2.3 million network customers. Vattenfall will analyse the selection statement in advance of a decision about our further course of action.
On 8 March 2019 the Dutch Government announced that Vattenfall’s Hemweg-8 power plant in Amsterdam should stop using coal as a fuel for electricity production by the end of 2019. This will mean that the Hemweg-8 power plant will have to stop operating without the previously announced transitional period of 5 years. The Dutch Government has indicated that the level of the compensation for losses will be further discussed with Vattenfall.
Note 46 Operations requiring permits
During the year Vattenfall conducted operations that require permits under national legislation in Sweden, Finland, Denmark, Germany, the Nether-lands and the UK. Vattenfall AB conducts operations that require permits in accordance with the Swedish Environmental Code. These consist primarily of electricity and heat production plants that require permits and/or registration. Vattenfall’s other operations requiring permits that make up a significant part of the business are conducted primarily by subsidiaries.
Magnus Hall is entitled to a maximum of 18 months’ severance pay after the notice period, but not longer than until his date of retirement. The amount of the severance pay shall be based on the fixed salary that app-lied at the time the notice was served. In the event Magnus Hall accepts new employment or earns income from other business activities, the severance pay shall be reduced by an amount corresponding to the new income or other benefit received during the period in question. Severance pay is to be paid out monthly. Magnus Hall’s terms of employment are in agreement with the Swedish government’s guidelines.
Other senior executivesSalaries and other remunerationFor other members of the Executive Group Management, a total of 10 indi-viduals (11), the sum of salaries and other remuneration for 2018, including the value of company cars and other benefits, was SEK 70,617 thousand. For other persons defined as senior executives by Vattenfall, who are not members of the Executive Group Management – a total of 2 individuals (2) – the sum of salaries and other remuneration for 2018, including the value of company cars and other benefits, was SEK 7,843 thousand.
Retirement benefitsKerstin Ahlfont, Gunnar Groebler, Anne Gynnerstedt, Tuomo Hatakka, Andreas Regnell, Torbjörn Wahlborg, Björn Linde, Annika Viklund, Karin Lepasoon, Anna Borg and Niek den Hollander all have defined contribu-tion pension solutions. Martijn Hagens has a pension solution under col-lective agreements in the Netherlands. All pensions for these executives are in compliance with the Swedish government’s guidelines.
Terms of notice on the part of the companyAccording to the government’s guidelines, the notice period for a senior executive in the event the company serves notice shall not exceed six months. In addition, severance pay equivalent to a maximum of 12 months’ salary1 is payable thereafter. In the event the individual in question accepts new employment or receives income from other business activities, the severance pay shall be reduced by an amount corresponding to the new income or benefit received during the time in question. The severance pay is paid out monthly. All senior executives have severance terms that are in compliance with the government’s guidelines.1 Based on new guidelines from the government. Contracts entered into before the Annual General Meeting
27 April 2017 have severance pay corresponding to a maximum of 18 months.
Incentive programmesThe members of the Executive Group Management and other senior executives do not receive any variable salary component.
Payment from variable remuneration programmesVattenfall offers short-term variable performance-based remuneration programmes to certain categories of employees in order to attract, retain and motivate.
Amounts in SEK thousandsPayment
2018Payment
2017
Type of programme:
Profit-sharing 217,754 187,404
Short-term incentive programmes 294,599 219,837
Long-term incentive programmes 26,376 24,038
132 Notes to the Consolidated accounts VATTENFALL ANNUAL AND SUSTAINABILITY REPORT 2018

Parent Company Vattenfall AB
Condensed review of 2018A condensed income statement and balance sheet for the Parent Company are presented below.• Net sales amounted to SEK 42,450 million (31,271).• Profit before appropriations and income taxes was SEK 1,400 mil-
lion (6,397).• Earnings were negatively affected by higher futures prices for the
un realized derivatives compared with the same period a year ago. Higher electricity generation and higher spot prices have had a positive effect on earnings. The result from participations in subsidiaries was SEK 3,389 million (4,855), of which SEK 2,904 million pertains to a dividend from N.V. Nuon Energi. The remaining amount consists of divi-dends, impairment losses and the result from liquidations. The change in other financial expenses is mainly attributable to currency effects.
• Changed tax rules in Sweden, have required a remeasurement of Vattenfall AB’s deferred tax assets, with an earnings effect of SEK –80 million.
• The balance sheet total was SEK 278,819 million (255,092).• Investments during the period amounted to SEK 1,318 million (5,204),
of which SEK 4,000 million of the amount for 2017 pertains to a share-holder contribution to Vattenfall Vindkraft AB.
• Cash and cash equivalents, and Short-term investments amounted to SEK 39,798 million (23,621). The increase pertains mainly to dividends, the repayment of loans from subsidiaries and changes in the company’s debt portfolio.
• Dividend paid to the owner of SEK 2,000 million (0).
Parent Company income statement
Amounts in SEK million, 1 January–31 December Note 2018 20171
Net sales 5, 6 42,450 31,271
Cost of purchases 6 –34,751 –20,370
Other external expenses –3,745 –3,246
Personnel expenses –2,053 –1,933
Other operating incomes and expenses, net 71 564
Operating profit before depreciation, amortisation and impairment losses (EBITDA) 13, 14 1,972 6,286
Depreciation, amortisation and impairments 7 –501 –496
Operating profit (EBIT) 1,471 5,790
Result from participations in subsidiaries 8 3,389 4,855
Other financial income 9 1,403 1,445
Other financial expenses 10 –4,863 –5,693
Profit before appropriations and income taxes 1,400 6,397
Appropriations 11 919 1,037
Profit before income taxes 2,319 7,434
Income taxes 12 135 –607
Profit for the year 2,454 6,8271 Certain amounts for 2017 have been recalculated compared with previously published information in
Vattenfall’s 2017 Annual and Sustainability Report as a result of new accounting rules (IFRS 9 and 15) that took effect in 2018. See Note 3 to the Parent Company accounts, Accounting policies.
Parent Company statement of comprehensive income
Amounts in SEK million, 1 January–31 December 2018 20171
Profit for the year 2,454 6,827
Total other comprehensive income — —
Total comprehensive income for the year 2,454 6,8271 The amount has been recalculated compared with previously published information in Vattenfall’s 2017
Annual and Sustainability Report as a result of new accounting rules (IFRS 9 and 15) that took effect in 2018. See Note 3 to the Parent Company accounts, Accounting policies.
VATTENFALL ANNUAL AND SUSTAINABILITY REPORT 2018 133Parent Company accounts
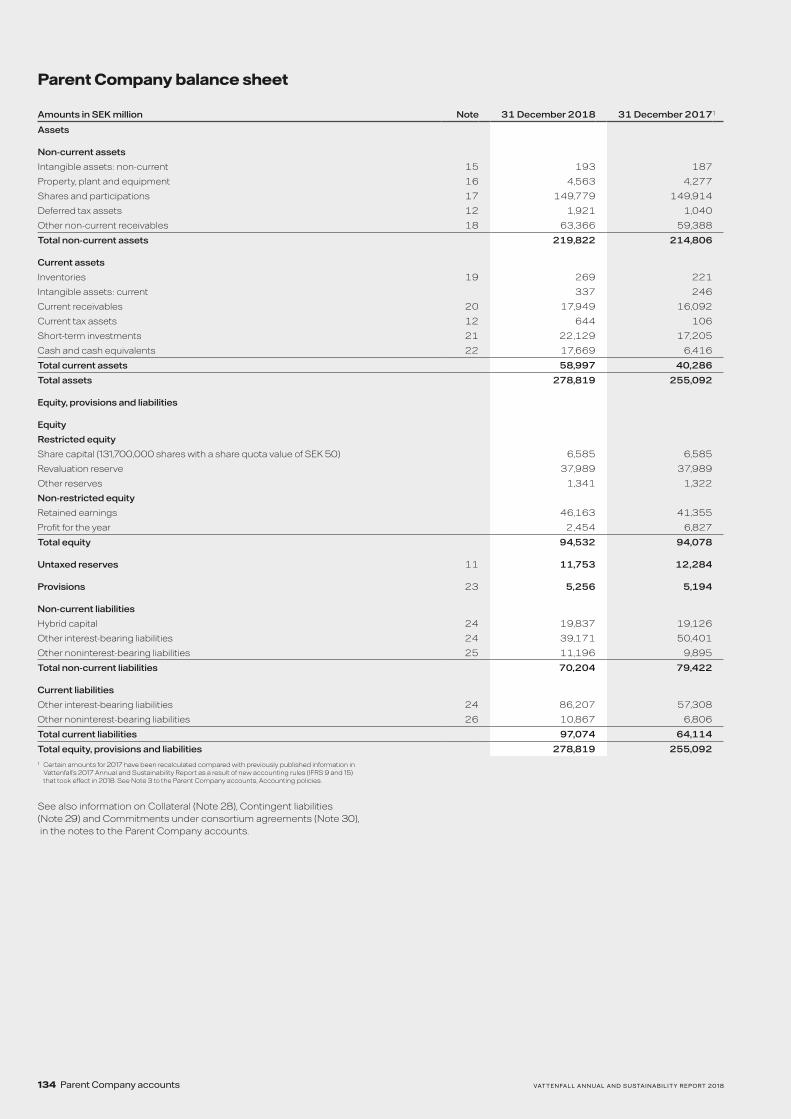
Parent Company balance sheet
Amounts in SEK million Note 31 December 2018 31 December 20171
Assets
Non-current assets
Intangible assets: non-current 15 193 187
Property, plant and equipment 16 4,563 4,277
Shares and participations 17 149,779 149,914
Deferred tax assets 12 1,921 1,040
Other non-current receivables 18 63,366 59,388
Total non-current assets 219,822 214,806
Current assets
Inventories 19 269 221
Intangible assets: current 337 246
Current receivables 20 17,949 16,092
Current tax assets 12 644 106
Short-term investments 21 22,129 17,205
Cash and cash equivalents 22 17,669 6,416
Total current assets 58,997 40,286
Total assets 278,819 255,092
Equity, provisions and liabilities
Equity
Restricted equity
Share capital (131,700,000 shares with a share quota value of SEK 50) 6,585 6,585
Revaluation reserve 37,989 37,989
Other reserves 1,341 1,322
Non-restricted equity
Retained earnings 46,163 41,355
Profit for the year 2,454 6,827
Total equity 94,532 94,078
Untaxed reserves 11 11,753 12,284
Provisions 23 5,256 5,194
Non-current liabilities
Hybrid capital 24 19,837 19,126
Other interest-bearing liabilities 24 39,171 50,401
Other noninterest-bearing liabilities 25 11,196 9,895
Total non-current liabilities 70,204 79,422
Current liabilities
Other interest-bearing liabilities 24 86,207 57,308
Other noninterest-bearing liabilities 26 10,867 6,806
Total current liabilities 97,074 64,114
Total equity, provisions and liabilities 278,819 255,0921 Certain amounts for 2017 have been recalculated compared with previously published information in
Vattenfall’s 2017 Annual and Sustainability Report as a result of new accounting rules (IFRS 9 and 15) that took effect in 2018. See Note 3 to the Parent Company accounts, Accounting policies.
See also information on Collateral (Note 28), Contingent liabilities (Note 29) and Commitments under consortium agreements (Note 30), in the notes to the Parent Company accounts.
134 Parent Company accounts VATTENFALL ANNUAL AND SUSTAINABILITY REPORT 2018

Parent Company cash flow statement
Amounts in SEK million, 1 January–31 December Note 2018 20171
Operating activities
Operating profit before depreciation, amortisation and impairment losses 1,972 6,286
Tax paid –1,284 –1,308
Interest received 1,452 1,513
Interest paid –3,110 –4,946
Other, incl. non-cash items 34 6,101 412
Funds from operations (FFO) 5,131 1,957
Changes in inventories –48 34
Changes in operating receivables –6,416 2,259
Changes in operating liabilities 2,696 –1,366
Cash flow from changes in operating assets and operating liabilities –3,768 927
Cash flow from operating activities 1,363 2,884
Investing activities
Investments in subsidiaries –364 –4,289
Investments in associated companies and other shares and participations –147 –66
Other investments in non-current assets –807 –849
Total investments –1,318 –5,204
Divestments 383 358
Cash flow from investing activities –935 –4,846
Cash flow before financing activities 428 –1,962
Financing activities
Changes in short-term investments –4,924 1,552
Loans raised 26,933 12,923
Amortisation of other debts –14,118 –31,262
Dividend paid to owner –2,000 —
Effect of early termination of swaps related to financing activities –122 105
Amortisation received from subsidiaries — 5,982
Dividend received from subsidiaries 3,670 230
Group contributions received/paid 1,386 1,894
Cash flow from financing activities 10,825 –8,576
Cash flow for the year 11,253 –10,538
Cash and cash equivalents
Cash and cash equivalents at start of year 6,416 16,954
Cash flow for the year 11,253 –10,538
Cash and cash equivalents at end of year 17,669 6,4161 Certain amounts for 2017 have been recalculated compared with previously published information in
Vattenfall’s 2017 Annual and Sustainability Report as a result of new accounting rules (IFRS 9 and 15) that took effect in 2018. See Note 3 to the Parent Company accounts, Accounting policies.
Parent Company statement of changes in equity
Amount in SEK millionShare
capitalRevaluation
reserveOther
reserves1Non-restricted
equity Total
Balance brought forward 2017 6,585 37,9892 1,316 43,619 89,509
Transitional effect of adoption of new accounting rules (IFRS9, 15) — — — –2,258 –2,258
Fund for development costs — — 63 –63 —
Profit for the year — — — 6,827 6,827
Balance carried forward 2017 6,585 37,989 1,322 48,182 94,078
Dividend paid to owners — — — –2,000 –2,000
Fund for development costs — — 183 –183 —
Profit for the year — — — 2,454 2,454
Balance carried forward 2018 6,585 37,989 1,340 48,618 94,5321 Other reserves consist of Statutory reserve SEK 1,286 million (1,286) and Fund for development costs
SEK 54 million (36).2 Pertains to the revaluation of shares in Vattenfall Eldistribution AB. This revaluation is a non-taxable item,
and the book value before the revaluation was SEK 11 million.3 Pertains to the year’s capitalised costs less depreciation according to plan for own development work
that have been reserved in the Fund for development costs. The capitalised costs are considered to be tax-deductible once the assets they pertain to become operational and depreciation according to plan is made.
As of 31 December 2018 the registered share capital comprised 131,700,000 shares with a share quota value of SEK 50.
VATTENFALL ANNUAL AND SUSTAINABILITY REPORT 2018 135Parent Company accounts

Notes to the Parent Company accounts
Amounts in SEK million unless indicated otherwise
Note 1 Company information 137
Note 2 Proposed distribution of profits 137
Note 3 Accounting policies 137
Note 4 Exchange rates 137
Note 5 Net sales 138
Note 6 Intra Group transactions 138
Note 7 Impairment losses 138
Note 8 Result from participations in subsidiaries 138
Note 9 Other financial income 138
Note 10 Other financial expenses 138
Note 11 Appropriations and untaxed reserves 138
Note 12 Income taxes 139
Note 13 Leasing 139
Note 14 Auditors’ fees 139
Note 15 Intangible assets: non-current 140
Note 16 Property, plant and equipment 141
Note 17 Shares and participations 142
Note 18 Other non-current receivables 142
Note 19 Inventories 142
Note 20 Current receivables 143
Note 21 Short-term investments 143
Note 22 Cash and cash equivalents 143
Note 23 Provisions 143
Note 24 Other interest-bearing liabilities 144
Note 25 Other noninterest-bearing liabilities (non-current) 144
Note 26 Other noninterest-bearing liabilities (current) 144
Note 27 Financial instruments: Carrying amount and fair value 145
Note 28 Collateral 145
Note 29 Contingent liabilities 145
Note 30 Commitments under consortium agreements 146
Note 31 Average number of employees and personnel costs 146
Note 32 Gender distribution among senior executives 147
Note 33 Related party disclosures 147
Note 34 Specification of the cash flow statement 147
Note 35 Events after the balance sheet date 147
136 Notes to the Parent Company accounts VATTENFALL ANNUAL AND SUSTAINABILITY REPORT 2018

Note 1 Company information
Vattenfall AB’s 2018 Annual Report was approved in accordance with a decision by the Board of Directors on 19 March 2019. Vattenfall AB (publ) with corporate identity number 556036-2138, which is the Parent Company of the Vattenfall Group, is a limited liability company with its registered office in Solna, Sweden and with the address SE-169 92 Stock-holm, Sweden. The balance sheet and income statement of the Parent Company included in Vattenfall’s Annual and Sustainability Report will be submitted at the Annual General Meeting (AGM) on 11 April 2019.
Note 2 Proposed distribution of profits
The Annual General Meeting as at its disposal retained profits including the result for the year, totalling SEK 48,617,698,593. In accordance with the dividend policy adopted by the Annual General Meeting of Vatten-fall AB, the Board of Directors and President propose, in view of the result for the year, that the profits to be distributed as follows:
To be distributed to the shareholder 2,000,000,000
To be carried forward 46,617,698,593
Total 48,617,698,593
Note 3 Accounting policies
GeneralThe Parent Company’s accounts are prepared in accordance with the Swedish Annual Accounts Act and recommendation RFR 2 – “Accounting for Legal Entities”, issued by the Swedish Financial Reporting Board (RFR). RFR 2 entails that the Parent Company should apply all standards and interpretations issued by IASB and IFRIC as endorsed by the European Commission for application within the EU. This should be done as far as possible within the framework of the Swedish Annual Accounts Act by taking into consideration the relationship between accounting and taxation.
The applied accounting policies are outlined in applicable parts of Note 3 to the consolidated accounts, Accounting policies, or in the respective notes for the Group, with the following addition for the Parent Company.
Important changes in the financial statements compared with the preceding yearAs described in Note 3 to the consolidated accounts, new accounting standards apply as from 2018: IFRS 9 – “Financial Instruments” and IFRS 15 – “Revenue from Contracts with Customers”. With respect to IFRS 9 the Parent Company has stopped applying the exception provided in RFR 2 and has switched over to reporting in accordance with IFRS 9. IFRS 15 applies without the exception provided in RFR 2, entailing that the Group’s changes also have an effect on the Parent Company. The areas that remain and that are affected in the Parent Company are BA Customers & Solutions and BA Heat. The changes in IFRS 9 and 15 entail that the Parent Company’s financial statements for the comparison year 2017 have been recalculated. The combined effect on the balance sheet total is an increase by SEK 12.3 billion (of which IFRS 9 SEK 12.2 billion) as per 1 January 2017 and an increase by SEK 9.4 billion (of which IFRS 9 SEK 9.3 billion) as per 31 December 2017. The effect on profit for the year for 2017 is a decrease by SEK 0.1 million (of which IFRS 9 SEK 0.1 million).
Presentation of Parent Company’s income statement See Note 2 to the consolidated accounts, Important changes in the financial statements compared with the preceding year.
Depreciation and amortisationAs in the consolidated accounts, depreciation and amortisation are based on cost and are applied on a straight-line basis over the estimated useful life of the asset in question. In addition, certain accelerated depre-ciation/amortisation (the difference between depreciation/amortisation according to plan and depreciation/amortisation for tax purposes) in the Parent Company is reported under Appropriations and Untaxed reserves, respectively.
Financial instrumentsThe Parent Company reports financial instruments in accordance with IFRS 9 – “Financial Instruments”. The principles for classification and measurement of financial instruments, impairment of financial assets, and hedge accounting are described in Note 36 to the consolidated accounts – Financial instruments by category, offsetting of financial assets and liabilities, and financial instruments’ effects on income.
The Parent Company effectively hedges net investments in foreign ope-rations via currency forward contracts and loans in foreign currency. Effects of changes in exchange rates are therefore not recognised for loans raised for the financing of foreign subsidiaries, associated companies and joint arrangements. Nonmonetary assets acquired in a foreign currency are recognised at the exchange rate at the time of the acquisition.
Foreign currencyAssets and liabilities in foreign currencies that not applies hedge accoun-ting for are recognised at the exchange rates of the balance sheet date.
Capitalised costs for own development workFor costs for own development work that are capitalised, a corresponding amount is transferred from unrestricted equity to the fund for develop-ment costs.
Income taxesTax legislation in Sweden allows companies to defer tax payments by making provisions to untaxed reserves. In the Parent Company, untaxed reserves are reported as a separate item on the balance sheet that inclu-des deferred tax. In the Parent Company’s income statement, provisions to untaxed reserves and dissolution of untaxed reserves are reported under the heading Appropriations.
Important estimations and assessments in the preparation of the financial statementsPreparation of the financial statements requires the company’s execu-tive management and Board of Directors to make estimations and assessments as well as to make assumptions that affect application of the accounting policies and the reported amounts of assets, liabilities, income and expenses. These estimations and assessments are based on historic experience and other factors that seem reasonable under current conditions. The results of these estimations and assessments are then used to establish the reported values of assets and liabilities that are not otherwise clearly documented from other sources. The final outcome may deviate from the results of these estimations and assessments. The estimations and assessments are revised on a regular basis. The effects of changes in estimations are reported in the period in which the changes were made if the changes affected this period only or in the period the changes were made and future periods if the changes affect both the current period and future periods. Important estimations and assessments are described further in Note 17 to the Parent Company, Shares and participations.
Significant accounting policies applicable as from 1 January 2019As from 2019, no changed accounting standards and interpretations are considered to have any material effect on the Parent Company’s financial statements. The Parent Company will report leasing in accordance with the exception rule for IFRS 16 provided in RFR 2, which entails no change compared with the current year.
Note 4 Exchange rates
See Note 5 to the consolidated accounts, Exchange rates.
VATTENFALL ANNUAL AND SUSTAINABILITY REPORT 2018 137Notes to the Parent Company accounts

Note 5 Net sales
Net sales per geographical area 2018 20171
Nordic 33,162 27,378
Germany 9,116 3,488
Netherlands 402 352
Other countries –230 53
Total 42,450 31,271
Net sales for products and services 2018 2017
Sales of electricity 36,459 26,205
Sale of heat and steam 1,947 1,909
Service and consulting 1,922 1,744
Total Revenues from contracts with customers 40,328 29,858
Other Revenues 2,122 1,413
Total 42,450 31,271
Contract balances 2018 2017
Contract assets 2 11
– of which, released as cost from opening balance during the year — —
Contract liabilities 213 218
– of which, released as revenue from opening balance during the year –12 —1 The amount has been recalculated compared with previously published information in Vattenfall’s 2017
Annual and Sustainability Report as a result of new accounting rules (IFRS 9 and 15) that took effect in 2018. See Note 3 to the Parent Company accounts, Accounting policies.
Note 6 Intra Group transactions
Of the Parent Company’s total income from sales and total purchase costs, transactions with subsidiaries account for 29% (21%) of sales and 64% (40%) of purchase costs.
Note 7 Impairment losses
No impairment was recognised of intangible non-current assets or of property, plant and equipment 2018 or 2017 financial years.
Note 8 Result from participations in subsidiaries
2018 2017
Dividends 3,670 230
Impairment losses1 –482 —
Capital gains/losses on divestments 201 132
Reversed debt to subsidiaries — 4,493
Total 3,389 4,8551 The impairment losses pertain to dividend received from Vattenfall A/S..
Note 9 Other financial income
2018 2017
Interest income from subsidiaries 1,341 1,306
Other interest income 62 139
Total 1,403 1,445
Note 10 Other financial expenses
2018 20171
Interest expenses to subsidiaries 39 32
Other interest expenses 3,222 5,171
Foreign exchange gains and losses, net 1,602 490
Total 4,863 5,6931 The amount has been recalculated compared with previously published information in Vattenfall’s 2017
Annual and Sustainability Report as a result of new accounting rules (IFRS 9 and 15) that took effect in 2018. See Note 3 to the Parent Company accounts, Accounting policies.
Note 11 Appropriations and untaxed reserves
Appropriations2018 2017
Group contributions paid –2,625 –2,774
Group contributions received 3,013 2,800
Provision/Dissolution of untaxed reserves, net 531 1,011
Total 919 1,037
Untaxed reservesBalance brought forward
Provision (+)/ dissolution (–)
Balance carried
forward
Accelerated depreciation 2,272 –287 1,985
Tax allocation reserves for 2012–2018 tax years 10,012 –244 9,768
Total 12,284 –531 11,753
138 Notes to the Parent Company accounts VATTENFALL ANNUAL AND SUSTAINABILITY REPORT 2018
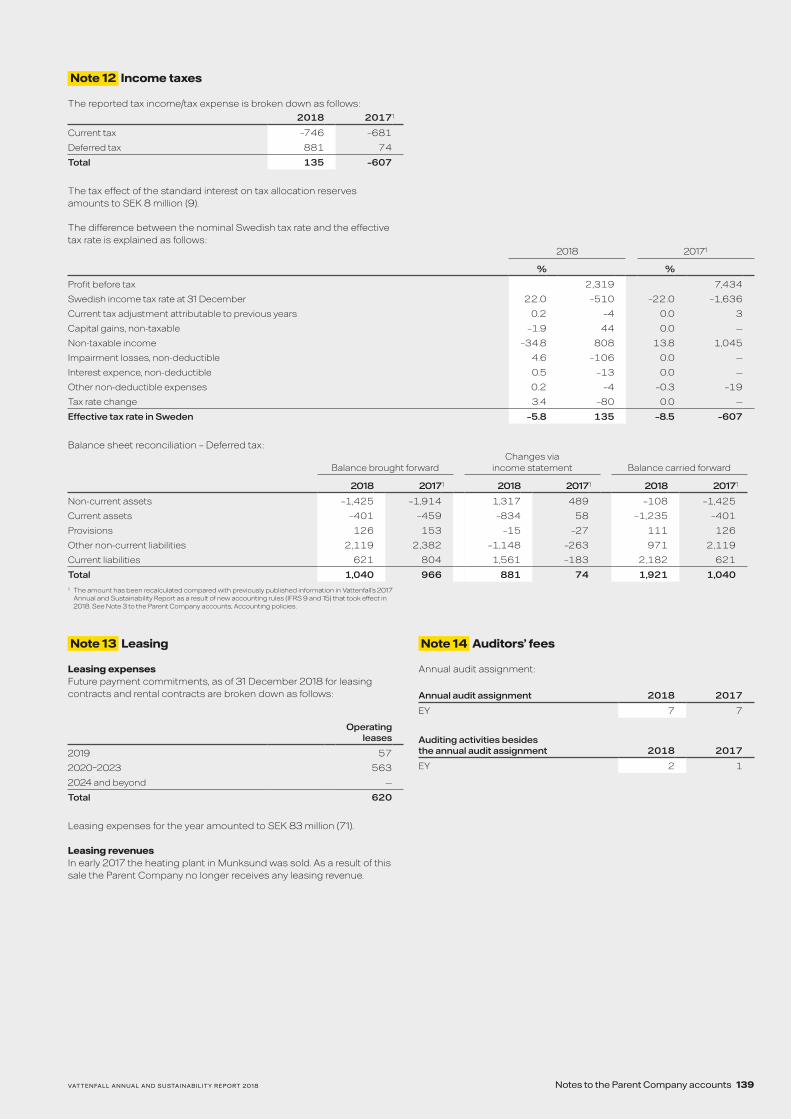
Note 12 Income taxes
The reported tax income/tax expense is broken down as follows:2018 20171
Current tax –746 –681
Deferred tax 881 74
Total 135 –607
The tax effect of the standard interest on tax allocation reserves amounts to SEK 8 million (9).
The difference between the nominal Swedish tax rate and the effective tax rate is explained as follows:
2018 20171
% %
Profit before tax 2,319 7,434
Swedish income tax rate at 31 December 22.0 –510 –22.0 –1,636
Current tax adjustment attributable to previous years 0.2 –4 0.0 3
Capital gains, non-taxable –1.9 44 0.0 —
Non-taxable income –34.8 808 13.8 1,045
Impairment losses, non-deductible 4.6 –106 0.0 —
Interest expence, non-deductible 0.5 –13 0.0 —
Other non-deductible expenses 0.2 –4 –0.3 –19
Tax rate change 3.4 –80 0.0 —
Effective tax rate in Sweden –5.8 135 –8.5 –607
Balance sheet reconciliation – Deferred tax:
Balance brought forwardChanges via
income statement Balance carried forward
2018 20171 2018 20171 2018 20171
Non-current assets –1,425 –1,914 1,317 489 –108 –1,425
Current assets –401 –459 –834 58 –1,235 –401
Provisions 126 153 –15 –27 111 126
Other non-current liabilities 2,119 2,382 –1,148 –263 971 2,119
Current liabilities 621 804 1,561 –183 2,182 621
Total 1,040 966 881 74 1,921 1,0401 The amount has been recalculated compared with previously published information in Vattenfall’s 2017
Annual and Sustainability Report as a result of new accounting rules (IFRS 9 and 15) that took effect in 2018. See Note 3 to the Parent Company accounts, Accounting policies.
Note 13 Leasing
Leasing expensesFuture payment commitments, as of 31 December 2018 for leasing contracts and rental contracts are broken down as follows:
Operating leases
2019 57
2020–2023 563
2024 and beyond —
Total 620
Leasing expenses for the year amounted to SEK 83 million (71).
Leasing revenuesIn early 2017 the heating plant in Munksund was sold. As a result of this sale the Parent Company no longer receives any leasing revenue.
Note 14 Auditors’ fees
Annual audit assignment:
Annual audit assignment 2018 2017
EY 7 7
Auditing activities besides the annual audit assignment 2018 2017
EY 2 1
VATTENFALL ANNUAL AND SUSTAINABILITY REPORT 2018 139Notes to the Parent Company accounts

Note 15 Intangible assets: non-current2018
Capitalised development
costs
Concessions and similar
rights and cost to obtain a contract
Renting and similar rights Total
Cost
Cost brought forward 356 936 — 1,292
Investments 22 63 — 85
Divestments/disposals — –13 — –13
Accumulated cost carried forward 378 986 — 1,364
Amortisation according to plan
Amortisation brought forward –193 –796 — –989
Amortisation for the year –4 –75 — –79
Divestments/disposals — 13 — 13
Accumulated amortisation according to plan carried forward –197 –858 — –1,055
Impairment losses
Impairment losses brought forward –116 — — –116
Accumulated impairment losses carried forward –116 — — –116
Residual value according to plan carried forward 65 128 — 193
20171
Capitalised development
costs
Concessions and similar
rights and cost to obtain a contract
Renting and similar rights Total
Cost
Cost brought forward 342 851 68 1,261
Investments 8 90 — 98
Transfer from construction in progress 5 — — 5
Divestments/disposals — –4 –68 –72
Reclassifications 1 –1 — —
Accumulated cost carried forward 356 936 — 1,292
Amortisation according to plan
Amortisation brought forward –189 –712 — –901
Amortisation for the year –4 –86 — –90
Divestments/disposals — 2 — 2
Accumulated amortisation according to plan carried forward –193 –796 — –989
Impairment losses
Impairment losses brought forward –116 — –68 –184
Divestments/disposals — — 68 68
Accumulated impairment losses carried forward –116 — — –116
Residual value according to plan carried forward 47 140 — 1871 The amount has been recalculated compared with previously published information in Vattenfall’s 2017
Annual and Sustainability Report as a result of new accounting rules (IFRS 9 and 15) that took effect in 2018. See Note 3 to the Parent Company accounts, Accounting policies.
At 31 December 2018 there were no contractual commitments for the acquisition of intangible non-current assets.
140 Notes to the Parent Company accounts VATTENFALL ANNUAL AND SUSTAINABILITY REPORT 2018
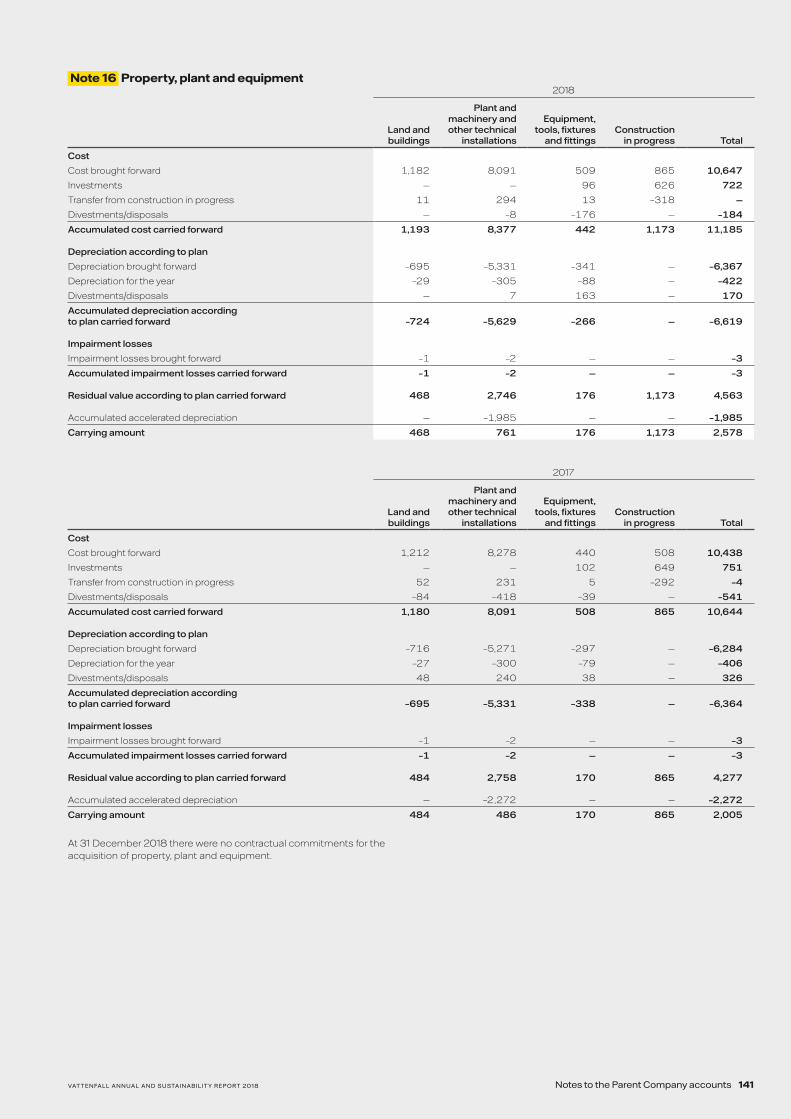
Note 16 Property, plant and equipment2018
Land and buildings
Plant and machinery and other technical
installations
Equipment, tools, fixtures
and fittingsConstruction
in progress Total
Cost
Cost brought forward 1,182 8,091 509 865 10,647
Investments — — 96 626 722
Transfer from construction in progress 11 294 13 –318 —
Divestments/disposals — –8 –176 — –184
Accumulated cost carried forward 1,193 8,377 442 1,173 11,185
Depreciation according to plan
Depreciation brought forward –695 –5,331 –341 — –6,367
Depreciation for the year –29 –305 –88 — –422
Divestments/disposals — 7 163 — 170
Accumulated depreciation according to plan carried forward –724 –5,629 –266 — –6,619
Impairment losses
Impairment losses brought forward –1 –2 — — –3
Accumulated impairment losses carried forward –1 –2 — — –3
Residual value according to plan carried forward 468 2,746 176 1,173 4,563
Accumulated accelerated depreciation — –1,985 — — –1,985
Carrying amount 468 761 176 1,173 2,578
2017
Land and buildings
Plant and machinery and other technical
installations
Equipment, tools, fixtures
and fittingsConstruction
in progress Total
Cost
Cost brought forward 1,212 8,278 440 508 10,438
Investments — — 102 649 751
Transfer from construction in progress 52 231 5 –292 –4
Divestments/disposals –84 –418 –39 — –541
Accumulated cost carried forward 1,180 8,091 508 865 10,644
Depreciation according to plan
Depreciation brought forward –716 –5,271 –297 — –6,284
Depreciation for the year –27 –300 –79 — –406
Divestments/disposals 48 240 38 — 326
Accumulated depreciation according to plan carried forward –695 –5,331 –338 — –6,364
Impairment losses
Impairment losses brought forward –1 –2 — — –3
Accumulated impairment losses carried forward –1 –2 — — –3
Residual value according to plan carried forward 484 2,758 170 865 4,277
Accumulated accelerated depreciation — –2,272 — — –2,272
Carrying amount 484 486 170 865 2,005
At 31 December 2018 there were no contractual commitments for the acquisition of property, plant and equipment.
VATTENFALL ANNUAL AND SUSTAINABILITY REPORT 2018 141Notes to the Parent Company accounts

Note 17 Shares and participations
Important estimations and assessmentsParticipations in subsidiaries are tested for impairment in accordance with the accounting policies described in Note 9 to the consolidated accounts, Impairment losses and reversed impairment losses. The recoverable amount for cash-generating units is determined by calcula-ting the value in use or fair value less costs to sell. For these calculations, certain estimations must be made regarding future cash flows along with other adequate assumptions regarding the required rate of return, for example.
Financial information
2018 2017
Participations in subsidiaries
Participations in associated
companies
Other shares and
participations TotalParticipations in subsidiaries
Participations in associated
companies
Other shares and
participations Total
Balance brought forward 149,850 56 8 149,914 145,571 13 2 145,586
Investments 24 11 — 35 1 41 6 48
Shareholder contributions 340 29 102 471 4,000 19 — 4,019
New share issue — 5 — 5 288 — — 288
Divestments — — — — –10 — — –10
Profit participations in associated companies — 3 — 3 — –17 — –17
Liquidation –167 — — –167 — — — —
Impairment losses –482 — — –482 — — — —
Balance carried forward 149,565 104 110 149,779 149,850 56 8 149,914
For a breakdown of the Parent Company’s shares and participations in subsidiaries, associated companies and other shares and participations, see Notes 18–19 to the consolidated accounts.
Note 18 Other non-current receivables
2018 20171
Receivables from
subsidiaries
Receivables from
associated companies
Derivative assets
Other receivables Total
Receivables from
subsidiaries
Receivables from
associated companies
Derivative assets
Other receivables Total
Balance brought forward 52,180 5 6,473 730 59,388 58,162 — 8,708 736 67,606
New receivables 5,126 24 — 11 5,161 — 5 — 9 14
Payments received — — — — — –5,982 — — — –5,982
Derivative changes — — –1,1492 — –1,149 — — –2,2352 — –2,235
Other changes 3 — — –37 –34 — — — –15 –15
Balance carried forward 57,309 29 5,324 704 63,366 52,180 5 6,473 730 59,3881 The amount has been recalculated compared with previously published information in Vattenfall’s 2017
Annual and Sustainability Report as a result of new accounting rules (IFRS 9 and 15) that took effect in 2018. See Note 3 to the Parent Company accounts, Accounting policies.
2 Net change and measurement at fair value.
Note 19 Inventories
Accounting policiesThe cost of inventories is calculated, depending on the type of inventory, either through application of the first-in, first-out (FIFO) method or through the application of a method based on average prices. Both methods include costs that arose on acquisition of the inventory assets.
Financial informationInventories consist mainly of biofuels and fossil fuels for heat production.
142 Notes to the Parent Company accounts VATTENFALL ANNUAL AND SUSTAINABILITY REPORT 2018
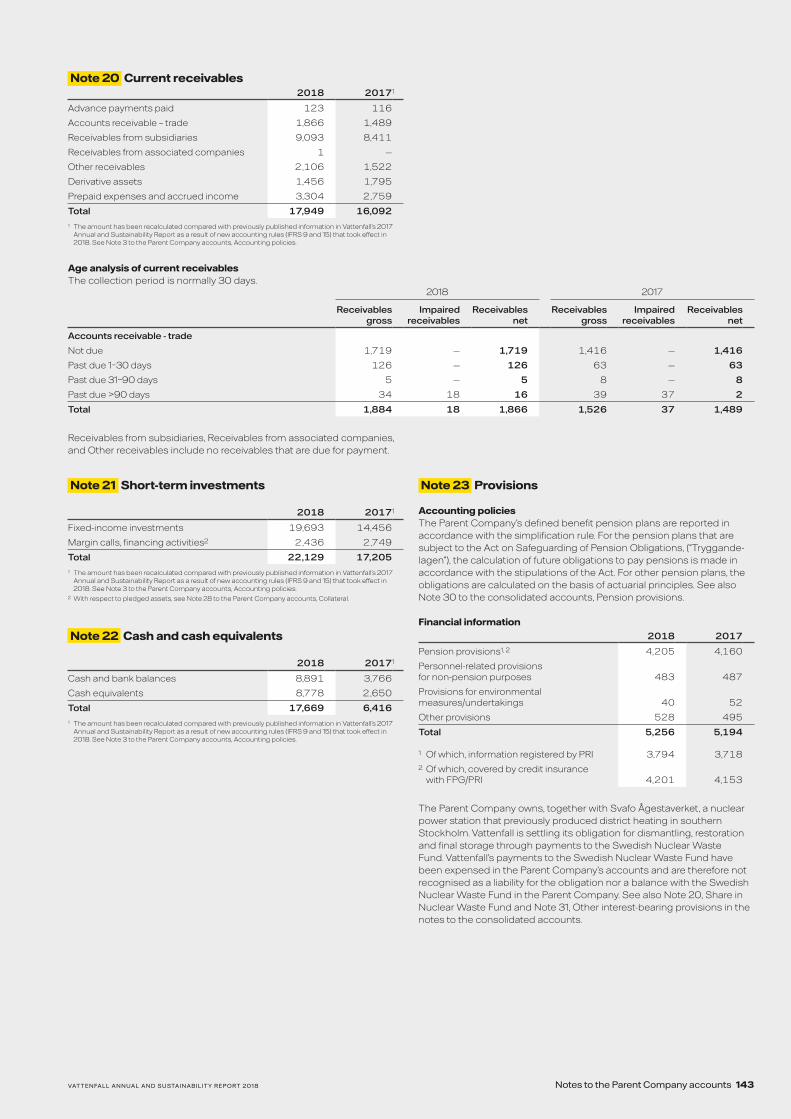
Note 20 Current receivables2018 20171
Advance payments paid 123 116
Accounts receivable – trade 1,866 1,489
Receivables from subsidiaries 9,093 8,411
Receivables from associated companies 1 —
Other receivables 2,106 1,522
Derivative assets 1,456 1,795
Prepaid expenses and accrued income 3,304 2,759
Total 17,949 16,0921 The amount has been recalculated compared with previously published information in Vattenfall’s 2017
Annual and Sustainability Report as a result of new accounting rules (IFRS 9 and 15) that took effect in 2018. See Note 3 to the Parent Company accounts, Accounting policies.
Age analysis of current receivablesThe collection period is normally 30 days.
2018 2017
Receivables gross
Impaired receivables
Receivables net
Receivables gross
Impaired receivables
Receivables net
Accounts receivable - trade
Not due 1,719 — 1,719 1,416 — 1,416
Past due 1–30 days 126 — 126 63 — 63
Past due 31–90 days 5 — 5 8 — 8
Past due >90 days 34 18 16 39 37 2
Total 1,884 18 1,866 1,526 37 1,489
Receivables from subsidiaries, Receivables from associated companies, and Other receivables include no receivables that are due for payment.
Note 21 Short-term investments
2018 20171
Fixed-income investments 19,693 14,456
Margin calls, financing activities2 2,436 2,749
Total 22,129 17,2051 The amount has been recalculated compared with previously published information in Vattenfall’s 2017
Annual and Sustainability Report as a result of new accounting rules (IFRS 9 and 15) that took effect in 2018. See Note 3 to the Parent Company accounts, Accounting policies.
2 With respect to pledged assets, see Note 28 to the Parent Company accounts, Collateral.
Note 22 Cash and cash equivalents
2018 20171
Cash and bank balances 8,891 3,766
Cash equivalents 8,778 2,650
Total 17,669 6,4161 The amount has been recalculated compared with previously published information in Vattenfall’s 2017
Annual and Sustainability Report as a result of new accounting rules (IFRS 9 and 15) that took effect in 2018. See Note 3 to the Parent Company accounts, Accounting policies.
Note 23 Provisions
Accounting policiesThe Parent Company’s defined benefit pension plans are reported in accordance with the simplification rule. For the pension plans that are subject to the Act on Safeguarding of Pension Obligations, (“Tryggande-lagen”), the calculation of future obligations to pay pensions is made in accordance with the stipulations of the Act. For other pension plans, the obligations are calculated on the basis of actuarial principles. See also Note 30 to the consolidated accounts, Pension provisions.
Financial information2018 2017
Pension provisions1, 2 4,205 4,160
Personnel-related provisions for non-pension purposes 483 487
Provisions for environmental measures/undertakings 40 52
Other provisions 528 495
Total 5,256 5,194
1 Of which, information registered by PRI 3,794 3,7182 Of which, covered by credit insurance
with FPG/PRI 4,201 4,153
The Parent Company owns, together with Svafo Ågestaverket, a nuclear power station that previously produced district heating in southern Stockholm. Vattenfall is settling its obligation for dismantling, restoration and final storage through payments to the Swedish Nuclear Waste Fund. Vattenfall’s payments to the Swedish Nuclear Waste Fund have been expensed in the Parent Company’s accounts and are therefore not recognised as a liability for the obligation nor a balance with the Swedish Nuclear Waste Fund in the Parent Company. See also Note 20, Share in Nuclear Waste Fund and Note 31, Other interest-bearing provisions in the notes to the consolidated accounts.
VATTENFALL ANNUAL AND SUSTAINABILITY REPORT 2018 143Notes to the Parent Company accounts

Note 24 Other interest-bearing liabilities
Non-current portion maturity 1–5 years
Non-current portion maturity >5 years
Total non-current portion Current portion Total
2018 20171 2018 20171 2018 20171 2018 20171 2018 20171
Bond issues 12,902 22,161 17,165 17,705 30,067 39,866 13,088 5,494 43,155 45,360
Commercial paper — — — — — — 7,408 4,192 7,408 4,192
Liabilities to credit institutions 1,401 2,256 — — 1,401 2,256 795 149 2,196 2,405
Liabilities to subsidiaries 576 596 — — 576 596 54,771 40,905 55,347 41,501
Derivative debts 5,207 4,220 1,920 3,463 7,127 7,683 6,550 2,954 13,677 10,637
Other liabilities (margin calls within financing activities)2 — — — — — — 3,595 3,614 3,595 3,614
Total interest-bearing liabilities excluding Hybrid capital 20,086 29,233 19,085 21,168 39,171 50,401 86,207 57,308 125,378 107,709
Hybrid capital3 9,582 6,000 10,255 13,126 19,837 19,126 — — 19,837 19,126
Total 29,668 35,233 29,340 34,294 59,008 69,527 86,207 57,308 145,215 126,8351 The amount has been recalculated compared with previously published information in Vattenfall’s 2017
Annual and Sustainability Report as a result of new accounting rules (IFRS 9 and 15) that took effect in 2018See Note 3 to the Parent Company accounts, Accounting policies.
2 With respect to pledged assets, see Note 28 to the Parent Company accounts, Collateral.3 See Note 29 to the consolidated accounts, Interest-bearing liabilities and related financial derivatives.
Note 25 Other noninterest-bearing liabilities (non-current)
2018 20171
Liabilities to subsidiaries 10,921 9,643
Contract debts 212 206
Other liabilities 63 46
Total 11,196 9,8951 The amount has been recalculated compared with previously published information in Vattenfall’s 2017
Annual and Sustainability Report as a result of new accounting rules (IFRS 9 and 15) that took effect in 2018. See Note 3 to the Parent Company accounts, Accounting policies.
Liabilities to subsidiaries refer mainly to liabilities pertaining to Group contributions and to a non-current liability to Forsmarks Kraftgrupp AB for power charges. For this latter debt, in accordance with an agreement between the co-owners, no interest is payable on the debt. Of other liabilities, SEK 12 million (19) falls due after more than five years.
Note 26 Other noninterest-bearing liabilities (current)
2018 20171
Accounts payable – trade 412 651
Liabilities to subsidiaries 5,775 2,800
Other liabilities 1,008 431
Accrued expenses and deferred income 3,672 2,924
Total 10,867 6,806
Breakdown of accrued expenses and deferred income:2018 2017
Accrued personnel-related costs 298 306
Accrued interest expenses 1,638 1,760
Other accrued expenses 1,095 361
Deferred income and accrued expenses, electricity 609 483
Other deferred income 32 14
Total 3,672 2,9241 The amount has been recalculated compared with previously published information in Vattenfall’s 2017
Annual and Sustainability Report as a result of new accounting rules (IFRS 9 and 15) that took effect in 2018. See Note 3 to the Parent Company accounts, Accounting policies.
144 Notes to the Parent Company accounts VATTENFALL ANNUAL AND SUSTAINABILITY REPORT 2018

Note 27 Financial instruments by measurement category
The measurement categories for assets and liabilities below correspond to the categories described in Note 36 to the consolidated accounts, Financial instruments by measurement category, offsetting of financial assets and liabilities, and financial instruments’ effects on income.
Presented below are assets and liabilities where the carrying amount differs from the fair value.
2018 2017
Carrying amount
Fair value
Carrying amount1
Fair value1
Financial assets at amortised cost
Other non-current receivables 63,366 66,798 59,388 59,656
Short-term investments 22,129 22,129 17,205 17,207
Total 85,495 88,927 76,593 76,863
Financial liabilities at amortised cost
Hybrid capital 19,837 19,957 19,126 19,798
Other non-current interest-bearing liabilities 39,171 44,618 50,401 57,400
Other non-current interest-bearing liabilities 86,207 86,394 57,308 57,313
Total 145,215 150,969 126,835 134,5111 The amount has been recalculated compared with previously published information in Vattenfall’s 2017
Annual and Sustainability Report as a result of new accounting rules (IFRS 9 and 15) that took effect in 2018. See Note 3 to the Parent Company accounts, Accounting policies.
Note 28 Collateral
Collateral and pledged assets (given)2018 2017
Shares pledged to the Swedish insurance company PRI Pensionsgaranti as security for credit insurance for pension obligations in Vattenfall’s Swedish operations 7,295 7,295
Pledged security to counterparties (derivative market)1 2,435 2,749
Blocked bank funds as security for trading on Nord Pool, ICE and EEX 4,822 2,017
Blocked bank funds as security for guarantees issued by bank — 1
Total 14,552 12,062
Collateral and pledged assets (received)2018 2017
Pledged security from counterparties (derivative market)1 3,370 3,3121 To fulfil the requirements for security in the derivative market, in its financial operations Vattenfall has
pledged security to counterparties for the negative fair value of derivative positions. The counterparties are obligated to repay this security to Vattenfall in the event the negative fair value decreases. In a similar manner, counterparties of Vattenfall have pledged security to Vattenfall.
Note 29 Contingent liabilities
Guarantees pertaining to:2018 2017
Swedish Nuclear Waste Fund 15,448 15,448
Contractor guarantees provided by order of subsidiaries 5,974 10,038
Guarantees provided as collateral for the subsidiaries within Vattenfall Energy Trading’s energy trading 8,712 5,760
Other contingent liabilities 11,793 11,497
Total 41,927 42,743
Swedish Nuclear Waste FundAccording to the Swedish Act (2006:647) on the Financing of Nuclear Waste Products, a party that has a permit to conduct nuclear engineering activities, such as Ringhals AB and Forsmarks Kraftgrupp AB, is required to provide security to the Swedish state as a guarantee that sufficient funds exist to cover the future costs of nuclear waste management. The security is provided in the form of guarantee commitments from the owners of the nuclear power companies. In a decision made on 21 December 2017, the Swedish government set new guarantee amounts for the years 2018–2020. Following this decision, as security for the sub-sidiaries Forsmarks Kraftgrupp AB and Ringhals AB, the parent company Vattenfall AB will make guarantee commitments for a combined value of SEK 23,935 million (15,448). Two types of guarantees will be issued. The first guarantee – so-called Financing Security, totaling SEK 15,892 million (10,633) – is intended to cover the current deficit of the Nuclear Waste Fund assuming no more nuclear waste fees are paid. This deficit is calculated as the difference between expected costs and existing funds.
The second guarantee – so-called Supplementary Security, totaling SEK 8,043 million (4,815) – pertains to potential future cost increases stemming from unforeseen events. However, as the wording of the new guarantees have not been finally approved by the government, they have not yet been issued. Instead, the previously existing guarantees for the lower amounts (15,448, see annual report 2017 for details) are still valid. The amounts for both of these types of security have been determined based on a probability-based risk analysis in which the former amount has been determined as such that there is a 50% probability that it, together with currently funded amounts (the median value), will provide full cost coverage for all waste produced to date. The latter amount consists essentially of the supplement that would be required if the cor-responding probability was 90%. See also Note 22 to the consolidated accounts, Share in the Swedish Nuclear Waste Fund and Note 35 to the consolidated accounts, Other interest-bearing provisions.
Contract guarantees provided by order of subsidiariesAs collateral for contractors’ obligations, Vattenfall AB has issued guaran-tees amounting to SEK 5,974 million (10,038), mainly attributable to obliga-tions in the Wind Business Area, which decreased significantly in 2018.
Guarantees provided as collateral for subsidiaries in Vattenfall Energy Trading’s energy tradingVattenfall AB has issued guarantees with a total nominal value of SEK 42,083 million (36,099) for energy trading conducted by the subsidiary Vattenfall Energy Trading. As per 31 December 2018 a total of SEK 8,712 million (5,760) of these guarantees had been utilised, which is included in the reported amount of contingent liabilities.
Other contingent liabilitiesOther contingent liabilities SEK 11,793 million (11,497) consists mainly of guarantees that Vattenfall AB has issued for the Customers & Solutions and Wind Business Areas (for the latter, see Note 44 to the consolidated accounts, Contingent liabilities), and pension obligations, which amoun-ted to SEK 1,382 million (1,294).
In addition to the contingent liabilities mentioned above, Vattenfall has the following significant commitmentsIn 2009 Vattenfall AB, together with its subsidiary SKB (the Swedish Nuclear Fuel and Waste Management Company) and the other part-owners of that company, signed a long-term cooperation agreement with the Östhammar and Oskarshamn municipalities. The agreement covers the period 2010 to approximately 2025 and regulates development efforts in association with the implementation of the Swedish nuclear waste programme. Through development initiatives in areas such as training, enterprise and infrastructure, over time the parties will generate value-added worth SEK 1,500 million to SEK 2,000 million. The parties are to finance the development efforts in proportion to their ownership interests. The Vattenfall Group’s ownership interest is 56%. Implementation of the efforts is being carried out across two periods: a period before all neces-sary permits have been received (Period 1), and a period during implemen-tation and operation of the facilities (Period 2). In 2018 Vattenfall reported a provision of SEK 43 million (34) for its share of Period 1 activities.
Atomic liability in Sweden is strict and limited to 300 million Spe-cial Drawing Rights (SDRs) (rate 12,4768), corresponding to about SEK 3,743 million (3,517), which means that the companies that are owners of nuclear power plants are only liable for damage to the sur-rounding environment up to this amount.
VATTENFALL ANNUAL AND SUSTAINABILITY REPORT 2018 145Notes to the Parent Company accounts

Note 30 Commitments under consortium agreements
See note 41 to the consolidated accounts, Commitments under consortium agreements.
Note 31 Average number of employees and personnel costs
Average number of employees2018 2017
Men Women Total Men Women Total
Sweden 1,106 537 1,643 1,129 530 1,659
Personnel costs2018 2017
Salaries and other remuneration 1,195 1,199
Social security expenses 829 778
– of which pension costs1 274 322
Total 2,024 1,9771 SEK 4,5 million (15) of the pension costs are attributable to senior executives, i.e., the current and former
Presidents and Executive Vice Presidents. The company’s outstanding pension obligations attributable to these executives amounted to SEK 0 million (0).
None of the board members receive any pension benefits in connection with their board duties.
Salaries and other remuneration:2018 2017
Senior executives1
Other employees Total
Senior executives1
Other employees Total
Sweden 65 1,130 1,195 73 1,126 1,1991 Senior executives comprise board members and deputy board members as well as the President and
the Executive Vice President. The term also refers to former board members and deputy board members, former Presidents and Executive Vice Presidents, and other senior executives who are members of the Executive Group Management.
Total salaries and other remuneration to board members and Presidents include bonuses of SEK 0 million (0). For benefits to senior executives at Vattenfall AB, see Note 42 to the consolidated accounts, Number of employees and personnel costs.
146 Notes to the Parent Company accounts VATTENFALL ANNUAL AND SUSTAINABILITY REPORT 2018

Note 32 Gender distribution among senior executives
See Note 43 to the consolidated accounts, Gender distribution among senior executives.
Note 33 Related party disclosures
See Note 44 to the consolidated accounts, Related party disclosures.
Note 34 Specification of the cash flow statement
Other, including non-cash items2018 20171
Realised foreign exchange gains/losses 3,028 473
Changes in provisions 62 –113
Other 3,0112 522
Total 6,101 412
Financial liabilitiesCurrent Non-current
Financial liabilities at 1 January 20171 64,688 68,971
Cashflow –10,938 –8,485
Non-cash effecting currency effects 717 264
Other non-cash flow effecting items 2,841 8,777
Financial liabilities at 31 December 20171 57,308 69,527
Cashflow 12,276 –756
Non-cash effecting currency effects 1,356 2,002
Effect of unrealized gains/losses on derivatives 4,192 –658
Other non-cash flow effecting items 11,075 –11,107
Financial liabilities at 31 December 2018 86,207 59,0081 The amount has been recalculated compared with previously published information in Vattenfall’s 2017
Annual and Sustainability Report as a result of new accounting rules (IFRS 9 and 15) that took effect in 2018. See Note 3 to the Parent Company accounts, Accounting policies.
2 Including the value of unrealiased derivatives in operating profit before depreciation, amortisation and impairment losses (EBITDA), totalling SEK 3,041 million (–53).
Note 35 Events after the balance sheet date
See Note 45 to the consolidated accounts, Events after the balance sheet date.
VATTENFALL ANNUAL AND SUSTAINABILITY REPORT 2018 147Notes to the Parent Company accounts

Auditor’s ReportTo the general meeting of the shareholders of Vattenfall AB, corporate identity number 556036-2138
Report on the annual accounts and consolidated accountsOpinionsWe have audited the annual accounts and consolidated accounts of Vattenfall AB (publ) except for the corporate governance statement on pages 70–84 for the year 2018. The annual accounts and consolidated accounts of the company are included on pages 2–5, 8–11, 62–147 in this document.
In our opinion, the annual accounts have been prepared in accordance with the Annual Accounts Act and present fairly, in all material respects, the financial position of the parent company as of 31 December 2018 and its financial performance and cash flow for the year then ended in accordance with the Annual Accounts Act. The consolidated accounts have been prepared in accordance with the Annual Accounts Act and present fairly, in all material respects, the financial position of the group as of 31 December 2018 and their financial performance and cash flow for the year then ended in accordance with International Financial Reporting Standards (IFRS), as adopted by the EU, and the Annual Accounts Act. Our opinions do not cover the corporate governance statement on pages 70–84. The statutory administration report is consistent with the other parts of the annual accounts and consolidated accounts.
We therefore recommend that the general meeting of shareholders adopts the income statement and balance sheet for the parent company and the group.
Basis for OpinionsWe conducted our audit in accordance with International Standards on Auditing (ISA) and generally accepted auditing standards in Sweden. Our responsibilities under those standards are further described in the Auditor’s Responsibilities section. We are independent of the parent company and the group in accordance with professional ethics for accountants in Sweden and have otherwise fulfilled our ethical responsi-bilities in accordance with these requirements.
We believe that the audit evidence we have obtained is sufficient and appropriate to provide a basis for our opinions.
Key Audit MattersKey audit matters of the audit are those matters that, in our professional judgment, were of most significance in our audit of the annual accounts and consolidated accounts of the current period. These matters were addressed in the context of our audit of, and in forming our opinion thereon, the annual accounts and consolidated accounts as a whole, but we do not provide a separate opinion on these matters.
Key audit matters, the GroupValuation of Tangible and Intangible assets
Description of the matter How this matter has been reflected in the audit
In the Group´s statement of financial position as per December 31, 2018 reported value of fixed tangible and intangible assets amounts to SEK 256,883 million, which equals 55.5 % of the Group´s total assets. Of the carrying value, SEK 13,791 million was goodwill. As described in note 9 the Company is making assessments throughout the year for any indication that an asset may have decreased in value. If there is an indication of this kind, the asset’s recoverable amount is calculated in order to determine whether there is any need for impairment. For goodwill the recoverable amount is calculated at least annually or as soon as there is an indication that an asset has decreased in value.
The Company has grouped its individual assets to the smallest group of assets that generates cash inflows that are largely inde-pendent from cash inflows from other assets. Recoverable amount is determined by calculating value in use and in Note 9 the main assumptions, such as future market prices of electricity, fuel and CO2 emission allowances used when calculating the value in use, are described. Further, in Note 9 it is described that the calculation of value in use for cash-generating units with finite useful lives are based on forecasts of the useful life of the respective asset. Cash flow projec-tions for cash-generating units with infinite useful lives are based on the business plan for the coming five years. Cash flows after the five year-period are calculated based on a growth factor of 0–0.5 %. Future cash flows have been discounted to value in use using a discount rate as described in Note 9.
Goodwill impairment is never reversed. Impairment of other assets is reversed if there has been a significant and lasting change in the assumptions used to calculate the recoverable amount.
In 2018, the company wrote down a total of SEK 136 million in Business Area Wind. No write-down reversals have occurred during the year.
Changes in assumptions may have a significant impact on the calculation of value in use which imply that the determination of assumptions is of significant importance to the calculation. Hence, we have assessed the valuation of tangible and intangible assets as a key audit matter in the audit.
In our audit we have evaluated the Company’s process to develop and perform impairment tests. We have assessed how cash-generating units, based on established criteria’s, are identified and compared to how the Company internally monitors its business. We have involved valuation specialists to assist us in the assessment of the Company’s valuation and calculation methods, assessment of reasonableness in used assumptions, sensitivity analysis of changed assumptions, com-parisons with historical results and the accuracy in previous forecasts. Each cash-generating units’ discount rate and long-term growth have been evaluated through comparisons with other companies within the same industry and current market rates. We have also assessed whether the information disclosed is appropriate.
148 Auditor’s Report VATTENFALL ANNUAL AND SUSTAINABILITY REPORT 2018

Provision for future expenses of nuclear power operations
Description of the matter How this matter has been reflected in the audit
In the Group’s statement of financial position as per December 31, 2018 the provisions for future expenses of nuclear power operations amounts to SEK 77,688 million. As described in note 31 the provisions pertain to future obligations for handling the decommissioning of the Company’s nuclear power plants in Sweden and Germany as well as for handling nuclear waste. The provisions are based on forecasts for future expenditures that cover a period of up to 50 years. These forecasts include assessments with significant uncertainties, such as for expenditures for the disposal of nuclear fuel and radioactive waste as well as for the decommissioning of reactor plants. The estimated expenditures have thus been calculated based on a discount rate.
Calculation of future expenses for decommissioning of nuclear power operations include a number of assumptions determined by the Company and changes in these assumptions may have a significant impact on the provision amount. Hence, we have assessed the recognition of provisions for future expenses of nuclear power operations as a key audit matter in the audit.
In our audit we have evaluated the Company’s process to calculate the amount of the provisions. We have evaluated the Company’s calculation methods, obtained assessments by third parties, asses-sed the reasonableness in used assumptions and sensitivity analysis of changed assumptions and performed comparisons with historical results and the accuracy in previous forecasts. The reasonableness of used discount rate has been evaluated through comparisons with other companies within the same industry and current market rates. We have also assessed whether the information disclosed is appropriate.
VATTENFALL ANNUAL AND SUSTAINABILITY REPORT 2018 149Auditor’s Report

Other Information than the annual accounts and consolidated accountsThis document also contains other information than the annual accounts and consolidated accounts and is found on pages 1, 6–7, 12–61 and 153–181. The Board of Directors and the Managing Director are respon-sible for this other information.
Our opinion on the annual accounts and consolidated accounts does not cover this other information and we do not express any form of assurance conclusion regarding this other information.
In connection with our audit of the annual accounts and consolidated accounts, our responsibility is to read the information identified above and consider whether the information is materially inconsistent with the annual accounts and consolidated accounts. In this procedure we also take into account our knowledge otherwise obtained in the audit and assess whether the information otherwise appears to be materially misstated.
If we, based on the work performed concerning this information, con-clude that there is a material misstatement of this other information, we are required to report that fact. We have nothing to report in this regard.
Responsibilities of the Board of Directors and the Managing DirectorThe Board of Directors and the Managing Director are responsible for the preparation of the annual accounts and consolidated accounts and that they give a fair presentation in accordance with the Annual Accounts Act and, concerning the consolidated accounts, in accordance with IFRS as adopted by the EU. The Board of Directors and the Managing Director are also responsible for such internal control as they determine is necessary to enable the preparation of annual accounts and consolidated accounts that are free from material misstatement, whether due to fraud or error.
In preparing the annual accounts and consolidated accounts, The Board of Directors and the Managing Director are responsible for the assessment of the company’s and the group’s ability to continue as a going concern. They disclose, as applicable, matters related to going concern and using the going concern basis of accounting. The going concern basis of accounting is however not applied if the Board of Directors and the Managing Director intends to liquidate the company, to cease operations, or has no realistic alternative but to do so.
The Audit Committee shall, without prejudice to the Board of Director’s responsibilities and tasks in general, among other things oversee the company’s financial reporting process.
Auditor´s responsibilityOur objectives are to obtain reasonable assurance about whether the annual accounts and consolidated accounts as a whole are free from material misstatement, whether due to fraud or error, and to issue an auditor’s report that includes our opinions. Reasonable assurance is a high level of assurance, but is not a guarantee that an audit conducted in accordance with ISAs and generally accepted auditing standards in Sweden will always detect a material misstatement when it exists. Misstatements can arise from fraud or error and are considered material if, individually or in the aggregate, they could reasonably be expected to influence the economic decisions of users taken on the basis of these annual accounts and consolidated accounts.
As part of an audit in accordance with ISAs, we exercise professional judgment and maintain professional skepticism throughout the audit. We also:• Identify and assess the risks of material misstatement of the annual
accounts and consolidated accounts, whether due to fraud or error, design and perform audit procedures responsive to those risks, and obtain audit evidence that is sufficient and appropriate to provide a basis for our opinions. The risk of not detecting a material misstatement resulting from fraud is higher than for one resulting from error, as fraud may involve collusion, forgery, intentional omissions, misrepresentations, or the override of internal control.
• Obtain an understanding of the company’s internal control relevant to our audit in order to design audit procedures that are appropriate in the circumstances, but not for the purpose of expressing an opinion on the effectiveness of the company’s internal control.
• Evaluate the appropriateness of accounting policies used and the reasonableness of accounting estimates and related disclosures made by the Board of Directors and the Managing Director.
• Conclude on the appropriateness of the Board of Directors’ and the Managing Director’s use of the going concern basis of accounting in preparing the annual accounts and consolidated accounts. We also draw a conclusion, based on the audit evidence obtained, as to whether any material uncertainty exists related to events or conditions that may cast significant doubt on the company’s and the group’s ability to continue as a going concern. If we conclude that a material uncertainty
exists, we are required to draw attention in our auditor’s report to the related disclosures in the annual accounts and consolidated accounts or, if such disclosures are inadequate, to modify our opinion about the annual accounts and consolidated accounts. Our conclusions are based on the audit evidence obtained up to the date of our auditor’s report. However, future events or conditions may cause a company and a group to cease to continue as a going concern.
• Evaluate the overall presentation, structure and content of the annual accounts and consolidated accounts, including the disclosures, and whether the annual accounts and consolidated accounts represent the underlying transactions and events in a manner that achieves fair presentation.
• Obtain sufficient and appropriate audit evidence regarding the financial information of the entities or business activities within the group to express an opinion on the consolidated accounts. We are responsible for the direction, supervision and performance of the group audit. We remain solely responsible for our opinions.
We must inform the Board of Directors of, among other matters, the planned scope and timing of the audit. We must also inform of significant audit findings during our audit, including any significant deficiencies in internal control that we identified.
We must also provide the Board of Directors with a statement that we have complied with relevant ethical requirements regarding indepen-dence, and to communicate with them all relationships and other matters that may reasonably be thought to bear on our independence, and where applicable, related safeguards.
From the matters communicated with the Board of Directors, we determine those matters that were of most significance in the audit of the annual accounts and consolidated accounts, including the most important assessed risks for material misstatement, and are therefore the key audit matters. We describe these matters in the auditor’s report unless law or regulation precludes disclosure about the matter or when, in extremely rare circumstances, we determine that a matter should not be communicated in the auditor’s report because the adverse conse-quences of doing so would reasonably be expected to outweigh the public interest benefits of such communication.
Report on other legal and regulatory requirements OpinionsIn addition to our audit of the annual accounts and consolidated accounts, we have also audited the administration of the Board of Direc-tors and the Managing Director of Vattenfall AB (publ) for the year 2018 and the proposed appropriations of the company’s profit or loss.
We recommend to the general meeting of shareholders that the profit be appropriated in accordance with the proposal in the statutory administration report and that the members of the Board of Directors and the Managing Director be discharged from liability for the financial year.
Basis for OpinionsWe conducted the audit in accordance with generally accepted auditing standards in Sweden. Our responsibilities under those standards are further described in the Auditor’s Responsibilities section. We are independent of the parent company and the group in accordance with professional ethics for accountants in Sweden and have otherwise fulfil-led our ethical responsibilities in accordance with these requirements.
We believe that the audit evidence we have obtained is sufficient and appropriate to provide a basis for our opinions.
Responsibilities of the Board of Directors and the Managing DirectorThe Board of Directors is responsible for the proposal for appropriations of the company’s profit or loss. At the proposal of a dividend, this includes an assessment of whether the dividend is justifiable considering the requirements which the company’s and the group’s type of operations, size and risks place on the size of the parent company’s and the group’s equity, consolidation requirements, liquidity and position in general.
The Board of Directors is responsible for the company’s organization and the administration of the company’s affairs. This includes among other things continuous assessment of the company’s and the group’s financial situation and ensuring that the company’s organization is desig-ned so that the accounting, management of assets and the company’s financial affairs otherwise are controlled in a reassuring manner. The Managing Director shall manage the ongoing administration according to the Board of Directors’ guidelines and instructions and among other mat-ters take measures that are necessary to fulfill the company’s accounting in accordance with law and handle the management of assets in a reassuring manner.
150 Auditor’s Report VATTENFALL ANNUAL AND SUSTAINABILITY REPORT 2018

Auditor´s responsibilityOur objective concerning the audit of the administration, and thereby our opinion about discharge from liability, is to obtain audit evidence to assess with a reasonable degree of assurance whether any member of the Board of Directors or the Managing Director in any material respect:• has undertaken any action or been guilty of any omission which can
give rise to liability to the company, or• in any other way has acted in contravention of the Companies Act, the
Annual Accounts Act or the Articles of Association.
Our objective concerning the audit of the proposed appropriations of the company’s profit or loss, and thereby our opinion about this, is to assess with reasonable degree of assurance whether the proposal is in accordance with the Companies Act.
Reasonable assurance is a high level of assurance, but is not a gua-rantee that an audit conducted in accordance with generally accepted auditing standards in Sweden will always detect actions or omissions that can give rise to liability to the company, or that the proposed appropriations of the company’s profit or loss are not in accordance with the Companies Act.
As part of an audit in accordance with generally accepted auditing standards in Sweden, we exercise professional judgment and maintain professional skepticism throughout the audit. The examination of the administration and the proposed appropriations of the company’s profit or loss is based primarily on the audit of the accounts. Additional audit procedures performed are based on our professional judgment with starting point in risk and materiality. This means that we focus the examination on such actions, areas and relationships that are material for the operations and where deviations and violations would have particular importance for the company’s situation. We examine and test decisions undertaken, support for decisions, actions taken and other circumstances that are relevant to our opinion concerning discharge from liability. As a basis for our opinion on the Board of Directors’ proposed appropriations of the company’s profit or loss we examined the Board of Directors’ reasoned statement and a selection of supporting evidence in order to be able to assess whether the proposal is in accordance with the Companies Act.
The auditor´s examination of the corporate governance statementThe Board of Directors is responsible for that the corporate governance statement on pages 70–84 has been prepared in accordance with “The State’s Ownership Policy and guidelines for companies with state ownership” (“the Ownership Policy”).
Our examination of the corporate governance statement is conducted in accordance with FAR´s auditing standard RevU 16 The auditor´s examination of the corporate governance statement. This means that our examination of the corporate governance statement is different and substantially less in scope than an audit conducted in accordance with International Standards on Auditing and generally accepted auditing standards in Sweden. We believe that the examination has provided us with sufficient basis for our opinions.
A corporate governance statement has been prepared. Disclosures in accordance with chapter 6 section 6 the second paragraph points 2–7 of the Annual Accounts Act and chapter 7 section 31 the second paragraph the same law are consistent with the other parts of the annual accounts and consolidated accounts and are in accordance with the Annual Accounts Act.
Stockholm, 19 March 2019Ernst & Young AB
Staffan LandénAuthorized Public Accountant
VATTENFALL ANNUAL AND SUSTAINABILITY REPORT 2018 151Auditor’s Report

Non-financialinformation
Materiality analysis 153Stakeholders 154Social information
Human rights 155Sustainable supply chain 156Taxes 158Human resources 158
Environmental information Environment 160
GRI Index and supplementary disclosures 164
Contents
152 Non-financial information VATTENFALL ANNUAL AND SUSTAINABILITY REPORT 2018
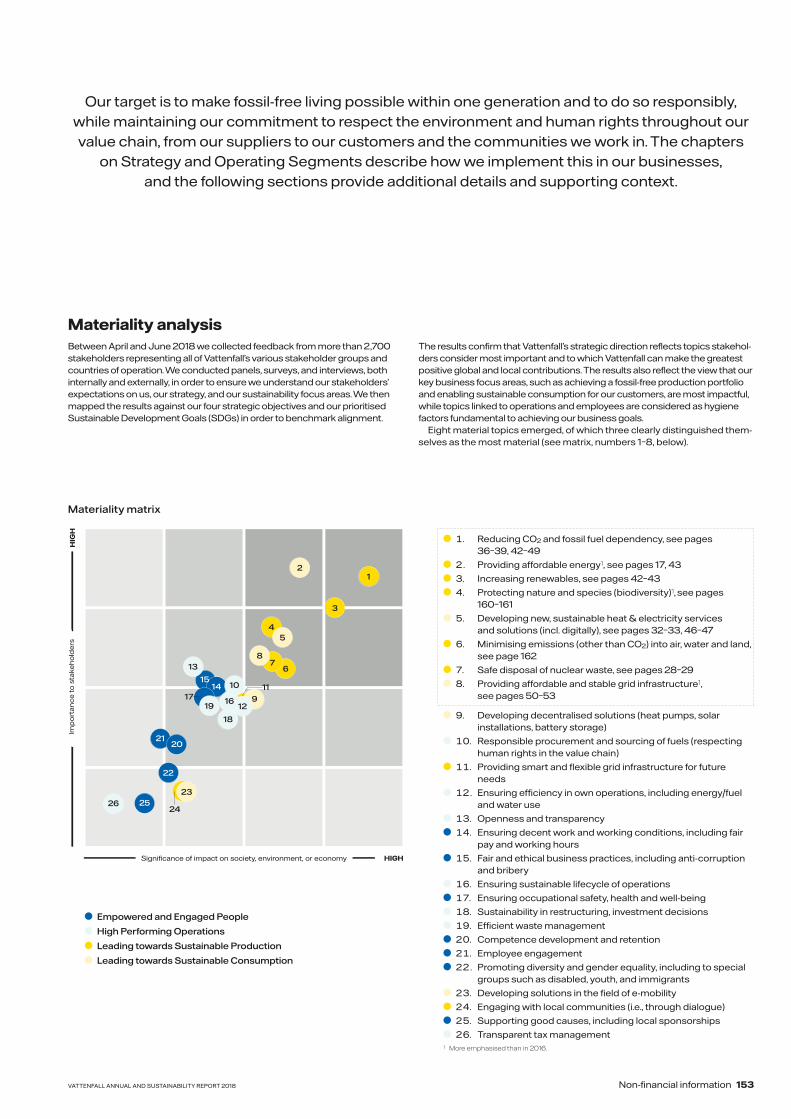
Our target is to make fossil-free living possible within one generation and to do so responsibly, while maintaining our commitment to respect the environment and human rights throughout our value chain, from our suppliers to our customers and the communities we work in. The chapters
on Strategy and Operating Segments describe how we implement this in our businesses, and the following sections provide additional details and supporting context.
Materiality analysisBetween April and June 2018 we collected feedback from more than 2,700 stakeholders representing all of Vattenfall’s various stakeholder groups and countries of operation. We conducted panels, surveys, and interviews, both internally and externally, in order to ensure we understand our stakeholders’ expectations on us, our strategy, and our sustainability focus areas. We then mapped the results against our four strategic objectives and our prioritised Sustainable Development Goals (SDGs) in order to benchmark alignment.
The results confirm that Vattenfall’s strategic direction reflects topics stakehol-ders consider most important and to which Vattenfall can make the greatest positive global and local contributions. The results also reflect the view that our key business focus areas, such as achieving a fossil-free production portfolio and enabling sustainable consumption for our customers, are most impactful, while topics linked to operations and employees are considered as hygiene factors fundamental to achieving our business goals.
Eight material topics emerged, of which three clearly distinguished them-selves as the most material (see matrix, numbers 1–8, below).
Materiality matrix
1
5
8
9
2
3
4
76
12
18
19
13
1514
1710
16
11
22
2021
252623
24
Imp
ort
anc
e t
o s
take
ho
lde
rs
Significance of impact on society, environment, or economy HIGH
HIG
H
1. Reducing CO2 and fossil fuel dependency, see pages 36–39, 42–49
2. Providing affordable energy1, see pages 17, 43
3. Increasing renewables, see pages 42–43
4. Protecting nature and species (biodiversity)1, see pages 160–161
5. Developing new, sustainable heat & electricity services and solutions (incl. digitally), see pages 32–33, 46–47
6. Minimising emissions (other than CO2) into air, water and land, see page 162
7. Safe disposal of nuclear waste, see pages 28–29
8. Providing affordable and stable grid infrastructure1, see pages 50–53
9. Developing decentralised solutions (heat pumps, solar installations, battery storage)
10. Responsible procurement and sourcing of fuels (respecting human rights in the value chain)
11. Providing smart and flexible grid infrastructure for future needs
12. Ensuring efficiency in own operations, including energy/fuel and water use
13. Openness and transparency
14. Ensuring decent work and working conditions, including fair pay and working hours
15. Fair and ethical business practices, including anti-corruption and bribery
16. Ensuring sustainable lifecycle of operations
17. Ensuring occupational safety, health and well-being
18. Sustainability in restructuring, investment decisions
19. Efficient waste management
20. Competence development and retention
21. Employee engagement
22. Promoting diversity and gender equality, including to special groups such as disabled, youth, and immigrants
23. Developing solutions in the field of e-mobility
24. Engaging with local communities (i.e., through dialogue)
25. Supporting good causes, including local sponsorships
26. Transparent tax management1 More emphasised than in 2016.
Empowered and Engaged People
High Performing Operations
Leading towards Sustainable Production
Leading towards Sustainable Consumption
VATTENFALL ANNUAL AND SUSTAINABILITY REPORT 2018 153Non-financial information

Stakeholders
Active dialogue with our stakeholders As an employer we influence the mental and physical health as well as the economic livelihood of our employees and the communities we work in. As a provider of electricity, heat, gas, and associated products and services, Vattenfall has a fundamental and direct impact on millions of people’s lives. As a developer of wind and solar projects, we impact local communities and ecosystems through our assets. Moreover, as a purchaser of fuels, goods, and services from around the world, we have social, environmental and economic impacts through our suppliers on an even greater number of people and local communities. We also have a global impact through the fossil fuels that are used in our electricity and heat production, as these lead to greenhouse gas emissions that are contributing to climate change, which in turn is affecting the entire earth. We are constantly striving to bet-ter understand and manage these impacts – maximising the positive and minimising the negative – and we view dialogue with our stakeholders as crucial to our success in this regard.
As a company with both local and global impacts, we have countless stakeholders. They include employees at our power plants, families that are kept warm by the heat we produce, and investors who help finance our operations. They are our owner, authorities and city partners we work with to set climate ambitions, our customers and industrial partners with and for whom we develop new solutions, the NGOs that help us address critical environmental and social issues in our value chain, and many more. With such a diverse range of stakeholders it is important that we are engaged in a constant dialogue with everyone, in order to make the best decisions
possible. The Vattenfall Project Governance Principles, valid throughout the Group, ensure that the various local interests are taken into account and addressed in our projects. Our dialogues take many other forms as well, including attitude surveys, direct customer satisfaction feedback, and many direct lines of communication with people throughout our organisation.
Feedback While the updated materiality analysis confirmed our strategy is in line with stakeholder expectations, priorities among certain stakeholders and stakeholder groups vary, and we must strive to achieve balance between sometimes conflicting priorities.
For example, while both business and retail customers desire renewable or low-CO2 offerings, they also clearly demonstrate that affordability of energy is still priority number one. We recognise this and seek to strike the correct balance to meet all expectations. While we continue to expand our renew-able capacity, we simultaneously strive to be a leader in Levelised Energy Cost, meaning the lifetime cost of installing and operating a wind or solar farm. Winning the permit for what will be the first non-subsidised offshore wind farm in the Netherlands, Hollandse Kust Zuid 1 and 2, demonstrates solid progress. Further, we are constantly developing our decarbonisation plans for our fossil assets, emphasising a focus on cost-efficient and com-mercially viable measures that enable rapid CO2 reductions while protect-ing customers from unnecessary price increases.
Stakeholders’ views
Olivier Aubert Vestas
Vice President Global Procurement – Head of Supplier Quality and Develop-ment at Vestas Wind Systems A/SVestas is a global leader in the wind energy industry, with 101 GW of wind turbines installed across 80 countries.
“Despite steady and significant growth, the wind power industry is still relatively young and in the process of maturing. One aspect of this maturation is the dis-covery of and focus on new risks, some of
which are related to sustainability. As an industry leader, Vestas takes an active role in driving sustainability improvements throughout its value chain,” says Olivier Aubert, Vice President of Global Procure-ment for Vestas.
“When driving sustainability matters, collaboration and leverage are key,” he continues. “In recent years, we’ve seen both investors and customers also raising their expectations with regards to sus-tainability. This, in turn, gives us the chance to further demonstrate our engagement together with our suppliers to improve sustainabil-ity in our supply chain.”
“At Vestas, we see sustainability as an opportunity to improve our partnership with all our stakeholders. Our customers are increasingly thorough regarding sustainability requirements while at the same time being very engaged and open to collaborating to achieve our collective goals. In this respect, Vattenfall has been an excellent counterpart and more of a partner. For example, Vattenfall responded positively to our invitation to join our global supplier conference at Vestas, representing the voice of the customer and helping us drive home the importance of sustainability to our own suppliers. This way, we think Vattenfall can use its position as a wind developer and as one of the leaders in the sustainability field to further drive change. Through our mutual discussions, Vattenfall’s willingness to engage honestly with us makes them a valuable partner. We look forward to finding more opportunities for collabora-tion in the future.”
Karin GregowForum Syd
Policy Advisor at Forum SydForum Syd is a development organisa-tion focused on improving human and civil rights. Based in Sweden, Forum Syd has approximately 140 members and works with local NGOs and civil society organisations to promote human rights in a number of specific countries, including Colombia. Together with local partners, Forum Syd investigates adverse environ-mental and human rights impacts, and works with them to support rights-holders in getting these adverse impacts addressed.
“Colombia has a number of human rights issues, many of which are linked to coal mining, one of the country’s main industries. Com-panies are responsible for all aspects of their operations, including the impacts of the products they source. Vattenfall sources coal from Colombia, and in that respect has a responsibility to address these issues,” says Gregow. “Since Vattenfall is the largest state-owned company in Sweden, we believe they have a duty to work with civil society to understand the adverse human rights impacts of the prod-ucts they are sourcing, and to put pressure on the mining companies to address these impacts.”
“We first engaged with Vattenfall on the topic of Colombian coal a number of years ago. We quickly felt that Vattenfall was engaging earnestly, listening to what we and other stakeholders said and participating in a constructive dialogue. We welcomed Vattenfall’s independent impact assessment in Colombia in 2017 and are pleased that they have engaged more utilities on the topic and can thus increase the leverage they have as a group to work with the mining companies and address the issues. It’s important that they live up to the commitments set forth in the report, for example agreeing on action plans with the mining companies, and important that they remain alert to other issues that may arise and affect their supply chains, such as threats to human rights defenders. Vattenfall is a leader in the European energy utility sector, and if they remain committed to engage with NGOs and civil society organisations in a constructive way, we believe they will remain in the forefront.”
154 Non-financial information VATTENFALL ANNUAL AND SUSTAINABILITY REPORT 2018

Human rights
Our commitment At Vattenfall we acknowledge that we have a responsibility to respect all internationally recognised human rights and that we are in a position to make a positive impact on human rights issues. We base our work on the UN Global Compact, the International Labor Organization’s (ILO) eight fun-damental conventions, the OECD’s guidelines for Multinational Enterprises, and the UN’s Guiding Principles for Business and Human Rights. Our com-mitment to respecting human rights is included in our Code of Conduct and Integrity, our Code of Conduct for Suppliers, and in our statement on slavery and human rights in accordance with the UK Modern Slavery Act. Further, ensuring social responsibility throughout the value chain is a key focus area of Vattenfall’s overall strategy.
Vattenfall’s Code of Conduct and Integrity defines how we are to act with integrity within the company in the course of our business. A whistleblow-ing function is in place for employees to report suspected violations of this Code.
We strive to work with others who are committed to doing business in an ethically sound manner. Our Code of Conduct for Suppliers1 (CoCfS) defines the company’s basic requirements and expectations for suppliers with respect to sustainability. This includes requiring that our suppliers agree with the ten principles laid out in the UN Global Compact. The CoCfS was updated in 2017 and explicitly addresses modern slavery and forced labour. Embedded in the CoCfS are specific clauses regarding community engagement and development, child labour and young workers, modern slavery and forced labour, working hours, wages and benefits, health and safety, freedom of association and collective bargaining, non-discrimina-tion, protection of third-party rights, and information security. Our suppliers shall respect the rights of indigenous and tribal peoples and their social, cultural, environmental, and economic interests, including their connection with lands and other natural resources.
Vattenfall conducts its operations primarily in northwest Europe (Sweden, Germany, the Netherlands, Denmark, the UK, France, and Finland). All of these countries have confirmed that they adhere to the ILO’s eight fundamental conventions.
At Vattenfall we strive to conduct due diligence by regularly and sys-tematically identifying and assessing human rights, environmental and business ethics–related risks and impacts in our value chain, and to use this information to avoid, mitigate or remedy the impacts.
Human rights impact and risk screening, and action plan for mitigation We have performed screenings of human rights impacts and risks across our value chain together with an independent third party. The latest screen-ing showed that the salient risks that we contribute to or are linked to exist
in our supply chain in high-risk countries in the areas of working conditions and local communities’ livelihood. Salient risks associated with our own operations are mainly related to contractors’ working conditions, local communities’ livelihood, indigenous people, and privacy (personal data and information).
Activities in 2018• Increased internal awareness through workshops and dialogues to find
the right priorities for human rights. • Published an updated statement on slavery and human rights in accord-
ance with the UK Modern Slavery Act2. • Published the first edition of our Human Rights Policy3 in which we
detail our commitment to respect human rights and the way we identify, assess, and manage human rights risks.
• Developed an action plan outlining the 11 key steps we need to take in the coming years to improve our efforts in relation to human rights.
• Expanded the scope of our due diligence process by including more human rights elements into our standard review process.
• Performed a pilot human rights dialogue in Russia and a follow-up visit to Colombia. Read more on page 157.
• Continued participation in external initiatives and seminars with focus on human rights in order to raise awareness, share best practices and discuss challenges going forward, including by helping establish wind Industry Principles with WindEurope and by contributing to the develop-ment of a potential Dutch covenant on supply chain sustainability with NWEA, the Dutch wind energy association.
Planned activities• Further increase awareness and conduct internal training in human rights. • Identify key focus areas and actions for each business area. • Execute our human rights action plan.• Collaborate in Bettercoal’s Russia and Colombia country working groups
to accelerate and expand the ways in which human rights are addressed.• Participate in a broader industry benchmarking study to identify best
practices and areas for improvement in addressing sustainability issues – in particular human rights – in the supply chain.
1 See corporate.vattenfall.com/globalassets/corporate/about_vattenfall/suppliers/ code_of_conduct_for_suppliers_EN_.pdf
2 For more details, see corporate.vattenfall.com/sustainability/policies-and-management/ statement-on-slavery
3 See corporate.vattenfall.com/sustainability/policies-and-management/
VATTENFALL ANNUAL AND SUSTAINABILITY REPORT 2018 155Non-financial information

Sustainable supply chainOur responsibility and commitment to act sustainably is valid not just within our operational boundaries, but extends to our supply chain as well. By focusing on environmental and social aspects throughout our supply chain, we can gain long-term advantages, principally by reducing risk, reducing cost, and improving our brand value. Through our supplier engagement strategy, sustainability assessments, and collaborations in specific industry initiatives, we are striving to increase our influence in the supply chain, to strengthen relationships with our suppliers, and to improve our suppliers’ sustainability performance.
Vattenfall’s Code of Conduct and Integrity governs the way Vattenfall employees interact with our suppliers. Our Code of Conduct for Suppliers (CoCfS) defines the company’s requirements and expectations for suppli-ers with respect to sustainability.
Diverse supplier base Vattenfall has approximately 33,000 suppliers across our four primary sourcing and purchasing streams: goods and services, commodity fuels (coal, biomass, gas and oil), directly sourced heat fuels, and nuclear fuel.
As Vattenfall has so many suppliers and purchases such a wide range of goods, services and fuels, with varying risk profiles and legal and sustain-ability requirements, implementation of our CoCfS varies. Regardless, we ensure that contracts either include an ethical clause linked to our CoCfS, are aligned with relevant industry initiatives such as Bettercoal or the Sustainable Biomass Program, or some combination of these.
Developments in 2018 Particular focus was directed to improving Vattenfall’s sourcing and purchasing methodologies, increasing internal awareness, and updat-ing methods and documents. The outsourcing of certain procurement processes has given us an opportunity to develop and strengthen sustain-ability elements in the supply chain, including to develop further internal supporting guidelines for our processes, create new training material for buyers and business, and revise and strengthen our monitoring and report-ing systems. In doing so, our sustainable supply chain work will become both more efficient and more comprehensive, leading to greater results.
More than ever, we believe partnership and collaboration with our various stakeholders offer the greatest opportunity to affect change. Accordingly, we continue to dedicate resources to both national and industry supply chain initiatives, as well as increasing our dialogue with e.g., NGOs, which continues to be a good way for identifying and mitigating social and envi-ronmental risks.
Key achievements • Together with Bettercoal and other Bettercoal members, we established
country working groups for Colombia and Russia to facilitate direct dialogue with mining companies regarding improvements in the mines. We also aligned our efforts in Colombia with Bettercoal and together we paid a follow-up visit to Colombia to start a conversation with mining companies on the recommendations in our Colombia report1, to obtain updates from Colombian stakeholders, and to offer an update2 to our Colombian stakeholders of developments since the publication of our Colombia report.
• Expanded supply chain engagement through dialogues on human rights with a nuclear fuel supplier and other local stakeholders in Russia.
• Continued to increase transparency surrounding our fuel sourcing activi-ties by publicly reporting on our direct coal suppliers over the last three years3.
• Set up a Sustainable Procurement Board (SPB), which provides guidance on strategic topics and deviating individual cases in order to balance purchasing strategy with sustainability aspects.
• Developed a new, expanded version of our sustainability audit checklist to be used by Vattenfall’s contracted 3rd party audit company while conducting audits of Vattenfall’s suppliers.
• Developed a roadmap to guide and accelerate a long-term strengthening and embedding of a sustainable supply chain for goods and services within Vattenfall.
• Actively participated in the creation of WindEurope’s new Sustainability Industry Principles, which were approved in 2018.
Activities planned for 2019: • Increase audits and engagement around identified risk issues. • Increase our efforts in Russia to address risks in our supply chain cover-
ing primarily coal and nuclear power.• Improve internal governance and focus on more accurate measurement
of new and existing KPIs and better reporting supported by new IT tools. • Further anchor sustainable supply chain processes in the business by
training our buyers to take responsibility for sustainability. • Conduct an internal benchmark of ways of working across our purchas-
ing streams to identify best practices, gaps, and potential synergies and opportunities for standardisation.
• Begin a phased rollout of a category risk assessment tool to strengthen our risk assessment and management capabilities.
1 See corporate.vattenfall.com/globalassets/corporate/sustainability/doc/ vattenfall_colombia_coal_report_english.pdf
2 See corporate.vattenfall.com/globalassets/corporate/sustainability/doc/ vattenfall_coalsupplychainresponsibilitycolombia_updatejuly2018.pdf
3 See corporate.vattenfall.com/globalassets/corporate/sustainability/doc/ origin_of_hard_coal_sept2018.pdf
MonitoringInitial risk assessment Audit
Initial risk assessment of country,
sector and supplier
Audits, desktop reviews and/or site visits to evaluate the supplier’s
performance
Monitoring and follow-up of corrective actions to ensure
continuous improvement
Continuous improvement
Implementation process for Vattenfall’s Code of Conduct for Suppliers
1 2 3
156 Non-financial information VATTENFALL ANNUAL AND SUSTAINABILITY REPORT 2018

Purchasing categoriesVattenfall’s sourcing and purchasing activities are conducted in four streams: goods and services, commodity fuels (coal, biomass, gas and oil), directly sourced heat fuels, and nuclear fuel. We took several steps to improve and strengthen our processes in 2018, with an overview of the current state of our activities presented below.
Number of suppliers: ~33,000Number of site audits conducted: 6Share of new suppliers that have undergone social/environmental assessments: 94%1
Share of new suppliers from high-risk countries that have undergone social/environmental assessments: 100%
Number of suppliers: 10Number of site audits conducted: 7Share of new suppliers that have undergone social/environmental assessments: 100%Share of new suppliers from high-risk countries that have undergone social/environmental assessments: 100%
Nuclear fuel• Uranium supplies are, over time, equally spread among Namibia,
Canada, Australia, Kazakhstan and Russia. In a single year we may receive deliveries from a number of these countries.
• All uranium suppliers are regularly audited (every three to six years) and are continuously assessed if deviations or other events are reported or discovered during the contract period.
• Screening and approval of all nuclear fuel suppliers that made deliveries in 2018 were performed prior to delivery.
• Positive experience and gained insight from applying updated audit procedures that further integrate human rights issues. This will be used as a model for future audits based on a risk analysis.
• All findings and recommendations from audits are followed up between the regular audits.
• Management systems were generally at a high standard at nuclear fuel production facilities. No major findings were noted in 2018 among performed audits.
• Even in high-risk countries, we experienced transparency and access to all facilities included in our audit programmes.
• No sanctions currently affecting the nuclear supply chain.
Commodity fuels• Primary fuels include coal and biomass. Purchases of gas and oil
are limited.• The main sourcing countries are Russia (75%), USA (19%) and
Colombia (6%) for coal, and Estonia, Latvia, and USA for biomass. • The scope of sustainability assessments was not only broadened
but also deepened:– We performed a follow-up visit to Colombia with Bettercoal and
other Bettercoal Members. During the visit we engaged with, among others, relevant Colombian Ministries, mining compa-nies, local communities and labour unions.
– At the end of 2018, eight of the ten suppliers we publicly report on went through the Bettercoal assessment process, while the other two undertook to do so in the near future. The eight sup-pliers that went through the assessment process are in different stages, with some implementing the corrective action plan. For more information on where each of the companies is located, please see the Bettercoal website1.
• We engaged external stakeholders both directly and through Bettercoal. Examples include: – Meetings with stakeholder organisations such as PAX and
Forum Syd. – Meetings with government representatives, including the Dutch
and Swedish Ministries of Foreign Affairs, Colombia’s Minister of Mining, human rights advisors to the President of Colombia, and the Swedish, Dutch, and German embassies in Colombia, as well as SIDA and NIR.
– Meetings with various mining companies throughout the year, including Drummond, CNR, Prodeco and Cerrejon, on our Colombia report.
1 https://bettercoal.org/bettercoal-suppliers/
Goods and services• The main sourcing countries are Sweden, Germany and the Nether-
lands, with a small but increasing share of suppliers in Asia.• New suppliers from high-risk countries are assessed via third-
party site audits. All suppliers with total volume of more than SEK 3,000 are subject to sanction list screening (to the extent permit-ted by Swedish law). As part of this process, we identified some current and potential suppliers that are owned or controlled by suspected corrupt persons. In discussions with relevant internal stakeholders, mitigation of the risks was recommended, and several activities have been initiated including enhanced supplier risk assessment, continued sustainability audits and dialogues, and shortened payment time to ensure deliveries.
• In most audits conducted in Asia, significant risks continue to be identified in work environment–related areas, such as severe levels of overtime with respect to suppliers’ employees. Evidence and/or strong indications of forced labour was found in several audits in Malaysia and Thailand during 2017 and 2018. However, after intense collaboration with both suppliers, these issues were cor-rected, leading to successful cooperation with both of them in 2018.
• Developing an overtime guideline to be implemented in 2019.• In 2018 internal checks revealed that an existing supplier had
recently been placed on international sanction lists. This was dis-cussed with relevant internal experts and resulted in the decision to stop working with this supplier until the sanctions are lifted.
• The annual Share & Learn sessions conducted towards the end of 2017 with global strategic suppliers generated a variety of follow-up activities that were implemented throughout 2018, including initiatives on transparency of the CO2 footprint in the value chain.
Number of suppliers: 28Number of site audits conducted: 9Share of new suppliers that have undergone social/environmental assessments: 0%2 Share of new suppliers from high-risk countries that have undergone social/environmental assessments: No new suppliers from high-risk countries
Number of suppliers: ~120Number of site audits conducted: 11Share of new suppliers that have undergone social/environmental assessments: 58%Share of new suppliers from high-risk countries that have undergone social/environmental assessments: No new suppliers from high-risk countries
Heat fuels• Primary fuels include biomass and waste. Purchases of peat are
limited.• Approximately 80% of heat fuels are sourced locally from the
respective countries of operation. In Sweden there was one new supplier from a medium-risk country in 2018. No new suppliers from high-risk countries to Sweden or Germany in 2018.
• Continued integrating sustainability aspects in purchasing activi-ties, especially human rights aspects.
• Developed a holistic view of the supply chain view with regard to human rights and the environment.
• The new Code of Conduct for Suppliers is implemented in all new contracts and contract renewals.
• Performed screening audits of all new suppliers in Germany, including desktop assessments and/or site visits.
2 Coal only. One new supplier in 2018, from USA, that was not assessed.1 Scope includes suppliers from high-risk countries and those with contracts over EUR 10 million.
VATTENFALL ANNUAL AND SUSTAINABILITY REPORT 2018 157Non-financial information

TaxesTaxes are a key issue for us and for our stakeholders. We regard taxes as an important component of our commitment to grow in a sustainable, respon-sible, and socially inclusive way.
As a business we are subject to taxation in the countries we work in. The tax laws in these countries differ and are often complex and subject to interpretation by management and government authorities. Developments in the international tax area can lead to changes in the tax systems in the countries we work in, which can lead to added uncertainty. We strive to pay the correct amount of tax on the profits we earn and in the countries where we create the value that generates those profits.
Vattenfall has established a process for tax management and monitoring to ensure that its taxation is in accordance with the law and to manage our tax risk. The Group and Country Tax functions ensure that the Vattenfall Group’s business activities are conducted proactively and in accordance with laws and regulations, i.e., in a responsible manner. The Group Tax func-tion reports to the Board of Directors and Audit Committee on tax strategy and provides updates on tax regulations and the main challenges we face. The Board and Audit Committee receive quarterly updates on significant tax issues, such as the Group’s effective tax rate, tax provisions and compli-ance.
Tax trendsIn recent years we have seen a positive trend toward a more tax transparent landscape, which Vattenfall supports. Vattenfall’s Tax function participates in various CSR and tax transparency projects and networks.
Vattenfall has submitted the country-by-country reporting that is required by law in all of the countries where Vattenfall operates.
Vattenfall’s tax strategyTo be able to assess the tax effects of business transactions across the Vattenfall Group, management and employees need a basic understanding of Vattenfall’s view of tax risks.
Vattenfall’s tax strategy is approved by the Board of Directors and is to be updated and approved on a yearly basis. The tax strategy focuses on compliance and efficiency. Vattenfall conducts tax planning to the extent required to secure an efficient handling of taxes within the constraints of the tax law. Vattenfall does not conduct any aggressive tax planning activi-ties and does not have any business activities in countries listed as tax havens. Vattenfall aims for an open and transparent relationship with the tax authorities and also to be transparent towards other external stakehold-ers. When possible, Vattenfall enters into country-specific tax enhanced relationship systems, with the benefits of a direct contact in the local Tax Authority, higher tax certainty, and no tax audit risks or exposures.
For more details about the tax strategy and policy, see corporate.vatten-fall.com/about-vattenfall/strategy-and-objectives/.
Vattenfall as a taxpayerVattenfall’s business generates considerable tax revenue for the national, regional, and local authorities in the countries we work in. In addition to cor-porate income tax, Vattenfall pays taxes on production, employment and property. In many of the countries in which we operate, these non-income- based taxes account for a majority of the tax revenues. In the income state-ment they are included as operating expenses, which entails that corporate income taxes are only part of the total taxes paid by Vattenfall.
Total taxes reported in Vattenfall’s income statement for 2018 amounted to SEK 6.9 billion and are outlined below. Corporate income taxes amounted to SEK 1.7 billion.
Effective tax rateVattenfall’s effective tax rate in 2018 was 14.3%, expressed as a percentage of consolidated profit before tax. This corresponds to SEK 1,996 million. See Note 13 to the Consolidated accounts for more information. When required, financial statements for the respective local companies are prepared and generally contain similar reconciliations of the effective tax rate.
The Group’s future tax cost and effective tax rate may be affected by several factors, including changes in tax laws and their interpretation, tax reforms in progress that have yet to be enacted into law, and the effects of acquisitions, divestments and any restructuring of our operations.
Total taxes paid by typeTaxes reported in the 2018 income statement, SEK 6.9 billion
SEK million Sweden Germany Netherlands Other Total
Personnel-related taxes1 1,926 859 267 53 3,105
Property tax 1,745 45 25 69 1,884
Income tax2 1,458 –230 209 276 1,713
Other taxes 103 47 26 0 176
Nuclear capacity tax 0 0 0 0 0
Total taxes paid 5,232 721 527 398 6,8781 Including social security costs.2 Does not include deferred income taxes.
Total taxes 2018SEK 6.9 billion, shown per tax type
Total taxes paid by regionTax history by country
SEK million Sweden Germany Netherlands Other Total
2018 5,232 721 527 398 6,878
2017 7,473 2,729 457 95 10,754
2016 9,894 2,157 316 53 12,419
Personnel-related taxes, 45% Property taxes, 27% Income taxes, 25% Other taxes, 3% Nuclear capacity tax, 0%
Human Resources
Diversity & Inclusion (D&I) at VattenfallVattenfall is a strong advocate for human rights and equal opportunity. We have integrated gender equality in recruitment strategies and governance principles, and we strongly believe that diversity and inclusion enables us to better understand customers’ expectations and makes us a better partner in the communities we serve. Vattenfall’s D&I strategy enables us to work for an open and inclusive culture, increasing awareness throughout our company.
In 2018 we committed to a number of different D&I initiatives. The first, Equal by 30, promotes equal pay, equal leadership, and equal opportunities for women in the energy transition. Our goal is to have the same gender composition in management positions as the company as a whole, thus enhancing equal leadership and contributing to the UN Sustainable Develop-ment Goal of Gender Equality. One target area in our strategy is to decrease the gap between female and male managers. In 2018 women represented more than 33% of all managerial hires, increasing the share of female manag-ers to 24% from 23% in 2017 (compared to 24% for the company as a whole in 2018).
The second initiative is a commitment to include equal rights for LGBTIs into our business and to develop policies to make equal rights and oppor-tunities more visible and practical for our employees and customers. We
believe that having diversity in work groups results in a greater variety of perspectives, which leads to more innovation and better results. To ensure equal opportunities and raise awareness, we have developed training material for our employees, and all executive managers have participated in a D&I workshop. In addition, we run a female coaching programme, participate in several mentoring programmes, and collaborate with external partners to enhance our knowledge.
Vattenfall has also appointed a Diversity & Inclusion Officer, on a two-year rotation among members of the Executive Group Management. In September 2018 we celebrated Diversity Day at Vattenfall for the first time, honouring diversity and inclusion through various activities such as panel discussions, lectures, and exhibitions displaying our figures on gender representation. We measure inclusion among all employees through tar-geted questions in our employee surveys and support our company-wide “Diverse Energy” networks.
Vattenfall’s remuneration policy Vattenfall’s remuneration policy supports the Group’s strategic direction and HR strategy. It aims to enable the organisation to foster an engaging and high-performance culture while securing relevant and diverse compe-tences and talents.
158 Non-financial information VATTENFALL ANNUAL AND SUSTAINABILITY REPORT 2018

Employee key ratios1
No. of employees Women Men –29 30–49 50–
Managers 1,833 24% 76% 1% 56% 43%
Country
Sweden 8,890 26% 74% 10% 50% 40%
Germany 6,563 22% 78% 10% 41% 48%
Netherlands 3,398 24% 76% 7% 58% 35%
Other 1,058 26% 74% 17% 67% 17%
Total 19,910 24% 76% 10% 49% 41%
Of which, part-time 1,650 20% 5%
Of which, temporary 618 3% 3%1 The composition of the Board of Directors is 29% women and 71% men. See pages 80–81.
0,0
0,5
1,0
1,5
2,0
2,5
3,0
1817161514
LTIF internal employees 2014–2018
0
2
4
6
8
10
181716
%Employee turnover, %
Bruise, 15.6% Fracture, 12.9% Strain, 12.9% Cuts, Laceration, Puncture, 12.2% Swelling, 6.1% Burn, 4.8% Abrasion, 2.7% Foreign body in eye or skin, 1.4% Inflammation, 1.4% Hearing, Sight, 1.4% Amputation, 0.7% Rash, 0.7% Other, 27.2%
Types of injuries
LTIF1 – Lost Time Injury Frequency for employeesSweden Germany Netherlands Total2
LTIF internal employees 1.9 1.8 2.4 1.9
Fatal accidents 2 0 0 2
LTI external (contractors)3 35 20 8 71
Fatal accidents 0 0 0 0
Sick leave per country 2018
Men 2.0% 5.2% 4.2% 3.5%
Women 4.3% 6.8% 6.9% 5.4%
Total 2.6% 5.6% 4.8% 4.0%1 LTIF is expressed in terms of the number of lost time work injuries (per 1 million hours worked),
i.e., work-related accidents resulting in absence longer than one day, and accidents resulting in fatality. Per-tains only to Vattenfall’s employees.
2 Includes Denmark and the UK.3 Since the contractor LTIF cannot be calculated with sufficient reliability, only LTI is reported.
During the year a Health & Safety maturity model was implemented in parts of the organisation, which contributed to a reduction in LTIF. The model enables more proactive Health & Safety work. The maturity model will con-tinue to be rolled out to other parts of the organisation in the coming years.
Training and educationSweden Germany Netherlands Total
Training days per employee 1.6 2.3 2.8 1.9
Training cost per employee (EUR) 831 1,011 776 890
Tracking injury type allows us to identify problem areas and prioritise initiatives that will have the greatest impact on reducing injuries.
The remuneration policy outlines the general guidelines for compensation and benefits at Vattenfall and draws from the guidelines for Swedish state-owned companies.
Remuneration objectives and structure Remuneration at Vattenfall is to be fair and consistent, and reflective of the local market, local laws and collective agreements1. It should also take into account individual performance, Group objectives and professional com-petency. Variable salary programmes strengthen the connection between performance and reward and help to attract, retain and motivate employ-ees on all levels. The programmes are structured in accordance with local laws, collective agreements and market conditions and therefore may differ from country to country. For more information, see Note 42.
Developing competent and engaged employees We encourage our employees to actively develop their skills and com-petences as part of our work on building a high-performance culture. Employee development is key to Vattenfall’s future success, and we rely on our people to take personal initiative for their continuous development. Toward this end, we offer a wide range of training opportunities including a carefully selected pallet of courses in a number of topic areas to strengthen both their professional and personal skills. In line with our strategic direc-tion to accelerate digitalisation in Vattenfall, we also offer different kinds of e-learning courses and e-books.
1 98% of employees are covered by collective bargaining agreements at the Group level.
VATTENFALL ANNUAL AND SUSTAINABILITY REPORT 2018 159Non-financial information

EnvironmentWe have set a goal to make fossil free living possible within one generation. This goal, together with our purpose – to Power Climate Smarter Living – is driving our transformation, whereby we are gradually phasing out fossil fuels, increasing the share of renewables and improving resource efficiency. Reducing climate impact is one of the top priorities in Vattenfall’s strategy and one of our most important environmental aspects.
To further strengthen our environmental work, we adopted a new environmental policy in 2018 that includes strong commitments in three important areas: Become climate neutral, Protect nature and biodiversity, and Sustainable use of resources. To make it even clearer and show how we deliver on the policy commitments in a short-term perspective, an action plan for internal work has been developed. The plan consolidates 15 key actions that are ongoing and planned within the three focus areas in the policy. The new policy aims to inspire us internally, but also our partners and customers.
The foundation for success in reaching our goal and purpose is a strong environmental management and culture, which is why the plan also has a fourth focus area including environmental awareness on all levels of the company.
Goals coupled to the EU 2020 targets Vattenfall informs the Swedish Parliament yearly via the Government Offices on the company’s progress in relation to the EU’s 2020 targets. The three relevant targets for Vattenfall are the CO2 emissions reduction target, the renewable energy target, and the energy efficiency target.
Environmental management Vattenfall’s environmental management system is part of the Vattenfall Management System (VMS). At year-end 2018, 99.8% of our electricity generation and 98.0% of our heat production came from facilities with certified environmental management systems, all of them according to ISO 14001 or EMAS. The remaining facilities pertain to a very limited number of back-up installations. Our environmental activities are governed by our environmental policy and operational instructions that describe the principles for environmental governance and environmental management. Accountability within environment is also described in the management systems. Being certified is an important part in gaining authorities’ trust and in delivering on customers’ requirements.
Vattenfall’s environmental governance and activities are also assessed by independent research and ratings companies that supply investors and customers with information. For example, in 2018 we kept our EcoVadis Gold Rating1 and received an improved overall score and an environmental score that corresponds to the top three per cent of assessed companies in our category.
Reduce climate impactReducing climate impact includes taking a holistic view on climate-related emissions. Our main environmental impact comes from
the CO2 emissions from our operations, but our measures cover our entire value chain.
CO2 emissions By reducing our emissions to 21 million tonnes of CO2 by 2020 and being CO2-neutral in the Nordic countries by 2030, Vattenfall is taking concrete steps towards the Group-wide ambition of making fossil free living pos-sible within one generation. The target for 2020 is set on a pro rata basis to reflect Vattenfall’s share of ownership in the various operations.
We believe that openness and transparency are a central part of our environmental work, and as part of this we have chosen to voluntarily report climate-related data and information to CDP2. Our Climate Score has improved significantly from year to year since we first began reporting to CDP, and we are striving to continue this upward trend. In 2018 we scored an A- (on a scale of A to F), which is above the industry average and among the leading utilities.
Direct emissions still make up our largest impact, but upstream and downstream emissions also account for a significant share in our value chain. We will therefore continue to work on reducing these emissions together with our suppliers, customers and partners. With a special focus on transports, we have committed to electrifying our own vehicle fleet until end of 2021, and we already compensate for our business travel through purchases and cancellation of CO2 certificates in the UN’s Clean Develop-ment Mechanism system. In 2018, this compensation amounted to about 25,000 tonnes of CO2.
Renewable energy Our renewable energy target is to install at least 2,300 MW of a cumulative new capacity from 2016 to 2020. In 2018 Vattenfall installed 101 MW of new renewable energy capacity, resulting in combined new capacity of 752 MW from 2016 to 2018. The Aberdeen Bay (97 MW) offshore wind farm in Scotland was inaugurated in September. We have also installed 3.8 MW of solar capacity. For more information, see the Wind section on page 43.
Biodiversity Our operations have direct impacts on biodiversity, such as through land use, alteration of natural landscapes, and emissions. We therefore assess biodiversity early in the planning of new projects, and we always strive to minimise any negative impacts. For impacts that cannot be fully avoided or mitigated, compensation measures are considered in discussion with the authorities and other stakeholders (such as local communities) as part of the permitting process. A responsible approach to these issues is impor-tant for nature conservation and for gaining acceptance from local commu-nities. It also reduces the risk for project delays and permitting obstacles.
1 See corporate.vattenfall.com/globalassets/corporate/sustainability/doc/ ecovadis_sustainability_profile_20-8-2018.pdf
2 Formerly Carbon Disclosure Project.
Vattenfall’s total CO2 emissions in 2018 amounted to 22.0 Mtonnes pro rata.
0
5
10
15
20
25
30
201820172016201520140
30
60
90
120
150
180
CO2 emissions1Vattenfall’s carbon footprint, MtCO2e
Scope 1: 22.6 Mton, Emissions include CO2, SF6 och N2O. 0.2 Mton CO2-equivavlents consist of SF6 and N2O.
Scope 2: 0.1 Mton (market based emission factors), the majority of energy used is bought from Vattenfall’s own production facilities and therefore booked as Scope 1.
Scope 3: 19.8 Mton, Emissions in Scope 3 includes fuel production and transports, non-fuel procurement, business travel and emissions linked to fuel sales to customers.
Emissions factors have been obtained from the IPCC Fifth Assessment Report, aver-age national grid factors from the Association of Issuing Bodies and Scope 3 emis-sions calculated from lifecycle data and information from suppliers.
All numbers are consolidated.
0
5
10
15
20
25Scope 2
Scope 3
Scope 1
CustomersVattenfallSuppliers
1 Data for 2014 to 2016 does not include the lignite operations.
CO2 Mtonnes CO2 g/kWh
160 Non-financial information VATTENFALL ANNUAL AND SUSTAINABILITY REPORT 2018
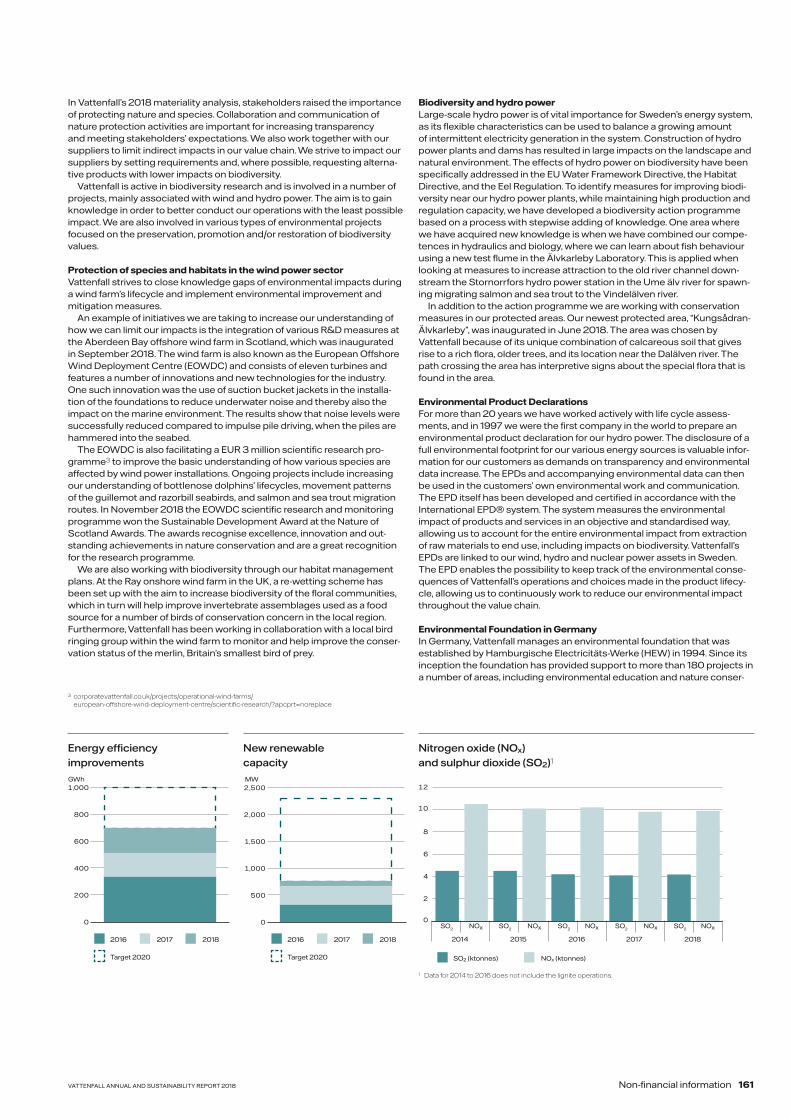
0
2
4
6
8
10
12
20182017201620152014
SO2 NOx SO2 NOx SO2 NOx SO2 NOx SO2 NOx
Nitrogen oxide (NOx) and sulphur dioxide (SO2)1
Energy efficiency improvements
New renewable capacity
0
200
400
600
800
1,000GWh
0
500
1,000
1,500
2,000
2,500MW
SO2 (ktonnes) NOx (ktonnes)
2016 2016
Target 2020 Target 2020
2017 2017
1 Data for 2014 to 2016 does not include the lignite operations.
In Vattenfall’s 2018 materiality analysis, stakeholders raised the importance of protecting nature and species. Collaboration and communication of nature protection activities are important for increasing transparency and meeting stakeholders’ expectations. We also work together with our suppliers to limit indirect impacts in our value chain. We strive to impact our suppliers by setting requirements and, where possible, requesting alterna-tive products with lower impacts on biodiversity.
Vattenfall is active in biodiversity research and is involved in a number of projects, mainly associated with wind and hydro power. The aim is to gain knowledge in order to better conduct our operations with the least possible impact. We are also involved in various types of environmental projects focused on the preservation, promotion and/or restoration of biodiversity values.
Protection of species and habitats in the wind power sector Vattenfall strives to close knowledge gaps of environmental impacts during a wind farm’s lifecycle and implement environmental improvement and mitigation measures.
An example of initiatives we are taking to increase our understanding of how we can limit our impacts is the integration of various R&D measures at the Aberdeen Bay offshore wind farm in Scotland, which was inaugurated in September 2018. The wind farm is also known as the European Offshore Wind Deployment Centre (EOWDC) and consists of eleven turbines and features a number of innovations and new technologies for the industry. One such innovation was the use of suction bucket jackets in the installa-tion of the foundations to reduce underwater noise and thereby also the impact on the marine environment. The results show that noise levels were successfully reduced compared to impulse pile driving, when the piles are hammered into the seabed.
The EOWDC is also facilitating a EUR 3 million scientific research pro-gramme3 to improve the basic understanding of how various species are affected by wind power installations. Ongoing projects include increasing our understanding of bottlenose dolphins’ lifecycles, movement patterns of the guillemot and razorbill seabirds, and salmon and sea trout migration routes. In November 2018 the EOWDC scientific research and monitoring programme won the Sustainable Development Award at the Nature of Scotland Awards. The awards recognise excellence, innovation and out-standing achievements in nature conservation and are a great recognition for the research programme.
We are also working with biodiversity through our habitat management plans. At the Ray onshore wind farm in the UK, a re-wetting scheme has been set up with the aim to increase biodiversity of the floral communities, which in turn will help improve invertebrate assemblages used as a food source for a number of birds of conservation concern in the local region. Furthermore, Vattenfall has been working in collaboration with a local bird ringing group within the wind farm to monitor and help improve the conser-vation status of the merlin, Britain’s smallest bird of prey.
Biodiversity and hydro power Large-scale hydro power is of vital importance for Sweden’s energy system, as its flexible characteristics can be used to balance a growing amount of intermittent electricity generation in the system. Construction of hydro power plants and dams has resulted in large impacts on the landscape and natural environment. The effects of hydro power on biodiversity have been specifically addressed in the EU Water Framework Directive, the Habitat Directive, and the Eel Regulation. To identify measures for improving biodi-versity near our hydro power plants, while maintaining high production and regulation capacity, we have developed a biodiversity action programme based on a process with stepwise adding of knowledge. One area where we have acquired new knowledge is when we have combined our compe-tences in hydraulics and biology, where we can learn about fish behaviour using a new test flume in the Älvkarleby Laboratory. This is applied when looking at measures to increase attraction to the old river channel down-stream the Stornorrfors hydro power station in the Ume älv river for spawn-ing migrating salmon and sea trout to the Vindelälven river.
In addition to the action programme we are working with conservation measures in our protected areas. Our newest protected area, “Kungsådran-Älvkarleby”, was inaugurated in June 2018. The area was chosen by Vattenfall because of its unique combination of calcareous soil that gives rise to a rich flora, older trees, and its location near the Dalälven river. The path crossing the area has interpretive signs about the special flora that is found in the area.
Environmental Product DeclarationsFor more than 20 years we have worked actively with life cycle assess-ments, and in 1997 we were the first company in the world to prepare an environmental product declaration for our hydro power. The disclosure of a full environmental footprint for our various energy sources is valuable infor-mation for our customers as demands on transparency and environmental data increase. The EPDs and accompanying environmental data can then be used in the customers’ own environmental work and communication.The EPD itself has been developed and certified in accordance with the International EPD® system. The system measures the environmental impact of products and services in an objective and standardised way, allowing us to account for the entire environmental impact from extraction of raw materials to end use, including impacts on biodiversity. Vattenfall’s EPDs are linked to our wind, hydro and nuclear power assets in Sweden. The EPD enables the possibility to keep track of the environmental conse-quences of Vattenfall’s operations and choices made in the product lifecy-cle, allowing us to continuously work to reduce our environmental impact throughout the value chain.
Environmental Foundation in Germany In Germany, Vattenfall manages an environmental foundation that was established by Hamburgische Electricitäts-Werke (HEW) in 1994. Since its inception the foundation has provided support to more than 180 projects in a number of areas, including environmental education and nature conser-
3 corporate.vattenfall.co.uk/projects/operational-wind-farms/ european-offshore-wind-deployment-centre/scientific-research/?apcprt=noreplace
2018 2018
VATTENFALL ANNUAL AND SUSTAINABILITY REPORT 2018 161Non-financial information

vation (projects in urban areas and small watercourses). The foundation is operated as an independent non-profit association under civil law. Thanks to Vattenfall’s support of administrating the foundation, all earnings from the foundation’s capital are used to fund environmental projects.
Environmental risk management To protect the environment and reduce our environmental impact we put special emphasis on assessing the environmental risks associated with our operations. Another important issue involves monitoring relevant legislative changes in order for us to be able to draw up action plans at an early stage, if necessary.
We have long worked with climate-related risks, but to further improve our preparedness for the consequences of climate change we imple-mented climate change risks in the risk management procedure in 2018. This means our businesses will now report and assess how climate change will impact their operations and business. For more details, see Risk Man-agement, page 65.
Sustainable use of resourcesVattenfall will take an active role in the development towards a circular economy. We will do this by providing renewable energy, developing new business models that enable our customers and partners to improve their resource footprint and by rethinking our internal processes to minimise our own use of resources.
In our operations we use many different types resources e.g., energy, fuel, water, construction materials, and chemicals, and our activities also gener-ate effluents, emissions, waste and by-products. Our resource footprint lies both within our own operations and in our supply chain. We therefore consider resource efficiency already in the design phase, choose Best Available Technologies, and continuously work to reduce environmental impacts based on a lifecycle perspective, including decommissioning of assets such as wind turbines, for example.
Other emissions Apart from CO2, we focus specifically on reducing emissions of sulphur dioxide (SO2), nitrogen oxides (NOx) and particulates resulting from the combustion of fossil fuels and biomass in our power plants. During con-struction, operation and dismantling of our power plants and networks, we take necessary measures to reduce noise and particulate emissions. We use innovative technologies to comply with all legal emission thresholds and to improve our environmental performance. This includes: • Primary measures such as targeted mixing of coal quality (SO2) or com-
bustion controlling (NOx, CO) to reduce combustion emissions • Secondary measures such as electrostatic precipitators or filter bags
(particulates), flue gas desulphurisation (SO2) and DENOX (NOx) to clean flue gas
• Noise abatement walls and facades or encapsulation of units to dampen noise from our operations
• Using combined heat and power (CHP) plants to improve fuel efficiency and reduce specific emissions. In addition, expansion of district heating is replacing large numbers of single heating units with high specific emissions
• The shift to biomass, which reduces both CO2 and SO2 emissions • The use of power-to-heat is replacing fossil-based heating and eliminat-
ing associated emissions
As we reduce and eventually eliminate the use of fossil fuels, the associated emissions will be likewise reduced.
Energy efficiency improvementWe have set a target to achieve a cumulative total of more than 1,000 GWh in annual energy efficiency improvements for the period 2016–2020. In 2018 we achieved 694 GWh in efficiency improvements, mainly through upgrades of hydro power plants and distribution networks and by replacing local boil-ers with district heating. Vattenfall is working continuously to improve energy efficiency by changing to more efficient components, expanding district heating networks and helping customers to become energy-efficient.
The laws that have been enacted as a result of the EU Energy Efficiency Directive require all large companies to conduct energy audits to identify cost-effective energy saving measures. Such audits have been conducted or are in progress in Vattenfall, in line with national implementation require-ments. To a large extent Vattenfall goes beyond the requirements of these laws through certified Energy Management Systems ISO 50001 or by adapting certified Environmental Management Systems, meaning that energy efficiency becomes a part of our systematic environmental work. Vattenfall also offers energy audits to customers.
Sustainable office buildings Our vision to enable fossil free living within one generation also guides us in how we act in a modern working environment. Accordingly, we are focusing on optimising energy and office space use as well as waste avoidance and innovative service solutions that go along with our environmental policy. By setting sustainability guidelines in Vattenfall’s Real Estate Standard for our offices, we ensure to apply these requirements for new and existing buildings and make them relevant for our suppliers, too. Furthermore, employees are encouraged to behave in a way that is better for the environment, and our offices should be easy to reach via access to public transportation.
Water management Cooling water Vattenfall’s nuclear power plants and fossil-based power plants require large amounts of cooling water. So-called through cooling is used at plants where large volumes of water, like river or sea water, are available. Otherwise, cool-ing towers are used, which have closed cooling cycles and use considerably less water. Vattenfall complies with all applicable regulations on water qual-ity, and the outlet water temperature is strictly controlled to protect aquatic fauna and flora from any potential harm caused by temperature variations.
Wastewater Wastewater from Vattenfall’s installations is carefully cleaned and con-stantly monitored – a process that also includes comprehensive laboratory controls. No untreated wastewater is discharged into watercourses.
Waste management Waste is generated during the operation and maintenance of power plants, electricity and heating grids, and during construction and dismantling of power generation systems. In addition, residual products such as ash, slag and gypsum are produced in combustion plants. Offices generate small amounts of waste as well. Depending on the waste content and national legislation, waste is classified either as hazardous or non-hazardous. Radio-active waste is a special form of waste produced from operations at nuclear power plants. See Radioactive waste.
Vattenfall works in accordance with the waste hierarchy. Waste is identi-fied, classified and managed within the framework of the applicable national laws. At the local level, various activities are conducted to prevent and reduce waste as well as to optimise reuse and recycling rates as far as possible.
Combustion residues Residual products such as ash, slag and gypsum are produced from the combustion of solid fuels such as hard coal, biomass and waste. The volumes produced are directly related to how much fuel is used. More than 90% of residual products are re-used and sold to the construction industry as secondary raw material for cement, concrete or asphalt production. The remainder is sent to landfills.
Radioactive waste Vattenfall operates nuclear power plants in Sweden and Germany. It is the operator’s responsibility to have reliable solutions for managing nuclear waste. All of Vattenfall’s facilities that handle radioactive waste have operat-ing guidelines and procedures for management and disposal.
High-level, long-life radioactive waste, consisting primarily of spent nuclear fuel and core components, must be carefully shielded during handling and transportation. When the waste is stored, it is encapsulated to prevent spreading of contamination. The type and location of storage depends on the radioactive level of the waste. The entire waste handling process is strictly regulated and monitored. At Vattenfall’s nuclear power plants, all employees who have access to radiologically controlled areas complete training in radiation protection. The radioactive waste system and how to minimise radioactive waste are themes included in the training. Waste operators and personnel at production plants who work with waste handling also participate in special training programmes.
Chemicals Chemicals are used in all our operations on a daily basis. To reduce the risk for harmful effects on health and the environment, Vattenfall is working continuously to eliminate or replace hazardous chemicals. We also urge our suppliers to do the same. During 2018 a decision was taken to strengthen our substitution work, both internally and towards suppliers. We therefore developed a new, stricter, restriction list for hazardous substances and will work to implement this into all operations starting in 2019.
162 Non-financial information VATTENFALL ANNUAL AND SUSTAINABILITY REPORT 2018

Waste from construction and demolition make up a small portion compared with the residues that are created at combustion plants. 1 Includes fly ash from waste incineration.
ktonnes Hazardous waste1 Non-hazardous waste Ash from coal Ash from biomass Slag from waste incineration Gypsum
2018 59 98 578 38 170 185
2017 61 145 671 37 168 169
Waste and residues (ktonnes)
Re-use (sold on the market)
Recovery
Landfill
0
100
200
300
400
500
600
GypsumSlag from wasteincineration
Ash frombiomass
Ash fromcoal
Non-hazardouswaste
Hazardouswaste
Total withdrawals and discharges of water (million m3)
Purchased water 2.8 (2.1)
Groundwater 0.1 (0.1)
Fresh surface water 2,292 (2,728)
Sea water 10,222 (9,671)
Sold process water 0.3 (0.4)Treated wastewater to water bodies 1.1 (1.2)
Evaporation 11.4 (8.9)
Cooling water to fresh surface water 2,279 (2,698)
Cooling water to the sea 10,222 (9,671)
Vattenfall
Discharges Withdrawals
Total 12,516 (12,401) Total 12,514 (12,380)
VATTENFALL ANNUAL AND SUSTAINABILITY REPORT 2018 163Non-financial information

GRI Index and supplementary disclosures
About this report Vattenfall’s Annual and Sustainability Report is a report in which informa-tion about the company’s work with sustainability issues and outcomes is described together with the company’s financial performance.
Vattenfall has been reporting in accordance with the Global Reporting Initiative (GRI) Guidelines since 2003. For 2018 Vattenfall adheres to the GRI Standards and reports according to the Core option. This means that Vattenfall has identified the aspects that are material for the company and reports at least one indicator per aspect. Omitted information is reported in the GRI Index on pages 165–167. Certain aspects, such as water, effluents and waste, are most relevant at the local level and are not as material at the Group level. No Group targets are currently defined for these areas; instead, they are steered and managed locally. Reporting on local com-munities focuses on the business areas and topics where Vattenfall’s operations have the greatest impact on local communities. Vattenfall’s overall ambition for its sustainability reporting is that it will be transparent and relevant. The GRI Index indicates where information about Vattenfall’s reporting in accordance with GRI can be found in the Annual and Sustain-ability Report.
Reporting profile and scope The Annual and Sustainability Report (ASR) describes the areas in which the Group has considerable environmental, social and financial impacts. Reporting on local communities does not correspond exactly to the GRI guidelines; instead, examples are used from the most relevant opera-tions to describe Vattenfall’s impact and handling. Vattenfall’s activities, performance and results are reported as an integrated part of Vattenfall’s strategy. The reporting covers all of the Vattenfall Group’s operations during the 2018 financial year, unless indicated otherwise, and the figures provided pertain to the 2018 financial year. Vattenfall reports sustainability data annually in the ASR, and the preceding year’s report was published on 28 March 2018.
Boundaries Vattenfall has limited its reporting to the areas in which the company has full control over data collection and information quality, which entails all operations of the company unless indicated otherwise. While GRI Stand-ards entail a greater focus on impacts along the entire value chain, the company cannot yet measure data outside of its own operations in a reli-able manner; instead, activities connected to both suppliers and custom-ers are described. Important events and information about changes in the organisation during the year are provided on pages 8–9 and 77. Changes in Vattenfall’s supply chain are described on pages 156–157. Changes in the capital structure and other changes in capital are described in Note 38 to the Consolidated accounts, Specifications of equity. The limitations and changes in the reporting are also described in the respective sections or in comments to diagrams and tables. Vattenfall uses different definitions of “supplier” and “new supplier” for its four purchasing streams reported on page 157. A supplier of goods and services is defined as an entity providing goods and services to Vattenfall and whose paid invoices exceeded SEK 3,000 in 2018.
For commodity fuels, a coal supplier is an entity that delivered coal to Vattenfall’s power plants for own use. A supplier of biomass, nuclear fuel or heat fuels is an entity that Vattenfall has a contract with. For all categories, a new supplier is an entity that did not previously have a contractual relation-ship with Vattenfall and which signed its first contract with us during the 2018 reporting period.
Data collection and accounting policies Environmental data is collected via the Group’s environmental reporting process. Group-wide definitions are used for all environmental parameters to enhance quality. Accounting policies for the financial reporting are described in Note 3 to the Consolidated accounts, Accounting policies. The principles of consolidation for environmental data are the same as for financial data. Consolidation includes subsidiaries in which Vattenfall AB owns shares corresponding to more than 50% of the voting rights or in some other way has control. Absolute CO2 emissions are also reported in accordance with Vattenfall’s share of ownership in the respective plants. Reported CO2 emissions are calculated based on fuel consumption. It should be noted that the calculation methods differ from country to coun-try. The calculation methods are set by national legislation, with ties to the
EU Emissions Trading System. All other emissions have either been meas-ured or calculated based on periodically recurring measurements. Figures for energy and water consumption are based, like all environmental data, on the production units’ own reporting. Depending on the size and type of operation, the measurement equipment differs from unit to unit. How-ever, all reporting is to be in accordance with the Group-wide definitions and principles. The employee data that is presented is based on verified figures from Vattenfall’s annual accounts. Vattenfall uses contractors to a considerable extent, but does not report the number of those persons due to the difficulty in obtaining quality data for this type of reporting. Significant corrections of last year’s figures have been commented in notes at the affected information.
Statutory sustainability reporting Vattenfall is subject to statutory sustainability reporting in accordance with the Swedish Annual Accounts Act. The statutory sustainability report is found in the following sections of the Vattenfall Annual and Sustainability Report and meets the reporting requirements for the environment, social conditions and personnel, human rights and anti-corruption: • Strategic targets, pages 10–11• Business model and value creation, pages 14–17• Integrity and risk management, pages 60–66• Internal governance, pages 75–77• Materiality analysis and stakeholders, pages 152–154• Human rights, page 155 • Responsible sourcing and purchasing, pages 156–157• Human resources, pages 158–159• Environment, pages 160–163
External assurance The sustainability information in the Annual and Sustainability Report for 2018 has been reviewed by Vattenfall’s auditor, Ernst & Young. In addition, it has been approved by Vattenfall’s Board of Directors.
Sustainability initiatives and principles that the company has aligned itself with or supports, and important memberships in interest association and organisations The Vattenfall Group has adhered to the UN’s voluntary Global Compact since 2002 through the Swedish partnership for Global Responsibil-ity. Vattenfall has been a direct participant since 2008. Consequently, Vattenfall has undertaken to support the UN Global Compact and to adhere to the OECD Guidelines for Multinational Enterprises. The implementation and the monitoring of compliance to the Vattenfall Code of Conduct for Suppliers, based on the UN Global Compact, is in progress. Vattenfall also adheres to the UN Guiding Principles on Business and Human Rights. Vattenfall uses the Annual and Sustainability Report as its Communication on Progress for the UN Global Compact (UNGC), and a cross reference between the UN Global Compact and the GRI can be found in the GRI Index. The cross reference is primarily done to the DMA (disclosure on manage-ment approach) of each relevant aspect. If this connection is not possible or if the information is available on another page, the principle is directly linked to an indicator. In addition to these undertakings, Vattenfall has opted to align itself with a number of voluntary sustainability initiatives and organi-sations at the Group level. Examples of these include: • CSR Europe• Business for Social Responsibility (BSR) • The World Economic Forum • WindEurope• EV100• Fossilfritt Sverige (Fossil-free Sweden)• Re-Source• Dutch Covenant in respect of improvements in the coal supply chain• Equal by 30• SDG LGBTI Manifesto
Vattenfall conducts its operations primarily in northwest Europe (Sweden, Germany, the Netherlands, Denmark, the UK, France, and Finland). These countries have all ratified the International Labour Organization’s (ILO) eight fundamental conventions. A country that has ratified an ILO convention must regularly report on its performance to the ILO.
164 Non-financial information VATTENFALL ANNUAL AND SUSTAINABILITY REPORT 2018

GRI Standard
Disclosure number Disclosure title
Page number(s) and/or URL(s) Omission
UNGC Principle(s)
GRI 102: General Disclosure 2016
Organizational profile
102-1 Name of the organization Cover, Note 1
102-2 Activities, brands, products, and services 2–3 8–9: Environment
102-3 Location of headquarters 2, 71
102-4 Location of operations 2–3
102-5 Ownership and legal form 2
102-6 Markets served 3
102-7 Scale of the organization 2, 4
102-8 Information on employees and other workers 158–159 6: Labour
102-9 Supply chain 156–167
102-10 Significant changes to the organization and its supply chain
8–9, 156–157
102-11 Precautionary Principle or approach 64–65, 160 All principles
102-12 External initiatives 164
102-13 Membership of associations 164
EU1 Installed capactiy 176–178
EU2 Energy production, net 176–178
EU3 Numbers of customers 2, 176–178
EU4 Length of transmission and distribution lines, based on voltage
176–177
EU5 Allocation of CO2 emission allowances 176–177
Strategy
102-14 Statement from senior decision-maker 6–7
Ethics and integrity
102-16 Values, principles, standards, and norms of behavior
58–61, 76–77, 155–156, 158–159
All principles
Governance
102-18 Governance structure 70–83
Stakeholder engagement
102-40 List of stakeholder groups 154
102-41 Collective bargaining agreements 154 3: Labour
102-42 Identifying and selecting stakeholders 154
102-43 Approach to stakeholder engagement 154
102-44 Key topics and concerns raised 154
Reporting practice
102-45 Entities included in the consolidated financial statements
164
102-46 Defining report content and topic Boundaries 164
102-47 List of material topics 153
102-48 Restatements of information 164
102-49 Changes in reporting 164
VATTENFALL ANNUAL AND SUSTAINABILITY REPORT 2018 165Non-financial information
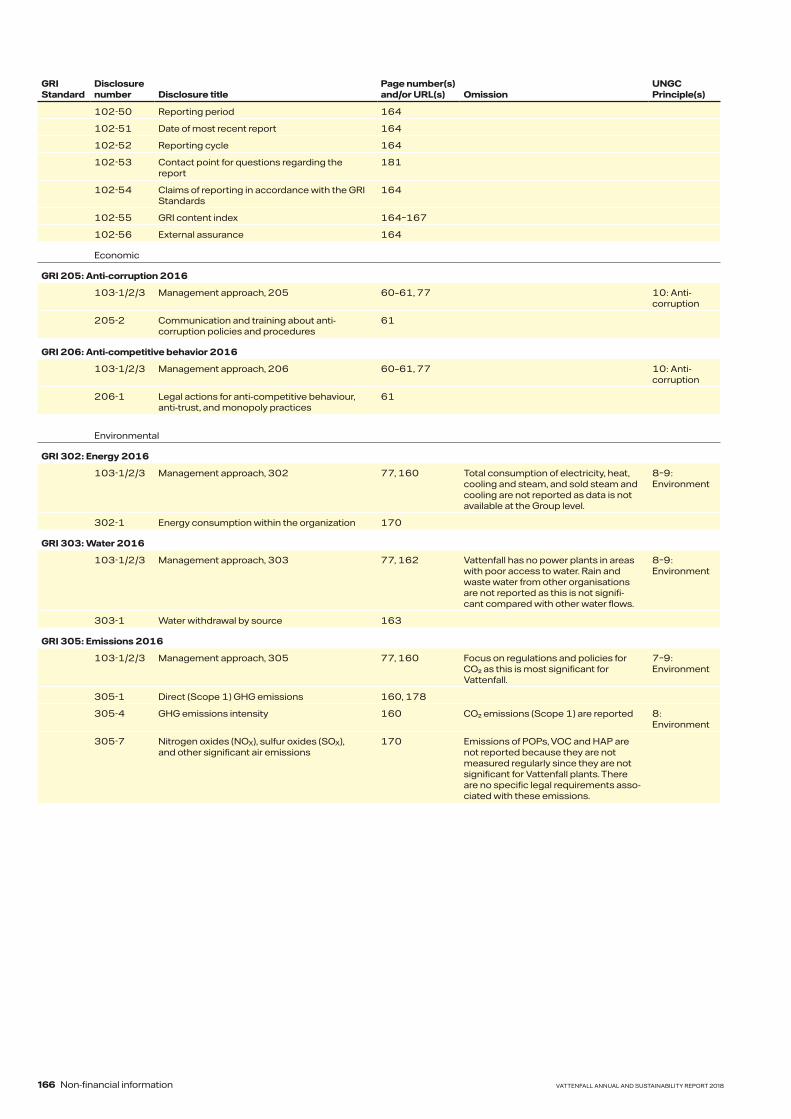
GRI Standard
Disclosure number Disclosure title
Page number(s) and/or URL(s) Omission
UNGC Principle(s)
102-50 Reporting period 164
102-51 Date of most recent report 164
102-52 Reporting cycle 164
102-53 Contact point for questions regarding the report
181
102-54 Claims of reporting in accordance with the GRI Standards
164
102-55 GRI content index 164–167
102-56 External assurance 164
Economic
GRI 205: Anti-corruption 2016
103-1/2/3 Management approach, 205 60–61, 77 10: Anti- corruption
205-2 Communication and training about anti- corruption policies and procedures
61
GRI 206: Anti-competitive behavior 2016
103-1/2/3 Management approach, 206 60–61, 77 10: Anti- corruption
206-1 Legal actions for anti-competitive behaviour, anti-trust, and monopoly practices
61
Environmental
GRI 302: Energy 2016
103-1/2/3 Management approach, 302 77, 160 Total consumption of electricity, heat, cooling and steam, and sold steam and cooling are not reported as data is not available at the Group level.
8–9: Environment
302-1 Energy consumption within the organization 170
GRI 303: Water 2016
103-1/2/3 Management approach, 303 77, 162 Vattenfall has no power plants in areas with poor access to water. Rain and waste water from other organisations are not reported as this is not signifi-cant compared with other water flows.
8–9: Environment
303-1 Water withdrawal by source 163
GRI 305: Emissions 2016
103-1/2/3 Management approach, 305 77, 160 Focus on regulations and policies for CO2 as this is most significant for Vattenfall.
7–9: Environment
305-1 Direct (Scope 1) GHG emissions 160, 178
305-4 GHG emissions intensity 160 CO2 emissions (Scope 1) are reported 8: Environment
305-7 Nitrogen oxides (NOX), sulfur oxides (SOX), and other significant air emissions
170 Emissions of POPs, VOC and HAP are not reported because they are not measured regularly since they are not significant for Vattenfall plants. There are no specific legal requirements asso-ciated with these emissions.
166 Non-financial information VATTENFALL ANNUAL AND SUSTAINABILITY REPORT 2018

GRI Standard
Disclosure number Disclosure title
Page number(s) and/or URL(s) Omission
UNGC Principle(s)
Electric Utility Sector-Specific-Environmental Social Indicators
EN21 Nitrogen oxides (NOX), sulfur oxides (SOX), and other significant air emissions
170
GRI 306: Effluents and Waste 2016
103-1/2/3 Management approach, 306 28–29, 162 8–9: Environment
306-1 Water discharge by quality and destination 163
306-2 Waste by type and disposal method 163
Electric Utility Sector-Specific-Environmental Performance Indicators
EN23 Waste by type and disposal method 170
GRI 308: Supplier Environmental Assessment 2016
103-1/2/3 Management approach, 308 156 7: Environment
308-1 New suppliers that were screened using environmental criteria
157
Social
GRI 403: Occupational Health and Safety 2016
103-1/2/3 Management approach, 403 58–60, 76–77 Data on gender for injury rate (LTIF) is unavailable. For contractors only LTI is reported as the number of hours worked is uncertain. Occupational dis-ease rate is not reported as the defini-tions differ between the countries.
1–2: Human rights4–6: Labour
403-2 Types of injury and rates of injury, occupational diseases, lost days, and absenteeism, and number of work-related fatalities
159
GRI 405: Diversity and Equal Opportunities 2016
103-1/2/3 Management approach, 405 58–60, 159 No reporting per minority group, as this is prohibited by rules in certain markets.
6: Labour
405-1 Diversity of governance bodies and employees 159
GRI 413: Local Communities 2016
103-1/2/3 Management approach, 413 153, 155 1–2: Human rights8–9: Environment
413-2 Operations with significant actual and potential negative impacts on local communities
37, 43, 50, 160–161
GRI 414: Supplier Social Assessment 2016
103-1/2/3 Management approach, 414 156
414-1 New suppliers that were screened using social criteria
156–157
Electric Utility Sector-Specific-Social Indicators
EU28 Power outage frequency 170
EU29 Average power outage duration 170
VATTENFALL ANNUAL AND SUSTAINABILITY REPORT 2018 167Non-financial information

Auditor’s Combined Assurance Report on Vattenfall AB’s Sustainability Report and statement regarding the Statutory Sustainability Report
This is the translation of the auditor’s report in Swedish. To Vattenfall AB, corp id 556036-2138
Introduction We have been engaged by the Board of Vattenfall AB to under-take a combined assurance engagement of Vattenfall AB’s Sustainability Report for the year 2018. Vattenfall AB has defined the scope of the Sustainability Report to the pages referred to in the GRI index on the pages 165–167. The Statutory Sustainability Report is defined on page 86.
Responsibilities of the Board and Executive Management The Board of Directors and Executive Management are responsi-ble for the preparation of the Sustainability Report including the Statutory Sustainability Report in accordance with applicable criteria and the Annual Accounts Act respectively. The criteria are defined on page 164 in the Sustainability Report and are part of the Sustainability Reporting Guidelines published by GRI (The Global Reporting Initiative) that are applicable to the Sustainabil-ity Report, as well as the accounting and calculation principles that the Company has developed. This responsibility includes the internal control relevant to the preparation of a Sustainability Report that is free from material misstatements, whether due to fraud or error.
Responsibilities of the auditor Our responsibility is to express a conclusion on the Sustainability Report based on the assurance procedures we have performed and to express an opinion regarding the Statutory Sustainability Report. Our engagement is limited to historical financial informa-tion and does therefore not include future oriented information.
We conducted our engagement in accordance with ISAE 3000 Assurance engagements other than audits or reviews of historical financial information. The engagement includes a limited assurance engagement on the complete Sustainability Report and audit of the data that is specified below. The objective of an audit is to obtain reasonable assurance that the informa-tion is free of material misstatements. A reasonable assurance engagement includes examining, on a test basis, evidence sup-porting the quantitative and qualitative information in the Sustain-ability Report. A limited assurance engagement consists of mak-ing inquiries, primarily of persons responsible for the preparation of the Sustainability Report, and applying analytical and other limited assurance procedures. Our examination regarding the Statutory Sustainability Report has been conducted in accord-ance with FAR’s accounting standard RevR 12 The auditor’s opinion regarding the statutory sustainability report. A limited assurance engagement and an examination according to RevR 12 are different from and substantially less in scope than reason-
able assurance conducted in accordance with IAASB’s Standards on Auditing and other generally accepted auditing standards in Sweden.
The firm applies ISQC 1 (International Standard on Quality Control) and accordingly maintains a comprehensive system of quality control including documented policies and procedures regarding compliance with ethical requirements, professional standards and applicable legal and regulatory requirements. We are independent of Vattenfall AB in accordance with professional ethics for accountants in Sweden and have otherwise fulfilled our ethical responsibilities in accordance with these requirements.
The conclusion based on our limited assurance procedures and an examination according to RevR 12 does not provide the same level of assurance as the conclusion of our reasonable assurance procedures. Since this engagement is combined, our conclusions regarding reasonable assurance and limited assur-ance are presented separately below.
Our audit has consisted of following information:Outcome of the strategic targets, disclosed on page 11:
• Customer loyalty, NPS (Net Promoter Score)
• Commissioned renewables capacity
• Absolute CO2 emissions pro rata
• Work injuries, LTIF (Lost Time Injury Frequency)
• Employee Engagement Index
Our procedures are based on the criteria de¬fined by the Board of Directors and the Executive Management as described above. We consider these criteria suitable for the preparation of the Sustainability Report.
We believe that the evidence we have obtained is sufficient and appropriate to provide a basis for our conclusion below.
Conclusions Based on the limited assurance procedures we have performed, nothing has come to our attention that causes us to believe that the Sustainability Report is not prepared, in all material respects, in accordance with the criteria de-fined by the Board of Directors and Executive Management.
In our opinion the information in the Sustainability Report which has been subject to our reasonable assurance procedures have, in all material respects, been prepared in accordance with the criteria defined by the Board of Directors and Executive Man-agement.
A Statutory Sustainability Report has been prepared.
Stockholm, 19 March 2019Ernst & Young AB
Staffan Landén Outi Alestalo Authorised Public Accountant Expert member of FAR
168 Combined Assurance Report VATTENFALL ANNUAL AND SUSTAINABILITY REPORT 2018

169VATTENFALL ANNUAL AND SUSTAINABILITY REPORT 2018 Combined Assurance Report

Five-year overview of sustainability data 20145 2015 2016 2017 2018
Production and environment
Electricity generation 172.9 117.4 119 127.3 130.3
– of which, hydro power 34.3 39.5 34.8 35.6 35.5
– of which, nuclear power 49.9 42.2 46.9 51.9 55.0
– of which, fossil power 82.7 29.2 30.8 31.9 31.6
– of which, wind power 4.1 5.8 5.8 7.6 7.8
– of which, biomass and waste 2 0.7 0.7 0.4 0.4
Energy consumption, TWh
Gas 31.7 27.7 32.5 36.8 38.6
Hard coal 35.2 46.1 43.9 42.1 41.1
Lignite 153.5 3.2 3.2 1.5 —
Peat 0.4 0.5 0.5 0.4 0.6
Waste (non-biogenic) 2.9 1.8 1.9 1.2 1.2
Biomass, waste (biogenic) 7.1 4.3 4.6 3.7 3.9
Other fuels, including oil 5.7 1.5 1.5 1.5 1.7
Uranium (tonnes) 119 143 119.6 105.9 118.0
Emissions to air (Scope1)1
Carbon dioxide (CO2), Mtonnes 82.7 23.9 23.7 23.0 22.56
Specific CO2 emissions, g/kWh 421 172 170 157 150
Biogenic CO22, Mtonnes 2.4 1.5 1.6 1.3 1.3
Nitrogen oxides (NOx), ktonnes 52.8 10.1 10.2 9.8 9.9
Specific NOx emissions, g/kWh 0.271 0.073 0.073 0.066 0.066
Specific NOx emissions (only combustion plants), g/kWh 0.474 0.196 0.196 0.187 0.194
Sulphur dioxide (SO2), ktonnes3 53.1 4.5 4.2 4.1 4.2
Specific SO2 emissions, g/kWh3 0.272 0.032 0.030 0.028 0.028
Specific SO2 emissions (only combustion plants), g/kWh3 0.476 0.087 0.081 0.078 0.082
Particulate matter (PM), ktonnes 1.7 0.3 0.3 0.3 0.2
Specific PM emissions, g/kWh 0.008 0.002 0.002 0.002 0.001
Specific PM emissions (only combustion plants), g/kWh 0.015 0.005 0.005 0.006 0.004
Carbon dioxide (CO2), Mtonnes (Scope 2) — — 0.1 0.1 0.1
Carbon dioxide (CO2), Mtonnes (Scope 3) — — 19.9 19.6 19.8
Waste and by-products, ktonnes
Hazardous waste 123 76 106 61 59
Non-hazardous waste 416 128 133 145 98
Ash from coal 5,912 790 775 671 579
Ash from biomass 42.3 38.3 41.3 37.4 38.4
Slag from waste incineration 245 229 237 168 170
Gypsum 3,000 193 208 169 185
Radioactive waste
Low and medium radiactive operational waste, m3 2,251 3,353 1,013 912 829
Core components, tonnes 10 7 17 15 31
Spent nuclear fuel, tonnes 193 197 124 175 137
SAIDI (minutes/customer)
Sweden 177 212 150 125 187
Germany 15 11 10 11 15
SAIFI (number/customer)
Sweden 2.4 2.2 2.1 1.8 2.9
Germany 0.2 0.2 0.2 0.2 0.3
Our people
Number employees, FTE 30,181 28,567 19,935 20,041 19,910
– of which females 6,983 6,399 4,773 4,827 4,840
– of which temporary employed (not permanent contract) 882 761 550 609 618
Sick leave
men, % 3.7% 4.1% 3.5% 3.6% 3.5%
women, % 5.0% 5.8% 5.4% 5.7% 5.4%
Work-related accidents
Internal LTIF (employees) 2.7 2.6 2.0 1.5 1.9
External LTI4 (contractors) — 133 101 80 71
170 VATTENFALL ANNUAL AND SUSTAINABILITY REPORT 2018

Quarterly overview
2017 2018
Amounts in SEK million Q11 Q21 Q31 Q41 Q1 Q2 Q3 Q4
Income statement items
Net sales 40,112 29,307 27,354 38,342 44,328 31,959 32,489 48,048
EBITDA 9,783 8,718 5,900 9,999 10,938 6,888 7,854 8,662
Operating profit (EBIT) 6,091 4,399 2,115 5,920 6,975 2,775 3,680 4,189
Underlying operating profit 8,408 4,826 2,757 7,213 9,359 3,770 2,127 4,627
Financial income 581 658 340 1,091 206 2,372 –64 373
Financial expenses –1,586 –1,773 –1,644 –3,422 –1,902 –1,647 –1,435 –1,519
Profit before income taxes 5,087 3,283 811 3,589 5,279 3,500 2,181 3,042
Profit for the period 3,829 2,097 749 2,808 4,158 2,967 1,782 3,100
– of which, attributable to owners of the Parent Company 3,267 1,853 695 2,519 3,691 2,377 1,668 2,421
– of which, attributable to non-controlling interests 562 244 54 289 467 590 114 679
Cash flow items
Funds from operations (FFO) 8,307 6,809 5,001 6,527 8,758 4,006 3,246 7,265
Cash flow from operating activities –1,161 6,789 15,550 4,550 1,259 15,215 18,816 5,764
Free cash flow –3,627 4,111 12,782 –175 –1,165 12,002 15,973 766
Balance sheet items
Cash and cash equivalents and short-term investments 39,308 42,813 34,166 26,897 32,492 35,449 41,186 40,071
Equity 85,780 88,358 89,454 92,332 97,815 99,194 104,213 103,597
– of which, attributable to owners of the Parent Company 70,460 72,763 73,935 77,085 82,587 83,812 89,085 88,096
– of which, attributable to non-controlling interests 15,320 15,595 15,519 15,247 15,228 15,382 15,128 15,501
Interest-bearing liabilities 96,013 111,994 91,911 87,154 97,497 93,832 84,182 88,275
Net debt 54,681 67,167 56,841 59,260 64,353 57,754 42,384 47,728
Adjusted net debt 127,051 123,263 113,288 124,360 130,900 125,182 109,273 112,324
Provisions 138,092 124,311 124,593 131,680 134,576 138,319 137,175 136,642
Noninterest-bearing liabilities 83,083 75,614 83,979 97,966 97,211 113,945 138,287 134,094
Capital employed, average 252,783 237,491 234,726 241,635 247,383 250,821 244,992 250,283
Balance sheet total 402,968 400,277 389,937 409,132 427,099 445,290 463,857 462,6081 Certain amounts have been recalculated compared with previously published information in Vattenfall’s
2017 Annual and Sustainability Report as a result of new accounting rules (IFRS 9 and 15) that took effect in 2018. See Note 2 to the consolidated accounts, Important changes in the financial statements compared with the preceding year.
20145 2015 2016 2017 2018
Gender diversity
Female managers, % 18% 19% 22% 23% 24%
Share of managers per age category total
–29 2% 1% 1% 1% 1%
30–49 54% 52% 56% 58% 56%
50– 45% 46% 43% 40% 43%
1 Emissions are presented in accordance to financial accounting and consolidated.2 CO2 emissions from combustion of biomass.3 2017 SO2 values have been corrected.4 As the Contractor LTIF calculation is not reliable enough, only LTI is reported.5 Values for 2014 are including the divested lignite operation.6 Total greenhouse emissions amount to 22.6 Mtonnes, 0.15 Mtonnes consist of SF6 and N2O emissions.
Characterisation factors are obtained from the IPCC Fifth Assessment report.
Five-year overview of sustainability data – cont.
VATTENFALL ANNUAL AND SUSTAINABILITY REPORT 2018 171

2017 2018
Amounts in SEK million Q12 Q22 Q32 Q42 Q1 Q2 Q3 Q4
Key ratios in % unless otherwise stated. (x) means times.
Operating margin 15.2 15.0 7.7 15.4 15.7 8.7 11.3 8.7
Operating margin1 21.0 16.5 10.1 18.8 21.1 11.8 6.5 9.6
Pre-tax profit margin 12.7 11.2 3.0 9.4 11.9 11.0 6.7 6.3
Pre-tax profit margin1 18.5 12.7 5.3 12.7 17.3 7.7 1.9 7.2
Return on equity –41.1 1.4 2.4 11.1 11.2 11.5 12.4 11.9
Return on capital employed –1.1 4.2 4.2 7.7 7.8 7.1 7.9 7.0
Return on capital employed1 8.7 9.7 9.9 9.6 9.9 9.2 9.2 7.9
EBIT interest cover, (x) – 0.5 2.2 2.2 3.3 3.3 3.0 3.4 4.3
EBIT interest cover, (x)1 5.0 4.9 5.2 4.1 4.0 3.9 3.9 4.9
FFO interest cover, (x) 6.9 6.9 7.1 5.4 5.2 4.9 4.7 6.5
FFO interest cover, net, (x) 7.9 7.1 7.5 6.9 6.4 6.0 5.8 7.8
Cash flow interest cover after maintenance investments, (x) 6.8 4.8 6.7 3.5 3.8 5.3 6.0 9.1
FFO/gross debt 27.7 24.5 29.6 30.6 27.8 25.9 26.8 26.4
FFO/net debt 48.7 40.8 47.9 45.0 42.1 42.1 53.2 48.8
FFO/adjusted net debt 21.0 22.3 24.1 21.4 20.7 19.4 20.6 20.7
EBITDA/net financial items, (x) 12.4 8.0 6.0 6.0 8.4 7.3 10.4 21.2
EBITDA/net financial items, (x)1 15.4 8.0 6.7 6.7 10.2 8.4 8.3 22.0
Equity/total assets 21.3 22.1 22.9 22.6 22.9 22.3 22.5 22.4
Gross debt/equity 111.9 126.8 102.7 94.4 99.7 94.6 80.8 85.2
Net debt/equity 63.7 76.0 63.5 64.2 65.8 58.2 40.7 46.1
Gross debt/gross debt plus equity 52.8 55.9 50.7 48.6 49.9 48.6 44.7 46.0
Net debt/net debt plus equity 38.9 43.2 38.9 39.1 39.7 36.8 28.9 31.5
Net debt/EBITDA, (x) 2.4 2.4 2.1 1.7 1.8 1.7 1.2 1.4
Adjusted net debt/EBITDA, (x) 5.5 4.4 4.1 3.6 3.7 3.7 3.1 3.3
Other information
Investments 4,023 4,922 5,173 7,176 3,284 5,558 4,036 9,035
Electricity generation, TWh 36.6 28.3 27.3 35.1 37.2 29.4 27.8 35.9
Sales of electricity, TWh 45.2 34.6 33.9 43.6 49.8 36.2 38.1 50.0
Sales of heat, TWh 7.6 3.2 1.9 6.1 8.2 2.4 1.9 5.8
Sales of gas, TWh 23.1 8.9 5.9 18.5 25.9 8.0 5.3 18.0
Number of employees, full-time equivalents 19,892 19,806 20,140 20,041 20,031 19,959 19,951 19,9101 Based on Underlying operating profit, that is, Operating profit excluding Items affecting comparability.2 Certain amounts have been recalculated compared with previously published information in Vattenfall’s
2017 Annual and Sustainability Report as a result of new accounting rules (IFRS 9 and 15) that took effect in 2018. See Note 2 to the consolidated accounts, Important changes in the financial statements compared with the preceding year.
172 VATTENFALL ANNUAL AND SUSTAINABILITY REPORT 2018

Ten-year overview
2009 2010 2011 2012 2013 2014 2015 2016 2017 2018
Income statement items
Net sales 205,407 213,572 181,040 167,313 172,253 165,945 143,576 139,208 135,1143 156,824
EBITDA 51,777 60,706 54,538 54,271 43,554 41,038 30,604 27,209 34,3993 34,341
Operating profit (EBIT) 27,938 29,853 23,209 25,958 –6,218 –2,195 –5,069 1,337 18,5243 17,619
Underlying operating profit 31,294 36,838 30,793 27,530 28,135 24,133 20,529 21,697 23,2033 19,883
Financial income 2,814 2,514 3,843 2,636 1,416 2,590 2,755 1,767 2,670 2,887
Financial expenses –13,018 –10,944 –12,754 –10,476 –10,453 –8,635 –7,531 –8,149 –8,425 –6,503
Profit before income taxes 17,734 21,423 14,298 18,118 –15,255 –8,240 –9,845 –5,045 12,7693 14,003
Profit for the year 13,448 13,185 10,416 17,047 –13,543 –8,284 –19,766 –26,004 9,4843 12,007
– of which, attributable to owners of the Parent Company 12,896 12,997 11,083 16,759 –13,668 –8,178 –16,672 –26,324 8,3333 10,157
– of which, attributable to non-controlling interests 552 188 –667 288 125 –106 –3,094 320 1,151 1,850
Cash flow items
Funds from operations (FFO) 36,700 40,108 38,256 34,419 31,888 32,131 29,009 28,186 26,6433 23,275
Cash flow from operating activities 46,246 41,231 33,468 28,485 37,843 40,146 40,934 30,783 25,728 41,054
Free cash flow 27,566 23,846 17,637 12,619 23,579 23,234 25,013 19,217 13,091 27,575
Balance sheet items
Cash and cash equivalents and short-term investments 56,940 43,873 28,685 46,495 27,261 45,068 44,256 43,292 26,897 40,071
Equity 142,404 133,621 138,931 149,372 130,718 128,462 115,956 83,800 92,3323 103,597
– of which, attributable to owners of the Parent Company 135,620 126,704 131,988 140,764 120,370 115,260 103,984 68,272 77,0853 88,096
– of which, attributable to non-controlling i nterests 6,784 6,917 6,943 8,608 10,348 13,202 11,972 15,528 15,2473 15,501
Interest-bearing liabilities 213,494 188,277 170,350 160,261 126,488 125,928 110,585 96,667 87,154 88,275
Net debt 154,987 144,109 141,089 111,907 98,998 79,473 64,201 50,724 59,260 47,728
Adjusted net debt 205,028 173,409 176,031 154,335 162,590 158,291 137,585 124,741 124,360 112,324
Provisions 91,100 87,822 91,719 103,832 118,166 138,567 138,263 138,344 131,680 136,642
Noninterest-bearing liabilities 155,129 131,712 123,558 114,899 110,112 104,252 97,513 90,449 88,2003 134,094
Capital employed, average — — 317,799 313,124 302,743 293,992 279,435 248,640 240,7783 250,283
Balance sheet total 602,127 541,432 524,558 528,364 485,484 497,209 462,317 409,260 409,1323 462,608
Key ratios in % unless otherwise stated. (x) means times.
Operating margin 13.6 14.0 12.8 15.5 –3.6 –1.3 –3.5 1.0 13.73 11.2
Operating margin1 15.2 17.2 17.0 16.5 16.3 14.5 14.3 15.6 17.2 12.7
Return on equity 9.5 10.0 8.6 12.3 –11.4 –6.9 –16.8 –33.4 11.13 11.9
Return on capital employed — — 7 8.3 –2.1 –0.8 –1.8 0.5 7.7 7.0
Return on capital employed1 — — 10 8.8 9.3 8.2 7.3 8.7 9.63 7.9
EBIT interest cover, (x) 3.1 4.1 2.6 3.7 –0.7 –0.1 –0.8 0.5 3.3 4.3
EBIT interest cover, (x)1 3.4 5.0 3.3 3.9 4.1 5.0 4.8 4.6 4.1 4.9
FFO interest cover, (x) 4.8 6.2 4.9 5.7 5.4 7.3 6.5 6.5 5.4 6.5
FFO interest cover, net, (x) 5.6 7.5 5.8 6.6 6.2 10.1 9.4 7.7 6.9 7.8
FFO/gross debt 17.2 21.3 22.5 21.5 25.2 25.5 23.2 27.8 30.6 26.4
FFO/net debt 23.7 27.8 27.1 30.8 32.2 40.4 39.9 53.0 45.03 48.8
FFO/adjusted net debt 18 23.1 21.7 22.3 19.6 20.3 18.6 21.6 21.43 20.7
Equity/total assets 23.7 24.7 26.5 28.3 26.9 25.9 25.1 20.5 22.63 22.4
Gross debt/equity 149.9 140.9 122.6 107.3 96.8 98.0 95.4 115.4 94.43 85.2
Net debt/equity 108.8 107.8 101.6 74.9 75.7 61.9 55.4 60.5 64.23 46.1
Gross debt/gross debt plus equity 60.0 58.5 55.1 51.8 49.2 49.5 48.8 53.6 48.63 46.0
Net debt/EBITDA, (x) 3.0 2.4 2.6 2.1 2.3 1.9 2.1 1.9 1.7 1.4
Adjusted net debt/EBITDA, (x) 4 2.9 3.2 2.8 3.7 3.9 4.5 4.6 3.6 3.3
Other information
Dividend to owners of the Parent Company 5,240 6,500 4,433 6,774 — — — — 2,000 2,0002
Investments 102,989 41,794 35,750 29,581 27,761 29,032 25,776 21,921 21,2943 21,913
Electricity generation, TWh 158.9 172.4 166.7 178.9 181.7 172.9 117.4 119.0 127.3 130.3
Sales of electricity, TWh 194.6 194.2 209.4 205.5 203.3 199.0 197.2 193.2 157.3 174.1
Sales of heat, TWh 37.9 47.1 41.6 29.8 30.3 24.1 20.6 20.3 18.9 18.3
Sales of gas, TWh 20.0 63.2 53.8 52.4 55.8 45.5 50.7 54.8 56.3 57.2
Number of employees, full-time equivalents 36,593 38,459 37,679 33,059 31,819 30,181 28,567 19,935 20,041 19,9101 Based on Underlying operating profit, that is, Operating profit excluding Items affecting comparability.2 Proposed dividend.3 The value has been recalculated compared with previously published information in Vattenfall’s 2017
Annual and Sustainability Report as a result of new accounting rules (IFRS 9 and 15) that took effect in 2018. See Note 2 to the consolidated accounts, Important changes in the financial statements compared with the preceding year.
VATTENFALL ANNUAL AND SUSTAINABILITY REPORT 2018 173

Definitions and calculations of key ratios
The key ratios are presented as percentages (%) or times (x) and are based on full year 2018.
Alternative Performance Measures In order to ensure a fair presentation of the Group’s operations, the Vattenfall Group uses a number of Alternative Performance Measures that are not defined in IFRS or in the Swedish Annual Accounts Act. The Alternative Performance Measures that Vattenfall uses are described below, including their definitions and how they are calculated. The Alternative Performance Measures used are unchanged compared with earlier periods.
EBIT – Operating profit (Earnings Before Interest and Tax)
EBITDA – Operating profit before depreciation, amortisation and impair-ment losses (Earnings Before Interest, Tax, Depreciation and Amortisa-tion)
Items affecting comparability – Capital gains and capital losses from shares and other non-current assets, impairment losses and reversed impairment losses and other material items that are of an infrequent nature. Also included here are, for trading activities, unrealised changes in the fair value of energy derivatives, which according to IFRS 9 cannot be recognised using hedge accounting and unrealised changes in the fair value of inventories. See Consolidated income statement for a specifica-tion of items affecting comparability.
Underlying EBITDA – Underlying operating profit before depreciation, amortisation and impairment losses. This measure is intended to provide a better view on the operating result by excluding items affecting com-parability that are of an infrequent nature, while also excluding non-cash depreciation and amortisation.
Underlying operating profit – Operating profit (EBIT) excluding items affecting comparability. This measure is intended to provide a better view on the operating result by excluding items affecting comparability that are of an infrequent nature.
FFO – Funds From Operations, see Consolidated statement of cash flow
Free cash flow – Cash flow from operating activities less maintenance investments
Interest-bearing liabilities – See Consolidated balance sheet – Supple-mentary Information
Net debt – See Consolidated balance sheet – Supplementary Information
Adjusted net debt – See Consolidated balance sheet – Supplementary Information
Capital employed – Total assets less financial assets, noninterest-bearing liabilities and certain other interest-bearing provisions not included in adjusted net debt. see Consolidated balance sheet – Supplementary Information
Other definitionHybrid Capital – Perpetual subordinated securities, junior to all Vattenfall’s unsubordinated debt instruments.
LTIF – Lost Time Injury Frequency (LTIF) is expressed in terms of the num-ber of lost time work injuries (per 1 million hours worked), i.e., work-related accidents resulting in absence longer than one day, and accidents resulting in fatality.
174 VATTENFALL ANNUAL AND SUSTAINABILITY REPORT 2018

Calculations of key ratios
Operating margin, % = 100 xEBIT 17,619
= 11.2Net sales 156,824
Operating margin excl itemsaffecting comparability, % = 100 x
Underlying EBIT 19,883= 12.7
Net sales 156,824
Pre-tax profit margin, % = 100 xProfit before income taxes 14,003
= 8.9Net sales 156,824
Pre-tax profit margin excl itemsaffecting comparability, % = 100 x
Profit before income taxes excl items affecting comparability 14,227= 9.1
Net sales 156,824
Return on equity, % = 100 xProfit for the period attributable to owner of the Parent Company 10,157
= 11.9Average equity for the period attributable to owner of the Parent Company excl the Reserve for cash flow hedges
85,500
Return on capital employed, % = 100 xEBIT 17,619
= 7.0Capital employed, average 250,283
Return on capital employed exclitems affecting comparability, % = 100 x
Underlying EBIT 19,883= 7.9
Capital employed, average 250,283
EBIT interest cover, (x) =EBIT + financial income excl return from the Swedish Nuclear Waste Fund 18,476
= 4.3Financial expenses excl discounting effects attributable to provisions 4,264
EBIT interest cover excl itemsaffecting comparability, (x) =
Underlying EBIT + financial income excl return from the Swedish Nuclear Waste Fund 20,740 = 4.9Financial expenses excl discounting effects attributable to provisions 4,264
FFO interest cover, (x) =FFO + financial expenses excl discounting effects attributable to provisions 27,539
= 6.5Financial expenses excl discounting effects attributable to provisions 4,264
FFO interest cover, net, (x) =
FFO + financial items net excl discounting effects attributable to provisions and return from the Swedish Nuclear Waste Fund 26,682
= 7.8Financial items net excl discounting effects attributable to provisions and return from the Swedish Nuclear Waste Fund
3,407
Cash flow interest cover aftermaintenance investments, (x) =
Cash flow from operating activities less maintenance investments + financial expenses excl discounting effects attributable to provisions and interest components related to pension costs 30,995 = 9.1Financial expenses excl discounting effects attributable to provisions and interest components related to pension costs
3,420
FFO/gross debt, % = 100 xFFO 23,275
= 26.4Interest-bearing liabilities 88,275
FFO/net debt, % = 100 xFFO 23,275
= 48.8Net debt 47,728
FFO/adjusted net debt, % = 100 xFFO 23,275
= 20.7Adjusted net debt 112,324
EBITDA/net financial items, (x) =EBITDA 34,341
= 10.1Financial items net excl discounting effects attributable to provisions and return from the Swedish Nuclear Waste Fund
3,407
EBITDA excl items affectingcomparability/net financial items, (x) =
EBITDA excl items affecting comparability 36,469= 10.7Financial items net excl discounting effects attributable to
provisions and return from the Swedish Nuclear Waste Fund3,407
Equity/total assets, % = 100 xEquity 103,597
= 22.4Balance sheet total 462,608
Gross debt/equity, % = 100 xInterest-bearing liabilities 88,275
= 85.2Equity 103,597
Net debt/equity, % = 100 xNet debt 47,728
= 46.1Equity 103,597
Gross debt/gross debt plusequity, % = 100 x
Interest-bearing liabilities 88,275= 46.0
Interest-bearing liabilities + equity 191,872
Net debt/net debt plusequity, % = 100 x
Net debt 47,728= 31.5
Net debt + equity 151,325
Net debt/EBITDA, (x) =Net debt 47,728
= 1.4EBITDA 34,341
Adjusted net debt/EBITDA, (x) =
Adjusted net debt 112,324= 3.3
EBITDA 34,341
VATTENFALL ANNUAL AND SUSTAINABILITY REPORT 2018 175

Facts about Vattenfall’s markets 20181
Sweden Finland Denmark Germany Netherlands UK Total
Installed capacity electricity, MW, 31 December 2018
Hydro power2 8,677 124 — 2,880 6 — 11,687
Nuclear power 7,223 — — — — — 7,223
Fossil-based power 699 — — 4,638 4,075 — 9,412
– of which, gas — — — 1,220 3,425 — 4,645
– of which, lignite — — — — — — —
– of which, hard coal — — — 2,877 650 — 3,527
– of which, oil and other 699 — — 540 — — 1,239
Wind power 356 — 337 588 201 1,077 2,559
Biomass, peat, waste 189 — — 45 2 — 236
Solar power — — — 2 10 5 17
Total 17,144 124 337 8,152 4,294 1,082 31,133
Installed capacity heat, MW, 31 December 2018 2,170 — — 7,915 1,225 — 11,310
Generated electricity, TWh
Hydro power2 31.6 0.4 — 3.5 — — 35.5
Nuclear power 55.0 — — — — — 55.0
Fossil-based power — — — 15.5 15.9 — 31.6
– of which, gas — — — 3.4 12.7 — 16.1
– of which, lignite — — — — — — —
– of which, hard coal — — — 11.9 3.2 — 15.1
– of which, oil and other — — — 0.3 — — 0.3
Wind power 0.9 — 0.9 2.6 0.4 3.0 7.8
Biomass, peat, waste 0.3 — — 0.2 — — 0.4
Solar power — — — — — — —
Total 87.9 0.4 0.9 21.9 16.4 3.0 130.3
Production of heat, TWh
Fossil–based heat 0.3 — — 12.8 1.6 — 14.7
– of which, gas — — — 7.5 1.6 — 9.1
– of which, lignite — — — — — — —
– of which, hard coal — — — 4.8 — — 4.8
– of which, oil and other 0.3 — — 0.6 — — 0.8
Biomass, peat, waste 3.1 — — 1.0 — — 4.2
Total heat Production 3.4 — — 13.9 1.7 — 18.9
Sales of electricity, TWh 91.8 3 0.5 1.1 61.04 19.0 0.7 174.1
Sales of Heat, TWh 3.1 — — 13.4 1.8 — 18.3
Sales of gas, TWh — — — 13.34 42.8 1.1 57.2
Number of retail customers 878,461 322,215 — 3,220,782 2,015,107 113,826 6,550,391
Electricity volume, TWh retail customers 8.5 2.4 — 8.9 6.9 0.7 27.4
Electricity volume, TWh resellers 3.7 0.6 0.6 24.6 — — 29.5
Electricity volume, TWh businesses 24.33 6.3 — 22.64 9.1 — 62.3
Number of network customers 965,601 — — 2,348,086 — — 3,313,687
Number of gas customers — — — 511,518 1,766,893 68,408 2,346,819
Electricity network
Transited volume, TWh 72.9 — — 13.1 — — 86.1
Distribution network, km 134,727 — — 35,090 — — 169,817
Number of employees (full-time equivalents)
Per country 8,890 83 290 6,563 3,398 464 19,688
Group total 19,910
CO2 emissions per country, Mtonnes 0.4 — — 14.1 7.9 — 22.5
CO2 emission allowances received, Mtonnes CO2/year 0.3 — — 1.1 0.1 — 1.5
176 VATTENFALL ANNUAL AND SUSTAINABILITY REPORT 2018

Facts about Vattenfall’s markets 20171
Sweden Finland Denmark Germany Netherlands UK Total
Installed capacity electricity, MW, 31 December 2017
Hydro power2 8,677 124 — 2,879 6 — 11,687
Nuclear power 7,226 — — — — — 7,226
Fossil-based power 699 — — 4,784 4,071 — 9,554
– of which, gas — — — 1,285 3,421 — 4,707
– of which, lignite — — — — — — —
– of which, hard coal — — — 2,866 650 — 3,516
– of which, oil 699 — — 632 — — 1,331
Wind power 375 — 338 588 201 981 2,483
Biomass, peat, waste 189 — — 45 2 — 236
Solar power — — — — 8 5 13
Total 17,166 124 338 8,297 4,288 986 31,198
Installed capacity heat, MW, 31 December 2017 2,183 — — 7,689 1,248 — 11,120
Generated electricity, TWh
Hydro power2 32.3 0.5 — 2.8 — — 35.6
Nuclear power 51.9 — — — — — 51.9
Fossil-based power — — — 16.6 15.3 — 31.9
– of which, gas — — — 3.5 12.1 — 15.6
– of which, lignite — — — 0.3 — — 0.3
– of which, hard coal — — — 12.4 3.2 — 15.6
– of which, oil — — — 0.3 — — 0.3
Wind power 1.1 — 1.1 2.5 0.4 2.6 7.6
Biomass, peat, waste 0.2 — — 0.2 — — 0.4
Solar power — — — — — — —
Total 85.5 0.5 1.1 22.0 15.7 2.6 127.3
Production of heat, TWh
Fossil-based heat 0.4 — — 13.6 1.5 — 15.5
– of which, gas — — — 6.7 1.5 — 8.2
– of which, lignite — — — 1.0 — — 1.0
– of which, hard coal — — — 5.5 — — 5.5
– of which, oil 0.4 — — 0.5 — — 0.9
Biomass, peat, waste 3.1 — — 1.0 — — 4.2
Total heat production 3.5 — — 14.7 1.6 — 19.7
Sales of electricity, TWh 89.63 3.1 1.3 43.54 18.9 0.6 157.3
Sales of heat, TWh 3.2 — — 14.0 1.7 — 18.9
Sales of gas, TWh — — — 12.4 43.4 0.5 56.3
Number of electricity customers 926,504 354,863 — 3,062,931 1,979,818 124,913 6,449,029
Electricity volume, TWh retail customers 8.8 2.6 — 8.1 7.1 0.3 26.9
Electricity volume, TWh resellers 3.7 0.6 0.6 20.5 — 0.3 25.6
Electricity volume, TWh businesses 25.13 5.4 — 17.14 8.9 — 56.6
Number of network customers 957,465 — — 2,332,978 — — 3,290,443
Number of gas customers — — — 537,257 1,735,226 71,078 2,343,561
Electricity network
Transited volume, TWh 72.5 — — 13.0 0 — 85.5
Distribution network, km 133,260 — — 34,710 0 — 167,970
Number of employees (full-time equivalents)
Per country 8,808 81 255 6,836 3,474 398 19,852
Group total 20,041
CO2 emissions per country, Mtonnes 0.3 — — 15.1 7.6 — 23.0
CO2 emission allowances received, Mtonnes CO2/year 0.3 — — 1.4 0.1 — 1.81 Rounding differences may be present for certain items.2 In Germany mainly pumped-storage power plants.3 Including sales in Norway.4 Including sales in France.
VATTENFALL ANNUAL AND SUSTAINABILITY REPORT 2018 177

Pro rata1
2018 Sweden Finland Denmark Germany Netherlands UK Total
Installed capacity electricity, MW, 31 December 2018
Hydro power2 8,470 124 — 2,880 6 — 11,479
Nuclear power 4,943 — — 2825 — — 5,225
Fossil-based power 699 — — 4,556 4,075 — 9,330
– of which, gas — — — 1,188 3,425 — 4,613
– of which, lignite — — — — — — —
– of which, hard coal — — — 2,828 650 — 3,478
– of which, oil and other 699 — — 540 — — 1,239
Wind power 285 — 336 322 273 1,004 2,219
Biomass, peat, waste 189 — — 34 2 — 225
Solar power — — — 2 10 5 17
Total 14,585 124 336 8,075 4,365 1,009 28,495
Installed capacity heat, MW, 31 December 2018 2,062 — — 7,475 1,225 — 10,762
Generated electricity, TWh
Hydro power2 30.8 0.4 — 3.5 — — 34.8
Nuclear power 37.7 — — 2.0 — — 39.7
Fossil-based power — — — 15.3 15.9 — 31.2
– of which, gas — — — 3.3 12.7 — 16.0
– of which, lignite — — — — — — —
– of which, hard coal — — — 11.7 3.2 — 14.9
– of which, oil and other — — — 0.3 — — 0.3
Wind power 0.7 — 0.9 1.4 0.6 2.7 6.3
Biomass, peat, waste 0.3 — — 0.2 — — 0.4
Solar power — — — — — — —
Total 69.5 0.4 0.9 22.3 16.5 2.7 112.3
CO2 emissions per country, Mtonnes 0.4 — — 13.7 7.9 — 22.0
Footnotes: For explanations, see page 177.
2017 Sweden Finland Denmark Germany Netherlands UK Total
Installed capacity electricity, MW, 31 December 2017
Hydro power2 8,470 124 — 2,879 6 — 11,479
Nuclear power 4,945 — — 2825 — — 5,227
Fossil-based power 699 — — 4,702 4,071 — 9,473
– of which, gas — — — 1,253 3,421 — 4,674
– of which, lignite — — — — — — —
– of which, hard coal — — — 2,817 650 — 3,467
– of which, oil and other 699 — — 632 — — 1,331
Wind power 304 — 336 322 273 907 2,142
Biomass, peat, waste 189 — — 34 2 — 224
Solar power — — — — 8 5 13
Total 14,607 124 336 8,220 4,360 912 28,558
Installed capacity heat, MW, 31 December 2017 2,072 — — 7,248 1,248 — 10,568
Generated electricity, TWh
Hydro power2 31.3 0.5 — 2.8 — — 34.6
Nuclear power 35.5 — — 1.1 — — 36.6
Fossil-based power — — — 16.3 15.3 — 31.6
– of which, gas — — — 3.4 12.1 — 15.6
– of which, lignite — — — 0.3 — — 0.3
– of which, hard coal — — — 12.2 3.2 — 15.4
– of which, oil and other — — — 0.3 — — 0.3
Wind power 0.9 — 1.1 1.3 0.6 2.3 6.2
Biomass, peat, waste 0.2 — — 0.1 — — 0.4
Solar power — — — — — — —
Total 67.9 0.5 1.1 21.7 15.9 2.3 109.3
CO2 emissions per country, Mtonnes 0.3 — — 14.7 7.6 — 22.6
Footnotes 1–4: For explanations, see page 177.
5 The technical capacity of Krummel nuclear power plant is 673 MW pro rata. However, Krummel has no authorisation for power operation and is therefore reported as zero capacity.
178 VATTENFALL ANNUAL AND SUSTAINABILITY REPORT 2018

Glossary
APX – Amsterdam Power Exchange. An energy exchange for the Netherlands, the UK and Belgium.
Aspect – GRI term that describes sustainability areas based on the categories Environment, Economy and Society.
Availability – Actual electricity generation in relation to the maximum possible generation.
Biomass – Renewable fuel, such as wood, bark and pine oil.
CHP (Combined Heat and Power) – A plant that produces both heat and electricity. In such a plant a large share of the primary energy is used for electricity and heat production, with little wasted heat.
CO2 – Carbon dioxide.
Derivative instrument – A financial instrument that is commonly used to manage risk. Its value and change in value is related to the underlying (derived) instrument. Examples of derivative instruments are options, forward contracts and swaps.
DMA – “Disclosures on Management Approach”. Describes why certain sustainability aspects are identified as material for the company and how steering and monitoring of these are conducted.
EEX – The European Energy Exchange. The German electricity exchange.
Efficiency – An efficiency rating indicates the relationship between energy output and the energy input in a system.
EPD – Environmental Product Declaration – a third-party environmental declaration in accordance with ISO 14025 (www.environdec.com).
EPEX –The spot market of EEX. Since 2009 part of EPEX Spot SE, Paris.
EU 27 – The 27 member states of the EU after its widening on 1 January 2007.
EU ETS – The EU Emissions Trading System. The EU’s trading system for CO2 emission allowances. The system sets a cap for emissions from businesses within the system and facilitates optimisation through trading in emission allowances.
Forward market – A market in which buyers and sellers agree on a set price for a future delivery of the underlying instrument, such as an electricity contract (see also derivative instrument).
Fossil fuels – Fuels based on hydrocarbons from ancient sedimentary layers – mainly coal, oil and natural gas.
Global Compact – The United Nations’ (UN’s) ten principles for companies surrounding human rights, labour issues, the environment and anti-corruption.
GRI – Global Reporting Initiative – a global standard for sustainability reporting.
Gross capacity – The electric output delivered directly from a plant’s generator. Measured in MW (Megawatt).
HOB (Heat only boiler) – A plant that produces heat for district heating as its sole output
IED (Industrial Emissions Directive) – An EU directive that sets higher demands on lowering emission levels and spills to soil and water.
IFRS – International Financial Reporting Standards – Vattenfall has been reporting in accordance with IFRS since 2005.
Indicator – GRI term that provides qualitative or quantitative information about the performance and development of the aspects that are identified as material for the company.
Installed capacity – The performance according to design data for power plants. Commonly measured in MW (Megawatt).
Intrapreneurship – An innovative process within an organisation, typically larger companies.
ISO 14001 – An international standard in the ISO 14000 series for establishing environmental management systems.
ISO 9001 – An international standard in the ISO 9000 series for establishing quality management systems.
LEC (Levelised Energy Cost) – The average cost of production per kilowatt hour electricity, calculated over the full life-time of the generating asset. The net present value method is used to discount future costs with the average cost of capital (WACC).
Life cycle analysis (LCA) – Methodology to establish a products’ total environmental impact during its life cycle, from raw material extraction, through manufacturing processes and usage, to waste management, including all transportation and energy consumption.
LTI (Lost Time Injury) – Work-related accidents resulting in absence longer than one day, and accidents resulting in fatality. Commonly expressed as LTIF, or Lost Time Injury Frequency, the number of such accidents per 1 million hours worked.
Margin call – Marginal security that the holding of a derivative position must pledge to cover the credit risk of its counterparty (OTC or exchange).
Merit order – The order in which production capacity at plants is used.
Net capacity – The electric output that a plant delivers to distribution networks, i.e. gross capacity less the energy used by the plant itself. Measured in MW (Megawatt).
Nominal capacity – The capacity that a generator is designed for. This concept is used mainly for electricity generation power plants, e.g., hydro power plants and wind turbines. Measured in MW (Megawatt).
Nord Pool – The Nordic electricity exchange. Started in Sweden and Norway in 1996.
VATTENFALL ANNUAL AND SUSTAINABILITY REPORT 2018 179

NOX – Collective term for nitrogen oxide, nitrogen dioxide and similar nitrogen compounds.
NPS (Net Promoter Score) – NPS is a score ranging from –100 to 100 that measures the willingness of customers to recom-mend a company’s products or services to others and is used to determine the customer’s overall satisfaction with a company and loyalty to the brand.
OHSAS 18000 – A series of standards that can be used as a basis for an occupational health and safety management system.
OTC (Over the Counter) – Trading outside of exchanges (directly or via brokers) in physical and financial contracts.
Peer-to-peer – Two or more individuals or customers can connect and transact directly, without going through a company.
Power-to-Heat – Converting electricity to heat using electric boilers combined with hot water storage. With Power-to-Heat systems, the excess power generated primarily from renewable energy can be utilised later as district heating.
Primary energy – Primary energy is the form of energy that is accessible directly from the original sources. Vattenfall uses the interpretation applied by Eurostat and IEA. This means that all fuels are assigned a primary energy content corresponding to its heating value. Uranium is assigned a primary energy content corresponding to the heat released in the power plant. Solar, wind and hydro power are assigned a primary energy content corresponding to the extracted electricity (or heat).
Prosumer – Someone who both produces and consumes electricity.
Renewable energy sources – Non-finite energy sources such as hydro power, biomass, wind, the sun, ocean waves and geothermal energy.
Repowering – The process of replacing older wind power stations with newer ones that either have a greater capacity or more effi-ciency, which results in a net increase of power generated.
Reservoir levels – Refers to the volume of water stored in a reservoir which on a specific occasion can be used for hydro power generation. Reservoir levels vary during the year depending on precipitation and production.
SAIDI (System Average Interruption Duration Index) – An index of average power interruption times within electricity distribution. Measured in terms of inter ruption duration per customer and year.
SAIFI (System Average Interruption Frequency Index) – An index of average power interruption frequency within electricity distribu-tion. Measured in terms of the number of power interruptions per customer and year.
SF6 – A greenhouse gas over 15,000 times more potent than CO2 which is commonly used for electrical insulation.
SKB – Svensk Kärnbränslehantering AB (The Swedish Nuclear Fuel Management Company) – responsible for handling radioactive waste in Sweden.
SO2 – Sulphur dioxide.
Spot market – A market in which trading is conducted for immediate delivery.
Swap – A financial instrument that is a combination of a spot and forward transaction – a type of financial swap agreement.
Thermal power – Electricity generated via a heating process, such as a gas turbine or a steam process in a coal or nuclear power plant (compare combined heat and power).
TPI (Third party integration) – A process in which excess or waste heat, which would otherwise be released to the atmosphere, is captured from the industrial facilities in which it is produced and integrated into the district heating network
Volatility – A measure of how the price of a product varies during a given period of time.
Waste hierarchy – The EU’s prioritisation framework for how waste is to be avoided and managed.
White label – A product or service which is provided to customers who then brand the product themselves and resell it as their own
For definitions of financial key ratios, see pages 174–175.
Power units• Power is energy per unit of time
• Power output is measured in watts (W)
• 1 kW (kilowatt) = 1,000 W
• 1 MW (megawatt) = 1,000 kW
• 1 GW (gigawatt) = 1,000,000 kW
Energy units• Energy is power multiplied by time
• 1 kWh (kilowatt hour) = 1 kW in one hour
• 1 MWh (megawatt hour) = 1,000 kWh
• 1 GWh (gigawat hour) = 1,000,000 kWh
• 1 TWh (terawatt hour) = 1,000,000,000 kWh
Weight units• ktonnes (kilotonnes)
= 1,000 tonnes
• Mton (megatonnes) = 1,000,000 tonnes
Voltage• 1 kV (kilovolt) = 1,000 volts (V)
180 VATTENFALL ANNUAL AND SUSTAINABILITY REPORT 2018

Contact personsKarin Lepasoon, Communications,[email protected], tel +46-8-739 50 00Annika Ramsköld, Sustainability,[email protected], tel +46-8-739 50 00Johan Sahlqvist, Investor Relations,[email protected], tel +46-8-739 50 00
Financial calendar11 April 2019 Annual General Meeting25 April 2019 Interim report January–March19 July 2019 Interim report January–June29 October 2019 Interim report January–September5 February 2020 Year-end report for 2019 (preliminary)
Forecasts and forward-looking statementsThis document contains forward-looking statements that are based on Vattenfall’s current expectations. Even if Vattenfall’s management believes that these expectations are reasonable, no guarantee can be made that these expectations will prove to be correct. The forward-looking statements herein pertain to risks and uncertainties that could have a material impact on future earnings. The statements are based on certain assumptions, including such that pertain to financial conditions in general in the company’s markets and the level of demand for the company’s products. The outcome may vary significantly compared with what is presented in the forward-looking statements, depending on, among other things, changed conditions regarding the economy, markets and competition, legal requirements, and other political actions and variations in exchange rates, as well as other factors referred to in the administration report. This English version of Vattenfall’s Annual and Sustainability Report is a translation of the Swedish original, which is the binding version. Rounding differences may occur in this document.
About Vattenfall’s financial reportsVattenfall’s financial reporting includes interim reports, the year-end report, and the annual report. In addition to these reports, the company issues financial information via press releases and on Vattenfall’s websites.
Vattenfall’s Annual and Sustainability Report 2018 is published in Swedish and English. All financial reports are available on Vattenfall’s websites. The reports are only available digitally for downloading and can therefore not be ordered in printed versions.
Production: Vattenfall AB in cooperation with Hallvarsson & Halvarsson. Photos: Andreas Lind, Annika Örnborg, Christian Steiness, Caiaimage, Christoffer Ågstrand, Elin Bergqvist, Felix Gerlach, Felix Odell, iStock, Jeanette Hägglund, Jennie Pettersson, Jes Larsen, John Guthed, Klas Rockberg, Liljewall arkitekter, Martijn Ooms, Matz Almbrandt, Peter Hoelstad, Sporting Wales/Steve Pope, Vattenfall AB. (Copyright 2018, Vattenfall AB, Solna.)

SE-169 92 Stockholm, Sweden. Evenemangsgatan 13, [email protected] Public company Stockholm VAT SE 556036-2138 www.vattenfall.com
A renewed Vattenfall with a clear goalFor more than 100 years we have electrified industries, powered
people’s homes and modernised our way of living through innovation and cooperation. We will now make it possible to live a fossil-free life
within one generation. That is our goal. But to succeed it is not enough that we alone are fossil-free. It is for this reason that we are looking beyond
our own production. Only then can we truly make a difference.
Energy & solutions from a broader perspectiveWe view our responsibility from a broader perspective. With our
capabilities we are now contributing to change on a much larger scale, and we are leading the shift to fossil-free sources of energy – even beyond
our own production. This means that we are finding new and innovative fossil-free ways of producing and delivering power to our customers.
But it also means that – together with our partners and customers – we are electrifying important industrial manufacturing processes, transports, and
other areas in which we can reduce or entirely eliminate CO2 emissions.
Ability & capacity to enable a fossil-free lifeClimate change is a global problem that requires major, sweeping
solutions. Vattenfall has operations in most countries in northern Europe. We are one of Europe’s largest producers and retailers of electricity and heat.
By using our engineering know-how in all parts of the value chain – produc-tion, distribution and sales to customers – we can develop solutions and
innovations that are bringing us closer to our goal. We are helping our cus-tomers live more energy-efficiently by making sure they can choose smart
technologies for producing their own electricity or heat, and change over to cleaner alternatives that are both affordable and easy to use.