Fossil Free Indexes - 350.org
20
The Carbon Underground The World’s Top 200 Public Companies, Ranked by the Carbon Content of their Fossil Fuel Reserves April 2014 F ossil F ree I ndexes SM
Transcript of Fossil Free Indexes - 350.org
The Carbon UndergroundThe World’s Top 200 Public Companies,
Ranked by the Carbon Content of their Fossil Fuel Reserves
April 2014
FossilFreeIndexesSM

© 2014 Fossil Free Indexes, LLC All Rights Reserved
The Carbon Underground
2
Contents
Executive Summary 3
Introduction 4
Methodology 6
The Carbon Underground 200TM 9
Market Dynamics 11
Notes 17
Updates 19
Acknowledgments 19
For More Information 19
About Fossil Free Indexes 20
Authors
Stuart Braman [email protected]
Lynn [email protected]
Lucy Di Rosa [email protected]
Thomas Francis [email protected]
Cliff [email protected]
Michael [email protected]
© 2014 Fossil Free Indexes, LLC All Rights Reserved
The Carbon Underground
3
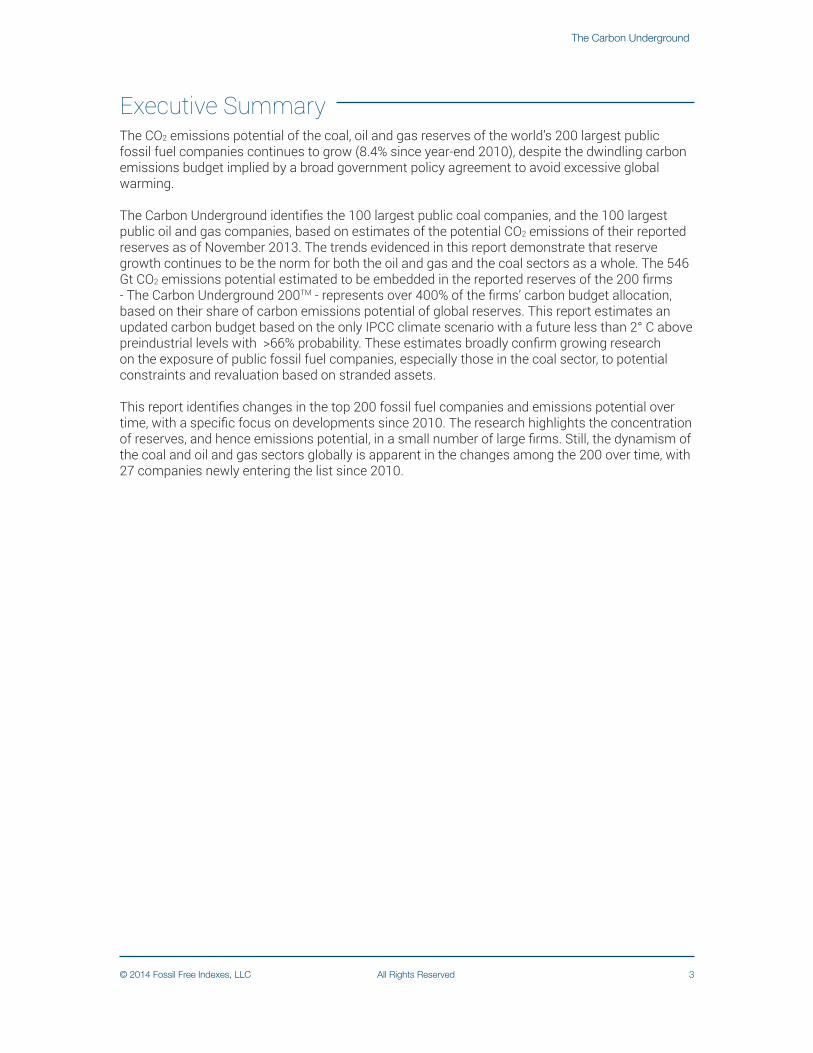
Executive Summary The CO2 emissions potential of the coal, oil and gas reserves of the world’s 200 largest public fossil fuel companies continues to grow (8.4% since year-end 2010), despite the dwindling carbon emissions budget implied by a broad government policy agreement to avoid excessive global warming.
The Carbon Underground identifies the 100 largest public coal companies, and the 100 largest public oil and gas companies, based on estimates of the potential CO2 emissions of their reported reserves as of November 2013. The trends evidenced in this report demonstrate that reserve growth continues to be the norm for both the oil and gas and the coal sectors as a whole. The 546 Gt CO2 emissions potential estimated to be embedded in the reported reserves of the 200 firms - The Carbon Underground 200TM - represents over 400% of the firms’ carbon budget allocation, based on their share of carbon emissions potential of global reserves. This report estimates an updated carbon budget based on the only IPCC climate scenario with a future less than 2° C above preindustrial levels with >66% probability. These estimates broadly confirm growing research on the exposure of public fossil fuel companies, especially those in the coal sector, to potential constraints and revaluation based on stranded assets.
This report identifies changes in the top 200 fossil fuel companies and emissions potential over time, with a specific focus on developments since 2010. The research highlights the concentration of reserves, and hence emissions potential, in a small number of large firms. Still, the dynamism of the coal and oil and gas sectors globally is apparent in the changes among the 200 over time, with 27 companies newly entering the list since 2010.

© 2014 Fossil Free Indexes, LLC All Rights Reserved
The Carbon Underground
4
IntroductionDespite the risks posed by global warming, and a consensus on the part of most governments that actions should be taken to limit the planet’s temperature increase to no more than 2° C above preindustrial levels,1 total fossil fuel reserves globally have continued to grow with ongoing exploration and development.2 In April 2014, the Intergovernmental Panel on Climate Change (IPCC) revealed that cumulative CO2 emissions from the fossil fuel industry and cement production over the last forty years are double the emissions of the previous two hundred and sixty years.3 The Panel warned that the window for action is closing and by 2030 maintaining temperature change below 2°C will be substantially more difficult.4
Based on estimates of the International Energy Association (IEA), the energy sector is the largest contributor to this increase in greenhouse gases, accounting for two-thirds of all emissions.5
Analysis of the carbon emissions content of the reserves of the world’s 200 largest public coal, oil and gas companies, as summarized in this report, shows that just as reserves have grown, so too have potential emissions from the public fossil fuel companies of the world.
Not surprisingly, climate scientists, financial analysts, and investors alike are increasingly paying attention to carbon budgets, and the potential for stranded assets in the energy sector. A “carbon budget” is the volume of CO2 emissions which cannot be exceeded in order to avoid global warming in excess of a target threshold.”6 A “stranded asset” is an asset that becomes obsolete or non-performing but must be recorded on the balance sheet as a loss. In this case, fossil fuel deposits that cannot be extracted and sold due to regulation or market forces, legislation, disruptive innovation, or societal norms become stranded.7
The IEA estimated the energy sector carbon budget and compared it to proven reserves in 2012. Their finding was that four-fifths of existing reserves would need to be constrained in order to meet an 80% probability of limiting the planet’s temperature increase to 2° C.8 Based on the only climate scenario published in the IPCC’s Climate Change 2014 deemed likely to limit global temperature increase to 2° C,9 the current energy sector carbon budget is estimated as:
66% probability of keeping temperatures below 2° C increase:• Emissions budget: fossil fuels & land use change 2011 – 205010 • Fossil fuel emissions 2011 – 201311 • Projected non-fossil fuel emissions 2011 – 205012
• Remaining energy sector carbon budget through 2050
925 Gt CO2
(97 Gt CO2)(104 Gt CO2) 724 Gt CO2
This updated carbon budget provides a benchmark for understanding the risk to both the firms owning potential CO2 emitting reserves, and to the investors in those firms. Baseline scenarios presented by the IPCC in which current policies remain unchanged show emissions increasing by 50% over the next forty years and likely temperature increases over 4° C.13 The scenario likely to maintain global temperature increases less than 2° C, and used to calculate the carbon budget, decreases emissions by 10% over the same period. Even with this aggressive emissions reduc-tion, the budget is exhausted in 22 years.14 at which time over three quarters of today’s reserves will remain unburned. Yet exploration and development of fossil fuel resources continue unabated. According to calculations based on IEA documents15 and the World Energy Council,16 the total carbon emissions for proven reserves stands at 3,200 Gt CO2,17 almost four and a half times the carbon budget.
The Carbon Tracker Initiative first linked carbon budgets with investor risk in its 2011 “Unburnable Carbon” report,18 which looked at the top 200 fossil fuel companies with publicly traded shares, ranked on the carbon content of their reserves.In its subsequent 2013 update, Carbon Tracker

© 2014 Fossil Free Indexes, LLC All Rights Reserved
The Carbon Underground
5
analyzed 200 publicly traded fossil fuel companies and assumed that their allotted portion of the total carbon budget was proportional with their percentage of the emissions from all global reserves. Carbon Tracker found that these companies had reserves whose embedded emissions total 340% beyond their allotted budget, and concluded that, “65% to 80% of listed companies’ reserves cannot be burned unmitigated.”19 The result is potentially significant amounts of “unburnable carbon.”
Reports by the IEA20 , IPCC21 , and Carbon Tracker22 have further explored the extent of unburnable carbon in this carbon budget framework. The conclusion that the extent of unburnable carbon is significant appears to stand up under a range of different measurement approaches, different target temperature increases, and different potential mitigating factors.
When reserves become unburnable, these assets, with valuations based on their extraction and burning, become stranded. When the stranded assets are not reflected in market pricing, the companies owning these assets become overvalued. The “carbon bubble” that analysts refer to now adds financial risk to climate risk as a growing concern for investors in these fossil fuel companies.
THE TOP 200 LIST – FROM CARBON TRACKER 2011 TO THE CARBON UNDERGROUND 2014 AND BEYOND
As part of its “Unburnable Carbon” analysis published in 2011, the Carbon Tracker Initiative identified the top 100 public coal companies in the world and the top 100 public oil and gas companies in the world, both reported to be ranked by the carbon emissions embedded in reserves reported as of year-end 2010. In July 2012, Bill McKibben gave enormous exposure to the analysis when he initiated the fossil fuel divestment movement with the publication of Global Warming’s Terrifying New Math.23 Adopting this top 200 list, 350.org joined with As You Sow, the Responsible Endowments Coalition, and Energy Action to kick off a fossil fuel divestment campaign in November 2012. The list, originally an analytical element of a research report, was thereby transformed into an operational element of what is now a global campaign aimed at encouraging university endowments and foundations, pension funds, NGOs, and individual investors to divest from the top 200 public companies with fossil fuel reserves.
The reserves landscape continues to evolve, and the task of monitoring the top 200 companies is an ongoing one. With this report, Fossil Free Indexes presents The Carbon Underground 200TM, the latest update to this list, based on reserves data reported as of November 28, 2013. In the course of preparing this update, Fossil Free Indexes has created a systematic process that will permit regular updating in the future.

© 2014 Fossil Free Indexes, LLC All Rights Reserved
The Carbon Underground
6
MethodologyINTRODUCTION
Fossil Free Indexes has used a reserves-based methodology to create The Carbon Underground 200TM, a consistent listing of the top 100 public coal companies globally and the top 100 public oil and gas companies globally, ranked by the potential carbon emissions content of their reported reserves. This approach follows that of Meinshausen from the Potsdam Institute for Climate Impact Research.24 It is largely consistent with the methodology reported to be the basis of the original list published by the Carbon Tracker Initiative in 2011 and used by the fossil fuel divestment campaign when it was launched in 2012.25
RESERVES DATA SOURCES
The core data underlying The Carbon Underground 200 is based on reported reserves. For coal, SNL Metals & Mining (formerly IntierraRMG) with its Raw Materials Data Coal Database (“RMD Coal Database”) was selected as the primary provider of reserves information. For oil and gas, Evaluate Energy with its Global Oil & Gas Database (“EE Oil & Gas Database”) and CANOILS Database (“EE CANOILS Database”) was selected as the primary provider of reserves information.
In each case, data from these primary providers were checked against and in some cases supplemented during the analysis with data from publicly available primary sources and from other secondary data providers. The primary use of supplemental data was to provide support for estimating the kind of coal predominating in a mine.
RESERVES DEFINITIONS AND APPROACH
Coal reserves are reported in the RMD Coal Database as the sum of proven and probable reserves. Reserves are the economically mine-able portion of a measured or indicated resource. The distinction between proven and probable reserves is the likelihood of extraction.
The reporting of reserves by coal mine on an annual basis is not consistent among companies with exchange listings, nor is it consistent for each mine in which a company has a controlling interest. Due to the sporadic reporting of reserves by listed companies, this analysis uses the last reported reserves amount by mine. Reserves were allocated to listed companies based on percentage ownership of individual mines.
Oil and gas reserves are distinguished between proven (1P) and proven and probable (2P). Proven reserves are defined in the oil and gas industry as having a 90% probability of near-term extraction. Probable reserves are defined as having a 50% probability of extraction. This analysis uses proven reserves (1P) as the basis for ranking the top 100 oil and gas companies. Most oil and gas companies report proven reserves, while fewer than half of the public oil and gas companies report proven plus probable reserves. This research does not include any portion of probable oil and gas reserves, nor does it include any status quo assumptions of continued discovery and development to replenish oil reserves as they are utilized, both of which would increase the potential CO2 emissions from these firms.
In order to maintain a consistent data set, oil and gas reserves data are represented net of royalty payments. Royalties are the government’s share of a company’s reserves, and vary by country and by project. The convention to represent reserves data net of royalties is consistent across all Evaluate Energy databases.
© 2014 Fossil Free Indexes, LLC All Rights Reserved
The Carbon Underground
7
DATE OF DATA USED
The calculations used to produce this first edition of The Carbon Underground 200 are based on reserves data available as of November 28, 2013. For the vast majority of companies, this data set includes year-end 2012 data, and for a small number of companies with fiscal years ending in March and June, a partial snapshot of 2013 data is included, as well. Corporate actions between November 28, 2013 and March 31, 2014 are included to ensure that all companies on the list were investable as of March 31, 2014.
EMISSIONS CALCULATION PROCESS
The Carbon Underground 200 relies on the IPCC Revised 1996 Guidelines for National Greenhouse Gas Inventories26 as a methodological framework. The calculation of CO2 emission potential requires several conversions to the raw reserves figures.
Categorization: Coal reserves are divided into five categories and petroleum reserves into four categories as follows:
In cases where the RMD database does not indicate the coal rank27 for a specific mine, all available sources of information are used to estimate the coal rank, including the coal use and the predominant rank of coal in the basin, the coalfield, the state or province, the region, and/or the country. In cases where none of these sources provided sufficient information to estimate the coal rank, the most common global coal rank, bituminous, was assumed.
Evaluate Energy reports oil and natural gas liquids in aggregate. Reported annual production figures for oil and for natural gas liquids are used to estimate the relative proportion of oil reserves to natural gas liquids reserves. Additionally, where proven (1P) reserves are unavailable (five of the top 100), they are estimated using proven and probable (2P) reserves and a ratio based on the mean relationship between 1P and 2P for the companies that report both.
Normalization: Coal reserves are universally reported in millions of tons. Petroleum reserves are reported in a variety of volume units. All reserves figures are converted into gigagrams using average factors specific to each type of fossil fuel.
Energy and Carbon Content Factors: Fossil fuels vary widely in energy potential and carbon content across reserve types. Following the IPCC framework, net calorific values are assigned to each reserve type, to convert mass into energy units. IPCC carbon content factors indicating the amount of carbon released during combustion are assigned based on reserve type.28
CO2 Emission Calculation: Potential CO2 emissions for reserves reported by each company are calculated based on the IPCC framework and the Potsdam Institute for Climate Impact Research formula E = R x V x C x F 29 , where E = emissions, R is reserves, V is net calorific value, and C is carbon content. F is a conversion factor accounting for transforming carbon into carbon dioxide and converting grams to gigatons.
Coal
• anthracite• coking coal (metallurgical)• other bituminous coal (thermal, PCI)• sub-bituminous coal• lignite
Petroleum
• oil• natural gas liquids• oil sands• gas
© 2014 Fossil Free Indexes, LLC All Rights Reserved
The Carbon Underground
8
LISTED COMPANIES
Given the continual mergers and acquisitions, closures, delisting, and IPO activities in the coal, oil and gas industries, this work is an ongoing best-efforts attempt at researching listed companies and basing the analysis on the latest available information. If subsidiaries are listed separately from their parent, and their reserves are reported separately from their parent, they are eligible to be included in The Carbon Underground 200. Companies that publicly trade only a portion of their overall shares are eligible to be included as well.
CONSTRUCTING THE CARBON UNDERGROUND 200TM LIST
Separate rankings have been created for the top 100 public coal companies globally and the top 100 public oil and gas companies globally.30 The rankings are based on calculated carbon emissions data using reserves reported as of November 28, 2013. The ranking is then adjusted based on company mergers and acquisitions following the most recent reserve reports.
Data Accuracy
Fossil Free Indexes has utilized best efforts to include the most recent and consistent data available. Reserves data and company ownership interest data are only as accurate and as timely as the data contained within company reports. While starting with reserves database suppliers, a data verification process including a check of a sample of data points against primary sources was conducted. Going forward, each update to the list will incorporate the most recent data available at the time.
A Comparison of the Fossil Free Index and Carbon Tracker Methodologies and Results
There are some differences in methodology that determine estimates of projected emissions from oil reserves. Fossil Free Indexes estimated potential emissions from oil (as well as gas and coal) based on annually reported reserves. Carbon Tracker, which primarily sought to measure the fossil fuel sector’s emissions potential relative to the carbon budget to 2050, assumed oil companies will replenish reserves through continued exploration and development. Accordingly, Carbon Tracker’s estimates embed a business as usual approach that results in higher emissions estimates based on the inclusion of projected future production. Both approaches generate a substantially similar universe of companies that have the most exposure to fossil fuel assets and potential emissions from their reserves.

© 2014 Fossil Free Indexes, LLC All Rights Reserved
The Carbon Underground
9
The Carbon Underground 200TM
Rank Coal CompaniesCoal Gt
CO2Rank Oil and Gas Companies Oil Gt CO2
Gas Gt CO2
Total O&G Gt CO2
1 Coal India 57.722 1 Gazprom 6.248 37.292 43.5402 Shenhua Group 31.523 2 Rosneft 10.059 1.979 12.0393 Adani Enterprises 25.383 3 PetroChina 4.884 3.693 8.5774 Shanxi Coking Company 18.445 4 ExxonMobil 4.143 4.038 8.1815 BHP Billiton 13.469 5 Lukoil 5.666 1.280 6.9466 Anglo American 12.985 6 BP 4.203 2.197 6.4007 Inner Mongolia Yitai Coal 12.223 7 Petrobras 4.676 0.674 5.3508 Datang Intl. Power 12.206 8 Royal Dutch Shell 2.140 2.332 4.4739 China National Coal 12.071 9 Chevron 2.545 1.591 4.137
10 Peabody Energy 11.469 10 Total 2.130 1.683 3.81311 Glencore Xstrata 10.453 11 Novatek 0.387 3.391 3.77712 Datong Coal Industry 10.281 12 ConocoPhillips 1.661 1.069 2.73013 Yanzhou Coal Mining 9.799 13 Tatneft 2.622 0.067 2.68914 Public Power Corp (DEH) 9.339 14 ENI 1.418 1.142 2.56115 Exxaro Resources 8.793 15 ONGC 1.449 0.703 2.15216 Yangquan Coal Industry 7.298 16 Statoil 1.012 0.928 1.93917 Mechel 6.739 17 Sinopec 1.204 0.367 1.57118 Arch Coal 6.530 18 CNOOC 1.155 0.366 1.52119 Alpha Natural Resources 5.482 19 BG 0.593 0.664 1.25720 Mitsubishi 4.738 20 Occidental 0.950 0.303 1.25321 Vale 4.401 21 Apache 0.586 0.461 1.04722 Rio Tinto 4.338 22 Canadian Natural Resources 0.780 0.200 0.98023 EVRAZ 4.235 23 Anadarko Petroleum 0.450 0.454 0.90424 Raspadskaya 4.084 24 BHP Billiton 0.345 0.552 0.89725 Asia Resource Minerals 3.181 25 Devon Energy 0.379 0.515 0.89426 UC RUSAL 3.081 26 Chesapeake Energy 0.293 0.596 0.88927 Neyveli Lignite 3.035 27 Bashneft 0.876 0.000 0.87628 Pingdingshan Tianan Coal 3.023 28 Inpex 0.393 0.369 0.76229 Cloud Peak Energy 2.881 29 Ecopetrol 0.580 0.157 0.73730 Sasol 2.731 30 EOG Resources 0.392 0.258 0.65031 Severstal 2.726 31 Suncor Energy 0.596 0.041 0.63632 AGL Energy 2.704 32 Marathon Oil 0.473 0.151 0.62433 Tata Steel 2.679 33 Hess 0.485 0.125 0.61034 Teck Resources 2.603 34 Imperial Oil 0.561 0.027 0.58735 Kuzbass Fuel 2.504 35 Encana 0.089 0.479 0.56836 Polyus Gold 2.294 36 Energi Mega Persada 0.020 0.537 0.55737 Energy Ventures 2.184 37 BASF 0.159 0.294 0.45338 Whitehaven Coal 2.055 38 Repsol 0.182 0.265 0.44639 Banpu 2.040 39 OMV 0.260 0.152 0.41340 RWE 1.943 40 Noble Energy 0.141 0.271 0.41241 Consol Energy 1.887 41 Woodside Petroleum 0.058 0.334 0.39242 W H Soul Pattison 1.850 42 Pioneer Natural Resources 0.270 0.120 0.39043 Resource Generation 1.818 43 Linn Energy 0.218 0.163 0.38144 Bayan Resources 1.806 44 Cenovus Energy 0.309 0.053 0.36245 Churchill Mining 1.745 45 YPF 0.235 0.121 0.35646 NTPC 1.740 46 Range Resources 0.090 0.261 0.35247 Adaro Energy 1.607 47 PTT 0.111 0.228 0.33948 Nacco Industries 1.557 48 Husky Energy 0.212 0.122 0.33449 Idemitsu Kosan 1.530 49 EQT 0.001 0.326 0.32750 Alliance Resource Partners 1.475 50 Continental Resources 0.238 0.073 0.311

© 2014 Fossil Free Indexes, LLC All Rights Reserved
The Carbon Underground
10
Rank Coal CompaniesCoal Gt
CO2Rank Oil and Gas Companies Oil Gt CO2
Gas Gt CO2
Total O&G Gt CO2
51 Huolinhe Opencut Coal Ind 1.387 51 Talisman Energy 0.111 0.199 0.31052 Coalspur Mines 1.380 52 KazMunaiGas EP 0.298 0.000 0.29853 Mitsui 1.366 53 JX Holdings 0.271 0.000 0.27154 Golden Energy Mines 1.354 54 WPX Energy 0.069 0.188 0.25855 Coal of Africa 1.339 55 Santos 0.033 0.204 0.23756 Novolipetsk Steel 1.288 56 SK Innovation 0.226 0.000 0.22657 Wesfarmers 1.094 57 QEP Resources 0.078 0.143 0.22058 Tata Power 1.062 58 Southwestern Energy 0.000 0.219 0.21959 Magnitogorsk Iron & Steel 1.046 59 Consol Energy 0.000 0.218 0.21860 Sherritt International 1.012 60 Cabot Oil & Gas 0.010 0.201 0.21261 Kazakhmys 0.998 61 SandRidge Energy 0.134 0.077 0.21162 New World Resources 0.972 62 Newfield Exploration 0.112 0.096 0.20763 Mongolian Mining 0.903 63 Murphy Oil 0.144 0.062 0.20664 Itochu 0.878 64 Dragon Oil 0.159 0.044 0.20365 Westmoreland 0.864 65 Freeport-McMoRan 0.155 0.028 0.18366 Cockatoo Coal 0.851 66 Maersk Group 0.174 0.000 0.17467 Shanxi Meijin Energy 0.784 67 Concho Resources 0.116 0.057 0.17368 Jizhong Energy Resources 0.742 68 Ultra Petroleum 0.008 0.162 0.16969 Bandanna Energy 0.731 69 Denbury Resources 0.139 0.026 0.16670 Polo Resources 0.726 70 GDF SUEZ 0.045 0.117 0.16271 Allete 0.723 71 MEG Energy 0.155 0.000 0.15572 CLP Holdings 0.696 72 Whiting Petroleum 0.139 0.012 0.15173 Aspire Mining 0.670 73 RWE 0.037 0.111 0.14874 Walter Energy 0.641 74 MOL 0.084 0.061 0.14675 Aquila Resources 0.627 75 Crescent Point Energy 0.135 0.010 0.14576 Coal Energy 0.614 76 Polish Oil & Gas 0.036 0.108 0.14477 China Resources Power 0.567 77 Mitsui 0.048 0.095 0.14278 Indika Inti 0.485 78 Penn West Petroleum 0.111 0.029 0.14079 ArcelorMittal 0.464 79 Pacific Rubiales Energy 0.104 0.028 0.13280 FirstEnergy 0.458 80 Oil India 0.073 0.059 0.13281 Black Hills Corp 0.431 81 Cimarex Energy 0.062 0.068 0.13082 Wescoal Holdings 0.430 82 Energen 0.082 0.044 0.12683 Grupo Mexico 0.420 83 TAQA 0.065 0.055 0.12184 African Rainbow Minerals 0.379 84 Oil Search 0.028 0.088 0.11785 Shanxi Coal Intl Energy 0.376 85 ARC Resources 0.044 0.065 0.10986 Capital Power 0.367 86 Canadian Oil Sands 0.109 0.000 0.10987 PTT Public 0.359 87 Genel Energy 0.105 0.000 0.10588 Lanhua 0.338 88 SM Energy 0.057 0.045 0.10289 Fortune Minerals 0.328 89 Sasol 0.004 0.085 0.08990 Cardero Resources 0.323 90 National Fuel Gas 0.018 0.071 0.08891 Zhengzhou Coal Ind & Elec 0.319 91 Tullow Oil 0.080 0.008 0.08892 Steel Authority of India 0.307 92 Pengrowth Energy 0.051 0.037 0.08893 Jindal Steel & Power 0.301 93 Xcite Energy 0.084 0.001 0.08594 Shougang Fushan Resources 0.299 94 Vermilion Energy 0.069 0.013 0.08295 Jingyuan CE 0.297 95 Peyto E&D 0.009 0.070 0.07996 Stanmore Coal 0.287 96 Quicksilver Resources 0.017 0.061 0.07797 Prophecy Coal 0.272 97 Petroceltic International 0.026 0.050 0.07798 Marubeni 0.265 98 Forest Oil 0.026 0.050 0.07699 Cliffs Natural Resources 0.247 99 Tourmaline Oil 0.009 0.065 0.074
100 NSSMC 0.237 100 Bonavista Energy 0.027 0.045 0.072
The Carbon Underground 200TM
© 2014 Fossil Free Indexes, LLC All Rights Reserved
The Carbon Underground
11
A Note on Dates
The 2014 list published here is based on reserves data as of November 28, 2013 and ownership data as of March 31, 2014. In light of reporting cycles, this represents primarily reserves reported as of December 31, 2012. The 2011 list is based on reserves and ownership data as of December 31, 2010.
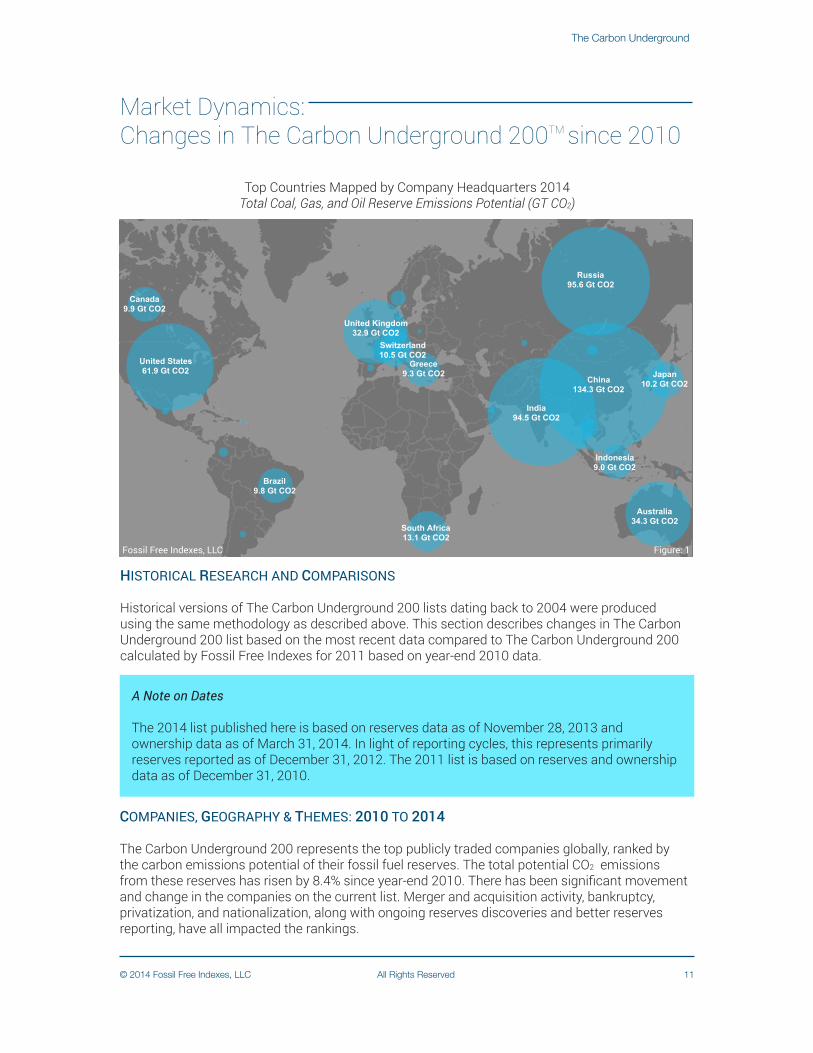
Top Countries Mapped by Company Headquarters 2014Total Coal, Gas, and Oil Reserve Emissions Potential (GT CO2)
About Tableau maps: www.tableausoftware.com/mapdata
United States61.9 Gt CO2
United Kingdom32.9 Gt CO2
Switzerland10.5 Gt CO2
South Africa13.1 Gt CO2
Russia95.6 Gt CO2
Japan10.2 Gt CO2
Indonesia9.0 Gt CO2
India94.5 Gt CO2
Greece9.3 Gt CO2
China134.3 Gt CO2
Canada9.9 Gt CO2
Brazil9.8 Gt CO2
Australia34.3 Gt CO2
Top Countries by Listed Company Headquarters 2014Total Coal, Gas & Oil Reserve Emissions Potential (Gt CO2)
Total 20130.1
50.0
100.0
134.3
Fossil Free Indexes LLCHISTORICAL RESEARCH AND COMPARISONS
Historical versions of The Carbon Underground 200 lists dating back to 2004 were produced using the same methodology as described above. This section describes changes in The Carbon Underground 200 list based on the most recent data compared to The Carbon Underground 200 calculated by Fossil Free Indexes for 2011 based on year-end 2010 data.
Market Dynamics: Changes in The Carbon Underground 200TM since 2010
COMPANIES, GEOGRAPHY & THEMES: 2010 TO 2014
The Carbon Underground 200 represents the top publicly traded companies globally, ranked by the carbon emissions potential of their fossil fuel reserves. The total potential CO2 emissions from these reserves has risen by 8.4% since year-end 2010. There has been significant movement and change in the companies on the current list. Merger and acquisition activity, bankruptcy, privatization, and nationalization, along with ongoing reserves discoveries and better reserves reporting, have all impacted the rankings.
Fossil Free Indexes, LLC Figure: 1

© 2014 Fossil Free Indexes, LLC All Rights Reserved
The Carbon Underground
12
Overall, a total of 27 companies have entered the list since year-end 2010, with 22 companies already on the list moving up in the rankings by 10 or more spots, and 12 companies already on the list moving down 10 or more. Activity is global and evenly split between coal, and oil and gas companies. However, market dynamics and geographical considerations are very different for each reserve type, and they are discussed individually below.
The total CO2 emissions potential of the reserves of the 200 largest oil and gas and coal companies measured in this report is 546 Gt. Adjusted for their share of the emissions embedded in global reserves, the carbon content of reserves held by The Carbon Underground 200 exceed the carbon budget by over 400%.
Global Carbon Budget vs. Reported Reserves
Coal Reserves 358 Gt CO2 Coal Reserves
396 GT CO2
Oil Reserves 71 Gt CO2
Oil Reserves 73 Gt CO2
Gas Reserves 75 Gt CO2
Gas Reserves 77 Gt CO2
Adjusted Budget for Carbon Underground 200
123 Gt CO2
0
200
400
600
2010 2014 2050
Gt C
O2
504 Gt CO2
546 Gt CO2
Fossil Free Indexes, LLC Figure: 2

© 2014 Fossil Free Indexes, LLC All Rights Reserved
The Carbon Underground
13
THE CARBON UNDERGROUND OIL & GAS 100
The Carbon Underground Oil & Gas 100 covers 98% of proven gas reserves from listed companies, and 97% of proven oil reserves from listed companies. The oil and gas exploration and production industry is dominated by state-controlled companies31 (often referred to as NOCs or national oil companies), most of which are 100% nationalized and unavailable to investors. However, some state-controlled companies do turn to the equity markets to raise capital. There are 21 state-controlled companies, accounting for about 62% of the total CO2 emissions, in the Carbon Underground Oil and Gas 100.
Regardless of ownership status, the oil and gas exploration and production industry is highly concentrated. The top five companies contribute roughly 53% of the total carbon emissions potential on The Carbon Underground Oil & Gas 100; the bottom half comprise about 5%.
Recent acquisitions have contributed to industry concentration. Of the top five companies with the greatest absolute increase in emissions, Rosneft, BHP Billiton, and CNOOC grew primarily through acquiring companies already on the list. Novatek grew through acquisition of companies off list and through development. Only Chevron of the top five increased reserves solely via exploration and development.
Topping the list is Gazprom, which is 50.002% controlled by the Russian Federation. Gazprom has ranked number one every year since 2004, throughout the full history of Fossil Free Indexes’ oil and gas database. While gas is the least carbon intensive fossil fuel (roughly 27% the carbon intensity of crude oil), Gazprom represents 29% of the total carbon emissions in the list.32 Its gas reserves and their associated carbon potential dwarf those of other companies on the list, whether the reserves are gas, oil, or oil sands.
Relative Rankings of The Carbon Underground 200TM
10Total3.81GtCO2
2 Rosne�12.04GtCO2
8 R Dutch Shell4.47 GtCO2
3 PetroChina8.58 GtCO2
7Petrobras5.35 GtCO2
5 Lukoil6.95 GtCO2
1 Gazprom43.54 GtCO2
4 ExxonMobil8.18 GtCO2
9 Chevron4.14 GtCO2
6 BP6.40 GtCO2
2 Shenhua Group31.52 GtCO2
4 Shanxi CokingCompany18.44 GtCO2
10 Peabody Energy11.47 GtCO2
7 Inner Mongolia YitaiCoal12.22 GtCO2
8 DatangInternationalPower12.21 GtCO2
1 Coal India57.72 GtCO2
9 China NationalCoal12.07 GtCO2
5 BHPBilliton13.47 GtCO2
6 Anglo American12.99 GtCO2
3 Adani Enterprises25.38 GtCO2
Coal Top 11 - 2599.69 GtCO2
Coal Top 26 - 10088.80 GtCO2
Oil & GasTop 26 - 100
20.42 GtCO2
Oil & GasTop 11 - 2526.17 GtCO2
Coal Top 10207.50 GtCO2
Oil & Gas Top 10103.46 GtCO2
Reserve TypeCoal
Oil & Gas
Fossil Free Indexes, LLC Figure: 3

© 2014 Fossil Free Indexes, LLC All Rights Reserved
The Carbon Underground
14
Aggregated gas reserves included in the list mirror worldwide reserves growth over the past two years (about 2% for gas), but public company oil reserves have only experienced about one-third the growth of oil reserves worldwide.33 Nonetheless, when compared against rankings compiled using historical data for the same period, oil reserves drive the emissions growth for the biggest emitters.
ExxonMobil is the top ranked company with 100% public ownership. Like Gazprom, ExxonMobil has held this position since at least 2004. Unlike Gazprom, ExxonMobil’s portfolio of reserves has shifted in composition over the past decade. The combined oil and gas reserves (excluding oil sands) have held steady in total, but shifted out of oil and into gas. The shift is not great, but represents movement out of international oil assets and into US-based unconventional gas led by the 2010 acquisition of XTO Energy. ExxonMobil increased holdings in Canadian oil sand reserves five-fold between 2004 and 2012. Due to the overall size of ExxonMobil’s fossil fuel reserves, the company’s potential CO2 emissions rank did not change. Smaller companies taking advantage of the same market shifts moved up in rankings the most.
Over the past two years, North America has experienced tremendous growth in both oil and gas reserves, primarily attributable to US shale oil, Canadian oil sands and US Marcellus gas reserves (see chart above, companies showing in dark red). Comparing current rankings with historical data, only two of the dozen companies that moved up 10 or more places are based outside of the United States or Canada. The growth of one of the international companies can also be attributed to acquisitions in the US shale oil reserves. As a group, the oil reserves of these 12 expanded at nearly twice the pace of gas reserves.
Oklahoma-based Continental Resources was edged out by Linn Energy from Houston for the largest jump up the Carbon Underground Oil and Gas 100 rankings. Linn Energy grew through the acquisition of Berry Petroleum, balancing out their gas heavy reserves portfolio with Berry’s western US oil assets. Continental Resources acquired rights to undeveloped acreage becoming the largest leaseholder of Bakken formation reservoirs.34 The Bakken shale oil formation spans North Dakota, Montana, Saskatchewan and Manitoba, and was largely unrecoverable until recent technological advances. Continental Resources pioneered horizontal drilling and fracture
Carbon Underground Oil and Gas Top 100Rank Changes 2010-2014
Fossil Free Indexes, LLC0 10 20 30 40 50 60 70 80 90 100Rank 2014
0
10
20
30
40
50
60
70
80
90
100
Ran
k 20
10
Xcite
Williams
Vermilion
Tourmaline
TNK-BP
SM
Plains
Peyto
Petrohawk
Petroceltic
Pacific Rubiales
Nexen
Natl Fuel
Murphy
MEG
Genel
FP-McMoran
EXCO
Enerplus
El Paso
Crescent Point
Continental
Concho
BHP
Berry
CabotJX Holdings
Sasol
Talisman
ForestWhiting
Linn
Oil IndiaQEP Quicksilver
Ultra
Additions since 2010
Deletionssince2010
Movers down 10 or more
Movers up 10 or more
Carbon Underground Oil & Gas Top 100Rank Changes 2010 - 2014
1
2
3
4
5
Fossil Free Indexes LLC
Fossil Free Indexes, LLC Figure: 4

© 2014 Fossil Free Indexes, LLC All Rights Reserved
The Carbon Underground
15
stimulated extraction technologies widely referred to as “fracking”. Their dual strategy of innovative technology and aggressive lease acquisition results in net new reserves (and potential carbon emissions). Linn Energy’s growth represents the consolidation of previously developed reserves.
Comparing current rankings with historical data, nine companies joined the Carbon Underground Oil and Gas 100 since year-end 2010. The companies entering the list are evenly split between potential carbon emissions increases attributable to oil reserves and to gas reserves. Only one of the nine companies represents reserves outside North America. Of course, the nine company additions resulted in another nine companies dropping from the list. Over two-thirds of the companies leaving the list were acquired by other companies in the top 100, and their carbon potential remains in the list. The potential growth in overall emissions of about 3% implies that companies maintaining the status quo, especially in the last 10 spots, could easily slip from the top 100 rankings. The two companies not acquired dropped into the 101-120 range.
THE CARBON UNDERGROUND COAL 100
Carbon Underground Coal Top 100Rank Changes 2010-2014
The Carbon Underground Coal 100 covers 98% of proven and probable coal reserves from listed companies. Similar to the Carbon Underground Oil & Gas 100, coal reserves are highly concentrated at the top of the coal list with 52% of potential CO2 emissions coming from the top 10 coal companies. This concentration is unchanged from year-end 2010. Total potential CO2
emissions from the top 100 coal companies have risen by 10.6% since 2010.
Company changes in the Carbon Underground Coal 100 are weighted towards Asia and Australia, with nine companies from Australia and China entering the list since 2010, and four exiting. North America accounts for considerable activity as well, with three Canadian companies entering and two exiting, and one American company entering with five exiting. A total of 18 companies have been added to the top 100 since 2010, accounting for 9.7% of the total potential CO2 emissions of the top 100, and a corresponding total of 18 companies have exited the list since 2010.
0 10 20 30 40 50 60 70 80 90 100Rank 2014
0
10
20
30
40
50
60
70
80
90
100
Ran
k 20
10
Xstrata
TransAlta
Stanmore
Resource Gen
PTT
Prophecy
Patriot
Optimum
OPK
NSSMC
Nippon Steel
Massey
Marubeni
Jizhong
Jindal
James River
ICG
Hebei Jinniu
Gujarat NRE
Great Energy
Glencore Xstrata
Fortune
Eurasian NatRes
Energy Vntr
Cockatoo
Cliffs
China Res
Cardero
Bandanna
Aston
Aspire
AGL
Adani
Magnitogorsk
Westmoreland
Golden EnergyItochu
Mongolian
African Rainbow
Asia Res Min
Bayan
Coal of Africa
Mitsui
Tata Power
MacArthur
Western
Alcoa
Cloud Peak
ConsolTata Steel
Whitehaven
WHSP
Oracle
Severstal
Additions since 2010
Deletionssince2010
Movers up 10 more
Movers down 10 or more
0
1
2
3
4
Fossil Free Indexes, LLC Figure: 5

© 2014 Fossil Free Indexes, LLC All Rights Reserved
The Carbon Underground
16
Merger, acquisition and joint venture activity accounted for six of the 18 companies entering the current rankings. Of the remaining company additions, eight came on to the list due to significant changes in reported reserves either through mine acquisitions or newly proven reserves. The remaining four entered by virtue of their moving up into the bottom of the list. The majority of the exits from the list, 13 of the 18 companies exiting the current rankings, were due to merger, acquisition and joint venture activity. Of the remaining companies exiting the list, two were due to a decline in reserves, two due to suspending activity at several mines, and one was a result of dropping off of the bottom of the list.
The increase in Australian and Chinese coal companies on the list and as upward movers in the rankings reflects the pronounced role of increasing Chinese and Indian energy demand on global coal markets. This demand has prompted increased feasibility studies for mine construc-tion and renewed merger and acquisition activity within the immediate geographic region, which is most evident among the Australian companies on the list. Three Australian companies, AGL, Energy Ventures, and Resource Generation – absent on the 2010 list – are now in the top 50 of the current list: Resource Generation due to new mine projects where reserves were first reported in 2012, and AGL and Energy Venture due to direct acquisition. AGL now fully owns Great Energy Alliance, previously a joint venture between AGL Energy and Tokyo Electric Power Company, and Energy Ventures purchased Aviva in 2013.
The trend of increased mining activity is also evident amongst companies that have been in the top 100 since 2010. Three Australian companies have moved up in rank by 20 or more spots due to mine acquisitions and increases in reported reserves from increased mine exploration and construction. There have also been similar increases in coal mine exploration resulting in reporting of increased reserves among companies with interests in Russian, South African, Mongolian and Indonesian coal mines.
In terms of new mine development, the Indian conglomerate Adani Group is the most notable new company. Adani has entered the current list at the number three spot, with their 2010 acquisition of Galilee Basin coal deposits in Australia from Linc Energy. These reserves had previously been deemed unrecoverable due to the lack of infrastructure for mining and transportation, but the 2012 Adani announcement of plans to build the $10 billion Carmichael Coal mine, rail, and port project brings these reserves into play and onto the list.
The trend is slightly reversed in North American listed coal companies. While coal continues to dominate U.S. power generation, the drop in U.S. companies on the list echoes the significant drop in both U.S. coal production and consumption since 2010, with competition from burgeoning shale gas production and increasing pressure from U.S. emissions regulations.
Emerging Metrics to Gauge Stranded Asset Exposure
The “HSBC Oil and Gas/Climate Change Europe Report January 2013” looks at the implication for European oil and gas companies of the IEA’s 450 scenario, which limits global warming to 2° C with a 50% probability. That scenario assumes that coal consumption falls 30%, and oil 12%, between 2010 and 2035. HSBC finds that reserves at risk of being undeveloped under this scenario vary widely between companies, ranging from as high as 25% of 2P resources. Value at risk, measured as reserves at risk to market capitalization, varied as well, from negligible to 17%. More compelling, perhaps, HSBC assesses the potential impact of lower oil and gas prices, imposing the exaggerated assumption of Brent $50/bbl, and gas at USD9/mm BTU. Not unrealistic in a low carbon world with aggressive policy response to accelerating climate risk, these prices would push exposure to “40% to 60% of the market capitalization of affected companies.”35
© 2014 Fossil Free Indexes, LLC All Rights Reserved
The Carbon Underground
17
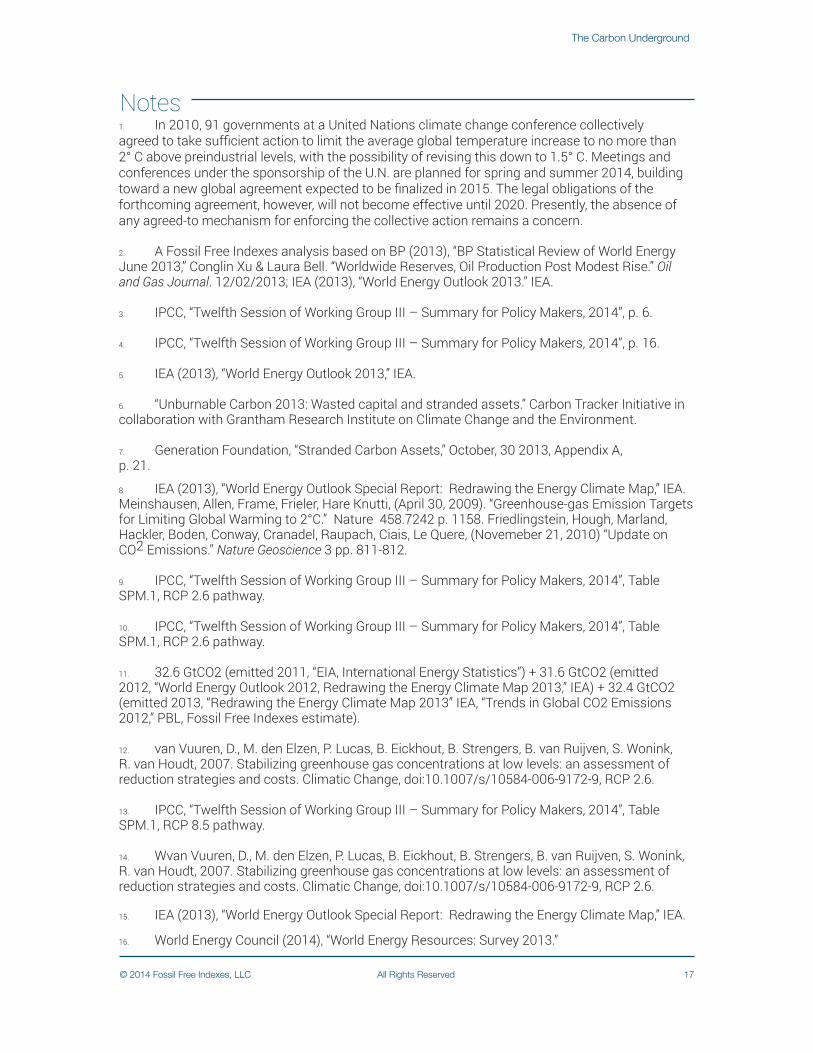
Notes1. In 2010, 91 governments at a United Nations climate change conference collectively agreed to take sufficient action to limit the average global temperature increase to no more than 2° C above preindustrial levels, with the possibility of revising this down to 1.5° C. Meetings and conferences under the sponsorship of the U.N. are planned for spring and summer 2014, building toward a new global agreement expected to be finalized in 2015. The legal obligations of the forthcoming agreement, however, will not become effective until 2020. Presently, the absence of any agreed-to mechanism for enforcing the collective action remains a concern.
2. A Fossil Free Indexes analysis based on BP (2013), “BP Statistical Review of World Energy June 2013,” Conglin Xu & Laura Bell. “Worldwide Reserves, Oil Production Post Modest Rise.” Oil and Gas Journal. 12/02/2013; IEA (2013), “World Energy Outlook 2013.” IEA. 3. IPCC, “Twelfth Session of Working Group III – Summary for Policy Makers, 2014”, p. 6. 4. IPCC, “Twelfth Session of Working Group III – Summary for Policy Makers, 2014”, p. 16.
5. IEA (2013), “World Energy Outlook 2013,” IEA.
6. “Unburnable Carbon 2013: Wasted capital and stranded assets.” Carbon Tracker Initiative in collaboration with Grantham Research Institute on Climate Change and the Environment. 7. Generation Foundation, “Stranded Carbon Assets,” October, 30 2013, Appendix A, p. 21. 8. IEA (2013), “World Energy Outlook Special Report: Redrawing the Energy Climate Map,” IEA. Meinshausen, Allen, Frame, Frieler, Hare Knutti, (April 30, 2009). “Greenhouse-gas Emission Targets for Limiting Global Warming to 2°C.” Nature 458.7242 p. 1158. Friedlingstein, Hough, Marland, Hackler, Boden, Conway, Cranadel, Raupach, Ciais, Le Quere, (Novemeber 21, 2010) “Update on CO2 Emissions.” Nature Geoscience 3 pp. 811-812.
9. IPCC, “Twelfth Session of Working Group III – Summary for Policy Makers, 2014”, Table SPM.1, RCP 2.6 pathway. 10. IPCC, “Twelfth Session of Working Group III – Summary for Policy Makers, 2014”, Table SPM.1, RCP 2.6 pathway.
11. 32.6 GtCO2 (emitted 2011, “EIA, International Energy Statistics”) + 31.6 GtCO2 (emitted 2012, “World Energy Outlook 2012, Redrawing the Energy Climate Map 2013,” IEA) + 32.4 GtCO2 (emitted 2013, “Redrawing the Energy Climate Map 2013” IEA, “Trends in Global CO2 Emissions 2012,” PBL, Fossil Free Indexes estimate).
12. van Vuuren, D., M. den Elzen, P. Lucas, B. Eickhout, B. Strengers, B. van Ruijven, S. Wonink, R. van Houdt, 2007. Stabilizing greenhouse gas concentrations at low levels: an assessment of reduction strategies and costs. Climatic Change, doi:10.1007/s/10584-006-9172-9, RCP 2.6.
13. IPCC, “Twelfth Session of Working Group III – Summary for Policy Makers, 2014”, Table SPM.1, RCP 8.5 pathway. 14. Wvan Vuuren, D., M. den Elzen, P. Lucas, B. Eickhout, B. Strengers, B. van Ruijven, S. Wonink, R. van Houdt, 2007. Stabilizing greenhouse gas concentrations at low levels: an assessment of reduction strategies and costs. Climatic Change, doi:10.1007/s/10584-006-9172-9, RCP 2.6. 15. IEA (2013), “World Energy Outlook Special Report: Redrawing the Energy Climate Map,” IEA.
16. World Energy Council (2014), “World Energy Resources: Survey 2013.”
© 2014 Fossil Free Indexes, LLC All Rights Reserved
The Carbon Underground
18
17. Proven (1P) oil and gas reserves as of 12/31/2012 and proven coal reserves as of 12/31/2011.
18. Carbon Tracker (2011), “Unburnable Carbon – Are the world’s financial markets carrying a carbon bubble?” 19. “Unburnable Carbon 2013: Wasted capital and stranded assets.” Carbon Tracker Initiative in collaboration with Grantham Research Institute on Climate Change and the Environment. 20. IEA (2013), “World Energy Outlook Special Report: Redrawing the Energy Climate Map,” IEA.
21. IPCC, “Fifth Assessment Report, Working Group 1, Summary for Policymakers, 2013.”
22. “Unburnable Carbon 2013: Wasted capital and stranded assets.” Carbon Tracker Initiative in collaboration with Grantham Research Institute on Climate Change and the Environment. 23. Bill McKibben, “Global Warming’s Terrifying New Math,” Rolling Stone, July 19, 2012.
24. Malte Meinshausen, et. al., “Greenhouse gas emissions targets for limiting global warming to 2 degrees centigrade,” Nature, 458:7242 http://www.ipcc-nggip.iges.or.jp/public/2006gl/pdf/2_Volume2/V2_1_Ch1_Introduction.pdf . 25. Carbon Tracker (2011), “Unburnable Carbon – Are the world’s financial markets carrying a carbon bubble?” 26. http://www.ipcc-nggip.iges.or.jp/public/2006gl/pdf/2_Volume2/V2_1_Ch1_Introduction.pdf. 27. Coal rank is the industry term for type of coal based on the level of organic metamorphism or carbonization. 28. Both calorific and carbon content factors come from the IPCC Revised 1996 Guidelines http://www.ipcc-nggip.iges.or.jp/public/2006gl/pdf/2_Volume2/V2_1_Ch1_Introduction.pdf . 29. http://www.nature.com/nature/journal/v458/n7242/extref/nature08017-s1.pdf . 30. Some of the top 100 coal and top 100 oil and gas companies are actually conglomerates and not fossil fuel companies, but their reserve ownership places them in the top 100. 31. Silvana Tordo, Brandon S. Tracy, Noora Arfaa. “National Oil Companies and Value Creation.” World Bank Working Paper No. 218. 2011. 32. It should be noted that the rankings rely solely on carbon emissions in keeping with the IPCC Tier I framework. Natural gas, however, is primarily composed of methane, another potent GHG. In the US, methane inadvertently released during production, processing and transmission has twice the global warming potential of the carbon emitted by all the natural gas burnt deliberately as a fuel annually (EPA, “Inventory of US Greenhouse Gas Emissions and Sinks,” 2/21/2014. IPCC, “Climate Change 2007: The Physical Science Basis”). No corresponding statistics are available for Russia. 33. Conglin Xu & Laura Bell. “Worldwide Reserves, Oil Production Post Modest Rise.” Oil and Gas Journal 12/02/2013. 34. Continental Resources, Inc. “Continental Resources Announces New Five-Year Plan To Triple Production And Proved Reserves [press release].” Oklahoma City, Oct. 8, 2012. 35. “Oil and Gas/Climate Change Europe Report,” HSBC, January 2013.
UpdatesFossil Free Indexes will update The Carbon Underground 200 TM quarterly and publish the updated list annually. Between annual publications, updates to the list will be available on a subscription basis, as will electronic versions of The Carbon Underground 200 TM in Excel (including tickers and primary exchanges).
AcknowledgmentsThe authors wish to thank the following individuals for reviewing the report:
Thanks also to Ariadne Wetzler for the report design.
For More Information• For questions on any aspect of this research, email Fossil Free Indexes at [email protected].
• For information on how to subscribe to updates and electronic copies of the Carbon Underground 200 with tickers and primary exchanges, for investment strategies or for portfolio research, email Fossil Free Indexes at [email protected].
• For information on portfolio-specific research that drills deeper into the risks associated with these owners of fossil fuel reserves, email Fossil Free Indexes at [email protected].
© 2014 Fossil Free Indexes, LLC All Rights Reserved
The Carbon Underground
19
Dan ApfelRichard BookbinderJon Braman
Brett FleishmanTyler JenksViktoriya Larsson
James LeatonHannah MumbyStephen Russell
Barry SchachterRuoyun Yang
To stay current with our work, visit http://www.fossilfreeindexes.com, and follow the company on Twitter (@FossilFreeIndxs).
© 2014 Fossil Free Indexes, LLC All Rights Reserved
The Carbon Underground
20
About Fossil Free IndexesFossil Free Indexes was formed to provide benchmarks and strategies for ethical investing with an initial focus on broad market indexes ex-fossil fuels defined exactly in line with the divestment movement.
We are developing a family of fossil free indexes that capture broad markets in the US, in developed markets beyond the US, and in emerging markets. The indexes specifically exclude the top 100 public coal companies globally and the top 100 public oil and gas companies globally, ranked by the carbon content of their reserves. These indexes will serve as benchmarks and will be licensed for investable products to meet the needs of index investors who want to divest from the largest fossil fuel companies.
The 200 companies in this report are an appropriate focus for further scrutiny and research by investors, lenders, and policy makers. In addition to its ongoing research program to keep The Carbon Underground 200TM updated, Fossil Free Indexes also offers portfolio-specific research that drills deeper into the risks associated with these owners of fossil fuel reserves.
This report is for information purposes only. It is not an offer to sell or a solicitation to buy any investment, nor is it an offer to provide any form of investment advice.
The information herein has been obtained from sources that Fossil Free Indexes LLC believes to be reliable; however, Fossil Free Indexes LLC does not guarantee its accuracy, timeliness or completeness, and it is subject to change without notice.