Forward-looking Statement - BW LPG · of BW LPG and that you will conduct your own analysis and be...
15
Transcript of Forward-looking Statement - BW LPG · of BW LPG and that you will conduct your own analysis and be...
Forward-looking Statement
This presentation has been produced by BW LPG Limited (“BW LPG”) exclusively for information purposes. This presentation may not be reproduced or redistributed, in whole or in part, to
any other person.
Matters discussed in this presentation and any materials distributed in connection with this presentation may constitute or include forward–looking statements. Forward–looking statements
are statements that are not historical facts and may be identified by words such as “anticipates”, “believes”, “continues”, “estimates”, “expects”, “intends”, “may”, “should”, “will” and similar
expressions, such as “going forward”. These forward–looking statements reflect BW LPG’s reasonable beliefs, intentions and current expectations concerning, among other things, BW
LPG’s results of operations, financial condition, liquidity, prospects, growth and strategies. Forward–looking statements include statements regarding: objectives, goals, strategies, outlook
and growth prospects; future plans, events or performance and potential for future growth; liquidity, capital resources and capital expenditures; economic outlook and industry trends;
developments of BW LPG’s markets; the impact of regulatory initiatives; and the strength of BW LPG’s competitors. Forward–looking statements involve risks and uncertainties because
they relate to events and depend on circumstances that may or may not occur in the future. The forward–looking statements in this presentation are based upon various assumptions, many
of which are based, in turn, upon further assumptions, including without limitation, management’s examination of historical operating trends, data contained in BW LPG’s records and other
data available from third parties. Although BW LPG believes that these assumptions were reasonable when made, these assumptions are inherently subject to significant known and
unknown risks, uncertainties, contingencies and other important factors which are difficult or impossible to predict and are beyond its control. Forward–looking statements are not
guarantees of future performance and such risks, uncertainties, contingencies and other important factors could cause the actual results of operations, financial condition and liquidity of BW
LPG or the industry to differ materially from those results expressed or implied in this presentation by such forward–looking statements. No representation is made that any of these
forward–looking statements or forecasts will come to pass or that any forecast result will be achieved and you are cautioned not to place any undue influence on any forward–looking
statement.
No representation, warranty or undertaking, express or implied, is made by BW LPG, its affiliates or representatives as to, and no reliance should be placed on, the fairness, accuracy,
completeness or correctness of the information or the opinions contained herein, for any purpose whatsoever. Neither BW LPG nor any of its affiliates or representatives shall have any
responsibility or liability whatsoever (for negligence or otherwise) for any loss whatsoever and howsoever arising from any use of this presentation or its contents or otherwise arising in
connection with this presentation. All information in this presentation is subject to updating, revision, verification, correction, completion, amendment and may change materially and without
notice. In giving this presentation, none of BW LPG, its affiliates or representatives undertakes any obligation to provide the recipient with access to any additional information or to update
this presentation or any information or to correct any inaccuracies in any such information. The information contained in this presentation should be considered in the context of the
circumstances prevailing at the time and has not been, and will not be, updated to reflect material developments which may occur after the date of the presentation.
The contents of this presentation are not to be construed as legal, business, investment or tax advice. Each recipient should consult its own legal, business, investment or tax adviser as to
legal, business, investment or tax advice. By attending this presentation you acknowledge that you will be solely responsible for your own assessment of the market and the market position
of BW LPG and that you will conduct your own analysis and be solely responsible for forming your own view on the potential future performance of the business of BW LPG. This
presentation must be read in conjunction with the recent financial information and the disclosures therein.
This presentation and the information contained herein are not an offer of securities for sale in the United States and are not for publication or distribution to persons in the United States
(within the meaning of Regulation S under the U.S. Securities Act of 1933, as amended (the “Securities Act”)). The securities referred to herein have not been and will not be registered
under the Securities Act and may not be offered or sold in the United States except pursuant to an exemption from the registration requirements of the Securities Act. Any failure to comply
with this restriction may constitute a violation of United States securities laws. BW LPG has not registered and does not intend to register its securities in the United States or to conduct a
public offering of shares in the United States. Copies of this presentation are not being made and may not be distributed or sent, directly or indirectly, in or into the United States, Canada,
Australia or Japan, or any other jurisdiction in which such distribution would be unlawful or would require registration or other measures.
In any EEA Member State other than Norway that has implemented Directive 2003/71/EC (as amended, together with any applicable implementing measures in any Member State, the
“Prospectus Directive”), this presentation is only addressed to and is only directed at qualified investors in that Member State within the meaning of the Prospectus Directive.
For the UK based investors–This presentation is only being distributed to and is only directed at persons in the United Kingdom that are (i) investment professionals falling within Article
19(5) of the Financial Services and Markets Act 2000 (Financial Promotion) Order 2005, as amended (the “Order”) or (ii) high net worth entities, and other persons to whom this
presentation may lawfully be communicated, falling within Article 49(2)(a) to (d) of the Order (all such persons together being referred to as “relevant persons”). This presentation must not
be acted on or relied on by persons who are not relevant persons. Any investment or investment activity to which this presentation relates is available only to relevant persons and will be
engaged in only with relevant persons.
2
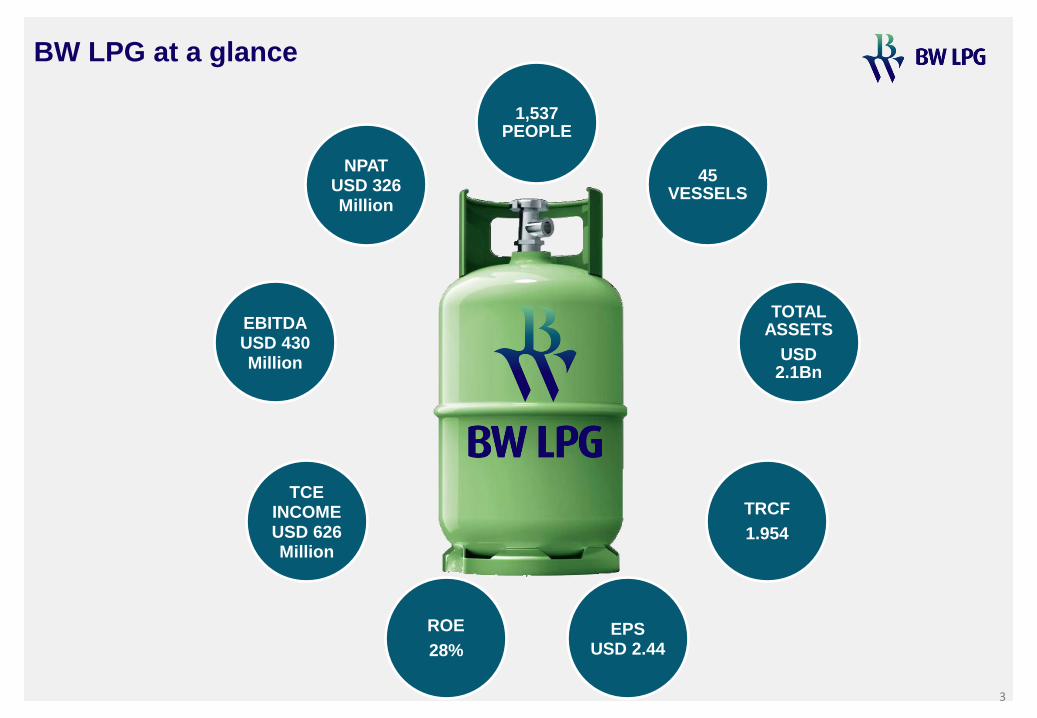
1,537 PEOPLE
45 VESSELS
TOTAL ASSETS
USD 2.1Bn
TRCF
1.954
EPS USD 2.44
ROE
28%
TCE INCOME USD 626 Million
EBITDA USD 430 Million
NPAT USD 326 Million
BW LPG at a glance
3
4
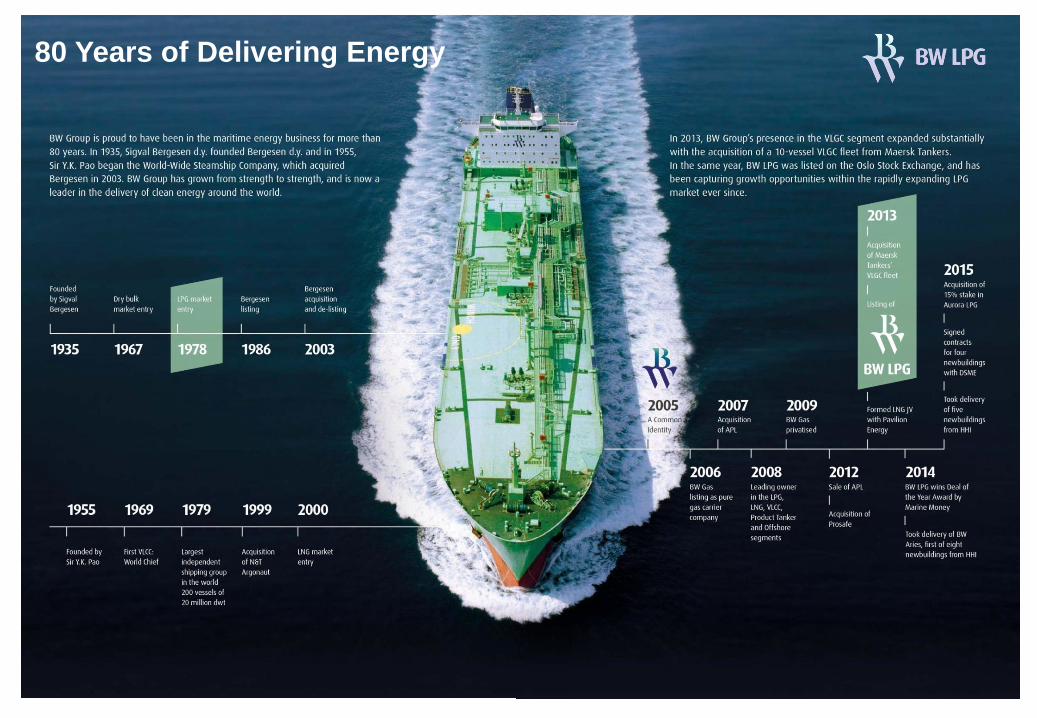
80 Years of Delivering Energy
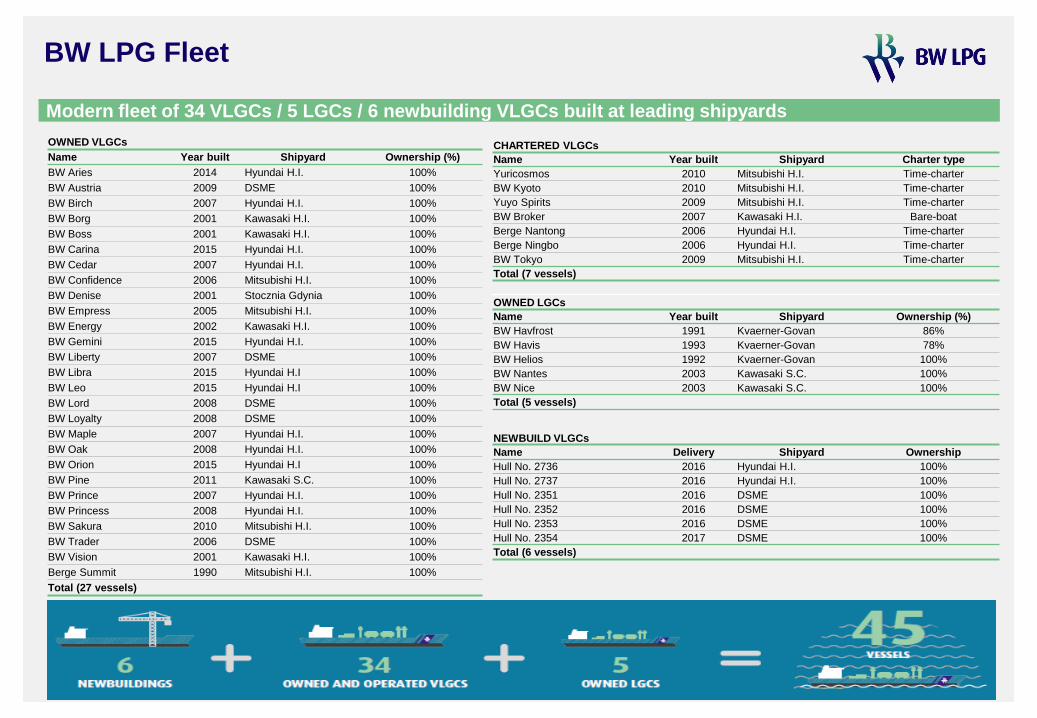
BW LPG Fleet
Modern fleet of 34 VLGCs / 5 LGCs / 6 newbuilding VLGCs built at leading shipyards
OWNED VLGCs
Name Year built Shipyard Ownership (%)
BW Aries 2014 Hyundai H.I. 100%
BW Austria 2009 DSME 100%
BW Birch 2007 Hyundai H.I. 100%
BW Borg 2001 Kawasaki H.I. 100%
BW Boss 2001 Kawasaki H.I. 100%
BW Carina 2015 Hyundai H.I. 100%
BW Cedar 2007 Hyundai H.I. 100%
BW Confidence 2006 Mitsubishi H.I. 100%
BW Denise 2001 Stocznia Gdynia 100%
BW Empress 2005 Mitsubishi H.I. 100%
BW Energy 2002 Kawasaki H.I. 100%
BW Gemini 2015 Hyundai H.I. 100%
BW Liberty 2007 DSME 100%
BW Libra 2015 Hyundai H.I 100%
BW Leo 2015 Hyundai H.I 100%
BW Lord 2008 DSME 100%
BW Loyalty 2008 DSME 100%
BW Maple 2007 Hyundai H.I. 100%
BW Oak 2008 Hyundai H.I. 100%
BW Orion 2015 Hyundai H.I 100%
BW Pine 2011 Kawasaki S.C. 100%
BW Prince 2007 Hyundai H.I. 100%
BW Princess 2008 Hyundai H.I. 100%
BW Sakura 2010 Mitsubishi H.I. 100%
BW Trader 2006 DSME 100%
BW Vision 2001 Kawasaki H.I. 100%
Berge Summit 1990 Mitsubishi H.I. 100%
Total (27 vessels)
CHARTERED VLGCs
Name Year built Shipyard Charter type
Yuricosmos 2010 Mitsubishi H.I. Time-charter
BW Kyoto 2010 Mitsubishi H.I. Time-charter
Yuyo Spirits 2009 Mitsubishi H.I. Time-charter
BW Broker 2007 Kawasaki H.I. Bare-boat
Berge Nantong 2006 Hyundai H.I. Time-charter
Berge Ningbo 2006 Hyundai H.I. Time-charter
BW Tokyo 2009 Mitsubishi H.I. Time-charter
Total (7 vessels)
OWNED LGCs
Name Year built Shipyard Ownership (%)
BW Havfrost 1991 Kvaerner-Govan 86%
BW Havis 1993 Kvaerner-Govan 78%
BW Helios 1992 Kvaerner-Govan 100%
BW Nantes 2003 Kawasaki S.C. 100%
BW Nice 2003 Kawasaki S.C. 100%
Total (5 vessels)
NEWBUILD VLGCs
Name Delivery Shipyard Ownership
Hull No. 2736 2016 Hyundai H.I. 100%
Hull No. 2737 2016 Hyundai H.I. 100%
Hull No. 2351 2016 DSME 100%
Hull No. 2352 2016 DSME 100%
Hull No. 2353 2016 DSME 100%
Hull No. 2354 2017 DSME 100%
Total (6 vessels)
5
6
Our Blue Chip Customer Base
National
Oil Companies
International
Oil Companies
International
Trading
Companies
7
2015 Seaborne LPG Exports by Country/Region (Mt)
2015 Seaborne LPG Imports by Country/Region (Mt)
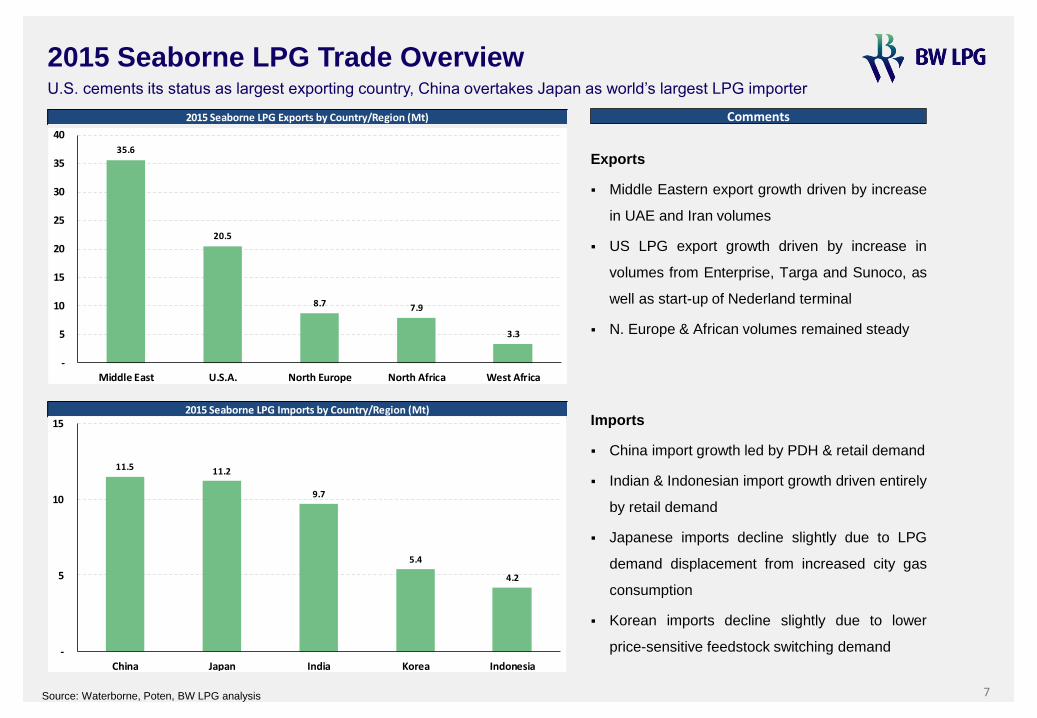
35.6
20.5
8.7 7.9
3.3
-
5
10
15
20
25
30
35
40
Middle East U.S.A. North Europe North Africa West Africa
11.5 11.2
9.7
5.4
4.2
-
5
10
15
China Japan India Korea Indonesia
Source: Waterborne, Poten, BW LPG analysis
Comments
2015 Seaborne LPG Trade Overview U.S. cements its status as largest exporting country, China overtakes Japan as world’s largest LPG importer
Exports
Middle Eastern export growth driven by increase
in UAE and Iran volumes
US LPG export growth driven by increase in
volumes from Enterprise, Targa and Sunoco, as
well as start-up of Nederland terminal
N. Europe & African volumes remained steady
Imports
China import growth led by PDH & retail demand
Indian & Indonesian import growth driven entirely
by retail demand
Japanese imports decline slightly due to LPG
demand displacement from increased city gas
consumption
Korean imports decline slightly due to lower
price-sensitive feedstock switching demand
Source: Argus, BW LPG analysis. All data for CY 2014, 2015 final data will be available by Q2 2016. 8
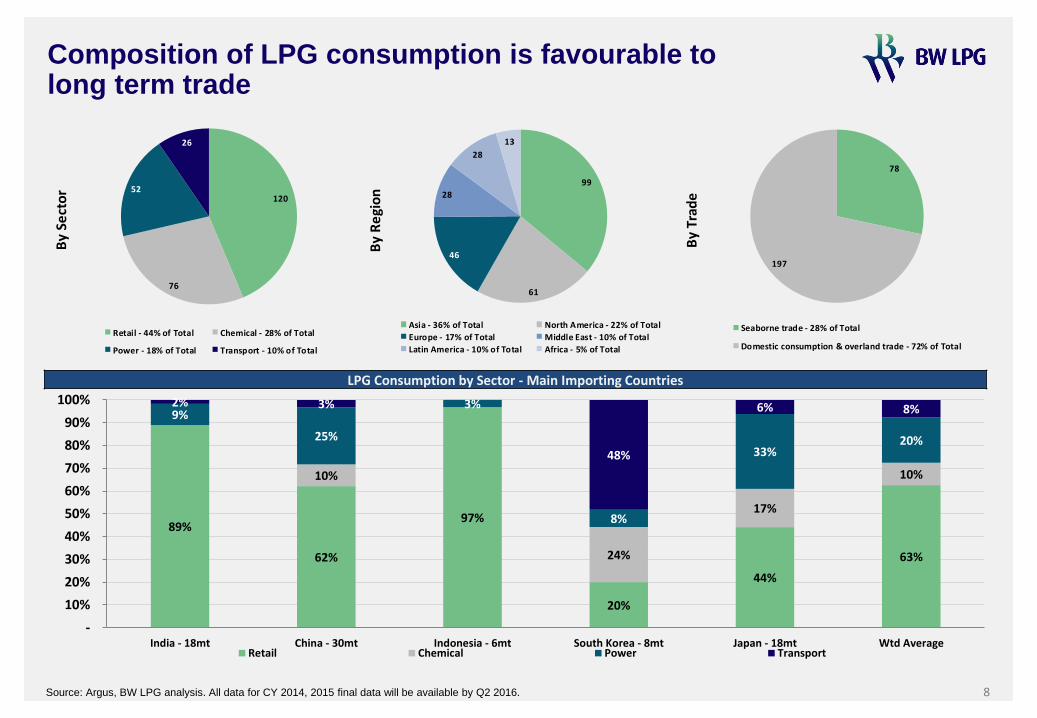
Composition of LPG consumption is favourable to long term trade
89%
62%
97%
20%
44%
63%
10%
24%
17%
10%
9%
25%
3%
8%
33% 20%
2% 3%
48%
6% 8%
-
10%
20%
30%
40%
50%
60%
70%
80%
90%
100%
India - 18mt China - 30mt Indonesia - 6mt South Korea - 8mt Japan - 18mt Wtd AverageRetail Chemical Power Transport
LPG Consumption by Sector - Main Importing Countries
By
Sect
or
120
76
52
26
Retail - 44% of Total Chemical - 28% of Total
Power - 18% of Total Transport - 10% of Total
By
Re
gio
n
99
61
46
28
28
13
Asia - 36% of Total North America - 22% of Total
Europe - 17% of Total Middle East - 10% of Total
Latin America - 10% of Total Africa - 5% of Total
By
Trad
e
78
197
Seaborne trade - 28% of Total
Domestic consumption & overland trade - 72% of Total
Source: EIA March 2016 STEO, BW LPG analysis 9
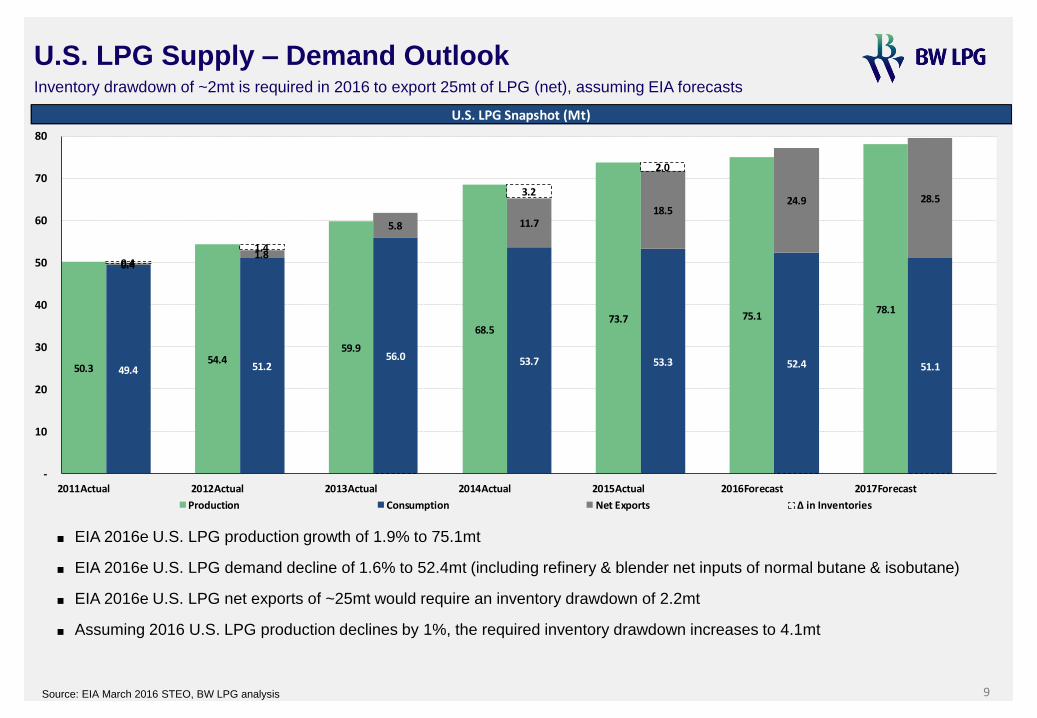
U.S. LPG Supply – Demand Outlook Inventory drawdown of ~2mt is required in 2016 to export 25mt of LPG (net), assuming EIA forecasts
■ EIA 2016e U.S. LPG production growth of 1.9% to 75.1mt
■ EIA 2016e U.S. LPG demand decline of 1.6% to 52.4mt (including refinery & blender net inputs of normal butane & isobutane)
■ EIA 2016e U.S. LPG net exports of ~25mt would require an inventory drawdown of 2.2mt
■ Assuming 2016 U.S. LPG production declines by 1%, the required inventory drawdown increases to 4.1mt
U.S. LPG Snapshot (Mt)
50.3 54.4
59.9
68.5 73.7 75.1
78.1
49.4 51.2 56.0 53.7 53.3 52.4 51.1
0.4 1.8
5.8 11.7 18.5
24.9 28.5
0.4
1.4
3.2
2.0
-
10
20
30
40
50
60
70
80
2011Actual 2012Actual 2013Actual 2014Actual 2015Actual 2016Forecast 2017Forecast
Production Consumption Net Exports Δ in Inventories
Source: EIA, BW LPG analysis 10
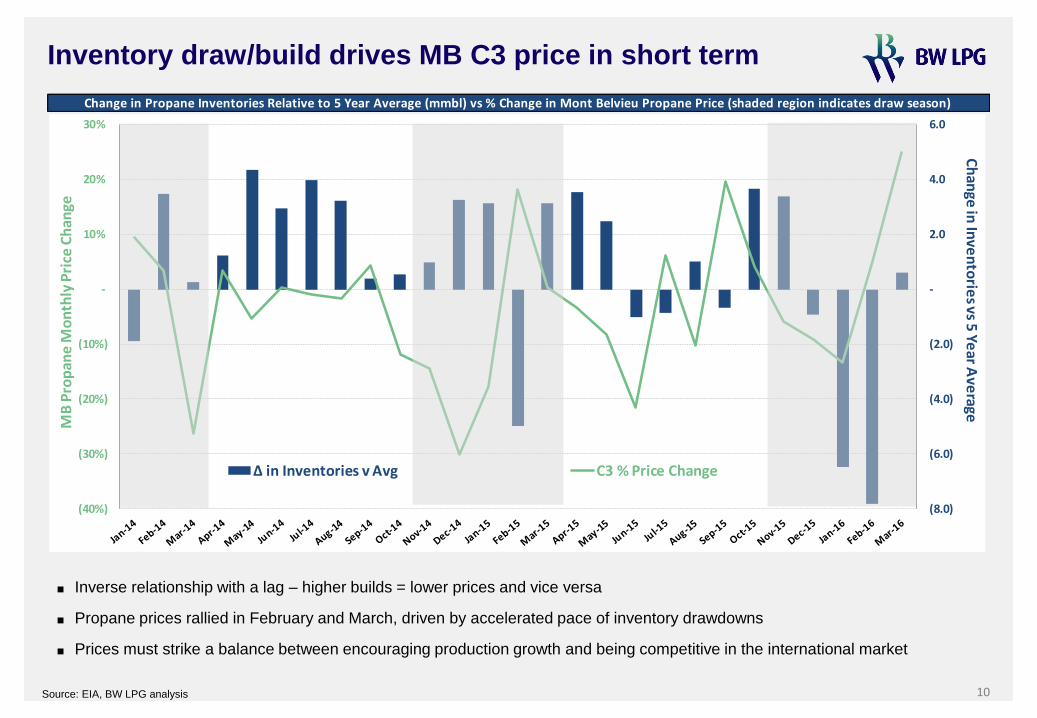
Inventory draw/build drives MB C3 price in short term
■ Inverse relationship with a lag – higher builds = lower prices and vice versa
■ Propane prices rallied in February and March, driven by accelerated pace of inventory drawdowns
■ Prices must strike a balance between encouraging production growth and being competitive in the international market
Change in Propane Inventories Relative to 5 Year Average (mmbl) vs % Change in Mont Belvieu Propane Price (shaded region indicates draw season)
(8.0)
(6.0)
(4.0)
(2.0)
-
2.0
4.0
6.0
(40%)
(30%)
(20%)
(10%)
-
10%
20%
30%
Ch
ange
in In
ven
torie
s vs 5 Ye
ar Ave
rageM
B P
rop
ane
Mo
nth
ly P
rice
Ch
ange
Δ in Inventories v Avg C3 % Price Change
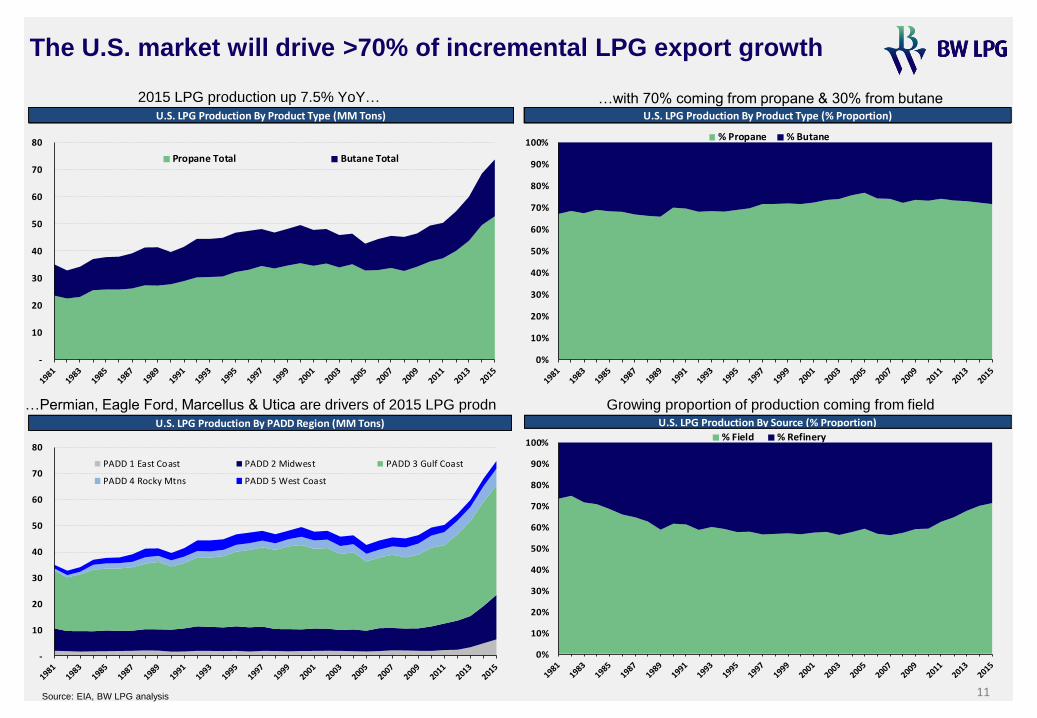
The U.S. market will drive >70% of incremental LPG export growth
Source: EIA, BW LPG analysis
2015 LPG production up 7.5% YoY… …with 70% coming from propane & 30% from butane
Growing proportion of production coming from field …Permian, Eagle Ford, Marcellus & Utica are drivers of 2015 LPG prodn
11
U.S. LPG Production By Source (% Proportion)
0%
10%
20%
30%
40%
50%
60%
70%
80%
90%
100%% Field % Refinery
U.S. LPG Production By PADD Region (MM Tons)
-
10
20
30
40
50
60
70
80
PADD 1 East Coast PADD 2 Midwest PADD 3 Gulf Coast
PADD 4 Rocky Mtns PADD 5 West Coast
U.S. LPG Production By Product Type (MM Tons) U.S. LPG Production By Product Type (% Proportion)
-
10
20
30
40
50
60
70
80
Propane Total Butane Total
U.S. LPG Production By Product Type (% Proportion)
0%
10%
20%
30%
40%
50%
60%
70%
80%
90%
100%% Propane % Butane
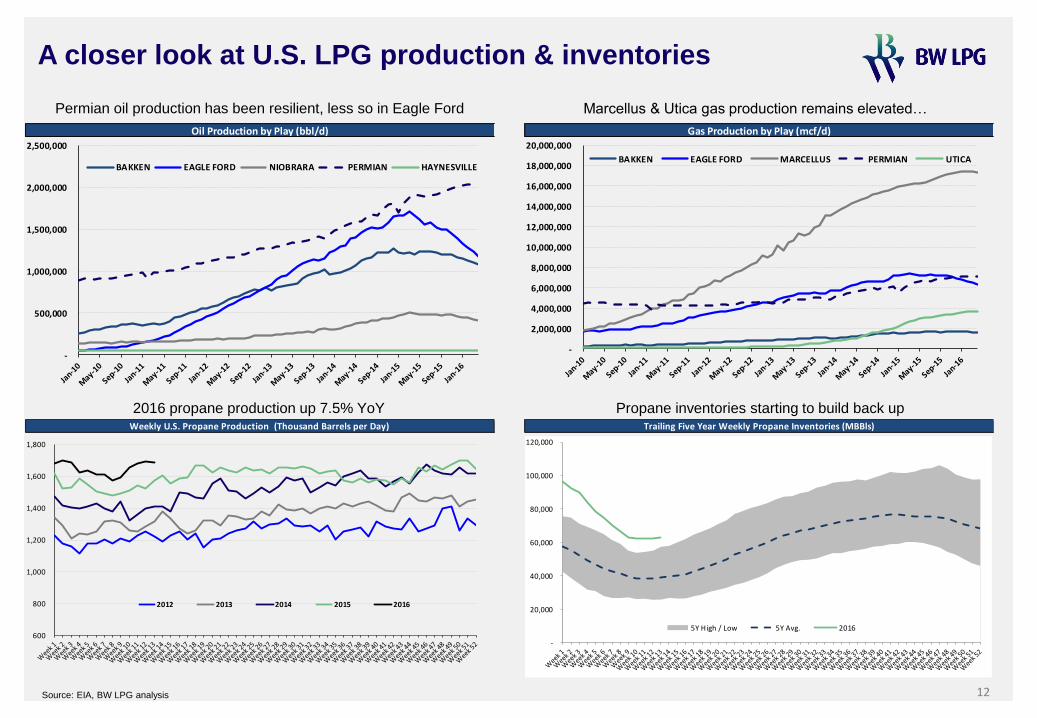
A closer look at U.S. LPG production & inventories
Source: EIA, BW LPG analysis
Permian oil production has been resilient, less so in Eagle Ford
Propane inventories starting to build back up
12
Oil Production by Play (bbl/d) Gas Production by Play (mcf/d)
-
500,000
1,000,000
1,500,000
2,000,000
2,500,000
BAKKEN EAGLE FORD NIOBRARA PERMIAN HAYNESVILLE
Gas Production by Play (mcf/d)
-
2,000,000
4,000,000
6,000,000
8,000,000
10,000,000
12,000,000
14,000,000
16,000,000
18,000,000
20,000,000
BAKKEN EAGLE FORD MARCELLUS PERMIAN UTICA
Marcellus & Utica gas production remains elevated…
Trailing Five Year Weekly Propane Inventories (MBBls)
-
20,000
40,000
60,000
80,000
100,000
120,000
5Y High / Low 5Y Avg. 2016
Weekly U.S. Propane Production (Thousand Barrels per Day)
600
800
1,000
1,200
1,400
1,600
1,800
2012 2013 2014 2015 2016
2016 propane production up 7.5% YoY
13
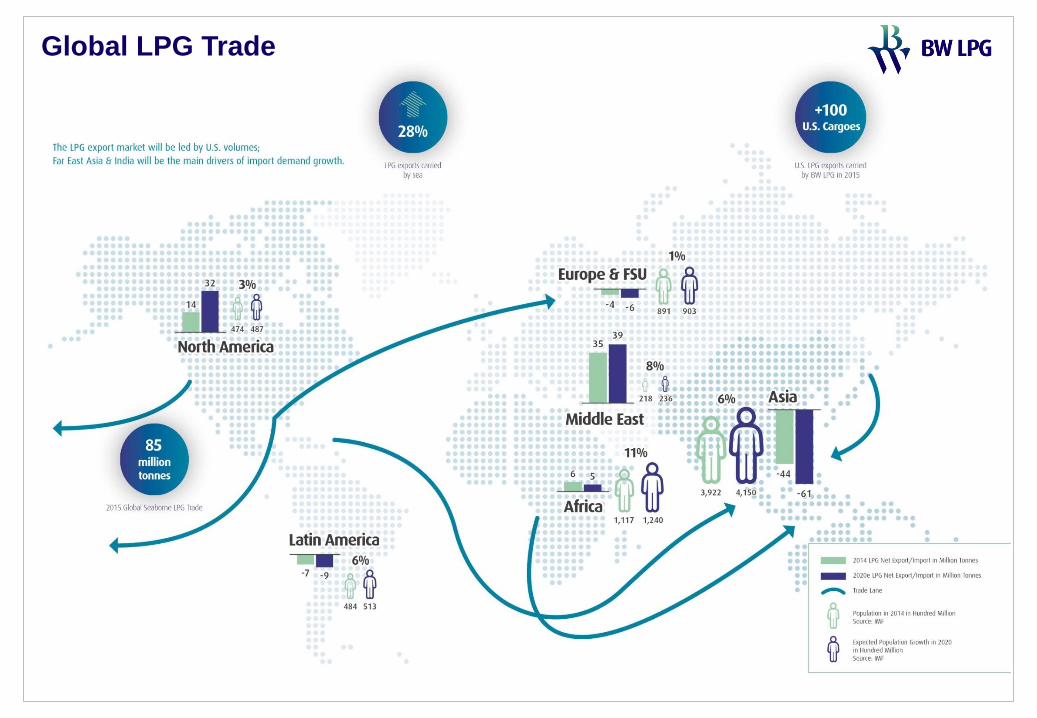
Global LPG Trade
14
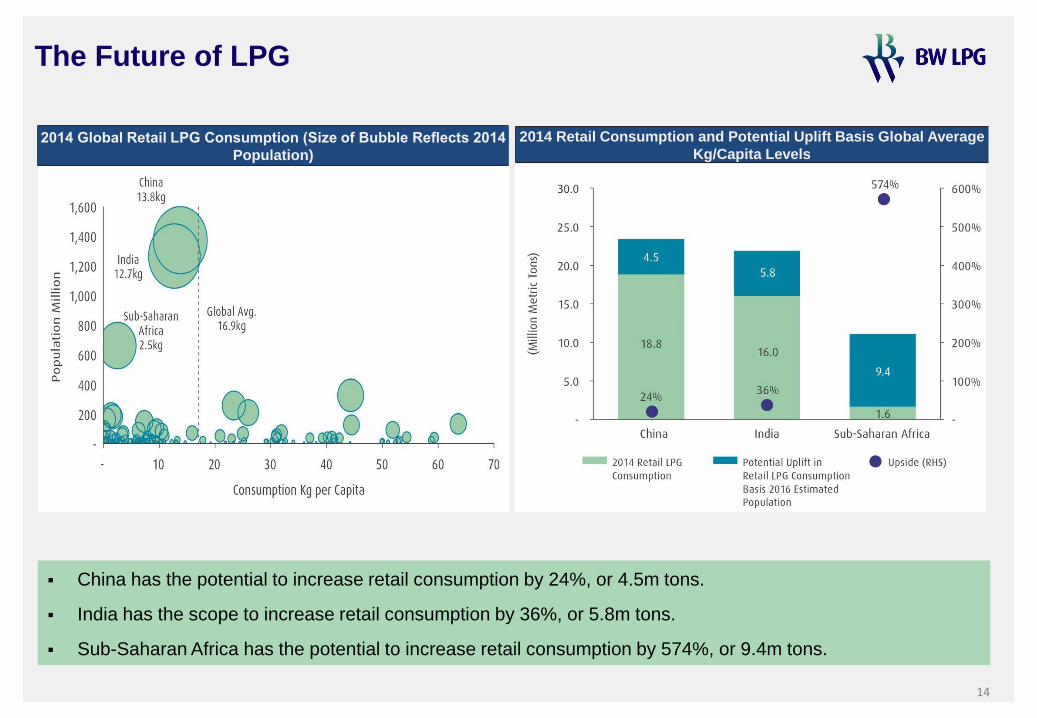
The Future of LPG
2014 Global Retail LPG Consumption (Size of Bubble Reflects 2014
Population)
2014 Retail Consumption and Potential Uplift Basis Global Average
Kg/Capita Levels
China has the potential to increase retail consumption by 24%, or 4.5m tons.
India has the scope to increase retail consumption by 36%, or 5.8m tons.
Sub-Saharan Africa has the potential to increase retail consumption by 574%, or 9.4m tons.