Forward Contracts in Electricity Markets: the … balancing market. The standard financial...
34
Forward Contracts in Electricity Markets: the Australian Experience Edward J Anderson and Xinmin Hu Australian Graduate School of Management University of New South Wales, Sydney, NSW 2052, Australia Donald Winchester Faculty of Commerce & Economics University of New South Wales, Sydney, NSW 2052, Australia Abstract Forward contracts play a vital role in all electricity markets, and yet the details of the market for forward contracts are often opaque. In this paper we review the existing literature on forward contracts and explore the contracting process as it operates in Australia. The paper is based on interviews with participants in Australia’s National Electricity Market. The interviews were designed to understand the contracting process and the practice of risk management in the Australian energy-only pool market. This survey reveals some significant gaps between the assumptions made in the academic literature and actual practice in the Australian market place. 1 Introduction Wholesale markets for electricity are complex, and their structure varies from one country to another. However, they have in common the characteristic that spot prices for electricity are highly volatile. This is a consequence of the inability to store electric power at any significant scale, so that power consumption and generation need to match each other very closely. Electricity demand is highly variable (e.g. with time of day and weather) and the volatility in price is exacerbated by the way that consumers are usually charged a fixed retail price independent of the spot market price. In this situation various types of generator reserves play an important role in ensuring stability of supply, with the necessary balancing role being 1
Transcript of Forward Contracts in Electricity Markets: the … balancing market. The standard financial...
Forward Contracts in Electricity Markets: the Australian
Experience
Edward J Anderson and Xinmin Hu
Australian Graduate School of Management
University of New South Wales, Sydney, NSW 2052, Australia
Donald Winchester
Faculty of Commerce & Economics
University of New South Wales, Sydney, NSW 2052, Australia
Abstract Forward contracts play a vital role in all electricity markets, and yet the details
of the market for forward contracts are often opaque. In this paper we review the existing
literature on forward contracts and explore the contracting process as it operates in Australia.
The paper is based on interviews with participants in Australia’s National Electricity Market.
The interviews were designed to understand the contracting process and the practice of risk
management in the Australian energy-only pool market. This survey reveals some significant
gaps between the assumptions made in the academic literature and actual practice in the
Australian market place.
1 Introduction
Wholesale markets for electricity are complex, and their structure varies from one country
to another. However, they have in common the characteristic that spot prices for electricity
are highly volatile. This is a consequence of the inability to store electric power at any
significant scale, so that power consumption and generation need to match each other very
closely. Electricity demand is highly variable (e.g. with time of day and weather) and the
volatility in price is exacerbated by the way that consumers are usually charged a fixed retail
price independent of the spot market price. In this situation various types of generator reserves
play an important role in ensuring stability of supply, with the necessary balancing role being
1
played by a ‘system operator’ who has the ability to dispatch generation. The system operator
also needs to manage the network requirements, solving power flow problems in the network
and taking account of transmission constraints.
Within this framework, forward markets play a crucial role. At one level, market partic-
ipants need to engage in bids and offers in advance of real time simply to enable the system
operator to look ahead and ensure physical feasibility of the proposed schedule. At another
level, the forward markets provide a way for participants to manage the risk associated with
the inherent volatility of the spot market. In this paper we will focus on forward markets for
energy, though forward markets may also exist for reserves, for transmission capacity and for
greenhouse gas emissions (or environmental products).
Many markets contain a provision for day-ahead trading. This time frame is a natural
one since it enables the system operator to plan against congestion on major transmission
lines and also gives generators the opportunity to plan on a daily basis taking account of unit
availability and constraints as well as predicted demand. The day-ahead market often takes
place through an exchange - which is the natural form when contracts are made with a market
manager, rather than bilaterally. The market manager then balances aggregate demand and
supply1. But a day-ahead exchange is not a necessary part of the structure of an electricity
market; and there is no equivalent to a day-ahead exchange in Australia.
Bilateral trades between generators and retailers (or large consumers) are the dominant
form of forward trading in electricity markets. But bilateral trades can also take place between
generators or with other intermediaries. Markets differ in whether forward contracts are
physical or purely financial. With a physical contract a generator makes a commitment
to provide a certain amount of electricity. If the generator is not able to do so when it
comes to real time then it will have to purchase the additional power in the spot market.
Under this arrangement the spot market only accounts for a proportion of the power actually
consumed. With financial contracts the payments under the contract are made in addition to
the payments for power, but are linked to the spot price. With these contracts all the power
consumed is traded through the spot market. When the spot market accounts for all the trade
in wholesale electricity, it is called a ‘gross pool’; as opposed to a ‘net pool’ in which only the
residual demand is traded, with bilateral forward trades netted out. A net pool is a type of
1In PJM, the PJM ISO operates the day ahead scheduling market; in Nord Pool, Nord Pool Spot AS operates
a day ahead spot market; in Texas, ERCOT operates a day ahead balancing market (although adjustments are
allowed up to one hour ahead).
2
real-time balancing market.
The standard financial instrument for forward contracts in electricity markets is a swap
(sometimes called a ‘contract for differences’ in this context). The contract is for a particular
quantity Q at a strike price f , which simply represents the agreement of the retailer (or buying
party) to pay the generator (or selling party) an amount $(f−p)Q after the spot market price p
is determined. If the spot market price ends up being higher than the strike price then the
retailer will receive money from the generator rather than the other way around. In some ways
the difference between a physical contract and a financial swap contract is not very great: the
payments made between the parties are equivalent.
There are many ways in which market structures can be set up, and this includes the
arrangements for forward contracts. This is particularly true for a net pool. For example, in
the former California market (where long-term contracts were not allowed) and the Nordic
electricity market, a centralized auction market (Power Exchange Market) trades contracts
with contract time windows from a day ahead to a few months ahead, or longer. While in
the current markets in both England and Wales and California, bilateral contracts are signed
without any system operator involvement. In these markets, buyers and producers are forced
to enter into contracts. However, in gross pool markets such as Australia, contracts between
market participants are voluntary. Both in the UK and California, the system operator runs
a balancing market which has relatively low volume: in the UK, it is about 5% of the total
delivery and in California, less than 10%.
Bilateral contracts may operate over a long period of time. For example, Australia and
some other countries like the UK, that have privatized publicly owned generating capacity,
chose to put in place so-called ‘vesting contracts’ for a large part of the generation capacity in
advance of selling the generation assets. These have the aim of reducing the risk to purchasers
of privatised assets in the context of a newly created market for electricity. These contracts
are in the form of swaps to run for a number of years (in Australia these have now expired).
Also contracts for the provision of power to industries such as aluminium smelters have often
been signed over periods of many years, particularly at the time when smelting capacity is
constructed. Nevertheless the typical length of time that a contract runs is either for a quarter
or a year, with many contracts signed one or two years ahead of time. Long-term contracts
clearly carry a large risk that the market environment changes substantially leaving one or
other party at a severe disadvantage. For example when California faced its energy crisis, the
3
state government changed the market rules and signed a number of long-term contracts with
generators to ensure adequate supply. However, in retrospect it is clear that it bought too
much at too high a strike price and this led to the requirement to renegotiate these contracts.
Long-term contracts have an important role in the entry of new participants in the market,
and particularly when new generation capacity has to be built. On the one hand, retailers can
sign long-term contracts with a new generator entrant to ensure a stable and forecastable cash
flow to the investors, which will therefore make the investment decision less risky and facilitate
new entry. On the other hand, incumbent generators can use their long-term contracts to deter
entries (see Newbery (1998)); as we will see below, high contract levels can lead to lower spot
market prices and make the market unprofitable to new entrants.
A comparison with trade in other commodities might lead one to expect there to be active
secondary markets in various types of traded financial instrument. However in many elec-
tricity markets there is relatively little secondary trading activity. During the 1990’s trade
in energy derivatives was widely expected to increase as electricity markets around the world
matured, however in most markets growth in volume has been slow. There are a number of
possible explanations. First the collapse of Enron in December 2001 may have had a dampen-
ing effect on such trading activity. Enron was a major participant in a number of derivative
markets (see Energy Information Administration Report (2002)). Secondly the important role
of generators themselves in trading in electricity markets and at the same time in determin-
ing prices in the primary market increases the risk for speculators in comparison with other
commodity futures. This is related to the competitiveness of the underlying physical (spot)
market (see Energy Information Administration Report (2002) and Eydeland and Wolyniec
(2003)). Certainly there are relatively few speculators operating in electricity forward mar-
kets, in comparison with the retailers and generators who are participants in the primary
market. Thirdly the relatively recent introduction of many energy markets, coupled with the
extraordinary importance of electrical power in national economies and citizen’s lives, have
meant that regulators have frequently changed the rules for the operation of these markets.
Speculators may feel that the significant degree of regulatory risk make electricity markets
less attractive.
The market for bilateral contracts is often referred to as an over-the-counter (OTC) market.
Another important form of forward contracting takes place in a futures exchange. There is
evidence that some exchanges have had problems because of the reluctance of speculators
4
to engage in trading on such exchanges. For example, Moulton (2005), in his analysis of
the failure of the market for Californian electricity futures traded on NYMEX, argues that
speculators leaving this market was the key factor in its demise, since hedgers alone did not
provide enough activity to give appropriate hedge cover in all circumstances.2
There are many issues in relation to forward markets for electricity that are not well-
documented, particularly in respect to the OTC contract market. For example, how do
market participants use contracts in their risk management? What factors do they consider in
negotiating contracts? How do they select contract counter parties and what form do contract
negotiations take? This paper tries to answer some of these questions for the Australian market
and in so doing fill some of the gaps between academic discussion in this area and actual
practice. The paper is organized as follows: We beginning by giving a general discussion
of the connection between the forward and spot markets. Then section 3 introduces the
Australian National Electricity Market and electricity derivatives markets. Section 4 presents
our survey results based on interviews with retailers, generators, brokers and intermediaries.
Finally, in section 5, we conclude with a discussion of some of the important trends in this
market.
2 The connection between forward and spot markets
The existence of forward contracts changes the behaviour of generators in the spot market.
Across a range of different market structures, a player who already holds a contract for some
part of their possible production will choose to offer at a lower price in the spot market (or
if the spot market has a Cournot structure, offer a greater total quantity). Because a firm’s
optimal reaction function is more competitive if it holds a forward contract, in equilibrium
this results in a lower price in the spot market.
As an example of this we briefly describe the simplest case where two symmetric firms (i,
j) compete in a Cournot spot market (as in Allaz and Vila (1993)). Suppose that demand is
linear and units are normalized so that the price in the spot market is given by p = a− qi − qj
when the generators offer qi and qj. If the costs of production are fixed at c per unit and
player i holds an existing contract for an amount Qi at a price f , then the profit function for
2NYMEX started electricity futures contract trading in April 1996, but it delisted all five products for
electricity futures contracts in February 2002 due to lack of interest.
5
player i is
πi(qi, qj) = (a − qi − qj)(qi − Qi) + fQi − cqi.
Thus the optimal choice for the quantity sold for generator i is
qi =a − c + Qi − qj
2,
so that qi is increasing with the contract quantity Qi. With this arrangement we reach an
equilibrium price in the spot market of
p =a + 2c − Qi − Qj
3
Bushnell (2005) extends this result to the case of n firms with quadratic cost functions.
The nature of electricity spot markets is not particularly well represented by a Cournot
model. A more realistic representation includes the fact that generator offers will take the
form of a schedule of prices and quantities. This has led to the application of supply function
equilibrium ideas introduced by Klemperer and Meyer (1989). Green (1999) shows that, when
supply function offers are restricted to be linear functions, an analysis similar to the above
can be carried out linking the equilibrium outcome to the amount of contracts held by both
generators. The conclusion is the same as drawn by Allaz and Vila – the existence of contracts
will reduce the price in the spot market. Wolak (2000) also discusses the reasons for this result
in a general context.
The majority of work in this area has assumed that, if the players are risk neutral, then
the price for contracts will be the same as the expected price in the spot market. With this
no-arbitrage assumption the generator profits are reduced as a result of holding contracts and
a question arises as to why generators should enter into forward contracts at all. Allaz and
Vila argue for a type of prisoner’s dilemma behaviour in their model. If just one of the two
firms enters into a forward contract then doing so will enable him to make greater profits (at
the expense of the other player). However when both players enter into contracts both are
worse off. When considered as a two player game, where each player chooses to contract or
not, then the only equilibrium has both players choosing to enter forward contracts. Green
(1999) shows that, with the slightly different structure arising from supply functions, the result
will depend critically on the conjectures that firms make about their rivals behaviour in the
contract market. If a firm assumes that taking up a contract will reduce the total contract
cover of its rival, then it will sign forward contracts; but if a firm assumes that its behaviour
in the contract market has no effect on the rivals contract cover, then it will not do so.
6
There is some controversy over whether, in a risk neutral context, we may expect forward
prices to match spot prices in expectation. Powell (1993) introduces a model in which this
does not occur, and Anderson and Hu (2005) argue that in electricity markets there will exist
a strategic premium to encourage generators to sign forward contracts, given the negative
impact of forward contracts on the generators’ market power in the spot market. This opens
up at least the theoretical possibility of a “free rider” effect. Since forward contracts increase
competition among generators in the spot market, the spot market price will be lower than
when the contracts were not signed. Therefore, those retailers or users who have entered
contracts with generators will have paid a (high) contract price to bring the spot market price
down and those who do not contract will benefit from the lower spot market price without
incurring any cost.
There is also considerable uncertainty about the exact process by which bilateral contracts
are negotiated. In fact researchers in this area have made different assumptions about the
process of contract negotiation. In Powell (1993), the contracting process is modelled by
assuming that generators decide the contract price and then retailers decide the contract
quantities. However the opposite is assumed in Green (1999) in the contract stage, where
generators and buyers of the contracts determine the contract quantities and contract prices
respectively. While in Anderson (2004), both the contract and the spot markets are modelled
as centralized auction markets where generators bid in the form of supply functions.
In practice the dominant motivation for contracts is that they fulfil a hedging role, to
enable participants in the market to reduce their risk, given highly volatile prices in the spot
market. Here the generators and retailers form natural hedging counter-parties: a forward
contract serves to reduce the risk for both of them. In addition we might expect that in these
markets there would be opportunities for risk averse players to sign contracts with speculators
(risk takers). In this environment risk averse players pay risk premiums to enter contracts
with other parties and transfer some risk to the sellers of the contracts.
Bessembinder and Lemmon (2002) consider a model with a competitive spot market in
which participants have mean-variance utility functions. They also look at empirical data
on the difference between spot and forward (one month ahead) prices for both PJM and the
Californian market. Empirical relationships between the forward market and spot market
are examined in Lucia and Schwartz (2002) for the Nordic Pool; and by Shawky and Barrett
(2003) for the wholesale prices at the California-Oregon Border (COB) and the NYMEX
7
futures prices for electricity delivered at COB.
3 Australian National Electricity Market
The Australian National Electricity Market (NEM) started its operation in 1998 with four
states: New South Wales (NSW), Victoria (VIC), Queensland (QLD), and South Australia
(SA), together with the Australian Capital Territory (ACT). The fifth state, Tasmania (TAS)
joined the NEM in 2005 (though a physical link will only occur when the Basslink is com-
pleted). The NEM is a mandatory gross pool market. Any units with capacity more than
30 MW must sell their generation through the NEM and the sales and purchases are settled
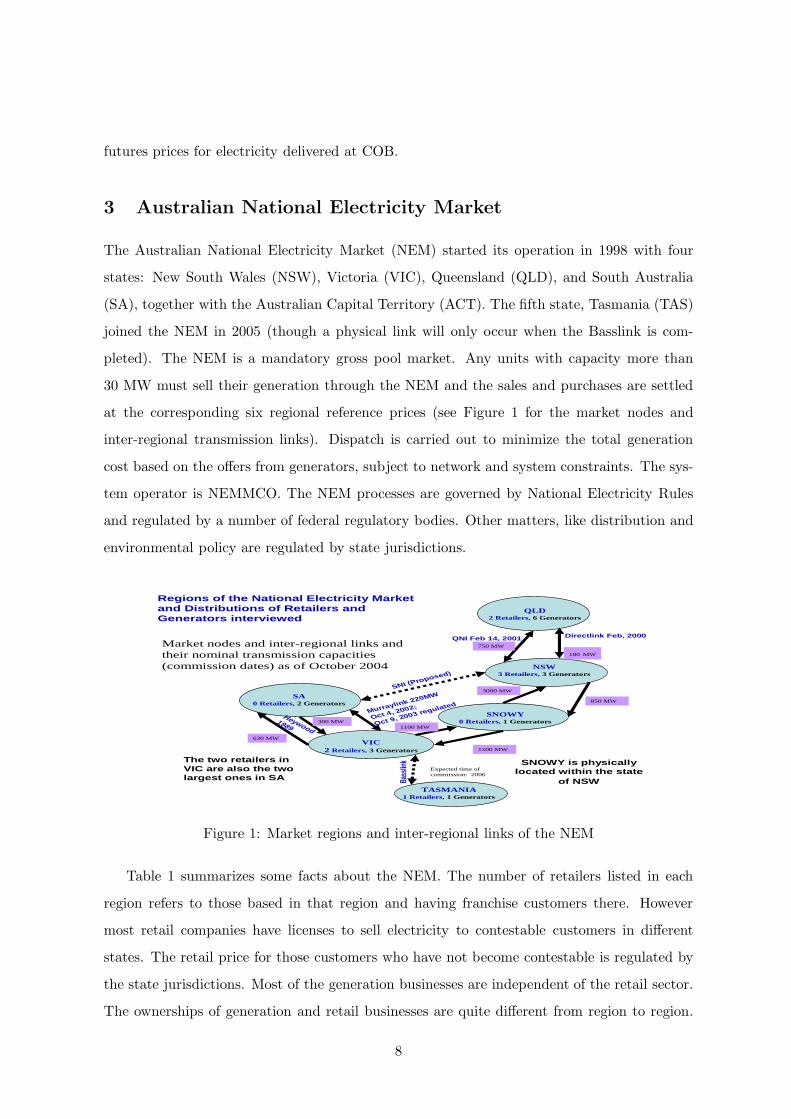
at the corresponding six regional reference prices (see Figure 1 for the market nodes and
inter-regional transmission links). Dispatch is carried out to minimize the total generation
cost based on the offers from generators, subject to network and system constraints. The sys-
tem operator is NEMMCO. The NEM processes are governed by National Electricity Rules
and regulated by a number of federal regulatory bodies. Other matters, like distribution and
environmental policy are regulated by state jurisdictions.
Market nodes and inter-regional links and their nominal transmission capacities (commission dates) as of October 2004
Regions of the National Electricity Marketand Distributions of Retailers and Generators interviewed
QLD 2 Retailers, 6 Generators
180 MW
750 MW
3000 MW
850 MW
1500 MW
1100 MW
630 MW
300 MW
Expected time of commission: 2006
Directlink Feb, 2000
SNOWY is physically located within the state
of NSW
Murraylink 220MW
Oct 4, 2002;
Oct 9, 2003 regulated
Heywood
1989
QNI Feb 14, 2001
SNI (Proposed)NSW
3 Retailers, 3 Generators
SNOWY 0 Retailers, 1 Generators
TASMANIA 1 Retailers, 1 Generators
VIC 2 Retailers, 3 Generators
SA 0 Retailers, 2 Generators
The two retailers in VIC are also the two largest ones in SA Ba
sslin
k
Figure 1: Market regions and inter-regional links of the NEM
Table 1 summarizes some facts about the NEM. The number of retailers listed in each
region refers to those based in that region and having franchise customers there. However
most retail companies have licenses to sell electricity to contestable customers in different
states. The retail price for those customers who have not become contestable is regulated by
the state jurisdictions. Most of the generation businesses are independent of the retail sector.
The ownerships of generation and retail businesses are quite different from region to region.
8
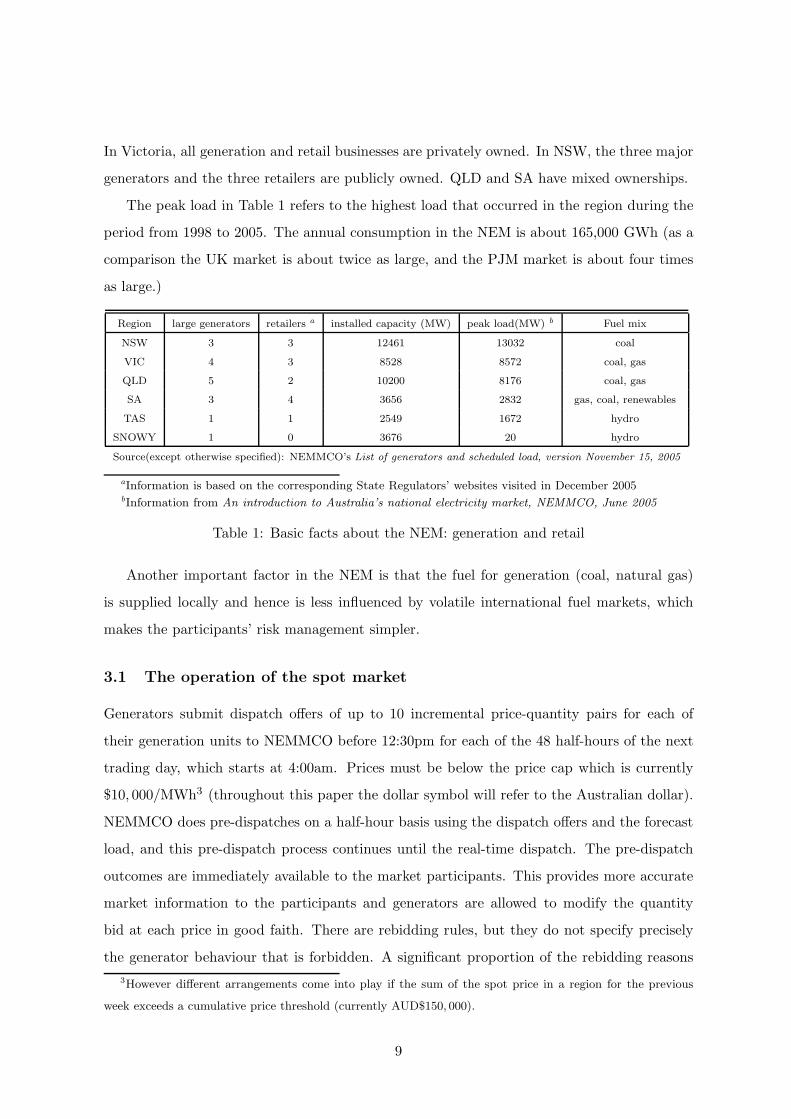
In Victoria, all generation and retail businesses are privately owned. In NSW, the three major
generators and the three retailers are publicly owned. QLD and SA have mixed ownerships.
The peak load in Table 1 refers to the highest load that occurred in the region during the
period from 1998 to 2005. The annual consumption in the NEM is about 165,000 GWh (as a
comparison the UK market is about twice as large, and the PJM market is about four times
as large.)
Region large generators retailers a installed capacity (MW) peak load(MW) b Fuel mix
NSW 3 3 12461 13032 coal
VIC 4 3 8528 8572 coal, gas
QLD 5 2 10200 8176 coal, gas
SA 3 4 3656 2832 gas, coal, renewables
TAS 1 1 2549 1672 hydro
SNOWY 1 0 3676 20 hydro
Source(except otherwise specified): NEMMCO’s List of generators and scheduled load, version November 15, 2005
aInformation is based on the corresponding State Regulators’ websites visited in December 2005bInformation from An introduction to Australia’s national electricity market, NEMMCO, June 2005
Table 1: Basic facts about the NEM: generation and retail
Another important factor in the NEM is that the fuel for generation (coal, natural gas)
is supplied locally and hence is less influenced by volatile international fuel markets, which
makes the participants’ risk management simpler.
3.1 The operation of the spot market
Generators submit dispatch offers of up to 10 incremental price-quantity pairs for each of
their generation units to NEMMCO before 12:30pm for each of the 48 half-hours of the next
trading day, which starts at 4:00am. Prices must be below the price cap which is currently
$10, 000/MWh3 (throughout this paper the dollar symbol will refer to the Australian dollar).
NEMMCO does pre-dispatches on a half-hour basis using the dispatch offers and the forecast
load, and this pre-dispatch process continues until the real-time dispatch. The pre-dispatch
outcomes are immediately available to the market participants. This provides more accurate
market information to the participants and generators are allowed to modify the quantity
bid at each price in good faith. There are rebidding rules, but they do not specify precisely
the generator behaviour that is forbidden. A significant proportion of the rebidding reasons
3However different arrangements come into play if the sum of the spot price in a region for the previous
week exceeds a cumulative price threshold (currently AUD$150, 000).
9
submitted to NEMMCO by generators are related to their contract positions (see Hu and
Batten (2005)).
The real-time dispatch takes place as in the pre-dispatch model except for the use of
real-time network conditions and more accurate load targets. The real-time dispatch is on
a 5-minute basis. In each of the 5-minute periods, a price for each region is determined by
minimizing the generation cost to meet the load. The market clearing price (RRP) for each
region is the average of the six 5-minute prices. Generators are paid and retailers are charged
the RRP for the half hour (modified by loss factors according to their location relative to the
reference node in their region).
3.2 Secondary financial and emissions trading markets
Electricity prices in pool markets around the world are one of the most volatile of commodity
prices (see Energy Information Administration Report (2002), Eydeland and Wolyniec (2003)).
Price spikes occur because of variations in demand (often as a result of weather conditions
since much demand is temperature-driven) and outages of generators or transmission lines.
This is compounded by generator bidding behaviour. So it is not surprising that various
electricity derivatives are traded to manage the financial risks for market participants.
Currently in Australia there are three types of forward trading activity, and we describe
these briefly here.
• Bilateral OTC trades negotiated directly between the two parties. The con-
tract counter-parties negotiate the terms and the structure of the contract. This flex-
ibility is valuable in matching the particular hedging requirements of the participants.
OTC trades can be based around swaps or involve option contracts.
• Bilateral OTC trades on standard products executed through brokers using
screens. The electricity derivatives traded through brokers are swaps, and standard
option contracts (primarily caps, but also floors, swaptions, and Asian options). Prices
for these products are shown on the screens and participants are able to agree the
contract price electronically. At this point a participant discovers who the counter-party
is and completes the contract with a bilateral agreement. There are about 6 brokers
in the electricity OTC markets, who charge a commission fee for a contract they have
facilitated, but do not have an interest in the contract itself.
10
• Derivative products traded on the Sydney Futures Exchange (SFE)4. A num-
ber of standard contracts are sold as futures, with the resultant need for participants
to pay (daily) margin calls over time once the futures contract is agreed. The two key
advantages of this form of forward trading are that the trade is entirely anonymous and
the use of margin calls mean that credit risk is essentially eliminated. D-cyphaTrade
operates an electricity trading facility on the SFE, where electricity futures contracts
have been traded since 2002. The types of products have changed over time. There
has been significant growth of futures volume over the last year and the trading volume
in the 12 months to February 2006 covered about 22% 5 of the physical energy in the
NEM.
The OTC brokers and exchanges have a valuable role within the market: they bring trading
partners together; operate screen systems; and provide data and other specialist services.
In addition to trades in the forward market being made by (physical) market participants,
there are a number of market traders who do not have either generation facilities or energy
consumers; sometimes these are called intermediaries. But according to some participants,
only two significant market intermediaries were active at the time of the interviews.
A complicating factor in the forward markets are State-based schemes introduced to protect
retailers from pool price volatility. The NSW government set up the Electricity Tariff Equal-
ization Fund (ETEF) in 2001. This provides a type of swap contract for the non-contestable
load (the franchise customers), but the strike price is the regulated tariff determined by the
NSW Treasury. Under this arrangement retailers contribute to the fund whenever spot prices
are lower than the regulated tariff for franchise customers, and they are paid from the fund
when the reverse is true. In the event that the fund falls to a low level, NSW generators are
called on to pay into the fund, according to their relative generation proportions. The volume
of demand covered by ETEF has slowly reduced as retail competition has removed franchise
customers.6 Queensland operates long-term energy procurement arrangements with a similar
aim to ETEF, but this scheme works in a different way since generators are not involved. Pay-
4In addition to the SFE, the Australian Stock Exchange has also operated a futures market. The participants
we talked to did not use this exchange - it seems to be no longer active.5According to d-cyphaTrade’s Energy Focus, Issue 6, February 20066In 2003, ETEF covered 33% of the NSW demand according to Australian National Competition Council:
2003 Assessment of Governments’ Progress in Implementing the National Competition Policy and Related
Reforms.
11
ments are made to retailers from the Queensland Treasury for community service obligations
- to support a uniform retail price for electricity, but retailers pay the Treasury in the event
that their revenue exceeds expenses.
In addition to forward trading based on the spot price of electricity there is an increasingly
important role for the trading of environmental instruments in the Australian market. The
Australian Commonwealth Government has introduced a Mandatory Renewable Energy Tar-
get requiring retailers and large electricity consumers to purchase 2% of their total electricity
from renewable energy sources or waste-product sources by 2010, or otherwise pay $40/MWh
penalty for the obligated amount. An OTC traded renewable energy market started in 2001
to trade Renewable Energy Certificates. The State Governments also have their own policies
to control or reduce greenhouse gas emission. These schemes have encouraged new generation
from renewables. Retailers have usually signed long-term power purchase agreements (PPAs)
with the developers of these projects.
4 Contract trading in the NEM
In this section we will describe the practice of forward contract trading in the NEM. The
information we give is based on 26 interviews with market participants, carried out during the
period from October 2005 to December 2005. There were 8 interviews with retailers (some with
significant generation capacities), 16 with generators, 1 with a market intermediary (Westpac–
an investment bank group), and 1 with a broker in the OTC market. The interviewees were
in most cases the general manager of the trading team for their companies. Many of the
issues discussed were commercially sensitive and we will not report precise figures or identify
individual companies in this paper.
The interview questions were designed to explore:
• the features of contracts in their business (contract types, time scale, proportions of
contracts traded through brokers, use of the futures exchange, etc.);
• the contracting process (setting the contract price, contract initiation, contract counter
parties, etc.);
• the appetite for contracts (tools for tracking risk, issues involved in determining contract
levels, adjustment of contract cover, relation between contract prices and spot prices,
etc.).
12
4.1 Risk attitudes and risk management
The financial risk to market participants arises from uncertainties with respect to both price
and volume. A retailers’ revenue is at risk if the spot price is very high and there is high
consumption from end-users paying a fixed tariff. A cautionary example is the bankrupted
load serving utilities in California in 2001 (see Borenstein (2002)). On the other hand a
generator may be in trouble if the market price is too low (cannot recover investment cost)
or if there is a price spike and at the same time the generator cannot meet the contracted
amount due to equipment failures (for example, the bankrupted generators in the Midwest
region of the US in June 1998 (see Michaels and Ellig (1999))). From the trading side, the
credit risk of trading counter-parties is a great concern. OTC trades through brokers make
it hard to appropriately price in credit risk, since prices are settled before the counterparty
to the trade is identified. Finally we should mention that there are longer run uncertainties
arising from regulatory risk.
Risk management is a centerpiece in all retail and generation businesses, who have well-
established policies and procedures to manage risks, and implement trading strategies within
the limits set by these policies. Market participants mentioned many different tools they use to
monitor risk. These include value at risk (VaR) at various time windows (e.g., daily, weekly),
stress testing (scenario simulation methods), earnings at risk, capital at risk (cash value at
risk), and mark-to-market methods. The most often quoted methods were VaR, earnings at
risk and stress testing. Typically risk limits are very closely monitored on a daily basis. For
similar practices used in other countries, see Pedersen and Mo (2005) who used a questionnaire
survey involving 37 companies from 18 countries.
Most retailers described themselves as (very) risk-averse. However, the attitude to risk and
the risk management methods used may differ substantially from one company to another,
especially between the State government owned businesses in NSW and QLD and the privately
owned companies in SA and VIC. In general the government owned businesses are more
risk-averse than the private companies. This may be a result of governments having more
conservative risk attitudes. For example, the NSW Treasury has shown some concern about
energy trading risk for its electricity businesses (NSW Treasury (2001)).
The majority of market participants operate both a ‘hedge book’ and a ‘trade book’.
Contracts in the hedge book are purely for the purpose of offsetting risks, while the trade
book gives room for their risk management or trading team to try to make a profit from
13
these contracting activities. Often, the trade book is more closely monitored than the hedge
book and the proportion of contracts in the trade book could be quite small, depending on
the company’s risk appetite. Operating a small trade book may also help in making better
decisions on the larger hedge book, as one participant put it: “We believe that if you are
active in the market then you are going to understand who is doing what and what prices are
out there”.
4.2 The mix of contracts held
In this section we will give more details on the mix of forward contracts used by participants.
We start by considering the direct bilateral trades. Longer term contracts can be for periods of
between 5 and 25 years. Some retailers and generators have inherited long-term contracts from
their parent entities or predecessors 7. Where generators mentioned these contracts they were
always ‘out of the money’. A second type of long-term contract may exist between generators
and large industrial users, such as aluminium smelters (consuming more than 10% of the
NEM generation), pulp and paper, cement and glass industries. Also long-term contracts are
necessary to ensure funding when significant new generation capacity is built. In some cases
this funding is through PPAs (e.g. for wind power which is sold through the NEM but not
dispatched through it), in other cases there are conventional swaps or caps that run over many
years..
Overall direct bilateral trades are the largest part of the forward market: the interviews
suggest that this form of contract accounts for about 50-60% of the total. But there is
wide variation around this figure, with one generator saying that the direct bilateral deals
now account for only 20-30% of its total contracting, while at the other extreme one of the
retailers said that it does more than 90% of its total contracting in this way.
The majority of customized bilateral contracts may be described as medium-term and are
for less than 5 years. Most of these contracts are hedging contracts between retailers and
generators (which we discuss in more detail below). However generators also reported that
they have contracts with other generators: for most this is a small part of their portfolio,
but one reported that more than 20% of its total contracts were with other generators. The
7For example, the Annual Report (2001, page 24) of the former Edison International, now IPM Australia
Limited, owner of generating units in Victoria, Australia, states that it has entered hedge contracts with the
State Electricity Commission of Victoria, selling 77% of its plant output under contracts commencing May
1997 and terminating in August 2014.
14
position has become less clear cut as retailers, especially in Victoria, have begun to vertically
integrate by buying generation capacity.
On occasion medium-term contracts are set up for a particular customer’s load. However
the normal practice is for a retailer to combine the load from different commercial customers
and look for contract cover for the full amount, rather than making many separate contracts
as new business is won.
The second component of the contract market are OTC trades made through brokers.
These contracts are for the shorter term, less than 3 years, with the greatest liquidity 1 year
ahead or less. The overall picture was that OTC trades through brokers accounted for about
40% of the total, but again there was a large variation between individual participants with
one (generator) reporting that up to 70% of recent trades were through brokers. This part of
the market has clearly become more important over the last few years, with significantly more
trades being made in this way and good liquidity especially in the near term (next calendar
year and next quarter). This is the market in which participants adjust their contract cover
as more information on demand becomes available to them (sometimes this is driven by the
need to stay within risk limits).
However exactly the same issues occur even at shorter time horizons of days or weeks. For
changes in contract cover in the very short-term there is no liquidity available through brokers
(or through the SFE) and participants will approach possible counter-parties directly. But this
may result in an unacceptably high price, so these very short-term trades are comparatively
rare.
The third component of the market are futures contracts traded in the SFE. This is the
smallest part of the overall contract market, with some generators saying that they make no
use of the SFE, citing either the lack of liquidity, or difficulties with margin calls on a daily
basis 8. For the participants we spoke to who use the futures market, it appeared that around
5% of their total trades were through the SFE, with the largest reported percentage being
15%. The anonymous nature of this market means that other companies might be trading on
the futures exchange without this being apparent to market participants.
There is a tension between retailers and generators with respect to the preferred time
frame for contracts. Generally retailers prefer short time periods and are not much interested
8One NSW generator mentioned that State government requirement to get funds through the NSW Treasury
Corporation made it expensive for them to operate in the SFE market where funding injections were required
over time.
15
in signing contracts for more than a couple of years ahead as this is the longest horizon over
which they have some clarity on load profiles and over which demand can be forecast with a
reasonable accuracy. By contrast generators would be happy with longer term contracts to
ensure a stable and guaranteed cash flow to recover their fixed costs of plants, and in the case
of investment decisions for a new plant a long-term contract is essential for bank funding.
There are a number of factors that make it hard to predict what will happen in the future.
Not only are there possible changes in the market brought about by regulators (e.g. changes
in the state based schemes like ETEF, or new environmental instruments), but there could
also be changes in the supply-demand balance with new generation capacity. From a retailer
perspective this makes it risky to enter a long-term contract at a price that may turn out to
be significantly too high. As one participant put it: “Not too many people want to go out past
three years, because the water is getting a bit murky out there.”
Market participants, both retailers and generators, who are primarily hedgers will grad-
ually build up their contract portfolios over time to manage price and volume risks as the
market situation becomes less uncertain. For example, at one year out, they may want to be
fully contracted (100% of final contract cover), two years out 60-70% contracted, three years
out 20-30% contracted, and at four years out 5-10% contracted. But participants adopting
this approach made it clear that this was a guide, around which they would vary considerably
according to market conditions.
We also asked participants for an estimate of how much of their total contracts were in the
form of swaps. Where specific figures were given (10 participants) they reported an average
of 68% of contracts in the form of swaps (with the remainder equally split between caps and
other options).
4.3 Hedging strategies
There are risks associated both with pool price volatility and also with changes in system
load (volume risk). Both retailers and generators are exposed to volume risks due to demand
fluctuations, which are strongly correlated to weather conditions and usage patterns. Retailers
in particular are at risk for the uncontracted load when the spot price goes high. Therefore,
an accurate forecast of their own load is necessary in managing the volume risk. Generators’
risk comes from a failure to meet their contracted supply due to planned or unplanned outages
or network problems reducing their delivery of power to contracted customers.
16
To understand the nature of the strategies employed it is helpful to bear in mind that the
price risk is not symmetric. The largest risk is associated with high prices, with occasional
peak pool prices of $10,000 per MWh (the price cap, which is called VOLL for Value of Lost
Load) over against an average level (at a time of day with peak demand) of $40 to $50. Thus
the distribution of prices is highly skewed and the risk is correspondingly one-sided. The other
point to bear in mind is that generators differ substantially in their operating characteristics.
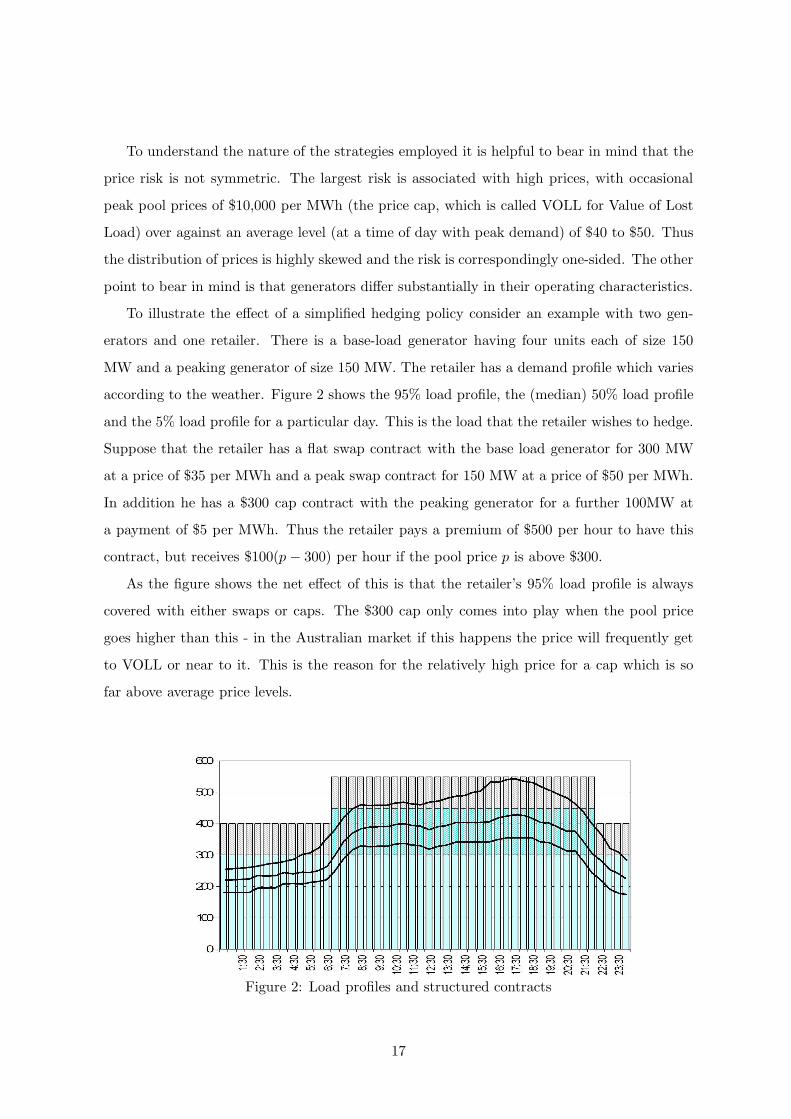
To illustrate the effect of a simplified hedging policy consider an example with two gen-
erators and one retailer. There is a base-load generator having four units each of size 150
MW and a peaking generator of size 150 MW. The retailer has a demand profile which varies
according to the weather. Figure 2 shows the 95% load profile, the (median) 50% load profile
and the 5% load profile for a particular day. This is the load that the retailer wishes to hedge.
Suppose that the retailer has a flat swap contract with the base load generator for 300 MW
at a price of $35 per MWh and a peak swap contract for 150 MW at a price of $50 per MWh.
In addition he has a $300 cap contract with the peaking generator for a further 100MW at
a payment of $5 per MWh. Thus the retailer pays a premium of $500 per hour to have this
contract, but receives $100(p − 300) per hour if the pool price p is above $300.
As the figure shows the net effect of this is that the retailer’s 95% load profile is always
covered with either swaps or caps. The $300 cap only comes into play when the pool price
goes higher than this - in the Australian market if this happens the price will frequently get
to VOLL or near to it. This is the reason for the relatively high price for a cap which is so
far above average price levels.
Figure 2: Load profiles and structured contracts
17
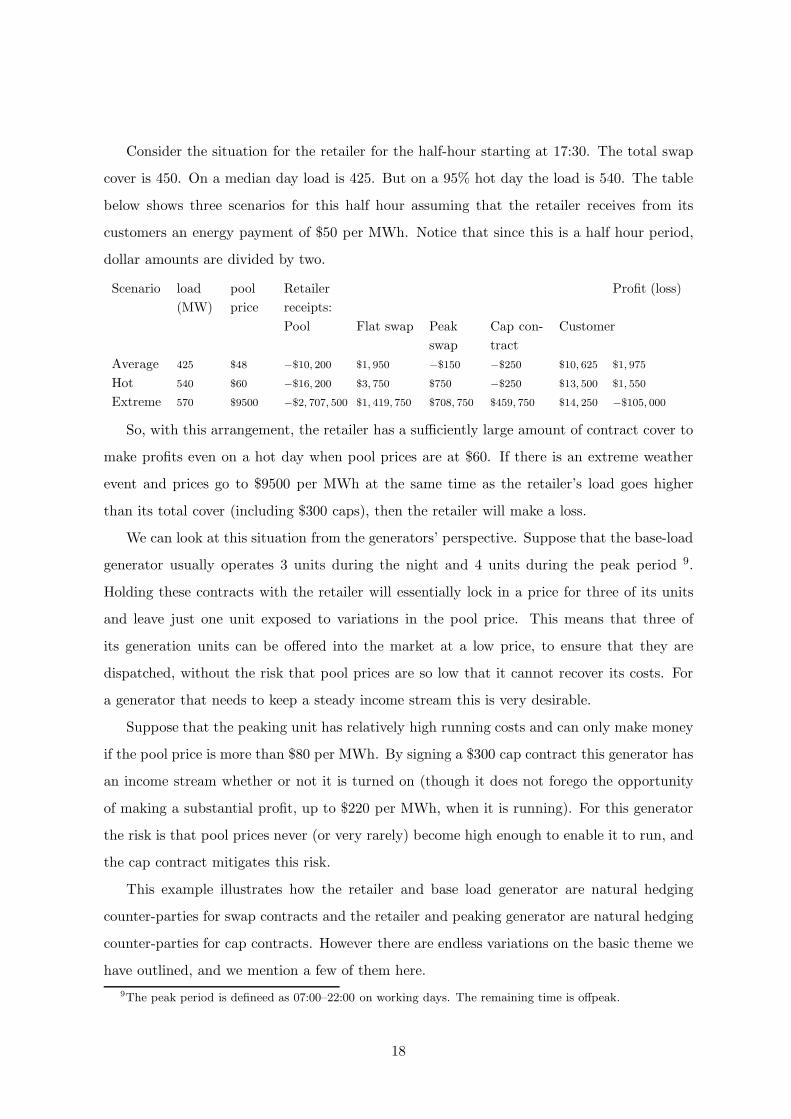
Consider the situation for the retailer for the half-hour starting at 17:30. The total swap
cover is 450. On a median day load is 425. But on a 95% hot day the load is 540. The table
below shows three scenarios for this half hour assuming that the retailer receives from its
customers an energy payment of $50 per MWh. Notice that since this is a half hour period,
dollar amounts are divided by two.
Scenario load
(MW)
pool
price
Retailer
receipts:
Profit (loss)
Pool Flat swap Peak
swap
Cap con-
tract
Customer
Average 425 $48 −$10, 200 $1, 950 −$150 −$250 $10, 625 $1, 975
Hot 540 $60 −$16, 200 $3, 750 $750 −$250 $13, 500 $1, 550
Extreme 570 $9500 −$2, 707, 500 $1, 419, 750 $708, 750 $459, 750 $14, 250 −$105, 000
So, with this arrangement, the retailer has a sufficiently large amount of contract cover to
make profits even on a hot day when pool prices are at $60. If there is an extreme weather
event and prices go to $9500 per MWh at the same time as the retailer’s load goes higher
than its total cover (including $300 caps), then the retailer will make a loss.
We can look at this situation from the generators’ perspective. Suppose that the base-load
generator usually operates 3 units during the night and 4 units during the peak period 9.
Holding these contracts with the retailer will essentially lock in a price for three of its units
and leave just one unit exposed to variations in the pool price. This means that three of
its generation units can be offered into the market at a low price, to ensure that they are
dispatched, without the risk that pool prices are so low that it cannot recover its costs. For
a generator that needs to keep a steady income stream this is very desirable.
Suppose that the peaking unit has relatively high running costs and can only make money
if the pool price is more than $80 per MWh. By signing a $300 cap contract this generator has
an income stream whether or not it is turned on (though it does not forego the opportunity
of making a substantial profit, up to $220 per MWh, when it is running). For this generator
the risk is that pool prices never (or very rarely) become high enough to enable it to run, and
the cap contract mitigates this risk.
This example illustrates how the retailer and base load generator are natural hedging
counter-parties for swap contracts and the retailer and peaking generator are natural hedging
counter-parties for cap contracts. However there are endless variations on the basic theme we
have outlined, and we mention a few of them here.
9The peak period is defineed as 07:00–22:00 on working days. The remaining time is offpeak.
18
• Swaptions can be used instead of caps - they have similar effects.
• Some retailers own peaking generation capacity - this is nearly equivalent to having a
cap contract for the capacity of the generator. In a similar way some retailers have
contracts enabling them to call up certain embedded generation facilities, like back-up
units in big shopping centers.
• Some swap contracts are set up with a profile for each half hour of the day. This
enables the retailer to more closely match its demand profile - we say more about these
structured products below.
Retailers generally wish to have hedge cover which matches their load profile reasonably
closely, leading to a requirement for shaped products. However a generator would prefer to
have a flat profile, matching its likely generation capacity, and will charge more for the shaped
product. This is because, when a generator sells a swap with tapered load at the shoulders
of the demand profile, then it will be very hard to find potential buyers for the remainder of
its capacity. There are however a variety of other structured products that might be more
attractive to a generator and still have the desired outcome for a retailer. Some products
mentioned by participants were:
• The shaped product may be defined in terms of the overall load in the system (at the
generator’s node), e.g. the swap quantity could be set to increase by 10 MW for each
50 MW of additional system load above some level.
• The swap may be activated with a trigger, so that it only becomes operational when
system load is high or there is a high temperature event.
• The swap may contain a degree of ‘optionality’. For example, for a call fee, a retailer
may be able to nominate how much energy is required for a swap on a half hour by half
hour basis. This would be negotiated with a time window, e.g. the nomination must be
made at least 10 minutes before the start of the half hour. The retailer then exercises
the swap only when a high load is anticipated, and a peaking generator has enough
warning to start up, so that its physical generation matches the generator’s hedge and
it is protected from a price spike.
There is a degree of ambivalence in relation to shaped products. Some market participants
believe that the higher price is not worthwhile. Retailers would do better to manage significant
19
risk associated with load profiles through derivatives instruments, rather than entering into
complex deals with generators, which might take weeks to agree. Certainly one difficulty faced
by retailers with significant contestable load is that large customers may be won or lost which
can effect their anticipated load profiles at relatively short notice. Moreover overall trends in
demand and updates on weather forecasts contribute to retailers wishing to fine-tune their
contract cover as they move closer to real time. But a structured product is unique and there
is no opportunity to adjust the profile of cover through the futures or broker-traded OTC
market. Thus it may not be surprising that the total amount of structured product is limited
with, from the responses we received, an average level being about 20% of structured product
(though one generator commented on the increasing demand for profiled swaps).
It is possible to see the forward market as mechanism for allocating risk in the most
effective way. Our discussion so far has concentrated on the risk positions of generators and
retailers, but there is also a role for large consumers. This is an area in which the NEM is
changing. Perhaps as a result of the activities of consultants a greater number of customers
now seem prepared to carry some additional risk, through an increased exposure to spot
prices, if this means a reduction in overall costs. This is particularly important for customers
who have opportunities to shed load through changes in their operations. For large industrial
customers (say greater than 5 MW) it has become commonplace for them to have contracts
with a provision for load curtailment. Under this arrangement the retailer will contact the
customer in the event of a price spike and ask them to reduce their load. Then the retailer
and the customer share the net benefit according to the terms of the contract (perhaps on a
50:50 basis).
For example, given the extreme scenario in the example above, the retailer might suggest
to a large customer that it shed load and be rewarded at half the difference between pool
and its energy charge of $50 a MWh. A customer who could reduce load by 5MW for half
an hour would then receive a total of $11,812, with the retailer gaining the same amount. If
the overall system load was reduced enough for generators to be dispatched at a lower point
on their bid curves then this load shedding arrangement might lead to a reduction in peak
prices, in which case the gains to the retailer could be even greater. But leaving this effect
aside, from the retailer perspective, load shedding operates as a partial cap.
Just as there is a risk to a retailer who is under-contracted when the spot price peaks,
there can be a matching risk to a generator who is over-contracted when there is a price spike.
20
Provided a generator dispatches to the pool an amount that is at least equal to its contract
position, then it has nothing to fear. Thus generators in their hedge books will not contract for
more than their capacity. But a base load generator is at risk if it is fully contracted and there
is an unplanned outage (i.e. a break-down of some sort) and at the same time the pool price
goes very high (which is exactly what might happen if the outage causes supply shortages).
In this scenario the generator could lose very large amounts of money. For this reason most
generators are unwilling to be fully contracted. They often adopt an n − 1 strategy which
means that they contract only up the level that they can supply from all but one of their
generation units - hence giving them protection provided no more than one of their units fails
at the same time.
Of course, a strict n − 1 strategy may not be suitable. For those generators with only a
couple of units, it may not be a good strategy to leave one unit fully uncontracted. In this
case, they may simply leave some proportion, say 25% of their total capacity not covered
by contracts. For generators with many more units, they may leave more than one unit
uncontracted. For example, a generator might have 8 base load units and leave 1.5 units
uncontracted. This balance of risk will typically be considered carefully, often using some
simulation methodology.
Nevertheless, even if this is the position for their hedge book, a generator may still decide
to take on additional risk as part of its trading strategy, and choose to enter contracts greater
than its installed capacity. Generators who do this may well trade outside the region in which
they are located and may also be active in the SRA market (see below).
In market conditions in which there is a high demand for forward contracts from retailers
there may well be a substantial price premium that encourages generators to become more
fully contracted. There are a number of alternative ways in which a generator can try to
moderate the risk of an unplanned outage:
• One possibility is simply to have an insurance contract, possibly with an intermediary
like Westpac.
• Alternatively a generator may have contracts of some sort with other generators to take
over the capacity that they have contracted but cannot meet during their outage period.
These are natural counter-parties for this risk, since an outage at one generator will be
likely to result in higher prices and higher demand for other generators.
21
• A third possibility is to use a force majeure (FM) clause in the contract, so that the
contract does not operate in the event of the generator being unable to supply. FM
clauses used to be widely used in Victoria, but most retailers state that they do not
want these clauses included in their contracts. However, participants report that FM
clauses are still in use in some bilaterally negotiated, large contracts in Queensland,
SA and Victoria. In some cases a type of FM clause is used that only comes into play
when a generator is unable to supply through line or network problems (thus excluding
generator faults). In other cases an FM clause may be signed in a contract between a
generator and retailer if a large industrial customer decides that they will wear this risk
for the benefit of a lower price.
In some other markets (see Energy Information Administration Report (2002)), insurance
and contracts with multiple triggers are used to manage forced outages. For example, a double-
triggered contract may be exercised when a forced outage has occurred and the market price
has exceeded the preset level.
Outages can be of many types. In the case of planned outages for maintenance there will
be a schedule that goes out for 2 years or more. This allows enough time to adjust contract
cover for the period in question. However there are circumstances when a generator is obliged
to take a generation unit out with only a short warning (days or weeks). As we mentioned
earlier, in this case a lack of short-term liquidity may force the generator to approach other
market participants for a short-term contract on a bilateral basis, when the price is likely to
be quite high.
From the interviews we carried out it seems that on average base load generators are about
70-80% contracted. This can be compared with Table 2 which gives estimates of aggregate
contract covers in various markets. Note that PJM, New England and New York all have
vertically integrated generation and retail businesses. Generators in the UK also have their
own associated retail arms.
4.4 Setting the contract price
Contract agreements are reached through bilateral negotiation, with retailers more often ini-
tiating the contracts and approaching the generators, rather than vice versa. This happens
because of the asymmetric form of the price distribution, and the risk of price spikes - broadly
speaking a retailer cannot afford to be under-contracted, whereas a generator cannot afford
22
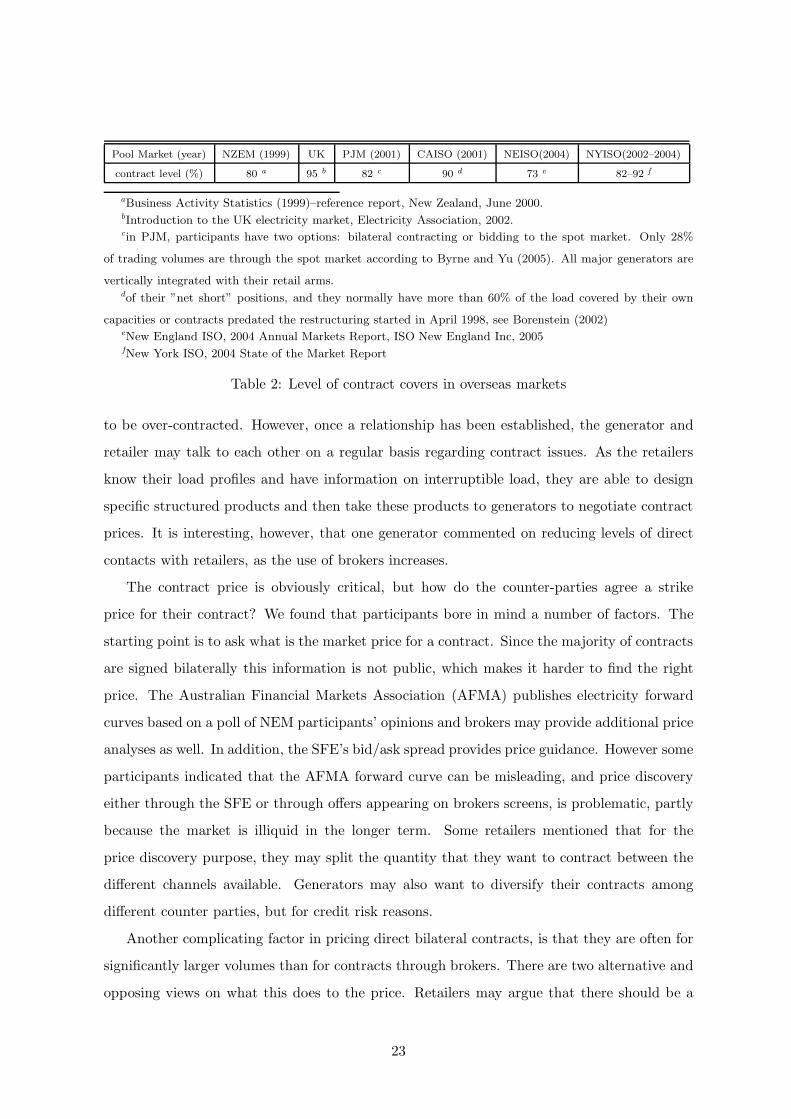
Pool Market (year) NZEM (1999) UK PJM (2001) CAISO (2001) NEISO(2004) NYISO(2002–2004)
contract level (%) 80 a 95 b 82 c 90 d 73 e 82–92 f
aBusiness Activity Statistics (1999)–reference report, New Zealand, June 2000.bIntroduction to the UK electricity market, Electricity Association, 2002.cin PJM, participants have two options: bilateral contracting or bidding to the spot market. Only 28%
of trading volumes are through the spot market according to Byrne and Yu (2005). All major generators are
vertically integrated with their retail arms.dof their ”net short” positions, and they normally have more than 60% of the load covered by their own
capacities or contracts predated the restructuring started in April 1998, see Borenstein (2002)eNew England ISO, 2004 Annual Markets Report, ISO New England Inc, 2005fNew York ISO, 2004 State of the Market Report
Table 2: Level of contract covers in overseas markets
to be over-contracted. However, once a relationship has been established, the generator and
retailer may talk to each other on a regular basis regarding contract issues. As the retailers
know their load profiles and have information on interruptible load, they are able to design
specific structured products and then take these products to generators to negotiate contract
prices. It is interesting, however, that one generator commented on reducing levels of direct
contacts with retailers, as the use of brokers increases.
The contract price is obviously critical, but how do the counter-parties agree a strike
price for their contract? We found that participants bore in mind a number of factors. The
starting point is to ask what is the market price for a contract. Since the majority of contracts
are signed bilaterally this information is not public, which makes it harder to find the right
price. The Australian Financial Markets Association (AFMA) publishes electricity forward
curves based on a poll of NEM participants’ opinions and brokers may provide additional price
analyses as well. In addition, the SFE’s bid/ask spread provides price guidance. However some
participants indicated that the AFMA forward curve can be misleading, and price discovery
either through the SFE or through offers appearing on brokers screens, is problematic, partly
because the market is illiquid in the longer term. Some retailers mentioned that for the
price discovery purpose, they may split the quantity that they want to contract between the
different channels available. Generators may also want to diversify their contracts among
different counter parties, but for credit risk reasons.
Another complicating factor in pricing direct bilateral contracts, is that they are often for
significantly larger volumes than for contracts through brokers. There are two alternative and
opposing views on what this does to the price. Retailers may argue that there should be a
23
further discount on the price associated with the large quantity. In this context a discount
can be seen as reflecting the cost of the risk that a generator runs in trying to build up the
same position over time through smaller trades. An alternative (generator) view is that the
retailer should pay a price premium for the larger quantity of hedge. Even if a lower price
is available for, say a 10MW contract through a broker, if the retailer keeps going back to
the brokers’ screens for trades, then the price will rise after the first few deals as generators
respond to the increased demand for this particular product.
Alongside the view of the ‘going rate’ for a particular contract, represented by some combi-
nation of recent deals done, bid/ask spreads and the AFMA forward curve, market participants
will also hold their own view of the correct price for that contract. This is related to what they
expect to happen to the forward curve in the future. The most important underlying factors
are the available supply and demand. Thus a trader will compare the market price with his
or her own estimation of where this price will move in the future to decide whether to accept
it. Most of the time traders have some flexibility to delay or bring forward the contracts they
are signing for a particular period in the future.
The ability to choose the time at which a contract is signed is limited, however. Since all
market participants are working within well-defined limits for certain risk measures, they may
find themselves forced to change their contract position with relatively little notice. Moreover
the necessity to end up with a solid hedge position will force participants to sign contracts
for a given period as that period approaches. This brings into play the issue of the supply
and demand for contracts. The hedge requirements from both sides of the market drive this
contract supply-demand balance. Thus if the retailer demand for flat or structured product
is greater than the generator willingness to supply, then contract prices are pushed up and
generators will look again at their risk position with respect to outages and may decide to sell
more contracts, perhaps using some of the methods mentioned in the previous section to deal
with the outage risk. One participant described this as the situation in NSW at the time of
this study: “Generators are getting to the envelope of where they really want to sell at”.
It is noticeable that participants give varying responses to questions about their use of
FM clauses, in a way that reflects the contract supply and demand balance. Having fallen
out of use during recent years as the supply position has been relatively benign, a couple
of participants mentioned their willingness to consider FM clauses, specifically as a way of
achieving a higher degree of contract cover at times when there was a shortage of generator
24
contract capacity.
Setting prices for very long-term contracts poses particular difficulties. Whatever the
varying limitations of different estimates of the forward curve, no one has any confidence in
being able to predict this more than 4 to 5 years out. When new generation capacity is built it
is necessary to look at funding over a period of 15 to 20 years. Over this time horizon pricing
becomes a matter of a generator recovering costs and making a reasonable return. Hence
contract prices are based on calculations of capital and operational expenses. Whatever the
time span for the contracts, in price discussions generators will be acutely aware of how much
they need in order to cover their financing requirements, and generators likewise will try to
lock in a margin against the retail price they charge.
The price volatility of an underlying commodity or financial instrument is often used in
academic literature (see Energy Information Administration Report (2002), Eydeland and
Wolyniec (2003), Pindyck (2001)) as an indicator of market risk. Therefore the contract price
in a more volatile period may be higher than that in a less volatile period. This is evidenced in
our interviews. In fact, a number of participants told us that they model and closely monitor
the volatility of the spot market prices. Based on this perception, generators may bid in a
strategic way to increase the volatility of spot market prices in order to push up the price in
the contract market.
The spot market price influences expectations of the spot price in the future and will have
an impact on forward contract prices. However, looking at the market data shows that the
connection between spot and forward prices is not straightforward or immediate. There can be
difficulty for someone outside the market in understanding the underlying cause for occasional
significant changes in forward contract prices.
There is some controversy over the extent to which a price premium in the contract market
reflects just a risk premium, or whether it also includes an incentive for generators to enter
contracts that will effectively limit their market power in the spot market (see Anderson and
Hu (2005), Powell (1993)). The retailers were asked whether they agreed with the statement:
Contract prices are higher than the average spot price, but if contracts were not signed then
spot prices would rise. All but one of the retailers answered “yes”. One retailer stated:
“Sometimes you will get a new board member [argue that] our average contract rate last year
was $40 and the average spot was only $27 why didn’t we just take the spot? And we say yes,
but it wouldn’t be $27 if we weren’t contracted.”
25
It is widely recognized that there have been significant changes in the relationship between
contract and pool prices during the history of the NEM. In the early stage of the NEM pool
prices were significantly lower than the price of vesting contracts. For example, in 1999
the volume weighted average spot market price in NSW was $24.42/MWh; while the price
of vesting contracts for Type 1 customers (80% of the vested load) in NSW for 1999 was
$37/MWh 10. See also Wolak (2000) for a discussion of the situation in 1997 for the NSW
and VIC pools from which the NEM developed. This resulted in a drop in contract levels, as
retailers took the view that the prices for swap contracts were too high. However this in turn
led to much higher pool prices as generators sought to maximise their profits (the average VIC
pool price went from $26.35 in financial year 1999-2000, to $44.57 in the following year), with
the result that retailers, particularly in Victoria, ended up doing badly during this period as
they paid high prices without much contract cover. Market participants have become more
sophisticated and we would not expect to continue to see such large swings in the contract
price vis-a-vis the spot price.
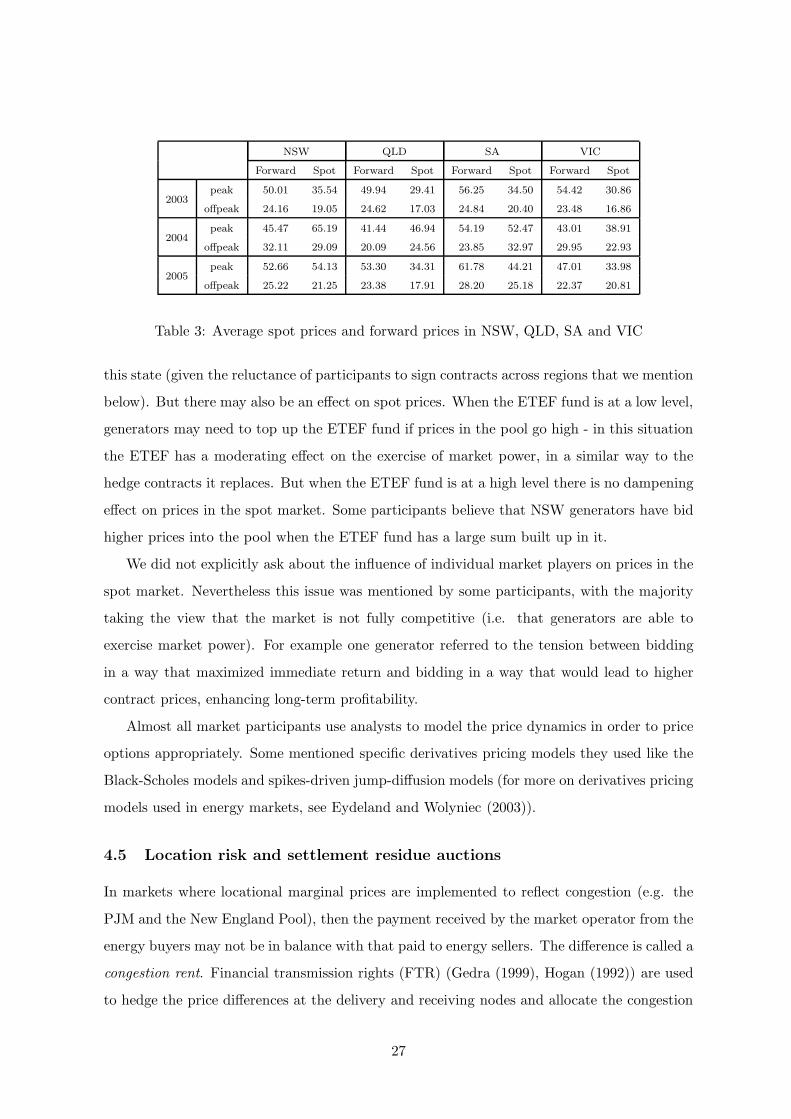
What has been happening in recent years? Table 3 gives the spot average prices and
AFMA mean forward prices for the week prior to the beginning of the calendar year of the
contract (where we would expect the smallest difference between contract and spot prices).
For the majority of cases forward prices are higher than spot prices (with only 5 out of 48 cases
where the reverse is true). The average premium over the 4 regions and 3 years is $9.09 for the
peak period (NSW has an average contract price $2.24 lower than spot, while the premium
in the other states was $11.34 in QLD, $13.68 in SA and $13.56 in VIC). The premiums for
the offpeak periods are smaller, averaging $2.85. This can be explained by observing that
competition is stronger in the off peak periods, so that the moderating effect of contracts on
market power is not significant, or the explanation may be simply related to a higher price
volatility in the peak periods, leading to a greater risk premium.
It is possible that the operation of the ETEF is significant in the way that the NSW
contract prices have not shown the same premium to spot prices as in other states. The
ETEF gives an effective hedge for retailers and this means that they do not need to seek
contract cover for the franchise portion of their load. Hence the demand for contracts in NSW
is lower than it would be otherwise, which will contribute to relatively lower contract prices in
10Source: ACCC Decision on NSW electricity vesting contracts, Release no. MR 164/99 and release date:
September 2, 1999.
26
NSW QLD SA VIC
Forward Spot Forward Spot Forward Spot Forward Spot
2003peak 50.01 35.54 49.94 29.41 56.25 34.50 54.42 30.86
offpeak 24.16 19.05 24.62 17.03 24.84 20.40 23.48 16.86
2004peak 45.47 65.19 41.44 46.94 54.19 52.47 43.01 38.91
offpeak 32.11 29.09 20.09 24.56 23.85 32.97 29.95 22.93
2005peak 52.66 54.13 53.30 34.31 61.78 44.21 47.01 33.98
offpeak 25.22 21.25 23.38 17.91 28.20 25.18 22.37 20.81
Table 3: Average spot prices and forward prices in NSW, QLD, SA and VIC
this state (given the reluctance of participants to sign contracts across regions that we mention
below). But there may also be an effect on spot prices. When the ETEF fund is at a low level,
generators may need to top up the ETEF fund if prices in the pool go high - in this situation
the ETEF has a moderating effect on the exercise of market power, in a similar way to the
hedge contracts it replaces. But when the ETEF fund is at a high level there is no dampening
effect on prices in the spot market. Some participants believe that NSW generators have bid
higher prices into the pool when the ETEF fund has a large sum built up in it.
We did not explicitly ask about the influence of individual market players on prices in the
spot market. Nevertheless this issue was mentioned by some participants, with the majority
taking the view that the market is not fully competitive (i.e. that generators are able to
exercise market power). For example one generator referred to the tension between bidding
in a way that maximized immediate return and bidding in a way that would lead to higher
contract prices, enhancing long-term profitability.
Almost all market participants use analysts to model the price dynamics in order to price
options appropriately. Some mentioned specific derivatives pricing models they used like the
Black-Scholes models and spikes-driven jump-diffusion models (for more on derivatives pricing
models used in energy markets, see Eydeland and Wolyniec (2003)).
4.5 Location risk and settlement residue auctions
In markets where locational marginal prices are implemented to reflect congestion (e.g. the
PJM and the New England Pool), then the payment received by the market operator from the
energy buyers may not be in balance with that paid to energy sellers. The difference is called a
congestion rent. Financial transmission rights (FTR) (Gedra (1999), Hogan (1992)) are used
to hedge the price differences at the delivery and receiving nodes and allocate the congestion
27
rent. The FTR is a point-to-point transmission right. An alternative approach, which is
incorporated into the Standard Market Design proposed by the Federal Energy Regulatory
Commission, is to use flowgate rights (see Chao et al. (2000)), which are financial rights that
can operate on a group of lines.
In NEMMCO’s pricing and dispatch engine (NEMDE), network constraints and (approx-
imated) losses are considered. These two factors are the sources of a potential difference
between the amount received by NEMMCO and the amount paid out, which is called the
settlement residue (SR). NEMMCO holds quarterly auctions to assign the rights of receiv-
ing a share of the inter-regional settlement residue (IRSR). The Settlement Residue Auction
(SRA) in the NEM is a little similar to an FTR auction, since the SR allocation is based on
the regional reference nodes, not on particular lines/routes connecting the regions. The SRA
assumes a single notional interconnector between regions. For example there are two regulated
interconnectors between SA and VIC (see Figure 1), but only one notional interconnector for
SRA purposes. The available units in a particular notional SRA interconnector are roughly
at the level of the nominal inter-regional transfer capability in MW between these regions.
The design of the SRA is intended to encourage inter-regional trading, therefore increasing
competition, and provide an opportunity to hedge inter-regional price differentials. However,
there is no clear consensus among academics about whether financial transmission products
actually increase competition (e.g. Stoft (1999)).
Each SRA participant submits a set of bids to NEMMCO: bids are pairs of prices and
numbers of units over (possibly linked) directional notional interconnectors. The higher price
bidder will win the units available for the specific direction in question until all available units
have been allocated. The clearing price for the directional link is the lowest bid price amongst
the winning bids. The available units of each notional interconnector for each calendar quarter
are auctioned in four equal tranches. The first tranche auction for the units of a given quarter
(say Quarter 3 2006) is held in the same quarter but a year ahead (i.e. Quarter 3 2005). The
second tranche auction is held in the following quarter, and so on11.
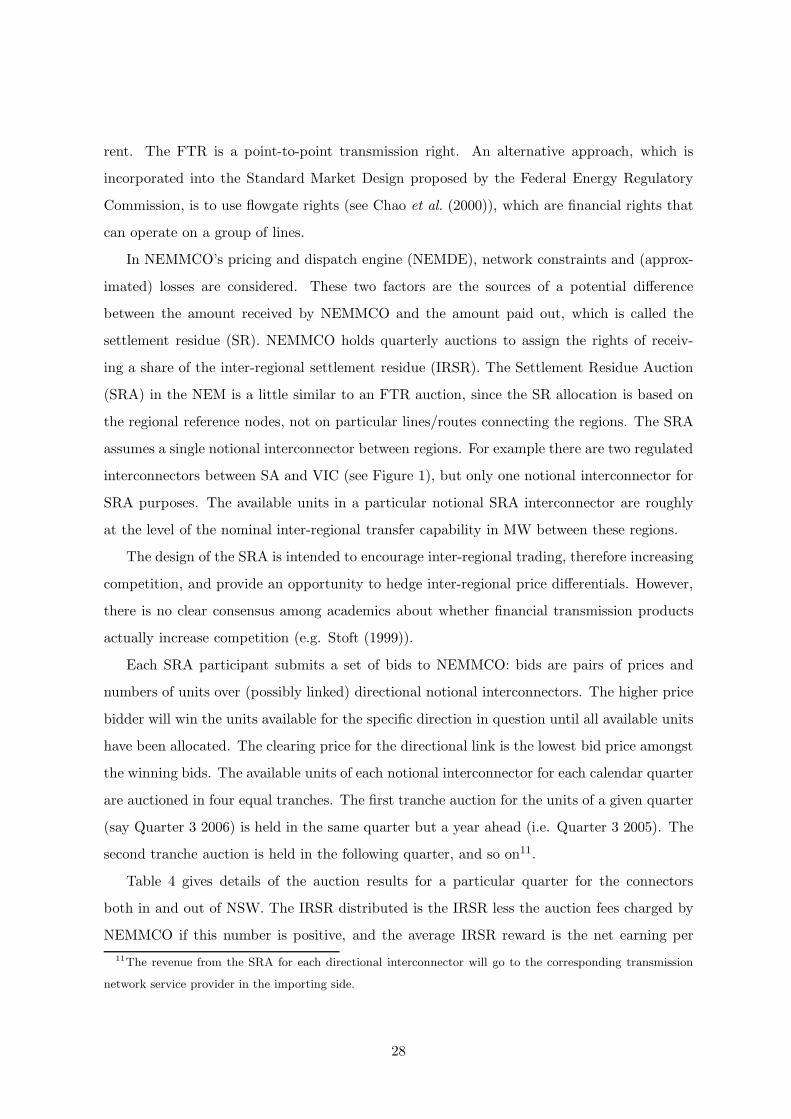
Table 4 gives details of the auction results for a particular quarter for the connectors
both in and out of NSW. The IRSR distributed is the IRSR less the auction fees charged by
NEMMCO if this number is positive, and the average IRSR reward is the net earning per
11The revenue from the SRA for each directional interconnector will go to the corresponding transmission
network service provider in the importing side.
28
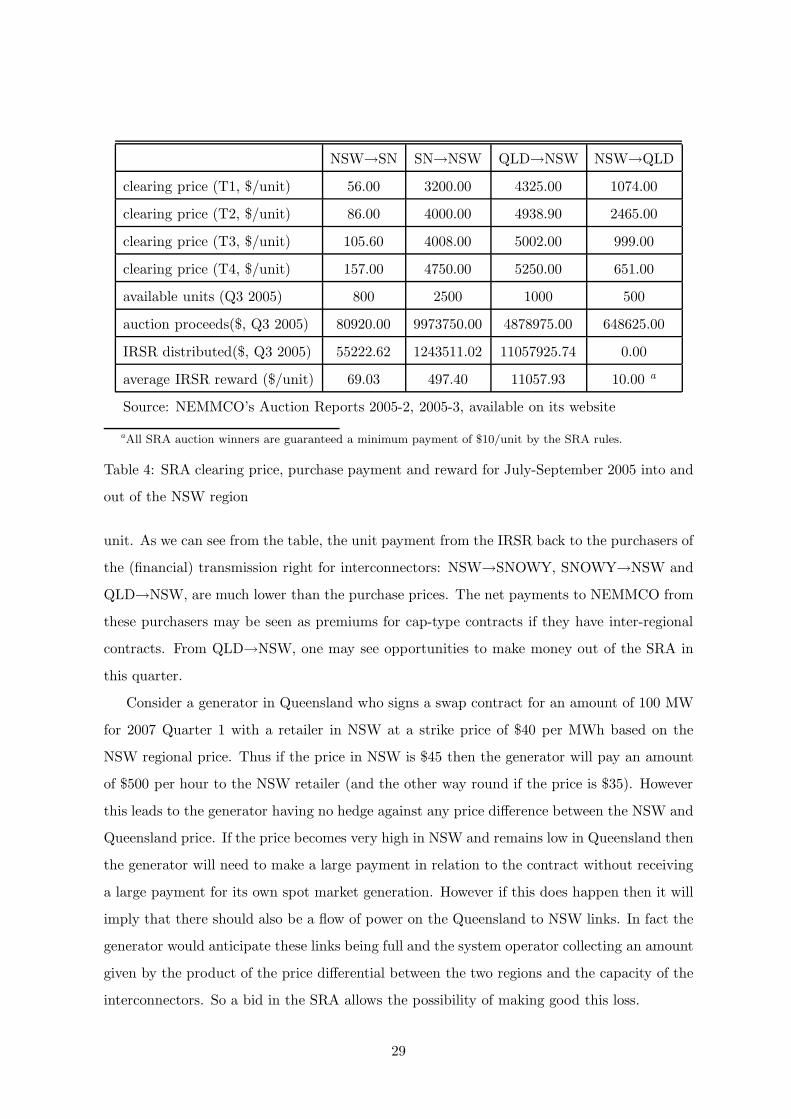
NSW→SN SN→NSW QLD→NSW NSW→QLD
clearing price (T1, $/unit) 56.00 3200.00 4325.00 1074.00
clearing price (T2, $/unit) 86.00 4000.00 4938.90 2465.00
clearing price (T3, $/unit) 105.60 4008.00 5002.00 999.00
clearing price (T4, $/unit) 157.00 4750.00 5250.00 651.00
available units (Q3 2005) 800 2500 1000 500
auction proceeds($, Q3 2005) 80920.00 9973750.00 4878975.00 648625.00
IRSR distributed($, Q3 2005) 55222.62 1243511.02 11057925.74 0.00
average IRSR reward ($/unit) 69.03 497.40 11057.93 10.00 a
Source: NEMMCO’s Auction Reports 2005-2, 2005-3, available on its website
aAll SRA auction winners are guaranteed a minimum payment of $10/unit by the SRA rules.
Table 4: SRA clearing price, purchase payment and reward for July-September 2005 into and
out of the NSW region
unit. As we can see from the table, the unit payment from the IRSR back to the purchasers of
the (financial) transmission right for interconnectors: NSW→SNOWY, SNOWY→NSW and
QLD→NSW, are much lower than the purchase prices. The net payments to NEMMCO from
these purchasers may be seen as premiums for cap-type contracts if they have inter-regional
contracts. From QLD→NSW, one may see opportunities to make money out of the SRA in
this quarter.
Consider a generator in Queensland who signs a swap contract for an amount of 100 MW
for 2007 Quarter 1 with a retailer in NSW at a strike price of $40 per MWh based on the
NSW regional price. Thus if the price in NSW is $45 then the generator will pay an amount
of $500 per hour to the NSW retailer (and the other way round if the price is $35). However
this leads to the generator having no hedge against any price difference between the NSW and
Queensland price. If the price becomes very high in NSW and remains low in Queensland then
the generator will need to make a large payment in relation to the contract without receiving
a large payment for its own spot market generation. However if this does happen then it will
imply that there should also be a flow of power on the Queensland to NSW links. In fact the
generator would anticipate these links being full and the system operator collecting an amount
given by the product of the price differential between the two regions and the capacity of the
interconnectors. So a bid in the SRA allows the possibility of making good this loss.
29
In theory we could expect to see speculators driving the cost of a unit in the SRA towards
its true expected value, and participants who hold swap contracts outside their region partic-
ipating in the SRA, and being prepared to pay a premium because of the value of the hedge
they will obtain if their purchase is successful.
However the SRA mechanism has a number of disadvantages and is a relatively crude
instrument to use in hedging inter-regional risk. The key problem is that a large price differ-
ential between two regions may occur when the link is not operating at full capacity (either
through an outage or because of more complex factors associated with the network). In these
cases there will be a much reduced settlement residue, but the market participant is still ex-
posed to losses through the price differential. In addition to this, auctions take place only
at prescribed times and at a maximum of one year ahead. This means that the SRA cannot
give an immediate hedge capability at the same time as the swap contract is entered into.
Moreover the SRA does not have any flexibility to hedge different load profiles (unless we take
the view that the great majority of Settlement Residue payments are associated with peak
demand, enabling it to be used to hedge a peak load contract).
Our survey reveals that the SRAs do not operate effectively in encouraging interregional
trade. Almost all the participants said that they tried to arrange contracts between counter-
parties in the same region, so as not to be exposed to inter-regional trading risks. Where
these ‘basis’ risks were taken on, the participants often hedged them through an interregional
product (a swap based on the difference between nodal prices) rather than through an SRA
and many participants stated that they were not actively involved in the SRA. It seems that a
significant part of the trade in SRAs is within the participants’ trade books and is speculative
rather than carried out for hedging purposes.
5 Trends in the market
The Australian electricity market continues to evolve. In common with the Californian and
England and Wales markets, it was set up with a separation between generation, transmis-
sion, distribution and retail companies. However there is no legislative restriction on cross-
ownership, provided it is not deemed to be anti-competitive. As a result there has been some
consolidation of the industry through acquisition or mergers, with ongoing discussion of fur-
ther moves in this direction. The most common pattern has been for retailers to purchase
peak or intermediate generation capacity. At the moment this stops well short of the inte-
30
gration of generation and retail on a regional basis (as is the case with many US markets in
which generation and retail businesses remain integrated). Nevertheless many in the industry
wonder whether further moves towards vertical integration are becoming almost inevitable,
perhaps following the pattern of the UK electricity market. Vertical integration has the effect
of reducing the need for hedging contracts. Thus a retailer who owns peaking generation
capacity will operate this capacity whenever pool prices are higher than its running cost.
In tandem with changes in overall market structure there has been an evolution in the
contract market. This has been primarily a result of market participants becoming more
confident in operating within this market. Many participants have increased the size of their
trade portfolios (in addition to their hedging contracts). Some participants mentioned that
they were more prepared to manage the risk themselves, rather than see this as something to
be passed on to a third party or intermediary. This increased level of sophistication can lead
to a preparedness to act as a price maker in this market, rather than a price taker. It may also
lead to a demand for more sophisticated derivative products. Note that many of the traders
in the contract market have experience in trading in other commodities. When the financial
side of the NEM first began it had a very different flavour, with more of a “procurement”
approach to the discussions between generators and retailers.
Looking to the future, changes in the structure of the market place represent a regulatory
risk that market participants need to absorb. Almost all participants see the regulatory risk
at both the federal and state government levels as the largest risk they face and they look
forward to a clear, stable and consistent regulatory policy system.
Our study has shown that a significant issue facing the contract market in Australia is
the lack of liquidity. Liquidity has been a concern in many secondary financial market for
electricity, primarily due to the fact that the underlying markets are not perfectly competitive.
The illiquidity in the Australian market is reflected in relatively large bid-offer spreads. From
the perspective of the Australian market the critical liquidity issues concern OTC trades
through brokers and trade on the SFE. It is interesting that there are few intermediaries or
speculators in this market: to some extent their place is taken by the trading operations of
generators and retailers (who operate both a trade book and a hedge book). Participants in
the market would benefit in a number of ways from a more liquid market. This could help
them reduce hedging costs through the availability of a better range of products, and through
being better able to adjust their contract positions in the light of changes in forecast load
31
(for a retailer), or equipment availability (for a generator). It may also help in improving the
handling of credit risk and in the evaluation of risk positions using mark-to-market methods.
The history of energy futures trading in Australia had a slow start, with low volumes
in the early years of SFE energy futures trading and with the energy futures trading at the
Australian Stock Exchange never reaching significant volume. The UK market experienced
similar difficulties in the early stage of the NETA12. It is interesting to compare the Australian
experience to that of the Nord Pool, where, since 2003, futures contracts have only existed for
the short-term (8-9 weeks ahead) with all other contracts (up to 4 years ahead) being traded
as forwards. It seems that in the Nord Pool the preference for using the futures exchange for
short-term products is due to the relatively high expense of working with daily settlements
for long-term products.
There have been some improvements in liquidity over the last few years. The SFE has
recorded strong growth in futures trading in the period since 2005. Also some new participants
(speculators) are reported to be entering the market. However a number of participants are
concerned that moves towards vertical integration will significantly reduce liquidity.
Acknowledgement
The authors would like to thank all the participants in the survey. We are especially grateful
for their openness and patience in answering our questions.
References
Allaz, B. and J.-L. Vila (1993). “Cournot competition, futures markets and efficiency.” Journal
of Economic Theory 59:1–16.
Anderson, E. J. and X. Hu (2005). “Strategic retailer behavior in an electricity contract
market.” Australian Graduate School of Management, Working paper. The University of
New South Wales.
Anderson, S. C. (2004). Analyzing strategic interaction in multi-settlement electricity markets:
12At the start of NETA in 2001 there were three major exchanges where electricity futures were traded: the
UK Power Exchange (UKPX), the UK Automated Power Exchange (APX) and the International Petroleum
Exchange (IPE, now Intercontinenental Exchange–ICE). In June 2004, the UKPX was combined with the APX
and this is now the dominant exchange (with UK power futures being only a very small proportion of the ICE).
32
A closed-loop supply function equilibrium model. PhD thesis, Harvard University, Cam-
bridge, Massachusetts.
Bessembinder, H. and M. L. Lemmon (2002). “Equilibrium pricing and optimal hedging in
electricity forward markets.” The Journal of Finance 57:1347–1382.
Borenstein, S. (2002). “The trouble with electricity markets: understanding California’s re-
structuring disaster.” Journal of Economic Perspectives 16:191–211.
Bushnell, J. (2005). “Oligopoly equilibria in electricity contract markets.” CSEM WP 148,
University of California Energy Institute.
Byrne, J., Y.-D. Wang and J.-M. Yu (2005). “Lessons from a comparative analysis of California
and PJM electricity restructuring models.” Center for Energy and Environmental Policy,
University of Delaware.
Chao, H.-P., S. Peck, S. S. Oren and R. Wilson (2000). “Flow-based transmission rights and
congestion management.” Electricity Journal 13:38–58.
Energy Information Administration Report (2002). Derivatives and risk management in the
petroleum, natural gas, and electricity industries. U.S. Department of Energy, Washing-
ton D.C..
Eydeland, A. and K. Wolyniec (2003). Energy and Power Risk Management–New Develop-
ments in Modeling, Pricing, and Hedging. John-Wiley & Sons, New Jersey.
Gedra, T. W. (1999). “On transmission congestion and pricing.” IEEE Transactions on Power
Systems 14:241–248.
Green, R. (1999). “The electricity contract market in England and Wales.” Journal of Indus-
trial Economics 47:929–952.
Hogan, W. W. (1992). “Contract networks for electric power transmission.” Journal of Regu-
latory Economics 4:211–242.
Hu, X., G. Grozev and D. Batten (2005). “Empirical observations of bidding patterns in
Australia’s National Electricity Market.” Energy Policy 36:2075–2086.
Klemperer, P. D. and M. A. Meyer (1989). “Supply function equilibria in oligopoly under
uncertainty.” Econometrica 57:1243–1277.
33
Lucia, J. and E. Schwartz (2002). “Electricity prices and power derivatives: Evidence from
the Nordic power exchange.” Review of Derivatives Research 5:5–50.
Michaels, R. J. and J. Ellig (1999). “Electricity: price spikes by design?” Regulation 22:20–22.
Moulton, J. S. (2005). “California electricity futures: the NYMEX experience.” Energy Eco-
nomics 27:181–194.
Newbery, D. (1998). “Competition, contracts, and entry in the electricity spot market.” RAND
Journal of Economics 29:726–749.
NSW Treasury (2001). “A risk management proposal for New South Wales’ electricity busi-
nesses.” Discussion paper (December 2001), Further consultation paper (May 2004), Sydney,
Australia.
Pedersen, S. S. and B. Mo (2005). “Risks and risk management for competitive electricity
markets, report from CIGRE TF C5-2.02.” CIGRE/IEEE PES, International Symposium,
October 2005 :156–163.
Pindyck, R. S. (2001). “The dynamics of commodity spot and futures markets: a primer.”
The Energy Journal 22:1–29.
Powell, A. (1993). “Trading forward in an imperfect market: the case of electricity in Britain.”
Economic Journal 103:444–453.
Shawky, H., A. Marathe and C. L. Barrett (2003). “A first look at the empirical relation
between spot and futures electricity prices in the United States.” The Journal of Futures
Markets 23:931–955.
Stoft, S. (1999). “Financial transmission rights meet cournot: how TCCs curb market power.”
The Energy Journal 20:1–23.
Wolak, F. A. (2000). “An empirical analysis of the impact of hedge contracts on bidding
behaviour in a competitive electricity market.” International Economic Journal 14:1–40.
34