Forum of Regulators (FOR) · 19.01.2005 · Forum of Regulators (FOR) Competitive Tariff vis-a-vis...
73
Forum of Regulators (FOR) Competitive Tariff vis-a-vis Cost plus Tariff- Critical Analysis November 2017
Transcript of Forum of Regulators (FOR) · 19.01.2005 · Forum of Regulators (FOR) Competitive Tariff vis-a-vis...

Forum of Regulators (FOR)
Competitive Tariff vis-a-vis Cost plus Tariff- Critical Analysis
November 2017

Forum of Regulators (FOR)
Competitive Tariff vis-a-vis Cost plus Tariff- Critical Analysis
Assisted By:
CRISIL Risk and Infrastructure Solutions Ltd.

Competitive Tariff vis-a-vis Cost plus Tariff- Critical Analysis
Forum of Regulators iii
Table of contents
Executive Summary ........................................................................................................................................ ix
Introduction and Objective of Study ................................................................................................................... ix
Approach for the Study ........................................................................................................................................ x
Findings of the study: .......................................................................................................................................... xi
Chapter 1 Overview ......................................................................................................................................... 1
1.1 Background of the study ............................................................................................................................... 1
1.2 Objective of the study .................................................................................................................................. 1
1.3 Scope of Work .............................................................................................................................................. 1
Chapter 2 Legislative and policy framework ...................................................................................................... 3
2.1 The Electricity Act, 2003 ............................................................................................................................... 3
2.2 Competitive bidding guidelines .................................................................................................................... 3
2.3 Tariff Policy, 2006 ......................................................................................................................................... 4
2.4 Judgement by the Appellate Tribunal of Electricity ..................................................................................... 5
Chapter 3 Overview of capacity contracted through competitive bidding .......................................................... 6
Chapter 4 Competitive Tariff vis-à-vis Cost Plus Tariff ....................................................................................... 7
4.1 Approach and methodology ......................................................................................................................... 7
4.2 Detailed analysis: ........................................................................................................................................11
4.2.1 Sample 1: Talwandi Sabo & Sipat Stage – 1 ..................................................................................11
4.2.2 Sample 2: Lanco Babandh & Sipat Stage – 1 .................................................................................21
4.2.3 Sample 3: Essar Mahan & Udupi Power Project ...........................................................................29
4.2.4 Sample 4: CLP Jhajjar & IGSTPP Jhajjar .........................................................................................39
4.2.5 Sample 5: MB Power Annupur ......................................................................................................48
4.2.6 Sample 6: Nabha Power (Rajpura) ................................................................................................51
Chapter 5 Summary of results and key findings............................................................................................... 54
Annexures ..................................................................................................................................................... 59
Annexure - 1 .......................................................................................................................................................59

Competitive Tariff vis-a-vis Cost plus Tariff- Critical Analysis
Forum of Regulators iv
List of tables
Figure 1: Power procurement routes ...........................................................................................................................3
Figure 2: Quoted tariff for Talwandi Sabo (Rs. / kWh) .............................................................................................. 12
Figure 3: Tariff and cost for Talwnadi Sabo under Scenarios 1 (Rs. / kWh) .............................................................. 14
Figure 4: Tariff and cost for Talwnadi Sabo under Scenarios 2 (Rs. / kWh) .............................................................. 14
Figure 5: Tariff and cost for Talwnadi Sabo under Scenarios 3 (Rs. / kWh) .............................................................. 15
Figure 6: Tariff for Talwnadi Sabo as per cost plus approach (Rs. / kWh) ................................................................. 19
Figure 7: Tariff for Sipat Stage -1 as per cost plus approach (Rs. / kWh) .................................................................. 19
Figure 8: Fixed Tariff Components - TSPL (Competitive Bid) (Rs. / kWh) .................................................................. 20
Figure 9: Fixed Tariff Components - TSPL (Cost Plus) (Rs. / kWh) ............................................................................. 20
Figure 10: Fixed Tariff Components - Sipat (Cost Plus) (Rs. / kWh) ........................................................................... 20
Figure 11: Quoted tariff for Lanco Babandh (Rs. / kWh) ........................................................................................... 21
Figure 12: Tariff and cost for Lanco Babandh under Scenarios 1 (Rs. / kWh) ........................................................... 23
Figure 13: Tariff and cost for Lanco Babandh under Scenarios 2 (Rs. / kWh) ........................................................... 23
Figure 14: Tariff and cost for Lanco Babandh under Scenarios 3 (Rs. / kWh) ........................................................... 24
Figure 15: Tariff for Lanco Babandh as per cost plus approach (Rs. / kWh) ............................................................. 28
Figure 16: Tariff for Sipat Stage -1 as per cost plus approach (Rs. / kWh) ................................................................ 28
Figure 17: Fixed Tariff Components - LBPP (Competitive Bid) (Rs. / kWh) ............................................................... 29
Figure 18: Fixed Tariff Components - LBPP (Cost Plus) (Rs. / kWh) ........................................................................... 29
Figure 19: Quoted tariff for Essar Mahan (Rs. / kWh) ............................................................................................... 30
Figure 20: Tariff and cost for Essar Mahan under Scenarios 1 (Rs. / kWh) ............................................................... 32
Figure 21: Tariff and cost for Lanco Babandh under Scenarios 2 (Rs. / kWh) ........................................................... 32
Figure 22: Tariff and cost for Lanco Babandh under Scenarios 3 (Rs. / kWh) ........................................................... 33
Figure 23: Tariff for Essar Mahan Babandh as per cost plus approach (Rs. / kWh) .................................................. 37
Figure 24: Tariff for Udupi power project as per cost plus approach (Rs. / kWh) ..................................................... 37
Figure 25: Fixed Tariff Components - Mahan (Competitive Bid) (Rs. / kWh) ............................................................ 38
Figure 26: Fixed Tariff Components - Mahan (Cost Plus) (Rs. / kWh) ....................................................................... 38
Figure 27: Fixed Tariff Components – Udupi (Cost Plus) (Rs. / kWh) ........................................................................ 38
Figure 28: Quoted tariff for CLP Jhajjar (Rs. / kWh) .................................................................................................. 39

Competitive Tariff vis-a-vis Cost plus Tariff- Critical Analysis
Forum of Regulators v
Figure 29: Tariff and cost for CLP Jhajjar under Scenarios 1 (Rs. / kWh) .................................................................. 41
Figure 30: Tariff and cost for CLP Jhajjar under Scenarios 2 (Rs. / kWh) .................................................................. 41
Figure 31: Tariff and cost for CLP Jhajjar under Scenarios 3 (Rs. / kWh) .................................................................. 42
Figure 32: Tariff for CLP Jhajjar as per cost plus approach (Rs. / kWh) ..................................................................... 46
Figure 33: Tariff for IGSTP Jhajjar as per cost plus approach (Rs. / kWh) ................................................................. 46
Figure 34: Fixed Tariff Components – CLP Jhajjar (Competitive Bid) (Rs. / kWh) ..................................................... 47
Figure 35: Fixed Tariff Components – CLP Jhajjar (Cost Plus) (Rs. / kWh) ................................................................. 47
Figure 36: Fixed Tariff Components – IGSTP Jhajjar (Cost Plus) (Rs. / kWh) ............................................................. 47
Figure 37: Quoted tariff for MB Annupur (Rs. / kWh) ............................................................................................... 48
Figure 38: Fixed Tariff Components – MB Power Annupur (Cost Plus) (Rs. / kWh) .................................................. 49
Figure 39: Tariff for MB Power Annupur as per cost plus approach (Rs. / kWh) ...................................................... 50
Figure 40: Quoted tariff for Nabha Power (Rajpura) (Rs. / kWh) .............................................................................. 51
Figure 41 Fixed Tariff Components – Nabha Power (Rajpura) (Cost Plus) (Rs. / kWh) ............................................. 52
Figure 42: Tariff and cost for Nabha Power (Rajpura) as per cost plus approach (Rs. / kWh) .................................. 53
Figure 43: Summary of tariff comparison (Lanco Babandh & Sipat): Case - I & MoU ............................................... 54
Figure 44: Summary of tariff comparison (Essar Mahan & Udupi): Case - I & MoU ................................................. 55
Figure 45: Summary of tariff comparison (Talwandi Sabo & Sipat): Case - II & MoU ............................................... 55
Figure 46: Summary of tariff comparison (CLP Jhajjar & IGSTP Jhajjar): Case - II & MoU ......................................... 55
Figure 47: Historical power tariff at exchange (Rs. kWh) .......................................................................................... 57

Competitive Tariff vis-a-vis Cost plus Tariff- Critical Analysis
Forum of Regulators vi
List of figures
Figure 1: Power procurement routes ...........................................................................................................................3
Figure 2: Quoted tariff for Talwandi Sabo (Rs. / kWh) .............................................................................................. 12
Figure 3: Tariff and cost for Talwnadi Sabo under Scenarios 1 (Rs. / kWh) .............................................................. 14
Figure 4: Tariff and cost for Talwnadi Sabo under Scenarios 2 (Rs. / kWh) .............................................................. 14
Figure 5: Tariff and cost for Talwnadi Sabo under Scenarios 3 (Rs. / kWh) .............................................................. 15
Figure 6: Tariff for Talwnadi Sabo as per cost plus approach (Rs. / kWh) ................................................................. 19
Figure 7: Tariff for Sipat Stage -1 as per cost plus approach (Rs. / kWh) .................................................................. 19
Figure 8: Fixed Tariff Components - TSPL (Competitive Bid) (Rs. / kWh) .................................................................. 20
Figure 9: Fixed Tariff Components - TSPL (Cost Plus) (Rs. / kWh) ............................................................................. 20
Figure 10: Fixed Tariff Components - Sipat (Cost Plus) (Rs. / kWh) ........................................................................... 20
Figure 11: Quoted tariff for Lanco Babandh (Rs. / kWh) ........................................................................................... 21
Figure 12: Tariff and cost for Lanco Babandh under Scenarios 1 (Rs. / kWh) ........................................................... 23
Figure 13: Tariff and cost for Lanco Babandh under Scenarios 2 (Rs. / kWh) ........................................................... 23
Figure 14: Tariff and cost for Lanco Babandh under Scenarios 3 (Rs. / kWh) ........................................................... 24
Figure 15: Tariff for Lanco Babandh as per cost plus approach (Rs. / kWh) ............................................................. 28
Figure 16: Tariff for Sipat Stage -1 as per cost plus approach (Rs. / kWh) ................................................................ 28
Figure 17: Fixed Tariff Components - LBPP (Competitive Bid) (Rs. / kWh) ............................................................... 29
Figure 18: Fixed Tariff Components - LBPP (Cost Plus) (Rs. / kWh) ........................................................................... 29
Figure 19: Quoted tariff for Essar Mahan (Rs. / kWh) ............................................................................................... 30
Figure 20: Tariff and cost for Essar Mahan under Scenarios 1 (Rs. / kWh) ............................................................... 32
Figure 21: Tariff and cost for Lanco Babandh under Scenarios 2 (Rs. / kWh) ........................................................... 32
Figure 22: Tariff and cost for Lanco Babandh under Scenarios 3 (Rs. / kWh) ........................................................... 33
Figure 23: Tariff for Essar Mahan Babandh as per cost plus approach (Rs. / kWh) .................................................. 37
Figure 24: Tariff for Udupi power project as per cost plus approach (Rs. / kWh) ..................................................... 37
Figure 25: Fixed Tariff Components - Mahan (Competitive Bid) (Rs. / kWh) ............................................................ 38
Figure 26: Fixed Tariff Components - Mahan (Cost Plus) (Rs. / kWh) ....................................................................... 38
Figure 27: Fixed Tariff Components – Udupi (Cost Plus) (Rs. / kWh) ........................................................................ 38
Figure 28: Quoted tariff for CLP Jhajjar (Rs. / kWh) .................................................................................................. 39

Competitive Tariff vis-a-vis Cost plus Tariff- Critical Analysis
Forum of Regulators vii
Figure 29: Tariff and cost for CLP Jhajjar under Scenarios 1 (Rs. / kWh) .................................................................. 41
Figure 30: Tariff and cost for CLP Jhajjar under Scenarios 2 (Rs. / kWh) .................................................................. 41
Figure 31: Tariff and cost for CLP Jhajjar under Scenarios 3 (Rs. / kWh) .................................................................. 42
Figure 32: Tariff for CLP Jhajjar as per cost plus approach (Rs. / kWh) ..................................................................... 46
Figure 33: Tariff for IGSTP Jhajjar as per cost plus approach (Rs. / kWh) ................................................................. 46
Figure 34: Fixed Tariff Components – CLP Jhajjar (Competitive Bid) (Rs. / kWh) ..................................................... 47
Figure 35: Fixed Tariff Components – CLP Jhajjar (Cost Plus) (Rs. / kWh) ................................................................. 47
Figure 36: Fixed Tariff Components – IGSTP Jhajjar (Cost Plus) (Rs. / kWh) ............................................................. 47
Figure 37: Quoted tariff for MB Annupur (Rs. / kWh) ............................................................................................... 48
Figure 38: Fixed Tariff Components – MB Power Annupur (Cost Plus) (Rs. / kWh) .................................................. 49
Figure 39: Tariff for MB Power Annupur as per cost plus approach (Rs. / kWh) ...................................................... 50
Figure 40: Quoted tariff for Nabha Power (Rajpura) (Rs. / kWh) .............................................................................. 51
Figure 41 Fixed Tariff Components – Nabha Power (Rajpura) (Cost Plus) (Rs. / kWh) ............................................. 52
Figure 42: Tariff and cost for Nabha Power (Rajpura) as per cost plus approach (Rs. / kWh) .................................. 53
Figure 43: Summary of tariff comparison (Lanco Babandh & Sipat): Case - I & MoU ............................................... 54
Figure 44: Summary of tariff comparison (Essar Mahan & Udupi): Case - I & MoU ................................................. 55
Figure 45: Summary of tariff comparison (Talwandi Sabo & Sipat): Case - II & MoU ............................................... 55
Figure 46: Summary of tariff comparison (CLP Jhajjar & IGSTP Jhajjar): Case - II & MoU ......................................... 55
Figure 47: Historical power tariff at exchange (Rs. kWh) .......................................................................................... 57

Competitive Tariff vis-a-vis Cost plus Tariff- Critical Analysis
Forum of Regulators viii
Abbreviations
APTEL Appellate Tribunal
BHEL Bharat Heavy Electrical Ltd.
CBG Competitive Bidding Guidelines
CERC Central Electricity Regulatory Commission
CLP China Light & Power
COD Commercial operation date
ECL Eastern Coalfields Ltd.
FERV Foreign exchange rate variation
GCV Gross Calorific Value
GRIDCO Grid Corporation of Odisha
GW Giga Watt
HPGCL Haryana Power Generation Corporation Limited
IGSTP Indira Gandhi Super Thermal Power Project
IPGCL Indraprastha Power Generation Co. Ltd.
IRR Internal Rate of Return
JV Joint Venture
LBPP Lanco Babandh Power Project
MoU Memorandum of Understanding
MPPMCL M.P. Power Management Company Limited
MW Mega Watt
MYT Multi Year Tariff
NA Not Applicable
NEP National Electricity Tariff
NTPC National Electricity Tariff
O&M Operations & Maintenance
PLF Plant Load Factor
PPA Power Purchase Agreement
PSEB Punjab State Electricity Board
PTC Power Trading Corporation
SECL South Eastern Coalfields Ltd.
SHR Station Heat Rate
TSPL Talwandi Sabo Power Limited
UMPP Ultra-Mega Power Project
UPPCL Uttar Pradesh Power Corporation Limited

Competitive Tariff vis-a-vis Cost plus Tariff- Critical Analysis
Forum of Regulators ix
Executive Summary
Introduction and Objective of Study
At present, tariffs are determined primarily on cost-plus method and reviewed annually or under MYT regime by
Electricity Regulatory Commissions under Section 62 of the Electricity Act, 2003, as well as tariffs are also adopted
through bidding process under Section 63, which is levelized for a fixed period of up to 25 years based on
parameters such as capacity and energy charges with allowable escalations on escalable components, and
discounting factor etc.
Under Cost plus approach most of the costs are allowed as pass through. Under competitive bidding approach,
quoted tariff for long term PPAs are based on various assumptions which are prone to variety of risk factors, some
of which are illustrated below:
1. Risk associated with fuel – Quality & Quantity (More specific for Case-I projects as procurement of fuel is
developer’s responsibility)
2. Risk of uncontracted power
3. Transmission adequacy/availability risk
4. Risk of delay of project due to uncontrollable circumstances (Political, environmental etc.)
5. Market risk (Price of equipment, price of merchant power etc.)
6. Policy risk (Taxes & Duties)
7. Financing cost including cost of capital & forex
8. Discom financial health
There are many structural differences in cost plus and competitive tariff approach which are detailed below:
1. Tariff under cost plus approach is determined 1 to 5 years in advance, whereas under competitive tariff
approach it is determined for up to 25 years in advance.
2. In cost plus approach it is easier to reflect budget and assess costs associated with the project.
3. Cost plus has a defined structure, whereas competitive tariff structure is subjective to bidder’s interpretation
of risks and costs.
4. In cost plus approach, cost optimisation is minimum whereas in competitive bid, bidder is forced to optimize
procurement costs.
5. Returns under cost plus is same for all the players whereas in competitive bid, returns are not under the control
of a regulator and depends upon strategy of each developer.
As tariff determination process under cost plus approach differs from competitive bidding in many aspects, there
is a need for a detailed analysis of both sets of tariff determination mechanism. Thus, the objective of this study is
to conduct a comparison of tariff determination mechanism under cost plus approach vis-à-vis competitive bidding
approach.

Competitive Tariff vis-a-vis Cost plus Tariff- Critical Analysis
Forum of Regulators x
Approach for the Study
There are around 45 power projects with capacity of 55,410 MW which are tied up under competitive bidding route
(details provided in Table 2).
1. Case 1: 24 Projects (24,399 MW)
2. Case 2: 21 Projects (31,011 MW)
To undertake this analysis, a sample of competitively bid projects have been chosen depending upon comparable
parameters and availability of basic project details which are then critically analysed with comparable projects
under the cost plus regime. These parameters include:
1. Case – 1 / Case – 2: As the projects under Case 1 and Case 2 have different characteristics it is important to
analyse both kind of projects. Two Case 1 projects and two Case 2 projects have been analysed with total
installed capacity of 5280 MW.
2. Location of project: As location plays an important role in overall project cost, fuel transportation cost etc.
all the projects have been chosen from different locations.
3. Unit size: It is observed that most of the projects (over 50%) contracted under competitive bidding comprise
of larger unit sizes, therefore the selected projects are also with 660 MW or 600 MW unit size.
4. Original scheduled COD: The original scheduled COD has been considered from year 2010 to 2014.
5. Developer: A major component of quoted tariff includes risk premium and expected profit margins which
mostly depend on discretion of the developers. Therefore all the projects have been chosen for different
developers.
6. Availability of data: Being an unregulated sector the availability of data is also one of the major constraints
for selecting the projects.
Following are the competitive bidding projects and comparative projects under cost plus regime which have been
analysed for the purpose of this study:
Table 1: Sample competitive bidding projects & comparative projects under cost plus regime
(Case – I / Case – II) Competitive Bid Project Cost Plus Project
Case I Essar Mahan Udupi
Case I Lanco Babandh Sipat Stage - 1
Case II Talwandi Sabo Sipat Stage - 1
Case II CLP Jhajjar IGSTPP Jhajjar
Cost plus tariff analysis for two additional projects under competitive bidding i.e. Nabha Power (Case - 2) and MB
Power (Case 1) has also been undertaken in this study.
Tariff for projects under competitive bidding route are finalized and adopted based on the least price offered.
However, only the final accepted tariff stream for the contract period including energy and capacity charges is
available, and the underling base assumptions upon which tariff for these projects is computed are not shared with
the procurer or the regulator and are in fact available only with the project developers. The major assumptions
include project cost, cost of capital, delivered price of fuel (for Case – 1 projects), risk premium, expected return on

Competitive Tariff vis-a-vis Cost plus Tariff- Critical Analysis
Forum of Regulators xi
investment, O&M expenses, operating parameters such as heat rate, auxiliary consumption, secondary fuel oil
consumption.
With several associated factors, there could be various combination of assumptions that the bidder might have
considered to arrive at the quoted tariff. Considering the project cost to be the most important parameter, three
different scenarios have been developed to figure out the assumptions which might have been considered by
developer at time of bidding.
Based on various operating parameters under the three scenarios and keeping expected returns at a reasonable
level of around 14%, the capital cost as considered by the developer at the time of bidding has been worked out in
the following three scenarios:
1) Scenario 1: Pessimistic Case (High project cost, thus in order to achieve the same returns the operating
parameters shall be very strict).
2) Scenario 2: Optimistic Case (Low project cost, thus in order to achieve the same returns the operating
parameters can be relaxed).
3) Scenario 3: Practical Case (Intermediate project cost as well as operating parameters between pessimistic
and optimistic scenarios).
Findings of the study:
The key findings of the study are listed below:
Based on the above comparison and detailed risk profiling as elaborated in earlier sections following key findings
have been drawn:
S. No. Key Findings
A) Findings specific to Case I Projects
1. It is difficult to make clear comparison between projects under competitive tariff and cost plus tariff, as there are
number of parameters associated with a power project differentiating one plant from any other. Specifically the
Case 1 projects are more difficult to compare with other projects due to following reasons:
i. Too many variables for decision making including source of fuel, location of plant, technology,
prevailing market condition impacting interest and operating cost etc.
ii. Limited information available regarding considerations and strategy followed by the successful
bidder.
iii. Association with uncontrollable risk factors which are difficult to be quantified.
iv. Sample size is too small to reach to a concrete inference on comparison.

Competitive Tariff vis-a-vis Cost plus Tariff- Critical Analysis
Forum of Regulators xii
S. No. Key Findings
2 Major risk under Case – I projects is uncontracted capacity: It is reckoned that more than 30,0001 MW of
commissioned generation capacity is lying un-contracted in the country and is being sold in the open market on
merchant basis. The tariff for such capacity is determined by market and poses huge risk to the developers. The
prices of electricity transacted through power exchanges have declined from Rs. 7.49 / kWh in FY 09 to Rs. 2.50 /
kWh in FY 17.
3 Trend of higher risk premium in the tariffs under Case – I bids: It is observed (Refer: Table 20) that up to FY 10,
the levelized tariff for most of the bids have been under Rs. 3.00 / kWh (fixed + variable). However, the quoted
tariffs have seen an increasing trend in the subsequent years. In 2012, there was a steep increase from earlier
bids of under Rs. 4.00 / kWh to about Rs. 5.00 / kWh. Such rise in tariff can largely be attributed to the identified
risk factors and inclusion of higher risk premium.
4
Case – I projects are exposed to fuel risks: In Case I projects the private developers are expected to arrange the
fuel requirements for their projects and have to assume the entire risk on this account. Case I technical
qualification require the bidder to have linkages for the entire capacity for which it is bidding. However, actual
coal supply many times is not adequate which results in substantially lower capacity utilizations for the projects.
This is a matter of serious concern. Bidders must then procure shortfall of coal through e-auction or blend with
imported coal which may lead to substantially higher cost of generation after a PPA is entered into on the basis
of a competitively bid tariff. Other way is to operate the plant at lower PLF which again results into higher per
unit fixed cost and lower efficiency. It is already seen that with reduction in operating PLF by 5% from the
normative levels, the returns for the developers may reduce by around 1% to 3% depending upon project
specifications and operating parameters.
B) Findings specific to Case II Projects
1 Tariff under Case – II projects may be comparable and in some cases, lower than tariff determined under cost
plus approach: Based on comparison of three sample Case – II projects with cost plus projects (refer: Figure 45,
Figure 46 & Error! Reference source not found.) it is prima facie found that Tariff for Case – II project is lower
than projects under cost plus approach. Some of the matters are still sub-judice and the fair comparison can only
be made on the outcomes of same.
C) Findings common for all competitive bid projects
1 Viability to a competitive bid project is sensitive to variety of risk factors: Various risk factors such as risk of
delay in project commissioning, quality of equipment procured, adequacy & quality of fuel, adequacy &
availability of transmission corridor for power evacuation, less power off-take by buyer, financial health of
discoms along with market movement and changes in the policy environment make the viability of the
competitive bid projects very sensitive. This can also observed in Table 9, Table 12, Table 15 and Table 18 where
quantification of impact of each of these factors has been worked out on the profitability of the project.
2 The extent of which the risk parameters are factored in the quoted tariff are difficult to assess: As may be
observed from Table 19 that the expected returns from competitively bid projects at original capital costs are in
variation from the expected minimum return of around 14% (used for comparison). This only captures the impact
of change in capital cost (due to equipment pricing or delays impacting IDC). The actual returns in the long term
1 Source: CRIS research (estimated based on stakeholders views)

Competitive Tariff vis-a-vis Cost plus Tariff- Critical Analysis
Forum of Regulators xiii
S. No. Key Findings
would depend on number of other factors also. The tariff quoted by a bid participant includes, risk free costs,
profit margin and risk factors. In order to place a bid, the cost and profit margin can be quantified easily as
compared to the impact of risk factors (which is very much unpredictable). Also such bid planning is exposed to
external macro-economic variations over a long term, particularly contract term being 25 years. Due to this reason
there could be chances that the quoted tariff may not be reflective of actual cost and risks, resultantly providing
lower /higher returns under unfavorable/favorable actual conditions.
3 Bidders also include part of fixed cost into variable charges & vice versa: It is observed that in order to transfer
the risk, the developers while bidding, build in the fixed cost into variable charges and variable cost into fixed
charges and vice versa. This is due to the fact that recovery of fixed charges are linked with plant availability
whereas variable charges are linked with actual net generation, and in case a bidder presumes risk of lower PLF
it might load the variable cost under fixed charges and in other case it presumes that it can save in operational
parameters such as heat rate, auxiliary consumption, secondary fuel oil consumption etc. it might load fixed
charges under variable cost components.
4 Competitive bid tariff approach does not allow most of the un-controllable factors to pass through to the buyer:
Cost-plus approach allows most of the un-controllable factors like inflation, actual financing cost, project cost (to
an extent) are pass through in tariff. However, under competitive bidding the developer (at the time of bidding)
have to build in all these factors while quoting a tariff assuming a projected uncertainty in business environment.
Recently, developers have been building in higher sensitivities in the project which has resulted in upward
increase in competitive bidding tariff from earlier bids of under Rs. 4.00 / kWh to about Rs. 5.00 / kWh.

Competitive Tariff vis-a-vis Cost plus Tariff- Critical Analysis
Forum of Regulators 1
Chapter 1 Overview
1.1 Background of the study
The Forum of Regulators (FOR) has been constituted by the Government of India in terms of Section 166 (2) of the
Electricity Act, 2003. The Forum consists of Chairperson of the Central Commission and the Chairpersons of the
State Commissions. Chairperson of the Central Commission is the Chairperson of the Forum of Regulators and
secretarial assistance to the Forum is provided by the Central Commission. The Forum is responsible for
harmonization, coordination and ensuring uniformity of approach amongst the Electricity Regulatory Commissions
across the country, in order to achieve greater regulatory certainty in the electricity sector.
FOR has been taking steps towards ensuring that the provisions in the Electricity Act, 2003 (the Act) and the policies
i.e. National Electricity Policy (NEP) and Tariff Policy are well implemented. The Electricity Act, 2003 as well as the
abovementioned policies emphasize the necessity of promoting competition as well as ensuring viability of the
sector.
Capacity addition is a complex process influenced by policy decisions at various levels. Memorandum of
Understanding (MoU) based contracts of the 1990s were the first major policy change that strived to attract private
sector investment in generation. However, lack of transparency in signing the MoU, failure to plan capacity addition
in a comprehensive manner and absence of competition in selection process were some of the primary governance
failures that undermined any usefulness of the IPP policy.
The Electricity Act, 2003 rightly emphasizes on competitive bidding framework for encouraging private sector
investment in generation. As per Section 63 of the Act, the Regulatory Commission has to adopt tariff discovered
through bidding if due process as per guidelines has been followed.
At present, tariffs are determined primarily on cost-plus method and reviewed annually or under MYT regime by
Electricity Regulatory Commissions under Section 62 of the Electricity Act, 2003, as well as tariffs are also adopted
through bidding process under Section 63, which is levelized for a fixed period of up to 25 years based on
parameters such as capacity and energy charges with allowable escalations on escalable components, and
discounting factor etc.
As parameters and price under cost plus based tariff determination differ from those of competitive bidding
parameters, there is a need for a detailed critical analysis of both sets of tariff determination processes.
1.2 Objective of the study
To conduct a critical comparison of cost plus based tariffs for electricity generation vis-à-vis tariff adopted through
competitive bidding route in India.
1.3 Scope of Work
As per the Terms of Reference, the scope of work includes the following:

Competitive Tariff vis-a-vis Cost plus Tariff- Critical Analysis
Forum of Regulators 2
1) Review the generation tariffs, adopted through competitive bidding and determined based on cost plus
models across the country since introduction of bidding guidelines.
2) Prepare trend analysis by tracing back the components of tariff.
3) Evolve a Matrix/ develop parameters for comparison of both the approaches of tariff determination.
4) Compare the tariffs discovered through bidding with the tariffs determined by CERC under cost plus
approach.
5) Present a critical analysis based on such comparison.
6) Carry out any other related analysis as may be required by the FOR secretariat.

Competitive Tariff vis-a-vis Cost plus Tariff- Critical Analysis
Forum of Regulators 3
Chapter 2 Legislative and policy framework
One of the major objectives of the electricity reforms was to introduce competition among generators. The
Electricity Act, 2003 and the Tariff Policy, 2006 emphasized to encourage the competition in generation.
This section studies the regulatory framework for capacity addition under competitive bidding route. Relevant
provisions of the Act, various policies, judgments and guidelines have been noted.
2.1 The Electricity Act, 2003
Section 62 of the Electricity Act, 2003 mentions that the determination of tariff for the supply of electricity by a
generating company to a distribution company is under the jurisdiction of the Electricity Regulatory Commission.
However, Section 63 states that:
“63. Notwithstanding anything contained in section 62, the Appropriate Commission shall adopt the tariff if such
tariff has been determined through transparent process of bidding in accordance with the guidelines issued by the
Central Government.”
2.2 Competitive bidding guidelines
Complying with the mandate of Electricity Act, 2003 the Ministry of Power first issued the Competitive Bidding
Guidelines (CBG) on January 19, 2005. The specific objectives of these guidelines are as follows:
1. Promote competitive procurement of electricity by distribution licensees;
2. Facilitate transparency and fairness in procurement processes;
3. Facilitate reduction of information asymmetries for various bidders;
4. Protect consumer interests by facilitating competitive conditions in procurement of electricity;
5. Enhance standardization and reduce ambiguity and hence time for materialization of projects;
6. Provide flexibility to suppliers on internal operations while ensuring certainty on availability of power and
tariffs for buyers.
Figure 1: Power procurement routes
Power procurement
MoU / Cost Plus (Section 62)
Competitive bidding (Section 63)
Case 1 Bidding
Case 2 Bidding

Competitive Tariff vis-a-vis Cost plus Tariff- Critical Analysis
Forum of Regulators 4
The guidelines also defined two mechanisms to procure power under competitive bidding route:
A. Case I Bidding:
Case I is an open bid where the developer has to decide the fuel and location of the plant and compete against
other developers in general. In such bids the fuel, location and technology for the project are not specified. The
project developer bids for the portion or the total power generated. The bidder is responsible for clearances/
approvals etc. This kind of bidding is more relevant for States with limited fuel sources. Such bidding entails higher
risk for developer and lower risk for the State.
B. Case II Bidding:
In Case II bids developers are expected to bid on the basis of specific fuel source and location which are provided
by the Central/State government/procurer which is calling for bids. The government (State or Central)/procurer
offers to assist in the following activities to set up power plants:
i) Securing land, water and mandatory clearances;
ii) Signing of power purchase agreement;
iii) Establishment of fuel linkages, etc.
Thus, the government/procurer is a facilitator for the promoters owning the responsibility of initial developments.
Many state governments/procurers have gone for such Case II bidding. Case II bidding can be called by one or more
states by the formation of SPV (Special Purpose Vehicle). Such kind of bidding is more applicable for states where
fuel sources are available or are at coastal areas (for imported fuel). Such an arrangement entails higher risk for the
procurer and lower risk for the developer.
2.3 Tariff Policy, 2006
In compliance with Section 3 of the Act, the Government of India notified the Tariff Policy in January 2006, subject
to periodic amendments. Clause 5.0 of the Tariff Policy states that,
"Introducing competition in different segments of the electricity industry is one of the key features of the Electricity
Act, 2003. Competition will lead to significant benefits to consumers through reduction in capital costs and also
efficiency of operations. It will also facilitate the price to be determined competitively. The Central Government has
already issued detailed guidelines for tariff based bidding process for procurement of electricity by distribution
licensees for medium or long-term period vide gazette notification dated 19th January, 2005. All future requirement
of power should be procured competitively by distribution licensees except in cases of expansion of existing projects
or where there is a State controlled/ owned company as an identified developer and where regulators will need to
resort to tariff determination based on norms provided that expansion of generating capacity by private developers
for this purpose would be restricted to one time addition of not more than 50% of the existing capacity. Even for the
Public Sector projects, tariff of all new generation and transmission projects should be decided on the basis of
competitive bidding after a period of five years or when the Regulatory Commission is satisfied that the situation is
ripe to introduce such competition”

Competitive Tariff vis-a-vis Cost plus Tariff- Critical Analysis
Forum of Regulators 5
Tariff Policy also provides that from January, 2011 onwards, all future procurement of power by distribution
utilities, with the exception stipulated in the said clause, should be done through tariff-based competitive bidding.
A similar provision exists for procurement of transmission services also.
2.4 Judgement by the Appellate Tribunal of Electricity
With the provisions of Tariff Policy, an issue had emerged that whether the procurement of power shall be
restricted only through the competitive bidding route and no power can be tied up under MoU route after January,
2011.
However, subsequently the Appellate Tribunal of Electricity (APTEL) recognised that both the routes of power
procurement are valid and determination of tariff under section 62 of the Act is permissible despite the provisions
of Para 5.1 of the Tariff Policy. The relevant extract of the judgement given by the APTEL is as follows:
“Thus these Sections provide for 2 alternatives to the concerned parties to procure power with the approval of tariff
by the Appropriate Commission. These 2 alternatives are as follows:
i. Under Section 62(1)(a), the Appropriate Commission shall determine the tariff for the supply of electricity
by a generating company to a distribution licensee.
ii. Under Section 63, when the tariff has been determined by the Competitive Bidding Process, the Appropriate
Commission shall adopt such tariff. The wording contained in Sections 62 and 63 of the Act would make it
clear that Section 63 is not couched as a non-obstante clause being an exception carved out from Section
62. Section 62 is a substantive provision. Section 63 is an exception. So the exception contained in Section
63 cannot override the scope of the substantive namely Section 62. In other words, Section 62 provides
substantive power to the Appropriate Commission for determination of tariff with the sole exception of price
discovery through the Competitive Bidding Process under Section 63.
iii. Section 63 is optional route for procurement of power by a distribution licensee and in case the same is
followed, the Appropriate Commission is required to adopt the said tariff. Therefore, the power under
Section 62(1)(a) and Section 86(1)(b) conferred on the State Commission cannot in any manner be restricted
or whittled down by way of a policy document or a subordinate legislation or notification issued by the
Government/Executive. Any rules, or executive instructions or notification which are contrary to any
provisions of the tariff statute shall be read down as ultra vires of the parent statute.”

Competitive Tariff vis-a-vis Cost plus Tariff- Critical Analysis
Forum of Regulators 6
Chapter 3 Overview of capacity contracted through competitive
bidding
As on May 31, 2016 the total installed capacity of the country is 303 GW2 and out of above around 40% (120 GW)
of the capacity has been added by private developers. However, it is noted that not all of the capacity added by
private developers is being contracted through competitive bidding. Some of it is used for trading in short-term
markets, while some have been contracted under MoU route and a considerable capacity through renewable
energy sources (37 GW).
Since year 2006 i.e. the commencement of bidding process a considerable capacity has been contracted by various
state utilities. Around 46 power projects with capacity of 55,410 MW have been tied up under competitive bidding
route.
1. Case 1: 24 Projects (24,399 MW)
2. Case 2: 21 Projects (31,011 MW)
The following table provides the summary of contracted capacity through Case 1 & Case 2 competitive bidding
route.
Table 2: Capacity contracted under Case 1 & Case 2 bidding route3
State Case 1 Case 2 # Total
Chhattisgarh 0 1320 1320
Gujarat 5010 1805 6815
Haryana 1724 1948 3672
Maharashtra 5365 2872 9437
Madhya Pradesh 1350 1815 3165
Punjab 0 4791 4791
Rajasthan 1450 2294 3744
Uttar Pradesh 4660 6875 11535
Andhra Pradesh 900 1584 2484
Tamil Nadu 1400 792 2192
Bihar 1010 1122 2132
Karnataka 1230 3249 4479
Delhi 0 446 446
Uttarakhand 0 99 99
Kerala 300 0 300
Total 24399 31011 55410
# Including contracted capacity of Sasan UMPP (3960 MW), Mundra UMPP (3800 MW) and Krishnapatnam UMPP (4000 MW), Tilayia UMPP
has not been considered, as developer has terminated the contract. This also includes some of the medium term tie-ups.
A detailed list of recent Case 1 and Case II bid results is as shown in Annexure 1.
2 Source: Executive summary of power sector for month of May, 2016 published by CEA 3 Source: Compiled from database of Infraline & Sigma insights

Competitive Tariff vis-a-vis Cost plus Tariff- Critical Analysis
Forum of Regulators 7
Chapter 4 Competitive Tariff vis-à-vis Cost Plus Tariff
4.1 Approach and methodology
A. Phase 1: Sampling of competitively bid projects:
To undertake this analysis; competitive tariff vis-à-vis cost plus tariff, a sample of competitively bid projects have
been selected depending upon comparable parameters and availability of basic project details in public domain.
The selected projects are then critically analysed with comparable projects whose tariff has been approved /
determined under the cost plus approach.
Following are the parameters which have been considered for selecting the projects:
1. Case – 1 / Case – 2: As the projects under Case 1 and Case 2 have different characteristics it is important to
analyse both kind of projects. Two Case 1 projects and two Case 2 projects have been analysed with total
installed capacity of 5280 MW.
2. Location of project: As location plays an important role in overall project cost, fuel transportation cost etc. all
the projects have been chosen from different locations.
3. Unit size: It is observed that most of the projects (over 50%) contracted under competitive bidding comprise of
larger unit sizes ranging from 300 MW to 660 MW, therefore the selected projects are also with 660 MW or
600 MW unit size.
4. Original scheduled COD: The original scheduled COD has been considered from year 2010 to 2014.
5. Developer: A major component of quoted tariff includes risk premium and expected profit margins which
mostly depend on discretion of the developers. Therefore all the projects have been chosen for different
developers.
6. Availability of data: Competitive bidding being unregulated, the availability of data is also one of the major
constraints for selecting the projects.
7. A corresponding project under cost plus regime has also been selected having similar characteristics that of the
competitive bid project.
Following are the selected competitive bidding projects and corresponding project under cost plus regime which
have been analysed under this study:
Table 3: Sample project I – Talwandi Sabo & Sipat Stage – 1
Particulars Talwandi Sabo Sipat Stage - 1
Developer Sterlite NTPC
Case 1 / Case 2 / MoU Case 2 MoU/Cost plus
Location Punjab, Mansa Bilaspur, Chhattisgarh
Procurer PSEB (100%) Chhattisgarh, M.P, Maharashtra, Gujarat, Goa, Daman & Diu, Dadra & Nagar Haveli.

Competitive Tariff vis-a-vis Cost plus Tariff- Critical Analysis
Forum of Regulators 8
Particulars Talwandi Sabo Sipat Stage - 1
Fuel type Domestic Coal (MCL, Basundra Coal Fields) Domestic Coal (ECL & SECL)
Capacity of Plant / Unit Size 3 x 660 MW 3 x 660 MW
Boiler Make Harbin (Chinese) Doosan (Korea)
Turbine Make Dongfang (Chinese) OJSC Power Machines(Russia)
Original Scheduled COD
Unit 1 31-08-2012 31-01-2011
Unit 2 31-12-2012 30-07-2011
Unit 3 30-04-2013 31-01-2012
Actual COD
Unit 1 05-07-2014 01-Oct-11
Unit 2 25-11-2015 25-May-12
Unit 3 Yet to be Commissioned 01-Aug-12
Source: Compiled from data published by CEA & database of www.sigmainsights.in
Table 4: Sample project II – Lanco Baband & Sipat Stage – 1
Particulars Lanco Babandh Sipat Stage – 1
Developer Lanco NTPC
Case 1 / Case 2 / MoU Case 1 MoU/Cost plus
Location Odisha, Dhenkanal Bilaspur, Chhattisgarh
Procurer Uttar Pradesh (424 MW) – Competitive & Odisha (330 MW) – Cost Plus
Chhattisgarh, M.P, Maharashtra, Gujarat, Goa, Daman & Diu, Dadra & Nagar Haveli.
Fuel type Domestic Coal (MCL) Domestic Coal (ECL & SECL)
Capacity of Plant / Unit Size 2 x 660 MW 3 x 660 MW
Boiler Make Dongfang (Chinese) Doosan (Korea)
Turbine Make Harbin (Chinese) OJSC Power Machines(Russia)
Original Sch COD
Unit 1 01-12-2013 31-01-2011
Unit 2 01-04-2014 30-07-2011
Unit 3 NA 31-01-2012
Actual COD
Unit 1 Yet to be Commissioned 01-Oct-11
Unit 2 Yet to be Commissioned 25-May-12
Unit 3 NA 01-Aug-12
Source: Compiled from data published by CEA & database of www.sigmainsights.in

Competitive Tariff vis-a-vis Cost plus Tariff- Critical Analysis
Forum of Regulators 9
Table 5: Sample project III – Essar Mahan & Udupi Power Project
Particulars Essar Mahan Udupi
Developer Essar Lanco Infratech
Case 1 / Case 2 / MoU Case 1 MoU/Cost plus
Location Madhya Pradesh, Singraulli Udupi Karnataka
Procurer Madhya Pradesh (150 MW) – Competitive & Madhya Pradesh (5%)– Cost Plus
Karnataka & Punjab
Fuel type Imported & E-auction / Captive mine (Tokisud North) Imported Coal
Capacity of Plant / Unit Size 2 x 600 MW 2 x 600 MW
Boiler Make Harbin (Chinese) Dongfang (Chinese)
Turbine Make Harbin (Chinese) Dongfang (Chinese)
Original Scheduled COD
Unit 1 31-05-2013 25-02-2010
Unit 2 30-11-2013 25-06-2010
Actual COD
Unit 1 29-04-2013 11-11-2010
Unit 2 Yet to be Commissioned 19-08-2013
Source: Compiled from data published by CEA & database of www.sigmainsights.in
Table 6: Sample project IV – CLP Jhajjar & IGSTPP Jhajjar
Particulars CLP Jhajjar IGSTP Jhajjar
Developer CLP JV of NTPC, HPGCL & IPGCL
Case 1 / Case 2 / MoU Case II MoU/Cost plus
Location Haryana, Jhajjar Haryana, Jhajjar
Procurer Haryana (90%) & Delhi (10%) Chandigarh, Delhi, H.P., Haryana, J&K, Rajasthan, Telangana, Uttarakhand, U.P
Fuel type Blended coal (North Karanpura & Imported)
Blended coal
Capacity of Plant / Unit Size 2 x 660 MW 3 x 500 MW
Boiler Make Harbin (Chinese) BHEL (Indian)
Turbine Make Dongfang (Chinese) BHEL (Indian)
Original Scheduled COD
Unit 1 02-10-2011 21-01-2011
Unit 2 02-02-2012 21-04-2011
Unit 3 NA 21-07-2011
Actual COD
Unit 1 29-03-2012 05-03-2011
Unit 2 19-07-2012 21-04-2012
Unit 3 NA 26-04-2013
Source: Compiled from data published by CEA & database of www.sigmainsights.in

Competitive Tariff vis-a-vis Cost plus Tariff- Critical Analysis
Forum of Regulators 10
Apart from the above projects, analysis on cost plus basis has been done for one project from Case-I (MB power) in
UPPCL and one project from Case-II (Nabha Power Rajpura).
B. Phase 2: Scenario building and risk profiling for competitively bid projects:
Tariff for projects under competitive bidding route are finalised and adopted based on the least quoted levelized
tariff (L-1). For these projects, the final accepted annual tariff stream for the contract period and the break-up of
energy and capacity charges are available. However the base assumptions upon which tariff for these projects is
computed are not available in public domain. Such assumptions upon which the tariff is quoted are only with the
project developers and are not shared with the procurer or the regulator.
Major assumptions include project cost, cost of capital, delivered price of fuel (for Case I projects), risk premium,
expected return on investment, O&M expenses, operating parameters such as heat rate, auxiliary consumption,
secondary fuel oil consumption.
Considering such limitation of information and several associated factors, there could be various combination of
assumptions that the bidder might have considered to arrive at the quoted tariff. Considering the project cost to
be the most important parameter, three different scenarios have been developed to figure out the assumptions
which might have been considered by developer at the time of bidding.
Based on various operating parameters under three scenarios and keeping expected returns at a reasonable level
of around 14%, the capital cost as considered by the developer at the time of bidding has been worked out in the
following three scenarios:
1) Scenario 1: Pessimistic Case (High project cost: In order to achieve the same returns operating parameters
shall be very strict)
2) Scenario 2: Optimistic Case (Low project cost: In order to achieve the same returns operating parameters
can be relaxed)
3) Scenario 3: Practical Case (Intermediate project cost as well as operating parameters i.e. between
pessimistic and optimistic scenarios)
The capital cost worked out under Scenario 3 (Practical case) for competitive bidding project has been used for
further analysis. A detailed risk profiling and assessment for each of sample competitive bid project has been
undertaken to estimate the impact on expected returns with associated risk parameter. Following are the major
associated risk factors which have been analysed:
1) Adequacy and quality of fuel.
2) Equipment quality.
3) Offtake risk
4) Transmission adequacy/availability risk.
5) Regulatory risk.
6) Cost associated Re-modernisation or life extension
Competitive Tariff vis-a-vis Cost plus Tariff- Critical Analysis
Forum of Regulators 11
7) Environmental risk
8) Risk of theft
9) Market risk (Price of fuel)
10) Market risk (Price of equipment)
11) Risk in delay of project
12) Lending policy risk.
13) Cost of capital / Leverage risk.
14) Taxes & Duties
15) Foreign exchange rate variation (FERV) Risk
16) Risk associated with contracting issues
17) Political risk
18) Cash flow / Repayment risk
19) Discom financial health
20) Manpower risk.
21) Inflationary risk
22) Import policy risk
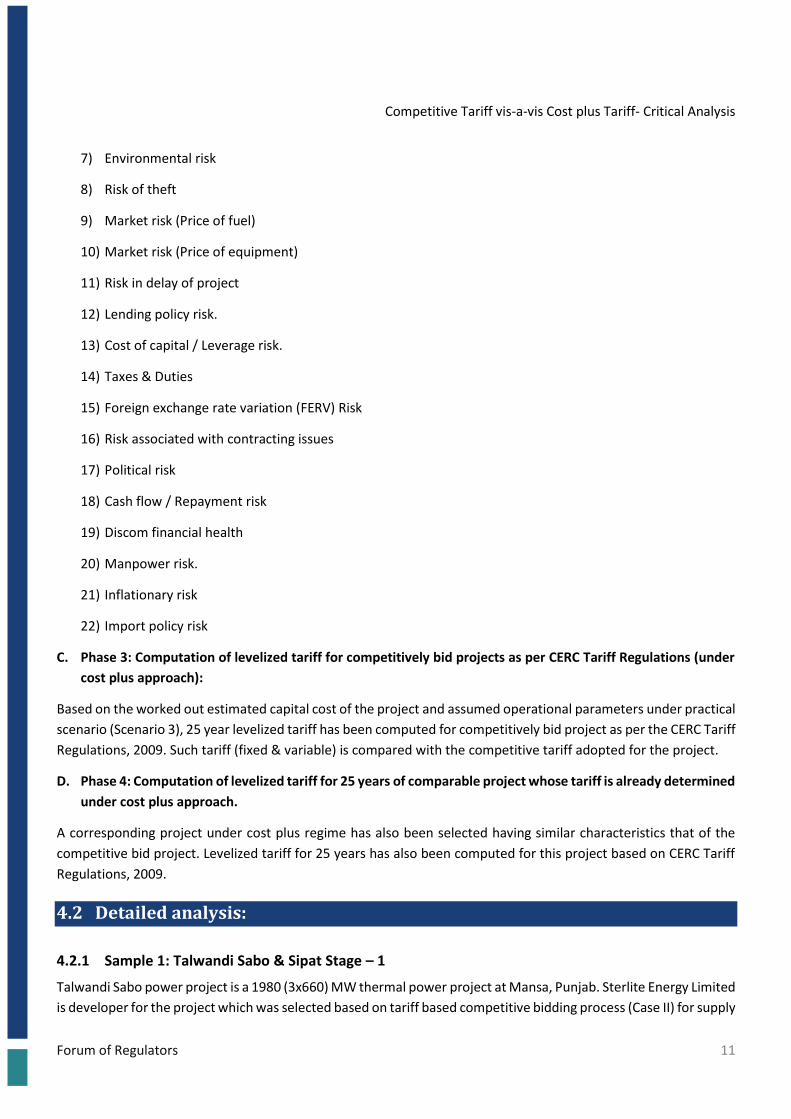
C. Phase 3: Computation of levelized tariff for competitively bid projects as per CERC Tariff Regulations (under
cost plus approach):
Based on the worked out estimated capital cost of the project and assumed operational parameters under practical
scenario (Scenario 3), 25 year levelized tariff has been computed for competitively bid project as per the CERC Tariff
Regulations, 2009. Such tariff (fixed & variable) is compared with the competitive tariff adopted for the project.
D. Phase 4: Computation of levelized tariff for 25 years of comparable project whose tariff is already determined
under cost plus approach.
A corresponding project under cost plus regime has also been selected having similar characteristics that of the
competitive bid project. Levelized tariff for 25 years has also been computed for this project based on CERC Tariff
Regulations, 2009.
4.2 Detailed analysis:
4.2.1 Sample 1: Talwandi Sabo & Sipat Stage – 1
Talwandi Sabo power project is a 1980 (3x660) MW thermal power project at Mansa, Punjab. Sterlite Energy Limited
is developer for the project which was selected based on tariff based competitive bidding process (Case II) for supply

Competitive Tariff vis-a-vis Cost plus Tariff- Critical Analysis
Forum of Regulators 12
of 100% power to Punjab for 25 years. Power Purchase Agreement (PPA) for the project was signed between
Talwandi Sabo Power Ltd (TSPL) and PSEB on September 1, 2008.
Being a Case II project the availability of fuel is responsibility of the procurer and the bidders were supposed to
quote the annual heat rate and the capacity charges for the project. Following figure shows the tariff quoted and
finalised for Talwandi Sabo:
Figure 2: Quoted tariff for Talwandi Sabo (Rs. / kWh)
* Escalable capacity charge has been worked out on CERC escalation rate used for evaluation purpose
**Net heat rate quoted by the developer is 2400 Kcal/kWh
Following are the three scenarios under pessimistic, optimistic and practical cases that the bidder might have
considered at the time of bidding. Assumptions under each scenarios have been taken after due consideration of
practicality in achieving them.
Table 7: Scenarios for sample 1 project: Talwandi Sabo
Scenario Analysis Units Scenario 1 (Pessimistic)
Scenario 2 (Optimistic)
Scenario 3 (Practical)
Assumed Annual availability/PLF % 90% 80% 85%
Auxiliary Power % 6.2% 7.0% 6.5%
Gross Station Heat Rate kcal/kWh 2,180 2,232 2,200
Annual Heat Rate degradation % 0.2% 0.4% 0.3%
Terminal Value % 20% 10% 15%
Loss of GCV from receiving end to firing end % 1.00% 1.80% 1.50%
Specific fuel consumption ml/kWh 0.30 0.50 0.40
Domestic Loan
Interest rate % 11.00% 11.00% 11.00%
No of Instalments (quarterly) Nos. 42.00 42.00 42.00
Moratorium (from Plant CoD) Months 6 months 3 months 6 months
0.097 0.120 0.134 0.153 0.172 0.205 0.214
1.2591.190
1.0040.941
0.8370.769
0.648
0.000
0.200
0.400
0.600
0.800
1.000
1.200
1.400
1 2 3 4 5 6 7 8 9 10 11 12 13 14 15 16 17 18 19 20 21 22 23 24 25 26
Per
un
it t
arif
f (R
s./k
Wh
)
Number of years
Quoted capacity charges (Rs. / kWh)
Escalable Capacity Charge (Rs. / kWh) Non-Esclable Capacity Charge (Rs. / kWh)

Competitive Tariff vis-a-vis Cost plus Tariff- Critical Analysis
Forum of Regulators 13
Scenario Analysis Units Scenario 1 (Pessimistic)
Scenario 2 (Optimistic)
Scenario 3 (Practical)
Foreign Loan
Interest rate % 8.00% 8.00% 8.00%
No of Instalments (quarterly) Nos. 60.00 60.00 60.00
Moratorium (from Plant CoD) Months 12 months 3 months 12 months
O&M expenses (base year) Rs. lakh/MW 10.00 11.00 10.50
O&M escalation % 4.00% 4.98% 4.50%
Interest on Working Capital
- Fuel Cost @ target availability Days 21 Days 30 Days 30 Days
- Secondary Fuel oil Days 21 Days 30 Days 30 Days
- O&M Expenses Days 25 Days 30 Days 30 Days
- Maint. Spares % of O&M Cost % 12.00% 15.00% 15.00%
- Receivables @ target availability Days 60 Days 60 Days 60 Days
Interest rate on Working Capital loan % 12.00% 12.50% 12.50%
Tariff and cost components for have been computed for the project under each of the three scenarios and are
shown in following figures:

Competitive Tariff vis-a-vis Cost plus Tariff- Critical Analysis
Forum of Regulators 14
Figure 3: Tariff and cost for Talwnadi Sabo under Scenarios 1 (Rs. / kWh)
Figure 4: Tariff and cost for Talwnadi Sabo under Scenarios 2 (Rs. / kWh)
1.654
1.197
2.851
1.618
1.188
2.806
0.000 0.500 1.000 1.500 2.000 2.500 3.000
Energy
Fixed
Total
Levelised Tariff & Cost
Cost Tariff
0.00
1.00
2.00
3.00
4.00
5.00
1 2 3 4 5 6 7 8 9 10 11 12 13 14 15 16 17 18 19 20 21 22 23 24 25 26
Rs.
/kW
h
Years
Tariff (Energy) Cost (Energy) Tariff (Fixed)
Cost (Fixed) Tariff (Total) Cost (Total)
1.654
1.197
2.851
1.685
1.101
2.786
0.000 0.500 1.000 1.500 2.000 2.500 3.000
Energy
Fixed
Total
Levelised Tariff & Cost
Cost Tariff
0.00
1.00
2.00
3.00
4.00
5.00
1 2 3 4 5 6 7 8 9 10 11 12 13 14 15 16 17 18 19 20 21 22 23 24 25 26R
s. /
kW
h
Years
Tariff (Energy) Cost (Energy) Tariff (Fixed)
Cost (Fixed) Tariff (Total) Cost (Total)

Competitive Tariff vis-a-vis Cost plus Tariff- Critical Analysis
Forum of Regulators 15
Figure 5: Tariff and cost for Talwnadi Sabo under Scenarios 3 (Rs. / kWh)
1.654
1.197
2.851
1.647
1.150
2.797
0.000 0.500 1.000 1.500 2.000 2.500 3.000
Energy
Fixed
Total
Levelised Tariff & Cost
Cost Tariff
0.00
1.00
2.00
3.00
4.00
5.00
1 2 3 4 5 6 7 8 9 10 11 12 13 14 15 16 17 18 19 20 21 22 23 24 25 26
Rs.
/ k
Wh
Years
Tariff (Energy) Cost (Energy) Tariff (Fixed)
Cost (Fixed) Tariff (Total) Cost (Total)

Competitive Tariff vis-a-vis Cost plus Tariff- Critical Analysis
Forum of Regulators 16
The estimated original capital cost at expected returns of 14% as worked out under this exercise for three different
scenarios are shown in the table below:
Table 8: Estimated original capital cost for Talwandi Sabo under three scenarios
Particulars Units Scenario 1 Scenario 2 Scenario 3
Equity IRR % 14.01% 14.00% 13.99%
Capital Cost Rs. Crore 10,780 7,850 9,270
As compared to above, the reported original project cost as obtained from the secondary sources4 is around Rs.
9500 Crore at which the equity IRR under scenario – 3 is working out as 13.11%.
Risk profiling: Impact Assessment for Competitive Bid Project (Scenario – 3)
A detailed risk profiling under scenario 3 (Practical case) has been undertaken to see the impact on the returns with
variation in each of the determining parameter. While undertaking risk profiling each parameter has been varied
by ±5% to see its impact on the equity IRR. More is the impact on IRR due to variation in determining
factor/parameter higher is risk imposition of such factor. Following table shows the detailed risk profiling and the
associated risk factors:
Table 9: Risk profiling: Impact Assessment for Talwandi Sabo project
Parameter Associated Risk Factors Variation
(Absolute)
Variation (%) Impact on Equity IRR
(Absolute)
Annual Availability/PLF 1) Adequacy of fuel supply.
2) Equipment quality.
3) Offtake risk
4) Transmission
adequacy/availability risk.
-4% -5% -2.31%
Aux Power 1) Equipment quality.
2) Fuel quality risk
0.3% 5% -0.41%
Gross Station Heat Rate
(kcal/kWh)
1) Quality of fuel.
2) Equipment quality.
3) Generation Risk
110
5% -3.37%
Terminal Value 1) Equipment quality.
2) Regulatory risk.
3) Cost associated Re-
modernisation or life
extension
4) Obsolete equipment
5) Environmental risk
-1% -5% -0.01%
4 http://www.projectstoday.com/

Competitive Tariff vis-a-vis Cost plus Tariff- Critical Analysis
Forum of Regulators 17
Parameter Associated Risk Factors Variation
(Absolute)
Variation (%) Impact on Equity IRR
(Absolute)
Loss of GCV from receiving end
to firing end
1) Regulatory Risk
2) Theft risk
0.08% 5% -0.05%
Sp. Fuel Consumption
(ml/kWh)
1) Equipment quality.
2) Price risk
3) Generation risk
0.02 5% -0.04%
Total Project Cost (Rs. Crore) 1) Market risk (Price of
equipment)
2) Risk in delay of project
3) Lending policy risk.
4) Tax & Duty
5) FERV Risk
6) Contracting issues
7) Environmental risk
8) Political risk
464
5% -1.73%
Interest Rate Domestic 1) Lending policy risk.
2) FERV Risk.
3) Cost of capital / Leverage
risk.
4) Cash flow / Repayment risk
0.55% 5% -0.52%
Interest Rate Foreign 0.40% 5% -0.52%
O&M expenses (Rs. Lakh /
MW)
1) Manpower risk.
2) Quality of equipment.
3) Fuel quality.
4) Inflationary risk.
0.53 5% -0.42%
O&M Escalation 0.23% 5% -0.14%
Coal inventory 1) Fuel availability risk.
2) Transportation risk.
3) Mine production risk.
1.5 Days 5% -0.03%
Secondary Fuel Inventory 1) Market price risk
2) Supply risk
3) Import policy risk
4) Coal quality risk
1.5 Days 5% 0.00%
Working capital requirement
for O&M
1) Manpower risk.
2) Quality of equipment.
3) Inflationary risk.
4) Fuel quality
1.5 Days 5% 0.00%
Inventory of Spares (% of O&M
Expenses)
0.75% 5% -0.01%
Receivables 1) Discom financial health 3.0 Days 5% -0.11%
Interest rate on Working
Capital
1) Lending policy rate.
2) Cash flow issues.
0.63% 5% -0.16%

Competitive Tariff vis-a-vis Cost plus Tariff- Critical Analysis
Forum of Regulators 18
The two major parameters which in general are considered to impact the returns and pose the highest risk on
feasibility of the project are fuel price (for variable cost) and capital cost (for fixed cost). However as this project is
a Case 2 project, variation in coal price is a pass through and therefore does not considerably impact the returns.
Further as per the analysis it is observed that apart from capital cost the other major parameters impacting the
returns for this project are Station Heat Rate (SHR) and Plant Load Factor (PLF). Considering large number of
associated factors and higher sensitivity, Competitive Bid projects pose higher risk with lower returns.
Computation of levelized tariff for Talwandi Sabo and Sipat Stage -1 under cost plus approach.
A detailed exercise has been undertaken to compute the tariff of Talwandi Sabo and Sipat Stage – 1 (comparable
cost plus project) for 25 years. For Talwandi Sabo, apart from parameters considered under Scenario 3, the
normative parameters have been considered as per CERC Tariff Regulations, 2009. Whereas for Sipat Stage 1, the
tariff as approved by the Commission till FY 2014 has been extrapolated for 25 years considering the normative
parameters as per CERC Tariff Regulations, 2009. Following points have been observed from the above analysis:
1. Based on normative cost parameters the levelized tariff for Talwandi Sabo project under cost plus approach is
working out as Rs. 3.13 / kWh as compared to Rs. 2.85 / kWh under assumed assumptions for competitive
bidding approach.
2. Tariff of Sipat Stage – 1 (3 x 660 MW) is working out to be more than TSPL project under cost plus approach.
3. Levelized tariff for Sipat Stage – 1 at normative parameters is working out as Rs. 3.35 / kWh.
The summary of the worked out tariff for Talwandi Sabo and Sipat Stage – 1 under cost plus approach is shown in
the figure below:

Competitive Tariff vis-a-vis Cost plus Tariff- Critical Analysis
Forum of Regulators 19
Figure 6: Tariff for Talwnadi Sabo as per cost plus approach (Rs. / kWh)
Figure 7: Tariff for Sipat Stage -1 as per cost plus approach (Rs. / kWh)
1.73
1.40
3.13
0.00 0.50 1.00 1.50 2.00 2.50 3.00 3.50
Energy
Fixed
Total
Levelised Tariff (Rs./kWh)
2.72
3.88
5.17
1.28
2.43
3.53
1.44 1.45 1.64
0.00
2.00
4.00
6.00
1 2 3 4 5 6 7 8 9 10 11 12 13 14 15 16 17 18 19 20 21 22 23 24 25 26
Rs.
/ k
Wh
Years
TSPL: Per Unit Tariff (Cost Plus)
Per Unit total tariff (Rs/ unit) Per Unit Energy Charges
Per Unit Fixed Charges
1.88
1.47
3.35
0.00 0.50 1.00 1.50 2.00 2.50 3.00 3.50 4.00
Energy
Fixed
Total
Levelised Tariff (Rs./kWh)
2.75
4.606.08
1.04
3.074.38
1.71 1.52 1.70
0.00
2.00
4.00
6.00
8.00
1 2 3 4 5 6 7 8 9 10 11 12 13 14 15 16 17 18 19 20 21 22 23 24 25 26
Rs.
/ k
Wh
Years
Sipat Stage - 1: Per Unit Tariff (Cost plus)
Per Unit total tariff (Rs/ unit) Per Unit Energy Charges
Per Unit Fixed Charges

Competitive Tariff vis-a-vis Cost plus Tariff- Critical Analysis
Forum of Regulators 20
The following figures show the components of tariff worked out each for TSPL (Competitive Tariff), TSPL (Cost Plus)
and Sipat Stage -1 (Cost Plus):
Figure 8: Fixed Tariff Components - TSPL (Competitive Bid) (Rs. / kWh)
Figure 9: Fixed Tariff Components - TSPL (Cost Plus) (Rs. / kWh)
Figure 10: Fixed Tariff Components - Sipat (Cost Plus) (Rs. / kWh)
0.000.200.400.600.801.001.201.401.601.802.00
1 2 3 4 5 6 7 8 9 10 11 12 13 14 15 16 17 18 19 20 21 22 23 24 25 26
Fixed Tariff Components - TSPL (Competitive Bid)
Cost of SFO Depreciation RoE Interest on Loan IOWC O&M Expenses
- 0.20 0.40 0.60 0.80 1.00 1.20 1.40 1.60 1.80 2.00
1 2 3 4 5 6 7 8 9 10 11 12 13 14 15 16 17 18 19 20 21 22 23 24 25 26
Fixed Tariff Components - TSPL (Cost Plus)
Cost of SFO Depreciation RoE Interest on Loan IOWC O&M Expenses
0.000.200.400.600.801.001.201.401.601.802.00
1 2 3 4 5 6 7 8 9 10 11 12 13 14 15 16 17 18 19 20 21 22 23 24 25 26
Fixed Tariff Components - Sipat Stage 1 (Cost Plus)
Cost of SFO Depreciation RoE Interest on Loan IOWC O&M Expenses

Competitive Tariff vis-a-vis Cost plus Tariff- Critical Analysis
Forum of Regulators 21
4.2.2 Sample 2: Lanco Babandh & Sipat Stage – 1
Lanco Babandh is a coal fired thermal power project with two supercritical units of 660 MW each, located in
Dhenkanal District, Orissa. From the total installed capacity of 1320 MW, 25% (330 MW) of power is tied up with
Grid Corporation of Odisha (GRIDCO) under MoU route and 423.90 MW is tied up with Uttar Pradesh Power
Corporation Ltd. (UPPCL) under Case 1 competitive bidding route. PPA for the project was signed with UPPCL on
August 8, 2013.
Being a Case 1 project the availability of fuel and all other project requirements are responsibility of the developer.
Levelized tariff for the project is Rs. 5.074/kWh. The selected bidders has quoted the yearly non-escalable capacity
charges (Rs. / kWh), escalable energy charges (Rs. / kWh), and escalable inland transportation charge (Rs. / kWh)
as shown in the following figure:
Figure 11: Quoted tariff for Lanco Babandh (Rs. / kWh)
* Escalable charges have been worked out on CERC escalation rate used for evaluation purpose
As part of installed capacity for this project is tied up under MoU route and some capacity is uncontracted, the
revenue stream for such generation capacity has been considered as per cost plus approach and merchant tariff.
Following are the three scenarios under pessimistic, optimistic and practical cases that bidder might have
considered for Lanco Babandh at the time of bidding.
Table 10: Scenarios for Sample 2 project: Lanco Babandh
Scenario Analysis Units Scenario 1 (Pessimistic)
Scenario 2 (Optimistic)
Scenario 3 (Practical)
Assumed Annual availability/PLF % 85% 75% 80%
Auxiliary Power % 7.0% 8.0% 7.5%
Inter-state transmission losses % 2.80% 3.00% 2.90%
Gross Station Heat Rate kcal/kWh 2,300 2,325 2,310
Annual Heat Rate degradation % 0.80% 0.90% 0.85%
Loss of GCV from receiving end to firing end
% 1.00% 2.00% 1.80%
0.8311.144 1.237
1.517 1.6101.982
0.314 0.357 0.370 0.409 0.421 0.473
2.6452.404
2.609 2.532
2.059
2.665
0.000
0.500
1.000
1.500
2.000
2.500
3.000
1 2 3 4 5 6 7 8 9 10 11 12 13 14 15 16 17 18 19 20 21 22 23 24 25 26
Per
un
it t
arif
f (R
s./k
Wh
)
Number of years
Quoted tariff (Rs. / kWh)
Escalable Fuel Energy (Rs. / kWh) Escalable Inland Transportation (Rs. / kWh)
Non-Escalable Capacity Charge (Rs. / kWh)

Competitive Tariff vis-a-vis Cost plus Tariff- Critical Analysis
Forum of Regulators 22
Scenario Analysis Units Scenario 1 (Pessimistic)
Scenario 2 (Optimistic)
Scenario 3 (Practical)
Transit Loss % 0.80% 0.80% 0.80%
Specific Fuel Oil ml / kWh 0.80 1.00 0.90
O&M expenses (base year) (Rs. Lakh / MW) 12.00 13.00 12.50
O&M Escalation % 4.00% 5.50% 5.00%
Interest on Working Capital
- Fuel Cost @ target availability Days 25 Days 30 Days 30 Days
- Secondary Fuel oil Days 25 Days 30 Days 30 Days
- O&M Expenses Days 25 Days 30 Days 30 Days
- Maint. Spares % of O&M Cost % 12.00% 15.00% 15.00%
- Receivables @ target availability Days 60 Days 60 Days 60 Days
Interest Rate for Working Capital Loan % 13.50% 14.00% 13.75%
Loan
Interest Operation period % 12.00% 13.00% 12.50%
No of Instalments (quarterly) Nos. 42 42 42
Moratorium (from Plant CoD) Months 6 months 6 months 6 months
Terminal Value % 20% 10% 15%
Fuel Details
Base Coal Price Rs. / Tonne 1000.00 1100.00 1050.00
Base Fuel oil Price (landed) Rs. / Tonne 42000.00 42000.00 42000.00
GCV of coal kcal / kg 4000.00 4000.00 4000.00
GVC of Fuel oil kcal / litre 10000.00 10000.00 10000.00
Base Price Inland Transportation Rs. / Tonne 300.00 320.00 310.00
Tariff and cost components for have been computed for the project under each of the three scenarios and are
shown in following figures:

Competitive Tariff vis-a-vis Cost plus Tariff- Critical Analysis
Forum of Regulators 23
Figure 12: Tariff and cost for Lanco Babandh under Scenarios 1 (Rs. / kWh)
Figure 13: Tariff and cost for Lanco Babandh under Scenarios 2 (Rs. / kWh)
1.802
1.990
3.792
1.920
1.693
3.613
0.000 0.500 1.000 1.500 2.000 2.500 3.000 3.500 4.000
Energy
Fixed
Total
Levelised Tariff & Cost
Cost Tariff
0.00
2.00
4.00
6.00
8.00
1 2 3 4 5 6 7 8 9 10 11 12 13 14 15 16 17 18 19 20 21 22 23 24 25 26
Rs.
/ k
Wh
Years
Tariff (Energy) Cost (Energy) Tariff (Fixed)
Cost (Fixed) Tariff (Total) Cost (Total)
1.905
1.733
3.638
2.184
1.299
3.483
0.000 0.500 1.000 1.500 2.000 2.500 3.000 3.500 4.000
Energy
Fixed
Total
Levelised Tariff & Cost
Cost Tariff
0.00
2.00
4.00
6.00
8.00
1 2 3 4 5 6 7 8 9 10 11 12 13 14 15 16 17 18 19 20 21 22 23 24 25 26R
s. /
kW
h
Years
Tariff (Energy) Cost (Energy) Tariff (Fixed)
Cost (Fixed) Tariff (Total) Cost (Total)

Competitive Tariff vis-a-vis Cost plus Tariff- Critical Analysis
Forum of Regulators 24
Figure 14: Tariff and cost for Lanco Babandh under Scenarios 3 (Rs. / kWh)
1.855
1.864
3.718
2.054
1.502
3.556
0.000 0.500 1.000 1.500 2.000 2.500 3.000 3.500 4.000
Energy
Fixed
Total
Levelised Tariff & Cost
Cost Tariff
0.00
1.00
2.00
3.00
4.00
5.00
6.00
7.00
8.00
1 2 3 4 5 6 7 8 9 10 11 12 13 14 15 16 17 18 19 20 21 22 23 24 25 26
Rs.
/ k
Wh
Years
Tariff (Energy) Cost (Energy) Tariff (Fixed)
Cost (Fixed) Tariff (Total) Cost (Total)

Competitive Tariff vis-a-vis Cost plus Tariff- Critical Analysis
Forum of Regulators 25
The estimated original capital cost for Lanco Babandh at expected returns of 14% as worked out under this exercise
for three different scenarios are shown in the table below:
Table 11: Estimated original capital cost for Lanco Babandh under three scenarios
Particulars Units Scenario 1 Scenario 2 Scenario 3
Equity IRR % 13.98% 13.91% 13.95%
Capital Cost Rs. Crore 9,100 4,890 6,900
As compared to above the reported original project cost as obtained from the secondary sources5 is around Rs.
6930 Crore at which the equity IRR under scenario – 3 is working out as 13.88%.
Risk profiling: Impact Assessment for Competitive Bid Project (Scenario – 3)
Risk profile under scenario 3 (Practical case) for the impact on the returns with ±5% variation in each of determining
parameter and associated risk factors have been shown in the table below:
Table 12: Risk profiling: Impact Assessment for Lanco Babandh project
Parameter Associated Risk Factors Variation (Absolute)
Variation (%)
Impact on Equity IRR (Absolute)
Annual Availability/PLF 1) Adequacy of fuel supply.
2) Equipment quality.
3) Offtake risk
4) Transmission adequacy/availability risk.
-4% -5% -3.81%
Aux Power 1) Equipment quality.
2) Fuel quality risk
0.4% 5% -0.26%
Gross Station Heat Rate (kcal/kWh)
1) Quality of fuel.
2) Equipment quality.
3) Generation Risk
116 5% -1.87%
Terminal Value 1) Equipment quality.
2) Regulatory risk.
3) Cost associated Re-modernisation or life extension
4) Obsolete equipment
5) Environmental risk
1% 5% 0.01%
Loss of GCV from receiving end to firing end
1) Regulatory Risk
2) Theft risk
0.09% 5% -0.03%
Sp. Fuel Consumption (ml/kWh)
1) Equipment quality.
2) Price risk
3) Generation risk
0.05 5% -0.07%
5 http://www.projectstoday.com/

Competitive Tariff vis-a-vis Cost plus Tariff- Critical Analysis
Forum of Regulators 26
Parameter Associated Risk Factors Variation (Absolute)
Variation (%)
Impact on Equity IRR (Absolute)
Total Project Cost (Rs. Crore)
1) Market risk (Price of equipment)
2) Risk in delay of project
3) Lending policy risk.
4) Tax & Duty
5) FERV Risk
6) Contracting issues
7) Environmental risk
8) Political risk
345
5% -1.20%
Interest Rate Domestic 1) Lending policy risk.
2) Cost of capital / Leverage risk.
3) Cash flow / Repayment risk
0.63% 5% -0.39%
O&M expenses (Rs. Lakh / MW)
1) Manpower risk.
2) Quality of equipment.
3) Fuel quality.
4) Inflationary risk.
0.63 5% -0.26%
O&M Escalation 0.25% 5% -0.11%
Coal inventory 1) Fuel availability risk.
2) Transportation risk.
3) Mine production risk.
1.5 Days 5% -0.02%
Secondary Fuel Inventory
1) Market price risk
2) Supply risk
3) Import policy risk
4) Coal quality risk
1.5 Days 5% 0.00%
Working capital requirement for O&M
1) Manpower risk.
2) Quality of equipment.
3) Inflationary risk.
4) Fuel quality
1.5 Days 5% 0.00%
Inventory of Spares (% of O&M Expenses)
0.75% 5% -0.01%
Receivables 1) Discom financial health 3.0 Days 5% -0.07%
Interest rate on Working Capital
1) Lending policy rate.
2) Cash flow issues.
0.69% 5% -0.10%
Price of Coal 1) Market Risk.
2) Pricing policy risks.
52.50 5% -1.59%
As Lanco Babandh is a Case 1 project, the variation in fuel price is reflected on returns for the project. It is observed
that apart from fuel price, other major parameters which impact the returns are cost of project, heat rate and
variation in PLF. As has been observed earlier for Sample 1 (Talwandi Sabo) for Lanco Babandh also there are
considerable number of associated factors which may impact the return and pose higher sensitivity. Such sensitivity
is usually built under the tariff as risk premium over and above the estimated cost and expected returns.
Computation of levelized tariff for Lanco Babandh under cost plus approach.
Following points have been observed while working put the tariff for Lanco Babandh (Case 1 project) by applying
CERC Tariff Regulation.

Competitive Tariff vis-a-vis Cost plus Tariff- Critical Analysis
Forum of Regulators 27
1. Based on normative cost parameters the levelized tariff for Lanco Babandh project under cost plus approach is
working out as Rs. 3.643 / kWh as compared to Rs. 3.718 / kWh under assumed assumptions for competitive
bidding approach and part power under MoU and Merchant.
2. Tariff of Lanco Babandh under competitive bidding route is working out to be more than under cost plus
approach.
The summary of the worked out tariff for Lanco Babandh and Sipat Stage – 1 under cost plus approach is shown in
the figures below:

Competitive Tariff vis-a-vis Cost plus Tariff- Critical Analysis
Forum of Regulators 28
Figure 15: Tariff for Lanco Babandh as per cost plus approach (Rs. / kWh)
Figure 16: Tariff for Sipat Stage -1 as per cost plus approach (Rs. / kWh)
1.901
1.743
3.643
0.000 0.500 1.000 1.500 2.000 2.500 3.000 3.500 4.000
Energy
Fixed
Total
Levelised Tariff (Rs./kWh)
2.97
4.94
7.52
1.11
3.28
5.47
1.86 1.65 2.04
0.00
2.00
4.00
6.00
8.00
1 2 3 4 5 6 7 8 9 10 11 12 13 14 15 16 17 18 19 20 21 22 23 24 25 26
Rs.
/ k
Wh
Years
LBPP: Per Unit Tariff (Cost Plus)
Per Unit total tariff (Rs/ unit) Per Unit Energy Charges
Per Unit Fixed Charges
1.88
1.47
3.35
0.00 0.50 1.00 1.50 2.00 2.50 3.00 3.50 4.00
Energy
Fixed
Total
Levelised Tariff (Rs./kWh)
2.75
4.60
6.08
1.04
3.07
4.38
1.71 1.52 1.70
0.00
2.00
4.00
6.00
8.00
1 2 3 4 5 6 7 8 9 10 11 12 13 14 15 16 17 18 19 20 21 22 23 24 25 26
Rs.
/kW
h
Years
Sipat Stage - 1: Per Unit Tariff (Cost plus)
Per Unit total tariff (Rs/ unit) Per Unit Energy Charges
Per Unit Fixed Charges

Competitive Tariff vis-a-vis Cost plus Tariff- Critical Analysis
Forum of Regulators 29
The following figures show the components of tariff worked out each for LBPP (Competitive Tariff) and LBPP (Cost
Plus):
Figure 17: Fixed Tariff Components - LBPP (Competitive Bid) (Rs. / kWh)
Figure 18: Fixed Tariff Components - LBPP (Cost Plus) (Rs. / kWh)
4.2.3 Sample 3: Essar Mahan & Udupi Power Project
Essar Mahan project is a coal fired thermal power project with two 600 MW each, located in Singrauli district,
Madhya Pradesh. Mahan - I Unit I began commercial operations on April 29, 2013. Power from the above project is
tied up with Madhya Pradesh Power Management Company Ltd. (MPPMCL), 5% (60 MW) of power is tied up under
MoU route at variable charges and 150 MW is tied up under Case 1 competitive bidding route.
Being a Case 1 project the availability of fuel and all other project requirements are responsibility of the developer.
Quoted levelized tariff for the project under competitive bidding is Rs. 2.45/kWh. The selected bidder has quoted
the yearly non-escalable capacity charges (Rs. / kWh), non-escalable energy charges (Rs. / kWh) as shown in the
following figure:
0.000.200.400.600.801.001.201.401.601.802.00
1 2 3 4 5 6 7 8 9 10 11 12 13 14 15 16 17 18 19 20 21 22 23 24 25 26
Fixed Tariff Components - LBPP (Competitive Bid)
Cost of SFO Depreciation RoE Interest on Loan IOWC O&M Expenses
- 0.20 0.40 0.60 0.80 1.00 1.20 1.40 1.60 1.80 2.00
1 2 3 4 5 6 7 8 9 10 11 12 13 14 15 16 17 18 19 20 21 22 23 24 25 26
Fixed Tariff Components - LBPP (Cost Plus)
Cost of SFO Depreciation RoE Interest on Loan IOWC O&M Expenses

Competitive Tariff vis-a-vis Cost plus Tariff- Critical Analysis
Forum of Regulators 30
Figure 19: Quoted tariff for Essar Mahan (Rs. / kWh)
As part of installed capacity for this project is tied up under MoU route and supposed be provided only at variable
charge and some capacity is uncontracted, the revenue stream for such generation capacities has been considered
as per cost plus approach and merchant tariff.
Following are the three scenarios under pessimistic, optimistic and practical cases that the bidder might have
considered for this project at the time of bidding.
Table 13: Scenarios for Sample 3 project: Essar Mahan
Scenario Analysis Units Scenario 1 (Pessimistic)
Scenario 2 (Optimistic)
Scenario 3 (Practical)
Assumed Annual Availability / PLF % 90% 80% 85%
Auxiliary Power % 6.0% 7.5% 6.5%
Gross Station Heat Rate kcal/kWh 2300 2400 2325
Annual Heat Rate Degradation % 0.3% 0.5% 0.4%
Loss of GCV from receiving end to firing end % 1% 2% 2%
Transit Loss % 0.30% 0.80% 0.50%
Specific Fuel Oil ml / kWh 0.50 1.00 0.70
O&M expenses (base year) Rs. Lakh / MW 11.00 13.00 12.00
O&M Escalation % 4.00% 5.78% 4.25%
Interest on Working Capital
- Fuel Cost @ target availability Days 21 Days 30 Days 30 Days
- Secondary Fuel oil Days 21 Days 30 Days 30 Days
- O&M Expenses Days 25 Days 30 Days 30 Days
- Maint. Spares % of O&M Cost Days 12.00% 15.00% 13.00%
- Receivables @ target availability Days 60 Days 60 Days 60 Days
Interest Rate on Working Capital % 12.00% 13.25% 12.75%
Interest Rate for capex loan % 11.00% 13.00% 12.00%
No of Instalments (quarterly) Nos. 42 42 42
Moratorium (from Plant CoD) Months 6 months 6 months 6 months
0.572 0.613 0.625 0.664 0.677 0.733
2.135
1.730 1.681 1.533 1.545 1.501
0.000
0.500
1.000
1.500
2.000
2.500
1 2 3 4 5 6 7 8 9 10 11 12 13 14 15 16 17 18 19 20 21 22 23 24 25 26
Per
un
it t
arif
f (R
s./k
Wh
)
Number of years
Quoted Tariff
Non Escalable Fuel Energy (Rs. / kWh) Non-Escalable Capacity Charge (Rs. / kWh)

Competitive Tariff vis-a-vis Cost plus Tariff- Critical Analysis
Forum of Regulators 31
Scenario Analysis Units Scenario 1 (Pessimistic)
Scenario 2 (Optimistic)
Scenario 3 (Practical)
Terminal Value % 20% 5% 15%
Fuel Details
Base Coal Price Rs. / Tonne 1100.00 1275.00 1125.00
Base Fuel oil Price (landed) Rs. / Tonne 42000.00 43000.00 42000.00
GCV of coal kcal / kg 4200.00 4200.00 4200.00
GCV of fuel oil kcal / L 10000.00 10000.00 10000.00
Tariff and cost components have been computed for the project under each of the three scenarios and are shown
in following figures:

Competitive Tariff vis-a-vis Cost plus Tariff- Critical Analysis
Forum of Regulators 32
Figure 20: Tariff and cost for Essar Mahan under Scenarios 1 (Rs. / kWh)
Figure 21: Tariff and cost for Lanco Babandh under Scenarios 2 (Rs. / kWh)
1.594
1.615
3.210
1.630
1.495
3.125
0.000 0.500 1.000 1.500 2.000 2.500 3.000 3.500
Energy
Fixed
Total
Levelised Tariff & Cost
Cost Tariff
0.00
1.00
2.00
3.00
4.00
5.00
6.00
1 2 3 4 5 6 7 8 9 10 11 12 13 14 15 16 17 18 19 20 21 22 23 24 25 26
Rs.
/ k
Wh
Years
Tariff (Energy) Cost (Energy) Tariff (Fixed)
Cost (Fixed) Tariff (Total) Cost (Total)
1.975
1.399
3.374
2.067
1.246
3.314
0.000 0.500 1.000 1.500 2.000 2.500 3.000 3.500 4.000
Energy
Fixed
Total
Levelised Tariff & Cost
Cost Tariff
0.00
2.00
4.00
6.00
8.00
1 2 3 4 5 6 7 8 9 10 11 12 13 14 15 16 17 18 19 20 21 22 23 24 25 26
Rs.
/ k
Wh
Years
Tariff (Energy) Cost (Energy) Tariff (Fixed)
Cost (Fixed) Tariff (Total) Cost (Total)

Competitive Tariff vis-a-vis Cost plus Tariff- Critical Analysis
Forum of Regulators 33
Figure 22: Tariff and cost for Lanco Babandh under Scenarios 3 (Rs. / kWh)
1.675
1.589
3.264
1.722
1.462
3.185
0.000 0.500 1.000 1.500 2.000 2.500 3.000 3.500
Energy
Fixed
Total
Levelised Tariff & Cost
Cost Tariff
0.00
2.00
4.00
6.00
8.00
1 2 3 4 5 6 7 8 9 10 11 12 13 14 15 16 17 18 19 20 21 22 23 24 25 26
Rs.
/ k
Wh
Years
Tariff (Energy) Cost (Energy) Tariff (Fixed)
Cost (Fixed) Tariff (Total) Cost (Total)

Competitive Tariff vis-a-vis Cost plus Tariff- Critical Analysis
Forum of Regulators 34
The estimated original capital cost for Lanco Babandh at expected returns of 14% as worked out under this exercise
for three different scenarios are shown in the table below:
Table 14: Estimated original capital cost for Essar Mahan under three scenarios
Particulars Units Scenario 1 Scenario 2 Scenario 3
Equity IRR % 13.96% 13.99% 13.93%
Capital Cost Rs. Crore 8,250 4,700 7,050
As compared to above the reported original project cost for Essar Mahan as obtained from the secondary sources6
is around Rs. 8000 Crore at which the equity IRR under scenario – 3 is working out as 13.11%.
Risk profiling: Impact Assessment for Competitive Bid Project (Scenario – 3)
Risk profile under scenario 3 (Practical case) for the impact on the returns with ±5% variation in each of determining
parameter and associated risk factors have been shown in the table below:
Table 15: Risk profiling: Impact Assessment for Essar Mahan project
Parameter Associated Risk Factors Variation (Absolute)
Variation (%)
Impact on Equity IRR (Absolute)
Annual Availability/PLF 1) Adequacy of fuel supply.
2) Equipment quality.
3) Offtake risk
4) Transmission adequacy/availability risk.
-4% -5% -0.94%
Aux Power 1) Equipment quality.
2) Fuel quality risk
0.3% 5% -0.07%
Gross Station Heat Rate (kcal/kWh)
1) Quality of fuel.
2) Equipment quality.
3) Generation Risk
116.25 5% -0.28%
Terminal Value 1) Equipment quality.
2) Regulatory risk.
3) Cost associated Re-modernisation or life extension
4) Obsolete equipment
5) Environmental risk
1% 5% 0.00%
Loss of GCV from receiving end to firing end
1) Regulatory Risk
2) Theft risk
0.1% 5% 0.00%
Sp. Fuel Consumption (ml/kWh)
1) Equipment quality.
2) Price risk
3) Generation risk
0.04 5% -0.01%
6 http://www.essar.com/article.aspx?cont_id=ePjCUbHH7R8=

Competitive Tariff vis-a-vis Cost plus Tariff- Critical Analysis
Forum of Regulators 35
Parameter Associated Risk Factors Variation (Absolute)
Variation (%)
Impact on Equity IRR (Absolute)
Total Project Cost (Rs. Crore)
1) Market risk (Price of equipment)
2) Risk in delay of project
3) Lending policy risk.
4) Tax & Duty
5) FERV Risk
6) Contracting issues
7) Environmental risk
8) Political risk
352.5 5% -0.41%
Interest Rate Domestic 1) Lending policy risk.
2) Cost of capital / Leverage risk.
3) Cash flow / Repayment risk
0.60% 5% -0.10%
O&M expenses (Rs. Lakh / MW)
1) Manpower risk.
2) Quality of equipment.
3) Fuel quality.
4) Inflationary risk.
0.60 5% -0.06%
O&M Escalation 0.21% 5% -0.02%
-Coal inventory 1) Fuel availability risk.
2) Transportation risk.
3) Mine production risk.
1.5 Days 5% 0.00%
Secondary Fuel Inventory
1) Market price risk
2) Supply risk
3) Import policy risk
4) Coal quality risk
1.5 Days 5% 0.00%
Working capital requirement for O&M
1) Manpower risk.
2) Quality of equipment.
3) Inflationary risk.
4) Fuel quality
1.5 Days 5% 0.00%
Inventory of Spares (% of O&M Expenses)
0.65% 5% 0.00%
Receivables 1) Discom financial health 3.0 Days 5% -0.02%
Interest rate on Working Capital
1) Lending policy rate.
2) Cash flow issues.
0.64% 5% -0.02%
Price of Coal 1) Market Risk.
2) Pricing policy risks.
56.25 5% -0.28%
Computation of levelized tariff for Essar Mahan and Udupi Power Project under cost plus approach.
A detailed exercise has been undertaken to compute the tariff of Essar Mahan and Udupi power project
(comparable cost plus project) for 25 years. For Essar Mahan, apart from parameters considered under Scenario 3,
the normative parameters have been considered as per CERC Tariff Regulations, 2009. Whereas for Udupi project,
the tariff as approved by the Commission till FY 2014 has been extrapolated for 25 years considering the normative
parameters as per CERC Tariff Regulations, 2009. Following points have been observed from the above analysis:

Competitive Tariff vis-a-vis Cost plus Tariff- Critical Analysis
Forum of Regulators 36
1. Based on normative cost parameters the levelized tariff for Essar Mahan under cost plus approach is working
out as Rs. 3.23 / kWh as compared to Rs. 3.264 / kWh under assumed assumptions for competitive bidding
approach.
2. Tariff of Udupi power project is working out to be more than Essar Mahan project under cost plus approach.
3. Levelized tariff for Udupi Power Project at normative parameters is working out as Rs. 5.40 / kWh.
4. Variable charges for Udupi is higher on account of the imported costly coal.
The summary of the worked out tariff for Essar Mahan and Udupi Power Project under cost plus approach is shown
in the figure below:

Competitive Tariff vis-a-vis Cost plus Tariff- Critical Analysis
Forum of Regulators 37
Figure 23: Tariff for Essar Mahan Babandh as per cost plus approach (Rs. / kWh)
Figure 24: Tariff for Udupi power project as per cost plus approach (Rs. / kWh)
1.52
1.72
3.23
0.00 0.50 1.00 1.50 2.00 2.50 3.00 3.50
Energy
Fixed
Total
Levelised Tariff (Rs./kWh)
2.71
4.16
6.08
0.87
2.58
4.19
1.84 1.58 1.88
0.00
2.00
4.00
6.00
8.00
1 2 3 4 5 6 7 8 9 10 11 12 13 14 15 16 17 18 19 20 21 22 23 24 25 26
Rs.
/ k
Wh
Years
Mahan: Per Unit Tariff (Cost Plus)
Per Unit total tariff (Rs/ unit) Per Unit Energy Charges
Per Unit Fixed Charges
3.79
1.61
5.40
0.00 1.00 2.00 3.00 4.00 5.00 6.00
Energy
Fixed
Total
Levelised Tariff (Rs./kWh)
4.09
7.8610.59
2.56
6.198.82
1.53 1.67 1.77
0.00
5.00
10.00
15.00
1 2 3 4 5 6 7 8 9 10 11 12 13 14 15 16 17 18 19 20 21 22 23 24 25 26
Rs.
/ k
Wh
Years
Udupi: Per Unit Tariff (Cost plus)
Per Unit total tariff (Rs/ unit) Per Unit Energy Charges
Per Unit Fixed Charges

Competitive Tariff vis-a-vis Cost plus Tariff- Critical Analysis
Forum of Regulators 38
The following figures show the components of tariff worked out each for Essar Mahan (Competitive Tariff), Essar
Mahan (Cost Plus) and Udupi (Cost Plus):
Figure 25: Fixed Tariff Components - Mahan (Competitive Bid) (Rs. / kWh)
Figure 26: Fixed Tariff Components - Mahan (Cost Plus) (Rs. / kWh)
Figure 27: Fixed Tariff Components – Udupi (Cost Plus) (Rs. / kWh)
0.000.200.400.600.801.001.201.401.601.802.00
1 2 3 4 5 6 7 8 9 10 11 12 13 14 15 16 17 18 19 20 21 22 23 24 25 26
Fixed Tariff Components - Mahan (Competitive Bid)
Cost of SFO Depreciation RoE Interest on Loan IOWC O&M Expenses
- 0.20 0.40 0.60 0.80 1.00 1.20 1.40 1.60 1.80 2.00
1 2 3 4 5 6 7 8 9 10 11 12 13 14 15 16 17 18 19 20 21 22 23 24 25 26
Fixed Tariff Components - Mahan (Cost Plus)
Cost of SFO Depreciation RoE Interest on Loan IOWC O&M Expenses
0.000.200.400.600.801.001.201.401.601.802.00
1 2 3 4 5 6 7 8 9 10 11 12 13 14 15 16 17 18 19 20 21 22 23 24 25 26
Fixed Tariff Components - Udupi (Cost Plus)
Cost of SFO Depreciation RoE Interest on Loan IOWC O&M Expenses

Competitive Tariff vis-a-vis Cost plus Tariff- Critical Analysis
Forum of Regulators 39
4.2.4 Sample 4: CLP Jhajjar & IGSTPP Jhajjar
CLP Jhajjar or Mahatma Gandhi Supercritical Power Plant is a 1320 (2x660) MW domestic coal based thermal power
project at Jhajjar, Haryana. CLP India is developer for the project which was selected based on tariff based
competitive bidding process (Case II) for supply of 90% power to Haryana for 25 years, the rest 10% power is being
procured by TPPDL at the same competitive bidding rates.
Being a Case II project the availability of fuel is responsibility of the procurer and the bidders were supposed to
quote the annual heat rate and the capacity charges for the project. Following figure shows the tariff quoted and
finalised for CLP Jhajjar:
Figure 28: Quoted tariff for CLP Jhajjar (Rs. / kWh)
**Net heat rate quoted by the developer is 2396 Kcal/kWh
Following are the three scenarios under pessimistic, optimistic and practical cases that the bidder might have
considered at the time of bidding.
Table 16: Scenarios for sample 1 project: CLP Jhajjar
Scenario Analysis Units Scenario 1 (Pessimistic)
Scenario 2 (Optimistic)
Scenario 3 (Practical)
Assumed Annual availability/PLF % 90% 80% 85%
Auxiliary Power % 6.0% 6.3% 6.1%
Gross Station Heat Rate kcal/kWh 2,180 2,246 2,200
Annual Heat Rate degradation % 0.1% 0.2% 0.15%
Terminal Value % 20% 15% 18.00%
Loss of GCV from receiving end to firing end % 0.00% 0.00% 0.00%
Specific fuel consumption ml/kWh 0.15 0.25 0.20
Domestic Loan
Interest rate % 11.00% 11.00% 11.00%
No of Instalments (quarterly) Nos. 42.00 42.00 42.00
Moratorium (from Plant CoD) Months 3 months 3 months 3 months
0.748
1.068 1.068 1.0680.950
0.748 0.7800.880
0.748 0.748
0.000
0.200
0.400
0.600
0.800
1.000
1.200
1 2 3 4 5 6 7 8 9 10 11 12 13 14 15 16 17 18 19 20 21 22 23 24 25 26
Per
un
it t
arif
f (R
s./k
Wh
)
Number of years
Quoted capacity charges (Rs. / kWh)
Non-Esclable Capacity Charge (Rs. / kWh)

Competitive Tariff vis-a-vis Cost plus Tariff- Critical Analysis
Forum of Regulators 40
Scenario Analysis Units Scenario 1 (Pessimistic)
Scenario 2 (Optimistic)
Scenario 3 (Practical)
Foreign Loan
Interest rate % 7.00% 7.00% 7.00%
No of Instalments (quarterly) Nos. 60.00 60.00 60.00
Moratorium (from Plant CoD) Months 3 months 3 months 3 months
O&M expenses (base year) Rs. lakh/MW 9.30 9.50 9.40
O&M escalation % 3.80% 4.00% 3.90%
Interest on Working Capital
- Fuel Cost @ target availability Days 21.0 Days 30.0 Days 25.0 Days
- Secondary Fuel oil Days 21.0 Days 30.0 Days 25.0 Days
- O&M Expenses Days 21.0 Days 30.0 Days 25.0 Days
- Maint. Spares % of O&M Cost % 12.00% 15.00% 12.00%
- Receivables @ target availability Days 45.0 Days 60.0 Days 45.0 Days
Interest rate on Working Capital loan % 12.00% 12.00% 12.00%
Tariff and cost components for have been computed for the project under each of the three scenarios and are
shown in following figures:

Competitive Tariff vis-a-vis Cost plus Tariff- Critical Analysis
Forum of Regulators 41
Figure 29: Tariff and cost for CLP Jhajjar under Scenarios 1 (Rs. / kWh)
Figure 30: Tariff and cost for CLP Jhajjar under Scenarios 2 (Rs. / kWh)
2.074
0.922
2.996
2.008
0.963
2.971
0.000 0.500 1.000 1.500 2.000 2.500 3.000 3.500
Energy
Fixed
Total
Levelised Tariff & Cost
Cost Tariff
0.00
1.00
2.00
3.00
4.00
5.00
6.00
7.00
1 2 3 4 5 6 7 8 9 10 11 12 13 14 15 16 17 18 19 20 21 22 23 24 25 26
Rs.
/ k
Wh
Years
Tariff (Energy) Cost (Energy) Tariff (Fixed)
Cost (Fixed) Tariff (Total) Cost (Total)
2.074
0.922
2.996
2.075
0.893
2.968
0.000 0.500 1.000 1.500 2.000 2.500 3.000 3.500
Energy
Fixed
Total
Levelised Tariff & Cost
Cost Tariff
0.00
2.00
4.00
6.00
8.00
1 2 3 4 5 6 7 8 9 10 11 12 13 14 15 16 17 18 19 20 21 22 23 24 25 26R
s. /
kWh
YearsTariff (Energy) Cost (Energy) Tariff (Fixed)
Cost (Fixed) Tariff (Total) Cost (Total)

Competitive Tariff vis-a-vis Cost plus Tariff- Critical Analysis
Forum of Regulators 42
Figure 31: Tariff and cost for CLP Jhajjar under Scenarios 3 (Rs. / kWh)
2.074
0.922
2.996
2.029
0.933
2.961
0.000 0.500 1.000 1.500 2.000 2.500 3.000 3.500
Energy
Fixed
Total
Levelised Tariff & Cost
Cost Tariff
0.00
2.00
4.00
6.00
8.00
1 2 3 4 5 6 7 8 9 10 11 12 13 14 15 16 17 18 19 20 21 22 23 24 25 26
Rs.
/ k
Wh
Years
Tariff (Energy) Cost (Energy) Tariff (Fixed)
Cost (Fixed) Tariff (Total) Cost (Total)

Competitive Tariff vis-a-vis Cost plus Tariff- Critical Analysis
Forum of Regulators 43
The estimated original capital cost at expected returns of 14% as worked out under this exercise for three different
scenarios are shown in the table below:
Table 17: Estimated original capital cost for CLP Jhajjar under three scenarios
Particulars Units Scenario 1 Scenario 2 Scenario 3
Equity IRR % 13.97% 13.94% 13.93%
Capital Cost Rs. Crore 5,800 4,310 5,130
As compared to above the reported original project cost as obtained from the secondary sources7 is around Rs.
6000 Crore at which the equity IRR under scenario – 3 is working out as 9.90%.
Risk profiling: Impact Assessment for Competitive Bid Project (Scenario – 3)
A detailed risk profiling under scenario 3 (Practical case) has been undertaken to see the impact on the returns on
±5% variation in each of the determining parameter. In the following table the impact of each parameter and the
associated risk factors have been identified:
Table 18: Risk profiling: Impact Assessment for CLP Jhajjar project
Parameter Associated Risk Factors Variation (Absolute)
Variation (%)
Impact on Equity IRR (Absolute)
Annual Availability/PLF 1) Adequacy of fuel supply.
2) Equipment quality.
3) Offtake risk
4) Transmission adequacy/availability risk.
-4% -5% -1.72%
Aux Power 1) Equipment quality.
2) Fuel quality risk
0.3% 5% -0.35%
Gross Station Heat Rate (kcal/kWh)
1) Quality of fuel.
2) Equipment quality.
3) Generation Risk
110
5% -3.84%
Terminal Value 1) Equipment quality.
2) Regulatory risk.
3) Cost associated Re-modernisation or life extension
4) Obsolete equipment
5) Environmental risk
-1% -5% -0.01%
Sp. Fuel Consumption (ml/kWh)
1) Equipment quality.
2) Price risk
3) Generation risk
0.01 5% -0.01%
Total Project Cost (Rs. Crore)
1) Market risk (Price of equipment)
2) Risk in delay of project
257
5% -1.30%
7 https://www.clpindia.in/media/Jhajjar%20Synchronization%20-%20120112.pdf

Competitive Tariff vis-a-vis Cost plus Tariff- Critical Analysis
Forum of Regulators 44
Parameter Associated Risk Factors Variation (Absolute)
Variation (%)
Impact on Equity IRR (Absolute)
3) Lending policy risk.
4) Tax & Duty
5) FERV Risk
6) Contracting issues
7) Environmental risk
8) Political risk
Interest Rate Domestic 1) Lending policy risk.
2) FERV Risk.
3) Cost of capital / Leverage risk.
4) Cash flow / Repayment risk
0.55% 5% -0.31%
Interest Rate Foreign 0.35% 5% -0.31%
O&M expenses (Rs. Lakh / MW)
1) Manpower risk.
2) Quality of equipment.
3) Fuel quality.
4) Inflationary risk.
0.47 5% -0.32%
O&M Escalation 0.20% 5% -0.09%
Coal inventory 1) Fuel availability risk.
2) Transportation risk.
3) Mine production risk.
1.3 Days 5% -0.03%
Secondary Fuel Inventory
1) Market price risk
2) Supply risk
3) Import policy risk
4) Coal quality risk
1.3 Days 5% 0.00%
Working capital requirement for O&M
1) Manpower risk.
2) Quality of equipment.
3) Inflationary risk.
4) Fuel quality
1.3 Days 5% 0.00%
Inventory of Spares (% of O&M Expenses)
0.60% 5% 0.00%
Receivables 1) Discom financial health 2.3 Days 5% -0.08%
Interest rate on Working Capital
1) Lending policy rate.
2) Cash flow issues.
0.60% 5% -0.11%
The two major parameters which in general are considered to impact the returns and pose the highest risk on
feasibility of the project are fuel price (for variable cost) and capital cost (for fixed cost). However as mentioned
earlier for Talwandi Sabo project this this project is also a Case II project, and therefore variation in coal price is a
pass through and does not considerably impact the returns. Further as per the analysis it is observed that apart
from capital cost the other major parameters impacting the returns for this project are Station Heat Rate (SHR) and
Plant Load Factor (PLF). Considering large number of associated factors and higher sensitivity, competitive Bid
projects are pose higher risk with lower returns.
Computation of levelized tariff for CLP Jhajjar and IGSTP Jhajjar under cost plus approach.
For CLP Jhajjar, apart from parameters considered under Scenario 3, the normative parameters have been
considered as per CERC Tariff Regulations, 2009. Whereas for IGSTP, Jhajjar, tariff as approved by the Commission
till FY 2014 has been extrapolated for 25 years considering the normative parameters as per CERC Tariff Regulations,
2009. Following points have been observed from the above analysis:

Competitive Tariff vis-a-vis Cost plus Tariff- Critical Analysis
Forum of Regulators 45
1. Based on normative cost parameters the levelized tariff for CLP Jhajjar project under cost plus approach is
working out as Rs. 3.138 / kWh as compared to Rs. 2.996 / kWh under assumed assumptions for competitive
bidding approach.
2. Tariff of IGSTP Jhajjar (3 x 500 MW) is working out to be more than CLP Jhajjar project under cost plus approach.
3. Levelized tariff for IGSTP Jhajjar at normative parameters is working out as Rs. 5.625 / kWh.
The summary of the worked out tariff for CLP Jhajjar and IGSTP Jhajjar under cost plus approach is shown in the
figure below:

Competitive Tariff vis-a-vis Cost plus Tariff- Critical Analysis
Forum of Regulators 46
Figure 32: Tariff for CLP Jhajjar as per cost plus approach (Rs. / kWh)
Figure 33: Tariff for IGSTP Jhajjar as per cost plus approach (Rs. / kWh)
2.17
0.97
3.14
0.00 0.50 1.00 1.50 2.00 2.50 3.00 3.50
Energy
Fixed
Total
Levelised Tariff (Rs./kWh)
2.31
4.59
6.86
1.41
3.45
5.46
0.91 1.14 1.40
0.00
2.00
4.00
6.00
8.00
1 2 3 4 5 6 7 8 9 10 11 12 13 14 15 16 17 18 19 20 21 22 23 24 25 26
Rs.
/ k
Wh
Years
CLP Jhajjar: Per Unit Tariff (Cost Plus)
Per Unit total tariff (Rs/ unit) Per Unit Energy Charges
Per Unit Fixed Charges
3.90
1.73
5.63
0.00 1.00 2.00 3.00 4.00 5.00 6.00
Energy
Fixed
Total
Levelised Tariff (Rs./kWh)
3.82
8.0010.26
2.01
6.238.45
1.81 1.77 1.81
0.00
5.00
10.00
15.00
1 2 3 4 5 6 7 8 9 10 11 12 13 14 15 16 17 18 19 20 21 22 23 24 25 26
Rs.
/ k
Wh
Years
IGSTP Jhajjar: Per Unit Tariff (Cost plus)
Per Unit total tariff (Rs/ unit) Per Unit Energy ChargesPer Unit Fixed Charges

Competitive Tariff vis-a-vis Cost plus Tariff- Critical Analysis
Forum of Regulators 47
The following figures show the components of tariff worked out each for CLP Jhajjar (Competitive Tariff), CLP Jhajjar
(Cost Plus) and IGSTP Jhajjar (Cost Plus):
Figure 34: Fixed Tariff Components – CLP Jhajjar (Competitive Bid) (Rs. / kWh)
Figure 35: Fixed Tariff Components – CLP Jhajjar (Cost Plus) (Rs. / kWh)
Figure 36: Fixed Tariff Components – IGSTP Jhajjar (Cost Plus) (Rs. / kWh)
0.00
0.30
0.60
0.90
1.20
1.50
1.80
1 2 3 4 5 6 7 8 9 10 11 12 13 14 15 16 17 18 19 20 21 22 23 24 25 26
Fixed Tariff Components - CLP Jhajjar (Competitive Bid)
Cost of SFO Depreciation RoE Interest on Loan IOWC O&M Expenses
-
0.30
0.60
0.90
1.20
1.50
1.80
1 2 3 4 5 6 7 8 9 10 11 12 13 14 15 16 17 18 19 20 21 22 23 24 25 26
Fixed Tariff Components - CLP Jhajjar (Cost Plus)
Cost of SFO Depreciation RoE Interest on Loan IOWC O&M Expenses
0.000.200.400.600.801.001.201.401.601.802.00
1 2 3 4 5 6 7 8 9 10 11 12 13 14 15 16 17 18 19 20 21 22 23 24 25 26
Fixed Tariff Components - IGSTP Jhajjar (Cost Plus)
Cost of SFO Depreciation RoE Interest on Loan IOWC O&M Expenses

Competitive Tariff vis-a-vis Cost plus Tariff- Critical Analysis
Forum of Regulators 48
4.2.5 Sample 5: MB Power Annupur
MB Power Annupur is a coal fired thermal power project with two subcritical units of 600 MW each, located in
Annupur District, Madhya Pradesh. From the total installed capacity of 1200 MW, 30% (360 MW) of power is tied
up with Madhya Pradesh Power Management Company Limited (MPPMCL) under cost plus mechanism for period
of 20 years and with the Government of Madhya Pradesh for supply of 5% of the net power generated at variable
tariff. Further 361 MW is tied up with Uttar Pradesh Power Corporation Ltd. (UPPCL) under Case 1 competitive
bidding route. PPA for the project was signed with UPPCL on January 18, 2014.
Being a Case 1 project the availability of fuel and all other project requirements are responsibility of the developer.
Levelized tariff for the project is Rs. 5.73/kWh. The selected bidder has quoted the yearly non-escalable capacity
charges (Rs. / kWh), escalable capacity charges (Rs / kWh), escalable energy charges (Rs. / kWh) and escalable inland
transportation charges (Rs. / kWh) as shown in the following figure:
Figure 37: Quoted tariff for MB Annupur (Rs. / kWh)
* Escalable charges have been worked out on CERC escalation rate used for evaluation purpose8
As part of installed capacity for this project is tied up under MoU route and some capacity is uncontracted, the
revenue stream for such generation capacity has been considered as per cost plus approach and merchant tariff.
Computation of levelized tariff for MB Power Annupur under cost plus approach.
Following points have been observed while working the tariff for MB Power Annupur (Case 1 project) by applying
CERC Tariff Regulation.
8 Since the bid evaluation sheet wherein levelized tariff is not available in public domain, reasonable assumptions have been considered over escalation rates
notified by CERC for evaluation purpose. Different iterations have been worked out considering the half yearly notified rates and the rates which measure up
closer to the levelllised tariff by the bidder have been considered for calculation of escalable capacity charges, escalable energy charges and escalable inland
transportation charges.
0.89
2.48
1.59 0.96
2.10
5.69
0.27 0.34 0.44 -
1.00
2.00
3.00
4.00
5.00
6.00
1 2 3 4 5 6 7 8 9 10 11 12 13 14 15 16 17 18 19 20 21 22 23 24 25 26
Per
un
it T
arif
f (r
s./K
Wh
)
Number of Years
Quoted Tariff (Rs/kWh)
Escalable Capacity Charges Non-escalable Capacity charges
Escalable Energy Charges Inland transportation charges

Competitive Tariff vis-a-vis Cost plus Tariff- Critical Analysis
Forum of Regulators 49
1. Based on normative cost parameters the levelized tariff for MB Power Annupur project under cost plus
approach is working out as Rs. 4.01 / kWh under assumed assumptions as compared to Rs. 5.73 / kWh for
competitive bidding approach.
2. Tariff of MB Power Annupur under competitive bidding route is working out to more than cost plus approach
route.
The following figures show the components of tariff worked out for MB Power Annupur (Cost Plus):
Figure 38: Fixed Tariff Components – MB Power Annupur (Cost Plus) (Rs. / kWh)
- 0.20 0.40 0.60 0.80 1.00 1.20 1.40 1.60 1.80 2.00
1 2 3 4 5 6 7 8 9 10 11 12 13 14 15 16 17 18 19 20 21 22 23 24 25 26
Fixed Tariff Components - MB Power Annupur (Cost Plus)
Cost of SFO Depreciation RoE Interest on Loan IOWC O&M Expenses

Competitive Tariff vis-a-vis Cost plus Tariff- Critical Analysis
Forum of Regulators 50
The summary of the worked out tariff for MB Power Annupur under cost plus approach is shown in the figures below:
Figure 39: Tariff for MB Power Annupur as per cost plus approach (Rs. / kWh)9
9 Energy charge have been considered after taking POC charges for injection into UP as per CERC order dtd 24.06.2013
2.20
1.81
4.01
0.00 0.50 1.00 1.50 2.00 2.50 3.00 3.50 4.00 4.50
Energy
Fixed
Total
Levelised Tariff (Rs./kWh)
3.21
5.06
7.18
1.84
3.33
5.31
1.90 1.88 2.12
0.00
1.00
2.00
3.00
4.00
5.00
6.00
7.00
8.00
1 2 3 4 5 6 7 8 9 10 11 12 13 14 15 16 17 18 19 20 21 22 23 24 25 26
MB Power Annupur: Per Unit Tariff (Cost Plus)
Per Unit total tariff (Rs/ unit) Per Unit Energy Charges
Per Unit Fixed Charges

Competitive Tariff vis-a-vis Cost plus Tariff- Critical Analysis
Forum of Regulators 51
4.2.6 Sample 6: Nabha Power (Rajpura)
Nabha Power (Rajpura) is a 1400 (2x700) MW supercritical domestic coal based thermal power project at Nalash
Village near Rajpura, Patiala District, Punjab owned by Nabha Power a subsidiary of L&T Limited, India. Nabha Power
Ltd. is a developer for the project which was selected based on tariff based competitive bidding process (Case II)
for supply of power to Punjab State Electricity Board for 25 years.
Being a Case II project the availability of fuel is responsibility of the procurer and the bidders were supposed to
quote the annual heat rate and the capacity charges for the project. Following figure shows the tariff quoted and
finalised for Nabha Power:
Figure 40: Quoted tariff for Nabha Power (Rajpura) (Rs. / kWh)
**Net heat rate quoted by the developer is 2268 Kcal/kWh
*Escalable charges have been worked out on CERC escalation rate used for evaluation purpose10
Computation of levelized tariff for Nabha Power under cost plus approach.
Following points have been observed while working the tariff for Nabha Power (Case 1 project) by applying CERC
Tariff Regulation:
1. Based on normative cost parameters the levelized tariff for Nabha Power (Rajpura) project under cost plus
approach is working out as Rs. 3.93 / kWh as compared to Rs. 2.89 / kWh as quoted by Nabha Power in the
competitive bid.
10 Since the assumptions and calculations of the bidders differ and are difficult to predict, the escalation rates have been considered as per the half yearly rates
notified by CERC for evaluation purpose. Different iterations have been worked out considering the half yearly notified rates and the rates which measure up
closer to the levelllised tariff by the bidder have been considered for calculation of escalable capacity charges, escalable energy charges and escalable inland
transportation charges.
0.15 0.18
0.26
0.40
0.63
1.072
1.273
1.062
1.493
0.88
1.002
-
0.20
0.40
0.60
0.80
1.00
1.20
1.40
1.60
1 2 3 4 5 6 7 8 9 10 11 12 13 14 15 16 17 18 19 20 21 22 23 24 25 26
Quoted Capacity charges (Rs./kWh)
Escalable Capacity Charges Non-escalabe Capacity charges

Competitive Tariff vis-a-vis Cost plus Tariff- Critical Analysis
Forum of Regulators 52
2. Tariff of Nabha Power (Rajpura) under cost plus approach is working out to more than competitive bidding
route.
The summary of the fixed tariff components determined under cost plus approach is shown below:
Figure 41 Fixed Tariff Components – Nabha Power (Rajpura) (Cost Plus) (Rs. / kWh)
-
0.20
0.40
0.60
0.80
1.00
1.20
1.40
1.60
1.80
2.00
1 2 3 4 5 6 7 8 9 10 11 12 13 14 15 16 17 18 19 20 21 22 23 24 25 26
Cost of SFO Depreciation RoE Interest on Loan IOWC O&M Expenses

Competitive Tariff vis-a-vis Cost plus Tariff- Critical Analysis
Forum of Regulators 53
Figure 42: Tariff and cost for Nabha Power (Rajpura) as per cost plus approach (Rs. / kWh)
2.79
1.14
3.93
0.00 0.50 1.00 1.50 2.00 2.50 3.00 3.50 4.00 4.50
Energy
Fixed
Total
Levelised Tariff (Rs./kWh)
2.98
5.57
7.86
1.88
4.22
6.34
1.10 1.35 1.52
0.00
1.00
2.00
3.00
4.00
5.00
6.00
7.00
8.00
9.00
1 2 3 4 5 6 7 8 9 10 11 12 13 14 15 16 17 18 19 20 21 22 23 24 25 26
Nabha Power : Per Unit Tariff (Cost Plus)
Per Unit total tariff (Rs/ unit) Per Unit Energy Charges Per Unit Fixed Charges

Competitive Tariff vis-a-vis Cost plus Tariff- Critical Analysis
Forum of Regulators 54
Chapter 5 Summary of results and key findings
The project cost determined for the sample projects is summarised in the following table:
Table 19: Summary of project cost determined for the sample projects
Scenario Analysis Units Scenario 1 (Pessimistic)
Scenario 2 (Optimistic)
Scenario 3 (Practical)
At original project cost (obtained from secondary sources)
Essar Mahan
Equity IRR % 13.96% 13.99% 13.93% 13.11%
Capital Cost Rs. Crore 8,250 4,700 7,050 8,000
Lanco Babandh
Equity IRR % 13.98% 13.91% 13.95% 13.88%
Capital Cost Rs. Crore 9,100 4,890 6,900 6,930
Talwandi Sabo
Equity IRR % 14.01% 14.00% 13.99% 13.11%
Capital Cost Rs. Crore 10,780 7,850 9,270 9,500
CLP Jhajjar
Equity IRR % 13.97% 13.94% 13.93% 11.17%
Capital Cost Rs. Crore 5,800 4,310 5,130 5700
Summary of tariff comparison under two tariff determination approach is shown in following figures:
Figure 43: Summary of tariff comparison (Lanco Babandh & Sipat): Case - I & MoU
1.855
1.901
1.882
1.864
1.743
1.467
3.718
3.643
3.350
0.000 0.500 1.000 1.500 2.000 2.500 3.000 3.500 4.000
LBPP (Competitive Bid) - Tariff
LBPP (Cost Plus)
Sipat (Cost Plus)
Levelised Tariff (Lanco Babandh & Sipat) : Case - I & MoU (Rs./kWh)
Total Fixed Energy

Competitive Tariff vis-a-vis Cost plus Tariff- Critical Analysis
Forum of Regulators 55
Figure 44: Summary of tariff comparison (Essar Mahan & Udupi): Case - I & MoU
Figure 45: Summary of tariff comparison (Talwandi Sabo & Sipat): Case - II & MoU
Figure 46: Summary of tariff comparison (CLP Jhajjar & IGSTP Jhajjar): Case - II & MoU
For MB Power Annupur project (Case 1) the levelized tariff under cost plus approach is working out as Rs. 4.01 /
kWh under assumed assumptions as compared to Rs. 5.73 / kWh for competitive bidding approach. And for Nabha
1.675
1.517
3.791
1.589
1.716
1.613
3.264
3.233
5.404
0.000 1.000 2.000 3.000 4.000 5.000 6.000
Mahan (Competitive Bid) - Tariff
Mahan (Cost Plus)
Udupi (Cost Plus)
Levelised Tariff (Essar Mahan & Udupi) : Case - I & MoU (Rs./kWh)
Total Fixed Energy
1.654
1.725
1.882
1.197
1.403
1.467
2.851
3.129
3.350
0.000 0.500 1.000 1.500 2.000 2.500 3.000 3.500 4.000
TSPL (Competitive Bid) - Tariff
TSPL (Cost Plus)
Sipat (Cost Plus)
Levelised Tariff (Talwandi Sabo & Sipat): Case - II & MoU (Rs./kWh)
Total Fixed Energy
2.074
2.166
3.897
0.922
0.972
1.728
2.996
3.138
5.625
0.000 1.000 2.000 3.000 4.000 5.000 6.000
CLP (Competitive Bid) - Tariff
CLP (Cost Plus)
IGSTP Jhajjar (Cost Plus)
Levelised Tariff (CLP Jhajjar & IGSTP Jhajjar): Case - II & MoU (Rs./kWh)
Total Fixed Energy

Competitive Tariff vis-a-vis Cost plus Tariff- Critical Analysis
Forum of Regulators 56
Power (Rajpura) project (Case 2) the levelized tariff under cost plus approach is working out as Rs. 3.93 / kWh as
compared to Rs. 2.89 / kWh as quoted under competitive bid.
Based on the above comparison and detailed risk profiling as elaborated in earlier sections following key findings
have been drawn:
A) Findings specific to Case I Projects:
1. The basic premise upon which the tariff for a project under competitive bid approach and the one under cost
plus approach is very different. Former is majorly market driven and based on risk appetite of the bidder
whereas the latter is regulated and is based on specified principles. Further there are number of parameters
associated with a power project differentiating one plant from any other. It is very difficult to compare the two
projects even if they are under the same tariff determination approach. Specifically the Case 1 projects are
more difficult to compare with other projects due to following reasons:
i. Too many variables for decision making including source of fuel, location of plant, technology, prevailing
market condition impacting interest and operating cost etc.
ii. Limited information available regarding considerations and strategy followed by the successful bidder.
iii. Association with uncontrollable risk factors which are difficult to be quantified.
iv. Sample size is too small to reach to a concrete inference on comparison.
In the analysis also, the comparison of two Case 1 projects with cost plus projects have given different results.
With reference to Figure 43 & Figure 44 it may be observed that levelized tariff of Lanco Babandh project (Case
– 1) is higher than the similarly placed Sipat power project (Cost plus), whereas tariff for Essar Mahan (Case –
1) is lower than Udupi power project (Cost plus).
2. Uncontracted capacity for the competitive bid projects pose more risk: It is reckoned that around 29,00011
MW of commissioned generation capacity is lying un-contracted in the country and is being sold in the open
market on merchant basis. The tariff for such capacity is determined by market. The prices of electricity
transacted through power exchanges have declined from Rs. 7.49 / kWh in FY 09 to Rs. 2.50 / kWh in FY 17.
11 Source: CRIS research (estimated based on stakeholders views)

Competitive Tariff vis-a-vis Cost plus Tariff- Critical Analysis
Forum of Regulators 57
Figure 47: Historical power tariff at exchange (Rs. kWh)
3. Trend of higher risk premium in the tariff under Case – I: It is observed (Refer: Table 20) that up to FY 10, the
levelized tariff for most of the bids have been under Rs. 3.00 / kWh (fixed + variable). However, the quoted
tariffs have seen an increasing trend in the subsequent years. In 2012, there was a steep increase from earlier
bids of under Rs. 4.00 / kWh to about Rs. 5.00 / kWh. Such rise in tariff can largely be attributed to the identified
risk factors and inclusion of higher risk premium which is also being reflected by number of compensatory tariff
petitions.
4. One of the major risks under Case – I projects is risk of fuel availability: In Case I projects the private developers
are expected to arrange the fuel requirements for their projects and have to assume the entire risk on this
account. Case I technical qualification require the bidder to have linkages for the entire capacity for which it is
bidding. However, actual coal supply is many times not adequate which results in substantially lower capacity
utilizations for the projects. This is a matter of serious concern. Bidders must then procure shortfall of coal
through e-auction or blend with imported coal which may lead to substantially higher cost of generation after
a PPA is entered into on the basis of a competitively bid tariff. Other way is to operate the plant at lower PLF
which again results into higher per unit fixed cost and lower efficiency. It is already seen that with reduction in
operating PLF by 5% from the normative levels, the returns for the developers may reduce by around 1% to 3%
depending upon project specifications and operating parameters.
B) Findings specific to Case II Projects:
5. For Case – II projects tariff under competitive bidding may be comparable and in some cases lower than
projects under cost plus approach: Based on comparison of three sample Case – II projects with cost plus
projects (refer: Figure 45, Figure 46 & Error! Reference source not found.) it is prima facie found that Tariff for
Case – II project is lower than projects under cost plus approach. However, some matters are still sub-judice
and the fair comparison can only be made on the outcomes of same.
C) Findings common for all competitive bid projects:
6. Viability of a competitive bid project is sensitive to variety of risk factors: Various risk factors such as risk of
delay in project commissioning, quality of equipment procured, adequacy & quality of fuel, adequacy &
availability of transmission corridor for power evacuation, less power off-take by buyer, financial health of
discoms along with market movement and changes in the policy environment make the viability of the
7.49
4.96
3.47 3.57 3.672.90
3.50
2.72 2.50
0.00
1.00
2.00
3.00
4.00
5.00
6.00
7.00
8.00
FY 09 FY 10 FY 11 FY 12 FY 13 FY 14 FY 15 FY 16 FY 17
Electricity tariff at exchange (Rs. / kWh)

Competitive Tariff vis-a-vis Cost plus Tariff- Critical Analysis
Forum of Regulators 58
competitive bid projects very sensitive. This can also observed in Table 9, Table 12, Table 15 and Table 18 where
each of these factors contribute to impact the profitability of the project.
7. The extent to which the risk parameters are factored in the quoted tariff is difficult to assess: As may be
observed from Table 19 that the expected returns from competitively bid projects at original capital costs are
in variation from the expected minimum return of around 14% (used for comparison). This only captures the
impact of change in capital cost (due to equipment pricing or delays impacting IDC). The actual returns in the
long term would depend on number of other factors also. The tariff quoted by a bid participant includes, risk
free costs, profit margin and risk factors. In order to place a bid, the cost and profit margin can be quantified
easily as compared to the impact of risk factors (which is very much unpredictable). Also such bid planning is
exposed to external macro-economic variations over a long term, particularly contract term being 25 years.
Due to this reason there could be chances that the quoted tariff may not be reflective of actual cost and risks,
resultantly providing lower /higher returns under unfavourable/favourable actual conditions.
8. Bidders also include part of fixed cost into variable charges & vice versa: It is observed that in order to transfer
the risk, the developers while bidding, build in the fixed cost into variable charges and variable cost into fixed
charges and vice versa. This is due to the fact that recovery of fixed charges are linked with plant availability
whereas variable charges are linked with actual net generation, and in case a bidder presumes risk of lower PLF
it might load the variable cost under fixed charges and in other case it presumes that it can save in operational
parameters such as heat rate, auxiliary consumption, secondary fuel oil consumption etc. it might load fixed
charges under variable cost components.
9. Competitive bid tariff approach does not allow most of the un-controllable factors to pass through to the
buyer: Cost-plus approach allows most of the un-controllable factors like inflation, actual financing cost, project
cost (to an extent) are being pass through. However, the developer (at the time of bidding) have to build in all
these factors while quoting a tariff assuming a projected uncertainty in business environment. Recently,
developers have been building in higher sensitivities in the project which has resulted in upward increase in
competitive bidding tariff from earlier bids of under Rs. 4.00 / kWh to about Rs. 5.00 / kWh.

Competitive Tariff vis-a-vis Cost plus Tariff- Critical Analysis
Forum of Regulators 59
Annexures
Annexure - 1
Table 20: Recent Case I and Case II Bids
State Quantum (MW)
Bid Date Developer Levellized tariff (Rs./kWh)
Case I / Case II
Case - I
FY 09
Gujarat 1000 FY 09 Adani Enterprises Ltd. 2.89 Case I
Gujarat 200 FY 09 Aryan Coal Beneficiaries Pvt. Ltd. 2.25 Case I
Gujarat 1000 FY 09 Adani Power Pvt. Ltd. 2.35 Case I
Gujarat 1000 FY 09 Essar Power Ltd. 2.40 Case I
Haryana 1424 FY 09 Adani Power, Mundra 2.94 Case I
FY 10
Rajasthan 1200 Nov-09 Adani Power Ltd 3.24 Case I
Rajasthan 100 Nov-09 GMR Kamalanga 3.81 Case I
Rajasthan 150 Jan-10 Monet Power (PTC) 3.76 Case I
Karnataka 430 Jan-10 Thermal Power Tech (PTC) 3.77 Case I
Gujarat 800 Jan-10 Essar Energy 2.80 Case I
Gujarat 1010 FY 10 KSK Mahanadhi (Wardha Power) 2.35 Case I
Gujarat 800 FY 10 Shapoorji Pallonji & Company 2.80 Case I
Bihar 450 Mar-10 Essar Energy 3.05 Case I
Maharashtra 1320 FY 10 Adani 3.28 Case I
Maharashtra 1200 FY 10 India Bulls 3.26 Case I
Maharashtra 300 FY 10 Emco 2.88 Case I
Madhya Pradesh 150 FY 10 Esaar Mahan 2.45 Case I
FY 11
Bihar 400 Feb-11 RKM Power Gen 4.59 Case I
Bihar 100 Feb-11 Vandana Vidyut Power 4.68 Case I
Uttar Pradesh 300 Feb-11 PTC- Athena 3.32 Case I
Uttar Pradesh 2456 Feb-11 Reliance Power 3.70 Case I
Uttar Pradesh 580 Feb-11 PTC - Hinduja 3.45 Case I
Andhra Pradesh 620 Feb-11 PTC-East Coast Energy 3.48 Case I
Uttar Pradesh 240 Feb-11 Essar Power 4.09 Case I
Uttar Pradesh 200 Feb-11 Visa Power 4.19 Case I
FY 13
Uttar Pradesh 300 Sep-12 NSL (Orissa) 4.48 Case I
Uttar Pradesh 390 Sep-12 PTC TRN (ACB Ltd) 4.89 Case I
Uttar Pradesh 424 Sep-12 Lanco Babandh 5.07 Case I

Competitive Tariff vis-a-vis Cost plus Tariff- Critical Analysis
Forum of Regulators 60
State Quantum (MW)
Bid Date Developer Levellized tariff (Rs./kWh)
Case I / Case II
Uttar Pradesh 1,000 Sep-12 KSK Mahanadi 5.59 Case I
Uttar Pradesh 361 Sep-12 MB Power 5.73 Case I
Rajasthan 195 Sep-12 PTC- MCCPL 4.52 Case I
Rajasthan 311 Sep-12 PTC -DB Power 4.81 Case I
Tamil Nadu 200 Mar-13 DB Power 4.91 Case I
Tamil Nadu 400 Mar-13 Jindal Power Ltd 4.95 Case I
FY 15
Kerala 200 Nov-14 Jindal Power 3.60 Case I
Kerala 115 Nov-14 Jhabua Power 4.15 Case I
Kerala 100 Nov-14 Balco 4.29 Case I
Kerala 200 Nov-14 Jindal India - Thermal 4.39 Case I
Kerala 150 Nov-14 Jindal Power 4.29 Case I
FY 16
Andhra Pradesh 488 Jun-15 East Coast Energy Ltd 4.27 Case I
Andhra Pradesh 500 Jun-15 NCC Power Projects 4.35 Case I
Kerala 540 Jun-15 Korba West Avantha 4.49 Case I
Andhra Pradesh 374 Jun-15 MB Power Ltd 4.69 Case I
Andhra Pradesh 400 Jun-15 Jindal India Thermal Ltd 4.83 Case I
Andhra Pradesh 500 Jun-15 Essar Power Ltd 4.83 Case I
Andhra Pradesh 200 Sep-15 Jindal India 3.99 Case I
Andhra Pradesh 120 Sep-15 Balco-Chhattisgarh 4.07 Case I
TPPDDL 374 Sep-15 M B Power 4.23 Case I
TPPDDL 100 Sep-15 Lanco Anpara 4.24 Case I
TPPDDL 400 Sep-15 Ratan India 4.48 Case I
Case - II
Jharkhand (Tilaiya) 3960 Jan-09 Reliance 1.77 Case II
Uttar Pradesh (Anpara C) 1200 Jun-06 Lanco 1.91 Case II
Gujarat (Mundra) 4000 Dec-06 Tata Power 2.26 Case II
Madhya Pradesh (Sasan) 3960 Dec-06 Reliance 1.19 Case II
Andhra Pradesh (Krishnapatnam)
3960 Nov-07 Reliance 2.33 Case II
Chhattisgarh (Bhaiyathan) 1320 Mar-08 Indiabulls 0.81 Case II
Haryana (Jhajjar) 1320 Jul-08 CLP 3.00 Case II
Punjab (Talwandi Sabo) 1980 Jul-08 Sterlite 2.86 Case II
Uttar Pradesh (Karchana) 1320 Sep-08 Jaypee 2.97 Case II
Uttar Pradesh (Bara) 1980 Nov-08 Jaypee 3.02 Case II
Punjab (Rajpura) 1320 Nov-09 L&T 2.89 Case II